Embed Size (px)
Citation preview
A DIAGNOSTIC EXPERT SYSTEM FOR GREEN PRODUCTIVITY ASSESSMENT OF
MANUFACTURINGPROCESSES
ALVIN B. CULABADepartment of Mechanical Engineering
De La Salle University-Manila, Philippines
RUBY PINEDA-HENSONDepartment of Industrial Engineering
Holy Angel University-Angeles City, Philippines
Life Cycle Assessment/Life Cycle Management: A Bridge to a Sustainable FutureInLCA/LCM 2003 Conference
23-25 September 2003, Seattle, Washington
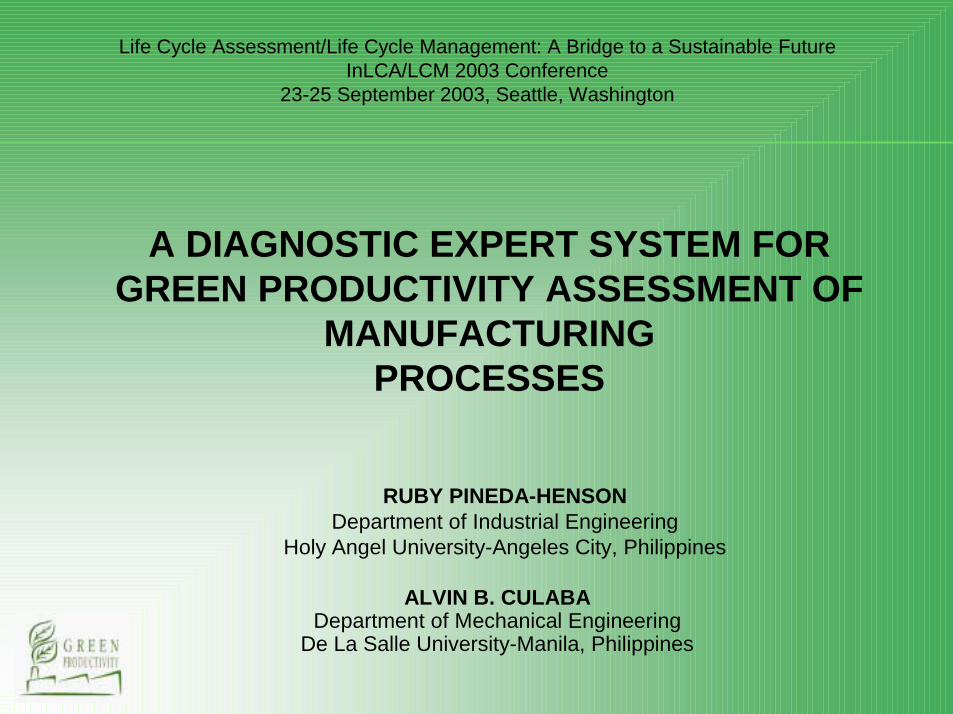
Green Productivity
• A term adopted from the Asian Productivity Organization (APO) to refer to environmental and productivity performance
• A program of the APO, Green Productivity (GP) is regarded as the key to sustainable development in Asia and the Pacific
• GP is the productivity approach to sustainable development
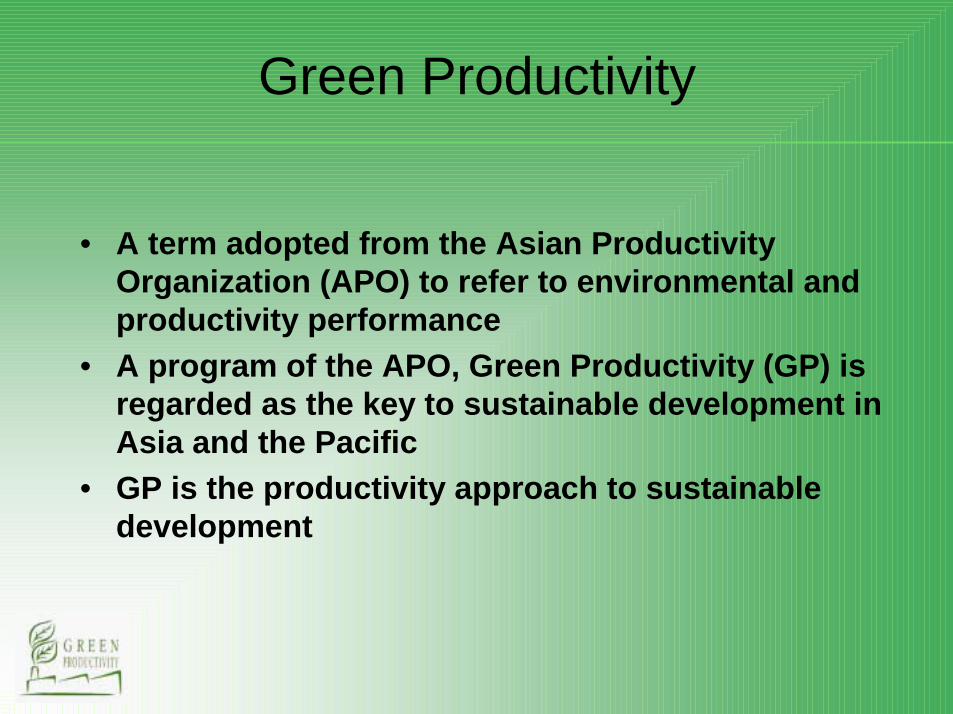
Framework for Continuous Improvement
ProductivityImprovement
⇒
Environmental Performance
⇒Foundation forSustainable Development
Green Productivity
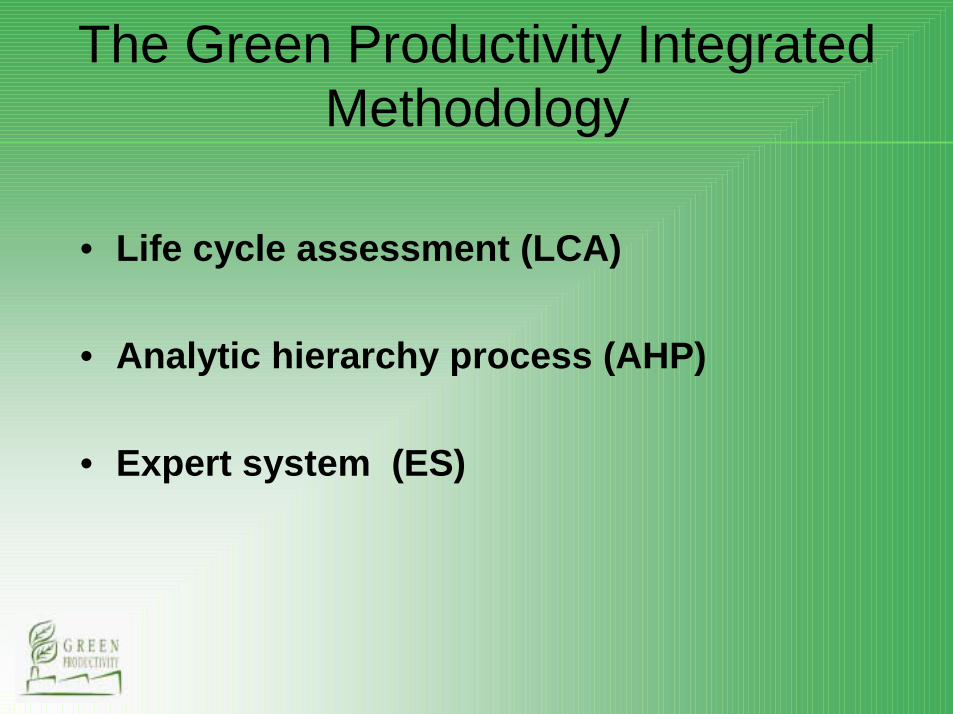
• Life cycle assessment (LCA)
• Analytic hierarchy process (AHP)
• Expert system (ES)
The Green Productivity Integrated Methodology
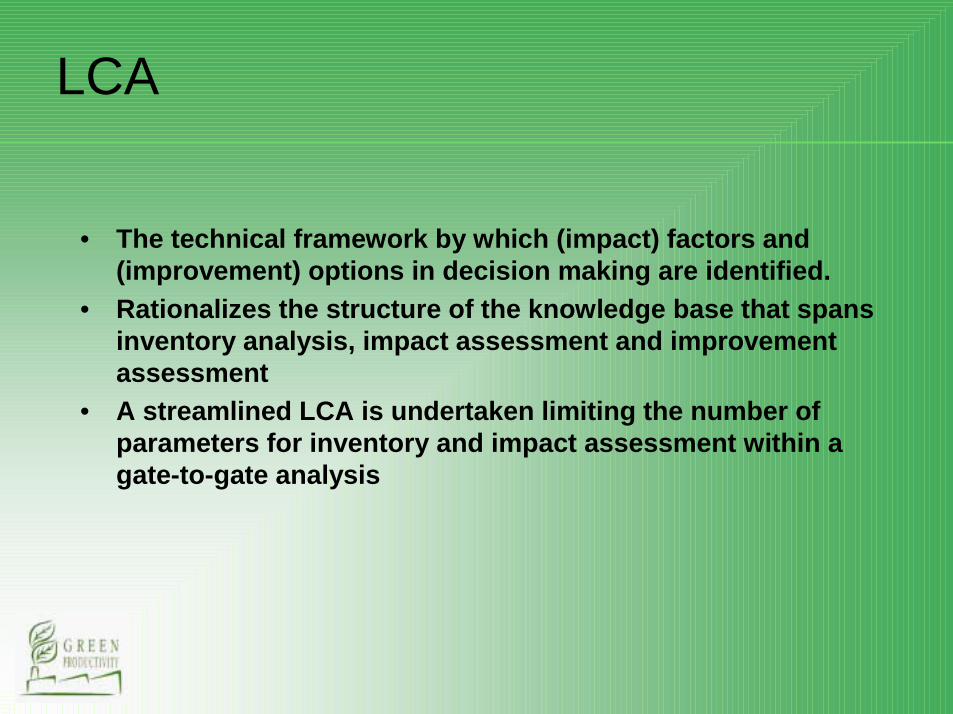
LCA
• The technical framework by which (impact) factors and (improvement) options in decision making are identified.
• Rationalizes the structure of the knowledge base that spans inventory analysis, impact assessment and improvement assessment
• A streamlined LCA is undertaken limiting the number of parameters for inventory and impact assessment within a gate-to-gate analysis
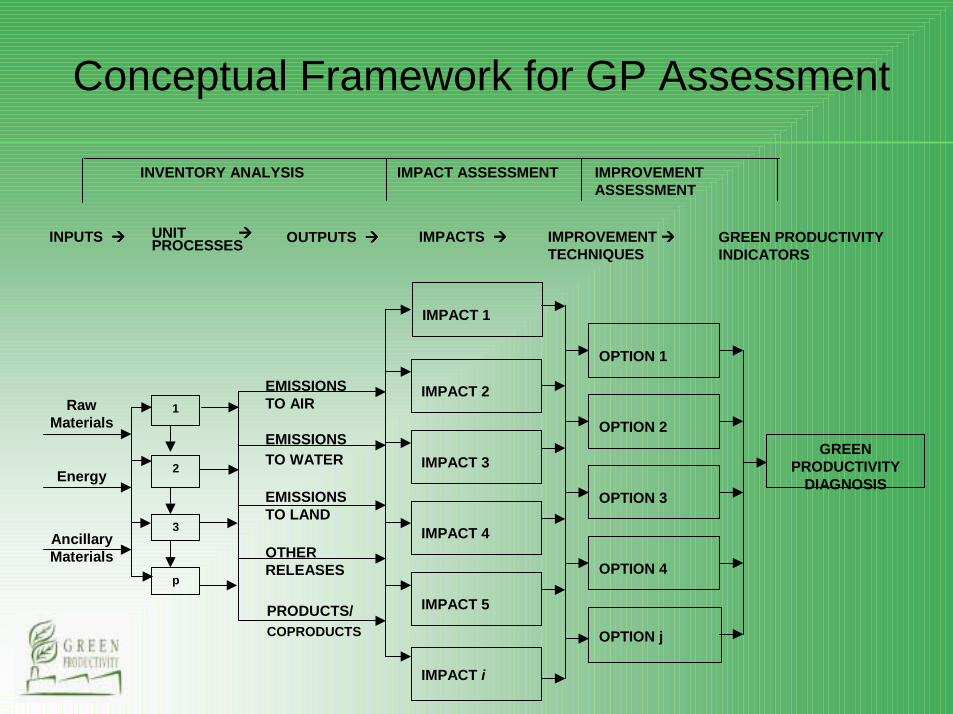
IMPACT ASSESSMENT IMPROVEMENT ASSESSMENT
INVENTORY ANALYSIS
UNIT !!!!PROCESSESINPUTS !!!! OUTPUTS !!!! IMPACTS !!!! IMPROVEMENT !!!!
TECHNIQUES GREEN PRODUCTIVITY INDICATORS
PRODUCTS/ COPRODUCTS
EMISSIONSTO LAND
OTHER RELEASES
EMISSIONSTO WATER
1
Ancillary Materials
Energy
RawMaterials
OPTION 1
OPTION 2
OPTION 3
OPTION 4
OPTION j
GREEN PRODUCTIVITY
DIAGNOSIS
IMPACT 5
IMPACT 1
IMPACT 2
IMPACT 3
IMPACT 4
IMPACT i
2
3
p
EMISSIONS TO AIR
Conceptual Framework for GP Assessment
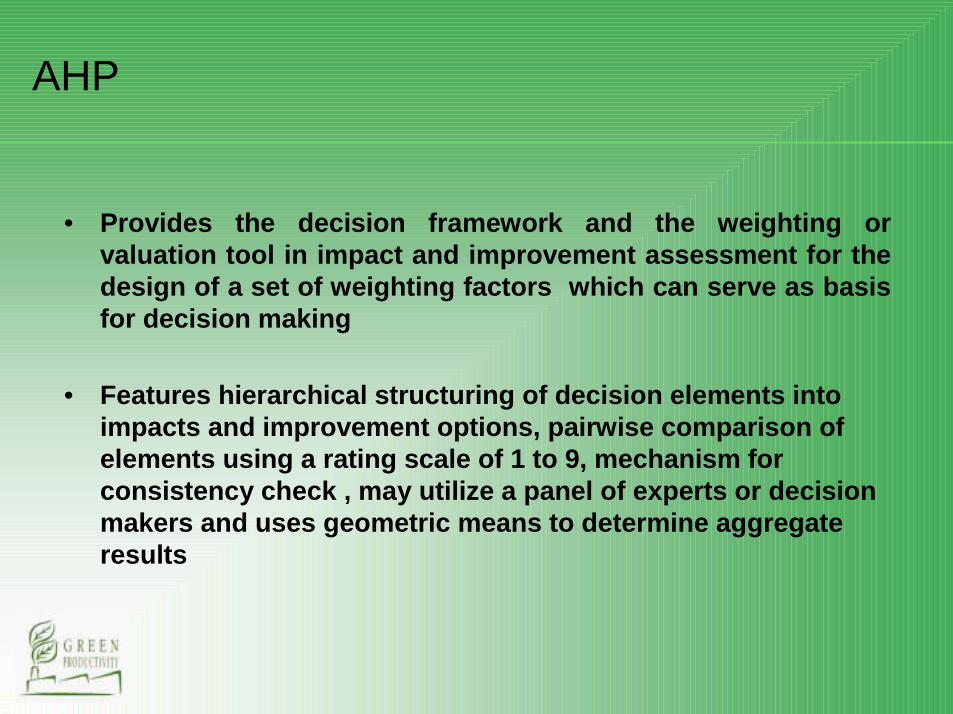
• Provides the decision framework and the weighting or valuation tool in impact and improvement assessment for the design of a set of weighting factors which can serve as basis for decision making
• Features hierarchical structuring of decision elements into impacts and improvement options, pairwise comparison of elements using a rating scale of 1 to 9, mechanism for consistency check , may utilize a panel of experts or decision makers and uses geometric means to determine aggregate results
AHP
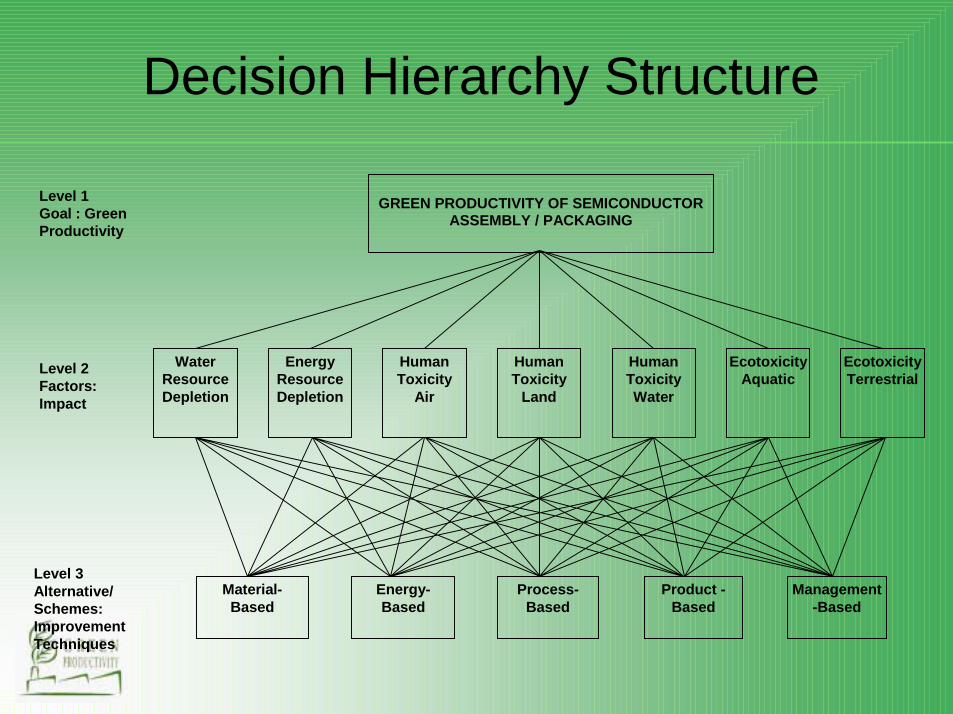
GREEN PRODUCTIVITY OF SEMICONDUCTOR ASSEMBLY / PACKAGING
WaterResource Depletion
Level 1Goal : Green Productivity
Level 2Factors:Impact
Energy Resource Depletion
EcotoxicityAquatic
HumanToxicityWater
Human Toxicity
Land
Human Toxicity
Air
EcotoxicityTerrestrial
Level 3Alternative/Schemes:Improvement Techniques
Management -Based
Product -Based
Process-Based
Energy-Based
Material-Based
Decision Hierarchy Structure
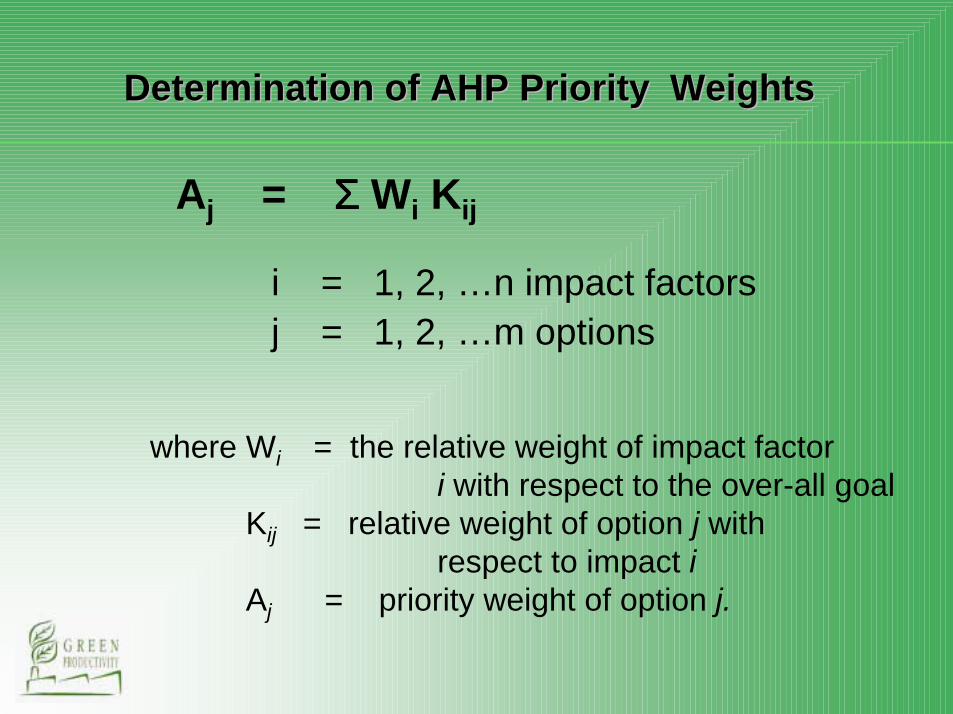
Aj = ΣΣΣΣ Wi Kij
i = 1, 2, …n impact factorsj = 1, 2, …m options
where Wi = the relative weight of impact factor i with respect to the over-all goal
Kij = relative weight of option j withrespect to impact i
Aj = priority weight of option j.
Determination of AHP Priority WeightsDetermination of AHP Priority Weights
• Expert system technology is explored to develop a software prototype that emulates how human experts diagnose GP performance of manufacturing processes.
The Diagnostic Expert System
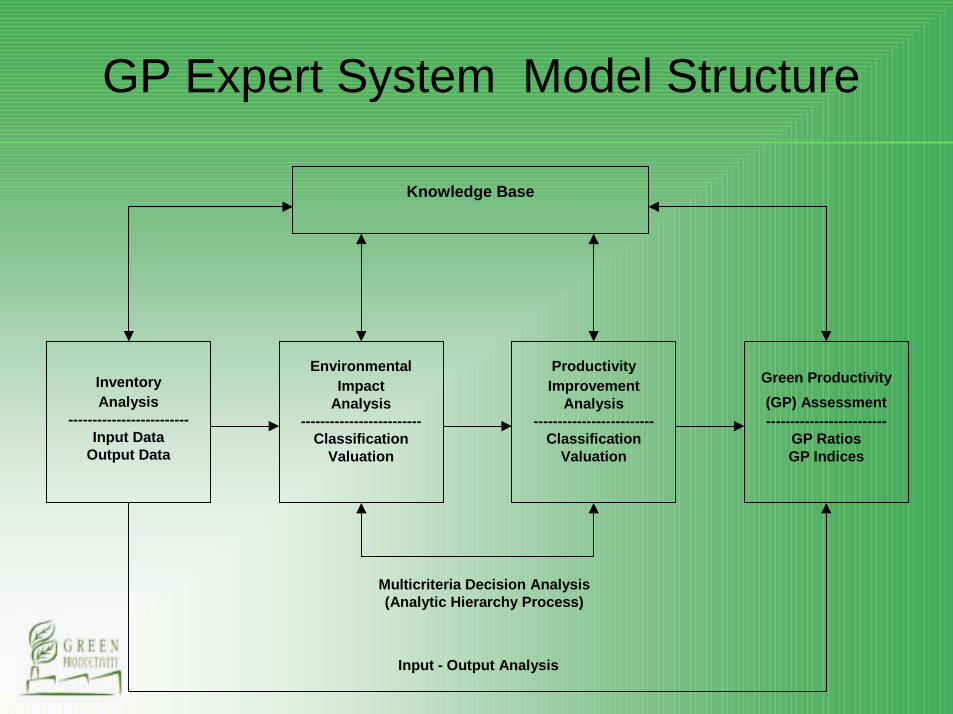
InventoryAnalysis
-------------------------Input Data
Output Data
EnvironmentalImpact
Analysis-------------------------
ClassificationValuation
ProductivityImprovement
Analysis-------------------------
Classification Valuation
Green Productivity (GP) Assessment-------------------------
GP RatiosGP Indices
Knowledge Base
Multicriteria Decision Analysis (Analytic Hierarchy Process)
Input - Output Analysis
GP Expert System Model Structure
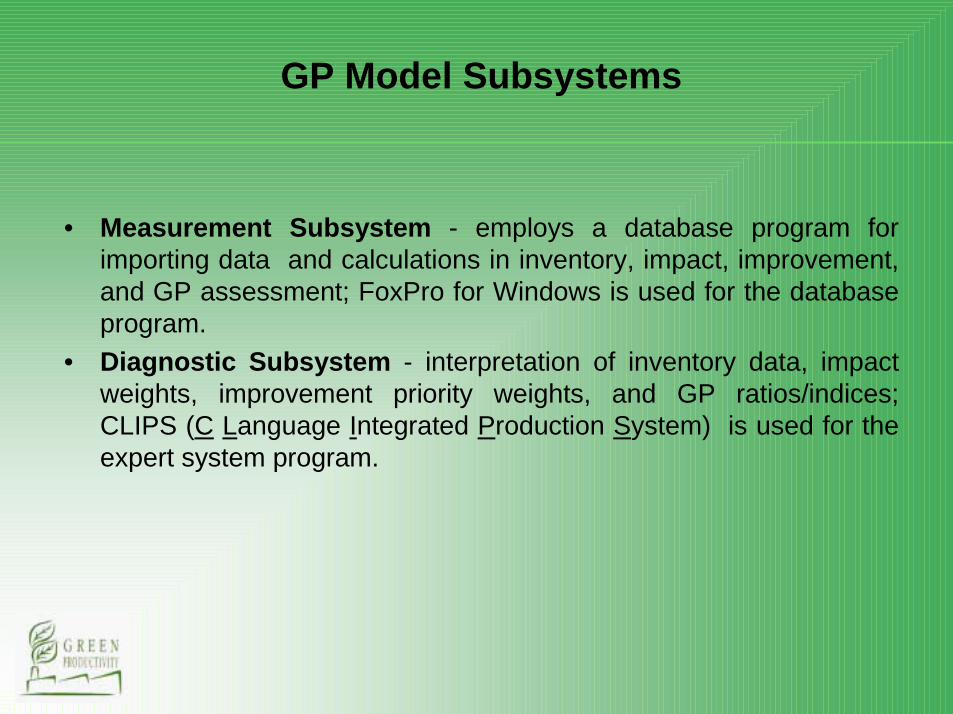
• Measurement Subsystem - employs a database program for importing data and calculations in inventory, impact, improvement, and GP assessment; FoxPro for Windows is used for the database program.
• Diagnostic Subsystem - interpretation of inventory data, impact weights, improvement priority weights, and GP ratios/indices; CLIPS (C Language Integrated Production System) is used for the expert system program.
GP Model Subsystems
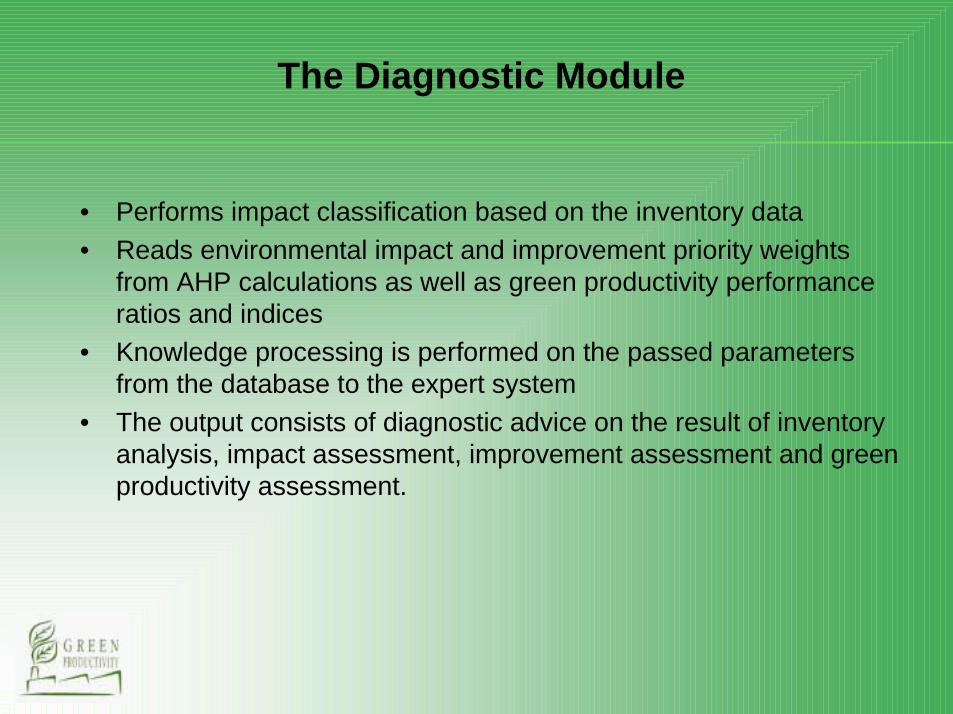
• Performs impact classification based on the inventory data • Reads environmental impact and improvement priority weights
from AHP calculations as well as green productivity performance ratios and indices
• Knowledge processing is performed on the passed parameters from the database to the expert system
• The output consists of diagnostic advice on the result of inventory analysis, impact assessment, improvement assessment and green productivity assessment.
The Diagnostic Module
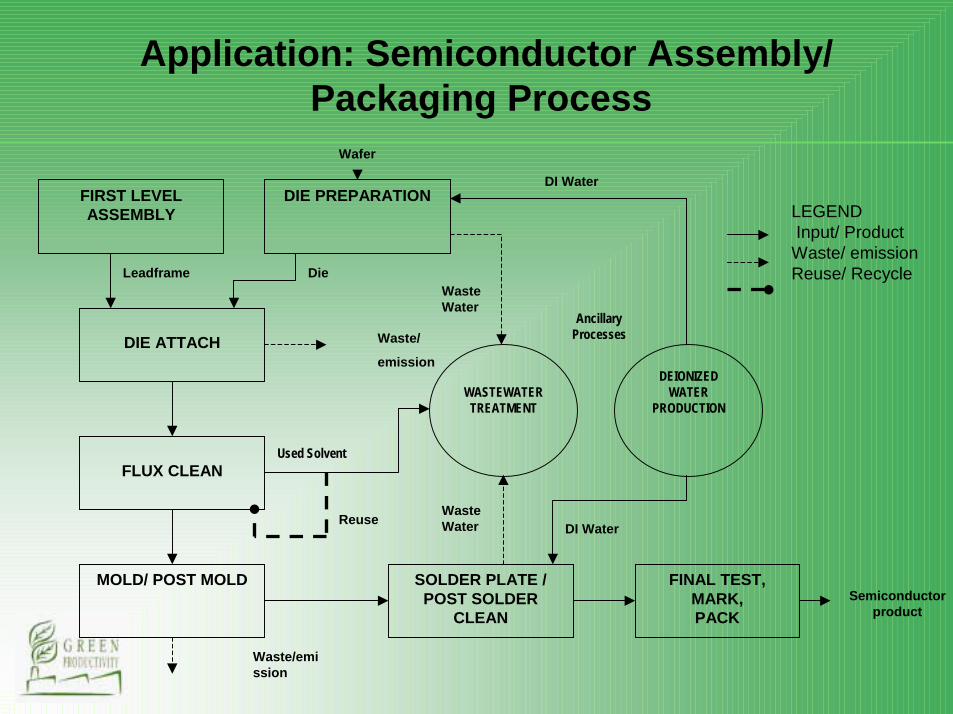
FIRST LEVEL ASSEMBLY
DIE PREPARATION
DIE ATTACH
FLUX CLEAN
MOLD/ POST MOLD
WASTEWATER TREATMENT
DEIONIZED WATER
PRODUCTION
SOLDER PLATE / POST SOLDER
CLEAN
FINAL TEST, MARK,PACK
Semiconductor product
DieLeadframe
Used Solvent
Reuse
Waste Water
Wafer
Ancillary Processes
DI Water
LEGENDInput/ ProductWaste/ emissionReuse/ Recycle
DI Water
Waste Water
Waste/
emission
Waste/emission
Application: Semiconductor Assembly/ Packaging Process
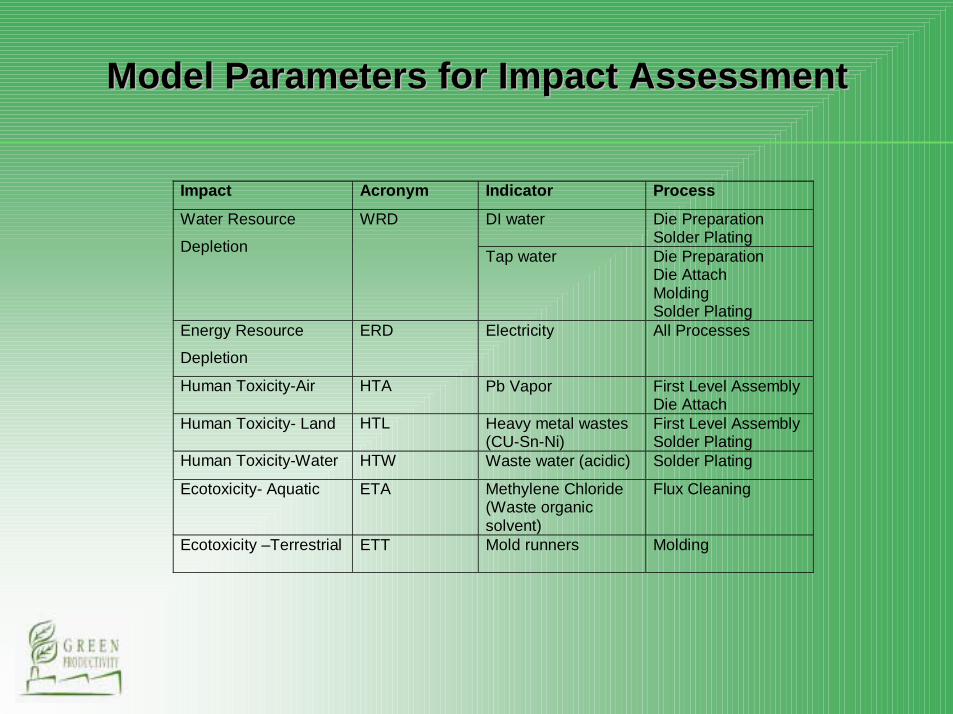
Model Parameters for Impact AssessmentModel Parameters for Impact Assessment
Impact Acronym Indicator Process
DI water Die PreparationSolder Plating
Water Resource
Depletion
WRD
Tap water Die PreparationDie AttachMoldingSolder Plating
Energy Resource
Depletion
ERD Electricity All Processes
Human Toxicity-Air HTA Pb Vapor First Level AssemblyDie Attach
Human Toxicity- Land HTL Heavy metal wastes(CU-Sn-Ni)
First Level AssemblySolder Plating
Human Toxicity-Water HTW Waste water (acidic) Solder Plating
Ecotoxicity- Aquatic ETA Methylene Chloride(Waste organicsolvent)
Flux Cleaning
Ecotoxicity –Terrestrial ETT Mold runners Molding
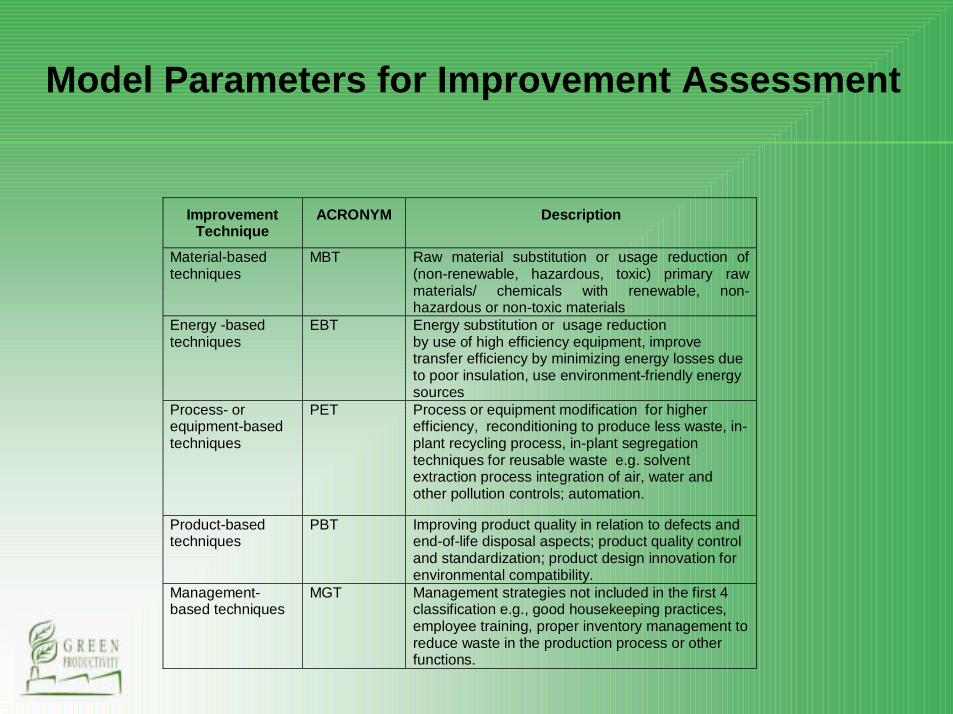
Model Parameters for Improvement Assessment
ImprovementTechnique
ACRONYM Description
Material-basedtechniques
MBT Raw material substitution or usage reduction of(non-renewable, hazardous, toxic) primary rawmaterials/ chemicals with renewable, non-hazardous or non-toxic materials
Energy -basedtechniques
EBT Energy substitution or usage reductionby use of high efficiency equipment, improvetransfer efficiency by minimizing energy losses dueto poor insulation, use environment-friendly energysources
Process- orequipment-basedtechniques
PET Process or equipment modification for higherefficiency, reconditioning to produce less waste, in-plant recycling process, in-plant segregationtechniques for reusable waste e.g. solventextraction process integration of air, water andother pollution controls; automation.
Product-basedtechniques
PBT Improving product quality in relation to defects andend-of-life disposal aspects; product quality controland standardization; product design innovation forenvironmental compatibility.
Management-based techniques
MGT Management strategies not included in the first 4classification e.g., good housekeeping practices,employee training, proper inventory management toreduce waste in the production process or otherfunctions.
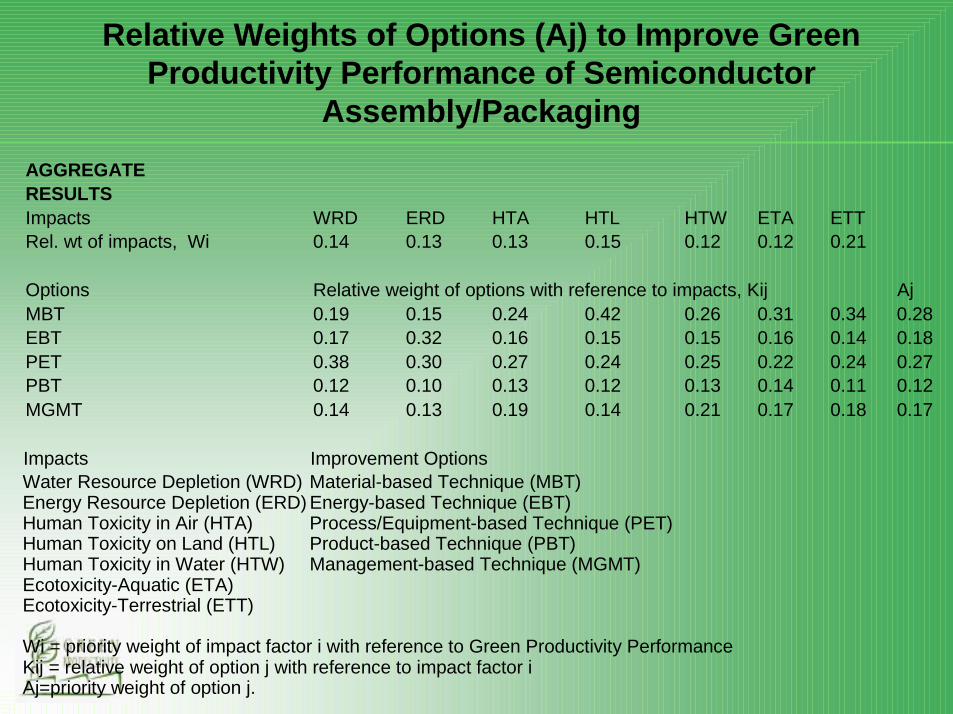
Relative Weights of Options (Aj) to Improve Green Productivity Performance of Semiconductor
Assembly/PackagingAGGREGATERESULTSImpacts WRD ERD HTA HTL HTW ETA ETTRel. wt of impacts, Wi 0.14 0.13 0.13 0.15 0.12 0.12 0.21
Options Relative weight of options with reference to impacts, Kij AjMBT 0.19 0.15 0.24 0.42 0.26 0.31 0.34 0.28EBT 0.17 0.32 0.16 0.15 0.15 0.16 0.14 0.18PET 0.38 0.30 0.27 0.24 0.25 0.22 0.24 0.27PBT 0.12 0.10 0.13 0.12 0.13 0.14 0.11 0.12MGMT 0.14 0.13 0.19 0.14 0.21 0.17 0.18 0.17
Impacts Improvement OptionsWater Resource Depletion (WRD) Material-based Technique (MBT)Energy Resource Depletion (ERD) Energy-based Technique (EBT)Human Toxicity in Air (HTA) Process/Equipment-based Technique (PET)Human Toxicity on Land (HTL) Product-based Technique (PBT)Human Toxicity in Water (HTW) Management-based Technique (MGMT)Ecotoxicity-Aquatic (ETA)Ecotoxicity-Terrestrial (ETT)
Wi = priority weight of impact factor i with reference to Green Productivity PerformanceKij = relative weight of option j with reference to impact factor iAj=priority weight of option j.
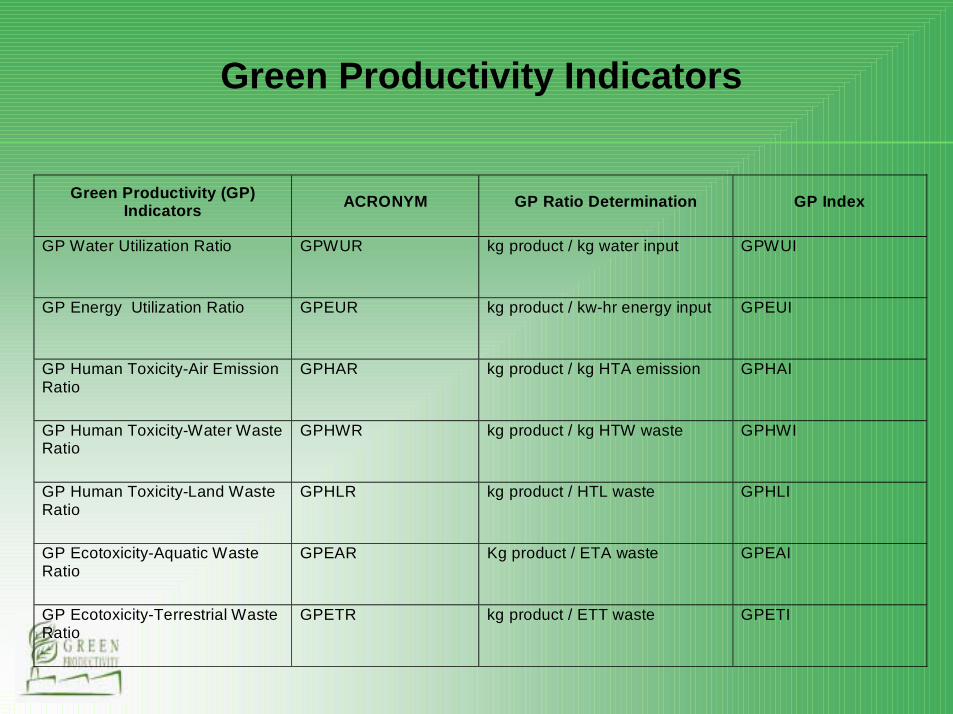
Green Productivity (GP)Indicators ACRONYM GP Ratio Determination GP Index
GP Water Utilization Ratio GPWUR kg product / kg water input GPWUI
GP Energy Utilization Ratio GPEUR kg product / kw-hr energy input GPEUI
GP Human Toxicity-Air EmissionRatio
GPHAR kg product / kg HTA emission GPHAI
GP Human Toxicity-Water WasteRatio
GPHWR kg product / kg HTW waste GPHWI
GP Human Toxicity-Land WasteRatio
GPHLR kg product / HTL waste GPHLI
GP Ecotoxicity-Aquatic WasteRatio
GPEAR Kg product / ETA waste GPEAI
GP Ecotoxicity-Terrestrial WasteRatio
GPETR kg product / ETT waste GPETI
Green Productivity Indicators
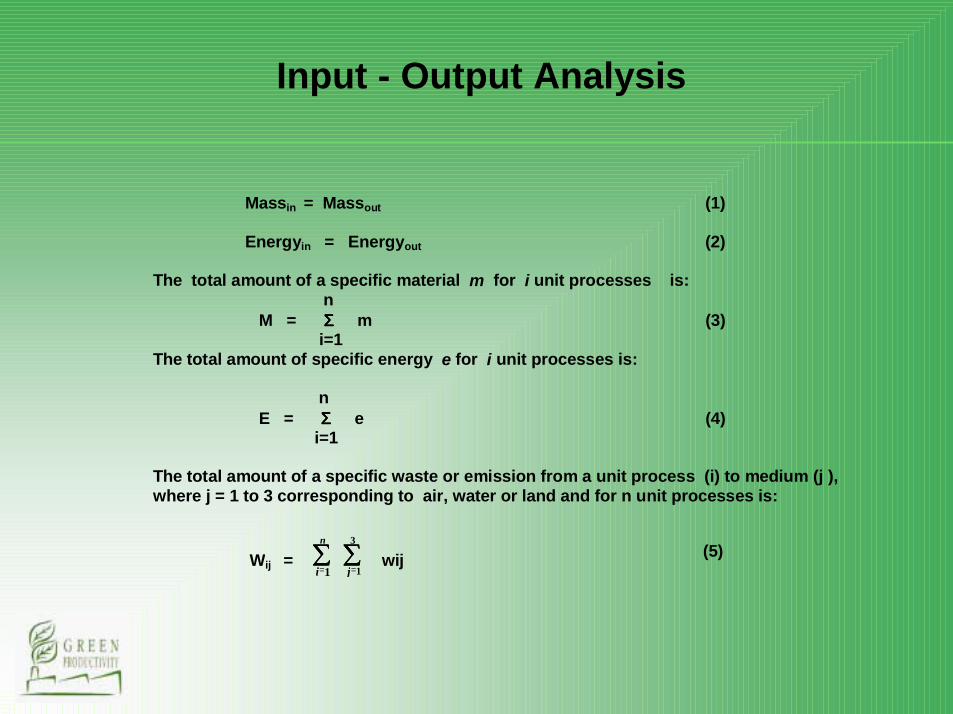
wij (5)
Massin = Massout (1)
Energyin = Energyout (2)
The total amount of a specific material m for i unit processes is: n
M = ΣΣΣΣ m (3) i=1The total amount of specific energy e for i unit processes is:
n E = ΣΣΣΣ e (4) i=1
The total amount of a specific waste or emission from a unit process (i) to medium (j ),where j = 1 to 3 corresponding to air, water or land and for n unit processes is:
∑∑∑∑=
n
i 1∑∑∑∑
=
3
1jWij =
Input - Output Analysis
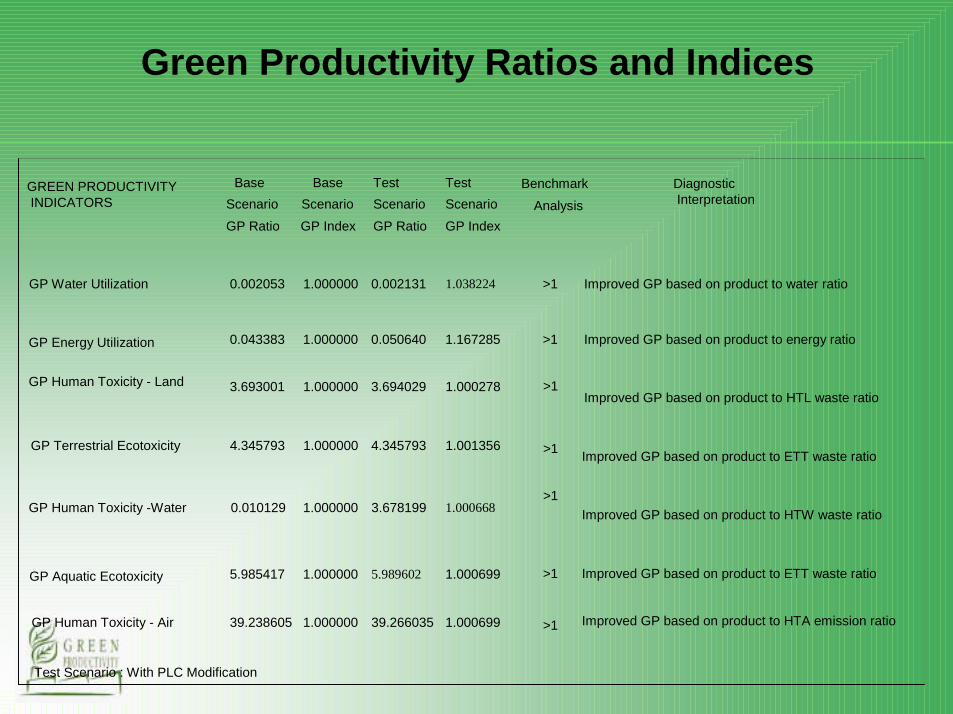
Base Scenario
Base Scenario
Test Scenario
Test Scenario
Benchmark
Analysis
DiagnosticInterpretation
GREEN PRODUCTIVITYINDICATORS
GP Ratio GP Index GP Ratio GP Index
GP Water Utilization 0.002053 1.000000 0.002131 1.038224 >1
GP Human Toxicity - Land 3.693001 1.000000 3.694029 1.000278
GP Terrestrial Ecotoxicity 4.345793 1.000000 4.345793 1.001356
Test Scenario : With PLC Modification
GP Energy Utilization 0.043383 1.000000 0.050640 1.167285 >1 Improved GP based on product to energy ratio
>1
>1
GP Human Toxicity -Water 0.010129 1.000000 3.678199 1.000668>1
GP Aquatic Ecotoxicity 5.985417 1.000000 5.989602 1.000699 >1
GP Human Toxicity - Air 39.238605 1.000000 39.266035 1.000699 >1
Improved GP based on product to water ratio
Improved GP based on product to HTL waste ratio
Improved GP based on product to ETT waste ratio
Improved GP based on product to HTW waste ratio
Improved GP based on product to ETT waste ratio
Improved GP based on product to HTA emission ratio
Green Productivity Ratios and Indices
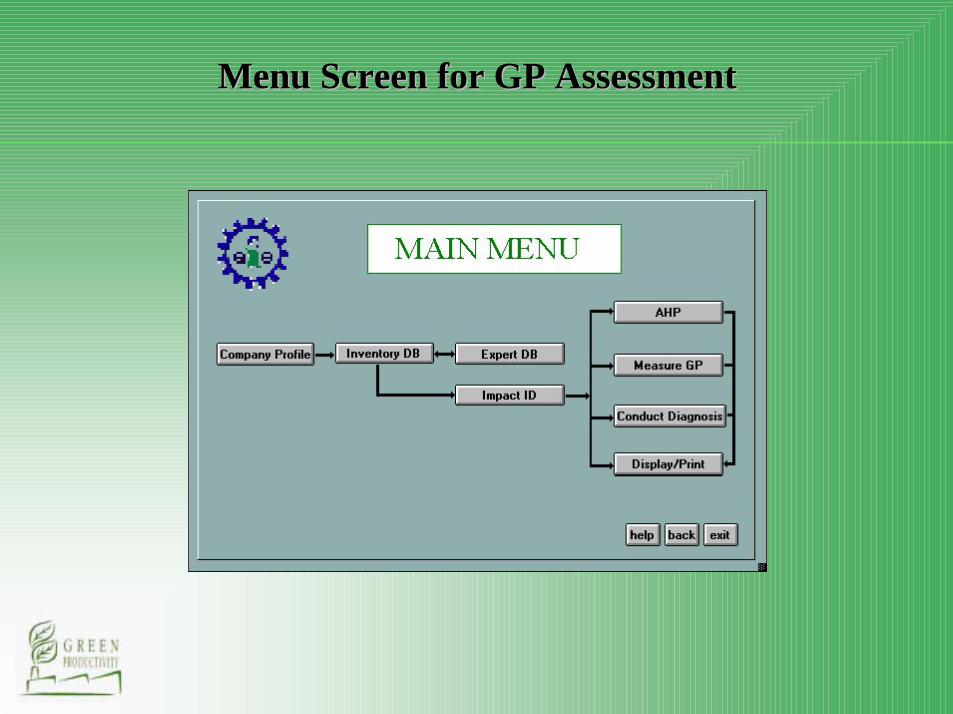
Menu Screen for GP AssessmentMenu Screen for GP Assessment
• Green productivity provides an open framework that can incorporate several strategies for sustainable manufacturing.
• The GP assessment methodology and computerized diagnostic prototype may be utilized as an internal management or self-assessment tool by companies in their continuous improvement strategies.
• The application of expert system technology is particularly appropriate to provide flexibility in testing assumptions and in preserving human expertise on green productivity program implementation.
• Enhancements may be made in future versions with a more comprehensive scope to include other pertinent life cycle stages, consider impact characterization differentiated into global, regional and local conditions and applicability on different industries when reliable databases become available.
• The GP diagnostic software may be integrated with some optimization software for improving industry performance.
Conclusion/Future Work
• Asian Productivity Organization (APO) for the concept materials on Green Productivity
• Semiconductor and Electronics Industries of the Philippines (SEIPI) and the Association of Electronics and Semiconductors for Safety and Environment Protection (AESSEP) for the favorable endorsement of the study to member-semiconductor companies which provided the necessary data and information for this research.
Acknowledgement