Embed Size (px)
Citation preview
- ii - - iii -
ASIAN PRODUCTIVITY ORGANIZATIONTOKYO
A MeasurementGuide to
Green Productivity
50 Powerful Tools to Grow your
Triple Bottom Line
- iv - - v -
Disclaimer and Permission to Use
This document is provided in PDF format for educational use. It may be copied and reproduced for personal use only. For all other purposes, the APO’s permission must first be obtained.
The responsibility for opinions and factual matter as expressed in this document rests solely with its author, and its publication does not constitute an endorsement by the APO of any such expressed opinion, nor is it affirmation of the accuracy of information herein provided.
50 Powerful Tools to Grow your Triple Bottom Line
A Measurement Guide to
Green Productivity
©Asian Productivity Organization, 2003ISBN: 92-833-2341-6
Dr. William Shireman
President, CEO
Global Futures/Future 500, USA
Foreword by Tachi Kiuchi
Chairman and CEO Emeritus
Mitsubishi Electric America
Editor by Prof. Tor Hundloe,
University of Queensland, Australia
- vi - - 1 -
Preface by Prof. Tor Hundloe
Tor HundloeProfessor of Environmental Management
University of Queensland and Chair of the Australian Tropical Rainforests World Heritage Property
Doing more with less — this is a desire of all humans. As a business person you want to produce more of your product by using less resources such as electricity, water, raw materials etc. This will increase your profits, and, automatically help the environment, even though this is not your first thought.
As a private citizen you want to air-condition your home (or heat it), bathe, wash your clothes, maintain your garden, use less electricity, water and detergents etc. This will provide you with the comforts you seek while saving you money and simultaneously improve the health of the environment.
These are two examples of green productivity. Some call this, or similar concepts, eco-efficiency or cleaner production. The term “green productivity” best captures the concept of being productive (something we all want in what ever capacity we act) and helping the environment (being “green” as it is now commonly called).
In whatever capacity we act (producer, consumer, government decision-maker or citizen) we have regard for our fellow human beings. We don’t want them to work in unhealthy factories and we don’t want people downstream to suffer from degraded water or air quality as a result of our lifestyles. This is the ethical dimension of being human.
Taken together, the economic, the environmental and ethical elements of our lifestyles can be called our “triple bottom line”.
The Foreword, by Tachi Kiuchi, Chairman and CEO Emeritus of Mitsubishi Electric America, takes up the theme of the triple bottom line. It is a very heartfelt, personal account of how a successful businessman learnt the lessons of green productivity well before anyone had coined the term.
As a trained economist and influenced by the conventional perspective of that discipline, I had to read this contribution three times before I came to fully appreciate its deep messages. Like Tachi Kiuchi, I have had a range of life-changing experiences in the rainforest, but it was only by sitting quietly deep
Table of Contents
Preface Tor Hundloe ......................................................................... 1
Foreword Tachi Kiuchi ........................................................................ 3
1. What is Green Productivity? ............................................................ 11
2. Twenty-Nine Different Ways to Measure and Motivate Green Productivity ............................................................ 17
– Examples of Environment Indicators .......................................... 30
– What is Life Cycle Assessment ................................................... 32
3. Eighteen Feedback Tools and Systems ........................................ 38
4. Three Environmental Management Systems ................................. 44
5. The Movement of Public Reporting ................................................ 51
6. Case Studies ..................................................................................... 53
7. Five Recommendations of What to do Next ................................. 72
Bibliography ..................................................................................... 74
- 2 - - 3 -
Foreword by Tachi Kiuchi
How Green Productivity Can Improve the Triple Bottom Line: Lessons from the Rainforest
Tachi Kiuchi Chairman and CEO Emeritus Mitsubishi Electric America
Green Productivity gives business the tools it needs to create more value, with fewer physical resources of all kinds — labour, materials, energy, pollution, and waste. It means running our businesses in ways that are friendly to the environment. But much more than that, it means running our businesses to maximize their total productivity — their triple bottom line: economic, social, and environmental.
Is that possible? For many years, we thought not. We assumed that to grow our businesses, we had to shrink the earth. But that makes no sense. The earth is where we get all the resources to run our economy. It is the big system. Business is the little system, operating within it. Destroy the big system, and we will find we have no businesses left to run. That is common sense. But how do we turn common sense theory into day-to-day practice? Green Productivity provides a way.
I learned about Green Productivity as a corporate CEO. Like many in my kind of position, I struggled to find ways to earn a profit while being a good corporate citizen. Like my colleague Bill Coors, who says that “all pollution and waste is lost profit,” I saw pollution as a drain on profits, not just inside the company, but throughout the globe. I wondered how we could eliminate waste, and turn it either into a source of savings, or of new value. I found some ideas in my company. But my most important lessons did not come from there. My most important lessons about business and the environment I learned in the forest. Let me explain.
My first lesson in the forest happened more than 40 years ago, days after I graduated from the University of British Columbia. I was asleep when I
inside a forest and pondering its complexity — a complexity that is its life — did I come to understand the message that Tachi Kiuchi gives us.
We then come to the body of the book. It elaborates on the theme of its title — basically elaborating on tools which any smart and thoughful business person can use to improve profits while providing environmental benefits. This has been written by Bill Shireman, CEO of Global Futures and President of The Future 500. As editor I have made slight changes to his work and added Appendix 2, which was compiled by the Environmental Management Centre, the University of Queensland. I have also added the illustrations.
- 4 - - 5 -
To seize the opportunities of this new era, our company and many others are shifting our investments away from the ecologically harmful practices of the old economy, toward the information-based technologies of the future. We are shifting from growth based on consumption to growth based on knowledge.
The pace of change, however, is extremely fast. To succeed, we must be agile. And we must be creative. And that requires that we operate our businesses in bold new ways. In the old days, we operated our businesses like they were machines. But machines are not agile. They are not creative. They do not respond well to change. In the future, we need to operate our businesses according to a different model.
That brings me to how I got my second lesson from the forest. Around Earth Day a decade ago, I received a small stack of letters from a class of elementary school students, asking me to do what I could to stop harming the rainforest. The letters confused me at first. We are an electronics company. We have no timber holdings. We make no forest products. We use very little paper or wood. What’s the connection?
It turned out they were talking about another company that shares the Mitsubishi name. We’ve been separate companies for 50 years, since 1946. Not subsidiaries, not divisions. Separate. But no one knows this except us. Everyone thinks they own us, or we own them, or somebody else owns us all. So long ago, we stopped trying to convince people we are separate companies. It’s much easier just to try to do something about the problem, instead of worrying about the name confusion.
Solving problems and fulfilling needs, after all, is how businesses discover new markets, and generate new profits. Even better if the company hasn’t invested in whatever caused the problem — so there’s no trapped capital to lose. So on my next trip to Asia, I visited the Malaysian rainforest. I met with expert foresters. I visited timber cutting sites, as well as reforestation and research operations. I spoke with visionary environmentalists and executives. What I learned changed my life as a corporate executive.
Be Like a Rainforest
I learned that saving the rainforests — in fact, saving the environment — is more than an environmental necessity. It is a business opportunity. In our case, it is an opportunity to pursue business opportunities that use creativity and technology to substitute for trees, for resources of any kind. But I learned something else in the rainforest, something more profound. I learned how we might operate our company not just to save the rainforest, but to be more like the rainforest.
Let me explain. As I said earlier, today’s fast-changing business environment requires that we be alert, and responsive; agile and creative.
got my lesson. This was unfortunate, because at the time I was driving a little British car, through the forests of the Canadian Rockies. It is not advisable to drive a car through the Rockies when one is asleep. You might drive off a cliff, which is exactly what happened to me. When I woke up in the hospital, I had plenty of time to reflect upon what I could learn from this incident. I remembered advice that my father had given me a few years before.
He knew I was an adventurer, and a risk taker. He liked that, but he didn’t want me to have too much of a good thing. So he took me aside and told me: “Do whatever you want. But don’t die.” I wanted to call my father to tell him that I had taken his good advice. But my jaw was clamped shut. So I couldn’t. He found out anyway. The Japanese Consul General saw an article on my adventure in the local newspaper, and sent it to him.
I have since passed along my father’s advice to others. I think about it when people ask me what I think about sustainability. To me, this is what it means: “Do what you want. Follow your purpose. But don’t die.” For a young man, driving off a cliff in the Rocky Mountains teaches a valuable lesson.
Stay Alert - Watch Where You are Going
It seems to me that the global business community is driving quickly toward a cliff, and we have our eyes closed. If we opened them, here is what we would see:
Today, 600 million of the Earth’s inhabitants — in Europe, Japan, and the United States — enjoy the material benefits of industrialism. Soon, 2.5 billion more — in China, India, the former Soviet republics — will join us. And after them, the final 3 billion will seek the same. They demand and deserve to share in the benefits that we enjoy.
To provide all with our lifestyle we would need two to three more planets, full of resources. But we have only one. That’s not all. Our population continues to grow. By the end of the 21st century, the United Nations predicts that it could as much as double. That means, to provide everyone with today’s industrial standard of living, we would need the resources of eight planets, or more.
We cannot do that. Instead, we must learn a new way of life. And we will. We have no choice. We must learn to provide affluence without effluence. And we must do so by consuming less from the environment, not more.
Population explosion. Habitat destruction. Resource consumption. Those are signs that may worry us. I wonder if you all see, as I do, positive signs as well, signs of the dawn of an entirely new era, an era when all our businesses, yours and mine, will undergo dramatic change. That new era could move us beyond the industrial era, when we used machines to expand human muscle. It could carry us into a new era in which we expand the human mind.
- 6 - - 7 -
True Profit Comes from Design, Not Matter
In fact, the most important feature of natural capital is its design, its structure and relationships. Like those we see in the rainforest, or in our communities, or in our companies. In Japan we have two terms to describe this: omote and ura. Omote is the surface or front of an object, ura its back or invisible side. Omote and ura. External reality and underlying reality.
When I visited the rainforest, I thought, as business people, we have been looking at the rainforest all wrong. What is valuable about the rainforest is not omote — the trees, which we can take out. What is valuable is ura — the design, the relationships, from which comes the real value of the forest. When we take trees from the forest, we can ruin its design. But when we take lessons from the forest, we further its purpose. We can develop the human ecosystem into as intricate and creative a system as we find in the rainforest. We can do more with less. Grow without shrinking. Ura, not omote.
We are beginning to learn the value of this in business. Consider the microchip. A microchip’s omote — its physical content — isn’t very valuable. Silica is the cheapest and most abundant raw material on the planet — sand. But a microchip — its shape, its design, its unseen artistry — is extraordinarily valuable. Yet it comes from a source that seems almost unlimited — the knowledge and inspiration we draw from the human mind and spirit. That is the most valuable resource, and the most abundant.
This becomes the most important question for today’s corporate executives to answer: How can we redesign, reinvent our corporations, so that they fully harness the human mind and spirit? How can we transform our top-down hierarchies, our conformist monocultures, to engage the magical creative qualities we see in the forest? That brings me to my next lesson.
Follow in Nature’s Footsteps
To succeed in the new economy, we must operate by the design principles of the rainforest, the design principles of nature’s most advanced learning organization. There are many design principles in nature. Let me name five that I think are most important for business. See if you agree, and if you can tell what connects them:
(i) Get Feedback. Feedback triggers innovation.
(ii) Add design value. All value is created by design.
(iii) Improve Efficiency. All waste is lost profit.
(iv) Harness diversity. Diversity equals resilience.
(v) Be a Good Fit. As we join together, we unleash a greater whole.
1”Cradle to cradle” is the ecological concept of a closed system.
To do so, we must structure our companies so they are living organizations. Not top-down, but bottom-up. Not centralized, but decentralized. Not limited by rules, but motivated by objectives. Not structured like machines — which cannot learn — but like living systems, which can.
When I visited the rainforest, I realized that it was a model of the perfect learning organisation. A place that excels by learning to adapt to what it doesn’t have. A rainforest has almost no resources. The soil is thin. There are few nutrients. It consumes almost nothing. Wastes are food. Design is capital. My model for Mitsubishi Electric. An organisation that is like a rainforest.
Here is what a banker would say if asked to make a loan to a rainforest: “No way!” After all, it has no “productive” assets, as bankers would define them. Yet rainforests are incredibly productive. They are home to millions of types of plants and animals, more than two-thirds of all biodiversity in the world. Those plants and animals are so perfectly mixed that the system is more efficient, and more creative, than any business in the world. Imagine how creative, how productive, how ecologically benign we could be if we could run our companies like the rainforest? How can we begin? By operating less like a machine, and more like a living system.
That is why Green Productivity is so important. Green Productivity is to the new economy as labour productivity was to the old. The industrial economy used machines to multiply human labour. Labour productivity told us how well we were doing. In the emerging economy, we use information to multiply a much wider array of resources — labour, materials, and energy. Green Productivity tells us how well we are doing.
Green Productivity is related to a whole new lexicon of terms, all helping us understand a different aspect of a sustainable economy. Terms like “industrial ecology”, which applies ecological principles to business and industrial practices; “natural capitalism”, Paul Hawken’s term for the ecological capital that underpins all other forms of capital; and “sustainable development”, the broad goal to provide for the needs of the present, without undermining the capacity of future generations to provide for their own needs.
For people in business, Green Productivity requires two things. First, we must have our eyes wide open, and see the environmental costs and benefits of our business. Second, based on what we see, we must take action. See costs - and reduce them. See benefits — and increase them. See needs — and fill them. Not just inside the company, but throughout the community, locally and globally. We must take responsibility for the impacts of our products, from cradle to cradle1.
Which brings me to my third lesson from the rainforest. How can rainforests be so productive when they seem to have no capital assets? They are productive because their capital is hidden in their design.
- 10 - - 11 -
1. What is green productivity?
Green Productivity (GP) reconciles two needs that are often in conflict: the need for business to earn a profit and the need for everyone to protect the environment (see Box 1). No business can long operate without a profit. That is true in a capitalist free market — but it is true under all other systems as well. A business that loses money will eventually drain the resources of its society. Either it will go bankrupt, or the society that supports it will. Similarly, no business can operate forever by depleting the natural environment. The environment is the ultimate foundation for business and economic productivity. If businesses operate in disregard for the limits of the environment, then either the economy will go bankrupt, or the environment that supports it will.
In a way, the industrial economy is like a business that doesn’t keep good track of the money it uses. The earth is a huge bank, full of resources that we can withdraw and spend. Yet no one is drawing down our accounts when we make withdrawals. We pay for earth’s resources according to their cost of extraction, not their cost of creation. That is like valuing your life savings according to the cost of driving to the ATM to withdraw them.
Just as we expect a business to keep track of the economic resources it draws from society, and replenish them by adding value, we are beginning to expect a business to track the environmental resources it consumes — and take responsibility for replenishing them.
To some that suggests that business will lose while the environment gains. But it does not have to be that way. A business with a sound system of financial accounting — one that knows its costs, revenues, and bottom line — can act in ways that increase its financial performance. Similarly, a business with a sound system of accounting of its economic, social and environmental costs and benefits can act in ways that build its triple bottom line.
Box 1: Green Productivity
Green Productivity (GP) is a strategy for enhancing a business’s productivity and environmental performance at the same time, for overall socio-economic development. It is the application of appropriate techniques, technologies, and management systems to produce environmentally compatible goods and services.
profits. We earn profits to run our business. Our business has meaning and purpose — a reason to be here.
People talk today about businesses needing to be socially responsible, as if this is something new we need to do, on top of everything else we do. But social responsibility is not something that one should do as an extra benefit of the business. The whole essence of the business should be social respon-sibility. It must live for a purpose. Otherwise, why should it live at all? That purpose is to unleash something greater than we are, something greater than our businesses are. Something that, like the process of evolution itself, leads to the emergence of a capacity within us that now lays latent, waiting to be discovered and tapped.
That is why Green Productivity is so important. Green Productivity is not just an environmental strategy. It is a total business strategy. Like industrial ecology, natural capitalism, and sustainable development, it looks at business in a whole new way. Rather than as a machine, it sees business as something living — a living system, a living organization, a community. Something that evolves, from one form, to others from which whole new qualities emerge.
The way to start profiting from Green Productivity is simple. Feedback. Find simple, gentle ways to feed back the total costs and benefits of business. Once the feedback is received, it can trigger adaptations. Breakthrough innovations that create new wealth. And continuous improvements that drive down costs. More value, less waste. As those adaptations increase, companies and people grow more different from one another, more distinctive. Yet paradoxically, they grow closer together. Each needs every other more. Competition begins to take a back seat to cooperation, to integration. And we begin to grow a global community.
The measurement tools in this manual are just a start. They seem simple — and most of them are. But their impacts can be far-reaching. They can trigger the start of a process of change that will enrich both your company, and the communities you serve. That suggests the final lesson I learned — so far — from the rainforest. The mission of business — the mission of civilization — is to develop the human ecosystem, sustainably. To take our place in the global ecosystem, in all our diversity and complexity.
What I learned from the rainforest is easy to understand. We can use less, and have more. Consume less, and be more. To do so, learn the tools of Green Productivity. Begin today.
- 12 - - 13 -
Is Green Productivity Today’s Successor to Labour Productivity?
When economists talk about productivity, they usually mean labor productivity — the amount of product produced by each unit of labor. But is this the only form of productivity? Why the focus on labour? All inputs contribute to the productivity of a business. These inputs (or resources) include labor, machinery, land, raw materials and human capital. So why do economists focus so much attention on just one kind of input?
This is a function of industrialism itself. For over three centuries, the industrial economy has used machines explicitly to augment and multiply human muscle. Machines extract raw materials. Machines transport them to factories. Machines turn raw materials into products. Machines deliver goods and services to market. Machines take them away when their useful life is spent. Because the core function of most industrial machines was to multiply human labour, labor productivity naturally became the core measure of economic productivity in the industrial economy.
Today, however, information technologies call for a much more comprehensive approach to productivity. When information is substituted for physical resources — in a microchip, an advanced material, an inventory management system, or an email message — all kinds of physical resources can be saved in the process. Sending a million messages using the post office, for example, requires trees, printers, postal employees, delivery trucks, and so on. Sending the same million messages via email requires nothing more than an electronic network. Plenty of resources are required to put that network into place. But once in place, the incremental communications are cheap.
Biomimicry is the term coined by scientist and writer Janine Benyus, and refers to technologies that mimic the designs and patterns of nature.
Industrial ecology is the application of ecological principles to business practices. Its objective is to foster higher productivity and superior environmental performance simultaneously. Its tools range from life cycle analysis and design-for-environment, to the management and measurement systems proposed in this book.
None of these concepts are yet fully developed. All tend to borrow from one another, to the point that the terms themselves are often used interchangeably. Everyone seems to have an impassioned opinion about the “correct” usage of each term. But those who invent, popularize, or practice the concepts won’t retain control of their definitions. Their meanings and methods will evolve depending on how they come to be used by the community at large.
GP recognizes that all the pollution and waste generated are resources a business bought but can’t sell. That is, when businesses produce waste, this represents a failure to convert resources into saleable products. From this perspective, pollution and waste are the inverse of corporate productivity — they are what a company makes when it isn’t being productive.
GP seeks to eliminate this pollution and waste. It also sets out to promote innovations that create new valuable products or processes. In these two ways — reducing waste and increasing innovation — GP helps a company increase productivity. It is applicable not only to manufacturing, but also to the service, information, and agricultural sectors, and even to government and community economic development. There are a number of concepts, we can call them “sister movements”, which are similar to GP. These are outlined in Box 2.
Box 2: Sister Movements to Green Productivity
Green Productivity is part of a much broader movement of change that goes by many names — natural capitalism, corporate sustainability, industrial ecology, and others. These are powerful concepts — they get us to think differently about business and the environment — but they may be tough to put into practice. They are hard to operationalize. This manual is in part an effort to provide practical tools to operationalize these concepts.
The concepts all borrow from one another, and are all part of an emerging art and science of corporate sustainability. Together they reflect a process of social exploration and introspection, as we search for answers on the verge between one global economic system and another.
Green Productivity (the focus of this manual) is a system popular in Asia that combines the tools of productivity enhancement with insights from nature to deliver gains in each. Just-in-time inventory management, source reduction, dematerialization, and environmental design are among its tools.
Corporate sustainability (a European and American variant on GP) was popularized by the Brundtland Commission and later the World Business Council on Sustainable Development. It focuses on enhancing the triple bottom line: the economy, the environment, and society.
Natural capitalism (a term coined by Paul Hawken) shows how business depends on the systems and cycles of nature, and suggests a set of practices aimed at multiple-factor gains in resource efficiency.
Bionomics was developed by business strategist Michael Rothschild and is popular among systems thinkers and free market advocates alike. It suggests that business itself is one of nature’s systems, and operates according to the same ecological principles.
- 14 - - 15 -
In nature, feedback drives evolution. Every creature is shaped by feedback, adaptation, and learning, sculpted in response to the limits that are a constant reality. The rainforest, for example, delivers resources through an extensive array of feedback loops, which serve as the sensory system of the forest. In conscious species, from the animals of the forest to today’s humans, sensory systems like taste, touch, hearing and sight provide the feedback we need to regulate our actions in ways that increase our chance of survival.
From this perspective, most businesses are severely handicapped. They operate with only two senses — taste and touch. They have a sense of taste — they know what is going on inside them, their immediate bottom line. And they have a sense of touch — they know the immediate impact of what is happening directly to them from the outside, right now. But they have no equivalent to the sense of sight, or hearing. They do not know what is happening at a distance, until it is directly affecting them, until they feel the impact.
Measurement helps give a business a fuller array of senses. It conveys, from a greater distance of space and time, the costs and benefits of its actions, as well as the limits and opportunities of its environment. It helps a business to know where it stands, plan where it goes, and reach its most desirable destinations.
The New Role of Measurement is Learning, Not Just Confirming
One common theme that ties together the measures (which we alternatively call “metrics”) is a focus not just on confirming performance — the objective of many traditional financial and compliance-based measurement options — but on providing feedback for learning and adaptation.
In the older-style conventional economy, a few core metrics dominated discussions of business performance. Sales, market share and profits became core indicators of the size, scale, and the potential of a business. Gross National Product (GNP) measured the total flow of commerce through the economy. Health of the business or macro-economy was indicated when the numbers went up every year, or every quarter. Decline was suggested when they went down.
Numbers enable control when used in a growth-oriented environment. That control tends to be linear and hierarchical, extending from one end of the chain to the other: shareholders control executives who control managers, employees, and suppliers. Metrics can be seen in a sense as tools to calibrate the machine. If parts don’t meet specifications, if workers don’t meet quotas, if executives don’t meet quarterly projections, and if portfolio and mutual fund managers don’t meet top rates of return, then the feedback can be direct and painful.
The infusion of information technologies into the industrial economy has dramatically increased the productivity not just of labour, but of energy and materials as well. Between 1970 and 1990, for example, energy and materials productivity increased by a third. Yet economists often ignore these gains, and thus overlook a compelling attribute of the information economy.
Today, as the economic role of information continues to expand, it makes sense to measure productivity more comprehensively. GP includes not just labor, but energy and materials as well.
The Two “Bullets” of Green Productivity
GP has two “silver bullets”. It enables us to do more, and use less. “Doing more” is a function of innovation. Designer William McDonough calls that eco-effectiveness. “Using less” is a function of efficiency — or what environmentalists call eco-efficiency. GP puts them together.
The first of GP’s bullets — eco-efficiency — involves three steps. The first step, especially as it has been practiced in Asia, is to prevent pollution, waste, and unnecessary consumption, at their source. This involves the rationalization and optimization of resource use. Tactics may include traditional Asian management tactics, like continuous improvement and quality circles, process redesign, as well as materials reuse, recovery, and recycling.
The second eco-efficiency step is to substitute toxic or hazardous substances to reduce life cycle impacts. This involves examining the life cycle environmental costs and benefits of a product, package, process, or service, and a focusing on design-for-environment.
The third step is to meet or exceed regulatory requirements and safeguard the workplace and environment. These three steps are often taken in the context of a corporate environmental management system (EMS) that embeds environmental considerations deep within the company, so that it is not just an end-of-pipe or even tactical step, but an element of the front-end strategy.
The second of GP’s bullets — eco-effectiveness — means fostering breakthrough innovations that create value in new ways. This has not been emphasized in most approaches to GP, possibly because of its roots in Asia, where there is greater emphasis on improvement than innovation.
Why Is Measurement Important to Green Productivity?
If eco-efficiency and eco-effectiveness are the twin bullets of GP, then measurement pulls the trigger that fires them. Everyone knows the phrase, “What gets measured gets done.” But why does it tend to be true? Because measurement is a form of feedback, and leads to adaptation.
- 16 - - 17 -
2. Twenty-nine Different Ways To Measure and Motivate Green Productivity
Here I define a wide array of measurement and feedback tools that business and organisations can use to enhance triple bottom line performance. We begin with a focus on total resource productivity, which expands the concept of labor productivity to include a more comprehensive set of productivity factors, including those related to materials and energy.
Then, we present 29 different measurement tools. This list includes tools with measurement components, although some are not exclusively measurement tools. Following this we present 18 additional feedback tools. Some of these include measurement components, but the measurement element is less significant than the programs that are involved in applying the tool.
The core metric of the industrial economy — the metric that captures the capacity of machines to multiply human work — is labor productivity. The core metric of the post-industrial economy, where information multiplies resources of all kinds is total resource productivity: labour, capital, land, raw material, water and energy. In aggregate or individually — the difference can be crucial — all inputs into production have to be used with the aim of obtaining the greatest possible output with the least possible input use.
The New Core Metric: Total Resource Productivity
There are many ways to measure resource productivity, or, at the very least, key components of it. You can focus on one or two key inputs, like water, or energy. You can focus on a physical output, like number of products, or on a financial one, like revenues from services delivered. You can count only direct internal costs and benefits, or you can seek to include life cycle impacts.
Similarly, there are many ways to express resource productivity depending on your professional background. If you’re an economist, it might be a benefit to cost ratio. To a systems scientist, it’s synergy to entropy. To an industrial ecologist, it’s physical outputs to inputs.
Metrics serve a somewhat different role in “learning” organizations. They provide feedback from many directions, in forms that are often more subtle and more forgiving. The perspective of Wheatley and Kellner-Rogers (1999) is that the difference is critical. Old-style measurement is uniform — one or two measures cascade through all levels of the company or organization, fostering a single focus from the top to the bottom of the chain. It is imposed.
Non-linear feedback, on the other hand, comes in many forms, from many directions. From an array of inputs, people focus on those that provide them with knowledge they can use to improve their performance. Feedback-oriented metrics stimulate performance, rather than define it. Surprising forms of feedback are highly desirable, because they are “red flags” of opportunity and risk. Their source is irrelevant. Their meaning is what is important.
It would be easy to exaggerate the role of measurement. As Wheatley and Kellner-Rogers (1999 p.27) write:
“In too many organizations, … the measures define what is meaningful, rather than letting the greater meaning of the work define the measures. As the focus narrows, people disconnect from any larger purpose, and only do what is required of them…. Eventually, they die on the job. They have been cut off from the deep well-springs of purpose which are the source of the motivation to do good work.”.
In other words, a sense of mission and shared values must underlie all good measurement.
- 18 - - 19 -
of resource productivity, a 75% reduction in resource intensity, and a factor four gain.
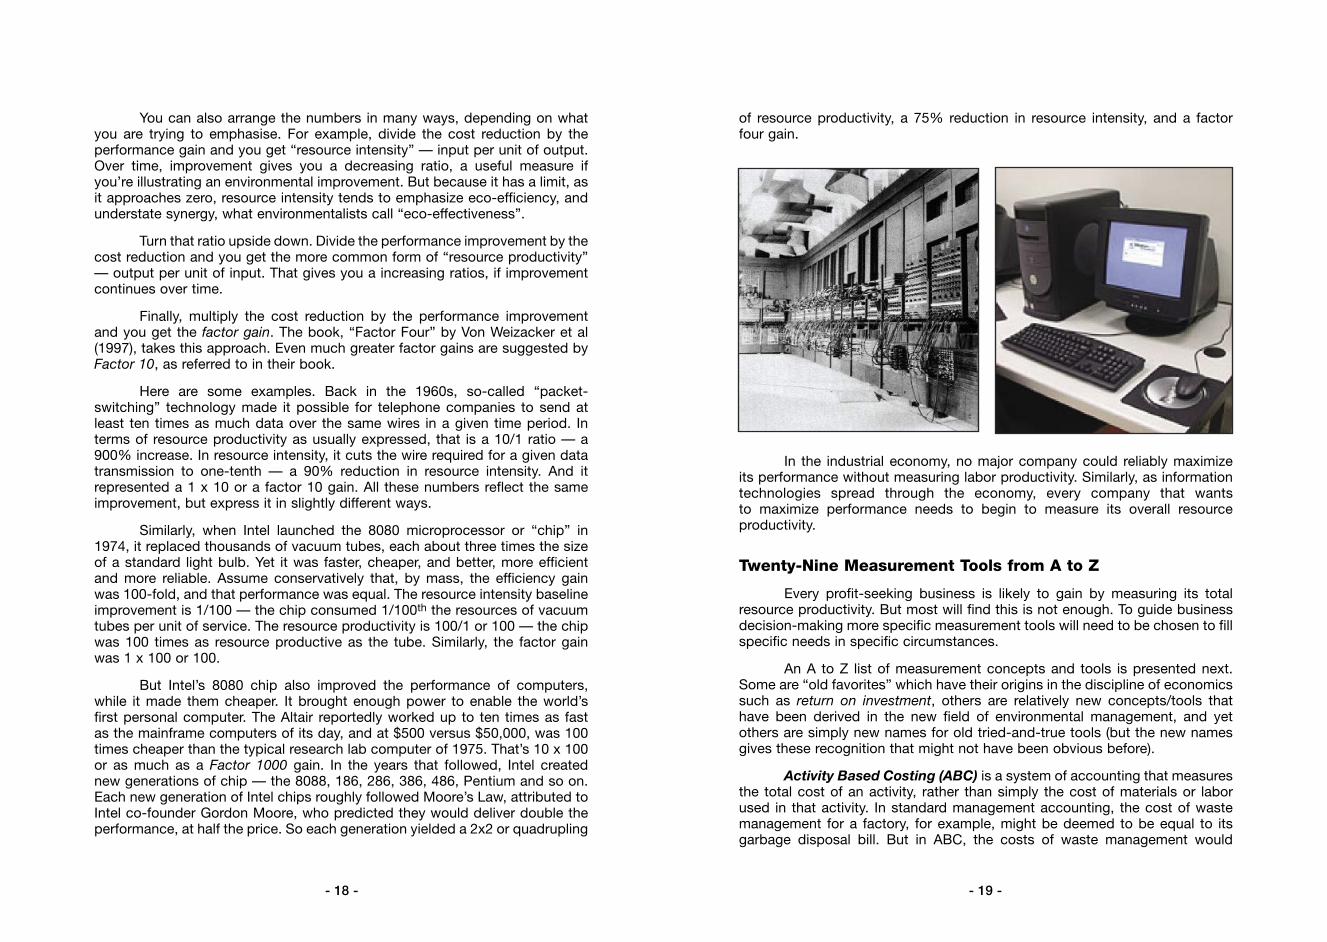
In the industrial economy, no major company could reliably maximize its performance without measuring labor productivity. Similarly, as information technologies spread through the economy, every company that wants to maximize performance needs to begin to measure its overall resource productivity.
Twenty-Nine Measurement Tools from A to Z
Every profit-seeking business is likely to gain by measuring its total resource productivity. But most will find this is not enough. To guide business decision-making more specific measurement tools will need to be chosen to fill specific needs in specific circumstances.
An A to Z list of measurement concepts and tools is presented next. Some are “old favorites” which have their origins in the discipline of economics such as return on investment, others are relatively new concepts/tools that have been derived in the new field of environmental management, and yet others are simply new names for old tried-and-true tools (but the new names gives these recognition that might not have been obvious before).
Activity Based Costing (ABC) is a system of accounting that measures the total cost of an activity, rather than simply the cost of materials or labor used in that activity. In standard management accounting, the cost of waste management for a factory, for example, might be deemed to be equal to its garbage disposal bill. But in ABC, the costs of waste management would
You can also arrange the numbers in many ways, depending on what you are trying to emphasise. For example, divide the cost reduction by the performance gain and you get “resource intensity” — input per unit of output. Over time, improvement gives you a decreasing ratio, a useful measure if you’re illustrating an environmental improvement. But because it has a limit, as it approaches zero, resource intensity tends to emphasize eco-efficiency, and understate synergy, what environmentalists call “eco-effectiveness”.
Turn that ratio upside down. Divide the performance improvement by the cost reduction and you get the more common form of “resource productivity” — output per unit of input. That gives you a increasing ratios, if improvement continues over time.
Finally, multiply the cost reduction by the performance improvement and you get the factor gain. The book, “Factor Four” by Von Weizacker et al (1997), takes this approach. Even much greater factor gains are suggested by Factor 10, as referred to in their book.
Here are some examples. Back in the 1960s, so-called “packet-switching” technology made it possible for telephone companies to send at least ten times as much data over the same wires in a given time period. In terms of resource productivity as usually expressed, that is a 10/1 ratio — a 900% increase. In resource intensity, it cuts the wire required for a given data transmission to one-tenth — a 90% reduction in resource intensity. And it represented a 1 x 10 or a factor 10 gain. All these numbers reflect the same improvement, but express it in slightly different ways.
Similarly, when Intel launched the 8080 microprocessor or “chip” in 1974, it replaced thousands of vacuum tubes, each about three times the size of a standard light bulb. Yet it was faster, cheaper, and better, more efficient and more reliable. Assume conservatively that, by mass, the efficiency gain was 100-fold, and that performance was equal. The resource intensity baseline improvement is 1/100 — the chip consumed 1/100th the resources of vacuum tubes per unit of service. The resource productivity is 100/1 or 100 — the chip was 100 times as resource productive as the tube. Similarly, the factor gain was 1 x 100 or 100.
But Intel’s 8080 chip also improved the performance of computers, while it made them cheaper. It brought enough power to enable the world’s first personal computer. The Altair reportedly worked up to ten times as fast as the mainframe computers of its day, and at $500 versus $50,000, was 100 times cheaper than the typical research lab computer of 1975. That’s 10 x 100 or as much as a Factor 1000 gain. In the years that followed, Intel created new generations of chip — the 8088, 186, 286, 386, 486, Pentium and so on. Each new generation of Intel chips roughly followed Moore’s Law, attributed to Intel co-founder Gordon Moore, who predicted they would deliver double the performance, at half the price. So each generation yielded a 2x2 or quadrupling
- 20 - - 21 -
facilities. Companies can access demonstration versions of the software via the web site www.natlogic.com.
CAP Audit is a comprehensive assessment of a company’s “triple bottom line” performance, using a 108-point inventory to score the company according to the criteria of its leading stakeholder communities, from shareholders to customers to investors, as well as using the criteria of groups like the Council on Economic Priorities and Global Reporting Initiative (GRI). (See Corporate Genuine Progress Indicator and Box 3).
Box 3: The CAP Audit
In 1998, Mitsubishi Electric asked the organization named The Future 500 to assemble a meeting of executives, measurement experts, environmentalists, and social responsibility representatives to begin to develop a system of feedback that companies could deploy to stimulate progress on all measures — higher productivity, positive social impacts, and superior environmental performance. They called the concept a Corporate Genuine Progress Indicator, or CGPI, borrowing the phrase from Redefining Progress, an organization which had developed a national GPI as an alternative to Gross National Product as a measure of economic well-being. Those discussions led to a succession of potential models for CGPIs.
The outgrowth of the CGPI process came to be known as the Corporate Accountability Practice (CAP) audit. The CAP audit assesses the full range of a company’s triple bottom line performance, highlights opportunities, and identifies (by “red flags”) performance gaps. The audit gives a company a comprehensive 108-point inventory of its total performance across five fields: environment, community, marketplace, workplace, and corporate. For each one, it links the asset or liability to one of 18 distinct bottom-line benefits (from reduced litigation to increased sales and market share), to highlight how a company can manage its economic, social and environmental performance to gain marketplace advantage. Then, it scores the company according to its performance against criteria of a dozen major indices of corporate accountability and sustainability.
The CAP Audit:
• Specifies how a company can improve its rating among the leading indicators of corporate social and environmental accountability, including the Global Reporting Initiative (GRI), Dow Jones Sustainability Index, Domini, Calvert, Council on Economic Priorities, and others.
• Helps ensure against gaps that may leave a company open to litigation, conflicts, boycotts, or new government legislation.
• Helps maximize a company’s capacity to profit from its social and environ-mental assets.
• Provides critical data needed to prepare annual corporate environmental, social, and public reports.
include other costs associated with the activity: the higher transportation costs for overpackaged goods, higher labour costs for removing excess packaging, higher storage costs for goods that take up more space than necessary, etc. Put in other words, waste management is an activity which commences with the decision to bring some good to the factory, takes into account its storage requirements and finishes when residuals are disposed of. Measure all these costs
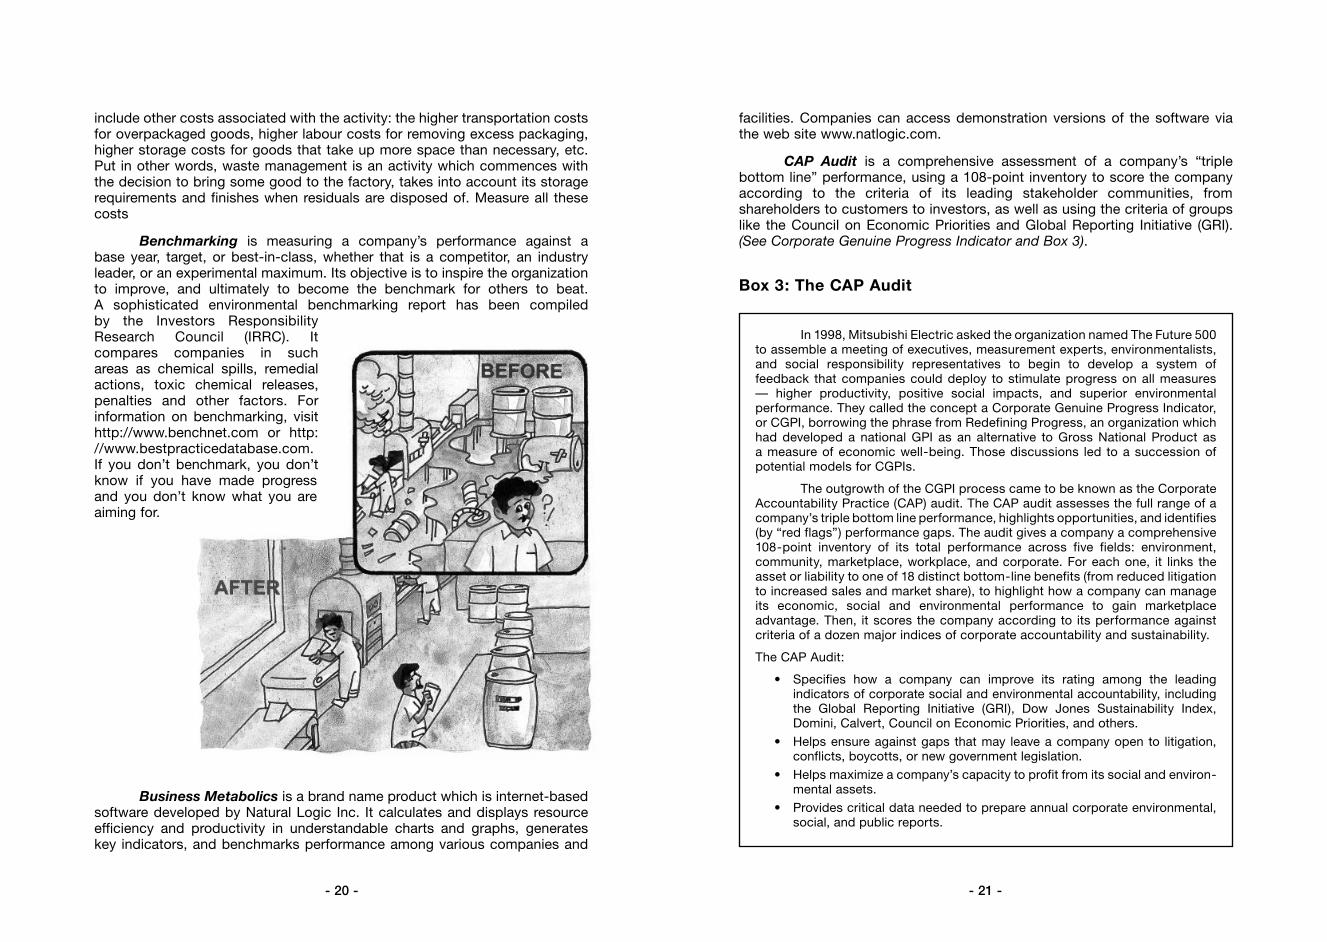
Benchmarking is measuring a company’s performance against a base year, target, or best-in-class, whether that is a competitor, an industry leader, or an experimental maximum. Its objective is to inspire the organization to improve, and ultimately to become the benchmark for others to beat. A sophisticated environmental benchmarking report has been compiled by the Investors Responsibility Research Council (IRRC). It compares companies in such areas as chemical spills, remedial actions, toxic chemical releases, penalties and other factors. For information on benchmarking, visit http://www.benchnet.com or http://www.bestpracticedatabase.com. If you don’t benchmark, you don’t know if you have made progress and you don’t know what you are aiming for.
Business Metabolics is a brand name product which is internet-based software developed by Natural Logic Inc. It calculates and displays resource efficiency and productivity in understandable charts and graphs, generates key indicators, and benchmarks performance among various companies and
- 22 - - 23 -
Digital Technology Assessment shows how a company can save money and improve performance through electronic meetings, videos, web casts, and other digital communication tools. Developed by The Future 500 and Ecostream, the assessment provides an inventory of corporate functions that could be enhanced through the use of these technologies, estimates the performance gain that could result, and provides a prioritized list of things to do.
Energy Audit is an increasingly common tool used by cost-conscious and environmentally attuned businesses. It includes such elements as an inventory of existing energy use patterns, products, and technologies; an evaluation of existing energy efficiency and energy productivity rates; identi-fication of savings opportunities; an estimate of the investment and payback for the installation of new energy technologies. For an on-line energy audit, visit http://www.energyguide.com/audit/webauditintro.asp? (This address is recommended in order to find the audit itself. However, if it is inaccessible, begin at www.energyguide.com and follow the links.)
Energy and Resources Opportunities Audit is a combination energy audit, materials audit, and CAP scan, conducted by The Future 500. In addition to a standard energy and materials audit, it assesses the energy and resource characteristics of a company’s products or processes. It considers ways in which the products or processes might be applied to enhance resource productivity by the company’s stakeholders. It provides a prioritized menu of options to harness the energy and resource savings opportunities, strategically to improve business and environmental performance.
Environmental Audit is the generic name for a check of a business’ operations. As a generic tool, there is considerable variability as to what is covered. Some do not go beyond resource inputs (such as energy, water, raw materials) and waste and pollution outputs. Other audits reach into the realms of Life Cycle Assessment. Note that “audit” and “assessment” are different concepts.
Environmental Performance Index (EPI) is used generically to encompass either a range of indices, or an aggregated index, of business’ environmental performance. Nortel, a Canadian-based telecommunications firm, has one of the best-known EPIs. The Nortel system covers 25 performance parameters in four categories: compliance, environmental releases, resource consumption, and environmental remediation. The categories are weighted for environmental impact, correlation of the measure with corporate environmental performance, the company’s control over a parameter, and financial and public risk to the company. Index scores are derived by benchmarking against a base year. For information, visit www.gemi.org.
Global Reporting Initiative (GRI) is a comprehensive corporate environmental reporting system developed by the Coalition for Environmentally Responsive Economies (CERES) in association with the Tellus Institute.
Corporate Environmental Report ScoreCard is a brand-name self-assessment tool that companies can use to assess their environmental reporting. It is based on various guidelines by international environmental organizations. The ScoreCard, which was developed by Deloitte & Touche, is presently being expanded.
Corporate Genuine Progress Indicator (CGPI) was developed by the organization, The Future 500, in association with Mitsubishi Electric and other member companies. The CGPI is now called the CAP Audit.
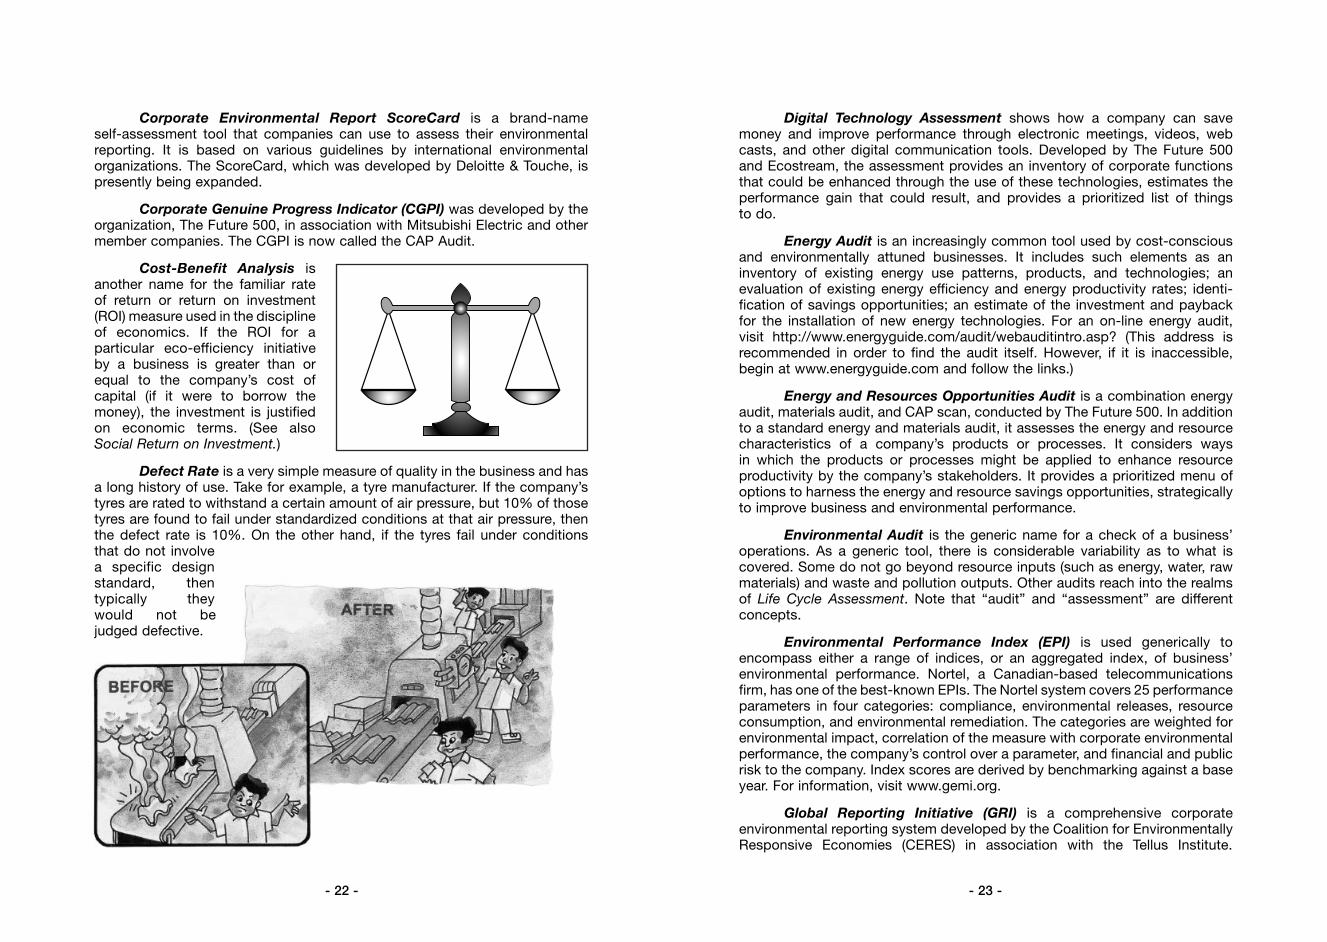
Cost-Benefit Analysis is another name for the familiar rate of return or return on investment (ROI) measure used in the discipline of economics. If the ROI for a particular eco-efficiency initiative by a business is greater than or equal to the company’s cost of capital (if it were to borrow the money), the investment is justified on economic terms. (See also Social Return on Investment.)
Defect Rate is a very simple measure of quality in the business and has a long history of use. Take for example, a tyre manufacturer. If the company’s tyres are rated to withstand a certain amount of air pressure, but 10% of those tyres are found to fail under standardized conditions at that air pressure, then the defect rate is 10%. On the other hand, if the tyres fail under conditions that do not involve a specific design standard, then typically they would not be judged defective.
- 24 - - 25 -
process that contain different mixes of environmental impacts. If one process requires extraordinary energy consumption, and another uses toxic materials, which has the more severe environmental impact? Extraordinary efforts have been made to provide a basis for ranking and prioritization, but other than converting all impacts (both positive and negative) into a monetary framework (as done in a cost-benefit analysis), there is no agreed methods of aggregation on an “apples to apples” basis.
Investment Value Added is the enhancement of stock price, and for present purposes is associated with the implementation of environmental or social programs. Investment advisors such as Innovest, for example, track the relationship between sets of eco-efficiencies, and growth in stock market valuations, for companies within selected sectors. They calculate whether, and to what extent, investments in eco-efficiency are related to improved stock performance over time.
Life Cycle Assessments/Analyses (LCAs) recognize that a product’s impacts occur throughout the whole range of its life, from before it enters the factory as raw materials, to after it leaves as a finished product, and in its ultimate dismantling, recycling and disposal. LCAs attempt to assess impacts over at least five product life stages: resource extraction, manufacturing, packaging and shipping, customer use, and disposal, reuse, or recycling. By taking account of costs and benefits through a product’s whole life cycle, from cradle to cradle, a company can seek to minimize total costs and maximize total benefits. See Box 5 and Appendix 2.
Box 5: Life Cycle Assessment
A life-cycle assessment (LCA) is an attempt to quantify and assess the environmental impacts of all the resources consumed and wastes created by a product, service or process, during its entire life, from cradle to cradle.
The undertaking of a LCA is quite a challenge. It requires that decisions be made about what materials actually comprise a product, where they come from; what impacts were imposed by their extraction, use, transportation, refinement, and application; what proportion becomes waste and what is done with it, and what proportion is successfully converted into the products made with them; how these products are made, packaged, delivered, and used; how these products are discarded; and the environmental impacts — on air, water, land, human health, and global sustainability — of all of these actions.
Because of the vast array of simplifications and assumptions that have to be made in the practice of conducting LCA, the process is fraught with difficulties. LCA’s can also be very expensive to perform, especially if they seek to be comprehensive. As Lynn Scarlett has written, ”(D)ata generation, analysis, and dissemination are costly. Some data on materials and energy use and their
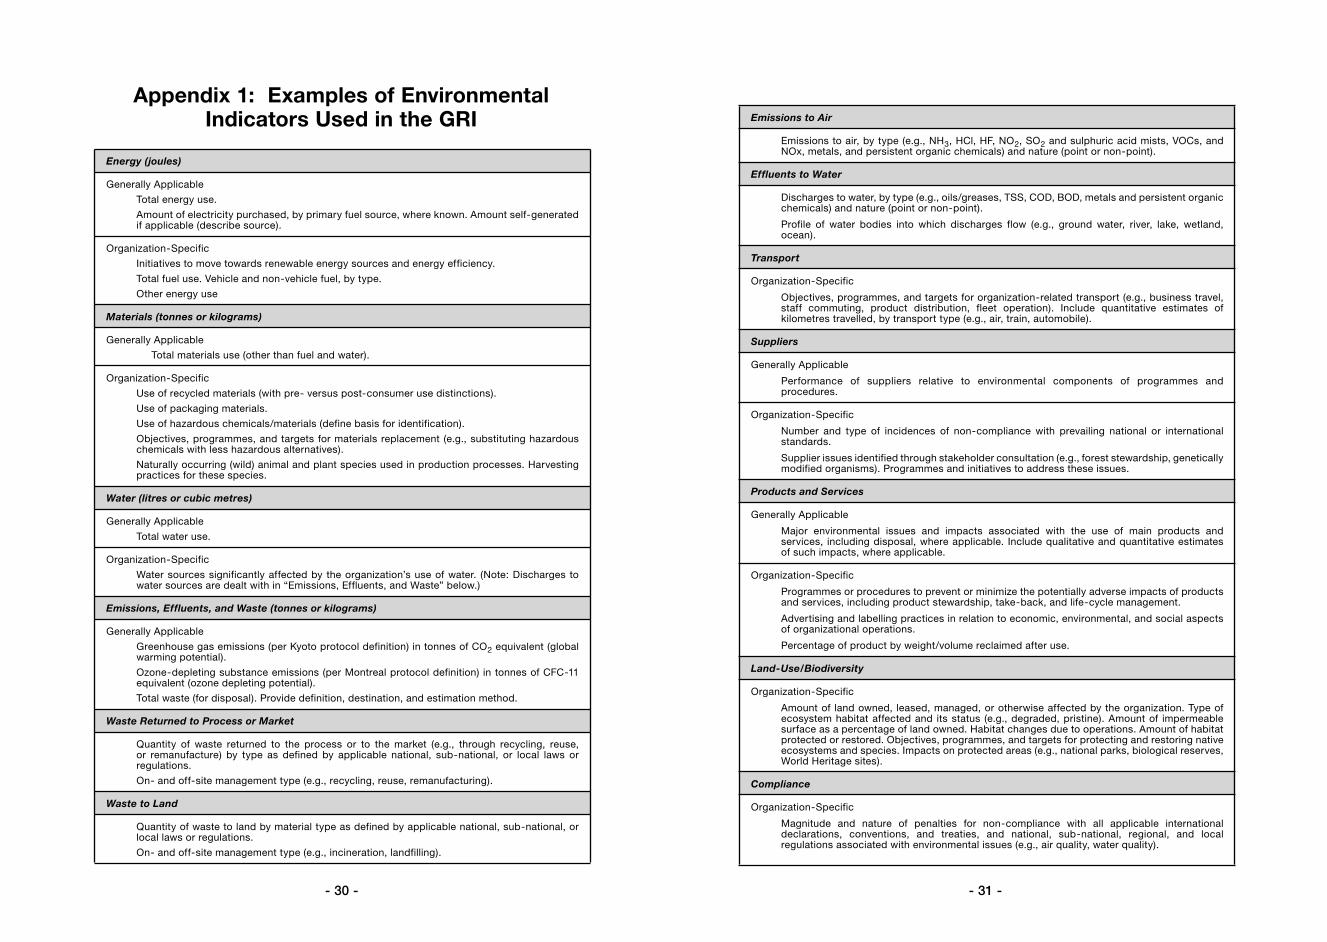
GRI specifies a standard set of measures intended to assess a company’s environmental sustainability. The GRI distinguishes between two types of performance indicators: generally applicable and organization-specific. See Box 4. To download a current copy of the GRI guidelines, visit www.globalreporting.org.
Box 4: The Global Reporting Initiative
Impact Assessment (IA) has been used since the early 1970’s as the short title for an Environmental Impact Assessment. These are comprehensive reports on projects (usually large ones such as water storages, freeways, tourist resorts). More recently, impact assessment has been used to refer to the final (or next-to-final) stage of any type of environmental analysis. Without a common numerarie, IA is an imprecise art of equating one type of environmental cost or benefit with another — a pound of toxic waste with a barrel of oil, for example. IA tries to normalize environmental impacts according to standard weights, and thereby establish a basis for comparing alternative products and
The Coalition for Environmentally Responsive Economies (CERES), in association with the Tellus Institute, has recently launched a comprehensive corporate environmental reporting system called the Global Reporting Initiative, or GRI. GRI specifies a standard set of measures intended to assess an organization’s environmental sustainability. However, the initial version of the GRI applies a narrow definition of the environment, and the economic and social aspects are not included. These aspects of sustainability are to be integrated in future versions of GRI. GRI guidelines are to be found by visiting www.globalreporting.org.
The GRI distinguishes between two types of performance indicators: generally applicable and organization-specific.
Generally Applicable IndicatorsThe indicators noted as generally applicable are relevant to all
organizations. In the interest of comparability, GRI asks all reporting companies to provide this information, regardless of sector, location, or other attributes of the organization.
Organization-Specific Indicators
Organization-specific indicators are those that, while critical to an understanding of the performance of the organizations to which they apply, may not be relevant to all organizations. These derive from attributes such as the organization’s industry sector and geographic location, and from the concerns of stakeholders. Examples of environmental indicators are listed in Appendix 1.
- 26 - - 27 -
Mass Balance Analysis follows the flow of materials through a process. It attempts to assure every unit of a material is accounted for, by balancing inputs and outputs. Through mass balance analysis, an organization can identify when toxins, for example, are “leaking” from somewhere within an industrial process. The process can be further segmented to isolate the leak.
Materials Audit is an audit of key materials (such as paper, metals, or hazardous materials) used by the business. It goes beyond a simple check on what is used. It can include an evaluation of the efficiency of existing materials use and productivity rates; identification of savings opportunities; and, an estimate of the investment and payback period.
• Design for remanufacturing means building products that are easy to take apart. In this process, cars, copiers, and computers, for example, are designed for disassembly. Their components are able to be restored or upgraded and used in a next generation of products.
• Design for recycling creates products that are easy and economical to recycle, products that can contain a high recycled content, or equipment that can use such products.
Box 6: Strategies for Better Environmental Design
concomitant environmental impacts are a prerequisite to designing products and selecting manufacturing processes or service-delivery options. But attempting to quantify all inputs and outputs, while interesting as an academic exercise, is too cumbersome to offer a useful decision making tool for private firms.”
There are three stages to an LCA: (i) establishing via an audit what materials and other resources are involved in the life of the product or service; (ii) determining what the environmental impacts are; and, (iii) what changes in design can be made to lessen the adverse impacts.
Environmental audits (energy, materials, toxins) represent the first stage of the LCA, the inventory analysis. They count the amount of energy, materials, and toxins used or generated in an industrial process. Mass balance analysis follows the flow of materials through a process. It attempts to assure that every unit of the material is accounted for, by balancing inputs and outputs. Through mass balance analysis, companies can identify when toxins, for example, are “leaking” from somewhere within an industrial process. The process can be further segmented to isolate the leak.
Impact assessment is the second stage of the LCA. It is the difficult and imprecise science-cum-art of equating one type of environmental cost or benefit with another — a pound of toxic waste with a barrel of oil, for example. Impact assessment tries to normalize environmental impacts according to standard weights, and thereby establish a basis for comparing alternative types of environmental impacts. If one process requires extraordinary energy consumption, and another uses toxic materials, which has the more severe environmental impact? The only tool available which is based on an “apples for apples” comparison is cost-benefit analysis. However, it poses its own difficulties in practice.
Design for environment (DFE) is a name for the set of approaches that can be used to improve environmental performance. DFE, the third stage of LCA, is the process of designing products and processes to minimize environmental costs at the front end, by design. Within DFE are several component strategies, each with names that are self-descriptive. See Box 6 below.
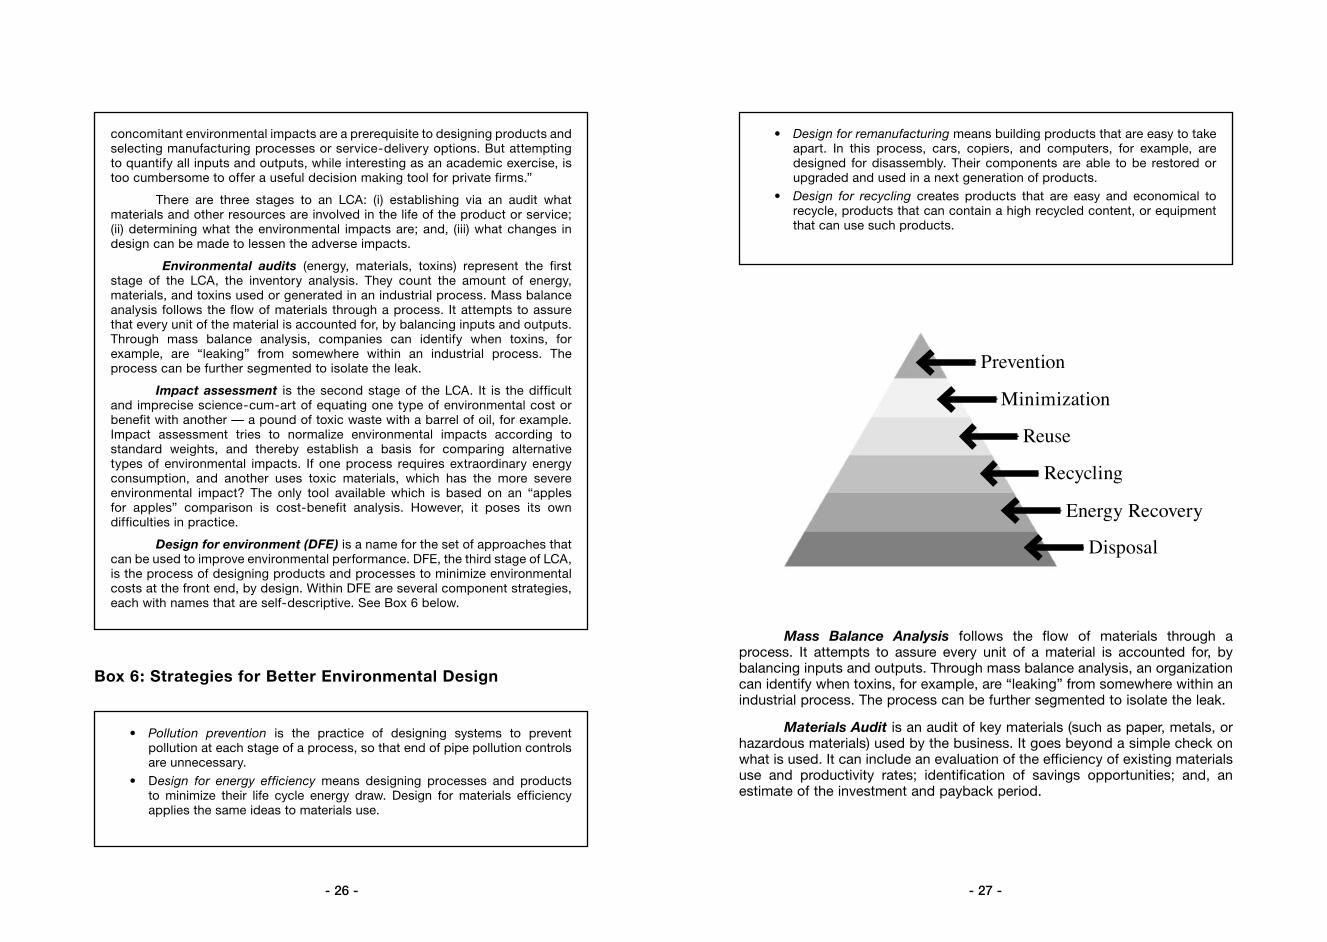
• Pollution prevention is the practice of designing systems to prevent pollution at each stage of a process, so that end of pipe pollution controls are unnecessary.
• Design for energy efficiency means designing processes and products to minimize their life cycle energy draw. Design for materials efficiency applies the same ideas to materials use.
Prevention
Minimization
Reuse
Recycling
Energy Recovery
Disposal
- 28 - - 29 -
mainly on negatives: every unit of cost, consumption, pollution, or negative health impact is “bad,” for example. But every transaction has both positive and negative impacts. Social Value Added seeks to capture both. If a company makes a new pharmaceutical product that saves 1,000 lives every year, but the product requires so much energy that energy efficiency per unit output drops 50%, then Social Value Added provides a sense of balance and perspective: energy consumption may have increased, but the health benefits of the product may justify the expenditure. If this example was subjected to a social cost-benefit analysis, all effects, positive and negative, would be converted to monetary values and via addition and subtraction a net figure arrived at.
Social Return on Investment is based on economic formula for ROI but with the explicit inclusion of all social and environmental costs and benefits (what economists call “externalies”). Outside the conventional field of economics, this measure is normally applied to public and philanthropic investments. It helps lay the foundation for enabling the proponents of these to specifically document the extent of the benefits generated by their efforts. For reports on social return on investment visit www.redf.org/about_sroi.htm.
Spend-to-Save is more akin to a popular saying rather than a measure. However, when used in a semi-formal sense it is equivalent to cost-of-capital analysis described above; if the ROI for a particular eco-efficiency investment is greater than or equal to the company’s cost of capital assuming it were to borrow the money, the investment is economically worthwhile. Spend-to-Save helps internal decision-making so that any eco-efficiency initiative with an ROI that exceeds the cost of capital is automatically approved.
Stakeholder Valuation analyzes corporate environmental, health and safety, and social performance as they impact on shareholder value. Deloitte & Touche has found that understanding the synergistic relationships of stakeholder value is a key aspect for management to consider. For a report on stakeholder valuation, visit: http://www.socialfunds.com/news/print.cgi?sfArticleld=416.
Waste Intensity is the ratio of waste generated per unit of output. Waste, the numerator, may include particular categories of waste (solid, hazardous, paper, etc.), either from a particular facility, activity, or even over a complete product life cycle. Output, the denominator, includes products and services.
Zero-Based Resource Budgeting is a planning tool that, like zero-based financial budgeting, assumes a zero base for resources at the start of a budget planning cycle. Rather than perpetuating historical patterns of resource consumption, it asks business units to justify their need for a particular quantity of resources. Zero-based budgeting is intended to help reduce or eliminate the use of resources in sub-optimal applications.
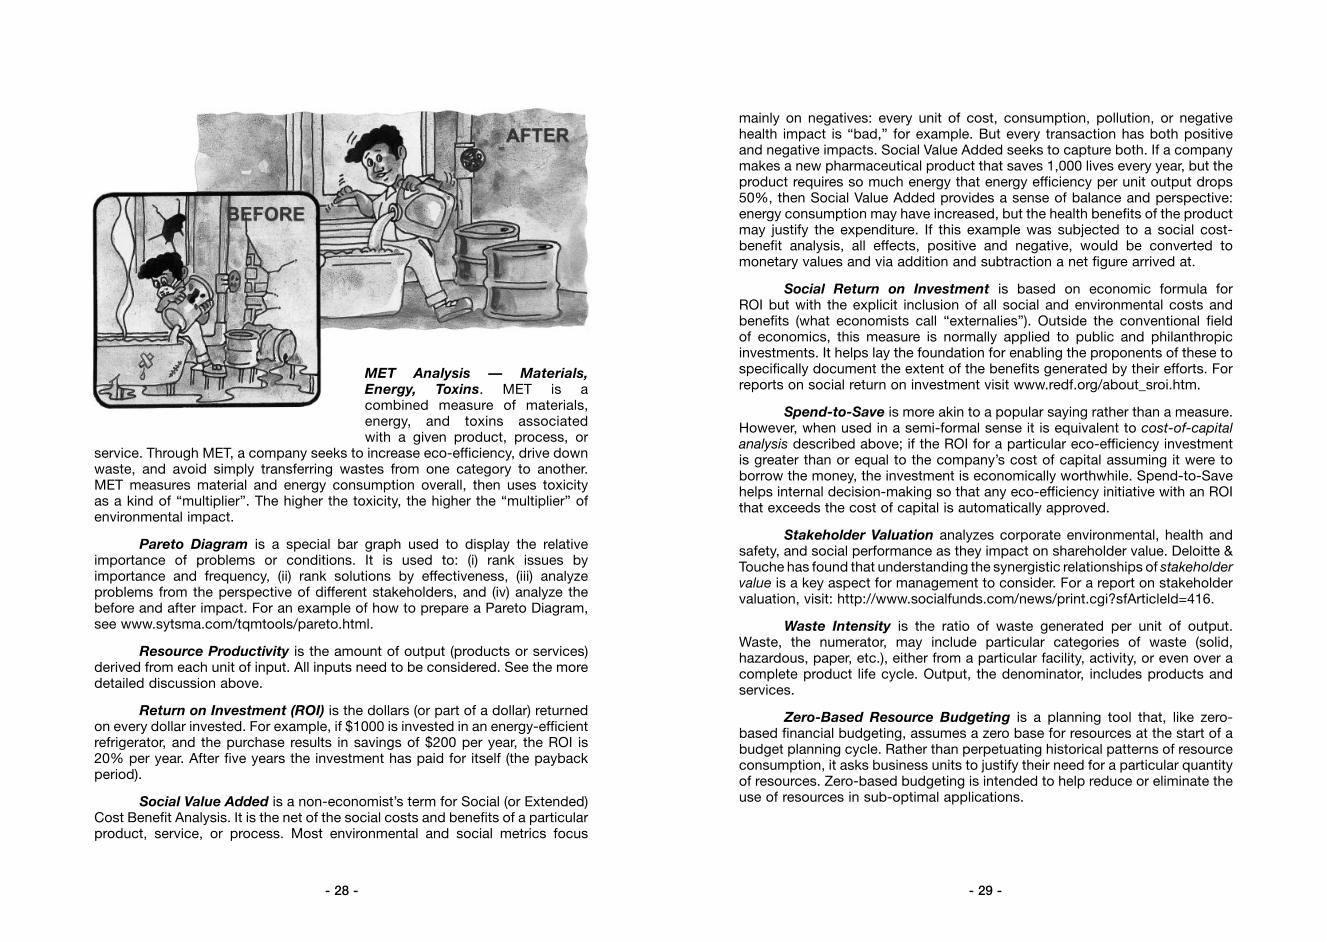
MET Analysis — Materials, Energy, Toxins. MET is a combined measure of materials, energy, and toxins associated with a given product, process, or
service. Through MET, a company seeks to increase eco-efficiency, drive down waste, and avoid simply transferring wastes from one category to another. MET measures material and energy consumption overall, then uses toxicity as a kind of “multiplier”. The higher the toxicity, the higher the “multiplier” of environmental impact.
Pareto Diagram is a special bar graph used to display the relative importance of problems or conditions. It is used to: (i) rank issues by importance and frequency, (ii) rank solutions by effectiveness, (iii) analyze problems from the perspective of different stakeholders, and (iv) analyze the before and after impact. For an example of how to prepare a Pareto Diagram, see www.sytsma.com/tqmtools/pareto.html.
Resource Productivity is the amount of output (products or services) derived from each unit of input. All inputs need to be considered. See the more detailed discussion above.
Return on Investment (ROI) is the dollars (or part of a dollar) returned on every dollar invested. For example, if $1000 is invested in an energy-efficient refrigerator, and the purchase results in savings of $200 per year, the ROI is 20% per year. After five years the investment has paid for itself (the payback period).
Social Value Added is a non-economist’s term for Social (or Extended) Cost Benefit Analysis. It is the net of the social costs and benefits of a particular product, service, or process. Most environmental and social metrics focus
- 30 - - 31 -
Emissions to Air
Emissions to air, by type (e.g., NH3, HCl, HF, NO2, SO2 and sulphuric acid mists, VOCs, and NOx, metals, and persistent organic chemicals) and nature (point or non-point).
Effluents to Water
Discharges to water, by type (e.g., oils/greases, TSS, COD, BOD, metals and persistent organic chemicals) and nature (point or non-point).
Profile of water bodies into which discharges flow (e.g., ground water, river, lake, wetland, ocean).
Transport
Organization-Specific
Objectives, programmes, and targets for organization-related transport (e.g., business travel, staff commuting, product distribution, fleet operation). Include quantitative estimates of kilometres travelled, by transport type (e.g., air, train, automobile).
Suppliers
Generally Applicable
Performance of suppliers relative to environmental components of programmes and procedures.
Organization-Specific
Number and type of incidences of non-compliance with prevailing national or international standards.
Supplier issues identified through stakeholder consultation (e.g., forest stewardship, genetically modified organisms). Programmes and initiatives to address these issues.
Products and Services
Generally Applicable
Major environmental issues and impacts associated with the use of main products and services, including disposal, where applicable. Include qualitative and quantitative estimates of such impacts, where applicable.
Organization-Specific
Programmes or procedures to prevent or minimize the potentially adverse impacts of products and services, including product stewardship, take-back, and life-cycle management.
Advertising and labelling practices in relation to economic, environmental, and social aspects of organizational operations.
Percentage of product by weight/volume reclaimed after use.
Land-Use/Biodiversity
Organization-Specific
Amount of land owned, leased, managed, or otherwise affected by the organization. Type of ecosystem habitat affected and its status (e.g., degraded, pristine). Amount of impermeable surface as a percentage of land owned. Habitat changes due to operations. Amount of habitat protected or restored. Objectives, programmes, and targets for protecting and restoring native ecosystems and species. Impacts on protected areas (e.g., national parks, biological reserves, World Heritage sites).
Compliance
Organization-Specific
Magnitude and nature of penalties for non-compliance with all applicable international declarations, conventions, and treaties, and national, sub-national, regional, and local regulations associated with environmental issues (e.g., air quality, water quality).
Appendix 1: Examples of Environmental Indicators Used in the GRI
Energy (joules)
Generally Applicable
Total energy use.
Amount of electricity purchased, by primary fuel source, where known. Amount self-generated if applicable (describe source).
Organization-Specific
Initiatives to move towards renewable energy sources and energy efficiency.
Total fuel use. Vehicle and non-vehicle fuel, by type.
Other energy use
Materials (tonnes or kilograms)
Generally Applicable
Total materials use (other than fuel and water).
Organization-Specific
Use of recycled materials (with pre- versus post-consumer use distinctions).
Use of packaging materials.
Use of hazardous chemicals/materials (define basis for identification).
Objectives, programmes, and targets for materials replacement (e.g., substituting hazardous chemicals with less hazardous alternatives).
Naturally occurring (wild) animal and plant species used in production processes. Harvesting practices for these species.
Water (litres or cubic metres)
Generally Applicable
Total water use.
Organization-Specific
Water sources significantly affected by the organization’s use of water. (Note: Discharges to water sources are dealt with in “Emissions, Effluents, and Waste” below.)
Emissions, Effluents, and Waste (tonnes or kilograms)
Generally Applicable
Greenhouse gas emissions (per Kyoto protocol definition) in tonnes of CO2 equivalent (global warming potential).
Ozone-depleting substance emissions (per Montreal protocol definition) in tonnes of CFC-11 equivalent (ozone depleting potential).
Total waste (for disposal). Provide definition, destination, and estimation method.
Waste Returned to Process or Market
Quantity of waste returned to the process or to the market (e.g., through recycling, reuse, or remanufacture) by type as defined by applicable national, sub-national, or local laws or regulations.
On- and off-site management type (e.g., recycling, reuse, remanufacturing).
Waste to Land
Quantity of waste to land by material type as defined by applicable national, sub-national, or local laws or regulations.
On- and off-site management type (e.g., incineration, landfilling).
- 32 - - 33 -
much greater level of control, not only in relation to community pressures and regulatory issues, but also in the market place. It provides the ability to make environmental improvements strategically, instead of in response to “flavor of the month” environmental pressures.
The information provided by an LCA can also assist an organization establish environmental priorities based on the objective and quantified information that LCA provides. This information can make an important contribution to the development of an organization’s Environmental Management System (EMS), in relation to determining the significance of its environmental aspects, and establishing objectives and targets.
The second is to improve the environmental performance of products and design new products with environmental attributes (Eco-Redesign). With increasing consumer awareness comes increasing consumer demand for environmentally sensitive products. The information provided by an LCA is necessary for determining ways to improve the environmental credentials of an existing product or to re-design new environmentally-sensitive products.
The third is to substantiate environmental claims (eco-labelling). As an extension to the previous point, LCA information will be crucial for substan-tiating product claims related to environmental performance, particularly in relation to eco-labelling. Eco-labelling systems are likely to be based on the comparison of LCA data for competing products with the same function.
Because LCA identifies and quantifies resource inputs and waste outputs of a production process, it provides an ideal opportunity to identify opportunities for reducing operating costs associated with resource consumption and waste management. This is its fourth purpose.
Initiatives to improve the environmental performance of a production process will include water and energy saving measures and waste minimization and resource recovery opportunities. The added benefit of this is that it saves money and improves the bottom line.
These are the most obvious reasons for undertaking LCA. Ultimately the driving force behind using LCA as an environmental decision-aiding tool will be to improve the long-term sustainability of the organization within an increasingly sophisticated market place, and to have the information to allow the organization to continually find opportunities for improvement.
What’s Involved in Undertaking LCA?
Besides time and money, the basic requirements for an LCA are a methodology, data and software to efficiently store and analyze data.
The methodology is a set of rules that specify the data to be gathered, the calculations that are to be made and guidelines on how to interpret
Appendix 2: What is Life Cycle Assessment?
Life Cycle Assessment (LCA) is the study of the environmental impacts of a product or service over its entire life cycle, from the extraction of raw materials, through to the consumption and final disposal of the product. It is an environmental decision-aiding tool that can help an organisation gauge the environmental performance of its products — from cradle to grave or cradle to cradle. The environmental impacts include the depletion of resources and the release of polluting or otherwise harmful substances and their impacts, both at the local and global scale.
Two international organizations have been instrumental in establishing LCA as a tool for environmental decision-aiding and for developing LCA methodologies. They are the Society of Environmental Toxicology and Chemistry (SETAC) and the International Standards Organization (ISO). The definitions of LCA, according to these two organizations, are provided below.
Why Use LCA?
For industry, LCA can be used for the following purposes. The first is to gain a greater understanding of the environmental impacts of products and services. Having a greater understanding of the full range of environmental impacts associated with an organization’s products and services provides a
LCA definition according to ISO 14040
“A systematic set of procedures for compiling and examining the inputs and outputs of materials and energy and the associated environmental impacts directly attributable to the functioning of a product or service system throughout its life cycle.”Source: ISO 14040: Life cycle assessment – principles and framework, 1998
LCA definition according to SETAC
“Life Cycle Assessment is a process to evaluate the environmental burdens associated with a product, process, or activity by identifying and quantifying energy and materials used and wastes released to the environment; to assess the impact of those energy and materials used and releases to the environment; and to identify and evaluate opportunities to affect environmental improvements. The assessment includes the entire life cycle of the product, process or activity, encompassing, extracting and processing raw materials; manufacturing, transpor-tation and distribution; use, re-use, maintenance; recycling, and final disposal”.Source: Guidelines for Life-Cycle Assessment: A ‘Code of Practice’, SETAC, Brussels, 1993
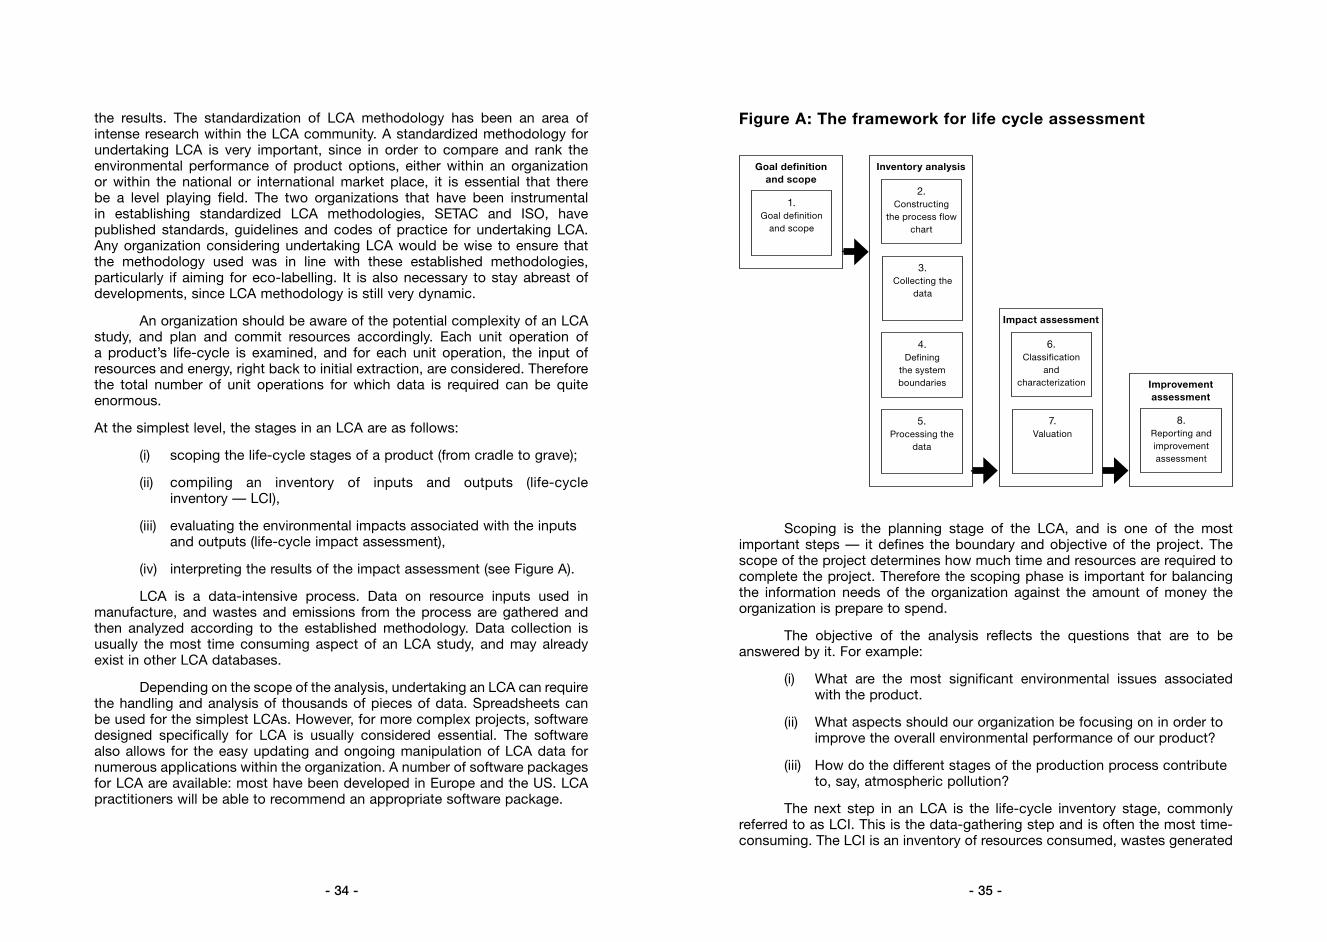
- 34 - - 35 -
Figure A: The framework for life cycle assessment
Scoping is the planning stage of the LCA, and is one of the most important steps — it defines the boundary and objective of the project. The scope of the project determines how much time and resources are required to complete the project. Therefore the scoping phase is important for balancing the information needs of the organization against the amount of money the organization is prepare to spend.
The objective of the analysis reflects the questions that are to be answered by it. For example:
(i) What are the most significant environmental issues associated with the product.
(ii) What aspects should our organization be focusing on in order to improve the overall environmental performance of our product?
(iii) How do the different stages of the production process contribute to, say, atmospheric pollution?
The next step in an LCA is the life-cycle inventory stage, commonly referred to as LCI. This is the data-gathering step and is often the most time-consuming. The LCI is an inventory of resources consumed, wastes generated
Goal definition and scope
1.Goal definition
and scope
Inventory analysis
2.Constructing
the process flow chart
3.Collecting the
data
5.Processing the
data
4.Defining
the system boundaries
Impact assessment
6.Classification
and characterization
7.Valuation
Improvement assessment
8.Reporting and improvement assessment
the results. The standardization of LCA methodology has been an area of intense research within the LCA community. A standardized methodology for undertaking LCA is very important, since in order to compare and rank the environmental performance of product options, either within an organization or within the national or international market place, it is essential that there be a level playing field. The two organizations that have been instrumental in establishing standardized LCA methodologies, SETAC and ISO, have published standards, guidelines and codes of practice for undertaking LCA. Any organization considering undertaking LCA would be wise to ensure that the methodology used was in line with these established methodologies, particularly if aiming for eco-labelling. It is also necessary to stay abreast of developments, since LCA methodology is still very dynamic.
An organization should be aware of the potential complexity of an LCA study, and plan and commit resources accordingly. Each unit operation of a product’s life-cycle is examined, and for each unit operation, the input of resources and energy, right back to initial extraction, are considered. Therefore the total number of unit operations for which data is required can be quite enormous.
At the simplest level, the stages in an LCA are as follows:
(i) scoping the life-cycle stages of a product (from cradle to grave);
(ii) compiling an inventory of inputs and outputs (life-cycle inventory — LCI),
(iii) evaluating the environmental impacts associated with the inputs and outputs (life-cycle impact assessment),
(iv) interpreting the results of the impact assessment (see Figure A).
LCA is a data-intensive process. Data on resource inputs used in manufacture, and wastes and emissions from the process are gathered and then analyzed according to the established methodology. Data collection is usually the most time consuming aspect of an LCA study, and may already exist in other LCA databases.
Depending on the scope of the analysis, undertaking an LCA can require the handling and analysis of thousands of pieces of data. Spreadsheets can be used for the simplest LCAs. However, for more complex projects, software designed specifically for LCA is usually considered essential. The software also allows for the easy updating and ongoing manipulation of LCA data for numerous applications within the organization. A number of software packages for LCA are available: most have been developed in Europe and the US. LCA practitioners will be able to recommend an appropriate software package.
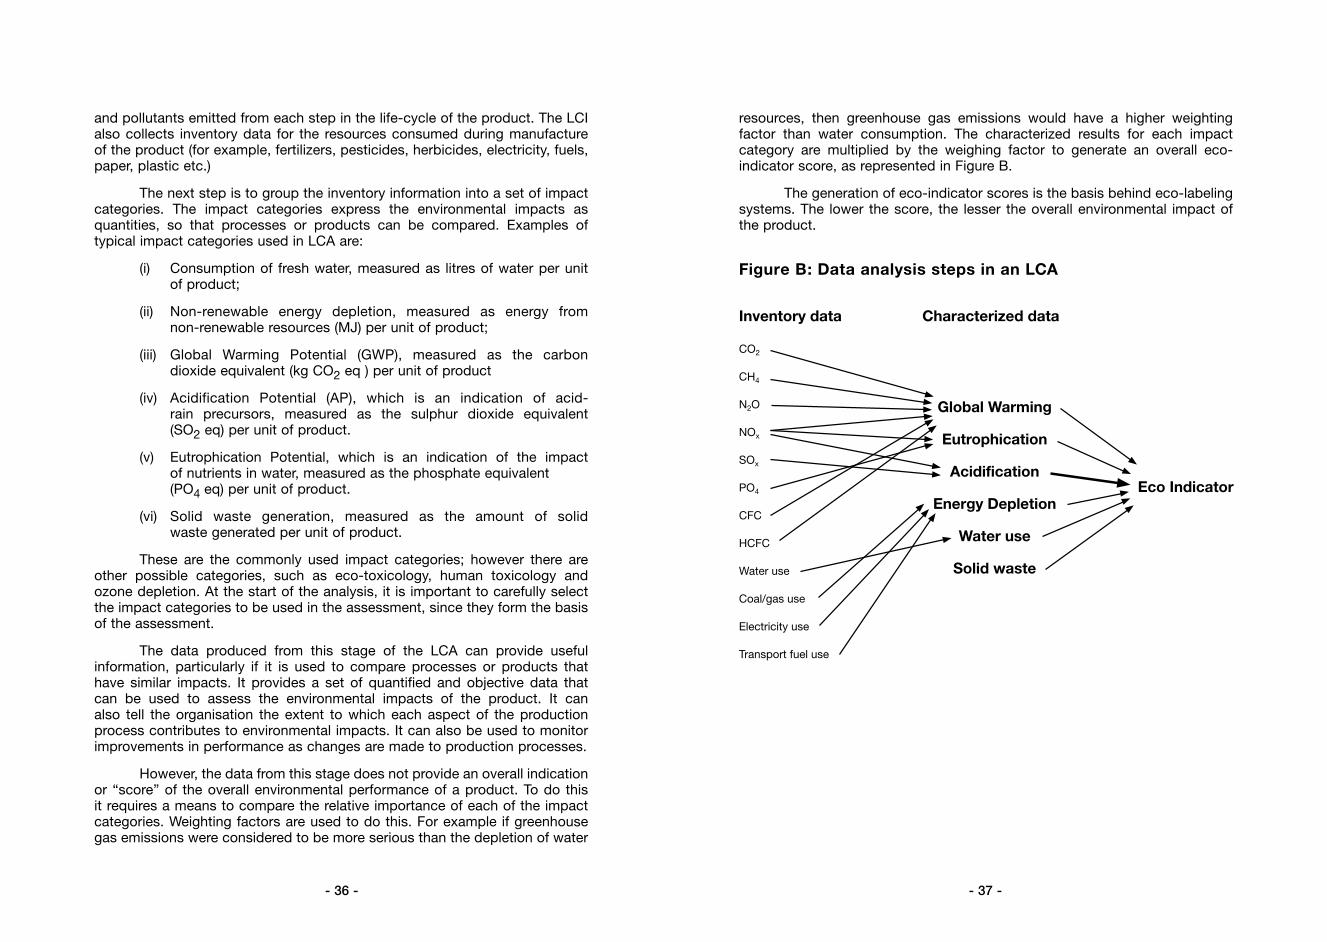
- 36 - - 37 -
resources, then greenhouse gas emissions would have a higher weighting factor than water consumption. The characterized results for each impact category are multiplied by the weighing factor to generate an overall eco-indicator score, as represented in Figure B.
The generation of eco-indicator scores is the basis behind eco-labeling systems. The lower the score, the lesser the overall environmental impact of the product.
Figure B: Data analysis steps in an LCA
Inventory data Characterized data
CO2
CH4
N2O
NOx
SOx
PO4
CFC
HCFC
Water use
Coal/gas use
Electricity use
Transport fuel use
Global Warming
Eutrophication
Acidification
Energy Depletion
Water use
Solid waste
Eco Indicator
and pollutants emitted from each step in the life-cycle of the product. The LCI also collects inventory data for the resources consumed during manufacture of the product (for example, fertilizers, pesticides, herbicides, electricity, fuels, paper, plastic etc.)
The next step is to group the inventory information into a set of impact categories. The impact categories express the environmental impacts as quantities, so that processes or products can be compared. Examples of typical impact categories used in LCA are:
(i) Consumption of fresh water, measured as litres of water per unit of product;
(ii) Non-renewable energy depletion, measured as energy from non-renewable resources (MJ) per unit of product;
(iii) Global Warming Potential (GWP), measured as the carbon dioxide equivalent (kg CO2 eq ) per unit of product
(iv) Acidification Potential (AP), which is an indication of acid- rain precursors, measured as the sulphur dioxide equivalent (SO2 eq) per unit of product.
(v) Eutrophication Potential, which is an indication of the impact of nutrients in water, measured as the phosphate equivalent (PO4 eq) per unit of product.
(vi) Solid waste generation, measured as the amount of solid waste generated per unit of product.
These are the commonly used impact categories; however there are other possible categories, such as eco-toxicology, human toxicology and ozone depletion. At the start of the analysis, it is important to carefully select the impact categories to be used in the assessment, since they form the basis of the assessment.
The data produced from this stage of the LCA can provide useful information, particularly if it is used to compare processes or products that have similar impacts. It provides a set of quantified and objective data that can be used to assess the environmental impacts of the product. It can also tell the organisation the extent to which each aspect of the production process contributes to environmental impacts. It can also be used to monitor improvements in performance as changes are made to production processes.
However, the data from this stage does not provide an overall indication or “score” of the overall environmental performance of a product. To do this it requires a means to compare the relative importance of each of the impact categories. Weighting factors are used to do this. For example if greenhouse gas emissions were considered to be more serious than the depletion of water
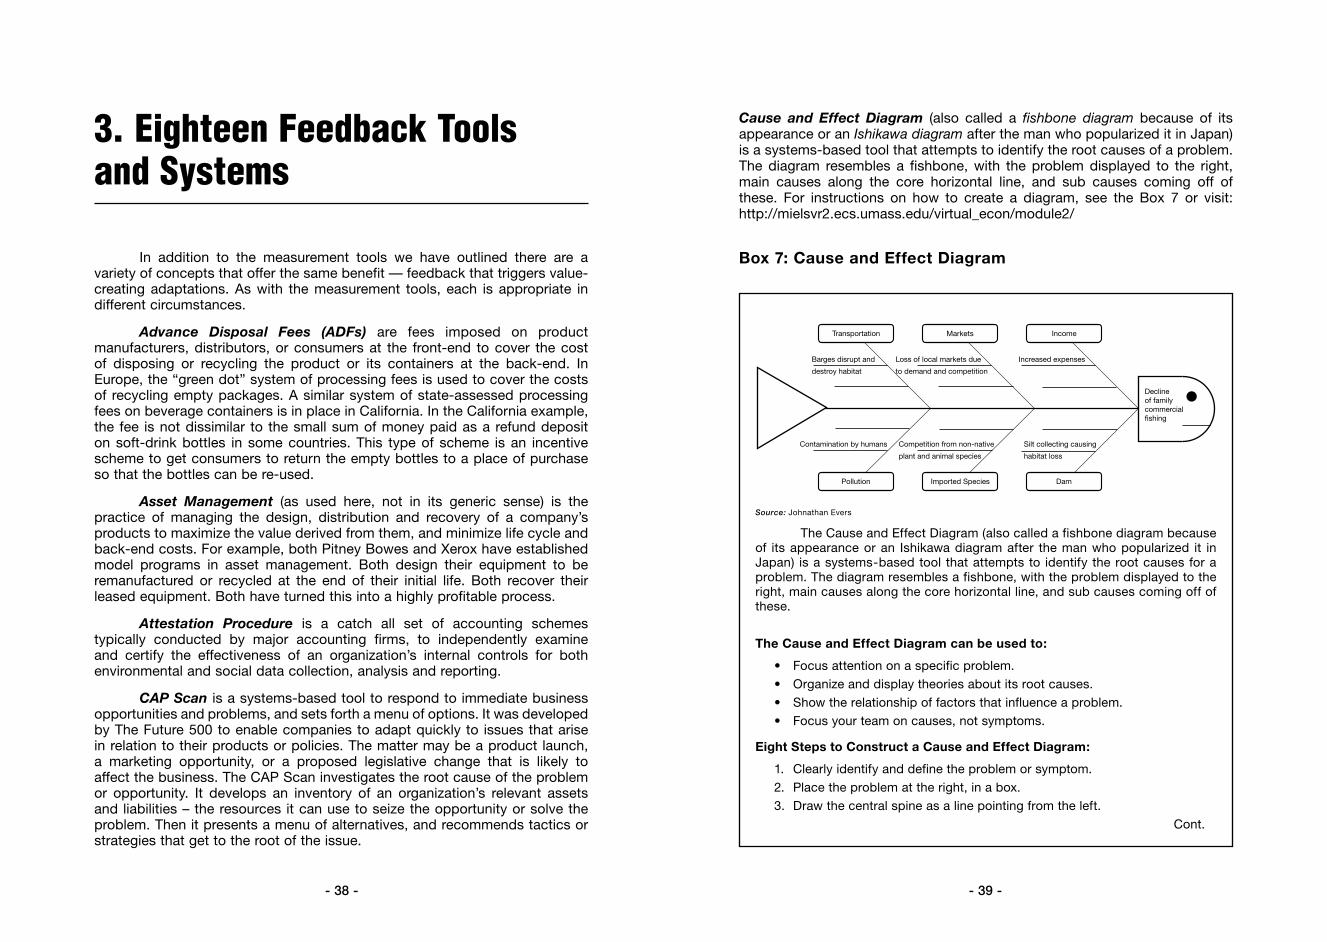
- 38 - - 39 -
Cause and Effect Diagram (also called a fishbone diagram because of its appearance or an Ishikawa diagram after the man who popularized it in Japan) is a systems-based tool that attempts to identify the root causes of a problem. The diagram resembles a fishbone, with the problem displayed to the right, main causes along the core horizontal line, and sub causes coming off of these. For instructions on how to create a diagram, see the Box 7 or visit: http://mielsvr2.ecs.umass.edu/virtual_econ/module2/
Box 7: Cause and Effect Diagram
Source: Johnathan Evers
The Cause and Effect Diagram (also called a fishbone diagram because of its appearance or an Ishikawa diagram after the man who popularized it in Japan) is a systems-based tool that attempts to identify the root causes for a problem. The diagram resembles a fishbone, with the problem displayed to the right, main causes along the core horizontal line, and sub causes coming off of these.
The Cause and Effect Diagram can be used to:
• Focus attention on a specific problem.
• Organize and display theories about its root causes.
• Show the relationship of factors that influence a problem.
• Focus your team on causes, not symptoms.
Eight Steps to Construct a Cause and Effect Diagram:
1. Clearly identify and define the problem or symptom.
2. Place the problem at the right, in a box.
3. Draw the central spine as a line pointing from the left.
Loss of local markets due
to demand and competition
Barges disrupt and
destroy habitat
Increased expenses
Contamination by humans Competition from non-native
plant and animal species
Silt collecting causing
habitat loss
Declineof familycommercialfishing
Transportation Markets Income
Pollution Imported Species Dam
Cont.
3. Eighteen Feedback Tools and Systems
In addition to the measurement tools we have outlined there are a variety of concepts that offer the same benefit — feedback that triggers value-creating adaptations. As with the measurement tools, each is appropriate in different circumstances.
Advance Disposal Fees (ADFs) are fees imposed on product manufacturers, distributors, or consumers at the front-end to cover the cost of disposing or recycling the product or its containers at the back-end. In Europe, the “green dot” system of processing fees is used to cover the costs of recycling empty packages. A similar system of state-assessed processing fees on beverage containers is in place in California. In the California example, the fee is not dissimilar to the small sum of money paid as a refund deposit on soft-drink bottles in some countries. This type of scheme is an incentive scheme to get consumers to return the empty bottles to a place of purchase so that the bottles can be re-used.
Asset Management (as used here, not in its generic sense) is the practice of managing the design, distribution and recovery of a company’s products to maximize the value derived from them, and minimize life cycle and back-end costs. For example, both Pitney Bowes and Xerox have established model programs in asset management. Both design their equipment to be remanufactured or recycled at the end of their initial life. Both recover their leased equipment. Both have turned this into a highly profitable process.
Attestation Procedure is a catch all set of accounting schemes typically conducted by major accounting firms, to independently examine and certify the effectiveness of an organization’s internal controls for both environmental and social data collection, analysis and reporting.
CAP Scan is a systems-based tool to respond to immediate business opportunities and problems, and sets forth a menu of options. It was developed by The Future 500 to enable companies to adapt quickly to issues that arise in relation to their products or policies. The matter may be a product launch, a marketing opportunity, or a proposed legislative change that is likely to affect the business. The CAP Scan investigates the root cause of the problem or opportunity. It develops an inventory of an organization’s relevant assets and liabilities – the resources it can use to seize the opportunity or solve the problem. Then it presents a menu of alternatives, and recommends tactics or strategies that get to the root of the issue.
- 40 - - 41 -
has adequately implemented the standardized environmental management system and methods of the International Organization for Standardization. Scientific Certification Systems (SCS) provides Green Cross certification of corporate environmental claims. If a company claims to be achieving a specified environmental result — like pesticide-free produce, for example — SCS will conduct tests to certify the claim. The Forest Stewardship Council (FSC) provides standards for certifying the sustainability of forestry practices. The Marine Stewardship Council (MSC) certifies fisheries. Green Globe 21 certifies ecotourism products. SA 8000 is a certification program of the Council on Economic Priorities (CEP), intended to assess a company’s social and labour practices. In addition to these private sector initiatives, a variety of green labels have emerged, most sponsored by government agencies, that indicate certification of various environmental characteristics of products. For information on ISO 14000, visit www.iso.ch./iso/en/ISOOnline.openerpage. For information on SA 8000, visit www.cepaa.org.
Deposit/Refund Systems are a specific type of take-back system, in which a consumer is charged a deposit on receipt of the product, and receives a refund of the deposit when the used product or its container is returned to the store or a designated location. Deposit/refund systems are most common with beverage containers, but are also used to provide an incentive for the return of other products which may be harmful or wasteful if otherwise discarded, from toxic chemicals, to used motor oil, to appliances.
Certification is a process for gaining third party confirmation that an organization or its products are meeting set criteria. The criteria can relate to processes or to outcomes (for example, the quality of a product or service). Specific environmental and, increasingly, triple bottom line certification (sometimes called accreditation programs) have been developed in recent years. Green labeling, where a product or process which meets certain criteria is identified by a logo, is covered under the concept of certification. Many companies provide ISO 14000 certification to confirm that a company
4. Brainstorm 2-6 “major categories” of possible causes. They might be:
• Methods, Machines, and Materials
• People, Places, and Procedures
• People, Policies, and Surroundings
• Suppliers, System, and Skills
5. Place each major category on the diagram and connect it to the central spine by a line at an angle of about 70 degrees from the horizontal.
6. For each major category ask, “Why does this condition exist?”
7. Add to each branch until the fishbone is complete.
8. Identify the likely, actionable root cause(s).
Remember to:• State causes, not solutions.
• Take note of causes that appear repeatedly.
• Review each major cause category. Circle the most likely causes on the diagram.
• Test the most likely cause and verify with data.
Source: Mechanical and Industrial Engineering, University of Massachusetts, 1999
- 42 - - 43 -
Processing Fees are similar to ADFs but potentially more compre-hensive in the range of costs they cover. They are fees imposed on product manufacturers or distributors at the front-end to cover the cost of recovering, discarding, or recycling products at the back-end.
Stakeholder Feedback and Adaptation keeps an organization in close touch with its key stakeholders — employees, customers, communities, media and others — and in touch with any changing opinions, trends, and attitudes toward the organization. It identifies threats and opportunities and provides a basis for product and marketing changes.
Sustainability Assessment Technique (SAT) can take any plan or decision, from a regional development plan, to a product or process design, to a single decision, and evaluate the expected outcomes against a range of economic, social and environmental criteria. Developed by WSP, the tool uses an extensive database of best current thinking and practice as a basis to provide an easy-to-use, graphical assessment that compares the planned outcomes with the best potential outcomes across the whole range of key business issues. The tool allows an easily understood evaluation of the relative strength and/or weakness of decisions and points the way to improved performance.
Take-Back Systems are systems in which the retailer, distributor, or manufacturer of a product takes the product back after its useful life. Take-back systems are relatively common for certain types of equipment, such as copiers and postage meters; for certain types of chemicals; and for cans and bottles through container recycling or deposit systems.
Verification Systems provide for the independent verification of corporate policies, claims, or supplier specifications regarding an increasing array of social and environmental performance standards. These may include verification of sustainably harvested wood, fair labor practices, carbon offset measurement, and many others. Verification is typically conducted by assessment or accounting firms such as Deloitte and Touche or Det Norske Veritas.
Environmental Product Design Map is a brand-name tool deployed by the engineering and environmental consulting firm WSP. It facilitates the product planning and design process by generating a simple and cost-effective life cycle analysis of product content and materials selection. Incorporating a legal risk analysis, the map generated by the tool conforms to new European requirements relating to Integrated Product Policy regulations, and delivers a sound basis to begin to undertake materials and process substitutions to reduce the environmental impacts of products in the design, prototype, manufacture, use, and disposition stages of a wide range of products.
Forces and Trends Assessment is a concept developed by the environmental consulting firm ERM. It takes an “outside-in” approach to reviewing the timing and magnitude of the impact on a particular corporation of global, social, economic, and environmental forces and trends. The approach begins with a review of the forces and trends most likely to have a significant or short-term impact on an organisation, builds organisation-specific scenarios which could credibly materialize as a result of the forces and trends identified, then determines appropriate actions for the organisation to better anticipate the scenarios in a way that improves overall corporate performance.
Greenhouse Gas Validation and Verification Protocols have been developed by firms such as Det Norske Veritas, to validate complex greenhouse gas emissions reduction projects. There are numerous schemes of this kind in operation, that help to verify actual emissions reductions for carbon trading markets.
Ishikawa Diagrams (See Cause and Effect Diagrams)
ISO 14000 is a standardized environmental management system that includes written procedures, instructions, forms or records to standardize behavior and make planning and administration more predictable and controllable, and help to clarify who is responsible for doing what, when, how, when, why and where. See the discussion of environmental management systems, as well as the discussion of certification. For further information visit www.iso.ch./iso/en/ISOOnline.openerpage — See Cause and Effect Diagrams
Just in Time Inventory Management (JIT) seeks to minimize the inventory of raw materials and parts by tightly coordinating the action of members of a company’s supply chain. Under JIT systems, companies institute a Kanban or “pull” system of production and materials control, where inventories are delivered as close as possible to the time they are needed. This significantly reduces both the cost and waste of inventory. It requires enhanced communication and coordination among suppliers and users, often including direct communication between shop floor and an offsite supplier. JIT is not possible without reliable delivery and consistent quality. For further information, visit http://sol.brunel.ac.uk/~jarvis/bola/jit/jit.html
- 44 - - 45 -
standards can be applied to any organization, large or small, whatever its product or service, in any sector of activity (business, governmental, or not-for-profit). It is a management system because it includes written procedures, instructions, forms or records to standardize behavior and make planning and administration more predictable and controllable, and help to clarify who is responsible for doing what, when, how, when, why and where.
The ISO was formed in 1947 to develop global technical standards for engineering and industrial parts and processes. The vast majority of ISO standards are highly specific technical specifications or other precise criteria to ensure that materials, products, processes and services are fit for their purpose. The ISO sets standards for such seemingly humble items as bolts, nuts, screws, pins and rivets so that engineers and industries can make reliable designs and products. Of its more than 11,400 technical standards, about 350 are for the monitoring of such aspects as the quality of air, water and soil.
The ISO established the ISO 14000 standard following its successful ISO 9000 series of quality management system standardizations. ISO 9000 is focused on quality management — what the organization does to ensure that its products conform to the customer’s requirements. ISO 14000 is concerned with environmental management — what the organization does to minimize its harmful effects on the environment. Just as ISO 9000 does not signify product quality, ISO 14000 does not signify a “green” or “environmentally friendly” product. Both ISO 9000 and ISO 14000 focus on process, not performance, at least not directly. They specify how an organization is to manage processes influencing quality (ISO 9000) or the environment (ISO 14000). They do not say the organizations must achieve specific benchmarks of quality or environmental performance. Actual performance expectations are to be functions of customer desire in the case of ISO 9000, and community desire or mandate in that of ISO 14000. Critics of the systems like to say that a company can pollute all it wants, so long as it manages and measures the process according to ISO specifications. Advocates, however, say that it provides assurance that a company is well run and that programs are in place that lead to continuous improvements in performance.
ISO 14000 grew out of sustainable development discussions at the United Nations Conference on Environment and Development, in Rio de Janeiro, in 1992. In 1993, the ISO launched a more strategic approach, aimed at developing environmental management system standards that could be implemented by any type of organisation. It set up a new technical committee, ISO/TC 207 Environmental management, to establish the ISO 14000 standard. Today, delegations from 55 countries are chosen by the national standards institute to reset a consensus on issues being addressed by the committee. Box 8 outlines the range of ISO14000 sub-categories.
4. Three Environmental Management Systems
Green Productivity initiatives, including both measurement and implementation, are often implemented in the context of a corporate environmental management system (EMS) that seeks to embed environmental considerations deep within the organization, so that they are not just an add on (end-of-pipe) or public relations tactical step, but an integral element of the business and a front-end strategy.
EMS is a management tool enabling an organization of any size or type to manage the impact on the environment of its activities, products or services. It provides a structured approach to setting, achieving, and confirming progress toward environmental objectives and targets.
One of the objectives of the tool is to help integrate environmental goals into broad business practices. Rather than seeking to simply comply with legal requirements, an EMS often aims at continuous improvement in environmental performance. It seeks to draw the whole organization into the process of environmental gain.
An EMS is explicitly focused on a company’s environmental objectives. This differs from GP, which aims to improve both productivity and environmental performance. From this perspective, environmental management is a subsystem of a company’s overall management system. By focusing on GP, an organization’s EMS can support its overall management system, and lead to productivity improvements as an offshoot of environmental gain.
EMS’s do not in and of themselves set standards of environmental performance. Instead, they provide a framework within which a company can set its own standards, whether that means complying with national laws, going beyond compliance, or becoming a proponent and example of sustainable development.
Basic EMS Structures
The first and best-known generic EMS was ISO 14000, established in 1996 by the International Organization for Standardization (ISO). ISO 14000 is the environmental equivalent of the same organization’s earlier system for quality management, ISO 9000. It is generic because, in theory, the same
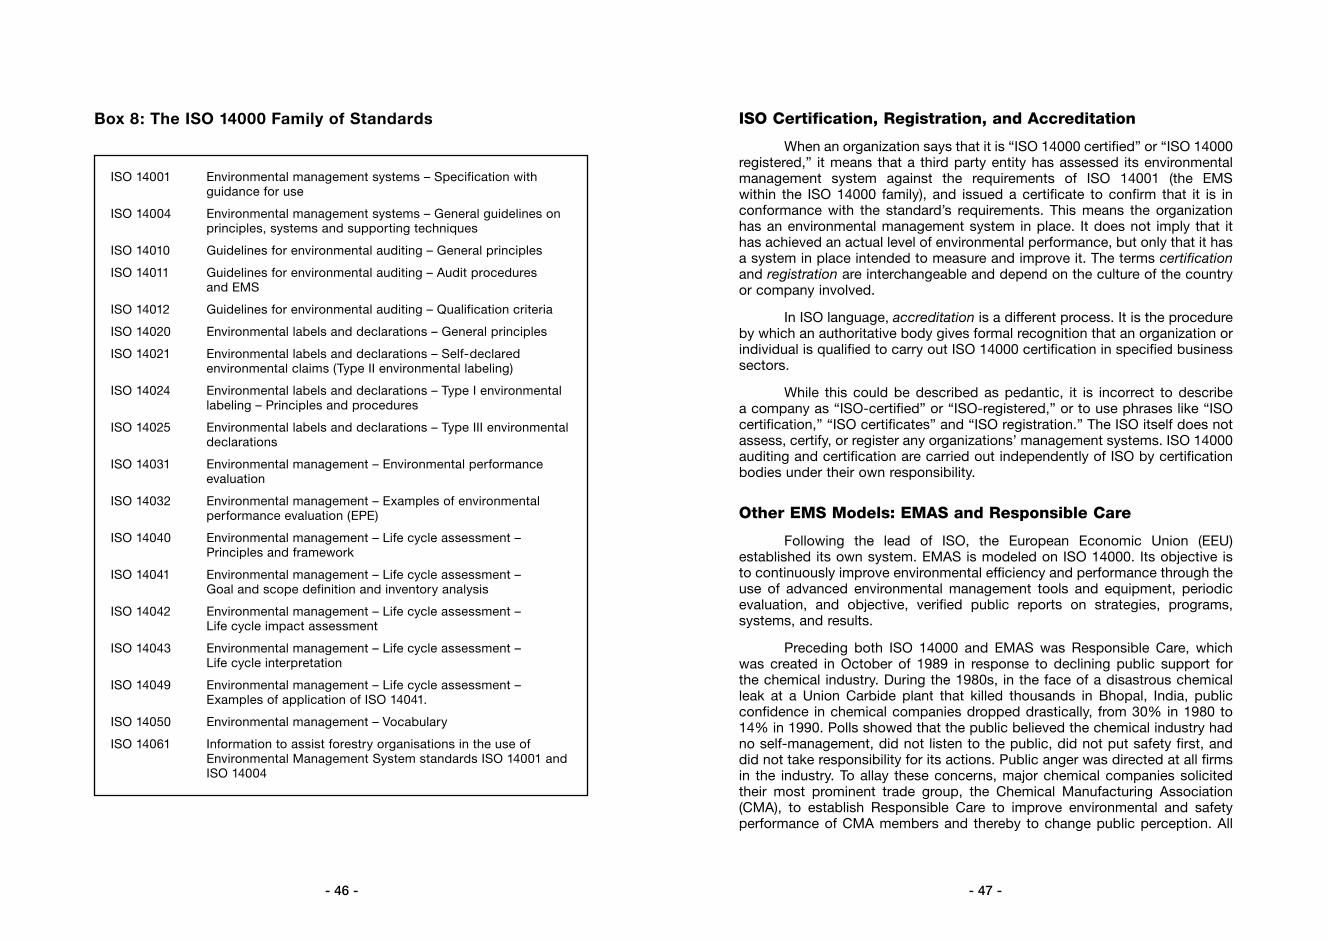
- 46 - - 47 -
ISO Certification, Registration, and Accreditation
When an organization says that it is “ISO 14000 certified” or “ISO 14000 registered,” it means that a third party entity has assessed its environmental management system against the requirements of ISO 14001 (the EMS within the ISO 14000 family), and issued a certificate to confirm that it is in conformance with the standard’s requirements. This means the organization has an environmental management system in place. It does not imply that it has achieved an actual level of environmental performance, but only that it has a system in place intended to measure and improve it. The terms certification and registration are interchangeable and depend on the culture of the country or company involved.
In ISO language, accreditation is a different process. It is the procedure by which an authoritative body gives formal recognition that an organization or individual is qualified to carry out ISO 14000 certification in specified business sectors.
While this could be described as pedantic, it is incorrect to describe a company as “ISO-certified” or “ISO-registered,” or to use phrases like “ISO certification,” “ISO certificates” and “ISO registration.” The ISO itself does not assess, certify, or register any organizations’ management systems. ISO 14000 auditing and certification are carried out independently of ISO by certification bodies under their own responsibility.
Other EMS Models: EMAS and Responsible Care
Following the lead of ISO, the European Economic Union (EEU) established its own system. EMAS is modeled on ISO 14000. Its objective is to continuously improve environmental efficiency and performance through the use of advanced environmental management tools and equipment, periodic evaluation, and objective, verified public reports on strategies, programs, systems, and results.
Preceding both ISO 14000 and EMAS was Responsible Care, which was created in October of 1989 in response to declining public support for the chemical industry. During the 1980s, in the face of a disastrous chemical leak at a Union Carbide plant that killed thousands in Bhopal, India, public confidence in chemical companies dropped drastically, from 30% in 1980 to 14% in 1990. Polls showed that the public believed the chemical industry had no self-management, did not listen to the public, did not put safety first, and did not take responsibility for its actions. Public anger was directed at all firms in the industry. To allay these concerns, major chemical companies solicited their most prominent trade group, the Chemical Manufacturing Association (CMA), to establish Responsible Care to improve environmental and safety performance of CMA members and thereby to change public perception. All
Box 8: The ISO 14000 Family of Standards
ISO 14001 Environmental management systems – Specification with guidance for use
ISO 14004 Environmental management systems – General guidelines on principles, systems and supporting techniques
ISO 14010 Guidelines for environmental auditing – General principles
ISO 14011 Guidelines for environmental auditing – Audit procedures and EMS
ISO 14012 Guidelines for environmental auditing – Qualification criteria
ISO 14020 Environmental labels and declarations – General principles
ISO 14021 Environmental labels and declarations – Self-declared environmental claims (Type II environmental labeling)
ISO 14024 Environmental labels and declarations – Type I environmental labeling – Principles and procedures
ISO 14025 Environmental labels and declarations – Type III environmental declarations
ISO 14031 Environmental management – Environmental performance evaluation
ISO 14032 Environmental management – Examples of environmental performance evaluation (EPE)
ISO 14040 Environmental management – Life cycle assessment – Principles and framework
ISO 14041 Environmental management – Life cycle assessment – Goal and scope definition and inventory analysis
ISO 14042 Environmental management – Life cycle assessment – Life cycle impact assessment
ISO 14043 Environmental management – Life cycle assessment – Life cycle interpretation
ISO 14049 Environmental management – Life cycle assessment – Examples of application of ISO 14041.
ISO 14050 Environmental management – Vocabulary
ISO 14061 Information to assist forestry organisations in the use of Environmental Management System standards ISO 14001 and ISO 14004
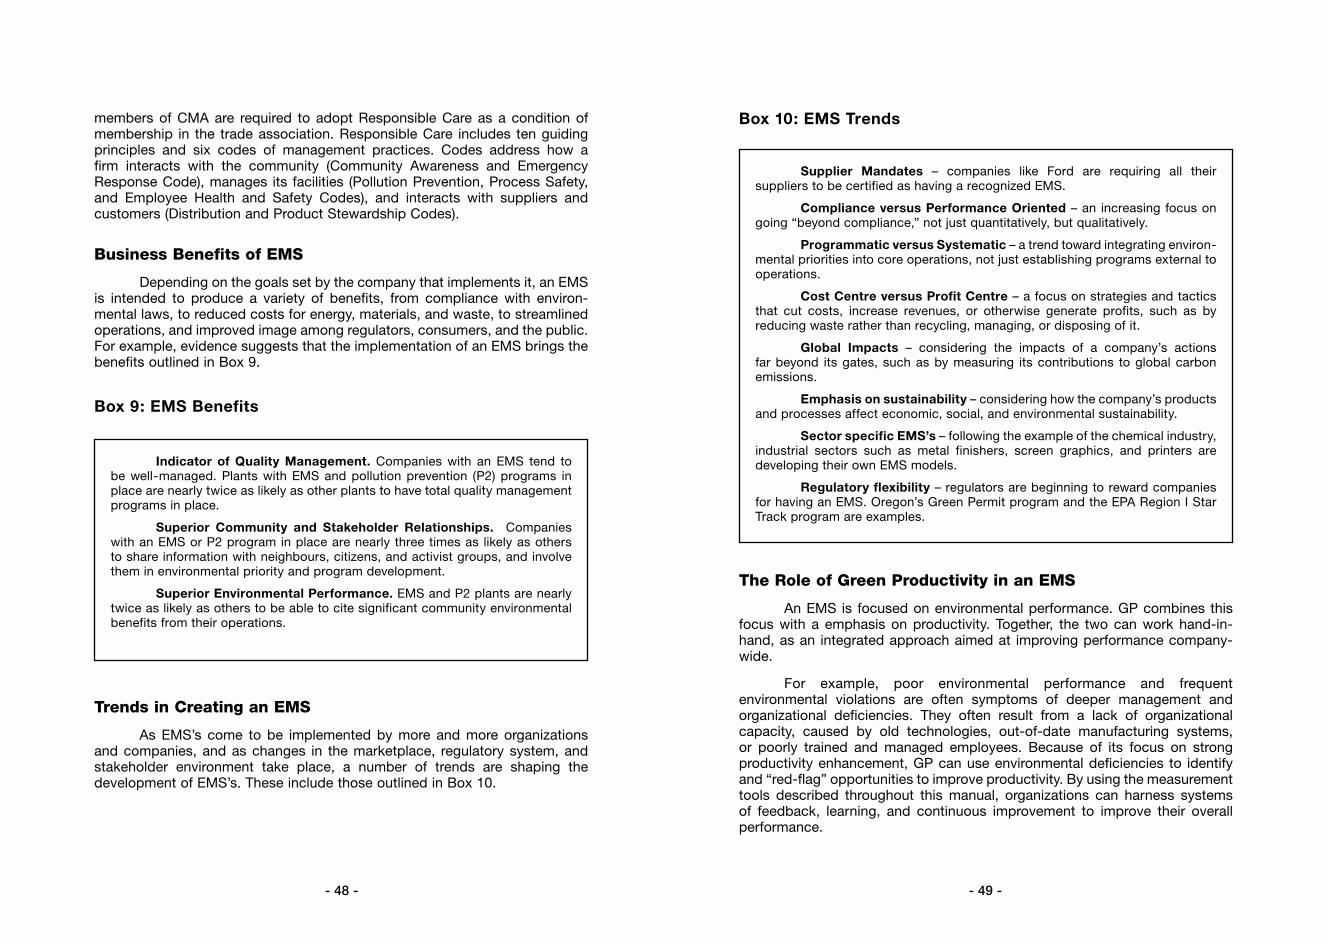
- 48 - - 49 -
Box 10: EMS Trends
The Role of Green Productivity in an EMS
An EMS is focused on environmental performance. GP combines this focus with a emphasis on productivity. Together, the two can work hand-in-hand, as an integrated approach aimed at improving performance company-wide.
For example, poor environmental performance and frequent environmental violations are often symptoms of deeper management and organizational deficiencies. They often result from a lack of organizational capacity, caused by old technologies, out-of-date manufacturing systems, or poorly trained and managed employees. Because of its focus on strong productivity enhancement, GP can use environmental deficiencies to identify and “red-flag” opportunities to improve productivity. By using the measurement tools described throughout this manual, organizations can harness systems of feedback, learning, and continuous improvement to improve their overall performance.
Supplier Mandates – companies like Ford are requiring all their suppliers to be certified as having a recognized EMS.
Compliance versus Performance Oriented – an increasing focus on going “beyond compliance,” not just quantitatively, but qualitatively.
Programmatic versus Systematic – a trend toward integrating environ-mental priorities into core operations, not just establishing programs external to operations.
Cost Centre versus Profit Centre – a focus on strategies and tactics that cut costs, increase revenues, or otherwise generate profits, such as by reducing waste rather than recycling, managing, or disposing of it.
Global Impacts – considering the impacts of a company’s actions far beyond its gates, such as by measuring its contributions to global carbon emissions.
Emphasis on sustainability – considering how the company’s products and processes affect economic, social, and environmental sustainability.
Sector specific EMS’s – following the example of the chemical industry, industrial sectors such as metal finishers, screen graphics, and printers are developing their own EMS models.
Regulatory flexibility – regulators are beginning to reward companies for having an EMS. Oregon’s Green Permit program and the EPA Region I Star Track program are examples.
members of CMA are required to adopt Responsible Care as a condition of membership in the trade association. Responsible Care includes ten guiding principles and six codes of management practices. Codes address how a firm interacts with the community (Community Awareness and Emergency Response Code), manages its facilities (Pollution Prevention, Process Safety, and Employee Health and Safety Codes), and interacts with suppliers and customers (Distribution and Product Stewardship Codes).
Business Benefits of EMS
Depending on the goals set by the company that implements it, an EMS is intended to produce a variety of benefits, from compliance with environ-mental laws, to reduced costs for energy, materials, and waste, to streamlined operations, and improved image among regulators, consumers, and the public. For example, evidence suggests that the implementation of an EMS brings the benefits outlined in Box 9.
Box 9: EMS Benefits
Trends in Creating an EMS
As EMS’s come to be implemented by more and more organizations and companies, and as changes in the marketplace, regulatory system, and stakeholder environment take place, a number of trends are shaping the development of EMS’s. These include those outlined in Box 10.
Indicator of Quality Management. Companies with an EMS tend to be well-managed. Plants with EMS and pollution prevention (P2) programs in place are nearly twice as likely as other plants to have total quality management programs in place.
Superior Community and Stakeholder Relationships. Companies with an EMS or P2 program in place are nearly three times as likely as others to share information with neighbours, citizens, and activist groups, and involve them in environmental priority and program development.
Superior Environmental Performance. EMS and P2 plants are nearly twice as likely as others to be able to cite significant community environmental benefits from their operations.

- 50 - - 51 -
5. The Movement for Public Reporting
In recent years, a movement has been growing for corporations to collect the necessary data and regularly report measurements such as those described in in this book. A popular name for this is Social and Ethical Accounting, Auditing, and Reporting (SEAAR).
Triple Bottom-Line Reporting
SEAAR’s first passed from an academic exercise into business application a little more than a quarter century ago, when A.D. Little published a 1972 paper entitled The Corporate Social Audit. Shortly thereafter, staff members from a small core of companies — Exxon, General Electric, Dayton Hudson, Bank of America and others — attended a meeting of accountants interested in developing a system of corporate social accounting. But until globalization reached its present intensity, there was little pressure for the broad application of corporate social reporting. Now, as the spread of industrial capitalism provokes change across a growing array of economic, cultural, and ecological issues, mainstream companies are slowly beginning to take up the approach.
Investors now want to know the value of companies whose primary assets may be their people and their relationships with one another, their customers, and their communities. There is, therefore, a push to measure employee loyalty, knowledge-content, intellectual property, customer satisfaction, community support, social need, in addition to the traditional area of interest to investors, prospective markets. Accounting and management firms such as Boston Consulting Group, Deloitte-Touche, and Pricewaterhouse Coopers, and business analysts such as Built to Last authors Jerry Porras and James Collins, are developing new approaches that they believe may better convey a company’s performance capacity in this new business environment.
Yet corporate social accounting has not yet emerged as a common or consistent practice. Some companies have begun social reporting systems, only to let them fall into disuse after two or three annual reports. There is no consistent discipline or generally accepted method for the practice of corporate social accounting. As a consequence, there appear to be many more consultants and advocacy groups vying to help companies prepare SEAARs than companies actually accepting the invitation, a situation that tends to create confusion for businesses and the public.
Steps in Establishing an EMS
Box 11 contains an outline of nine typical steps for establishing an EMS, such as ISO 14000.
Box 11: How to Build an EMS
Step 1: Lay the Groundwork. Build understanding and support for an EMS among the organizations’ managers and employees. Clarify why one is being developed, who is the target audience, and what environmental impacts will be tracked.
Step 2: Create an Environmental Policy. Review the organization’s current methods for managing environmental concerns, and where you want it to be. Perform a “gap analysis” that measures the difference between current methods and the vision. Write the organization’s environmental policy statement, both building on strengths and filling in the gaps most important to the organization.
Step 3: Determine significant environmental aspects, and set objectives. Environmental aspects are activities, products, and services that can interact with the environment. Sources of information may include internal data, Manufacturer’s Safety Data Sheets (MSDS’s), Toxic Release Inventory (TRI) records, etc. Prioritize environmental aspects in order of which you will address first. Translate these into objectives to reduce the impact of each.
Step 4: Evaluate alternatives. Brainstorm and evaluate a wide array of alternatives that can meet the objectives set forth in step 3. Follow a hierarchy that emphasizes reduction first, then recycling, treatment, and disposal.
Step 5: Set targets and measure success. Develop targets for every significant environmental aspect of the organization. Describe how you will meet a goal, and develop ways to do so — either by adopting alternatives, or instituting operational control procedures.
Step 6: Develop operational controls. In some cases, you will need to implement tight procedures to insure that activities are controlled in ways that reduce environmental impact. Measure the success of these controls, and take corrective action when necessary.
Step 7: Implement your EMS. Plan the EMS development process and set up environmental management projects targeted to your objectives. Identify the staff member responsible for each project. Establish a means or action plan. Implement timetables.
Step 8: Build organizational support. Identify all job functions influencing the organization’s environmental aspects. Provide training and education, meet staff needs, develop documentation, and communicate with and involve stakeholders.
Step 9: Establish continuous improvement. Review the EMS regularly. Assess whether environmental performance targets are being effectively selected, pursued, and achieved. Evaluate progress in communication, documentation, and stakeholder dialogue, as sources of feedback that indicate where to make efforts for improvement.
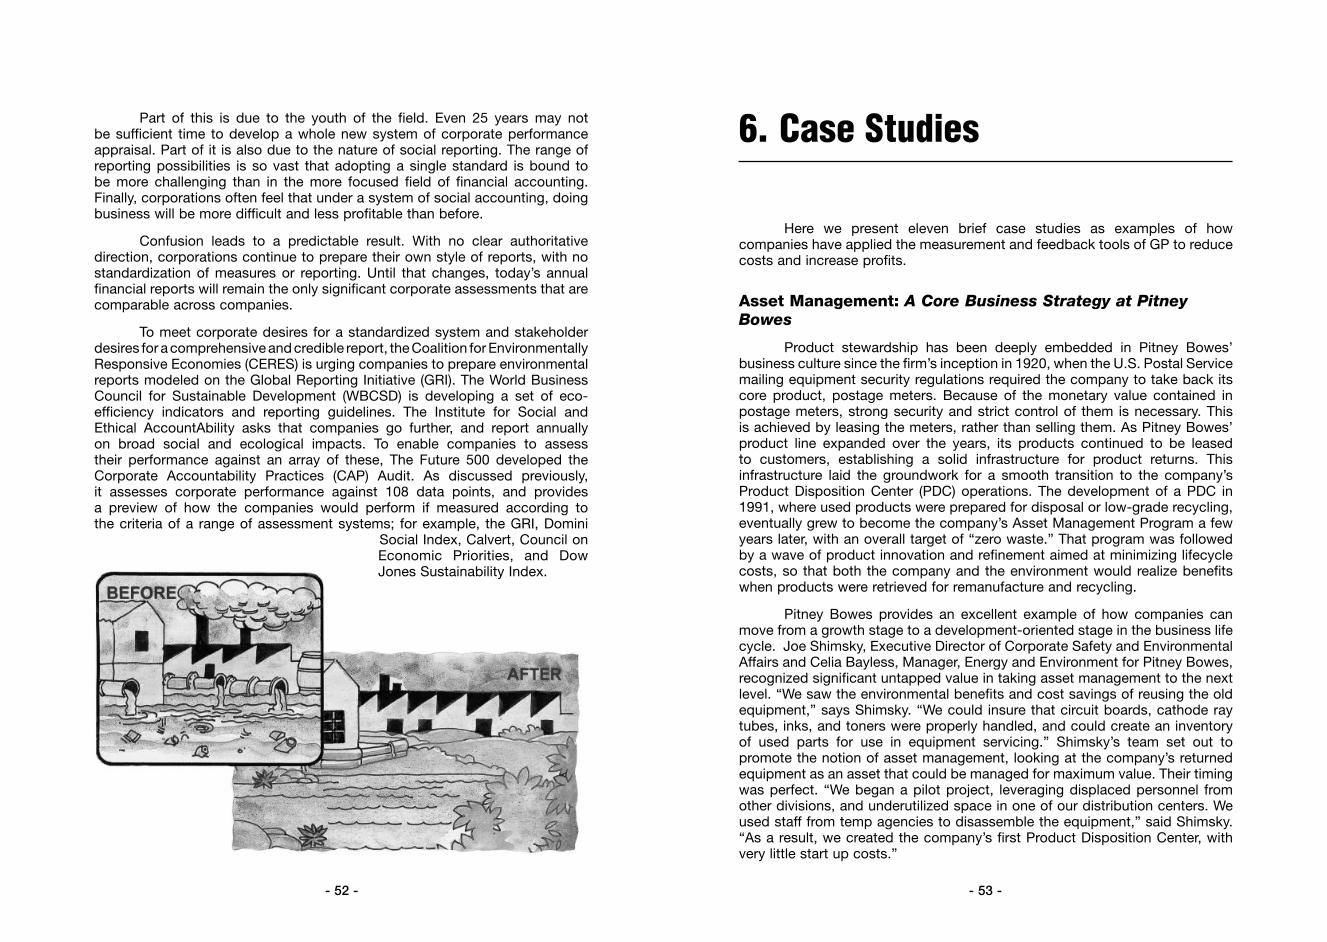
- 52 - - 53 -
6. Case Studies
Here we present eleven brief case studies as examples of how companies have applied the measurement and feedback tools of GP to reduce costs and increase profits.
Asset Management: A Core Business Strategy at Pitney Bowes
Product stewardship has been deeply embedded in Pitney Bowes’ business culture since the firm’s inception in 1920, when the U.S. Postal Service mailing equipment security regulations required the company to take back its core product, postage meters. Because of the monetary value contained in postage meters, strong security and strict control of them is necessary. This is achieved by leasing the meters, rather than selling them. As Pitney Bowes’ product line expanded over the years, its products continued to be leased to customers, establishing a solid infrastructure for product returns. This infrastructure laid the groundwork for a smooth transition to the company’s Product Disposition Center (PDC) operations. The development of a PDC in 1991, where used products were prepared for disposal or low-grade recycling, eventually grew to become the company’s Asset Management Program a few years later, with an overall target of “zero waste.” That program was followed by a wave of product innovation and refinement aimed at minimizing lifecycle costs, so that both the company and the environment would realize benefits when products were retrieved for remanufacture and recycling.
Pitney Bowes provides an excellent example of how companies can move from a growth stage to a development-oriented stage in the business life cycle. Joe Shimsky, Executive Director of Corporate Safety and Environmental Affairs and Celia Bayless, Manager, Energy and Environment for Pitney Bowes, recognized significant untapped value in taking asset management to the next level. “We saw the environmental benefits and cost savings of reusing the old equipment,” says Shimsky. “We could insure that circuit boards, cathode ray tubes, inks, and toners were properly handled, and could create an inventory of used parts for use in equipment servicing.” Shimsky’s team set out to promote the notion of asset management, looking at the company’s returned equipment as an asset that could be managed for maximum value. Their timing was perfect. “We began a pilot project, leveraging displaced personnel from other divisions, and underutilized space in one of our distribution centers. We used staff from temp agencies to disassemble the equipment,” said Shimsky. “As a result, we created the company’s first Product Disposition Center, with very little start up costs.”
Part of this is due to the youth of the field. Even 25 years may not be sufficient time to develop a whole new system of corporate performance appraisal. Part of it is also due to the nature of social reporting. The range of reporting possibilities is so vast that adopting a single standard is bound to be more challenging than in the more focused field of financial accounting. Finally, corporations often feel that under a system of social accounting, doing business will be more difficult and less profitable than before.
Confusion leads to a predictable result. With no clear authoritative direction, corporations continue to prepare their own style of reports, with no standardization of measures or reporting. Until that changes, today’s annual financial reports will remain the only significant corporate assessments that are comparable across companies.
To meet corporate desires for a standardized system and stakeholder desires for a comprehensive and credible report, the Coalition for Environmentally Responsive Economies (CERES) is urging companies to prepare environmental reports modeled on the Global Reporting Initiative (GRI). The World Business Council for Sustainable Development (WBCSD) is developing a set of eco-efficiency indicators and reporting guidelines. The Institute for Social and Ethical AccountAbility asks that companies go further, and report annually on broad social and ecological impacts. To enable companies to assess their performance against an array of these, The Future 500 developed the Corporate Accountability Practices (CAP) Audit. As discussed previously, it assesses corporate performance against 108 data points, and provides a preview of how the companies would perform if measured according to the criteria of a range of assessment systems; for example, the GRI, Domini
Social Index, Calvert, Council on Economic Priorities, and Dow Jones Sustainability Index.
- 54 - - 55 -
Return on Investment: At DuPont, Eco-Innovations Drive Costs Down and Market Share Up
How do you develop the culture of a sustainable business in a company with 90,000 employees spread through 16 strategic business units and 90 businesses around the world? DuPont does it in part with a feedback system founded on one central metric: shareholder value added per unit of impact.
“We are on a journey to transform DuPont into a sustainable growth company,” says CEO Chad Holliday, “one where we increase societal value while decreasing our ecological footprint.” Results so far have been promising. For example, between 1991 and 2000, the company increased production by 35%, while cutting greenhouse gas emissions 45%.
Since the 1970s, DuPont has evolved through three distinct stages of management: a centralized, control-oriented model, followed by decentralized networks, and increasingly by a more integrated living systems model. “In the 1970s we had a large centralized safety, health, and environment control group,” says DuPont’s Edwin L. Mongan III, Manager of Environmental Stewardship. “We needed it to get things done. But as we moved along, we realized we couldn’t separate environment from the rest of our business. It needed to be fully integrated at the operations level.”
The company first shifted from “command-and-control” to eco-efficiency using various templates and modes. In 1980, arch-competitor Dow invited its employees to suggest eco-efficiencies. That year, 27 projects paid back an average return on investment of 173 percent. Compelled by competition, DuPont launched an even more far-reaching plan in the 1980s. Then-CEO Edgar S. Woolard, a tough administrator expanded the corporate mission of zero injuries and illnesses to include “zero waste, zero emissions, and zero incidents.”
“Zero isn’t an absolute so much as it’s a way for our people to think,” says Darwin Wika, DuPont’s Director of the Corporate Safety, Health and Environment Excellence Center: “It drives innovation.” Motivated by the zero waste goal, DuPont has cut toxic releases 74%, halved its landfill waste, and saved $200 million on its $1 billion-a-year environmental costs bill since 1987.
One of DuPont’s most famous eco-efficiency breakthroughs came in 1982, when its agricultural division developed biodegradable herbicides that were both less toxic and more effective than predecessors, allowing up to a hundred-fold reduction in herbicides per acre. Developed for 23 different crops, their use cut worldwide herbicide use and helped move DuPont from the seventh to the second largest herbicide maker. Since then, most of the company’s gains have come through its awards program for environmental excellence.
One early concern the group faced was that shipping and handling costs would destroy the economic benefits of the program. But savings mounted into millions of dollars, and through the efforts of the company’s Integrated Supply Chain Management Program, the operations were optimized to realize maximum value of the returned products locally, only transporting equipment with the best potential to be remanufactured back to a central location. Improved information management systems contributed to more intelligent utilization of this valuable resource, providing a wealth of used components for the servicing of equipment. The remanufactured products provided access to new markets and a lower cost alternative for customers.
The net benefits go beyond remanufacturing and harvesting of components for service. Product take-back helps the company better understand the performance and durability of its products. This understanding provides invaluable information for the company’s design engineers, facilitating improved product quality and serviceability. The efficiency of the Asset Recovery Operations is facilitated by the company’s Design for Environmental Quality (DfEQ) program, which drives product design toward ease of disassembly and recycling through the use of “snap-fit” components, reusable plastic parts, use of fewer types of materials, and other innovations.
Senior management support was fundamental to the success of the program. Michael Critelli, Pitney Bowes Chairman and CEO, was supportive of the project from the start. As the former General Counsel, to whom environ-mental affairs reported, he understood the environmental benefits and cost savings that could result from an asset recovery operation and gave the concept a chance to prove itself.
Today, the company continues to improve its eco-effectiveness. For example, Pitney Bowes Management Services division, which provides on-site and off-site mail and document management services for customers, has found ways to dramatically streamline mailroom and reprographic operations. With its ability to manage equipment and resources, the firm capitalizes on new digital electronic messaging products, thereby reducing the consumption of material goods. In the metering arena, programs like Pitney Bowes Postage By Phone enable meter resetting via telephone line or modem, eliminating trips to the Post Office. Pitney Bowes’ new PC-based products, currently in beta-testing with the U.S. Postal Service, provide the same benefit, allowing customers to purchase postage online, either directly through the Internet, or by downloading postage from a small device connected to a personal computer.
Shimsky’s next challenge is to take on corporate sustainability at a more fundamental level. “Asset management was one step toward sustainability,” he says. “Our board is very enthusiastic about industrial ecology and eco-efficiency initiatives. We’re ready to take on more.”
- 56 - - 57 -
photopolymers and electronic materials team developed new ways to make circuit boards that led to new DuPont products and $100 million in sales over five years. An engineering team in Wilmington developed a pollution prevention practice that discovered $100 million in capital cost savings in 1998. And a team in the automotive products division changed the way the company sells auto body paint to auto manufacturers. Now they charge not per gallon, but per car painted. That creates incentives to improve paint quality, so DuPont can sell less and earn more. Next, DuPont hopes to create new products from renewable materials, such as cornstarch and other plants, rather than fossil fuels.
“This represents a whole new way of thinking,” says Mongan: “Back in the 1970s, most of the dollars we spent in environment were on regulatory compliance. As time went on, we were spending billions, but we really made no headway in the minds of the public. To build trust, we subscribed to the Responsible Care principles and management practices (a chemical industry environmental safety initiative), shared information with the public, listened to people’s concerns. And we focused on performance improvement. Eventually we realized that sustainability provides the link that we needed to fulfill our public trust.”
The process will take years, but the benefits will be worth the commitment, says CEO Holliday. “We are on a journey of creation and growth that requires an increased connection to the natural environment as well as the broader needs of a global society. As we enter our third century, we view sustainable growth as an integrating concept and focus that will allow us to prosper as a company dedicated to delivering the miracles of science in a way that creates a better future.”
Spend-to-Save: Compaq Computers Invests in Eco-Efficiency if it Pays Better than the Cost of Capital
Machine-like thinking is often the undoing of many of today’s eco-efficiency advocates. It may suggest once-off improvements in building design or production process to save energy, but it often fails as a “system thinker.” It does not create systems with the incentives and feedback loops to cause continuous gains.
Ron Perkins broke out of that mold. As facilities manager at Compaq Computer in the 1980s, Perkins championed energy efficiency. But rather than advocating improvements one-by-one, Perkins got company approval for a system that helped bring about continual gains.
At Compaq as in most companies, to gain approval, projects (such as energy saving technologies or techniques) had traditionally been required to have payback periods of two years or less. That proved a barrier to many of Perkins’ proposed improvements. But rather than accept the company’s
More recently, the company found what may prove an even more effective way to drive profits from sustainability. “At the start of the century, we are looking at the environment in a whole new way,” says Mongan. “It’s not just about eliminating waste, but increasing value across the value chain. It’s still important to comply, and to drive waste toward zero. But the biggest bottom line benefit, for society, the environment, and the shareholder, comes from sustainability.”
The company’s metric is simple and elegant. “We measure shareholder value added per ton of materials used or waste emitted,” says Wika; a form of resource productivity, “the numerator is value added, and the denominator is our footprint, the amount of materials we use or the impact we have on our surroundings.”
“Originally, the focus was all on reducing the denominator, our footprint,” Wika says. The metric stimulated broad discussion about what to include in the footprint. Pounds of materials? Units of energy? Toxicity? Social impacts? There were no easy answers, so the company engaged the individual business units for input. The biggest conceptual breakthroughs happened when the company raised its sights and looked to the top half of the metric, the numerator, value. “Sustainability is about creating value,” says Mongan. “If we develop new products and services, and those have a positive impact on society and the environment, those go in the numerator.”
That creates even more internal discussion and debate. What is shareholder value? New products and new services? Dollars earned? How do you account for broader social or environmental benefits? Those discussions lead to the biggest benefit of the metric: innovation. To drive the company’s improvements, environmental vice president Paul Tebo meets annually with DuPont’s sixteen strategic business units, to explore their footprint. Then, Tebo uses one additional metric that has been especially effective at driving internal competition and motivating creative innovations. “We use a template with four quadrants: low and high impact, and low and high return,” says Wika. “We ask every business to rate their products and processes on the template. They identify where they are having a high impact on the environment and generating low value in return. That keeps us from being too restrictive in our thinking. It frees them to set their own priorities.”
High impact, low return processes are either changed or shelved. Low impact, high return ones are used as models, and often recognized with DuPont Sustainable Growth Awards, where winning employee teams are given $5,000 to donate to the environmental cause of their choice. Wika says they also use “waterfall charts” that compare the various results for different business sectors: “That way everyone can see how they compare on value, waste, emissions, and so on.”
The result has been a succession of new products and services that create value while cutting consumption of raw materials. For example, a
- 58 - - 59 -
Consider softlines merchandising. Softlines include Target’s wide selection of clothing. Bosch discovered that a large category of waste consisted of packaging to help protect and display the clothing as it was transported from the manufacturer to its presentation and ultimate sale destination. The packaging provided important functions. The question was, were all the functions needed by Target, and could they be provided without the packaging?
Bosch could simply have targeted softlines packaging, and developed a strategy to reduce it. But he took a broader, more comprehensive approach. The distinction is very important to understand. Bosch didn’t select softlines first. Softlines emerged as a target through another more systemic mechanism. Target had instituted a system of measuring its waste intensity, which identified areas of high waste, and therefore high potential for remedial action. Combined with ABC, Bosch was able to target a source of waste that was particularly costly to the company and the environment.
Waste intensity is the amount of pollution or waste you generate for every unit of product or service delivered. Waste may be one all-inclusive category, as companies like Interface define it. Or it might be a narrowly targeted form of waste, such as the in-store packaging and product waste that is the focus for Target.
Here is how Target measures its waste intensity. Every store’s waste management and recycling contracts are negotiated centrally by its Environmental Affairs Division. It requires the contractor to email data on waste and recycling at each of the stores every month. How much is thrown away? How much is recycled? What is it — paper, plastic, metal, wood? Where does it come from — apparel, electronics? From there, the data is analyzed and sent out to each store’s managers. One of the most important measures they receive is their waste intensity, the amount of waste generated for every unit of sales. You can think of it as a ratio, with waste in the numerator, and output in the denominator.
There are many ways to measure waste intensity. Waste might include the solid waste measured by Target, or hazardous waste measured (and reduced) at Texaco’s refinery. Or it might be a much broader definition of waste: every underutilized resource, from space, to transit capacity, to labor, to inefficient materials use, to garbage, is waste. That broader definition enables the company to focus on a much broader array of cost-saving opportunities.
Output, in the denominator, might also include many different things: number of units sold or manufactured, dollar sales, profits, and so on. The important thing is this: the choice of what goes in the numerator and denominator are numbers that can be readily generated, numbers that clearly serve the survival and development interests of the company. Not just factors that enable it to live, but those that help it serve its mission and reach its goals.
process, he went to Compaq’s chief financial officer, John Gribi. Gribi’s philosophy was, “spend money to save money.” Together they developed a system that drove efficiency gains and saved the company more than $1 million a year in direct energy costs alone.
Gribi used the conventional economic measure of a return on investment to make decisions on eco-efficiency. Since the company’s cost of borrowing money was 7 to 11 percent, he asked only that eco-efficiency investments pay that plus 3 percent. “If we don’t have the money, we’ll borrow,” he said. That meant Perkins could move forward with any efficiency program with a return of 14 percent or better.
Resource Intensity: Target Stores Measures the Total Cost of Waste for Every Sale it Makes
Dayton Hudson Corporation is renowned for its commitment to community engagement and social responsibility, so when the company took on corporate environmentalism in 1990, Jim Bosch was chosen to institute a program that could be deeply planted within the company.
As an engineer, Jim Bosch brought his facility and fascination with numbers to his position as Vice President of Environmental Affairs at the discount chain Target Stores, and also to its partner company, Mervyn’s department stores. He knew that what gets measured gets done. So he applied a series of measurement tools at the chain that have helped to institutionalize Target’s commitment to the environment, and have changed the way it does business and made a lot of money in the process.
The popularity of recycling had reached its peak in the late 1980’s and early 1990’s, and Target got on the bandwagon. Yet as popular and easy as recycling was its economic justification was not always apparent. It cost Target about $30 a ton to throw stuff away — not much of a savings motivator when the value of goods sold is thousands of dollars a ton.
But that fact got Bosch thinking. When Target sells a ton of goods, it requires a margin of more than just a few dollars to cover its costs. What if the company was to calculate the full costs of handling something it doesn’t sell, like garbage? That brought Bosch to the idea of “activity-based costing,” or ABC. This is a system of accounting that measures the cost of an activity, rather than simply the cost of materials or labor. In ABC, the costs of waste management are redefined as the costs of processing materials through a Target store, from the time they enter to the time they leave.
Bosch discovered that when he measured the actual cost of handling waste through the stores, it added up not to $30 a ton, but to something more like $3,000 – a difference one hundred times higher. The reason was that every item that entered the store had to be transported to Target stores, handled by Target employees, and stored in Target facilities.
- 60 - - 61 -
Resource Productivity: Maxager and Cast Alloys Measure Productivity and Performance in Real Time
Michael Rothschild wasn’t always a rebel. For a long time, he followed traditional thinking in economics and business management. After earning a degree in law and a MBA at Harvard, he joined a leading corporate strategy consulting firm, the Boston Consulting Group (BCG). By the late seventies, Rothschild began to grow disenchanted with the “Machine Age” methods that manufacturers used to measure their operational and financial performance.
BCG’s mission was to work with major corporations struggling to keep up with a rapidly changing and competitive business environment. In some cases, it was a losing struggle. Too many companies needed fundamental changes in their whole approach to business in order to survive. “To assure long-term survival,” says Rothschild, “we couldn’t just band-aid a company built on obsolete economic assumptions. We had to rethink every important aspect of the business.”
Gradually, Rothschild came to see that ecological systems capable of evolving in the face of change offer a more dynamic economic model for manufacturers and corporations struggling to stay afloat. What if companies could be explicitly managed more like “intelligent social organisms,” flexible, adaptive, responsive, and able to learn rapidly from experience?
At that point in time, very few people and even fewer companies thought in terms of “living systems.” But Rothschild, entering his own creative stage of development, sensed that the time was right to make a difference. He spent six years developing a new way of thinking about business and the economy. His 1990 book, Bionomics: Economy as Ecosystem, attracted a cadre of enthusiastic supporters from an eclectic mix of communities — high-technology entrepreneurs, environmentalists, futurists, New Democrats, and libertarian Republicans. And for several years, the annual Bionomics Institute Conference brought together leading minds from all these disparate groups.
In his book, Rothschild asserted that the free market is an ecosystem that evolves according to the same design principles as natural ecosystems, and that disrupting the “free flow” of the economy in order to maximize output is as flawed as the idea that disrupting a free-flowing river will enhance the output of nature.
Although Rothschild’s book attracted a remarkable following, Bionomics was long on theory and public policy prescriptions, but short on practical tools for solving business problems. Several high-technology business leaders challenged Rothschild to come up with a way to turn an elegant theory into a competitive business advantage. So in 1993, with a few colleagues from his not-for-profit Bionomics Institute, he spun off a new for-profit software company, then called Applied Bionomics.
Since Target’s managers are each responsible for as many as seven stores, the information led the managers to question why some stores had high waste intensity and others had lower waste intensity. They started to look at their garbage. They found where it was coming from. And through activity-based costing and just common sense they figured where the costs were generated.
Rather than pitting individual stores against one another, Target emphasized cooperation and the trading of ideas. Because managers covered several different stores, they had an incentive to find out what worked at one store and then apply that at other stores. And because they were judged in part by the economic performance of all their stores, they had an incentive to report to headquarters when a centrally designed policy was costing them money.
For example, in softlines, central headquarters policy specified that suppliers package all their shoes and shirts with boxes, bags, wrappings and pins, most of which had to be removed and discarded when they reached the stores. Excess packaging could cut in half the quantity of products that could be fit in a single delivery truck. And it could double or triple the amount of labor required between the time of delivery and of display. It also cost the suppliers more money, and they passed those charges along to Target.
Spurred by the waste intensity measure, store managers communicated these costs, and hundreds of others, to central headquarters and one another, informally as well as through Target’s “Eco-Logic” quarterly newsletter. The newsletter reported the ideas and concerns, and identified “heroes” who came up with waste minimizing innovations.
Target was the first major retail chain to go 100% paperless on domestic purchase orders. Overall, Target was able to reduce paper use by 42%. But more importantly, Target improved the speed and accuracy of ordering, cutting labour and resource requirements across the board. It also set a goal of eliminating trash from several high-cost areas, including transport packaging and softlines merchandising. In 1994, the company reduced packaging waste 79%; in 1995 this reached 95%. Most of the percentage reduction was from recycling. But most of the cost savings was from reduction.
The changes at Target improved their “sense of taste,” of what was happening within its stores. But they also provided them with an enhanced sense of what was happening outside their operations. Target and its parent company, Dayton Hudson, are known for the active role they play in the communities surrounding their stores, so their “sense of hearing” and “sight” was already established. ABC and waste intensity drew them down their “food web” to their suppliers, and engaged them all together in a process of reducing waste and costs. Target’s initiatives have now begun to spread through its web of relationships, and are being adopted and adapted by other chains as well.
- 62 - - 63 -
optimal financial performance) and the level actually being achieved, and then prioritizes the changes needed to bring the plant up to its full potential. Maxager enables plant managers to maximize plant profitability, by giving them the information they need to continually reallocate resources to their highest value-added use.
The information Maxager disseminates throughout a manufacturing organization helps unify and coordinate the company’s strategic, environmental, and operations sectors. It tracks plant resource productivity and waste intensity at any level an environmental affairs manager may desire—by work team, product line, or plant, hourly to annually. Line employees and teams can touch a computer screen to see how changing the quantity in a production run impacts on unit cost and profit. Team leaders, floor supervisors, plant managers, and senior corporate executives can view information at the level of detail most appropriate to the decisions they face.
To achieve this breakthrough in manufacturing information, Maxager focuses on the plant’s bottleneck, that is, the point where the flow of materials (and dollars) is physically constrained. Think of the Golden Gate Bridge: there are five lanes in each direction on the freeways entering and leaving the bridge, but only three lanes in each direction on the bridge itself. Raising the speed limit or adding lanes on the freeways leading to and from the bridge cannot increase the overall flow of traffic. To improve the throughput of the system as a whole, you have to optimize flow through the system’s bottleneck, the bridge itself.
Applying principles of the theory of constraints, Maxager helps managers maximize the flow of value-added goods through points of constraint. It calculates profits lost to waste (especially post-constraint scrap, the most expensive form), setup time, and sub-optimal decisions on product mix. It identifies the most profitable product mix for a plant and calculates the real unit cost for each product by machine, batch size, etc.
So far, Rothschild’s bionomic theory is working out well in Maxager’s practice. For example, in two years of trials at Cast Alloys (makers of Callaway’s famous “Big Bertha” titanium golf clubs), inventories fell by half, cash flow per month grew 70%, and profits jumped. “They discovered that, in effect, they had dramatically increased the productive capacity of their plant, by making better decisions about how to use their resources,” says Rothschild. He sees the Maxager approach as an alternative to the traditional meat axe approach to corporate restructuring. “Downsizing is sometimes necessary, but often it’s a crude approach that leaves whole companies traumatized. Companies do it because they don’t know how to become more efficient and profitable. When you come right down to it, they don’t have access to actionable, detailed information about what’s profitable and what’s not.”
Often downsizing is accompanied by campaigns that talk about creating an empowered learning organization. “But so much of empowerment
Large manufacturers, the target customers for Applied Bionomics’ software system, often thought the word “bionomics” had something to do with biotechnology, so the company’s name was changed to Maxager—short for Maximum Manager.
Maxager Technology’s vision is to redefine how manufacturers manage for maximum productivity and profitability. Its method is to maximize a company’s resource productivity, the value it generates from all the resources it uses. Resource productivity is typically expressed as a ratio. Resources used are in the denominator, and value generated is in the numerator. Traditionally, a narrow selection of resources are used: for example, energy, materials, or labor. Value generated may be number of products produced, their dollar value, or profits generated, for example. Because value is in the numerator, improvements in resource productivity, when expressed as a ratio, show an increase. Some feel they have a more intrinsic appeal to business people than waste intensity, because like profits and sales, improvements show upward rather than downward movements.
Maxager takes a much more comprehensive and sophisticated approach to resource productivity. While resource productivity is usually measured annually on a narrow selection of inputs and outputs, Maxager provides a means for continuously and automatically calculating the productivity of many or all manufacturing plant resources. Using the latest computer network technology to create a “central nervous system for a highly intelligent organization”, The Maxager System™ allows the people inside a company to see, in real-time, the most efficient and the most profitable ways to use energy, materials, labor and all other resources. After four years, many millions of dollars, and several hundred thousand lines of code, Maxager Technology Inc. introduced The Maxager System™ to the manufacturing community.
While traditional resource productivity measurements may be most appropriate for relatively simple linear production processes with a small variety of outputs, Maxager is designed more for production facilities that produce an array of products. It is most effective for manufacturing plants that turn raw materials — from metals and plastic, to rubber, raw wood, and fibre to silicon wafers — into an enormous variety of component parts, like screws, springs, gears, gaskets, capacitors, connectors, and fasteners, all of those tiny parts that no one ever notices. As a result, Maxager is not likely to be as valuable in an automobile factory as in a company that supplies parts to an auto manufacturer. Maxager’s objective, says Rothschild, is “to optimize the physical economics of these very complex factories.” The goal is to create the most value for customers and the most profits for shareholders, while using up the least raw material, capital, and labour.
Maxager operates on the principle of real-time “bio”-feedback. The software continuously recalculates a factory’s greatest “health” — the product mix and operating conditions that will maximize value-added and profits. Maxager calculates the gap between a plant’s “Total Available Profit” (its
- 64 - - 65 -
MET and Mass Balance: Consolidated Tracking of Resource Use at Mitsubishi Electric
Mitsubishi Electric tracks its growth stage success through traditional measures like sales, profit, and return on equity, with a goal of about ten percent return on equity over the long term. But Mitsubishi also uses two additional measures, which assess both its operational draw (resource use) and its growth-stage impacts on the environment.
The first is called MET, for Materials, Energy, and Toxicity. Through MET, the company seeks to drive down pollution and waste in a comprehensive fashion, and avoid simply transferring wastes from one category to another. MET measures material and energy consumption overall, then uses toxicity as a kind of “multiplier.” The higher the toxicity, the more it multiplies the environmental impact. MET has led the company to ban 27 specific chemical substances. For 488 other chemical substances, Mitsubishi uses a second metric: mass balance. Mass balance tracks exactly where materials come from, and where they go. This way, they create positive incentives to reduce or eliminate their use, by identifying or inventing better substitutes.
Social Value Added: Mitsubishi’s VSIS Unit Assesses the Social Benefits of Innovative Products
Striking innovations seldom emerge from companies whose capital is trapped in older technologies. But as the speed of change accelerates, more companies recognize the need to make obsolete their very own products. Doing so usually requires the development of parallel units, even subsidiaries, which are free to depart from established directions of the parent company.
That is the case with VSIS, a unit of Mitsubishi Electric. In choosing ventures for development at the company, Steve Hester’s metric was social need. The former Executive Vice President of Mitsubishi Electric America, Hester headed the company’s New Business Development Group, and also served as CEO of VSIS, whose business is to put whole systems on a single silicon chip. VSIS makes custom chips for extremely high value applications, not mass market chips like those of Intel, but high cost, high margin chips that perform extraordinarily complex functions.
Hester’s bottom line goal at Mitsubishi Electric was “to create much higher levels of value on silicon.” By value, he’s not just talking traditional economics. “What we need to focus on is things that improve quality of life. Whether we do it or someone else does it, it doesn’t matter. That’s what we’re here for. I’m banking the rest of my life on it.”
He identifies social needs first by reading and traveling extensively, then by measuring the potential of target markets. “I spent three weeks in Tanzania, in the Serengeti. The African continent has to develop. But we don’t have to
talk is just that—talk,” says Rothschild, “Giving people the authority to make decisions doesn’t work, unless you also give them the information they need to make smart ones. Self-managed teams need real data, in real-time, at whatever level of detail they want, if they are going to truly be empowered to help the company reach its full profit potential.”
Life Cycle Analysis: Mitsubishi Electric’s Take-Back Program Merges LCA with The Natural Step
Mitsubishi Electric’s Asset Management program was initiated in partnership with the Japanese government and other manufacturers, involving the establishment of 46 take-back centres throughout Japan. These centres will receive electric and electronic products from all manufacturers, then disassemble them into valuable parts, recyclable parts, hazardous materials, and others.
Mitsubishi expects the most valuable resource extracted by their take-back centers will be what they teach. In the first plant, opened in April 1998, a database keeps track of all the products they process, by brand and model. A built-in artificial intelligence system feeds back the costs (and problems) in the dismantling process, and learns how to do the job better. That information is used to help design better products and processes.
But not all costs are captured by product take-back. As a consequence, the company is also conducting life cycle assessments (LCA’s) of many of the products in its line. Life cycle assessments recognize that most of a product’s impacts occur either before it enters the factory as raw materials, or after it leaves as a finished product. LCA attempts to assess impacts over at least five product life stages: resource extraction, manufacturing, packaging and shipping, customer use, and disposal, reuse, or recycling. By taking account of costs through a product’s whole life cycle, from cradle to cradle (NB: Not simply from cradle to grave), a company can seek to minimize total costs and maximize total benefits.
The company also applies the principles of The Natural Step. The Natural Step (TNS) is a program developed in Sweden that specifies four “system conditions” that the program’s designers say must be adhered to in order for a system to be sustainable over the long term. While no business can meet all the conditions at any one moment, they help motivate continuous improvements and, occasionally, fundamental leaps. Mitsubishi Electric is using TNS as the model within which to establish its ISO 14000 environmental management program. ISO 14000 is the program by the International Organization for Standardization that sets global standards for the structure of corporate environmental management. Because it is primarily reporting oriented and lacks goals, TNS provides a useful compass to direct corporate EMS toward higher levels of sustainability.
- 66 - - 67 -
on time. Within two years, Japan’s electronics companies held 57 percent of the world’s semiconductor business, and by 1983, 24 percent of all chip sales.
Companies like National Semiconductor cried foul, charging that U.S. companies needed protection from Japanese competition. But Motorola took a different approach. It set an “impossible” goal: Six Sigma quality, a term that means just 3.4 failures per million chips, or 99.99966 percent perfect. To approach that goal, Motorola reinvented itself, establishing Motorola University to train its employees in continuous improvement and designing quality into every step of production.
The result was a completely new approach to key semiconductor manufacturing processes. That “clean sheet” strategy helped the company eliminate inputs and process steps that were getting in the way of quality. For example, CFCs in the soldering process were creating inefficiencies and destroying stratospheric ozone. Instead of simply finding a CFC alternative, Motorola invented a new soldering process that eliminated the need for cleaners.
By taking this whole-systems approach, the company achieved its Six Sigma goal by the end of the 1980s. Intel took up the challenge too, with its own quality program modeled on Motorola’s example. Japanese manufac-turers, who had grown complacent with their once-secure markets, had to scale back and settle for less profitable market niches.
Investment Value Added: Innovest Finds that Eco-Efficiency is a Proxy for Superior Management Performance
To the typical financial analyst or chief financial officer, environmental affairs is a cost centre that reduces corporate profits. Therefore, a company’s objective should be to minimize environmental expenses. Every dollar cut from an environmental program, assuming no reduction in effectiveness, is a dollar added to profits. That belief has led corporations to see the environment as a risk management issue, and to focus on two risk-minimizing goals. First, comply with the law, not only to shield the company against fines and legal sanctions, but also to reduce the risk of liability from public health or ecosystem impacts. Second, drive down the use of materials that might create regulatory or liability problems for the company.
Those two risk factors have been the driving force behind the extraor-dinary gains many companies have made in reducing their use of materials deemed toxic by regulators. But what is missed in this approach is the potential to profit from environmental excellence. Nearly every academic and business study shows a positive relationship between a company’s environ-mental performance and its performance in the stock market.
develop it. The Africans need to develop Africa, in their own image. Not with all the mistakes we’ve made. What is our alternative? We don’t know. No one knows. Silicon technologies can contribute to the solution. But not the ways we might expect, the ways we might impose on Africa or anywhere. The third world needs to develop a higher quality of life in its own way, according to its own terms, without stringing phone lines all across Africa.” Hester believes that to develop its own way, Africans need their own self-designed systems of health and education, drawing on the lessons learned in the west, but not necessarily copying our methods.
To help provide education and information on advanced systems of health care, Hester and a small group of engineers developed a series of high value chips. “One is a surgical simulation chip that can help advance the training of health professionals around the world, without years of four-on-one apprenticeships like we do in the U.S. today.” That requires a lot more than a training video. It requires training that draws students into virtual engagement with surgical processes. “We need high speed graphics, a complex model of the human heart.”
Eco-capitalism, the biological model of business, was the secret to the success of VSIS, says Hester. “To make the company work, we needed to throw out all the business models we knew, the Japanese and the American. We had to embrace a different model. It’s part of the evolution of business. Intellectual capital, as opposed to raw material resources, is the new basis for business. The core objective is to make the best use of intellectual capital. The ‘bio-model’ enables that. It doesn’t require a lot of people — just a few people with vision,” he says.
Now Hester would like to see the “bio-model” applied to the products of his business and industry directly, to make products with greater capacity to learn and grow with the user: “We have a long way to go. In computers we’ve carried planned obsolescence much further than automobiles ever did and nobody’s calling attention to it. We in the industry need to call attention to it first.”
Defect Rate: How Motorola Drove Down Defects to Regain a Competitive Edge
When a company doesn’t make its own products or processes obsolete, eventually its competitors will. That is what Motorola learned, and it used the process as a catalyst for changes that restored its market leadership.
At a Boston conference of electronics industry executives in 1979, Hewlett-Packard (HP) launched a verbal missile against U.S. manufacturers of microchips. Fully five percent of all U.S. made chips that HP bought failed. Moreover, deliveries were often late or the wrong assignment. By comparison, Japanese chips had almost zero defects, and the deliveries were consistently
- 68 - - 69 -
in 1999 the investment quality of Mobil Oil and Unocal was rated almost dead even by Wall Street analysts, but Innovest data gave Mobil a huge edge on the basis of its eco-efficiency. For the year ended February 1999, shares of oil companies rated among the top 50% in environmental performance outper-formed by 20% those in the bottom 50%. Innovest showed similar results for every industry sector it studied. Chemical companies in the top half of environ-mental performers, for example, had a 20% share gain advantage during the one year ending February 1999, and a 70% advantage over the three years ending December 1998.
Stakeholder Feedback and Adaptation: Nike Learns to Listen, Listens to Learn
Take away the products, facilities, suppliers, and even the profits. For companies like Nike, those assets are worth very little, compared to the value of the brand name.
In the industrial era, economies of scale were vital to business success. Mass markets brought huge factories, generic products, low costs and high profits. Corporate names were secondary, and often generic: General Motors, General Electric, Standard Oil, Standard Brands. But in the emerging economy, economies of scale take a back seat to relationships. The key to profits is often maintaining a close relationship with all of a company’s stakeholders, keeping their trust, and their support. Nike first learned that lesson three decades ago, but like many companies, it forgot some of what it learned, and has taken at least two intensive refresher courses since.
Back in 1972, Nike was a small start-up company with an ambitious goal: to beat the market leader, Adidas. Nike was a firm of 48 people. Adidas was 3,000. Nike’s bold ambitious powered more than a decade of astonishing growth. As the mass market for shoes divided into an array of niches, Nike chose a highly profitable one: high quality, European-design athletic shoes, made less expensively in Asian factories. For the 12 years beginning 1972, Nike grew one thousand fold, from $1 million to $1 billion in sales by 1983.
When growth is explosive, and follows a straight linear path toward the roof, companies often begin to lose touch with subtle shifts in the market. With growth so strong, why should they care if they miss the emergence of a few small niches?
Nike has learned why. As the company tooled up to meet colossal market demand, its culture changed, says one top Nike executive: “The business got so large and so complex that it was impossible for (cofounder and CEO) Phil (Knight), or any of us, to play the same role.” Growth and profits reached record levels. The company looked healthy. But it was becoming machine-like, blind to changes in the market. When aerobics entered the picture, and customers began to look for the right footwear, Nike was caught off-guard.
Correlation is not causation. More often than not, even a company with superb environmental performance will not be able to attribute much of its bottom line directly to its environmental initiatives. Much more significant is the quality of a company’s management, investors say. And environmental performance can be an excellent proxy for management quality.
Environmental issues pose complex challenges for companies. They are a Pandora’s box of scientific, technological, social, political, and values-based considerations that cannot be effectively managed by machine-style hierarchical organizations. They involve high levels of uncertainty, a multitude of issues and stakeholders, and a variety of assessment techniques that go beyond traditional financial measures.
Because of that, environmental issues begin a process of change that can compel companies to engage much more seriously with a broader array of stakeholders. They stimulate internal dialogue and communication, public discussions, and teamwork. They foster loyalty and give employees a performance motivation that goes beyond a paycheck alone. And they encourage efficiency, innovation, and entrepreneurism.
Even when corporate environmentalism does not drive performance directly, it is a strong indicator of a company’s ability to excel in times of complexity and change, sustain challenges, and seize opportunities. Superior eco-efficiency, for example, suggests a company’s ability to create shareholder value over the long term. The company that can motivate continuous improvements in eco-efficiency is well positioned to excel during the often difficult transition from the growth to development stage. It knows how to cut costs, drive efficiencies and improve quality. These attributes, essential to a company’s ability to sustain itself through a succession of business cycles, is not currently captured by most Wall Street analysts. As a consequence, entrepreneurial investment advisors have developed methods to assess corporate environmental performance, and track its success as an indicator of financial performance.
Innovest, for example, identifies environmental “best-in-class” companies that it believes will outperform the market trend over time. Mutual fund and portfolio managers buy Innovest’s data to help them choose between companies that otherwise appear to be equivalent investment opportunities.
Innovest is not driven by the political litmus tests common in ethical investment circles. They don’t exclude “politically-incorrect” industries from their analyses, since every industry group has a best-in-class, and channeling investments to that firm can not only yield better returns, but advance their environmental initiatives as well.
Innovest surveys companies for more than 60 indicators of environ-mental performance, weights the indicators using a proprietary formula, then aggregates and summarizes the indicators in a scoring matrix. Then they compare the scores of companies in the same industry sector. For example,
- 70 - - 71 -
criticisms, and instead turned its focus to the more difficult issue of solving the problems. The company found it had more power over social and environmental conditions along its supply chain than it had recognized. Because Nike often buys a large percentage — sometimes 100% — of the output of their contract manufacturers, they have tremendous leverage to change things. In Farris’ words, “We can tell them, ‘This is what our customers are demanding from us. No child labor. Meet these pollution standards, meet these safety standards. If you want our business, you have to do it that way, even if it’s different from how you’ve done it for 50 years’”.
The company prohibited child labor at all its suppliers. It established environmental management and performance standards, and increased its measurement and tracking. It even began to take back old shoes, and recycle them into Nike Grind, which is used to make basketball courts and soccer fields. The biggest benefit of the recycling is at the front end, says Nike’s environmental veteran Phil Berry: “For example, we had a problem with chromium in the upper material. So we were able to tell R&D that chromium is a problem for us. Designs are changing in response to this feedback.”
That improved environmental and social performance, and reduced criticism of the company in the media, but it also increased awareness inside the company. Now, people wanted to press for more fundamental solutions. Nike couldn’t single-handedly change global living standards, without being decimated in the marketplace. But activists convinced the company it could plant the seeds of new patterns of growth. As a consequence, to promote cultural sustainability, Nike began a small lending program, offering small loans of $80 to $100 in Vietnam and elsewhere, to enable people to form their own businesses, and avoid the either-or proposition of poverty in rural areas or factory jobs in the cities.
“Microenterprise is one of the few community programs that has the power to transform a person’s life,” says Diana Tsui, who runs the program. “It’s not like giving a person a handout. Recipients set up small businesses with these loans, benefiting not only themselves but entire families. In so doing, they learn skills that they can use for the rest of their lives.” In Nike’s first program, eighty-five percent of the funds went direct to loans, and not one defaulted.
To its critics, Nike may always remain a target for activist causes in the apparel industry, ripe for attack as a symbol for all of globalization. That is what every brand leader must expect in the age of Internet activism. But the company’s ability to adapt to the feedback it received was critical to its regaining its momentum in the marketplace, and retaining its leadership position. Nike’s long-term resilience now depends on its ability to maintain the trust, loyalty, and support of its full array of stakeholders.
But Reebok wasn’t. Between 1981 and 1987, Reebok’s sales grew nearly one thousand fold, mostly at Nike’s expense.
“We crashed,” says Nelson Farris, Nike’s longest-standing employee besides CEO Phil Knight: “We had diversified too much, spread ourselves too thin. We took our eyes off the market, started focusing on ourselves. And we had a loss of leadership. A lot of our original people cashed out their stock options, moved on. There was confusion about what we stood for.”
Over time, Nike regrouped, and responded by seeking to jostle its machine-style organization awake. To cultivate more of a learning organization, it decentralized authority, increased diversity, and differentiated its product line. The shift in management strategy worked. Within 18 months, the company stabilized, and sales began to grow. Between 1993 and 1997, they exploded a second time, this time from $2 billion to $9 billion.
Then, the company was surprised again, caught off-guard by claims that it was using child labor to make its products. For example, in Pakistan the company contracted with home based businesses to stitch its soccer balls. Because the businesses were family-run, children were often part of the production. Without knowing it, Nike had stumbled into a controversial use of child labor.
Nike responded by doing what critics of the Pakistani soccer ball business asked. It ended its contracts with the home businesses, and instead hired heads of households to work at separate factories, a distinctly western model of development. Now, children weren’t required to help with the family income. But parents weren’t always around to guide and mentor them either. The company also initiated a global campaign to improve working conditions and set and verify standards throughout the global network of independent suppliers who make Nike products.
Most within the company, however, thought the accusations were unfair. “What the media was saying was often highly biased, lazy, and even erroneous reporting,” says Farris. “When you peel the onion, Nike is the best of the bunch. We’ve been a leader in offshore business responsibility from the start.”
But that didn’t matter. Guilty or not, Nike had grown to be more than a small, narrowly focused business. As the dominant player in the market, it was expected to be a leader in social responsibility as well. Gradually managers began to accept that, as the market leader, Nike was a lightning rod for all the ills of the sports apparel industry. Since its brand name was arguably its most valuable asset, the company could not afford to suffer sustained public criticism that might more fairly be assessed against the system of which it was only a part.
Maria Eitel was hired as the new vice president for corporate responsibility. The company turned its attention away from rebutting the
- 72 - - 73 -
5. Prepare an Annual Report. Demonstrate to the public your commitment to maximizing your triple bottom line. Whether you call it a Public, Stakeholder, Environmental or Sustainability report, the actions above, plus those you are already taking, will give you ample information to convey. By publicly displaying both your achievements and the real-world challenges you face, you will enhance relationships, build trust, and get the feedback vital to continuous improvement.
The emerging economy demands that organizations be innovative, agile, profitable, and sustainable. GP provides the tools, but it is up to every employee in every organization to actually put them to use. Find out where you can make a difference, and begin.
7. Five Recommendations of What To Do Next
Green Productivity and its parallel fields offer exciting opportunities to move business to a higher phase of development. But the array of ideas and tools is so large that many companies do not know where to begin. Five basic steps that can benefit almost any major business are recommended. The steps are all related to one another — each can support the others. They are:
1. Measure Your Resource Productivity. Labor productivity is no longer enough. If your organisation is not also measuring energy and materials productivity, then it is not capturing the full potential of today’s technologies to drive up productivity across-the-board.
2. Institute a Spend-to-Save Policy. If your organization approves efficiency and eco-efficiency measures one at a time — or worse, if you demand that they pay returns equivalent to successful new product developments — then you are locking yourself into a long-term high cost structure that damages both economic and environmental performance. A Spend-to-Save policy merely says that when it is cheaper to access efficiency than to access capital, it makes good sense to buy efficiency. The result could be an array of initiatives that will save money and give you plenty to report in recommendation five below.
3. Conduct a CAP Audit. Every brand-name company is judged, ranked, and rated by a variety of investor, media, and activist groups. Every company gains and loses market share based on the impressions its stakeholders have of it. It is expensive and confusing to comply with every one of the assessment systems in the marketplace. By performing a CAP Audit, you can identify opportunities and risks, giving you a simple road map to plan your actions. You will also be able to understand, anticipate, and head off criticisms that can lead to litigation, new legislation, and negative public relations.
4. Conduct a CAP Scan. Choose one problem or one opportunity around which to scope a corporate initiative. Conduct a CAP Scan to identify a menu of options. Then choose a plan of action with the likelihood of a high payback for your company and the environment.
- 74 - - 75 -
Segaller, Stephen, Nerds – A Brief History of the Internet, TV Books, New York, 1998.
Tibbs, Hardin, “Human Ecostructure,” Whole Earth Review, Summer 1998.
von Weizacker, E., Lovins, A.B. and Lovins Hunter R. (1997) Factor Four: Doubling Wealth - Halving Resource Use: A New Report to the Club of Rome, Allen and Unwin, St. Leonard’s.
Wheatley, Margaret, and Myron Kellner-Rogers, Questions that could revitalize measurement, Journal of Strategic Performance Measurement, January 1999.
BIBLIOGRAPHY(Also refer to the web sites listed in the text)
Abe, Joseph M., David A. Bassett, Patricia E. Dempsey, Business Ecology: Giving Your Organisation the Natural Edge, Butterworth-Heinemann, 1998.
Benyus, Janine M., Biomimicry, Morrow, New York, 1997.
Business Week, November 10, 1999, Industrial Ecology – A Society that Reuses Almost Everything.
Chandler, Alfred D., The Visible Hand: The Managerial Revolution in American Business, Harvard University Press, 1977.
Cohen, Nevin, Greening the Internet: Ten Ways E-Commerce Could Affect the Environment and What We Can Do, iMP magazine, October 1999, www.cisp.org/imp
Cringley, Robert X., Accidental Empires, Harper Business, New York, 1996.
De Geus, Arie, The Living Company, Harvard Business School Press, Boston, 1997.
Eiseman, Fred B., Jr., Bali: Sekala & Niskala (Volume 1), Periplus Editions, Hong Kong, 1990.
Gilder, George, Microcosm, Simon and Schuster, NY, 1989.
Hawken, Paul, The Ecology of Commerce, Harper Business, NY, 1993.
Hurst, David K, Crisis and Renewal, Harvard Business School Press, 1995.
Kelly, Kevin, Out of Control, Addison-Wesley, Menlo Park, 1994.
Moore, James F., The Death of Competition: Leadership & Strategy in the Age of Business Ecosystems, Harper Business, New York, 1996.
Moscowitz, Milton, conference keynote address, Standards for the New Millenium, Vancouver, BC, Canada, Oct. 19, 1998.
Peters, Tom, Lean, Green, and Clean: The Profitable Company of the Year 2000, TPG Communications, Palo Alto, California, 1990.
Rothschild, Michael, Bionomics, Henry Holt, 1990.
Sakaiya, Taichi, The Knowledge-Value Revolution, Kodansha International, Tokyo, 1991.

- 76 - - 77 -
Asian Productivity Organization
Hirakawa-cho Dai-ichi Seimei Bldg. 2F1-2-10, Hirakawa-cho, Chiyoda-ku
Tokyo 102-0093, Japan
Phone: (81-3) 52263920Fax: (81-3) 52263950
E-mail: [email protected] site: www.apo-tokyo.org
Typeset and cover design by Graham Abraham Design, Brisbane, Australia