Embed Size (px)
Citation preview
July 18, 2018 The Honorable Phil Murphy Governor, State of New Jersey Dear Governor Murphy: The New Jersey Economic Development Authority (EDA) is pleased to submit the enclosed review and analysis of the Grow New Jersey Assistance Program (Grow NJ) and State Economic Redevelopment and Growth Grant Program (ERG), pursuant to P.L. 2013, c.161 – the Economic Opportunity Act. Per statute, the EDA formally engaged the Edward J. Bloustein School of Planning and Public Policy at Rutgers University (Bloustein) in March 2016 to commence an analysis of the Grow NJ and ERG programs, satisfying the legislative directive that the Authority retain “a premier, not-for-profit, non-partisan entity to undertake the review and analysis of the State economic incentive laws.” The Grow NJ and ERG programs were created through P.L. 2013, c.161 to incentivize the creation and retention of jobs in New Jersey (Grow NJ) and enable commercial and residential development that would not be completed under traditional financing mechanisms (ERG), with a particular emphasis on economically distressed areas of the state. The Bloustein analysis reveals the following key observations:
• There has been a significant volume of project approvals under Grow NJ, which are associated with significant volumes of retained and created jobs, but which will also generate a substantial offset to the Corporate Business Tax and Insurance Premium Tax in the years ahead.
• Commercial ERG projects leverage a considerable amount of private investment. • Given the long lead time associated with Grow NJ and ERG projects, it is too soon to fully
evaluate the impact of these programs on the State’s economy. • Projects approved under Grow NJ are generally concentrated in the northern, more populous
counties of the State. A significant percentage of project funding in the eight southern counties has been concentrated in Camden.
• Redundancies in the Grow NJ base and bonus award structure are potentially providing more generous incentives than intended by the statute.
• Because certain bonuses have been underutilized, it is not clear that the program has advanced certain policy goals intended by the legislation such as clean energy investment and the creation of incubators.
• There is an opportunity to improve EDA’s analysis of proposed incentive projects. While comprehensive in meeting the statutory directive, the Bloustein analysis was limited to four main objectives, and there are several gaps that merit further exploration. The Economic Opportunity Act was crafted and passed following a severe national recession, and the State was facing significant unemployment and job loss. This report does not analyze economic cycles, and the improved economy presents an opportunity to reexamine award parameters. Other focus areas could include:
• A deeper analysis of the types and quality of jobs created or retained, and whether some or all of the related economic activity would have happened with lower or no incentives.
• A comprehensive best practices review, assessing incentive programs available in other states. • A review of the overall impact of the reduction in Corporate Business Tax revenues (which
would be made up for by higher Gross Income Tax from created or retained jobs) given the constitutional requirement that the Gross Income Tax fund property tax relief while the Corporate Business Tax and Insurance Premium Tax are the primary resources for the General Fund.
As part of your economic development strategy for the State, the EDA will be reviewing best practices related to incentive structure and administration in competitor states. As you have stated, given the increasingly competitive environment, incentives must be part of New Jersey’s economic development toolkit, and they must be a tool to accomplish an overarching strategy of sustainable growth We thank the dedicated team at the Edward J. Bloustein School of Planning and Public Policy at Rutgers University for their efforts related to the Grow NJ and ERG analysis, and we look forward to a continuing dialogue with you and the Legislature as we work to make New Jersey’s economy stronger and fairer. Sincerely,
Tim Sullivan Chief Executive Officer New Jersey Economic Development Authority
Review of Grow New Jersey and Economic
Redevelopment and Growth Programs
Submitted to:
New Jersey Economic Development Authority
July 2018
Will Irving
Michael L. Lahr
Ray Caprio
Edward J. Bloustein School of Planning and Public Policy
Rutgers, The State University of New Jersey
Contents
Executive Summary .................................................................................................................. i
Introduction .............................................................................................................................. 1
Grow NJ Program Description ................................................................................................. 2
Review of Grow NJ Awards ...................................................................................................... 5
Distribution of Awards by Base Award and Geography ...................................................... 5
Distribution of Awards by Project/Firm Size ......................................................................11
Distribution of Awards by Award Size ................................................................................13
Distribution of Awards by Capital Expenditure .................................................................14
Credits Issued to Date .........................................................................................................16
Job Creation/Retention and Costs Per Job .............................................................................18
Bonus Categories .....................................................................................................................26
Target-Industry Bonus ........................................................................................................31
Issue #1: Several bonus categories are seldom or never used. ...........................................32
Issue #2: Transit-Oriented Development (TOD) Bonus Redundancy ................................33
Issue #3: Large Job Creators Bonus Redundancy ..............................................................34
Issue #4: Deep Poverty Pocket Redundancy .......................................................................35
Issue #5: MRI data needs updating.....................................................................................35
Use of Benefit-Cost Test In Award Evaluations .....................................................................36
Benefit-Cost Analysis Thresholds .......................................................................................37
Technical Parameters and Inputs for Benefit-Cost Analyses ............................................41
ERG Program Description .......................................................................................................45
Analysis of Commercial ERG Awards .....................................................................................45
Bonus Share of Award Costs ...............................................................................................48
Issue #1: Benefit-Cost Framework ......................................................................................48
Issue #2: Internal Rates of Return ......................................................................................49
Issue #3: Multi-Phase Projects ............................................................................................50
Analysis of Residential ERG Awards ......................................................................................51
Credits Issued to Date .........................................................................................................55
Bonus Share of Total Awards ..............................................................................................55
Issue #1: Limited Geographic Distribution .........................................................................55
Issue #2: Inclusion of Non-Residential Awards ..................................................................57
Issue #3: Construction Employment ...................................................................................57
Issue #4: Affordable Housing – Redundancy/Ambiguity in Program Rules.......................58
Appendix I: Definitions of Base Award and Bonus Categories ..............................................59

Appendix II: Grow New Jersey Awards by County/Municipality ..........................................66
Appendix III: Grow New Jersey Costs Per Job .......................................................................69
Appendix IV: Benefit-Cost Recommendations Memorandum ................................................71
Appendix V: Estimation of Tax Revenues in the Benefit-Cost Model ....................................74
Appendix VI: Alternative Benefit-Cost Model Parameters .................................................. 106
Appendix VII: Industry Operating Surplus to Compensation Ratios .................................. 107
i
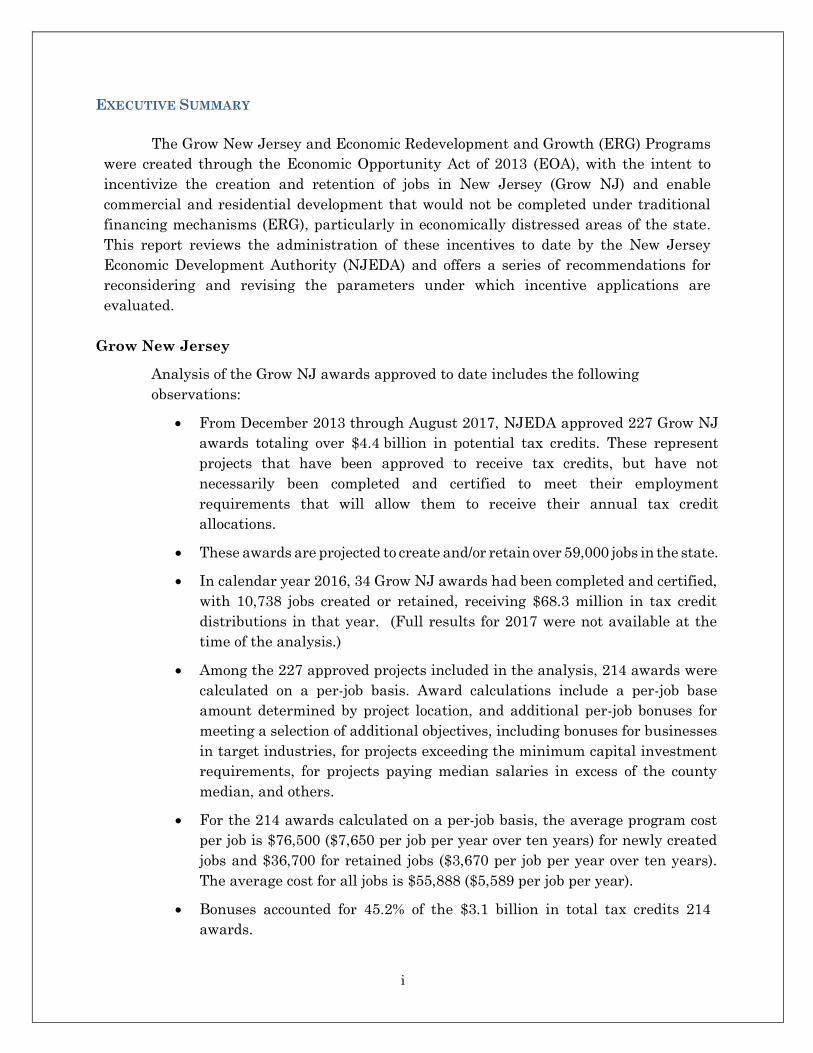
EXECUTIVE SUMMARY
The Grow New Jersey and Economic Redevelopment and Growth (ERG) Programs
were created through the Economic Opportunity Act of 2013 (EOA), with the intent to
incentivize the creation and retention of jobs in New Jersey (Grow NJ) and enable
commercial and residential development that would not be completed under traditional
financing mechanisms (ERG), particularly in economically distressed areas of the state.
This report reviews the administration of these incentives to date by the New Jersey
Economic Development Authority (NJEDA) and offers a series of recommendations for
reconsidering and revising the parameters under which incentive applications are
evaluated.
Grow New Jersey
Analysis of the Grow NJ awards approved to date includes the following
observations:
From December 2013 through August 2017, NJEDA approved 227 Grow NJ
awards totaling over $4.4 billion in potential tax credits. These represent
projects that have been approved to receive tax credits, but have not
necessarily been completed and certified to meet their employment
requirements that will allow them to receive their annual tax credit
allocations.
These awards are projected to create and/or retain over 59,000 jobs in the state.
In calendar year 2016, 34 Grow NJ awards had been completed and certified,
with 10,738 jobs created or retained, receiving $68.3 million in tax credit
distributions in that year. (Full results for 2017 were not available at the
time of the analysis.)
Among the 227 approved projects included in the analysis, 214 awards were
calculated on a per-job basis. Award calculations include a per-job base
amount determined by project location, and additional per-job bonuses for
meeting a selection of additional objectives, including bonuses for businesses
in target industries, for projects exceeding the minimum capital investment
requirements, for projects paying median salaries in excess of the county
median, and others.
For the 214 awards calculated on a per-job basis, the average program cost
per job is $76,500 ($7,650 per job per year over ten years) for newly created
jobs and $36,700 for retained jobs ($3,670 per job per year over ten years).
The average cost for all jobs is $55,888 ($5,589 per job per year).
Bonuses accounted for 45.2% of the $3.1 billion in total tax credits 214
awards.
ii
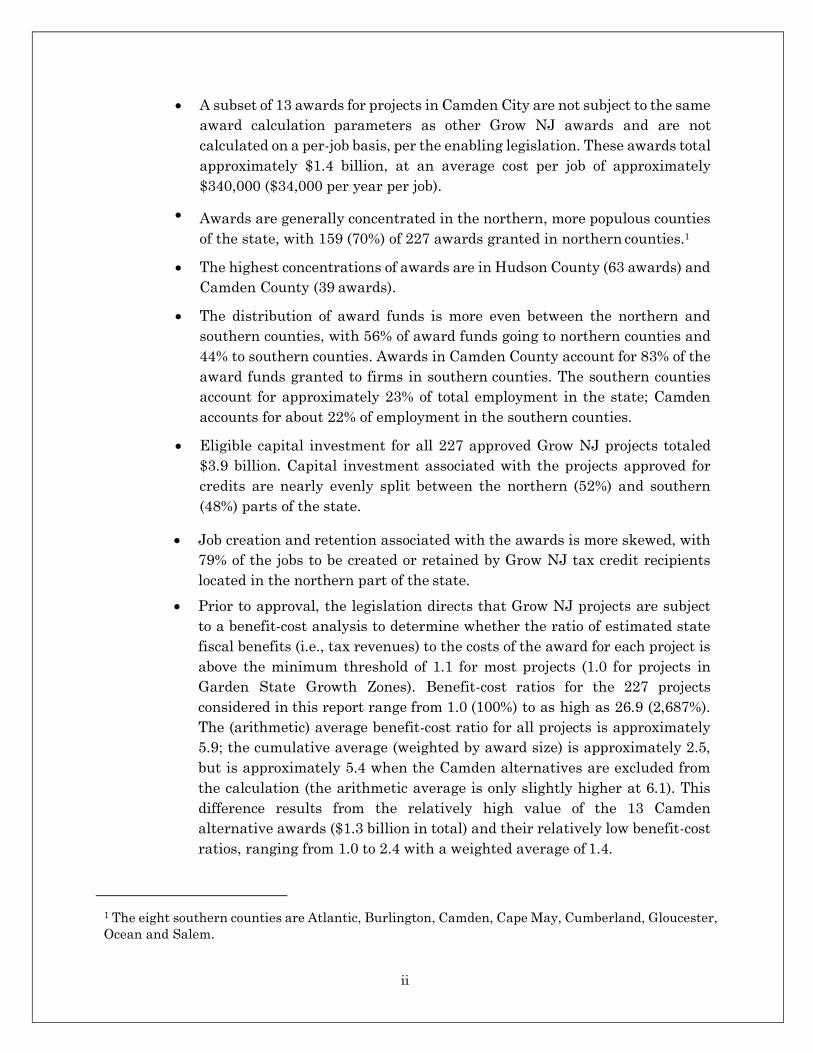
A subset of 13 awards for projects in Camden City are not subject to the same
award calculation parameters as other Grow NJ awards and are not
calculated on a per-job basis, per the enabling legislation. These awards total
approximately $1.4 billion, at an average cost per job of approximately
$340,000 ($34,000 per year per job).
Awards are generally concentrated in the northern, more populous counties
of the state, with 159 (70%) of 227 awards granted in northern counties.1
The highest concentrations of awards are in Hudson County (63 awards) and
Camden County (39 awards).
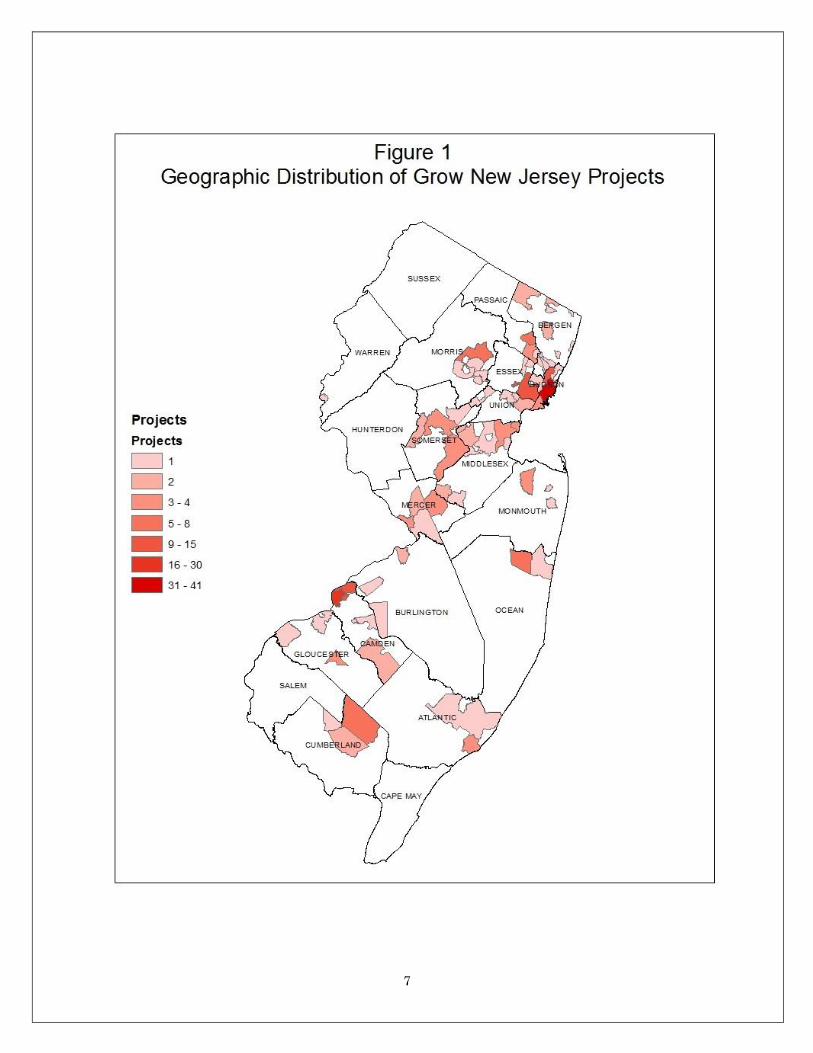
The distribution of award funds is more even between the northern and
southern counties, with 56% of award funds going to northern counties and
44% to southern counties. Awards in Camden County account for 83% of the
award funds granted to firms in southern counties. The southern counties
account for approximately 23% of total employment in the state; Camden
accounts for about 22% of employment in the southern counties.
Eligible capital investment for all 227 approved Grow NJ projects totaled
$3.9 billion. Capital investment associated with the projects approved for
credits are nearly evenly split between the northern (52%) and southern
(48%) parts of the state.
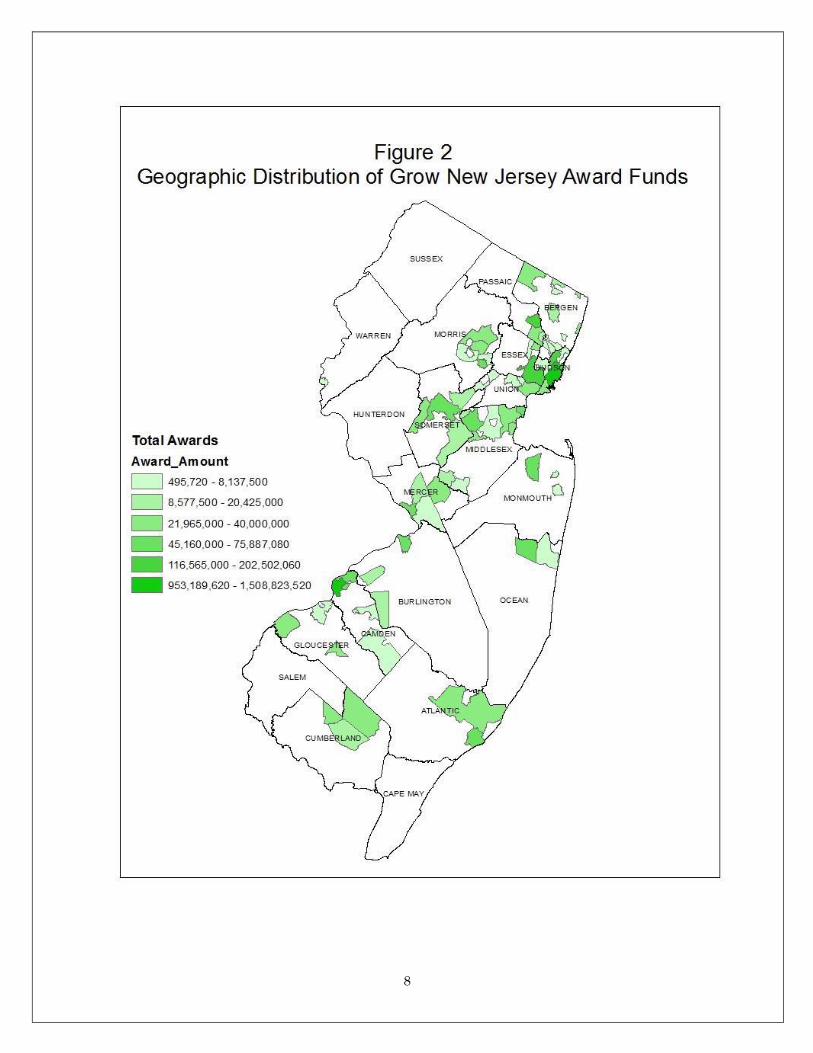
Job creation and retention associated with the awards is more skewed, with
79% of the jobs to be created or retained by Grow NJ tax credit recipients
located in the northern part of the state.
Prior to approval, the legislation directs that Grow NJ projects are subject
to a benefit-cost analysis to determine whether the ratio of estimated state
fiscal benefits (i.e., tax revenues) to the costs of the award for each project is
above the minimum threshold of 1.1 for most projects (1.0 for projects in
Garden State Growth Zones). Benefit-cost ratios for the 227 projects
considered in this report range from 1.0 (100%) to as high as 26.9 (2,687%).
The (arithmetic) average benefit-cost ratio for all projects is approximately
5.9; the cumulative average (weighted by award size) is approximately 2.5,
but is approximately 5.4 when the Camden alternatives are excluded from
the calculation (the arithmetic average is only slightly higher at 6.1). This
difference results from the relatively high value of the 13 Camden
alternative awards ($1.3 billion in total) and their relatively low benefit-cost
ratios, ranging from 1.0 to 2.4 with a weighted average of 1.4.
1 The eight southern counties are Atlantic, Burlington, Camden, Cape May, Cumberland, Gloucester,
Ocean and Salem.
iii
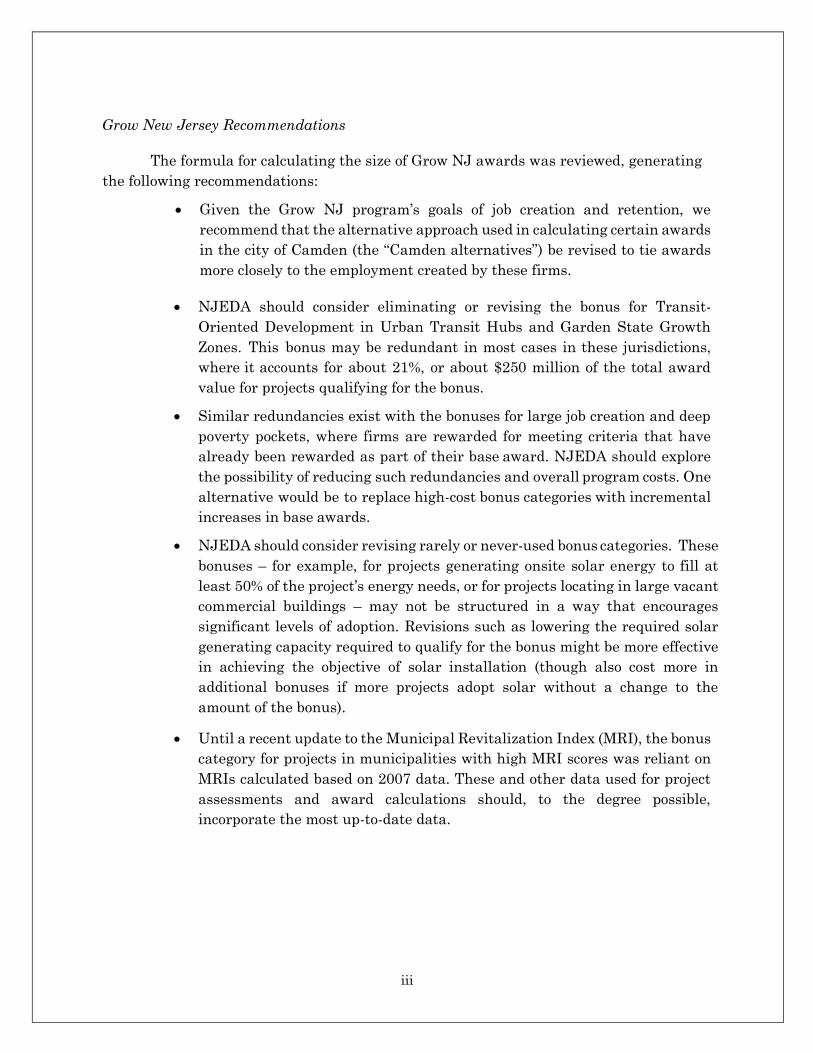
Grow New Jersey Recommendations
The formula for calculating the size of Grow NJ awards was reviewed, generating
the following recommendations:
Given the Grow NJ program’s goals of job creation and retention, we
recommend that the alternative approach used in calculating certain awards
in the city of Camden (the “Camden alternatives”) be revised to tie awards
more closely to the employment created by these firms.
NJEDA should consider eliminating or revising the bonus for Transit-
Oriented Development in Urban Transit Hubs and Garden State Growth
Zones. This bonus may be redundant in most cases in these jurisdictions,
where it accounts for about 21%, or about $250 million of the total award
value for projects qualifying for the bonus.
Similar redundancies exist with the bonuses for large job creation and deep
poverty pockets, where firms are rewarded for meeting criteria that have
already been rewarded as part of their base award. NJEDA should explore
the possibility of reducing such redundancies and overall program costs. One
alternative would be to replace high-cost bonus categories with incremental
increases in base awards.
NJEDA should consider revising rarely or never-used bonus categories. These
bonuses – for example, for projects generating onsite solar energy to fill at
least 50% of the project’s energy needs, or for projects locating in large vacant
commercial buildings – may not be structured in a way that encourages
significant levels of adoption. Revisions such as lowering the required solar
generating capacity required to qualify for the bonus might be more effective
in achieving the objective of solar installation (though also cost more in
additional bonuses if more projects adopt solar without a change to the
amount of the bonus).
Until a recent update to the Municipal Revitalization Index (MRI), the bonus
category for projects in municipalities with high MRI scores was reliant on
MRIs calculated based on 2007 data. These and other data used for project
assessments and award calculations should, to the degree possible,
incorporate the most up-to-date data.
iv
The benefit-cost framework and the benefit-cost model used in determining award
eligibility were reviewed in detail.
We recommend considering a higher approval threshold for the benefit-cost
test to acknowledge the possibility that firms may have moved to or remained
in the state even in the absence of the award. A higher benefit-cost approval
threshold would either reduce the number of awards granted or effectively
impose lower caps on calculated awards.
Review of the benefit-cost calculations used in award determinations for both
Grow and ERG projects revealed several areas in which we believe the
benefit-cost analysis methodology should be revised.
The technical aspects of these changes are explained in detail in the text.
While some of the proposed changes would reduce the calculated benefits for
certain projects, others could result in increases in calculated benefits or
reductions in calculated costs. The recommendations include:
o Using state-level economic multipliers rather than county-level in
calculating project benefits. While county-level multipliers can in
some cases result in more conservative benefit estimates, the use of
these multipliers can distort estimates of economic impacts in
certain contexts. Whether this change results in an increase or
decrease in the calculated benefits for any given project will depend
on the county and industry of the project.
o Eliminating local property taxes from the calculation of benefits in
cases where capital improvements are property tax exempt. This
will result in a reduction in the benefit-cost ratios calculated for
those projects.
o Replacing per-job profits estimates in the estimation of Corporation
Business Taxes (CBT) with the most recent data on compensation
and operating surplus from the U.S. Bureau of Economic Analysis.
This will provide a more direct approach to estimating taxable
corporate income, based on consistently measured, regularly
updated data. NJEDA now solicits documentation of past corporate
tax payments (in New Jersey or other states) directly from the
applicant, and uses this information as the basis for estimating
future CBT obligations. The new approach we recommend can be
used as a point of comparison to further verify the estimates based
on past payments.
v
Economic Redevelopment and Growth
Analysis of the ERG awards approved to date includes the following observations:
From January 2014 through April 2018, NJEDA has approved 50 ERG
commercial (10), residential (38) and parking (2) awards totaling
approximately $1 billion.
Approved commercial awards total $340.2 million, representing
approximately 21% of the eligible capital investment for these projects.
Awards approved for commercial projects range from $1.3 million to $223.3
million, accounting for between 9.5% and 36.4% of total project costs.
One single multi-phase project – a $1 billion mixed-use waterfront project in
Sayreville – accounts for 62% of the total approved commercial awards (no
credits have yet been issued as the project has not yet commenced).
Approved awards for residential projects total approximately $649.1 million,
representing approximately 29% of total eligible capital investment.
The 38 residential awards are distributed across 14 municipalities in ten
counties and range in size from $2.7 million to $40 million.
Approximately 48% of the 7,814 residential units to be created by approved
ERG-assisted projects are slated to be affordable units.
In 2016, a total of approximately $8 million in credits was issued for five
projects. (Full results for 2017 were not available at the time of the analysis.)
Economic Redevelopment and Growth Recommendations
Commercial ERG projects are assessed using a benefit-cost framework
similar to that used for Grow NJ awards. In the case of certain types of
commercial development, inclusion of state tax revenues in the analysis of
prospective benefits may not be appropriate, as development in areas outside
the incentivized locations may have been pursued absent the award. In such
cases, state tax revenues do not necessarily represent a net return to the
state. NJEDA should consider additional alternative metrics for evaluating
the viability and benefit of commercial projects.
Another metric of analysis used in assessing the financing needs of
commercial projects is the internal rate of return (IRR) on equity for the
project developer. It is not clear that the increase in IRR conditioned on the
ERG awards is a transparent and meaningful measure of project viability,
though it appears to be used for this purpose in project evaluations. NJEDA
should provide more information about how the IRR calculation informs the
vi
evaluation for each project.
The geographic distribution of funding for residential ERG projects is highly
concentrated in a small number of cities due to legislated funding allocations
and program rules. Adopting a more comprehensive rubric of criteria for
determining residential funding priorities could allow for distribution of
funds to a broader range of areas in need of redevelopment in a manner
consistent with NJEDA’s residential project financing objectives.
Several awards made under the auspices of the residential ERG program are
not residential developments (e.g., $25 million for development of athletic
facilities at Rutgers University). While such awards are consistent with
legislative funding allocations under the program, future programs should
seek to clearly delineate and evaluate projects by type, as potential
differences in evaluation parameters, project goals, economic outcomes and
program purposes suggest that a separate classification and/or approach is
warranted.
NJEDA should clarify the rules and data reporting regarding the
affordable housing requirement. The rules appear to offer bonus
financing for projects that reserve 10% of units for low- and moderate-
income families, while at the same time stipulating that, unless
otherwise exempt, projects must include at least 20% affordable units. If
the development of affordable housing is considered a key objective of the
program, additional financing for projects that surpass the minimum
20% requirement would be a reasonable stipulation, but it is not clear
whether the funding is being allocated in this way.
1
INTRODUCTION
The purpose of this report is to provide an analysis of the Grow New Jersey (Grow NJ)
and ERG (Economic Redevelopment and Growth) tax incentive programs established by the
Economic Opportunity Act of 2013 (EOA) and administered by the New Jersey Economic
Development Authority (NJEDA).2
The report has four main objectives as initially determined in agreement with NJEDA in
March 2016:
1) To review and present the distribution of awards by geography, award type, size and
other parameters.
2) To evaluate and analyze the general qualifying parameters – base awards and bonus
categories – of the awards, and offer observations and/or recommendations regarding
their efficiency and effectiveness.
3) To examine the parameters of the benefit-cost model used by EDA for evaluating
award applications and make recommendations for revisions where indicated.
4) To review and evaluate the economic impact estimates used in assessing the benefits
for ERG projects and compare them to results of an alternative state model.
The first section of the report covers the Grow New Jersey program. The section begins
with a brief review of the Grow NJ program and its parameters. This is followed by a review
of the Grow NJ tax credit awards approved to date, including breakdowns by geography,
award size and employment. A review of Grow NJ bonus categories is provided, including
observations and recommendations regarding costs and use of bonuses. This is followed by a
discussion of the benefit-cost test and associated model used in analyzing Grow NJ awards and
ERG awards for commercial projects. (An appendix provides a detailed analysis of the benefit-
cost model and recommendations for revisions, with examples demonstrating the effect of
proposed changes to the modeling process.) The final section of the report examines the
Economic Redevelopment and Growth program, including the geographic distribution of
awards made for commercial and residential projects, project evaluation criteria, and the
estimated employment impacts associated with capital investment for the residential
projects.
2 This report covers Grow New Jersey and ERG awards approved following passage of the NJ Economic
Opportunity Act (NJEOA) in 2013. Prior to that, the Grow New Jersey Program was administered
pursuant to the Grow New Jersey Assistance Act of 2011," P.L. 2011, c. 149, enacted on January 5,
2012. Under this iteration of the Grow New Jersey Program (referred to as “Legacy Grow New
Jersey”), EDA approved 18 projects for $529,731,293 based on the estimated creation of 2,523 new jobs
and 6,685 retained jobs. The Economic Redevelopment and Growth (ERG) Program was first
administered pursuant to the New Jersey Economic Stimulus Act of 2009, P.L. 2009, c. 90., enacted in
July 2009. Under this iteration of the ERG Program (referred to as “Legacy ERG”), EDA approved 16
projects for $551,640,889 based on total eligible capital investment of over $4,009,319,678.
2
GROW NJ PROGRAM DESCRIPTION
The Grow NJ program was intended by the EOA to incentivize companies to locate or
remain in areas of the state identified as “Qualified Incentive Areas,” including Urban Transit
Hubs, Garden State Growth Zones, Distressed Municipalities, and other designated areas
prioritized for development. Applicants must meet minimum employment, capital investment
and green building requirements and other thresholds to qualify for the incentives, and
proposed projects must pass a benefit-cost test. The company CEO must also attest that the
award constitutes a “material factor” in the firm’s decision to remain/locate in New Jersey.
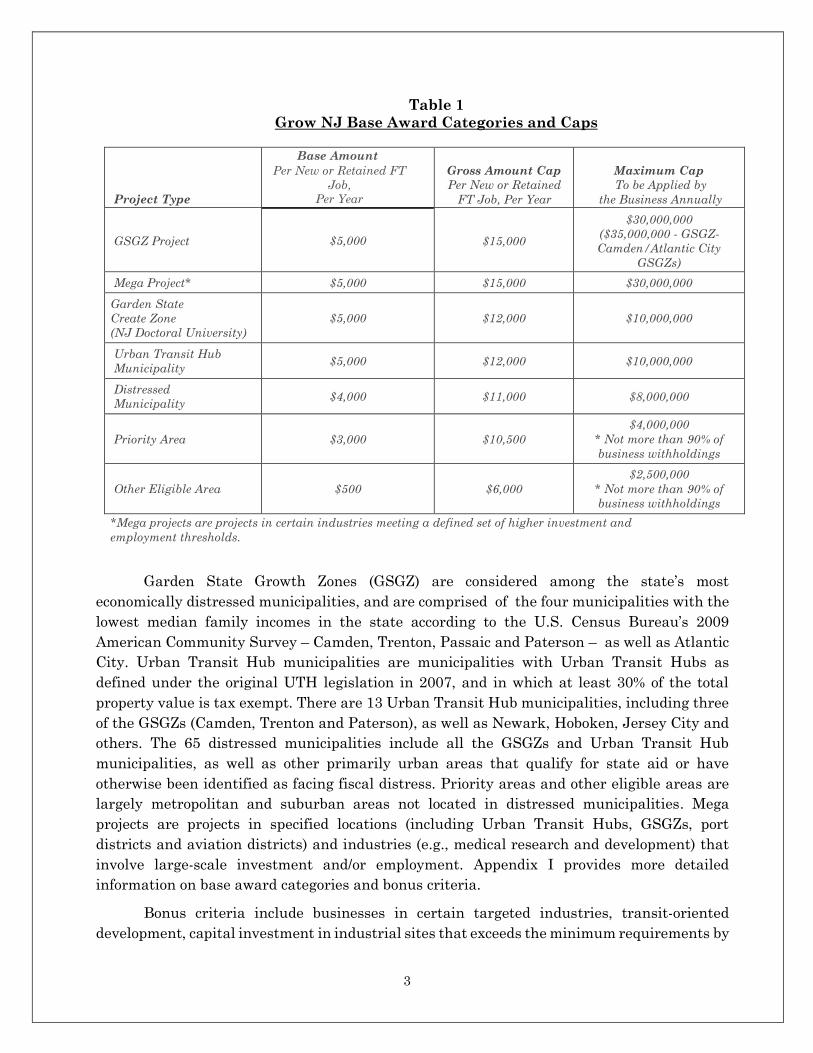
The value of the incentive offered is in most cases calculated based on the number of
jobs created and/or retained in the state by the company. Incentives are granted in the form of
transferrable credits against the corporation business tax and insurance premiums tax. For
each job created and/or retained each year, the award consists of a base amount determined
by the project’s location in a Qualified Incentive Area and in some cases its size, along with
additional per-job bonuses for projects meeting a variety of criteria. The base awards range
from $500 to $5,000 per new or retained job, depending on the location/project type. These base
awards are summarized in Table 1, excerpted from the NJEDA program materials.
SUMMARY
This section provides a detailed description of the Grow NJ program. Because project
completion and certification has not yet reached a significant level, it is difficult to judge the
overall program results based only on the projects that have already created jobs and
received tax credits. As more projects reach completion, future analysis can determine if
employment objectives and projects are meeting program requirements. Findings from a
review of the program include the following:
Urban-focused base awards account for approximately half of the potential job
creation/retention of the Grow NJ program and about 70% of the total dollar
value of awards.
Awards to firms remaining in the state were concentrated among those
retaining 200 jobs or fewer (84 of 131 awards), accounting for approximately
7,328 jobs.
In total, the 11,535 new jobs planned by in-state firms receiving Grow NJ
awards represent 40% of the 28,670 total new jobs to be created by 227 Grow
NJ awards covered by this report.
Of the 227 total awards, 210 are valued at less than $40 million, the cutoff
after which awards are subject to adjustment based on the funding gap
between the New Jersey project site and an alternative site out of state. Of the
17 awards over $40 million, 12 are Camden alternatives and thus not subject
to that limitation.
3
Table 1
Grow NJ Base Award Categories and Caps
Project Type
Base Amount
Per New or Retained FT
Job,
Per Year
Gross Amount Cap
Per New or Retained
FT Job, Per Year
Maximum Cap
To be Applied by
the Business Annually
GSGZ Project
$5,000
$15,000
$30,000,000
($35,000,000 - GSGZ-
Camden/Atlantic City
GSGZs)
Mega Project* $5,000 $15,000 $30,000,000
Garden State
Create Zone
(NJ Doctoral University)
$5,000
$12,000
$10,000,000
Urban Transit Hub
Municipality $5,000 $12,000 $10,000,000
Distressed
Municipality $4,000 $11,000 $8,000,000
Priority Area
$3,000
$10,500
$4,000,000
* Not more than 90% of
business withholdings
Other Eligible Area
$500
$6,000
$2,500,000
* Not more than 90% of
business withholdings
*Mega projects are projects in certain industries meeting a defined set of higher investment and
employment thresholds.
Garden State Growth Zones (GSGZ) are considered among the state’s most
economically distressed municipalities, and are comprised of the four municipalities with the
lowest median family incomes in the state according to the U.S. Census Bureau’s 2009
American Community Survey – Camden, Trenton, Passaic and Paterson – as well as Atlantic
City. Urban Transit Hub municipalities are municipalities with Urban Transit Hubs as
defined under the original UTH legislation in 2007, and in which at least 30% of the total
property value is tax exempt. There are 13 Urban Transit Hub municipalities, including three
of the GSGZs (Camden, Trenton and Paterson), as well as Newark, Hoboken, Jersey City and
others. The 65 distressed municipalities include all the GSGZs and Urban Transit Hub
municipalities, as well as other primarily urban areas that qualify for state aid or have
otherwise been identified as facing fiscal distress. Priority areas and other eligible areas are
largely metropolitan and suburban areas not located in distressed municipalities. Mega
projects are projects in specified locations (including Urban Transit Hubs, GSGZs, port
districts and aviation districts) and industries (e.g., medical research and development) that
involve large-scale investment and/or employment. Appendix I provides more detailed
information on base award categories and bonus criteria.
Bonus criteria include businesses in certain targeted industries, transit-oriented
development, capital investment in industrial sites that exceeds the minimum requirements by
4
20% or more, solar energy generation, and others. Most awards are calculated over a ten- year
horizon, and firms can claim one-tenth of the total award as a credit against their Corporate
Business Tax and Insurance Premiums Tax obligations. The credits are not refundable, but
are transferrable at a price no less than 75% of their value.
Certain minimum requirements are relaxed and award incentives increased for projects
in Garden State Growth Zones (Atlantic City, Camden, Passaic, Paterson and Trenton) and in
any area of eight South Jersey counties: Atlantic, Burlington, Camden, Cape May, Cumberland,
Gloucester, Ocean and Salem. Projects in these areas have their minimum employment
requirements reduced by one quarter and their capital investment requirements reduced by
one-third. For projects in these areas, awards for new and retained jobs are equal to 100% of
the calculated per-job amount. For projects outside these areas, the award per retained job is
equal to the lesser of 50% of the calculated amount for new jobs or the capital investment
divided by 10 divided by the total number of new and retained jobs. In addition, projects
meeting a set of new employment and capital investment thresholds in Camden are eligible
for awards calculated on the basis of their capital investment, rather than on a per- job basis.
Award applications are initially analyzed to determine whether there is in fact a cost
differential between the proposed New Jersey site and an alternative project site outside the
state. In most cases, projects that demonstrate that costs in New Jersey would be significantly
higher than in the alternative location are then evaluated using a cost-benefit model developed
by an outside contractor (Jones Lange LaSalle) for NJEDA. The model weighs the future fiscal
benefits of the project in terms of state and local tax revenues generated by the project (business
taxes and the income taxes generated by the jobs created/retained by the project) over a
designated time horizon against the annual value of the tax credit. For award applications
approved for $40 million ($4 million per year) or more, EDA determines an award amount
between the calculated per-job award and the amount required to make up the cost differential
between the New Jersey site and the alternative site. Approved awards remain active for four
years. If a project has not been completed and received certification of its employment within
four years of approval, the award is cancelled.
5
REVIEW OF GROW NJ AWARDS
This review comprises a total of 227 awards approved for 224 companies between
December 2013 and August 2017.3 The total cost of these awards is estimated at approximately
$4.4 billion, and they are estimated to retain or create approximately 59,200 jobs, generally
over a ten-year period for most awards, and facilitate capital investment of $3.9 billion. It
should be noted that the awards described in this section and the subsequent analysis
represent the currently active awards approved over the December 2013-August 2017 period.
As of 2016, 34 of these awards – or about 15% – had been completed and certified, with tax
credits issued. Because project completion and certification has not yet reached a significant
level, it is difficult to judge the overall program results based only on projects that have already
created jobs and received tax credits. As such, the description and analysis of awards in terms
of geographic distribution, jobs created or retained, costs per job, and other parameters
includes all approved awards. As the completion of projects approved from 2016 and 2017 is
tracked, it will become clearer whether the program is achieving its employment objectives
and the extent to which projects are meeting their program requirements.
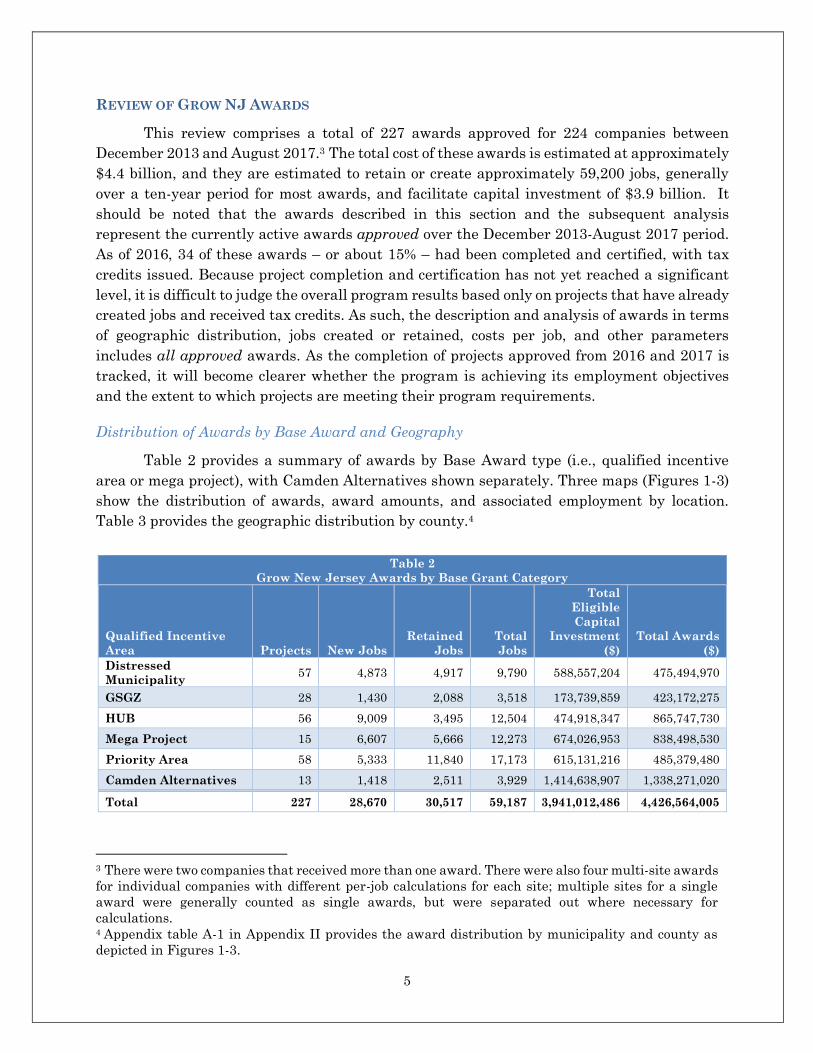
Distribution of Awards by Base Award and Geography
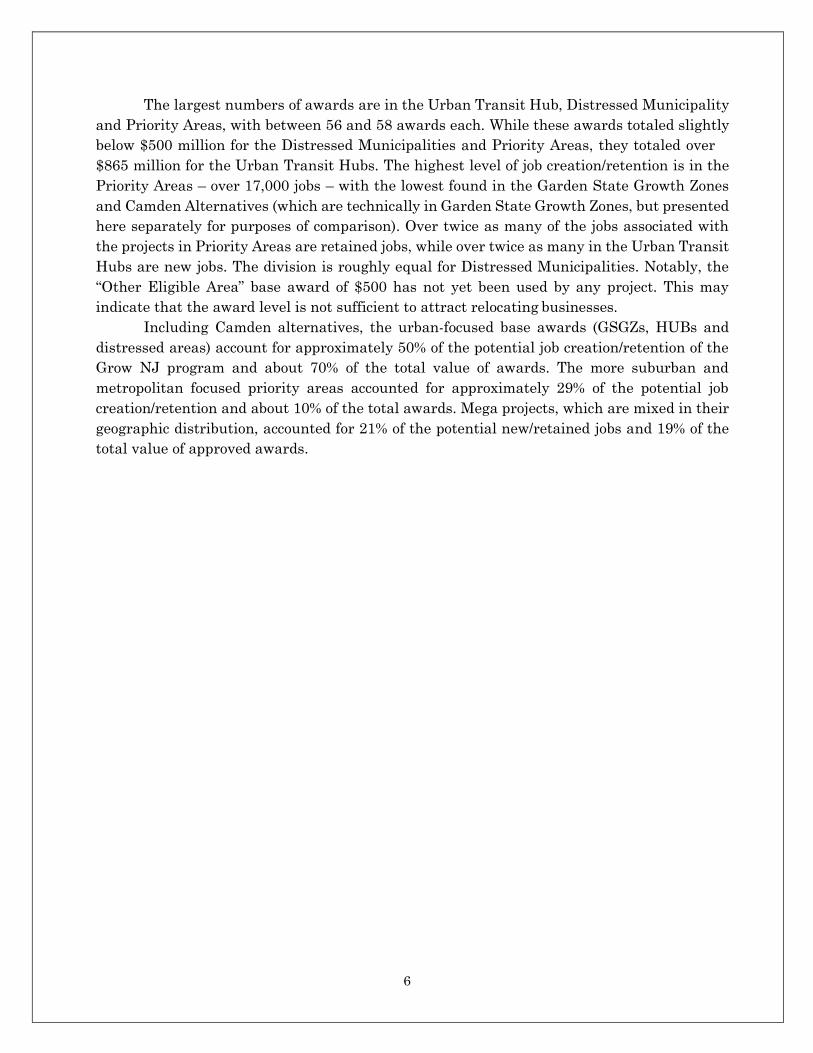
Table 2 provides a summary of awards by Base Award type (i.e., qualified incentive
area or mega project), with Camden Alternatives shown separately. Three maps (Figures 1-3)
show the distribution of awards, award amounts, and associated employment by location.
Table 3 provides the geographic distribution by county.4
Table 2
Grow New Jersey Awards by Base Grant Category
Qualified Incentive
Area Projects New Jobs
Retained
Jobs
Total
Jobs
Total
Eligible
Capital
Investment
($)
Total Awards
($)
Distressed
Municipality 57 4,873 4,917 9,790 588,557,204 475,494,970
GSGZ 28 1,430 2,088 3,518 173,739,859 423,172,275
HUB 56 9,009 3,495 12,504 474,918,347 865,747,730
Mega Project 15 6,607 5,666 12,273 674,026,953 838,498,530
Priority Area 58 5,333 11,840 17,173 615,131,216 485,379,480
Camden Alternatives 13 1,418 2,511 3,929 1,414,638,907 1,338,271,020
Total 227 28,670 30,517 59,187 3,941,012,486 4,426,564,005
3 There were two companies that received more than one award. There were also four multi-site awards
for individual companies with different per-job calculations for each site; multiple sites for a single
award were generally counted as single awards, but were separated out where necessary for
calculations. 4 Appendix table A-1 in Appendix II provides the award distribution by municipality and county as
depicted in Figures 1-3.
6
The largest numbers of awards are in the Urban Transit Hub, Distressed Municipality
and Priority Areas, with between 56 and 58 awards each. While these awards totaled slightly
below $500 million for the Distressed Municipalities and Priority Areas, they totaled over
$865 million for the Urban Transit Hubs. The highest level of job creation/retention is in the
Priority Areas – over 17,000 jobs – with the lowest found in the Garden State Growth Zones
and Camden Alternatives (which are technically in Garden State Growth Zones, but presented
here separately for purposes of comparison). Over twice as many of the jobs associated with
the projects in Priority Areas are retained jobs, while over twice as many in the Urban Transit
Hubs are new jobs. The division is roughly equal for Distressed Municipalities. Notably, the
“Other Eligible Area” base award of $500 has not yet been used by any project. This may
indicate that the award level is not sufficient to attract relocating businesses.
Including Camden alternatives, the urban-focused base awards (GSGZs, HUBs and
distressed areas) account for approximately 50% of the potential job creation/retention of the
Grow NJ program and about 70% of the total value of awards. The more suburban and
metropolitan focused priority areas accounted for approximately 29% of the potential job
creation/retention and about 10% of the total awards. Mega projects, which are mixed in their
geographic distribution, accounted for 21% of the potential new/retained jobs and 19% of the
total value of approved awards.
7
8
9
10
Table 3
Distribution of Grow NJ Awards by County
County
Number of
Projects
Award
Amount ($)
New
Jobs
Retained
At Risk
Jobs
Total
Jobs
Total
Eligible
Capital
Investment
($)
Atlantic 5 85,609,015 656 210 866 77,046,684
Bergen 14 134,500,470 906 3,586 4,492 183,550,690
Burlington 4 73,972,030 841 715 1,556 70,424,229
Camden* 39 1,595,456,600 2,592 4,416 7,008 1,527,572,693
Cumberland 9 72,191,600 449 859 1,308 107,871,478
Essex 12 218,418,310 1,631 1,714 3,345 249,817,210
Essex/Passaic** 1 18,648,000 150 200 350 23,221,782
Gloucester 5 48,677,500 362 446 808 77,298,222
Hudson 63 1,262,463,170 12,371 6,905 19,276 667,005,420
Mercer 10 109,791,500 768 1,229 1,997 60,265,296
Middlesex 15 223,179,820 2,839 1,464 4,303 277,784,199
Middlesex/Somerset** 1 11,486,250 50 241 291 17,500,000
Monmouth 5 62,823,340 823 846 1,669 60,924,787
Morris 9 127,774,610 1,507 2,129 3,636 150,896,118
Ocean 6 53,484,020 515 566 1,081 23,884,110
Passaic 11 147,167,500 515 801 1,316 52,391,883
Passaic/Essex** 1 16,937,500 271 0 271 55,158,000
Somerset 9 110,797,470 858 3,486 4,344 171,356,002
Somerset/Bergen** 1 10,254,300 60 464 524 73,910,484
Union 6 41,881,000 492 240 732 12,333,199
Warren 1 1,050,000 14 0 14 800,000
Total 227 4,426,564,005 28,670 30,517 59,187 3,941,012,486
* Includes Camden alternatives. ** Projects with sites in multiple counties.
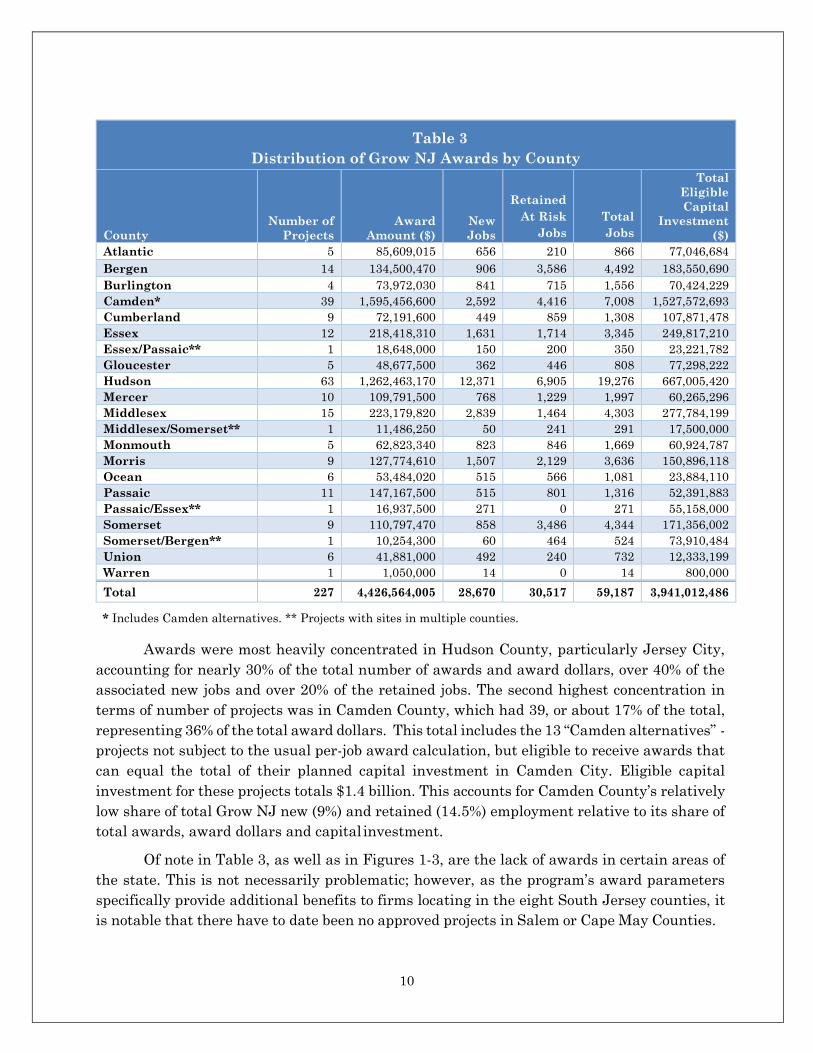
Awards were most heavily concentrated in Hudson County, particularly Jersey City,
accounting for nearly 30% of the total number of awards and award dollars, over 40% of the
associated new jobs and over 20% of the retained jobs. The second highest concentration in
terms of number of projects was in Camden County, which had 39, or about 17% of the total,
representing 36% of the total award dollars. This total includes the 13 “Camden alternatives” -
projects not subject to the usual per-job award calculation, but eligible to receive awards that
can equal the total of their planned capital investment in Camden City. Eligible capital
investment for these projects totals $1.4 billion. This accounts for Camden County’s relatively
low share of total Grow NJ new (9%) and retained (14.5%) employment relative to its share of
total awards, award dollars and capital investment.
Of note in Table 3, as well as in Figures 1-3, are the lack of awards in certain areas of
the state. This is not necessarily problematic; however, as the program’s award parameters
specifically provide additional benefits to firms locating in the eight South Jersey counties, it
is notable that there have to date been no approved projects in Salem or Cape May Counties.
11
Distribution of Awards by Project/Firm Size
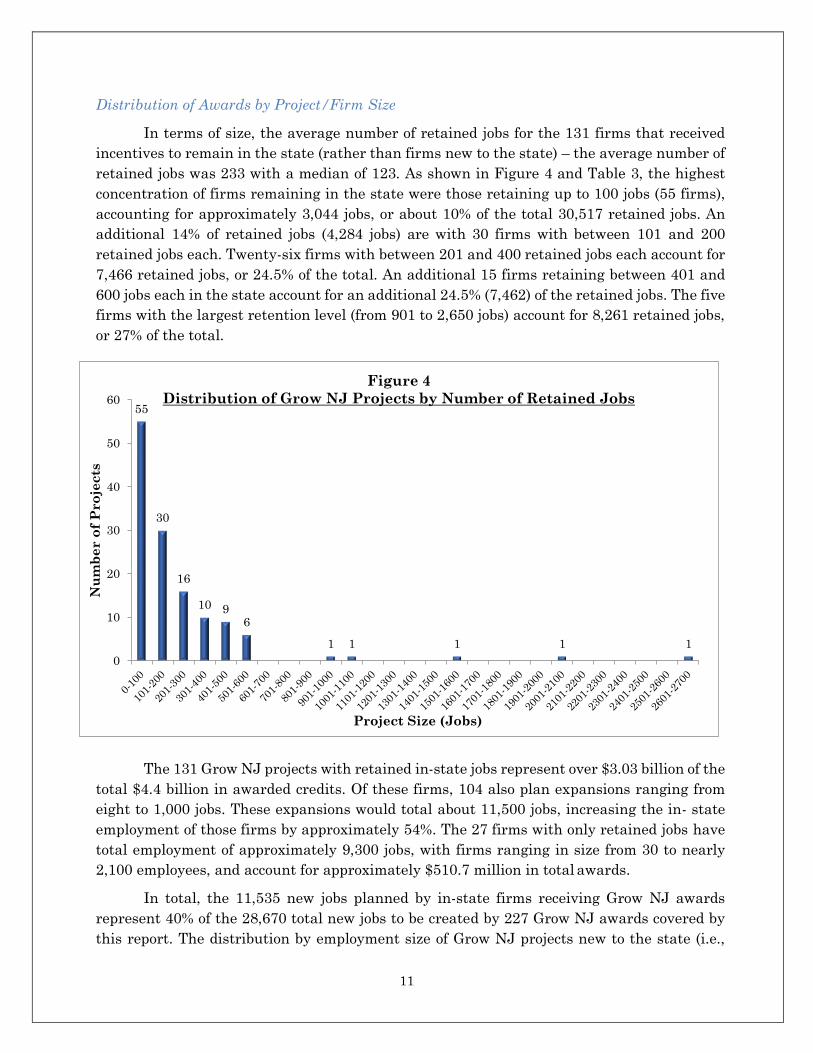
In terms of size, the average number of retained jobs for the 131 firms that received
incentives to remain in the state (rather than firms new to the state) – the average number of
retained jobs was 233 with a median of 123. As shown in Figure 4 and Table 3, the highest
concentration of firms remaining in the state were those retaining up to 100 jobs (55 firms),
accounting for approximately 3,044 jobs, or about 10% of the total 30,517 retained jobs. An
additional 14% of retained jobs (4,284 jobs) are with 30 firms with between 101 and 200
retained jobs each. Twenty-six firms with between 201 and 400 retained jobs each account for
7,466 retained jobs, or 24.5% of the total. An additional 15 firms retaining between 401 and
600 jobs each in the state account for an additional 24.5% (7,462) of the retained jobs. The five
firms with the largest retention level (from 901 to 2,650 jobs) account for 8,261 retained jobs,
or 27% of the total.
The 131 Grow NJ projects with retained in-state jobs represent over $3.03 billion of the
total $4.4 billion in awarded credits. Of these firms, 104 also plan expansions ranging from
eight to 1,000 jobs. These expansions would total about 11,500 jobs, increasing the in- state
employment of those firms by approximately 54%. The 27 firms with only retained jobs have
total employment of approximately 9,300 jobs, with firms ranging in size from 30 to nearly
2,100 employees, and account for approximately $510.7 million in total awards.
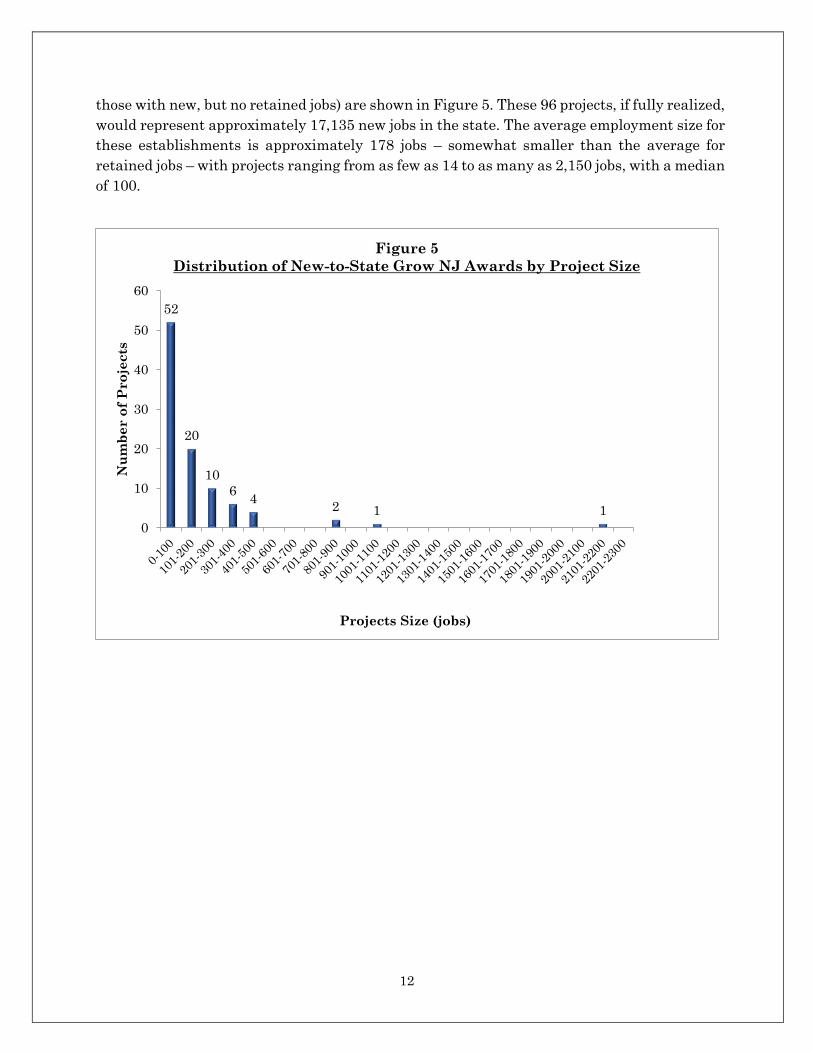
In total, the 11,535 new jobs planned by in-state firms receiving Grow NJ awards
represent 40% of the 28,670 total new jobs to be created by 227 Grow NJ awards covered by
this report. The distribution by employment size of Grow NJ projects new to the state (i.e.,
55
30
16
10 96
1 1 1 1 1
0
10
20
30
40
50
60
Nu
mb
er o
f P
ro
jects
Project Size (Jobs)
Figure 4
Distribution of Grow NJ Projects by Number of Retained Jobs
12
those with new, but no retained jobs) are shown in Figure 5. These 96 projects, if fully realized,
would represent approximately 17,135 new jobs in the state. The average employment size for
these establishments is approximately 178 jobs – somewhat smaller than the average for
retained jobs – with projects ranging from as few as 14 to as many as 2,150 jobs, with a median
of 100.
52
20
10
64
2 1 1
0
10
20
30
40
50
60
Nu
mb
er o
f P
ro
jects
Projects Size (jobs)
Figure 5
Distribution of New-to-State Grow NJ Awards by Project Size
13
Distribution of Awards by Award Size
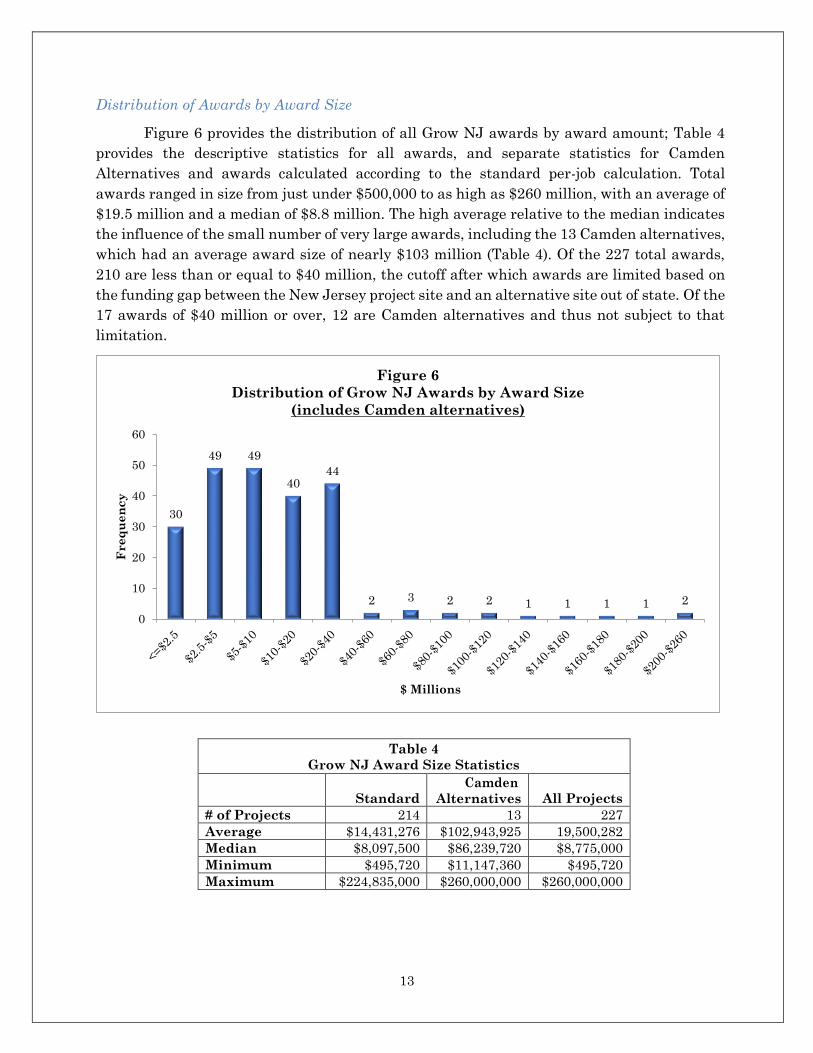
Figure 6 provides the distribution of all Grow NJ awards by award amount; Table 4
provides the descriptive statistics for all awards, and separate statistics for Camden
Alternatives and awards calculated according to the standard per-job calculation. Total
awards ranged in size from just under $500,000 to as high as $260 million, with an average of
$19.5 million and a median of $8.8 million. The high average relative to the median indicates
the influence of the small number of very large awards, including the 13 Camden alternatives,
which had an average award size of nearly $103 million (Table 4). Of the 227 total awards,
210 are less than or equal to $40 million, the cutoff after which awards are limited based on
the funding gap between the New Jersey project site and an alternative site out of state. Of the
17 awards of $40 million or over, 12 are Camden alternatives and thus not subject to that
limitation.
Table 4
Grow NJ Award Size Statistics
Standard Camden
Alternatives
All Projects # of Projects 214 13 227 Average $14,431,276 $102,943,925 19,500,282 Median $8,097,500 $86,239,720 $8,775,000 Minimum $495,720 $11,147,360 $495,720 Maximum $224,835,000 $260,000,000 $260,000,000
30
49 49
4044
2 3 2 2 1 1 1 1 2
0
10
20
30
40
50
60
Freq
uen
cy
$ Millions
Figure 6
Distribution of Grow NJ Awards by Award Size
(includes Camden alternatives)
14
Distribution of Awards by Capital Expenditure
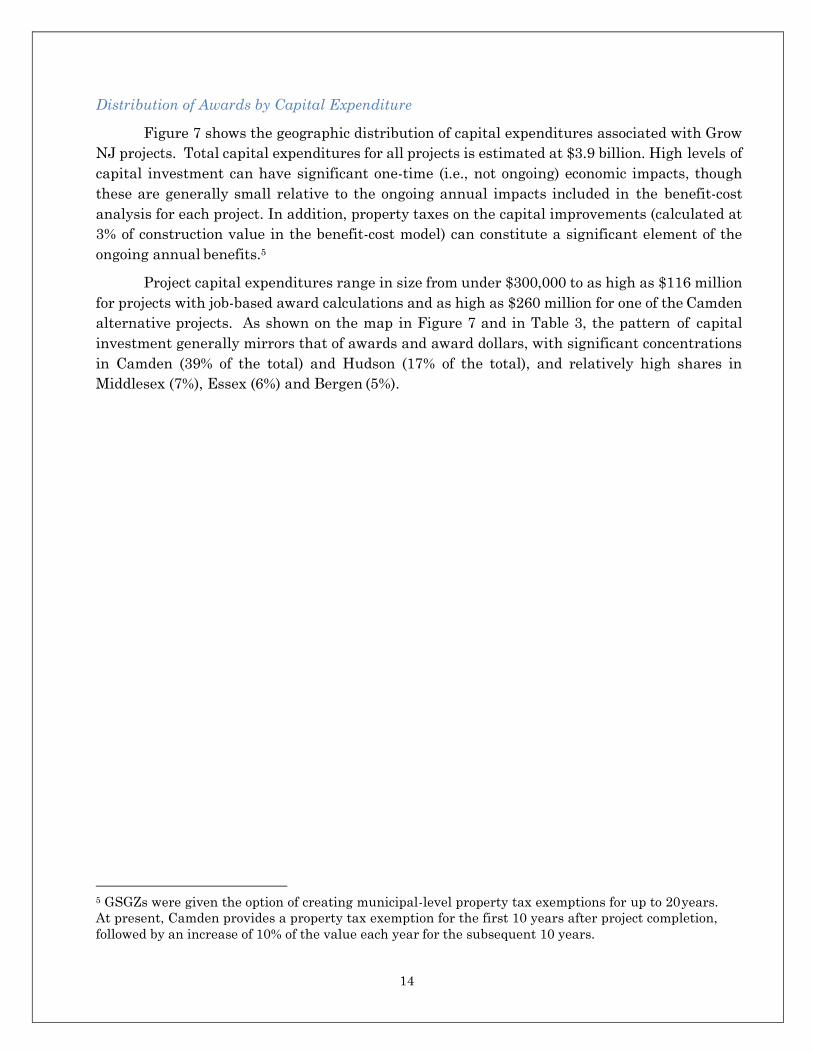
Figure 7 shows the geographic distribution of capital expenditures associated with Grow
NJ projects. Total capital expenditures for all projects is estimated at $3.9 billion. High levels of
capital investment can have significant one-time (i.e., not ongoing) economic impacts, though
these are generally small relative to the ongoing annual impacts included in the benefit-cost
analysis for each project. In addition, property taxes on the capital improvements (calculated at
3% of construction value in the benefit-cost model) can constitute a significant element of the
ongoing annual benefits.5
Project capital expenditures range in size from under $300,000 to as high as $116 million
for projects with job-based award calculations and as high as $260 million for one of the Camden
alternative projects. As shown on the map in Figure 7 and in Table 3, the pattern of capital
investment generally mirrors that of awards and award dollars, with significant concentrations
in Camden (39% of the total) and Hudson (17% of the total), and relatively high shares in
Middlesex (7%), Essex (6%) and Bergen (5%).
5 GSGZs were given the option of creating municipal-level property tax exemptions for up to 20 years.
At present, Camden provides a property tax exemption for the first 10 years after project completion,
followed by an increase of 10% of the value each year for the subsequent 10 years.
15
16
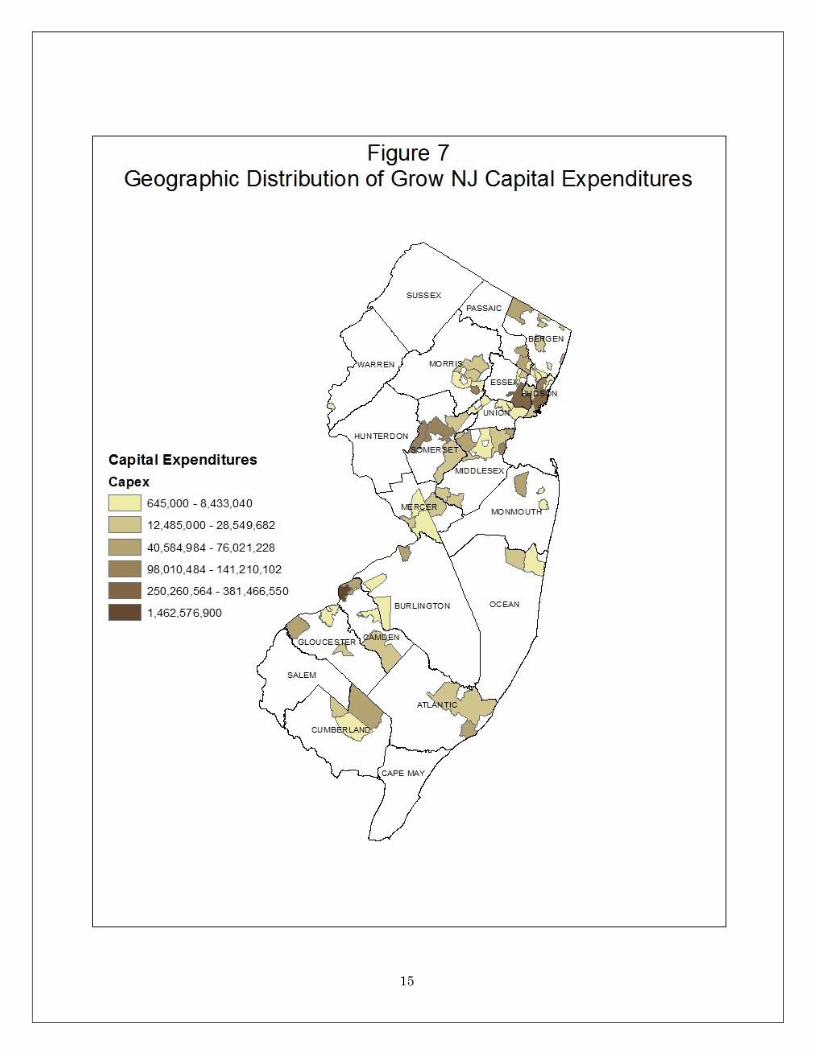
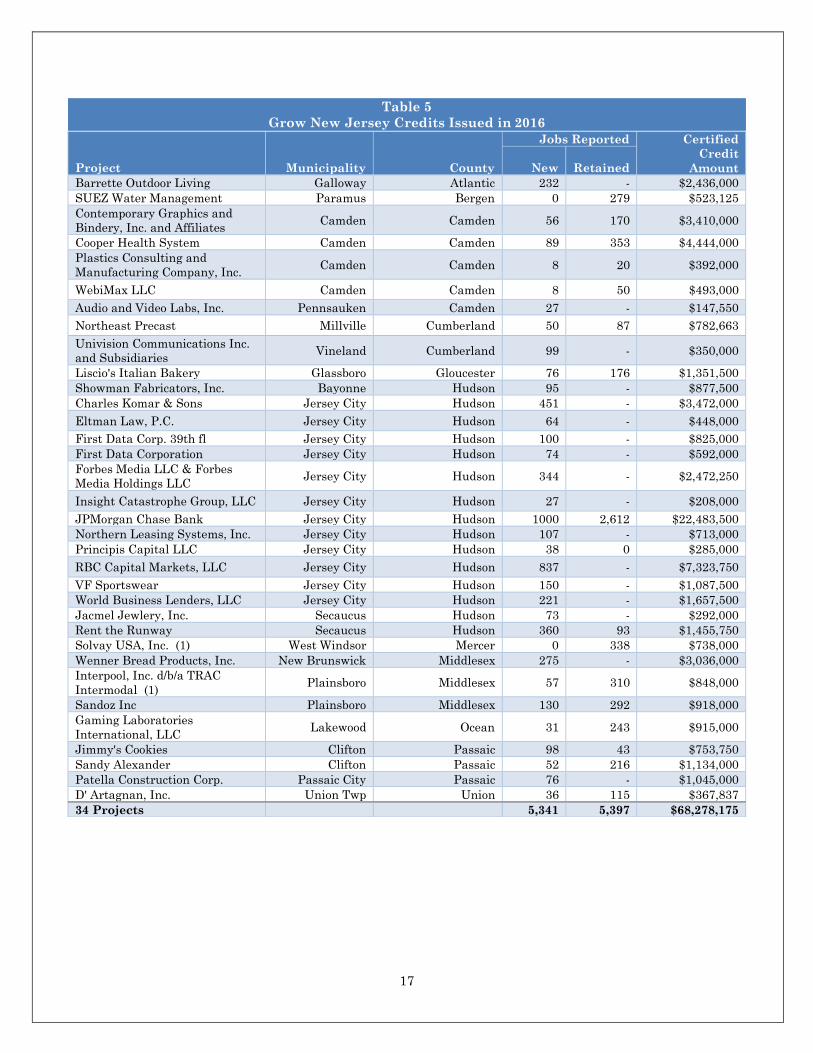
Credits Issued to Date
Table 5 lists projects for which NJEDA reported issuing credits in 2016.6 The 34 projects
were issued $68.3 million in credits and reported 5,341 new jobs and 5,397 retained jobs, in line
with the 5,361 new jobs and 5,433 retained jobs expected based on their applications and their
total approved awards of $708.3 million. These 34 projects are among 112 projects that were
approved through January 2016, with most (103) projected to be completed in or later than 2016.
All in, the 112 projects are projected to create 16,317 new jobs and retain 15,384 existing jobs, and
were approved for credits totaling $1.9 billion. Thus, the $68.3 million for the 34 awards represents
about 36% of the credits that would be issued annually were all the projects approved by 2016 to
reach completion. Many of these may have already been completed and credits issued, though
complete data on certified credits for 2017 is not yet available. The credits issued were highly
concentrated in Hudson County, and Jersey City in particular, with nearly $42 million credits
issued in the city. Projects in Camden County also received certified tax credits of about $9 million.
6 In 2015, approximately $12.6 million in credits were issued to 13 of the firms receiving them in 2016.
17
Table 5
Grow New Jersey Credits Issued in 2016
Project
Municipality
County
Jobs Reported Certified
Credit
Amount
New
Retained Barrette Outdoor Living Galloway Atlantic 232 - $2,436,000 SUEZ Water Management Paramus Bergen 0 279 $523,125 Contemporary Graphics and
Bindery, Inc. and Affiliates Camden Camden 56 170 $3,410,000
Cooper Health System Camden Camden 89 353 $4,444,000 Plastics Consulting and
Manufacturing Company, Inc. Camden Camden 8 20 $392,000
WebiMax LLC Camden Camden 8 50 $493,000 Audio and Video Labs, Inc. Pennsauken Camden 27 - $147,550 Northeast Precast Millville Cumberland 50 87 $782,663 Univision Communications Inc.
and Subsidiaries Vineland Cumberland 99 - $350,000
Liscio's Italian Bakery Glassboro Gloucester 76 176 $1,351,500 Showman Fabricators, Inc. Bayonne Hudson 95 - $877,500 Charles Komar & Sons Jersey City Hudson 451 - $3,472,000 Eltman Law, P.C. Jersey City Hudson 64 - $448,000 First Data Corp. 39th fl Jersey City Hudson 100 - $825,000 First Data Corporation Jersey City Hudson 74 - $592,000 Forbes Media LLC & Forbes
Media Holdings LLC Jersey City Hudson 344 - $2,472,250
Insight Catastrophe Group, LLC Jersey City Hudson 27 - $208,000 JPMorgan Chase Bank Jersey City Hudson 1000 2,612 $22,483,500 Northern Leasing Systems, Inc. Jersey City Hudson 107 - $713,000 Principis Capital LLC Jersey City Hudson 38 0 $285,000 RBC Capital Markets, LLC Jersey City Hudson 837 - $7,323,750 VF Sportswear Jersey City Hudson 150 - $1,087,500 World Business Lenders, LLC Jersey City Hudson 221 - $1,657,500 Jacmel Jewlery, Inc. Secaucus Hudson 73 - $292,000 Rent the Runway Secaucus Hudson 360 93 $1,455,750 Solvay USA, Inc. (1) West Windsor Mercer 0 338 $738,000 Wenner Bread Products, Inc. New Brunswick Middlesex 275 - $3,036,000 Interpool, Inc. d/b/a TRAC
Intermodal (1) Plainsboro Middlesex 57 310 $848,000
Sandoz Inc Plainsboro Middlesex 130 292 $918,000 Gaming Laboratories
International, LLC Lakewood Ocean 31 243 $915,000
Jimmy's Cookies Clifton Passaic 98 43 $753,750 Sandy Alexander Clifton Passaic 52 216 $1,134,000 Patella Construction Corp. Passaic City Passaic 76 - $1,045,000 D' Artagnan, Inc. Union Twp Union 36 115 $367,837 34 Projects 5,341 5,397 $68,278,175
18
JOB CREATION/RETENTION AND COSTS PER JOB
As in the case of many tax incentives, the primary goal of the Grow New Jersey
Assistance Program is to attract and retain businesses and jobs. As the enabling legislation
states, “The purpose of the program is to encourage economic development and job creation
and to preserve jobs that currently exist in New Jersey but which are in danger of being
relocated outside of the State.” A positive aspect of the program’s structure, as with the
structure of its predecessor – the Business Employment Incentive Program – is that in most
cases the size of the tax credit award is calculated directly as a function of the number of jobs
created or retained by the awardee, and in most cases the award calculation is twice as large
for newly created jobs in the state versus existing jobs retained in the state. In addition, firms
are required to maintain at least 80% of the employment indicated in the award agreement
SUMMARY
This section provides an overview of the potential job creation and retention produced
through the NJ Grow program and the cost associated with attracting jobs (firms) to or
keeping jobs in the state. Findings include:
The potential employment to be created or retained by Grow New Jersey-assisted
projects if all 227 approved projects were completed and certified at their full
employment levels would be over 59,000 jobs.
As of 2016, completed and certified Grow NJ projects have attracted or retained
nearly 11,000 jobs in the state.
In some counties, the number of potential jobs to be created and/or retained is notable
in comparison to the employment change over the past seven years as New Jersey
emerged from the Great Recession. In Hudson County, the 63 Grow NJ projects are
expected to result in the creation of 12,371 new jobs and the retention of 6,905 existing
jobs, which is equivalent to roughly 74% of the non-retail employment growth in the
county from 2010 through 2017.
In Camden County, the 7,008 jobs to be potentially created or retained by Grow NJ
projects (including 781 certified new and/or retained Grow NJ jobs in 2016) are
equivalent to about 53% of the total non-retail employment change from 2010 to 2017.
The average costs per job for most Grow NJ awards (excluding Camden alternatives)
is generally consistent with national benchmarks, with the average $7,650 per new
job per year near the upper bound of estimates and the average annual cost of $3,670
per retained Grow NJ job in line with some national benchmarks.
Among the Camden alternatives, the annual costs per job range from just under
$20,000 per year to over $65,000 per year, with an average of about $34,000 (the
award amount for new and retained jobs is the same in Garden State Growth Zone
municipalities), or 4.5 times the average award per new job for awards calculated on
a per-job basis.
19
each year, or the tax credit is not issued for that year.
To provide context for the job creation/retention figures discussed in the preceding
section, it is helpful to look at the magnitude of job growth in New Jersey in recent years.
From December 2010 (marking roughly the end of the employment declines resulting from
the 2007-2009 recession) to December 2017, New Jersey added approximately 316,500
private-sector jobs – an average of just over 45,000 jobs per year, representing a compound
annual growth rate of about 1.35%. This was slower than the national rate of private sector
job growth of just over 2% annually for the same period. If fully implemented, the 59,000 jobs
to be created and/or retained through Grow NJ projects would be equivalent to a relatively
strong private-sector job growth year for New Jersey. (It should be noted however, that for
projects in which firms relocated within the state, the retained jobs, while new to the counties
and/or municipalities, would not represent new employment gains in the state.) The strongest
year for New Jersey since 2010 was 2016, when the state added 63,000 private sector jobs. It
is worth noting that 10,700 Grow NJ jobs were certified in 2016. If those firms had left or not
come to the state (and the jobs created and/or retained were not replaced), the 2016
employment level would be lower by nearly 11,000 jobs.
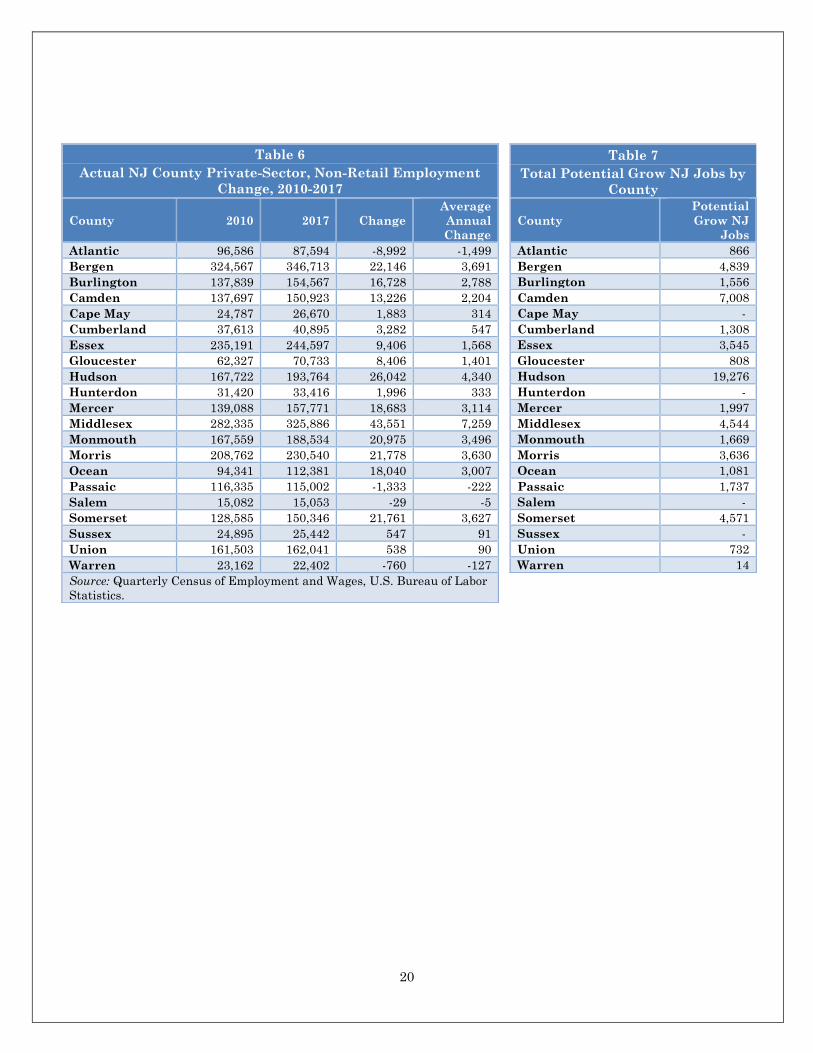
A similar comparison of potential Grow NJ-assisted employment creation and
retention to recent actual employment change is also useful at the county level. Table 6
provides the total actual private-sector non-retail employment levels and change by county
for 2010-2017.7 These are the annual average county employment data reported by the
U.S. Bureau of Labor Statistics for 2010 and 2017, and the change between the two periods.
Table 7 provides the total new and retained Grow NJ jobs that would be created in each
county if all 227 approved Grow NJ awards were certified at their full employment levels.
There have to date been no approved projects in Salem or Cape May Counties, which had
among the highest unemployment rates in the state in 2016 (in Cape May this is largely
due to the seasonal nature of the tourism industry). There have been at least four awards
approved in each of the other South Jersey counties, with the vast majority of activity
concentrated in Camden County.
In some counties, the number of jobs to be created and/or retained is notable in
comparison to the employment change over the past seven years as New Jersey emerged from
the Great Recession. For example, in Hudson County, the 63 Grow NJ projects are expected
to result in the creation of 12,371 new jobs and the retention of 6,905 existing jobs. This total
of over 19,000 jobs is equivalent to roughly 74% of the non-retail employment growth in the
county from 2010 through 2017 (note that some of the employment in the county represents
the 6,646 new/retained Grow NJ jobs certified in 2016). In Camden County, the 7,008 jobs to
be potentially created or retained by Grow NJ projects (including 781 certified new and/or
retained Grow NJ jobs in 2016) are equivalent to about 53% of the total non-retail
employment change from 2010 to 2017.
7 Retail projects are not eligible for Grow New Jersey credits; Grow NJ employment estimates are thus
compared to non-retail private-sector employment change.
20
Table 6
Actual NJ County Private-Sector, Non-Retail Employment
Change, 2010-2017
County 2010 2017 Change
Average
Annual
Change
Atlantic 96,586 87,594 -8,992 -1,499
Bergen 324,567 346,713 22,146 3,691
Burlington 137,839 154,567 16,728 2,788
Camden 137,697 150,923 13,226 2,204
Cape May 24,787 26,670 1,883 314
Cumberland 37,613 40,895 3,282 547
Essex 235,191 244,597 9,406 1,568
Gloucester 62,327 70,733 8,406 1,401
Hudson 167,722 193,764 26,042 4,340
Hunterdon 31,420 33,416 1,996 333
Mercer 139,088 157,771 18,683 3,114
Middlesex 282,335 325,886 43,551 7,259
Monmouth 167,559 188,534 20,975 3,496
Morris 208,762 230,540 21,778 3,630
Ocean 94,341 112,381 18,040 3,007
Passaic 116,335 115,002 -1,333 -222
Salem 15,082 15,053 -29 -5
Somerset 128,585 150,346 21,761 3,627
Sussex 24,895 25,442 547 91
Union 161,503 162,041 538 90
Warren 23,162 22,402 -760 -127
Source: Quarterly Census of Employment and Wages, U.S. Bureau of Labor
Statistics.
Table 7
Total Potential Grow NJ Jobs by
County
County
Potential
Grow NJ
Jobs
Atlantic 866
Bergen 4,839
Burlington 1,556
Camden 7,008
Cape May -
Cumberland 1,308
Essex 3,545
Gloucester 808
Hudson 19,276
Hunterdon -
Mercer 1,997
Middlesex 4,544
Monmouth 1,669
Morris 3,636
Ocean 1,081
Passaic 1,737
Salem -
Somerset 4,571
Sussex -
Union 732
Warren 14
21
Costs per Job
Of the 227 Grow NJ awards considered in this report, 214 (made to 211 companies)
were calculated using the per-job formula accounting for location-based base awards and
bonuses, subject to certain limitations.8 In total, based on their agreements and award
calculations, these 214 projects were projected to create 27,252 new jobs in the state, and to
preserve 28,006 existing jobs at risk of leaving the state. Based on the total approved awards
of $3.1 billion for these projects and the award formula, the average cost per newly created
job for these awards is approximately $7,650 per year, or $76,500 over the ten-year period of
most awards. Per-new-job costs ranged from as low as $486 per year in the case of a project
with an award limited by program rules, to as high as $15,000 per year – the maximum
allowed. Costs per retained job ranged from $556 to $15,000, with an average of $3,670 per
year. The average annual cost per job for all new and retained jobs for the 214 projects would
be approximately $5,589. These estimates assume that award levels are not reduced or
otherwise modified based on employment levels or other factors.
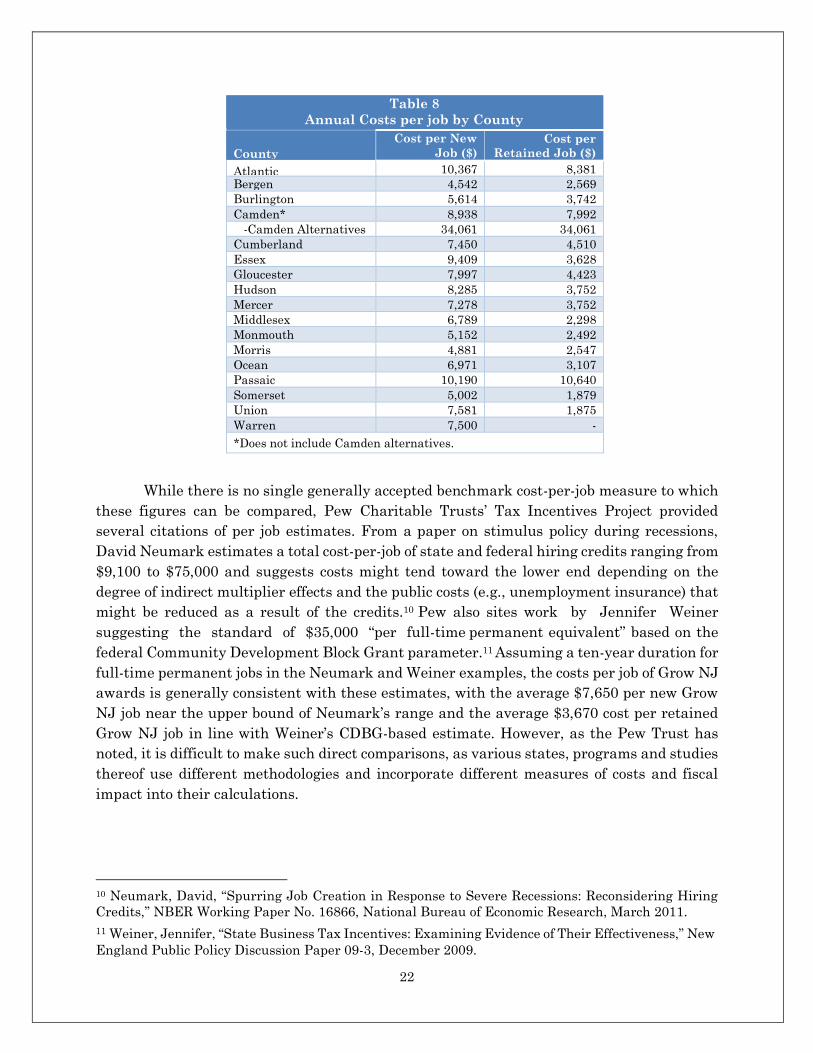
Table 8 provides the annual cost per new and retained job by county, not including
the Camden alternatives (new and retained job costs by municipality are provided in
Appendix III). Annual costs per new job ranged from a low of $4,542 in Bergen County to a
high of $10,367 in Atlantic County. Annual costs per retained job ranged from a low of $1,875
in Union County to $10,640 in Passaic County. The significantly higher per-job cost of the
Camden alternatives results from the alternative calculation used to determine these
awards. This issue is described in more detail below. For awards calculated using the
standard per-job approach, the differences in average costs per job across counties are driven
by a combination of base awards – which range from $3,000 to $5,000 per job, depending on
project location and classification9 – and the number and type of bonuses for which projects
are eligible.
8 Some awards were somewhat less than the calculation would indicate based on program rules
capping the maximum possible award. 9 There is a $500 base award category for project locations that do not fall into any of the other
categories, but it has not yet been used.
22
Table 8
Annual Costs per job by County
County
Cost per New
Job ($) Cost per
Retained Job ($)
Atlantic 10,367 8,381 Bergen 4,542 2,569 Burlington 5,614 3,742 Camden* 8,938 7,992
-Camden Alternatives 34,061 34,061 Cumberland 7,450 4,510 Essex 9,409 3,628 Gloucester 7,997 4,423 Hudson 8,285 3,752 Mercer 7,278 3,752 Middlesex 6,789 2,298 Monmouth 5,152 2,492 Morris 4,881 2,547 Ocean 6,971 3,107 Passaic 10,190 10,640 Somerset 5,002 1,879 Union 7,581 1,875 Warren 7,500 - *Does not include Camden alternatives.
While there is no single generally accepted benchmark cost-per-job measure to which
these figures can be compared, Pew Charitable Trusts’ Tax Incentives Project provided
several citations of per job estimates. From a paper on stimulus policy during recessions,
David Neumark estimates a total cost-per-job of state and federal hiring credits ranging from
$9,100 to $75,000 and suggests costs might tend toward the lower end depending on the
degree of indirect multiplier effects and the public costs (e.g., unemployment insurance) that
might be reduced as a result of the credits.10 Pew also sites work by Jennifer Weiner
suggesting the standard of $35,000 “per full-time permanent equivalent” based on the
federal Community Development Block Grant parameter.11 Assuming a ten-year duration for
full-time permanent jobs in the Neumark and Weiner examples, the costs per job of Grow NJ
awards is generally consistent with these estimates, with the average $7,650 per new Grow
NJ job near the upper bound of Neumark’s range and the average $3,670 cost per retained
Grow NJ job in line with Weiner’s CDBG-based estimate. However, as the Pew Trust has
noted, it is difficult to make such direct comparisons, as various states, programs and studies
thereof use different methodologies and incorporate different measures of costs and fiscal
impact into their calculations.
10 Neumark, David, “Spurring Job Creation in Response to Severe Recessions: Reconsidering Hiring
Credits,” NBER Working Paper No. 16866, National Bureau of Economic Research, March 2011.
11 Weiner, Jennifer, “State Business Tax Incentives: Examining Evidence of Their Effectiveness,” New
England Public Policy Discussion Paper 09-3, December 2009.
23
Camden Alternatives
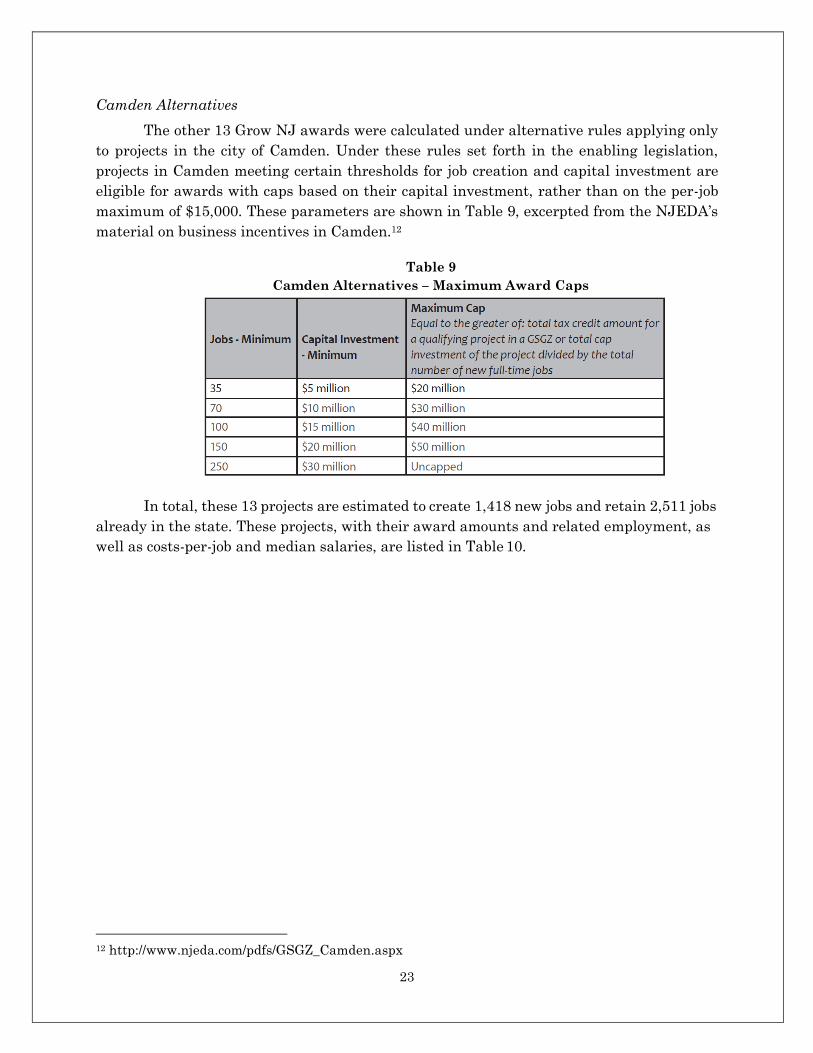
The other 13 Grow NJ awards were calculated under alternative rules applying only
to projects in the city of Camden. Under these rules set forth in the enabling legislation,
projects in Camden meeting certain thresholds for job creation and capital investment are
eligible for awards with caps based on their capital investment, rather than on the per-job
maximum of $15,000. These parameters are shown in Table 9, excerpted from the NJEDA’s
material on business incentives in Camden.12
Table 9
Camden Alternatives – Maximum Award Caps
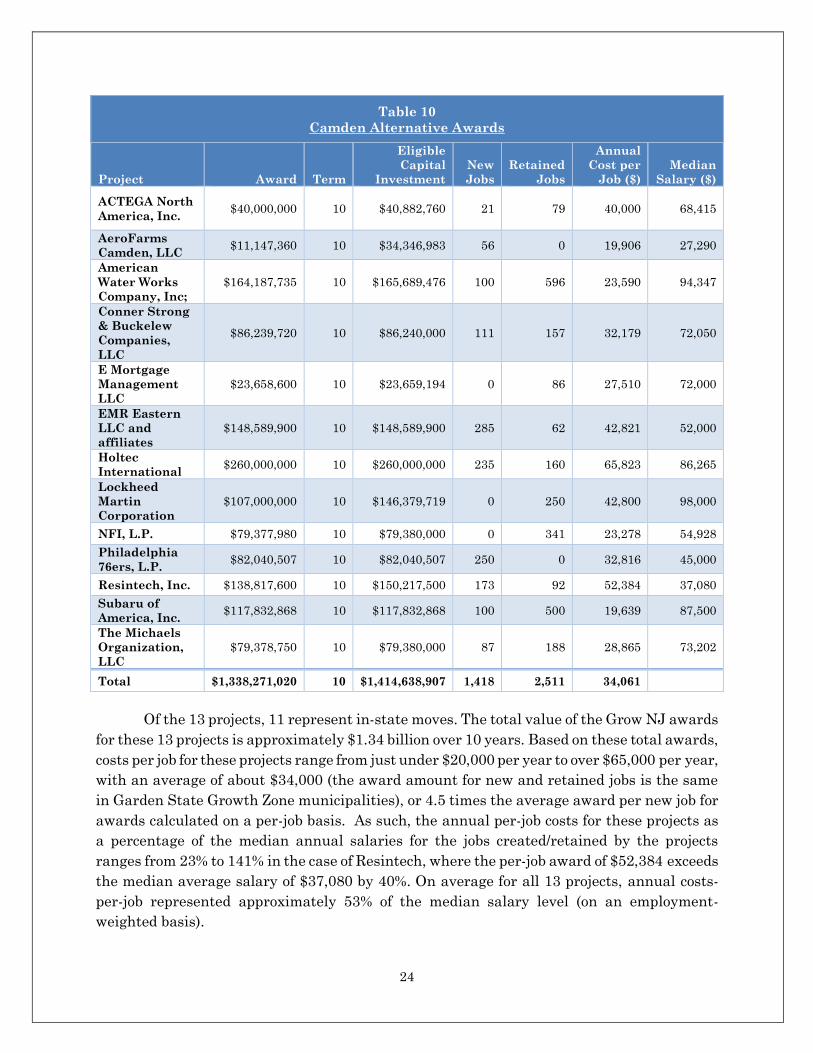
In total, these 13 projects are estimated to create 1,418 new jobs and retain 2,511 jobs
already in the state. These projects, with their award amounts and related employment, as
well as costs-per-job and median salaries, are listed in Table 10.
12 http://www.njeda.com/pdfs/GSGZ_Camden.aspx
24
Table 10
Camden Alternative Awards
Project Award Term
Eligible
Capital
Investment
New
Jobs
Retained
Jobs
Annual
Cost per
Job ($)
Median
Salary ($)
ACTEGA North
America, Inc. $40,000,000 10 $40,882,760 21 79
40,
40,000
000
68,415
AeroFarms
Camden, LLC $11,147,360 10 $34,346,983 56 0 19,906 27,290
American
Water Works
Company, Inc;
$164,187,735 10 $165,689,476 100 596 23,590 94,347
Conner Strong
& Buckelew
Companies,
LLC
$86,239,720 10 $86,240,000 111 157 32,179 72,050
E Mortgage
Management
LLC
$23,658,600 10 $23,659,194 0 86 27,510 72,000
EMR Eastern
LLC and
affiliates
$148,589,900 10 $148,589,900 285 62 42,821 52,000
Holtec
International $260,000,000 10 $260,000,000 235 160 65,823 86,265
Lockheed
Martin
Corporation
$107,000,000 10 $146,379,719 0 250 42,800 98,000
NFI, L.P. $79,377,980 10 $79,380,000 0 341 23,278 54,928
Philadelphia
76ers, L.P. $82,040,507 10 $82,040,507 250 0 32,816 45,000
Resintech, Inc. $138,817,600 10 $150,217,500 173 92 52,384 37,080
Subaru of
America, Inc. $117,832,868 10 $117,832,868 100 500 19,639 87,500
The Michaels
Organization,
LLC
$79,378,750 10 $79,380,000 87 188 28,865 73,202
Total $1,338,271,020 10 $1,414,638,907 1,418 2,511 34,061
Of the 13 projects, 11 represent in-state moves. The total value of the Grow NJ awards
for these 13 projects is approximately $1.34 billion over 10 years. Based on these total awards,
costs per job for these projects range from just under $20,000 per year to over $65,000 per year,
with an average of about $34,000 (the award amount for new and retained jobs is the same
in Garden State Growth Zone municipalities), or 4.5 times the average award per new job for
awards calculated on a per-job basis. As such, the annual per-job costs for these projects as
a percentage of the median annual salaries for the jobs created/retained by the projects
ranges from 23% to 141% in the case of Resintech, where the per-job award of $52,384 exceeds
the median average salary of $37,080 by 40%. On average for all 13 projects, annual costs-
per-job represented approximately 53% of the median salary level (on an employment-
weighted basis).
25
Because these awards were not calculated on a per-job basis, detailed information on
bonuses for which these projects would qualify was not available. However, assuming the
maximum cap of $15,000 per job for per-job award calculations, the cumulative awards for
these 13 projects would total approximately $589.4 million – less than half of the value
actually awarded under the alternative approach. These awards (as with all projects in
Camden) are not limited to the amount required to complete the project relative to other
potential locations, while projects calculated on a per-job basis that are approved for awards
greater than $4 million per year are required to demonstrate the difference in costs between
the New Jersey location and locations considered outside the state. For example, the
incentive award for the Philadelphia 76ers practice facility was approximately $82 million,
while the cost differential between the two sites was calculated to be approximately $42.5
million over the 15-year commitment duration of the incentive. This difference was based on
approximately $49 million in higher initial capital costs in New Jersey versus the alternative
site in Philadelphia, but slightly lower annual costs in New Jersey. However, approximately
$16 million of the difference in capital costs was attributable to the larger size of the facility
in New Jersey (approximately 50% larger).
Recommendation: The effort to encourage large scale development projects in the city of
Camden as reflected in the legislative establishment of alternative incentive calculations for
the city appears to have been effective, to the degree that the scale of the awards played a
role in attracting them to the city. At the same time, it should be noted that, by design, these
costs are significantly higher than for other projects, even those in GSGZs. Based on these
cost considerations alone, we would urge NJEDA and the legislature to re-examine the
structure of this award type. There appears to be an intention in the legislation to encourage
the type of large-scale capital investment targeted by these awards. If expenditures on a per-
job basis are a concern, there may be approaches that would more closely tie awards to the
same job creation/retention criteria used for other projects, while still encouraging large-scale
capital investment in Camden or elsewhere. We note that there is already a per-job bonus of
up to $5,000 available for capital investment in excess of minimum requirements that serves
this purpose to some degree. This could be sufficient, or could serve as the basis for a
restructured formula that continues to reward significant investment, while also tying it to
job creation.
26
BONUS CATEGORIES
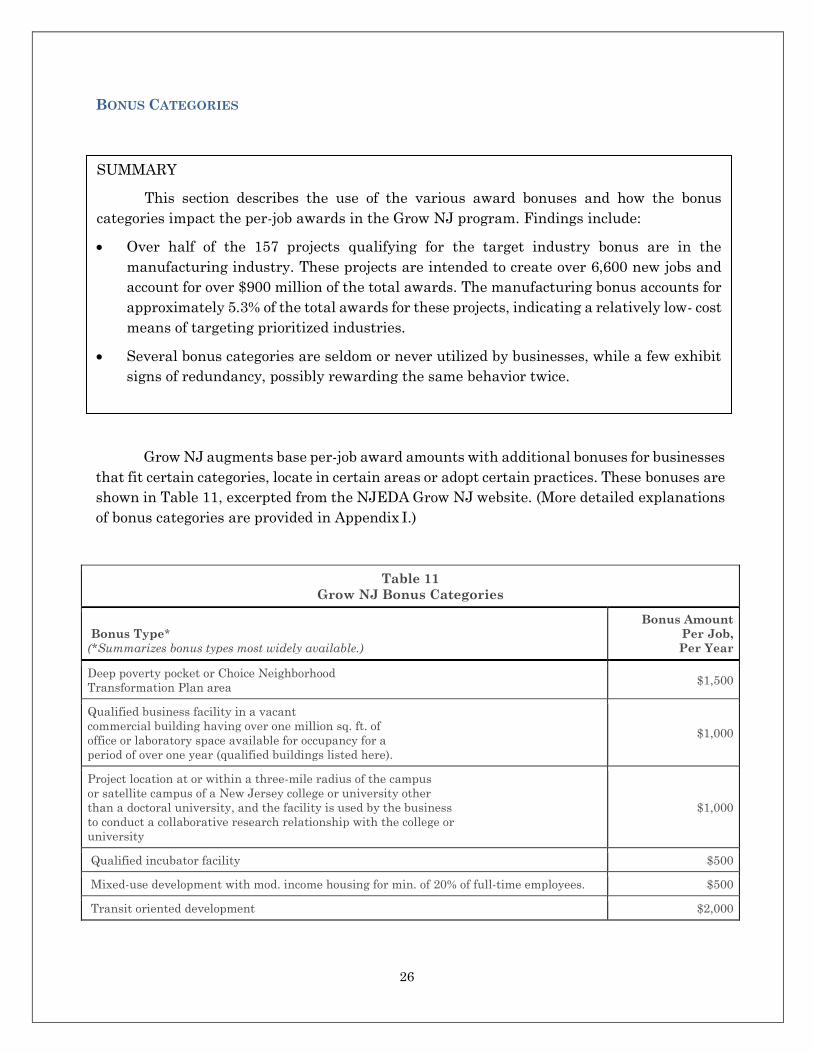
Grow NJ augments base per-job award amounts with additional bonuses for businesses
that fit certain categories, locate in certain areas or adopt certain practices. These bonuses are
shown in Table 11, excerpted from the NJEDA Grow NJ website. (More detailed explanations
of bonus categories are provided in Appendix I.)
Table 11
Grow NJ Bonus Categories
Bonus Type*
(*Summarizes bonus types most widely available.)
Bonus Amount
Per Job,
Per Year
Deep poverty pocket or Choice Neighborhood
Transformation Plan area $1,500
Qualified business facility in a vacant
commercial building having over one million sq. ft. of
office or laboratory space available for occupancy for a
period of over one year (qualified buildings listed here).
$1,000
Project location at or within a three-mile radius of the campus
or satellite campus of a New Jersey college or university other
than a doctoral university, and the facility is used by the business
to conduct a collaborative research relationship with the college or
university
$1,000
Qualified incubator facility $500
Mixed-use development with mod. income housing for min. of 20% of full-time employees. $500
Transit oriented development $2,000
SUMMARY
This section describes the use of the various award bonuses and how the bonus
categories impact the per-job awards in the Grow NJ program. Findings include:
Over half of the 157 projects qualifying for the target industry bonus are in the
manufacturing industry. These projects are intended to create over 6,600 new jobs and
account for over $900 million of the total awards. The manufacturing bonus accounts for
approximately 5.3% of the total awards for these projects, indicating a relatively low- cost
means of targeting prioritized industries.
Several bonus categories are seldom or never utilized by businesses, while a few exhibit
signs of redundancy, possibly rewarding the same behavior twice.
27
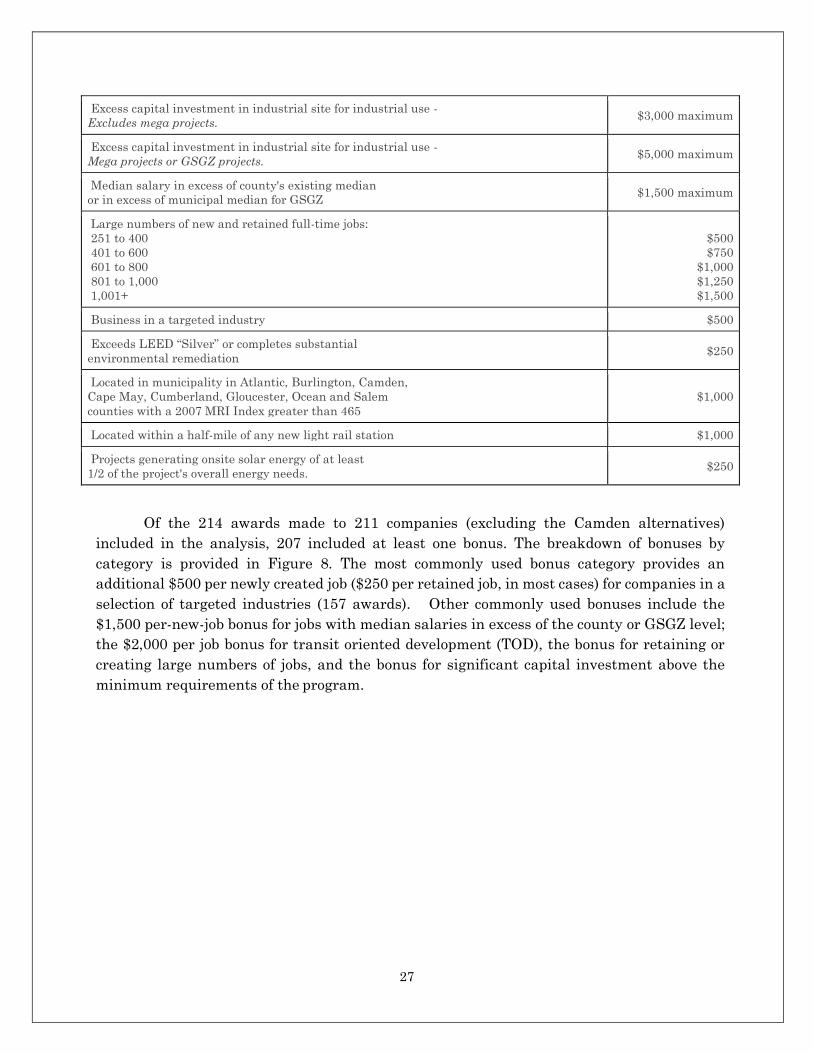
Excess capital investment in industrial site for industrial use -
Excludes mega projects. $3,000 maximum
Excess capital investment in industrial site for industrial use -
Mega projects or GSGZ projects. $5,000 maximum
Median salary in excess of county's existing median
or in excess of municipal median for GSGZ $1,500 maximum
Large numbers of new and retained full-time jobs:
251 to 400
401 to 600
601 to 800
801 to 1,000
1,001+
$500
$750
$1,000
$1,250
$1,500
Business in a targeted industry $500
Exceeds LEED “Silver” or completes substantial
environmental remediation $250
Located in municipality in Atlantic, Burlington, Camden,
Cape May, Cumberland, Gloucester, Ocean and Salem
counties with a 2007 MRI Index greater than 465
$1,000
Located within a half-mile of any new light rail station $1,000
Projects generating onsite solar energy of at least
1/2 of the project's overall energy needs. $250
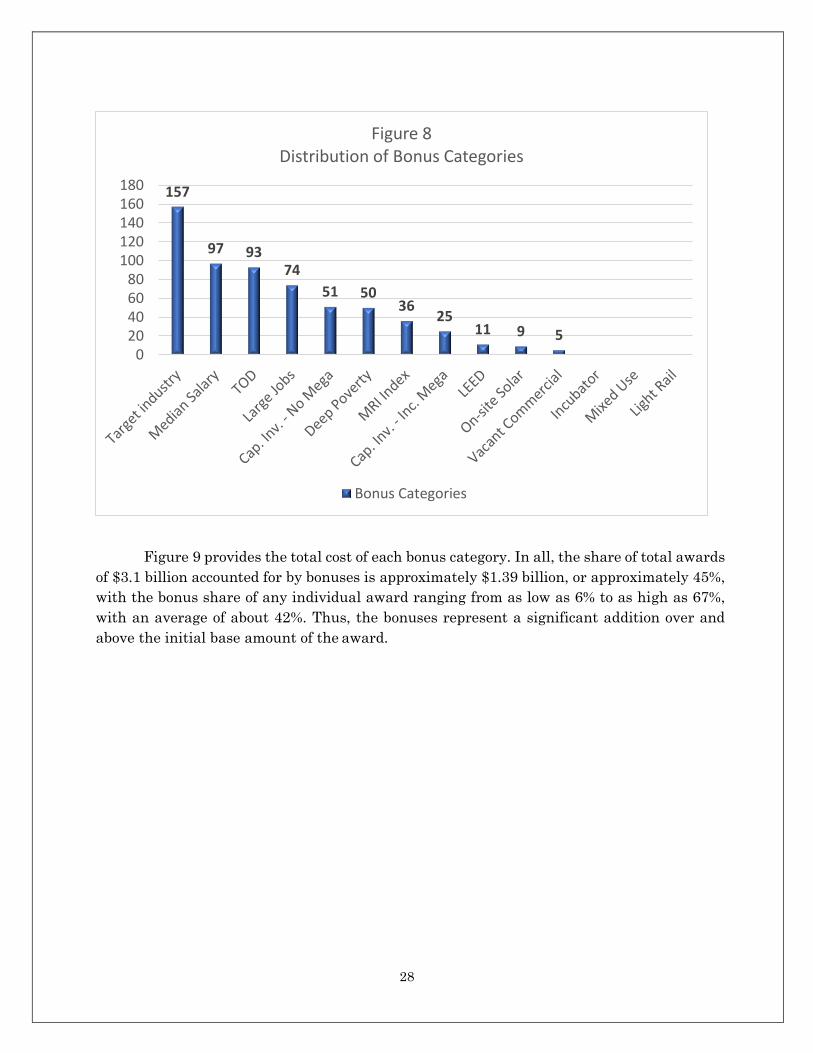
Of the 214 awards made to 211 companies (excluding the Camden alternatives)
included in the analysis, 207 included at least one bonus. The breakdown of bonuses by
category is provided in Figure 8. The most commonly used bonus category provides an
additional $500 per newly created job ($250 per retained job, in most cases) for companies in a
selection of targeted industries (157 awards). Other commonly used bonuses include the
$1,500 per-new-job bonus for jobs with median salaries in excess of the county or GSGZ level;
the $2,000 per job bonus for transit oriented development (TOD), the bonus for retaining or
creating large numbers of jobs, and the bonus for significant capital investment above the
minimum requirements of the program.
28
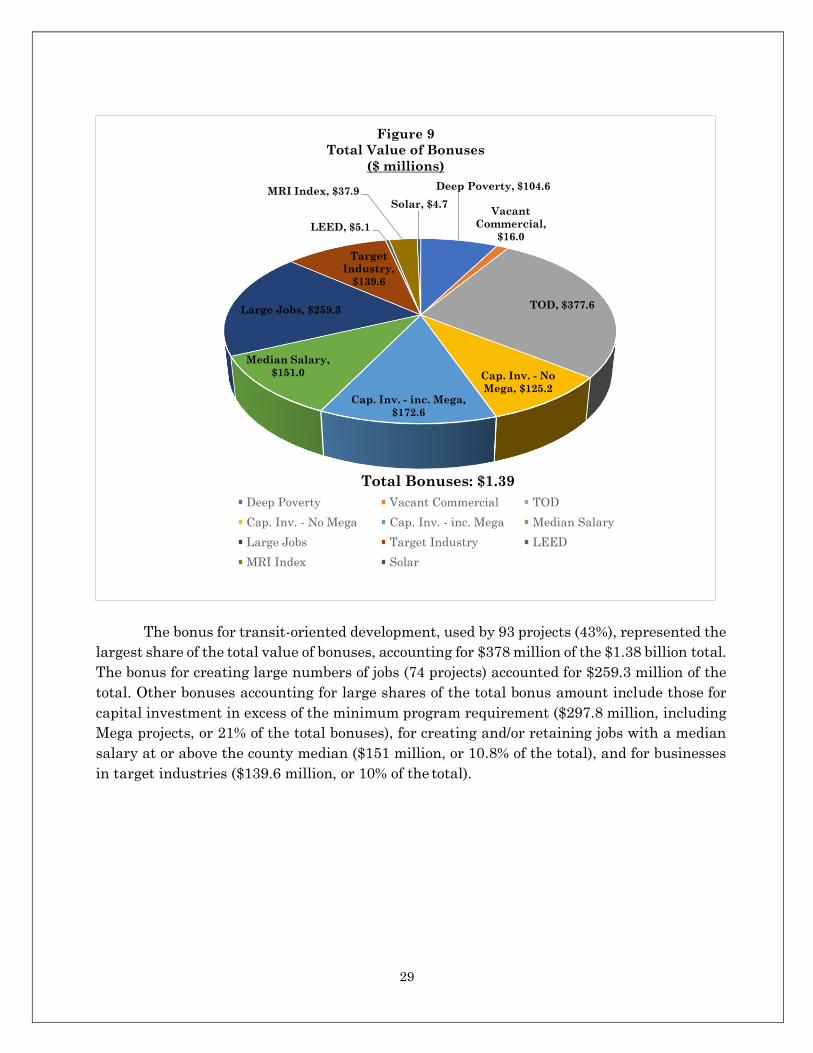
Figure 9 provides the total cost of each bonus category. In all, the share of total awards
of $3.1 billion accounted for by bonuses is approximately $1.39 billion, or approximately 45%,
with the bonus share of any individual award ranging from as low as 6% to as high as 67%,
with an average of about 42%. Thus, the bonuses represent a significant addition over and
above the initial base amount of the award.
157
97 9374
51 5036
2511 9 5
020406080
100120140160180
Figure 8Distribution of Bonus Categories
Bonus Categories
29
The bonus for transit-oriented development, used by 93 projects (43%), represented the
largest share of the total value of bonuses, accounting for $378 million of the $1.38 billion total.
The bonus for creating large numbers of jobs (74 projects) accounted for $259.3 million of the
total. Other bonuses accounting for large shares of the total bonus amount include those for
capital investment in excess of the minimum program requirement ($297.8 million, including
Mega projects, or 21% of the total bonuses), for creating and/or retaining jobs with a median
salary at or above the county median ($151 million, or 10.8% of the total), and for businesses
in target industries ($139.6 million, or 10% of the total).
Deep Poverty, $104.6
Vacant
Commercial,
$16.0
TOD, $377.6
Cap. Inv. - No
Mega, $125.2Cap. Inv. - inc. Mega,
$172.6
Median Salary,
$151.0
Large Jobs, $259.3
Target
Industry,
$139.6
LEED, $5.1
MRI Index, $37.9
Solar, $4.7
Figure 9
Total Value of Bonuses
($ millions)
Deep Poverty Vacant Commercial TOD
Cap. Inv. - No Mega Cap. Inv. - inc. Mega Median Salary
Large Jobs Target Industry LEED
MRI Index Solar
Total Bonuses: $1.39
30
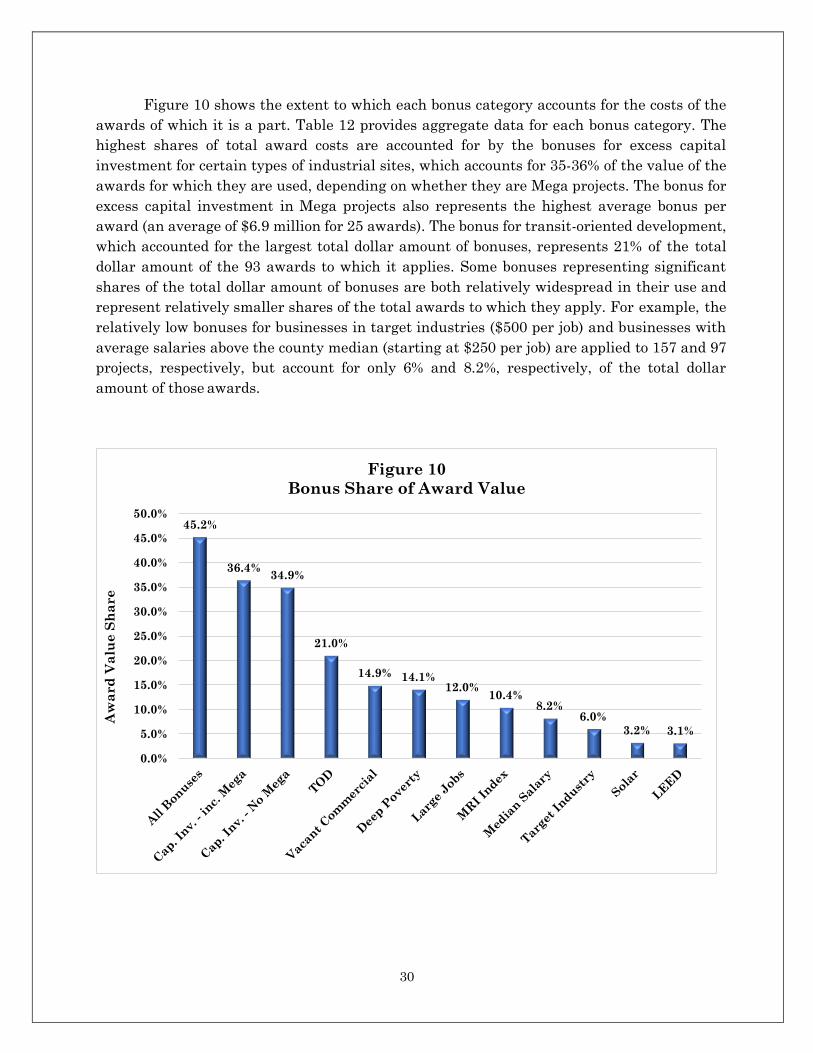
Figure 10 shows the extent to which each bonus category accounts for the costs of the
awards of which it is a part. Table 12 provides aggregate data for each bonus category. The
highest shares of total award costs are accounted for by the bonuses for excess capital
investment for certain types of industrial sites, which accounts for 35-36% of the value of the
awards for which they are used, depending on whether they are Mega projects. The bonus for
excess capital investment in Mega projects also represents the highest average bonus per
award (an average of $6.9 million for 25 awards). The bonus for transit-oriented development,
which accounted for the largest total dollar amount of bonuses, represents 21% of the total
dollar amount of the 93 awards to which it applies. Some bonuses representing significant
shares of the total dollar amount of bonuses are both relatively widespread in their use and
represent relatively smaller shares of the total awards to which they apply. For example, the
relatively low bonuses for businesses in target industries ($500 per job) and businesses with
average salaries above the county median (starting at $250 per job) are applied to 157 and 97
projects, respectively, but account for only 6% and 8.2%, respectively, of the total dollar
amount of those awards.
45.2%
36.4%34.9%
21.0%
14.9% 14.1%12.0%
10.4%8.2%
6.0%3.2% 3.1%
0.0%
5.0%
10.0%
15.0%
20.0%
25.0%
30.0%
35.0%
40.0%
45.0%
50.0%
Aw
ard
Va
lue
Sh
are
Figure 10
Bonus Share of Award Value
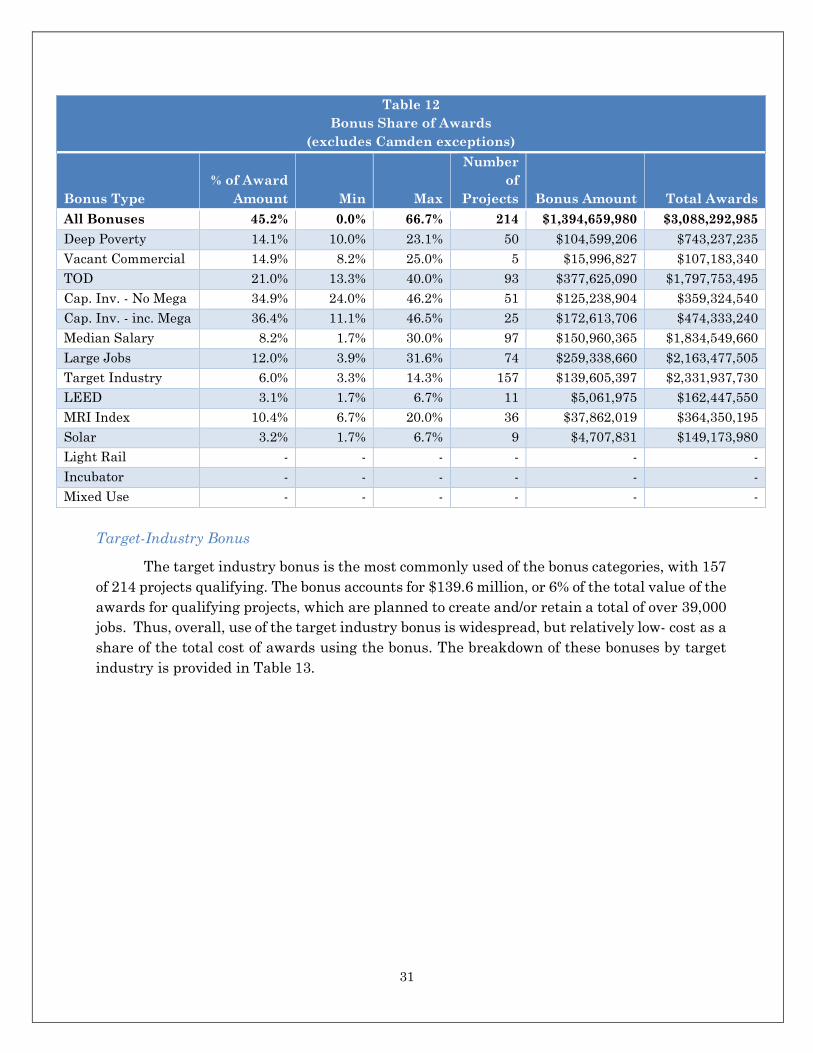
31
Table 12
Bonus Share of Awards
(excludes Camden exceptions)
Bonus Type
% of Award
Amount Min Max
Number
of
Projects Bonus Amount Total Awards
All Bonuses 45.2% 0.0% 66.7% 214 $1,394,659,980 $3,088,292,985
Deep Poverty 14.1% 10.0% 23.1% 50 $104,599,206 $743,237,235
Vacant Commercial 14.9% 8.2% 25.0% 5 $15,996,827 $107,183,340
TOD 21.0% 13.3% 40.0% 93 $377,625,090 $1,797,753,495
Cap. Inv. - No Mega 34.9% 24.0% 46.2% 51 $125,238,904 $359,324,540
Cap. Inv. - inc. Mega 36.4% 11.1% 46.5% 25 $172,613,706 $474,333,240
Median Salary 8.2% 1.7% 30.0% 97 $150,960,365 $1,834,549,660
Large Jobs 12.0% 3.9% 31.6% 74 $259,338,660 $2,163,477,505
Target Industry 6.0% 3.3% 14.3% 157 $139,605,397 $2,331,937,730
LEED 3.1% 1.7% 6.7% 11 $5,061,975 $162,447,550
MRI Index 10.4% 6.7% 20.0% 36 $37,862,019 $364,350,195
Solar 3.2% 1.7% 6.7% 9 $4,707,831 $149,173,980
Light Rail - - - - - -
Incubator - - - - - -
Mixed Use - - - - - -
Target-Industry Bonus
The target industry bonus is the most commonly used of the bonus categories, with 157
of 214 projects qualifying. The bonus accounts for $139.6 million, or 6% of the total value of the
awards for qualifying projects, which are planned to create and/or retain a total of over 39,000
jobs. Thus, overall, use of the target industry bonus is widespread, but relatively low- cost as a
share of the total cost of awards using the bonus. The breakdown of these bonuses by target
industry is provided in Table 13.
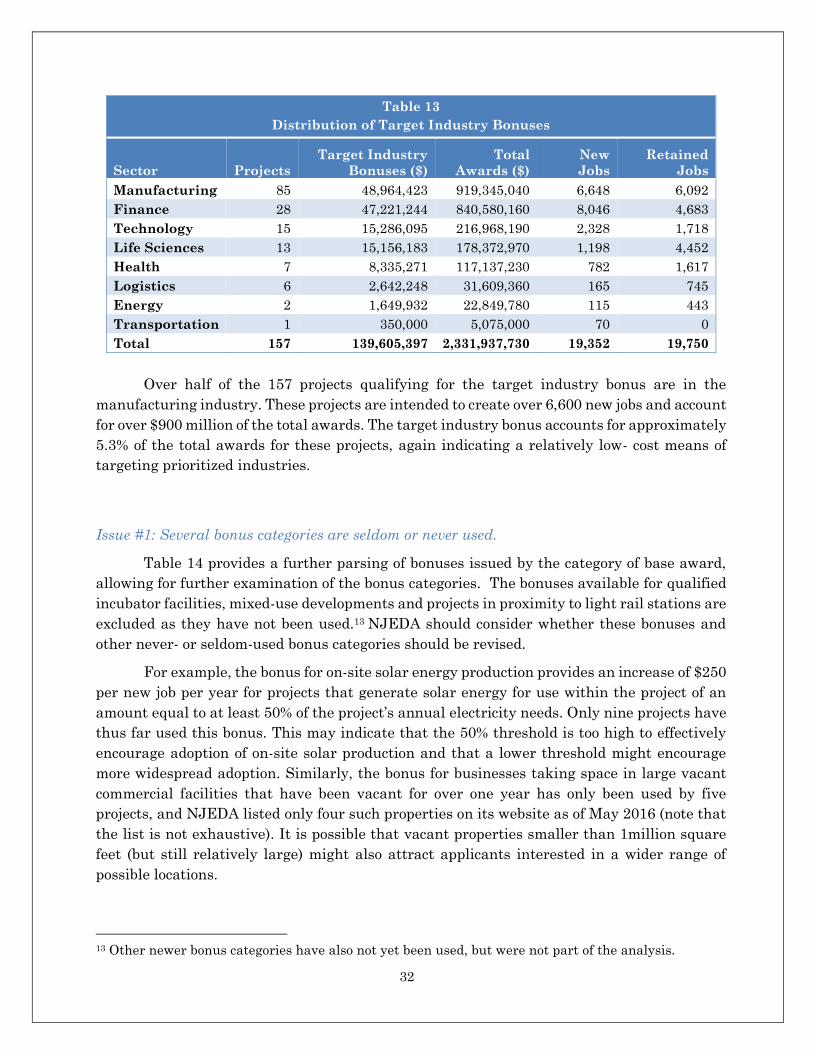
32
Table 13
Distribution of Target Industry Bonuses
Sector Projects
Target Industry
Bonuses ($)
Total
Awards ($)
New
Jobs
Retained
Jobs
Manufacturing 85 48,964,423 919,345,040 6,648 6,092
Finance 28 47,221,244 840,580,160 8,046 4,683
Technology 15 15,286,095 216,968,190 2,328 1,718
Life Sciences 13 15,156,183 178,372,970 1,198 4,452
Health 7 8,335,271 117,137,230 782 1,617
Logistics 6 2,642,248 31,609,360 165 745
Energy 2 1,649,932 22,849,780 115 443
Transportation 1 350,000 5,075,000 70 0
Total 157 139,605,397 2,331,937,730 19,352 19,750
Over half of the 157 projects qualifying for the target industry bonus are in the
manufacturing industry. These projects are intended to create over 6,600 new jobs and account
for over $900 million of the total awards. The target industry bonus accounts for approximately
5.3% of the total awards for these projects, again indicating a relatively low- cost means of
targeting prioritized industries.
Issue #1: Several bonus categories are seldom or never used.
Table 14 provides a further parsing of bonuses issued by the category of base award,
allowing for further examination of the bonus categories. The bonuses available for qualified
incubator facilities, mixed-use developments and projects in proximity to light rail stations are
excluded as they have not been used.13 NJEDA should consider whether these bonuses and
other never- or seldom-used bonus categories should be revised.
For example, the bonus for on-site solar energy production provides an increase of $250
per new job per year for projects that generate solar energy for use within the project of an
amount equal to at least 50% of the project’s annual electricity needs. Only nine projects have
thus far used this bonus. This may indicate that the 50% threshold is too high to effectively
encourage adoption of on-site solar production and that a lower threshold might encourage
more widespread adoption. Similarly, the bonus for businesses taking space in large vacant
commercial facilities that have been vacant for over one year has only been used by five
projects, and NJEDA listed only four such properties on its website as of May 2016 (note that
the list is not exhaustive). It is possible that vacant properties smaller than 1million square
feet (but still relatively large) might also attract applicants interested in a wider range of
possible locations.
13 Other newer bonus categories have also not yet been used, but were not part of the analysis.
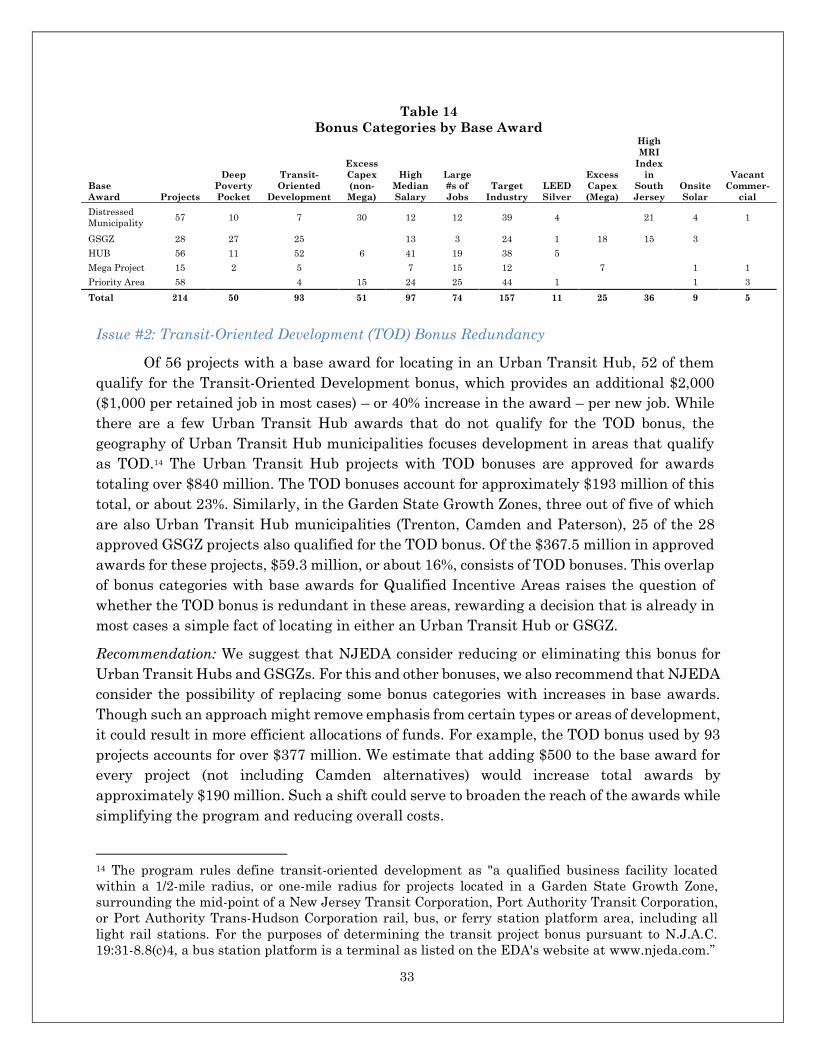
33
Table 14
Bonus Categories by Base Award
Base
Award Projects
Deep
Poverty
Transit-
Oriented
Development
Excess
Capex
(non-
Mega)
High
Median
Salary
Large
#s of
Jobs
Target
Industry
LEED
Silver
Excess
Capex
(Mega)
High
MRI
Index
in
South
Jersey
Onsite
Solar
Vacant
Commer-
cial
Distressed
Municipality 57 10 7 30 12 12 39 4 21 4 1
GSGZ 28 27 25 13 3 24 1 18 15 3
HUB 56 11 52 6 41 19 38 5
Mega Project 15 2 5 7 15 12 7 1 1
Priority Area 58 4 15 24 25 44 1 1 3
Total 214 50 93 51 97 74 157 11 25 36 9 5
Issue #2: Transit-Oriented Development (TOD) Bonus Redundancy
Of 56 projects with a base award for locating in an Urban Transit Hub, 52 of them
qualify for the Transit-Oriented Development bonus, which provides an additional $2,000
($1,000 per retained job in most cases) – or 40% increase in the award – per new job. While
there are a few Urban Transit Hub awards that do not qualify for the TOD bonus, the
geography of Urban Transit Hub municipalities focuses development in areas that qualify
as TOD.14 The Urban Transit Hub projects with TOD bonuses are approved for awards
totaling over $840 million. The TOD bonuses account for approximately $193 million of this
total, or about 23%. Similarly, in the Garden State Growth Zones, three out of five of which
are also Urban Transit Hub municipalities (Trenton, Camden and Paterson), 25 of the 28
approved GSGZ projects also qualified for the TOD bonus. Of the $367.5 million in approved
awards for these projects, $59.3 million, or about 16%, consists of TOD bonuses. This overlap
of bonus categories with base awards for Qualified Incentive Areas raises the question of
whether the TOD bonus is redundant in these areas, rewarding a decision that is already in
most cases a simple fact of locating in either an Urban Transit Hub or GSGZ.
Recommendation: We suggest that NJEDA consider reducing or eliminating this bonus for
Urban Transit Hubs and GSGZs. For this and other bonuses, we also recommend that NJEDA
consider the possibility of replacing some bonus categories with increases in base awards.
Though such an approach might remove emphasis from certain types or areas of development,
it could result in more efficient allocations of funds. For example, the TOD bonus used by 93
projects accounts for over $377 million. We estimate that adding $500 to the base award for
every project (not including Camden alternatives) would increase total awards by
approximately $190 million. Such a shift could serve to broaden the reach of the awards while
simplifying the program and reducing overall costs.
14 The program rules define transit-oriented development as "a qualified business facility located
within a 1/2-mile radius, or one-mile radius for projects located in a Garden State Growth Zone,
surrounding the mid-point of a New Jersey Transit Corporation, Port Authority Transit Corporation,
or Port Authority Trans-Hudson Corporation rail, bus, or ferry station platform area, including all
light rail stations. For the purposes of determining the transit project bonus pursuant to N.J.A.C.
19:31-8.8(c)4, a bus station platform is a terminal as listed on the EDA's website at www.njeda.com.”
34
Issue #3: Large Job Creators Bonus Redundancy
The bonus to firms creating and/or retaining at least 250 jobs is somewhat redundant
for Mega Projects and to some degree for other projects as well. [As of January 2018, EDA no
longer accepts applications for businesses under the Mega project designation; however, we
note its overlap with the bonus for large employers to illustrate possible cost redundancies.]
The value of the bonus ranges from $500 to $1,500 per job, depending on the number of jobs
created/retained. This bonus was applied for all 16 Mega projects included in this review,
accounting for approximately $103.8 million of the total awards of $838.5 million approved for
these projects. In most cases, the Mega project base award was available to firms in certain
industries locating in certain areas that are required to create/retain a minimum of 250, or in
some cases 1,000 jobs, as well as meeting certain capital investment requirements.15 Because
the designation of a Mega project already in some cases carries with it a higher base award than
would otherwise have been available based on capital investment and employment
requirements,16 the additional bonus for creating large numbers of jobs at least in part rewards
firms for meeting criteria that had already been rewarded as part of the Mega Project base
award. In a broader sense, there is some redundancy in this bonus category itself. As awards
are calculated on a per-job basis, there is already a significant financial incentive for those
firms that create large numbers of jobs. Further, because the bonus is applied for all jobs
created by a project, rather than for the additional jobs created above each threshold, the
addition of a single job can significantly increase the cost of the award. For example, a project
creating 250 new jobs would not qualify for the bonus at all, but would receive a $500 bonus
for each job annually if it created one more job – a total of $125,500 per year. Similarly, under
the current structure a project creating 1,000 new jobs would be eligible for a bonus of $1,250
per job for a total of $1.25 million; by adding one additional job, the per-job award would
increase to $1,500, resulting in a total bonus of $1.5 million – an additional award of $251,500
annually.
Recommendation: While the Mega project designation no longer exists, this bonus still
contains some redundancy in costs for other project types as well. We recommend that EDA
consider eliminating this bonus or revising it to apply the per-job bonuses only to the marginal
jobs created in excess of each threshold.
15 For projects located in certain areas of Atlantic, Burlington, Camden, Cape May, Cumberland,
Gloucester, Ocean or Salem counties and meeting certain capital investment requirements, the
minimum employment is 150 jobs for classification as a Mega Project. The four approved Mega Projects
in those counties all qualify with at least 250 jobs. 16 For some Mega project designations, such as those located in Urban Transit Hubs, the base award
would be the same whether the project met the Mega requirements or not.

35
Issue #4: Deep Poverty Pocket Redundancy
The $1,500 per-job bonus for locating in a Deep Poverty Pocket or Choice Neighborhood
Transformation area is part of 52 awards, including 27 of 28 GSGZ awards. For these 27
awards, the bonus accounts for $245.2 million of $417.1 million in total awards, or about 59%.
As in the case of the TOD bonus, this overlap between the base award location and that of the
bonus category suggests that there is some redundancy in the bonus for these areas. However,
the bonus may be incentivizing location in these particular tracts as opposed to other areas of
these cities. We note that of 24 Census tracts in Trenton, 19 qualify, as do 12 of 14 in Passaic,
25 of 33 in Paterson, all 17 in Camden and 13 of 14 in Atlantic City.
Recommendation: We recommend that NJEDA examine in more depth whether this bonus is
influencing site selection within the GSGZs.
Issue #5: MRI data needs updating
To date, the program has relied on Municipal Revitalization Index values calculated
using 2007 data.
Recommendation: This index has recently been reformulated and updated by the New Jersey
Department of Community Affairs and the more current values should be used in determining
eligibility for this bonus in the future.
36
USE OF BENEFIT-COST TEST IN AWARD EVALUATIONS
The EOA legislation directs NJEDA to use a benefit-cost test to determine whether
applicants qualify for Grow NJ awards. The test compares the benefits of the award –
measured in terms of the state and local tax revenues associated with both the project’s initial
capital expenditures and with the firm’s operations – with the costs – the dollar value of the
tax credits granted to the applicant. Benefit-cost analysis is a useful tool both for organizing
and categorizing the types of benefits and costs that might arise over time in relation to a
proposed expenditure, and for estimating the magnitude of those benefits and costs. Benefit-
cost models can play an important role in evaluating projects such as those implemented
under Grown NJ and ERG, helping to understand how different benefits and costs accrue
over time. At the same time, the results of such models are highly sensitive both to their own
underlying structure and parameters, and to the model inputs used to analyze a given project
or other initiative. In addition, the context in which the results – in terms of a net benefit or
benefit-cost ratio – of a benefit-cost analysis are interpreted should be carefully considered
as part of the decision-making process.
SUMMARY
This section explores the use of the benefit-cost test in the Grow NJ award
evaluations. A more detailed and technical discussion of the benefit-cost test can be found
in Appendix V. Findings in reviewing the benefit-cost test include:
A benefit-cost ratio higher than 1.1 would reflect the element of uncertainty
regarding the role of the award in the retention or attraction of any given firm and
could potentially reduce the number of approved awards or require a reduction in
the size of many awards relative to the projects’ projected benefits.
Benefit-cost ratios for the 227 projects considered in this report range from 1.0 to as
high as 26.9. The average benefit-cost ratio for all projects is approximately 5.9;
the cumulative average (weighted by award size) is 2.5, but rises to 5.4 when the
Camden alternatives are excluded from the calculation (the arithmetic average is
only slightly higher at 6.1).
A number of revisions to the benefit-cost methodology have already been adopted
by NJEDA in order to make the calculated benefit-cost ratios more accurate, and
in most cases, more conservative. A series of further technical revisions are
recommended for the benefit-cost model that have a variety of potential effects on
calculated benefits.
Further research is suggested to provide an empirical comparison between benefit-
cost models, across regions and job types, in order to identify how raising the
benefit-cost threshold would affect past and future awards.
37
In this section, we first discuss the overall benefit-cost framework used in assessing
Grow New Jersey awards. In particular, we examine the benefit-cost thresholds that projects
are required to meet in order to be approved. We then highlight several model revisions
adopted by EDA, as well as additional issues regarding model inputs and parameters that
require further attention. Appendix V examines in detail the parameters and inputs used in
measuring the benefits and costs of proposed Grow NJ projects and the effect of certain
changes, some of which have already been adopted, on benefit-cost calculations. Careful
examinations of the benefit-cost calculations for several awards are presented to highlight
the impact of the various parameters and changes on the benefit-cost calculus.
Benefit-Cost Analysis Thresholds
A key question surrounding location incentives like Grow NJ is whether they actually
affect firm behavior, or whether they may reward decisions that firms would have made even
in the absence of the incentive. There is a wealth of academic literature examining this
question and supporting both sides of the issue. We do not seek here to provide a definitive
answer; however, we do suggest an approach for considering the benefits and costs of the
Grow New Jersey awards that accounts for the uncertainty surrounding the effect of
incentives on firm behavior.
In a 2015 paper, Duanjie Chen of the University of Calgary, citing Sebastian James
of The World Bank, provides a set of metrics for codifying the extent to which tax incentives
have influenced firm behavior. These include:
“Redundancy ratio: the amount of investment that is within the TIP [Tax
Incentive Program] target but would be in place even without the TIP, as a
share of the total investment within the target of TIP.”
“Displacement share: a ‘net addition’ of investment within the TIP target (e.g.,
the targeted geographic area, or business line, or capital size, or investor’s
nationality, etc.) may include a relocation (i.e., displacement) of existing capital
from outside of the TIP target; such a net addition within the TIP target
represents a “washout” within the overall economy and a sure loss in both
economic efficiency and government revenue. This displacement effect should
be measured as a share of the additional investment truly attributable to the
TIP. A high displacement share indicates a great efficiency and revenue loss;
and vice versa.
While in practice it is not necessarily possible to measure these indicators directly, they do
provide a helpful framework for considering the costs of incentives.
As previously noted, Grow NJ applicants are initially required to demonstrate that
there is a cost differential between the proposed New Jersey site and an alternative project
site outside the state. The Grow NJ program further requires the CEOs of companies
receiving Grow NJ credits to attest that credits constitute a material factor in the company’s
38
decision. However, even with this provision and a demonstrated cost differential, it would
still be prudent for the benefit-cost evaluation structure to reflect the possibility that not all
economic activity associated with the awards is necessarily a direct product thereof. The
current benefit-cost parameters for the program do not embody this possibility.
Under the Economic Opportunity Act of 2013, the current analytical framework for
Grow NJ requires that the ratio of benefits to costs for proposed awards be at least 1.1 (110%)
for most awards (or 1.0 (100%) in the case of Garden State Growth Zone awards). Benefits
consist of corporate business taxes, income taxes to be paid by the workers in the new and
retained jobs, and local property taxes, as well as the income taxes and sales taxes generated
indirectly via the economic ripple or “multiplier” effects of the awardees’ operations. While
this standard – a benefit-cost ratio of (or 1.0 for GSGZs) does require the calculated benefits
– in terms of state and local tax revenue – to exceed (or equal) the cost of the credits for a
given project, it effectively assumes very low redundancy ratios and displacement shares. In
other words, these benefit-cost thresholds assume that all or nearly all (91%, or 100% for
GSGZs) economic activity associated with these projects would not have occurred in the state
were it not for the awards.
Considered from this perspective, a higher benefit-cost ratio would reflect an element
of uncertainty regarding the role of the award in the retention or attraction of a given firm.
For example, with a benefit-cost threshold of 2.0, even if only 50% of a given firm’s benefits
were attributable to the effect of the award, it would still pass the benefit-cost test. Similarly,
with a threshold of 5.0, one could state that even if only 20% of the benefits were attributable
to the award, it would still pass the test. While in reality it is not possible to attribute a given
percentage of the benefits to the award, such an approach - which would in practice reduce
the number of approved awards, or alternatively, require a reduction in the size of many
awards relative to the projects’ projected benefits – would reflect the uncertainty surrounding
the attribution of benefits to the awards.
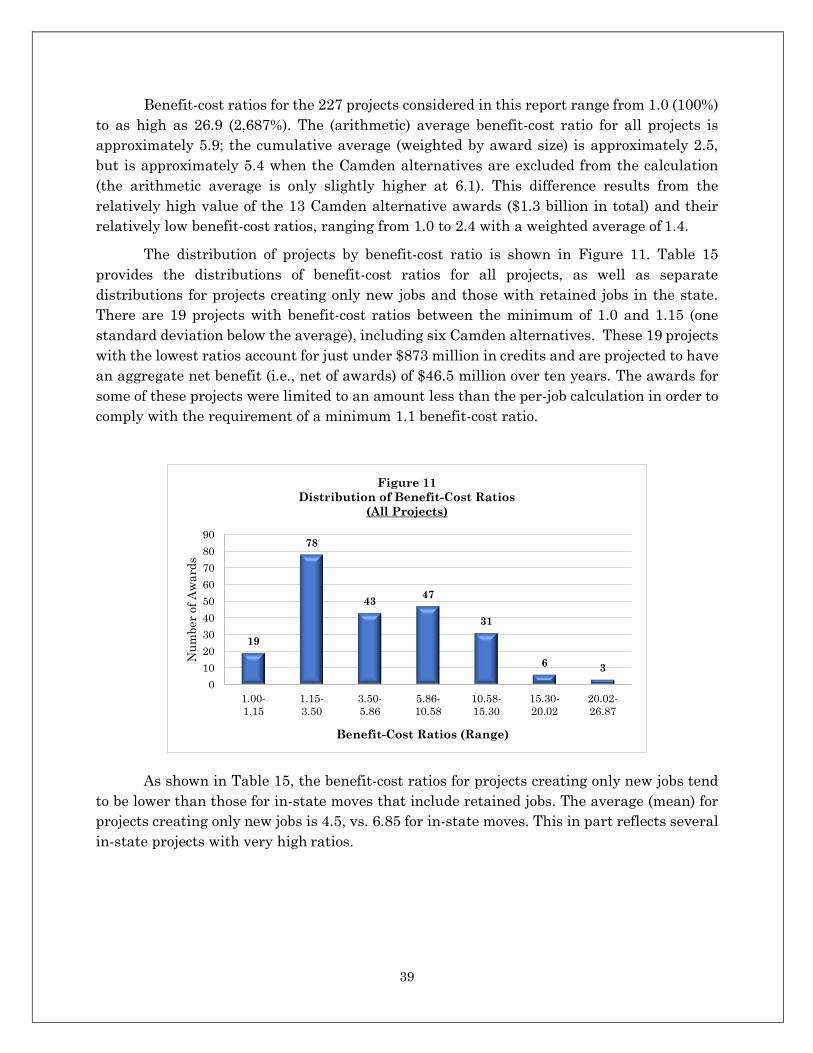
39
Benefit-cost ratios for the 227 projects considered in this report range from 1.0 (100%)
to as high as 26.9 (2,687%). The (arithmetic) average benefit-cost ratio for all projects is
approximately 5.9; the cumulative average (weighted by award size) is approximately 2.5,
but is approximately 5.4 when the Camden alternatives are excluded from the calculation
(the arithmetic average is only slightly higher at 6.1). This difference results from the
relatively high value of the 13 Camden alternative awards ($1.3 billion in total) and their
relatively low benefit-cost ratios, ranging from 1.0 to 2.4 with a weighted average of 1.4.
The distribution of projects by benefit-cost ratio is shown in Figure 11. Table 15
provides the distributions of benefit-cost ratios for all projects, as well as separate
distributions for projects creating only new jobs and those with retained jobs in the state.
There are 19 projects with benefit-cost ratios between the minimum of 1.0 and 1.15 (one
standard deviation below the average), including six Camden alternatives. These 19 projects
with the lowest ratios account for just under $873 million in credits and are projected to have
an aggregate net benefit (i.e., net of awards) of $46.5 million over ten years. The awards for
some of these projects were limited to an amount less than the per-job calculation in order to
comply with the requirement of a minimum 1.1 benefit-cost ratio.
As shown in Table 15, the benefit-cost ratios for projects creating only new jobs tend
to be lower than those for in-state moves that include retained jobs. The average (mean) for
projects creating only new jobs is 4.5, vs. 6.85 for in-state moves. This in part reflects several
in-state projects with very high ratios.
19
6
19
78
4347
31
6 3
0
10
20
30
40
50
60
70
80
90
1.00-
1.15
1.15-
3.50
3.50-
5.86
5.86-
10.58
10.58-
15.30
15.30-
20.02
20.02-
26.87
Nu
mb
er
of
Aw
ard
s
Benefit-Cost Ratios (Range)
Figure 11
Distribution of Benefit-Cost Ratios
(All Projects)
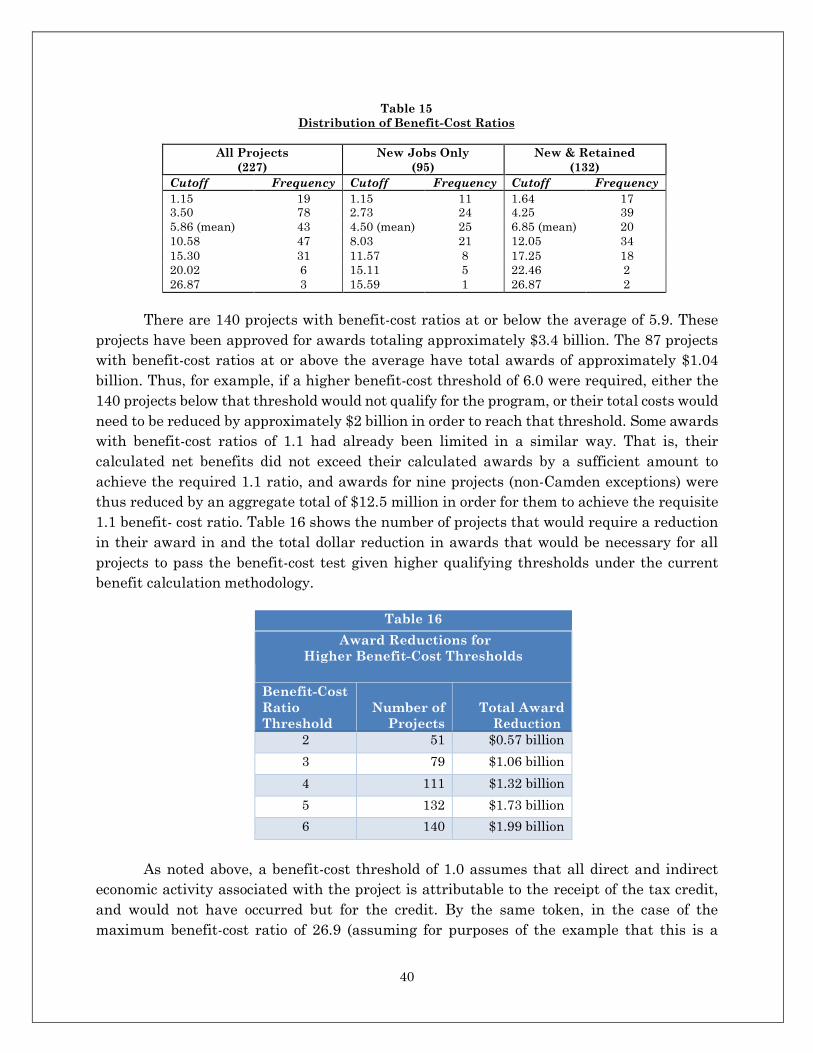
40
Table 15
Distribution of Benefit-Cost Ratios
All Projects
(227) New Jobs Only
(95) New & Retained
(132) Cutoff Frequency Cutoff Frequency Cutoff Frequency 1.15 19 1.15 11 1.64 17 3.50 78 2.73 24 4.25 39 5.86 (mean) 43 4.50 (mean) 25 6.85 (mean) 20 10.58 47 8.03 21 12.05 34 15.30 31 11.57 8 17.25 18 20.02 6 15.11 5 22.46 2 26.87 3 15.59 1 26.87 2
There are 140 projects with benefit-cost ratios at or below the average of 5.9. These
projects have been approved for awards totaling approximately $3.4 billion. The 87 projects
with benefit-cost ratios at or above the average have total awards of approximately $1.04
billion. Thus, for example, if a higher benefit-cost threshold of 6.0 were required, either the
140 projects below that threshold would not qualify for the program, or their total costs would
need to be reduced by approximately $2 billion in order to reach that threshold. Some awards
with benefit-cost ratios of 1.1 had already been limited in a similar way. That is, their
calculated net benefits did not exceed their calculated awards by a sufficient amount to
achieve the required 1.1 ratio, and awards for nine projects (non-Camden exceptions) were
thus reduced by an aggregate total of $12.5 million in order for them to achieve the requisite
1.1 benefit- cost ratio. Table 16 shows the number of projects that would require a reduction
in their award in and the total dollar reduction in awards that would be necessary for all
projects to pass the benefit-cost test given higher qualifying thresholds under the current
benefit calculation methodology.
Table 16
Award Reductions for
Higher Benefit-Cost Thresholds
Benefit-Cost
Ratio
Threshold
Number of
Projects
Total Award
Reduction 2 51 $0.57 billion
3 79 $1.06 billion
4 111 $1.32 billion
5 132 $1.73 billion
6 140 $1.99 billion
As noted above, a benefit-cost threshold of 1.0 assumes that all direct and indirect
economic activity associated with the project is attributable to the receipt of the tax credit,
and would not have occurred but for the credit. By the same token, in the case of the
maximum benefit-cost ratio of 26.9 (assuming for purposes of the example that this is a
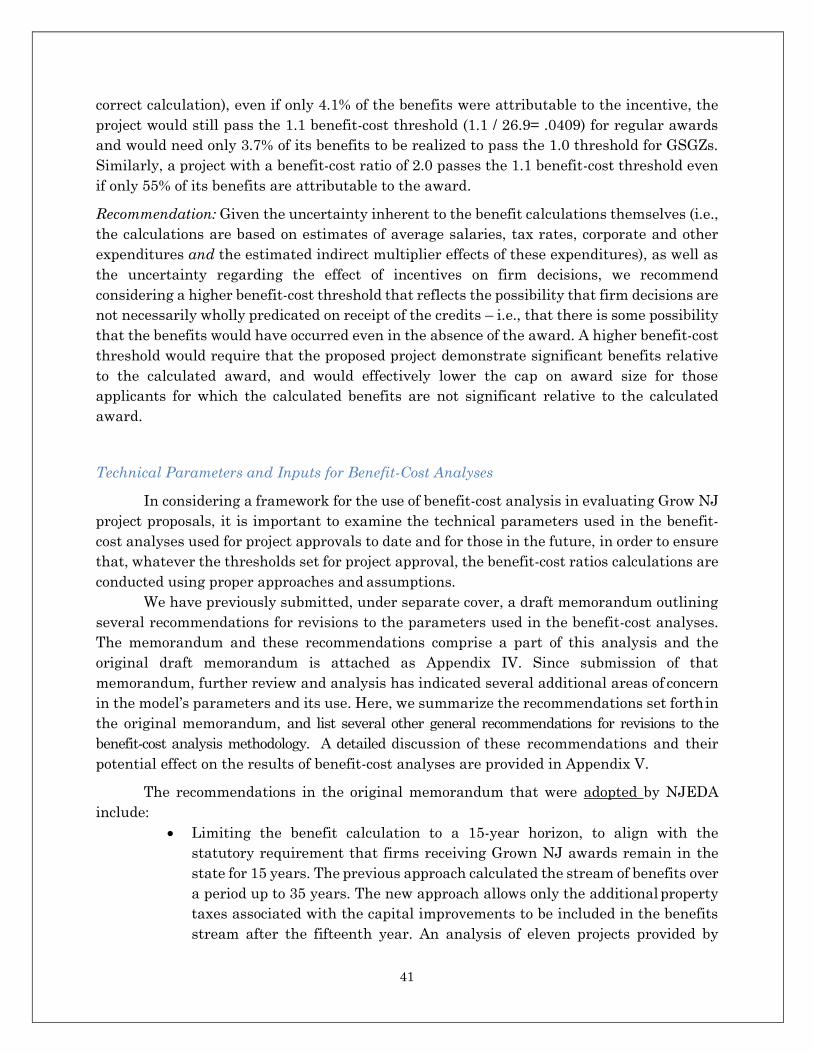
41
correct calculation), even if only 4.1% of the benefits were attributable to the incentive, the
project would still pass the 1.1 benefit-cost threshold (1.1 / 26.9= .0409) for regular awards
and would need only 3.7% of its benefits to be realized to pass the 1.0 threshold for GSGZs.
Similarly, a project with a benefit-cost ratio of 2.0 passes the 1.1 benefit-cost threshold even
if only 55% of its benefits are attributable to the award.
Recommendation: Given the uncertainty inherent to the benefit calculations themselves (i.e.,
the calculations are based on estimates of average salaries, tax rates, corporate and other
expenditures and the estimated indirect multiplier effects of these expenditures), as well as
the uncertainty regarding the effect of incentives on firm decisions, we recommend
considering a higher benefit-cost threshold that reflects the possibility that firm decisions are
not necessarily wholly predicated on receipt of the credits – i.e., that there is some possibility
that the benefits would have occurred even in the absence of the award. A higher benefit-cost
threshold would require that the proposed project demonstrate significant benefits relative
to the calculated award, and would effectively lower the cap on award size for those
applicants for which the calculated benefits are not significant relative to the calculated
award.
Technical Parameters and Inputs for Benefit-Cost Analyses
In considering a framework for the use of benefit-cost analysis in evaluating Grow NJ
project proposals, it is important to examine the technical parameters used in the benefit-
cost analyses used for project approvals to date and for those in the future, in order to ensure
that, whatever the thresholds set for project approval, the benefit-cost ratios calculations are
conducted using proper approaches and assumptions.
We have previously submitted, under separate cover, a draft memorandum outlining
several recommendations for revisions to the parameters used in the benefit-cost analyses.
The memorandum and these recommendations comprise a part of this analysis and the
original draft memorandum is attached as Appendix IV. Since submission of that
memorandum, further review and analysis has indicated several additional areas of concern
in the model’s parameters and its use. Here, we summarize the recommendations set forth in
the original memorandum, and list several other general recommendations for revisions to the
benefit-cost analysis methodology. A detailed discussion of these recommendations and their
potential effect on the results of benefit-cost analyses are provided in Appendix V.
The recommendations in the original memorandum that were adopted by NJEDA
include:
Limiting the benefit calculation to a 15-year horizon, to align with the
statutory requirement that firms receiving Grown NJ awards remain in the
state for 15 years. The previous approach calculated the stream of benefits over
a period up to 35 years. The new approach allows only the additional property
taxes associated with the capital improvements to be included in the benefits
stream after the fifteenth year. An analysis of eleven projects provided by
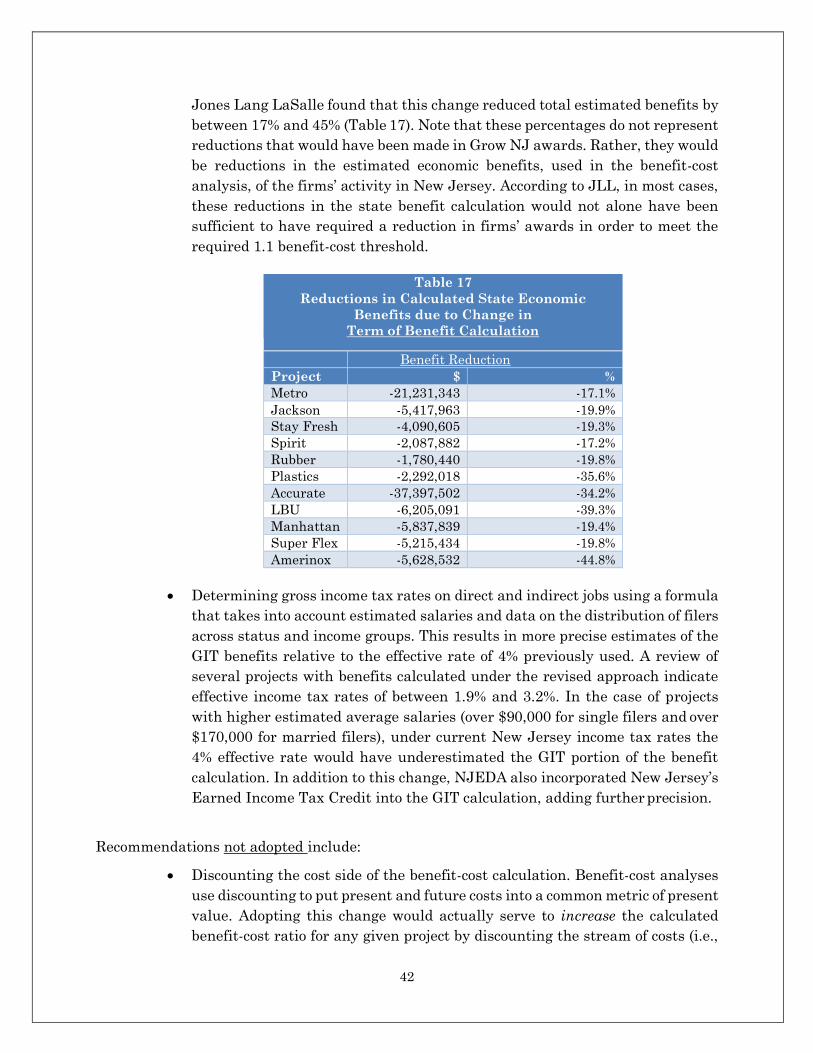
42
Jones Lang LaSalle found that this change reduced total estimated benefits by
between 17% and 45% (Table 17). Note that these percentages do not represent
reductions that would have been made in Grow NJ awards. Rather, they would
be reductions in the estimated economic benefits, used in the benefit-cost
analysis, of the firms’ activity in New Jersey. According to JLL, in most cases,
these reductions in the state benefit calculation would not alone have been
sufficient to have required a reduction in firms’ awards in order to meet the
required 1.1 benefit-cost threshold.
Table 17
Reductions in Calculated State Economic
Benefits due to Change in
Term of Benefit Calculation
Benefit Reduction Project $ % Metro -21,231,343 -17.1% Jackson -5,417,963 -19.9% Stay Fresh -4,090,605 -19.3% Spirit -2,087,882 -17.2% Rubber -1,780,440 -19.8% Plastics -2,292,018 -35.6% Accurate -37,397,502 -34.2% LBU -6,205,091 -39.3% Manhattan -5,837,839 -19.4% Super Flex -5,215,434 -19.8% Amerinox -5,628,532 -44.8%
Determining gross income tax rates on direct and indirect jobs using a formula
that takes into account estimated salaries and data on the distribution of filers
across status and income groups. This results in more precise estimates of the
GIT benefits relative to the effective rate of 4% previously used. A review of
several projects with benefits calculated under the revised approach indicate
effective income tax rates of between 1.9% and 3.2%. In the case of projects
with higher estimated average salaries (over $90,000 for single filers and over
$170,000 for married filers), under current New Jersey income tax rates the
4% effective rate would have underestimated the GIT portion of the benefit
calculation. In addition to this change, NJEDA also incorporated New Jersey’s
Earned Income Tax Credit into the GIT calculation, adding further precision.
Recommendations not adopted include:
Discounting the cost side of the benefit-cost calculation. Benefit-cost analyses
use discounting to put present and future costs into a common metric of present
value. Adopting this change would actually serve to increase the calculated
benefit-cost ratio for any given project by discounting the stream of costs (i.e.,
43
the tax expenditure associated with the credit) over the 10-year period of the
award. Generally, this approach would decrease the net present value of the
cost of a given award by approximately 26%. In order to maintain a
conservative approach to the calculation of benefit-cost ratios, NJEDA has
opted to continue using the full (i.e., undiscounted) value of costs in its
calculations.
Adoption of an alternative discount rate reflecting the current cost of capital
to the state. The model was amended, however, to reflect a lower real growth
rate of 2.25%, rather than the previous 3%.
Based on review of the benefit-cost model, we recommend a number of technical revisions
that can, but do not necessarily, have significant effects on the results of benefit-cost
analyses for Grow NJ projects. We discuss two of the more potentially impactful of these
issues below, with a more thorough discussion of the technical recommendations provided
in Appendix V.
Appropriate Inclusion of Property Tax Revenues
Benefits included in the model include local property taxes to be paid on the
improvements made to property by the capital expenditures associated with each project.
These taxes are usually estimated at 3% on the value of eligible construction expenditures.
Garden State Growth Zones have the option of offering tax exemptions on these
improvements. In Camden, Trenton and Passaic, Grow NJ projects are exempt from payment
of property taxes on these improvements for the first five years, or in the case of projects
designated as Garden State Growth Zone Development Entities, ten years after project
completion. In the latter cases, property taxes are then phased in at 10% per year over the
subsequent 10-year period (years 11-20). However, we note that, according to the program
rules, the benefit-cost analyses for projects in these areas nevertheless include these tax
revenues in full in the benefit stream for the entire analysis period. For projects with
significant capital expenditures, these estimated revenues can constitute a significant
portion of the projected annual benefits even though such benefits are not realized by the
state or municipality. A review of a selection of the Camden alternatives shows property
taxes accounting for between 15% and 44% of annual project benefits. For those projects with
relatively low benefit-cost ratios where these taxes represent a large share of the calculated
benefits, their inclusion may have resulted in the benefit-cost threshold of 1.0 being attained
when it otherwise would not have been, even when benefits were calculated over a 35-year
period in cases prior to the adoption of the revised modeling parameters.
Recommendation: We recommend that these non-realized tax revenues be excluded from
future benefit-cost analyses.
44
Use of State-Level Multipliers
The calculation of a project’s benefits includes tax revenues generated both through
the direct activity of the firm (e.g., income taxes paid by the firm’s employees), and through
the additional indirect economic activity that occurs as a result of the firm’s initial operating
and capital expenditures. Economic multipliers are tools used to estimate the magnitude of
this latter, indirect economic activity that occurs as the result of an initial investment,
expenditure or other economic event. The benefit-cost model used by NJEDA was designed
using county-level multipliers produced by the U.S. Bureau of Economic Analysis’s RIMS II
input-output modeling system. The use of county-level multipliers was chosen in order to
obtain relatively conservative benefit estimates, given that multipliers for counties tend to
be smaller than they are for states. More conservative estimates of indirect economic effects
would result in a more rigorous benefit-cost test for Grow NJ applicants. It is true that use
of county-level multipliers will generally result in somewhat more conservative estimates of
the income taxes calculated on the basis of indirect earnings, and of the sales taxes on
business expenditures generated indirectly by the initial business activity. However, due to
an incomplete understanding within NJEDA’s benefit-cost model of how worker commuting
between counties affects the use of multipliers, we suggest that the use of county multipliers
in the benefit-cost model contributes to sometimes significant mis-estimation of benefits,
including potential over- estimation.
Recommendation: Given this issue as well as other potential issues surrounding the use of
county multipliers, we recommend that state-level RIMS II multipliers be used instead. We
also recommend that some of the benefit calculations be revised to incorporate alternative
data in lieu of multipliers. These recommendations for technical revisions to the benefit-cost
modeling process are described in Appendix V.
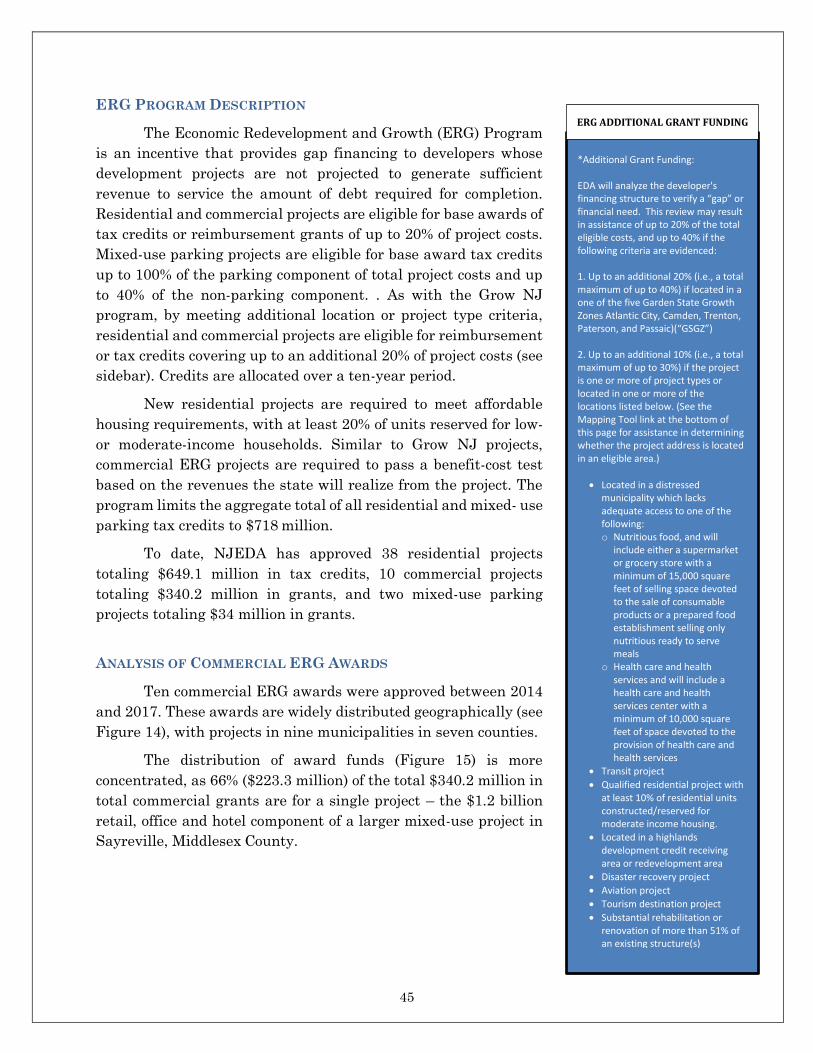
45
ERG PROGRAM DESCRIPTION
The Economic Redevelopment and Growth (ERG) Program
is an incentive that provides gap financing to developers whose
development projects are not projected to generate sufficient
revenue to service the amount of debt required for completion.
Residential and commercial projects are eligible for base awards of
tax credits or reimbursement grants of up to 20% of project costs.
Mixed-use parking projects are eligible for base award tax credits
up to 100% of the parking component of total project costs and up
to 40% of the non-parking component. . As with the Grow NJ
program, by meeting additional location or project type criteria,
residential and commercial projects are eligible for reimbursement
or tax credits covering up to an additional 20% of project costs (see
sidebar). Credits are allocated over a ten-year period.
New residential projects are required to meet affordable
housing requirements, with at least 20% of units reserved for low-
or moderate-income households. Similar to Grow NJ projects,
commercial ERG projects are required to pass a benefit-cost test
based on the revenues the state will realize from the project. The
program limits the aggregate total of all residential and mixed- use
parking tax credits to $718 million.
To date, NJEDA has approved 38 residential projects
totaling $649.1 million in tax credits, 10 commercial projects
totaling $340.2 million in grants, and two mixed-use parking
projects totaling $34 million in grants.
ANALYSIS OF COMMERCIAL ERG AWARDS
Ten commercial ERG awards were approved between 2014
and 2017. These awards are widely distributed geographically (see
Figure 14), with projects in nine municipalities in seven counties.
The distribution of award funds (Figure 15) is more
concentrated, as 66% ($223.3 million) of the total $340.2 million in
total commercial grants are for a single project – the $1.2 billion
retail, office and hotel component of a larger mixed-use project in
Sayreville, Middlesex County.
*Additional Grant Funding: EDA will analyze the developer's financing structure to verify a “gap” or financial need. This review may result in assistance of up to 20% of the total eligible costs, and up to 40% if the following criteria are evidenced: 1. Up to an additional 20% (i.e., a total maximum of up to 40%) if located in a one of the five Garden State Growth Zones Atlantic City, Camden, Trenton, Paterson, and Passaic)(“GSGZ”) 2. Up to an additional 10% (i.e., a total maximum of up to 30%) if the project is one or more of project types or located in one or more of the locations listed below. (See the Mapping Tool link at the bottom of this page for assistance in determining whether the project address is located in an eligible area.)
Located in a distressed municipality which lacks adequate access to one of the following: o Nutritious food, and will
include either a supermarket or grocery store with a minimum of 15,000 square feet of selling space devoted to the sale of consumable products or a prepared food establishment selling only nutritious ready to serve meals
o Health care and health services and will include a health care and health services center with a minimum of 10,000 square feet of space devoted to the provision of health care and health services
Transit project
Qualified residential project with at least 10% of residential units constructed/reserved for moderate income housing.
Located in a highlands development credit receiving area or redevelopment area
Disaster recovery project
Aviation project
Tourism destination project
Substantial rehabilitation or renovation of more than 51% of an existing structure(s)
ERG ADDITIONAL GRANT FUNDING
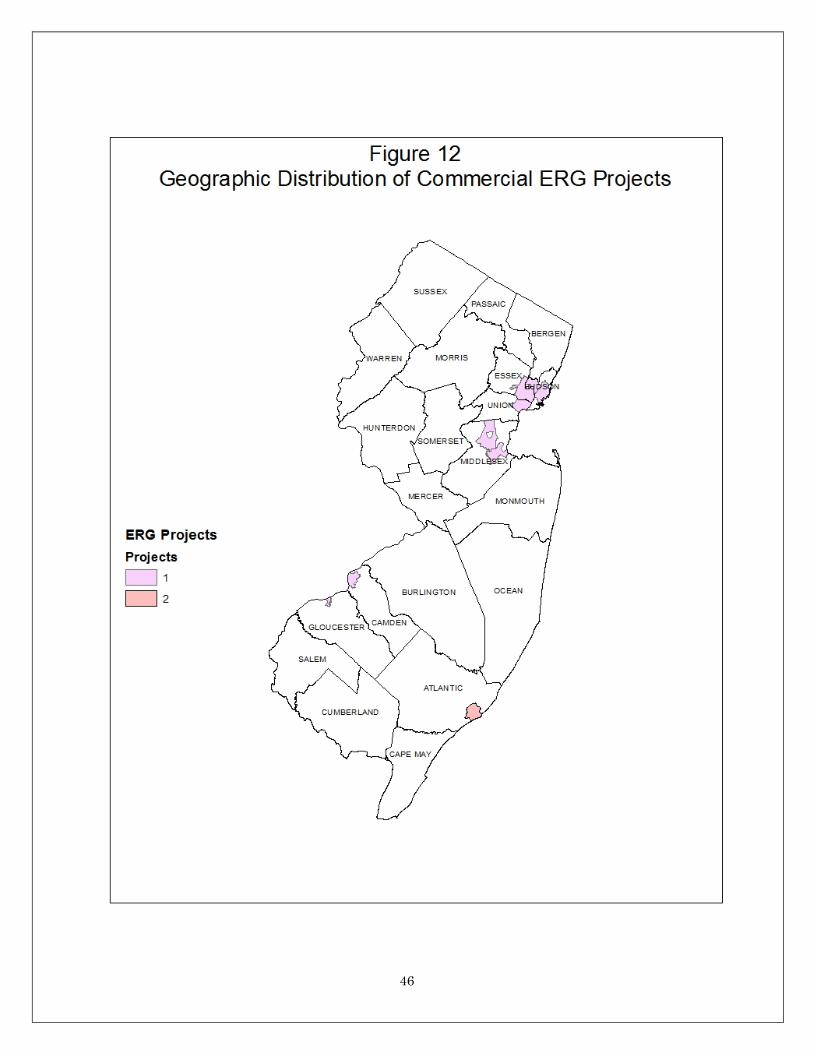
46
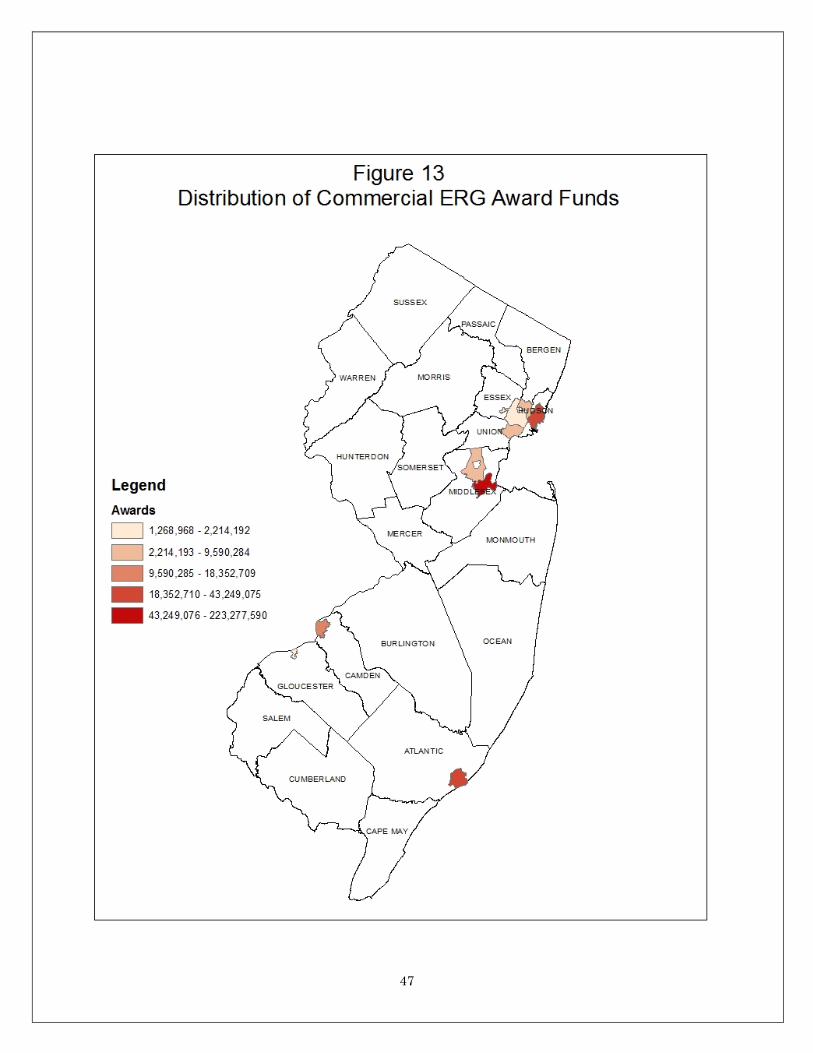
47
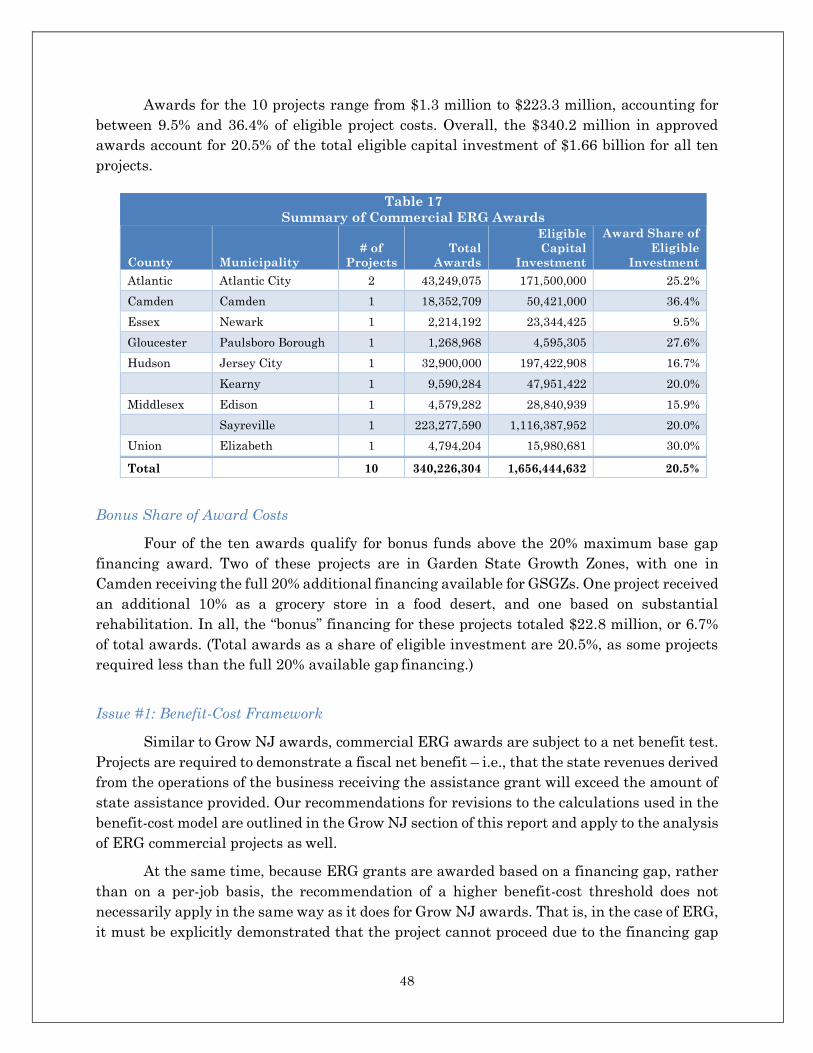
48
Awards for the 10 projects range from $1.3 million to $223.3 million, accounting for
between 9.5% and 36.4% of eligible project costs. Overall, the $340.2 million in approved
awards account for 20.5% of the total eligible capital investment of $1.66 billion for all ten
projects.
Table 17
Summary of Commercial ERG Awards
County
Municipality
# of
Projects
Total
Awards
Eligible
Capital
Investment
Award Share of
Eligible
Investment
Atlantic Atlantic City 2 43,249,075 171,500,000 25.2%
Camden Camden 1 18,352,709 50,421,000 36.4%
Essex Newark 1 2,214,192 23,344,425 9.5%
Gloucester Paulsboro Borough 1 1,268,968 4,595,305 27.6%
Hudson Jersey City 1 32,900,000 197,422,908 16.7%
Kearny 1 9,590,284 47,951,422 20.0%
Middlesex Edison 1 4,579,282 28,840,939 15.9%
Sayreville 1 223,277,590 1,116,387,952 20.0%
Union Elizabeth 1 4,794,204 15,980,681 30.0%
Total 10 340,226,304 1,656,444,632 20.5%
Bonus Share of Award Costs
Four of the ten awards qualify for bonus funds above the 20% maximum base gap
financing award. Two of these projects are in Garden State Growth Zones, with one in
Camden receiving the full 20% additional financing available for GSGZs. One project received
an additional 10% as a grocery store in a food desert, and one based on substantial
rehabilitation. In all, the “bonus” financing for these projects totaled $22.8 million, or 6.7%
of total awards. (Total awards as a share of eligible investment are 20.5%, as some projects
required less than the full 20% available gap financing.)
Issue #1: Benefit-Cost Framework
Similar to Grow NJ awards, commercial ERG awards are subject to a net benefit test.
Projects are required to demonstrate a fiscal net benefit – i.e., that the state revenues derived
from the operations of the business receiving the assistance grant will exceed the amount of
state assistance provided. Our recommendations for revisions to the calculations used in the
benefit-cost model are outlined in the Grow NJ section of this report and apply to the analysis
of ERG commercial projects as well.
At the same time, because ERG grants are awarded based on a financing gap, rather
than on a per-job basis, the recommendation of a higher benefit-cost threshold does not
necessarily apply in the same way as it does for Grow NJ awards. That is, in the case of ERG,
it must be explicitly demonstrated that the project cannot proceed due to the financing gap
49
(rather than that the project is at risk of locating outside the state). As such, the assumed
risk that the project would have proceeded even in the absence of the award is not as great.
However, commercial projects such as office and retail facilities receiving ERG grants are not
necessarily developments that would not have occurred in the state at all. Instead, the ERG
grants are intended to facilitate development in locations where projects might otherwise not
be realized. In some cases, such projects might still be built in nearby communities not
necessarily eligible for ERG assistance if there is sufficient market demand. As such, the net
benefits realized to the state for some projects might be realized even in the absence of any
public financing. This does not obviate the local need for certain types of projects – e.g., a
grocery store in a food desert – or suggest that it is problematic to facilitate projects in areas
where they would otherwise not be feasible. However, it does indicate that the metric of net
positive benefit to the state is not necessarily probative for all projects.
Recommendation: NJEDA should consider additional metrics for evaluating the viability and
benefit of commercial ERG projects. While economic impacts (e.g., additional tax revenues)
may accrue to the state as a result of such projects, it is not always clear that such projects
would not have been pursued elsewhere in the state in the absence of the ERG grant, and the
state benefits therefore may not necessarily constitute a net return to the state. This
recommendation applies only to the inclusion of state taxes in the calculation of state
benefits. Local benefits of such development may still be significant, and reflect the program’s
central objective of directing investment to areas where it would not otherwise have occurred.
Issue #2: Internal Rates of Return
Project financing gaps are analyzed in part using a hurdle rate model applied to the
internal rate of return on the equity portion of a project’s financing. While we have not
conducted a full accounting analysis of the hurdle rate determinations (i.e., the maximum
equity IRR determined by JLL based on project type and locality), we do note that the
improvements in IRR resulting from ERG gap financing have a wide range. Differentials run
from as low as 1.4 percentage points for a $200 million, 491,000-square-foot retail and office
tower in Jersey City to 13 percentage points for a $17 million, 55,000-square-foot grocery
store and mixed retail development in Elizabeth (a “food desert” project). All project
summaries state that the IRR in the absence of the ERG award would not be sufficient for
project completion. However, while the cash flow from the ERG grant would by definition
improve the IRR for any given project, it is not clear that very small increases in projected
IRR would necessarily significantly change a project’s viability.
Recommendation: NJEDA should clarify how the IRR calculation informs the evaluation for
each project in terms of the magnitude of the return to the developer and whether the level
of increase in IRR conditional on ERG assistance should be considered in project evaluations.
The amount of ERG funding available is not dependent on the IRR calculation, but it is not
clear from the current analytical framework that the higher IRR that results when ERG is
50
factored in to a project’s financing is either a necessary prerequisite of project completion or
necessarily sufficient to satisfy a developer’s target rate of return.
Issue #3: Multi-Phase Projects
An issue that has arisen in analyses of projects elsewhere is one that pertains to multi-
phase projects. One example was a 1,000-room flagship hotel targeted for city incentives in
San Antonio, Texas. The rationale for the incentives was that the hotel was to sit atop a large,
new conference center and the market would by nature only otherwise enable hoteliers to
commit to two hotels half that size and it would take eight years for the two to come on line.
The subsidy would open up the possibility for much larger conferences and, hence, much more
tourism over the course of those eight years. Analysis suggested, that the subsidy would pay
for itself through the time value of the earlier influx of taxes via tourism. Interestingly, the
oral history of the conference center suggest that it too was built with some city funds. And
this funding was also justified via tourism, by assuming the existence of a hotel that was
sufficiently large to lure to san Antonio large organizations like the American Medical
Association, which prefer a single venue in which most of their members can be housed either
on top of or immediately adjacent to the event/meeting space. In other words, a sort of circular
logic was applied to justify the two projects: Each justified the economic viability of the other.
If the hotel had been built first, the city’s hotels would have suffered heavy average vacancy
rates. Because the conference center was built first, it was unable to capture the large
volumes of visitations needed to pay for itself. Each without the other posed a possible
economic development failure.
Given the difficulty in assuring funding for all stages of a multi-phase project, how
can or should they viably be assessed? Presently NJ Administrative Code §19:31-4.6(a)3
states “For large, multi-phased projects that are built sequentially over time, the EDA shall
only evaluate and validate the project financing gap on phases of the project with funding
commitments.” While this provision limits the gap analysis (and potential award) to project
phases with funding commitments, as illustrated in the example above, it is important to
consider the inter-dependency of project phases, and to view the economic viability of those
phases being considered for ERG assistance in the context of future phases.
N.J.A.C. §19:31-4.3(a)2.ii notes “In the event the project is to be undertaken in phases,
a developer may apply for phases for which construction has not yet commenced, subject to
N.J.A.C. 19:31-4.6(a)2,” which states that “a developer's future expenditures will have to be
at least 100 percent of the project costs previously expended as of its application date in order
for the Authority to include the costs expended prior to the application date to be included in
the project costs.” Given the example above, this wording needs clarity and some
strengthening.
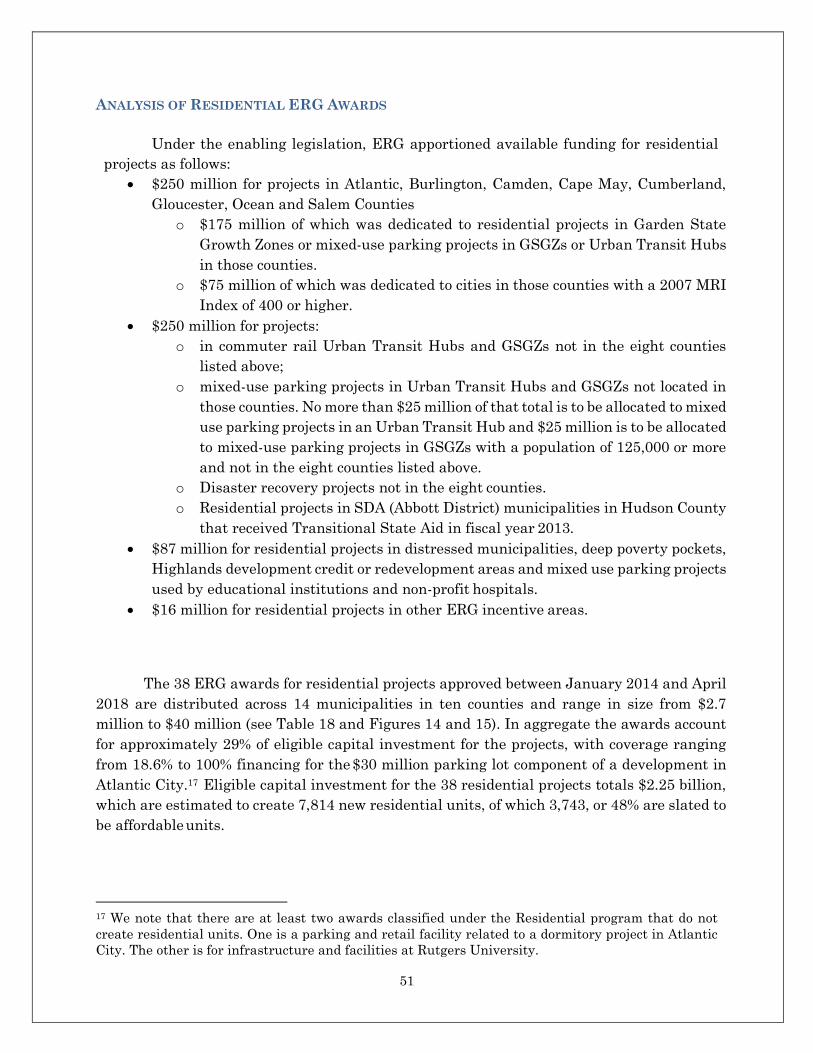
51
ANALYSIS OF RESIDENTIAL ERG AWARDS
Under the enabling legislation, ERG apportioned available funding for residential
projects as follows:
$250 million for projects in Atlantic, Burlington, Camden, Cape May, Cumberland,
Gloucester, Ocean and Salem Counties
o $175 million of which was dedicated to residential projects in Garden State
Growth Zones or mixed-use parking projects in GSGZs or Urban Transit Hubs
in those counties.
o $75 million of which was dedicated to cities in those counties with a 2007 MRI
Index of 400 or higher.
$250 million for projects:
o in commuter rail Urban Transit Hubs and GSGZs not in the eight counties
listed above;
o mixed-use parking projects in Urban Transit Hubs and GSGZs not located in
those counties. No more than $25 million of that total is to be allocated to mixed
use parking projects in an Urban Transit Hub and $25 million is to be allocated
to mixed-use parking projects in GSGZs with a population of 125,000 or more
and not in the eight counties listed above.
o Disaster recovery projects not in the eight counties.
o Residential projects in SDA (Abbott District) municipalities in Hudson County
that received Transitional State Aid in fiscal year 2013.
$87 million for residential projects in distressed municipalities, deep poverty pockets,
Highlands development credit or redevelopment areas and mixed use parking projects
used by educational institutions and non-profit hospitals.
$16 million for residential projects in other ERG incentive areas.
The 38 ERG awards for residential projects approved between January 2014 and April
2018 are distributed across 14 municipalities in ten counties and range in size from $2.7
million to $40 million (see Table 18 and Figures 14 and 15). In aggregate the awards account
for approximately 29% of eligible capital investment for the projects, with coverage ranging
from 18.6% to 100% financing for the $30 million parking lot component of a development in
Atlantic City.17 Eligible capital investment for the 38 residential projects totals $2.25 billion,
which are estimated to create 7,814 new residential units, of which 3,743, or 48% are slated to
be affordable units.
17 We note that there are at least two awards classified under the Residential program that do not
create residential units. One is a parking and retail facility related to a dormitory project in Atlantic
City. The other is for infrastructure and facilities at Rutgers University.
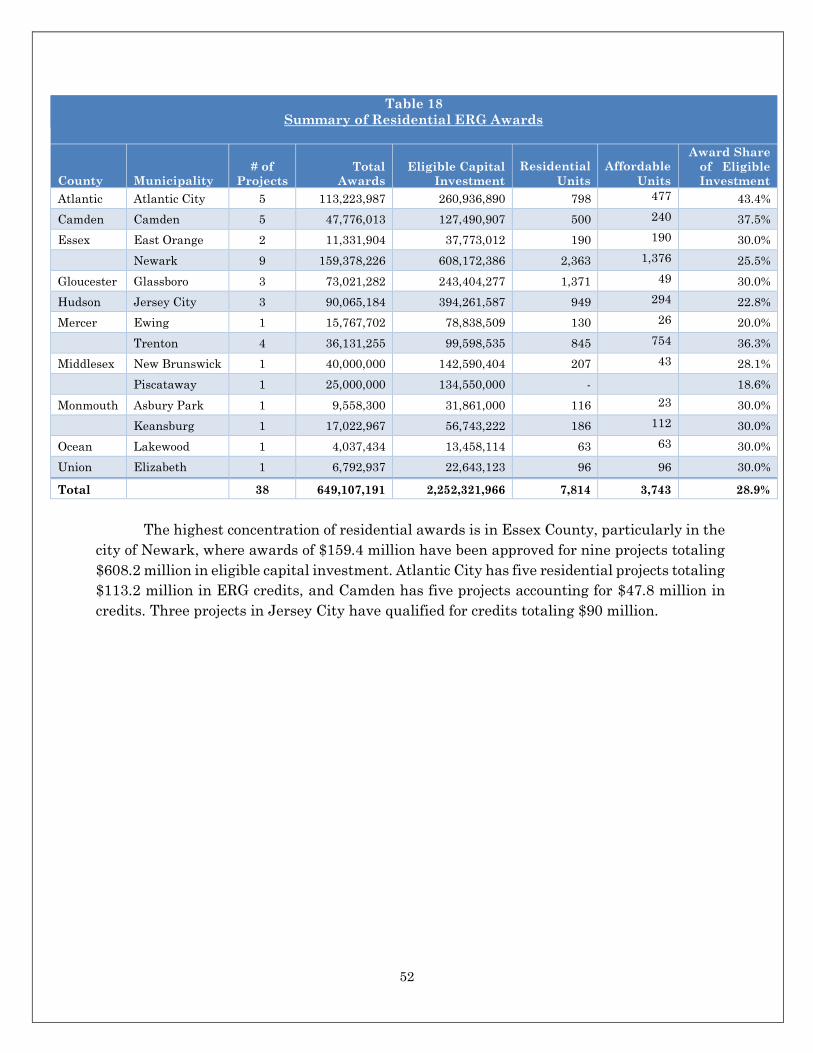
52
Table 18
Summary of Residential ERG Awards
County
Municipality
# of
Projects
Total
Awards
Eligible Capital
Investment
Residential
Units
Affordable
Units
Award Share
of Eligible
Investment Atlantic Atlantic City 5 113,223,987 260,936,890 798 477 43.4%
Camden Camden 5 47,776,013 127,490,907 500 240 37.5%
Essex East Orange 2 11,331,904 37,773,012 190 190 30.0%
Newark 9 159,378,226 608,172,386 2,363 1,376 25.5%
Gloucester Glassboro 3 73,021,282 243,404,277 1,371 49 30.0%
Hudson Jersey City 3 90,065,184 394,261,587 949 294 22.8%
Mercer Ewing 1 15,767,702 78,838,509 130 26 20.0%
Trenton 4 36,131,255 99,598,535 845 754 36.3%
Middlesex New Brunswick 1 40,000,000 142,590,404 207 43 28.1%
Piscataway 1 25,000,000 134,550,000 - 18.6%
Monmouth Asbury Park 1 9,558,300 31,861,000 116 23 30.0%
Keansburg 1 17,022,967 56,743,222 186 112 30.0%
Ocean Lakewood 1 4,037,434 13,458,114 63 63 30.0%
Union Elizabeth 1 6,792,937 22,643,123 96 96 30.0%
Total 38 649,107,191 2,252,321,966 7,814 3,743 28.9%
The highest concentration of residential awards is in Essex County, particularly in the
city of Newark, where awards of $159.4 million have been approved for nine projects totaling
$608.2 million in eligible capital investment. Atlantic City has five residential projects totaling
$113.2 million in ERG credits, and Camden has five projects accounting for $47.8 million in
credits. Three projects in Jersey City have qualified for credits totaling $90 million.
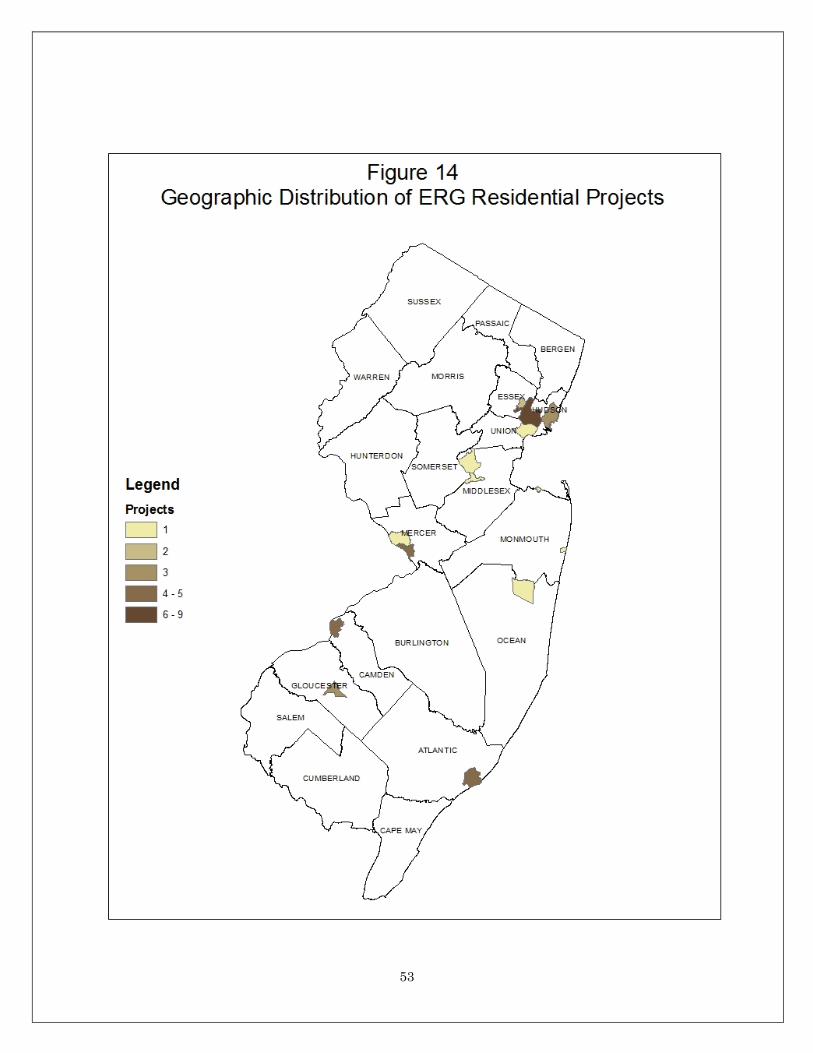
53
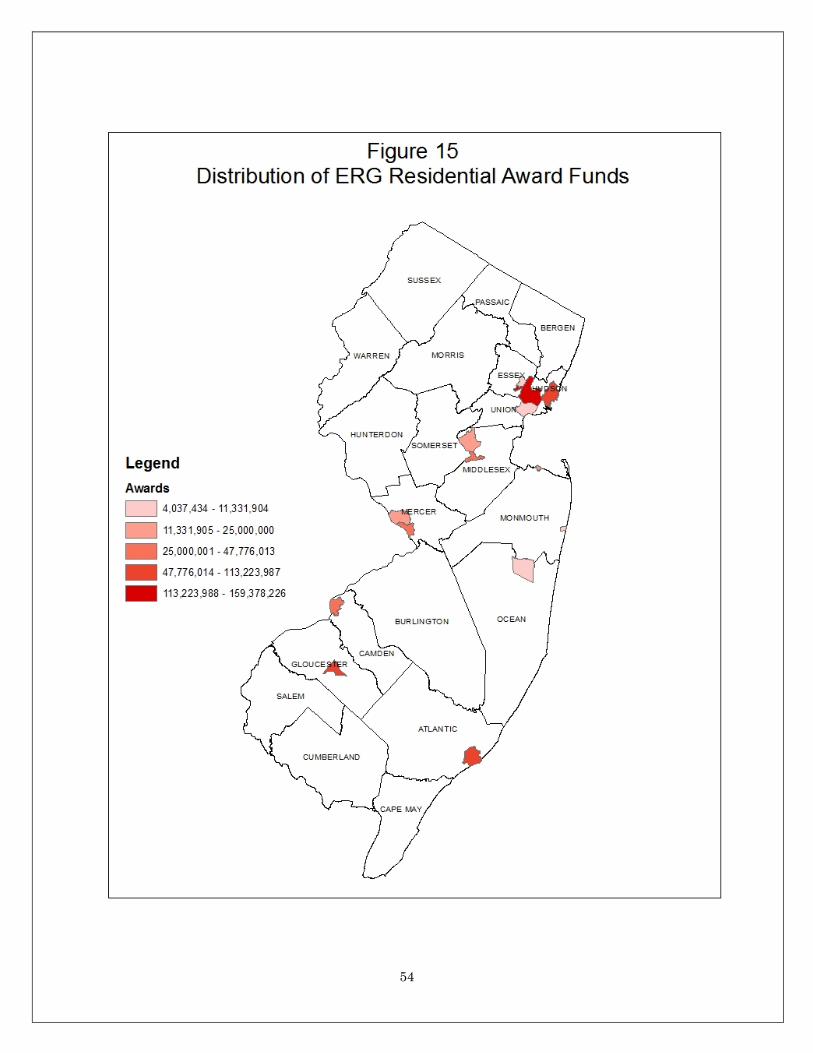
54
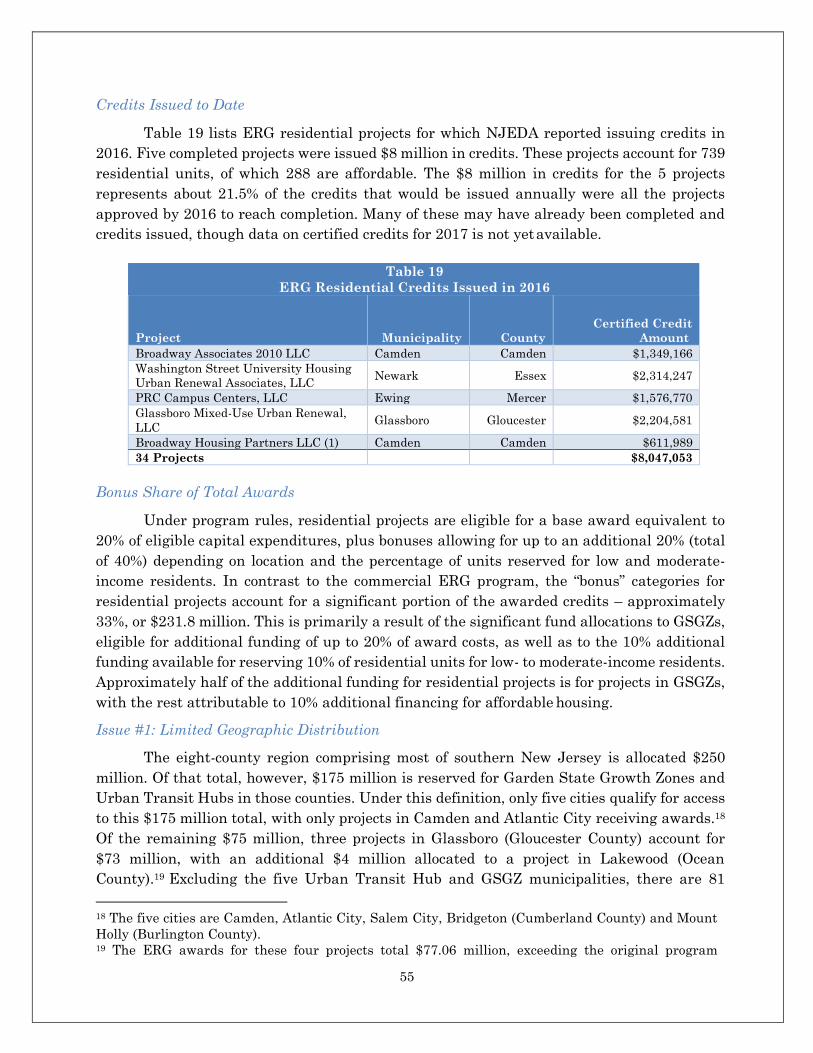
55
Credits Issued to Date
Table 19 lists ERG residential projects for which NJEDA reported issuing credits in
2016. Five completed projects were issued $8 million in credits. These projects account for 739
residential units, of which 288 are affordable. The $8 million in credits for the 5 projects
represents about 21.5% of the credits that would be issued annually were all the projects
approved by 2016 to reach completion. Many of these may have already been completed and
credits issued, though data on certified credits for 2017 is not yet available.
Table 19
ERG Residential Credits Issued in 2016
Project
Municipality
County
Certified Credit
Amount Broadway Associates 2010 LLC Camden Camden $1,349,166 Washington Street University Housing
Urban Renewal Associates, LLC Newark Essex $2,314,247
PRC Campus Centers, LLC Ewing Mercer $1,576,770 Glassboro Mixed-Use Urban Renewal,
LLC Glassboro Gloucester $2,204,581
Broadway Housing Partners LLC (1) Camden Camden $611,989 34 Projects $8,047,053
Bonus Share of Total Awards
Under program rules, residential projects are eligible for a base award equivalent to
20% of eligible capital expenditures, plus bonuses allowing for up to an additional 20% (total
of 40%) depending on location and the percentage of units reserved for low and moderate-
income residents. In contrast to the commercial ERG program, the “bonus” categories for
residential projects account for a significant portion of the awarded credits – approximately
33%, or $231.8 million. This is primarily a result of the significant fund allocations to GSGZs,
eligible for additional funding of up to 20% of award costs, as well as to the 10% additional
funding available for reserving 10% of residential units for low- to moderate-income residents.
Approximately half of the additional funding for residential projects is for projects in GSGZs,
with the rest attributable to 10% additional financing for affordable housing.
Issue #1: Limited Geographic Distribution
The eight-county region comprising most of southern New Jersey is allocated $250
million. Of that total, however, $175 million is reserved for Garden State Growth Zones and
Urban Transit Hubs in those counties. Under this definition, only five cities qualify for access
to this $175 million total, with only projects in Camden and Atlantic City receiving awards.18
Of the remaining $75 million, three projects in Glassboro (Gloucester County) account for
$73 million, with an additional $4 million allocated to a project in Lakewood (Ocean
County).19 Excluding the five Urban Transit Hub and GSGZ municipalities, there are 81
18 The five cities are Camden, Atlantic City, Salem City, Bridgeton (Cumberland County) and Mount
Holly (Burlington County). 19 The ERG awards for these four projects total $77.06 million, exceeding the original program
56
municipalities in the eight counties with 2007 MRI ranking of 400 or higher. These
municipalities had an aggregate population of over 644,000 in 2010, including seven with
populations over 20,000 and one with population over 60,000 (Vineland, 2007 MRI Rank
#474). The five GSGZ/UTH cities had total population of 157,000. The allocations for northern
New Jersey are similarly explicitly channeled to a limited number of cities (e.g., Newark,
Jersey City).
Recommendation: While the geographic distribution objectives for residential ERG awards are
largely explicitly embodied in the program funding allocations, and there is an allocation for
projects not located in pre-specified municipalities, we observe that the resulting geographic
distribution of these funds is limited to a small number of cities. Given the large number of
municipalities with high MRI 2007 rankings, including some of significant size, it may make
sense to consider strategies that would broaden the geographic reach of the program to employ
available funds in other areas that may benefit from residential development.20 The example
of financing allocation approaches used for affordable housing programs can be informative in
this regard.
Financing for affordable housing generally includes layered financing from a number of
sources, as is the case with most ERG projects. These include federal sources such as Federal
Housing Administration insurance, Low Income Housing Tax Credits, HOME Investment
Partnerships Program, historic tax credits (can be used for housing), and state and local
sources such as subsidies from the New Jersey Housing Mortgage and Finance Agency and
the Department of Community Affairs’ Balanced Housing Funds. Historically there has been
more demand for affordable housing financing than has been available, which has led to the
creation of a number of frameworks for determining which projects receive priority for
funding. A leading example of this is the Qualified Allocation Plan (QAP) used for the Low
Income Housing Tax Credit program.21 This plan lays out a detailed matrix of criteria for
prioritizing projects eligible for the limited supply of LIHTC assistance. Projects are scored
and ranked according to numerous parameters that include location, duration of availability
of LIHTC-funded units, provision of social services, provision of amenities, level of municipal
support, energy efficiency, proximity to certain land uses (grocery stores, pharmacies, etc.),
and a wide range of other factors.
While ERG is not exclusively an affordable housing program, we recommend that NJEDA
consider adopting a set of guiding criteria for determining residential funding priorities. The
QAP can serve as a useful example of a state-specific model for selecting and prioritizing
the multiple parameters that NJEDA may determine are germane to its residential project
financing objectives.
allocation of $75 million. It is not clear under which qualifying area Lakewood falls, as its 2007 MRI
rank was 298. 20 As noted earlier, we recommend that the updated 2017 MRI methodology and rankings be employed
for future programs, and that the rankings be updated regularly to reflect the relative changes in
economies of the state’s municipalities. 21 http://www.state.nj.us/dca/hmfa/developers/credits/allocations/qap.shtml
57
Issue #2: Inclusion of Non-Residential Awards
As seen in the allocation of ERG funds described above, the residential portion of the
program has been used as a vehicle for financing of certain non-residential projects. Notably,
this applies to the $25 million allocation for university infrastructure. This allocation is
specifically for a tax credit to Rutgers University as part of the $140 million construction of
new and renovation of existing athletic training facilities. The findings accompanying the
Economic Stimulus Act of 2009 (N.J. Stat. § 52:27D-489b), which created the original ERG
program, specifically foresee the use of tax credits to “assist institutions of higher education
to develop needed classrooms, laboratories, dormitory rooms and other educational facilities,”
and amendments made in 2015 add Rutgers as a qualified developer and specify university
infrastructure as a qualified category for assistance. While this project and other non-
residential projects are thus eligible for residential ERG financing under program rules, their
inclusion under the rubric of the residential program is somewhat confusing. Such projects
may not necessarily lend themselves to evaluation under the same parameters as residential
projects, and their purpose and potential impact are clearly different from that of more typical
residential projects.
Recommendation: Future programs should seek to clearly delineate and evaluate projects by
type. While the use of an existing funding mechanism such as the residential ERG for non-
residential projects is not necessarily problematic, potential differences in evaluation
parameters, project goals, economic outcomes and program purposes suggest that a separate
classification and/or approach is warranted.
Issue #3: Construction Employment
The original scope of the analysis of ERG projects proposed for this study consisted
primarily of assessing the economic impacts of the capital spending associated with selected
projects, for comparison to any impacts estimated as part of the benefit-cost model developed
by Jones Lange LaSalle. The impact estimates for both ongoing and one-time (capital)
expenditures associated with the JLL model have been reviewed in detail in the Grow NJ
analysis and accompanying case studies. Here we provide an estimate of the construction jobs
(job-years) associated with the total construction spending of all ERG residential projects in
aggregate.2234 This allows for a comparison of estimated direct construction employment
generated by these expenditures with publicly available estimates from NJEDA. For ease of
analysis, we exclude the two projects receiving ERG assistance that do not include the
construction of residential units; additionally, we consider all capital expenditures for other
projects to be for residential development, even in the case of mixed use projects. The aggregate
expenditures for these 36 projects total $2.32 billion, with $1.5 billion allocated to construction
and site improvements. Using the R/ECON input-output model, we estimate that these
22 Construction employment is generally measured in job-years. A job-year is equivalent to one job
lasting one year.
58
expenditures would generate approximately 8,834 job-years. This estimate is approximately
33% higher than NJEDA’s estimate of 6,608 jobs for the same projects.
We believe that this discrepancy is attributable to the difference in assumed
compensation rates for construction jobs in New Jersey.23 While the R/ECON model uses an
underlying estimate of average compensation (wages + benefits) for all construction jobs
(about $92,000), the NJEDA estimate appears to be based on county prevailing wage rates
ranging high as $125,000. The approach used by NJEDA – allocating 50% of construction costs
to labor, and then dividing by prevailing wage rates – is not unreasonable, but it should be
noted that it assumes that the total construction and site improvement costs for the project
were estimated assuming that prevailing wage rates will be paid by all contractors.24
Issue #4: Affordable Housing – Redundancy/Ambiguity in Program Rules
Among the objectives specified in the findings of the Economic Stimulus Act of 2009
(N.J. Stat. § 52:27D-489b) is the use of tax credits and other public financing mechanisms to
“assist the private development of affordable housing.” In the case of ERG, this objective is
reflected in the additional 10% financing of eligible project costs for “a qualified residential
project in which at least 10 percent of the residential units are constructed as and reserved
for moderate income housing.” At the same time, the program rules cite and stipulate
compliance with prior law requiring that residential developments receiving public funds
reserve at least 20% of units for low- to moderate-income residents. This would seem to
suggest that any project would by definition qualify for the additional funding assistance. It
is not clear from the available data whether some projects received this additional funding
based on meeting the legislated 20% threshold.
Recommendation: NJEDA should clarify the rules and data reporting regarding the affordable
housing requirement. If the development of affordable housing is considered a key objective of
the program, additional financing for projects that surpass the minimum 20% requirement
would be reasonable stipulation, but it is not clear whether the funding is being allocated in
this way.
23 EDA uses county level construction compensation estimates, while we have applied a state-wide
average to all projects. Any divergence in estimates arising from this difference would be minor. 24 The allocation of 50% of construction costs to labor is consistent with data for New Jersey reported
in the 2012 Economic Census, in which the sum of annual payroll, fringe benefits, and work
subcontracted to others for new multi-family housing construction comprise 48% of the value of
construction work. We recommend that this figure be re-confirmed as the latest data become available.
(The Economic Census is conducted every five years, with data released periodically in the following
years. The most recent Economic Census was conducted in 2017.)
59
APPENDIX I: DEFINITIONS OF BASE AWARD AND BONUS CATEGORIES
The following definitions and explanations are excerpted from the Grow New Jersey Program
Rules outlined in the New Jersey Administrative Code (N.J.A.C. 19:31-18.1 through 18.19).
Detailed definitions are provided for base award categories (Qualified Incentive Areas),
followed by detailed information on bonus categories.
Additional Information on Base Award Categories:
1) "Garden State Growth Zone" or "growth zone" means the four New Jersey cities with the
lowest median family income based on the 2009 American Community Survey from the
U.S. Census, (Table 708. Household, Family, and Per Capita Income and
Individuals, and Families Below Poverty Level by City: 2009); or a municipality
which contains a Tourism District as established pursuant to section 5 of P.L.
2011, c. 18 (N.J.S.A. 5:12-219) and regulated by the Casino Reinvestment
Development Authority. (N.J.A.C. 19:31-18.2, p. 5.)2538
2) "Mega project" means:
1. A qualified business facility located in a port district housing a business in the logistics,
manufacturing, energy, defense, or maritime industries, either: i. Having a capital
investment in excess of $ 20,000,000, and at which more than 250 full-time employees of
such business are created or retained; or ii. At which more than 1,000 full-time employees
of such business are created or retained;
2. A qualified business facility located in an aviation district housing a business in the
aviation industry, in a Garden State Growth Zone, or in a priority area housing the United
States headquarters and related facilities of an automobile manufacturer, either:
i. Having a capital investment in excess of $ 20,000,000, and at which more than
250 full-time employees of such business are created or retained; or
ii. At which more than 1,000 full-time employees of such business are created or
retained;
3. A qualified business facility located in an urban transit hub housing a business of any
kind, having a capital investment in excess of $ 50,000,000, and at which more than 250
full-time employees of a business are created or retained; Page 6 N.J.A.C. 19:31-18.2
4. A project located in an area designated in need of redevelopment, pursuant to P.L. 1992,
c. 79 (N.J.S.A. 40A:12A-1 et seq.), prior to the enactment of P.L. 2014, c. 63, within
Atlantic, Burlington, Camden, Cape May, Cumberland, Gloucester, Ocean, or Salem
25 The Garden State Growth Zones are Atlantic City, Camden, Passaic, Paterson and Trenton.
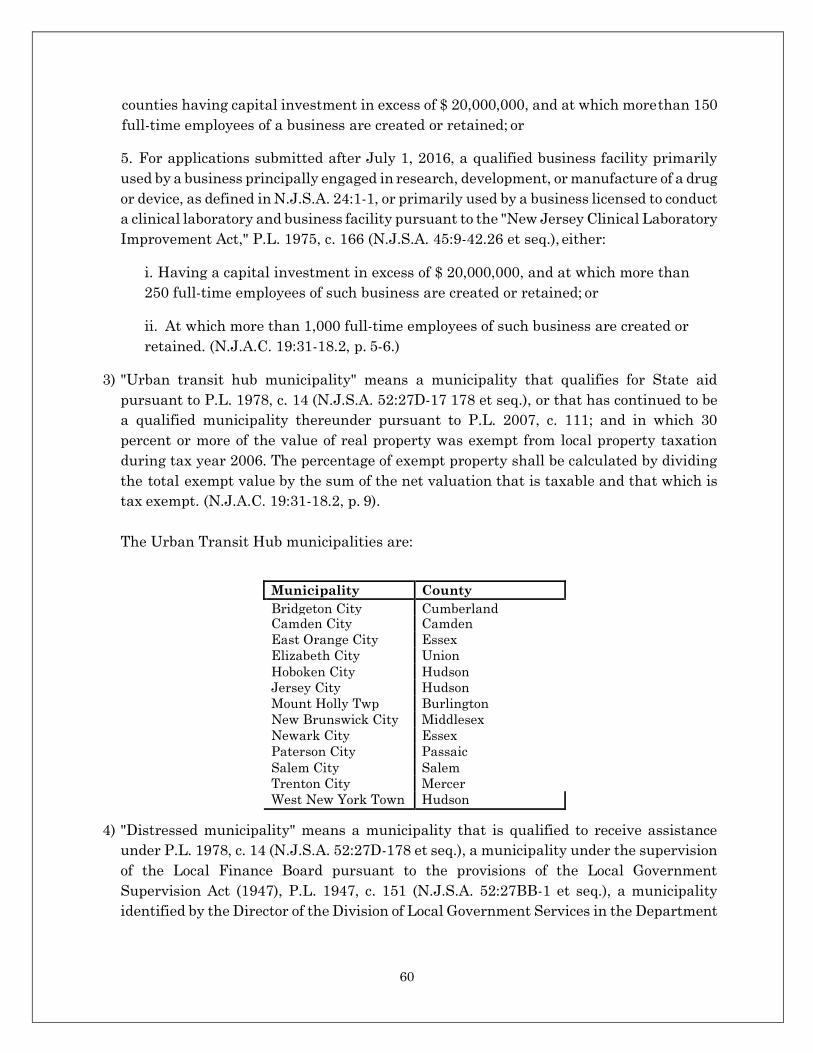
60
counties having capital investment in excess of $ 20,000,000, and at which more than 150
full-time employees of a business are created or retained; or
5. For applications submitted after July 1, 2016, a qualified business facility primarily
used by a business principally engaged in research, development, or manufacture of a drug
or device, as defined in N.J.S.A. 24:1-1, or primarily used by a business licensed to conduct
a clinical laboratory and business facility pursuant to the "New Jersey Clinical Laboratory
Improvement Act," P.L. 1975, c. 166 (N.J.S.A. 45:9-42.26 et seq.), either:
i. Having a capital investment in excess of $ 20,000,000, and at which more than
250 full-time employees of such business are created or retained; or
ii. At which more than 1,000 full-time employees of such business are created or
retained. (N.J.A.C. 19:31-18.2, p. 5-6.)
3) "Urban transit hub municipality" means a municipality that qualifies for State aid
pursuant to P.L. 1978, c. 14 (N.J.S.A. 52:27D-17 178 et seq.), or that has continued to be
a qualified municipality thereunder pursuant to P.L. 2007, c. 111; and in which 30
percent or more of the value of real property was exempt from local property taxation
during tax year 2006. The percentage of exempt property shall be calculated by dividing
the total exempt value by the sum of the net valuation that is taxable and that which is
tax exempt. (N.J.A.C. 19:31-18.2, p. 9).
The Urban Transit Hub municipalities are:
Municipality County
Bridgeton City Cumberland Camden City Camden East Orange City Essex Elizabeth City Union Hoboken City Hudson Jersey City Hudson Mount Holly Twp Burlington New Brunswick City Middlesex Newark City Essex Paterson City Passaic Salem City Salem Trenton City Mercer West New York Town Hudson
4) "Distressed municipality" means a municipality that is qualified to receive assistance
under P.L. 1978, c. 14 (N.J.S.A. 52:27D-178 et seq.), a municipality under the supervision
of the Local Finance Board pursuant to the provisions of the Local Government
Supervision Act (1947), P.L. 1947, c. 151 (N.J.S.A. 52:27BB-1 et seq.), a municipality
identified by the Director of the Division of Local Government Services in the Department
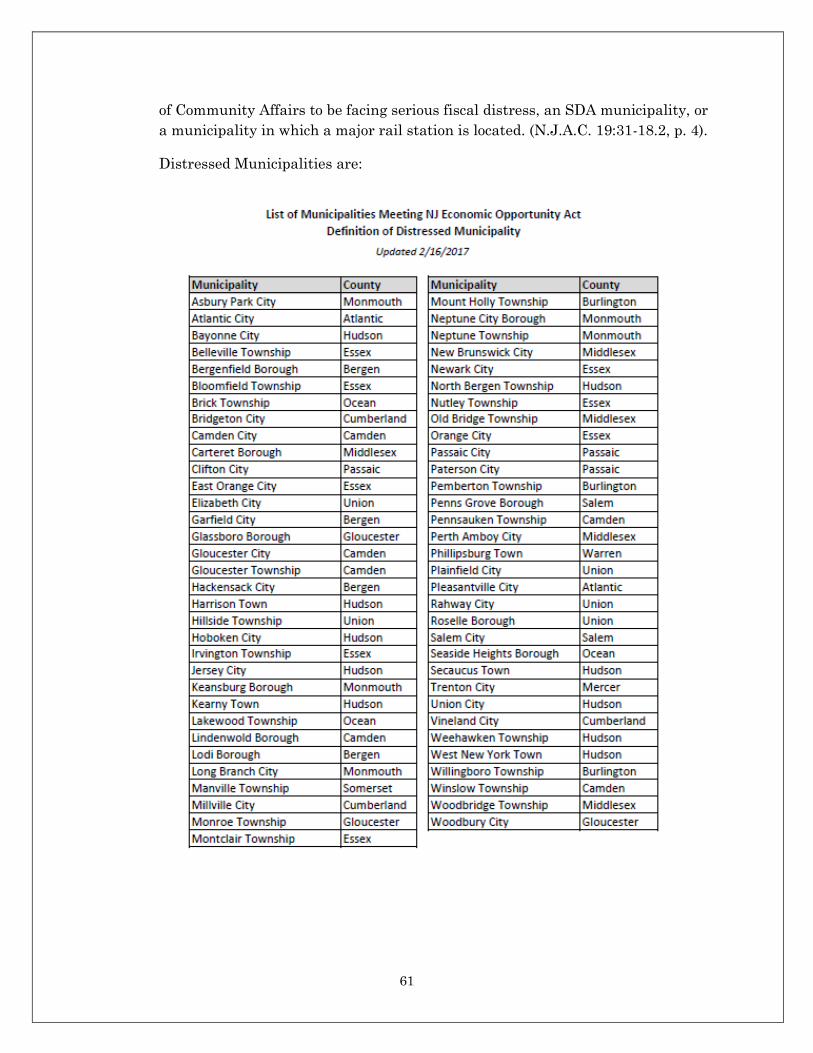
61
of Community Affairs to be facing serious fiscal distress, an SDA municipality, or
a municipality in which a major rail station is located. (N.J.A.C. 19:31-18.2, p. 4).
Distressed Municipalities are:
62
5) "Priority area" means the portions of the qualified incentive area that are not located
within a distressed municipality and which: are designated pursuant to the State Planning
Act, P.L. 1985, c. 398 (N.J.S.A. 52:18A-196 et seq.), as Planning Area 1 (Metropolitan),
Planning Area 2 (Suburban), a designated center under the State Development and
Redevelopment Plan, or a designated growth center in an endorsed plan until June 30,
2013, or until the State Planning Commission revises and readopts New Jersey's State
Strategic Plan and adopts regulations to revise this definition; intersect with portions of
a deep poverty pocket, a port district, or were Federally owned land approved for closure
under a Federal Commission on Base Realignment and Closure action; are the proposed
site of a disaster recovery project, a qualified incubator facility, a highlands development
credit receiving area or redevelopment area, a tourism destination project, or transit
oriented development; or contain a vacant commercial building having over 400,000
square feet of Page 7 N.J.A.C. 19:31-18.2 office, laboratory, or industrial space available
for occupancy for a period of over one year; or a site that has been negatively impacted
by the approval of a "qualified business facility," as defined pursuant to section 2 of P.L.
2007, c. 346 (N.J.S.A. 34:1B-208). (N.J.A.C. 19:31-18.2, p. 7).
6) "Other eligible area" means the portions of the qualified incentive area that are not located
within a distressed municipality, or the priority area.
Additional Information on Selected Bonus Categories:
1) "Deep poverty pocket" means a population census tract having a poverty level of 20 percent
or more, and which is located within the qualified incentive area. (N.J.A.C. 19:31-18.2, p.
3.)
2) "Qualified incubator facility" means a commercial building located within a qualified
incentive area: that contains 50,000 or more square feet of office, laboratory, or industrial
space; that is located near, and presents opportunities for collaboration with a research
institution, teaching hospital, college, or university, which is evidenced by a written
agreement that demonstrates this collaboration; and within which, at least 50 percent of
the gross leasable area is restricted for use by one or more technology startup companies
during the commitment period. The restricted space may be comprised of non-contiguous
areas, and its location within the qualified incubator facility may change from time to time.
(N.J.A.C. 19:31-18.2, p. 8.)
3) "Transit oriented development" means a qualified business facility located within a 1/2-
mile radius, or one-mile radius for projects located in a Garden State Growth Zone,
surrounding the mid-point of a New Jersey Transit Corporation, Port Authority Transit
Corporation, or Port Authority Trans-Hudson Corporation rail, bus, or ferry station
platform area, including all light rail stations. For the purposes of determining the transit
63
project bonus pursuant to N.J.A.C. 19:31-8.8(c)4, a bus station platform is a terminal as
listed on the EDA's website at www.njeda.com. (N.J.A.C. 19:31-18.2, p. 9.)
4) Bonus for excess capital investment (excluding mega projects):
A qualified business facility, other than a mega project or a project in a Garden State
Growth Zone, at which the capital investment in industrial premises for industrial use by
the business is in excess of the minimum capital investment required for eligibility
pursuant to subsection b. of section 3 of P.L. 2011, c. 149 (N.J.S.A. 34:1B-244), an increase
of $ 1,000 per year for each additional amount of investment, as measured in square feet
of measured gross leasable area, that exceeds the minimum amount required for eligibility
by 20 percent, with a maximum increase of $ 3,000 per year. (N.J.A.C. 19:31-18.8, p. 30.)
5) Bonus for excess capital investment (mega projects):
For a mega project or a project located within a Garden State Growth Zone at which the
capital investment in industrial premises for industrial use by the business is in excess of
the minimum capital investment required for eligibility pursuant to subsection b. of
section 3 of P.L. 2011, c. 149 (N.J.S.A. 34:1B-244), an increase of $ 1,000 per year for each
additional amount of investment, as measured in square feet of measured gross leasable
area, that exceeds the minimum amount by 20 percent, with a maximum increase of $
5,000 per year. (N.J.A.C. 19:31-18.8, p. 30.)
6) Bonus for median salary in excess of county median:
For a business with new full-time jobs and retained full-time jobs at the project with a
median average salary in excess of the existing median average salary for full-time
workers residing in the county in which the project is located, or, in the case of a project
in a Garden State Growth Zone, a business that employs full-time jobs at the project with
a median average salary in excess of the median average salary for full-time workers
residing in the Garden State Growth Zone, an increase of $ 250.00 per year during the
commitment period for each 35 percent by which the project's average salary levels exceeds
the county or Garden State Growth Zone average salary, with a maximum increase of $
1,500 per year. (N.J.A.C. 19:31-18.8, p. 30.)
7) "Targeted industry" means any industry identified from time to time by the Authority
including initially, a transportation, manufacturing, defense, energy, logistics, life
sciences, technology, health, and finance business, but excluding a primarily warehouse,
distribution, or fulfillment center business. (N.J.A.C. 19:31-18.2, p. 9.)
8) Bonus for locating in municipalities with MRI Index over 465:
"Municipal Revitalization Index" means the 2007 index by the Office for Planning
Advocacy within the Department of State measuring or ranking municipal distress.
(N.J.A.C. 19:31-18.2, p. 6.). These municipalities are (see
http://www.njeda.com/web/pdf/GrowNJ_SouthJersey_MRIIndex.pdf):
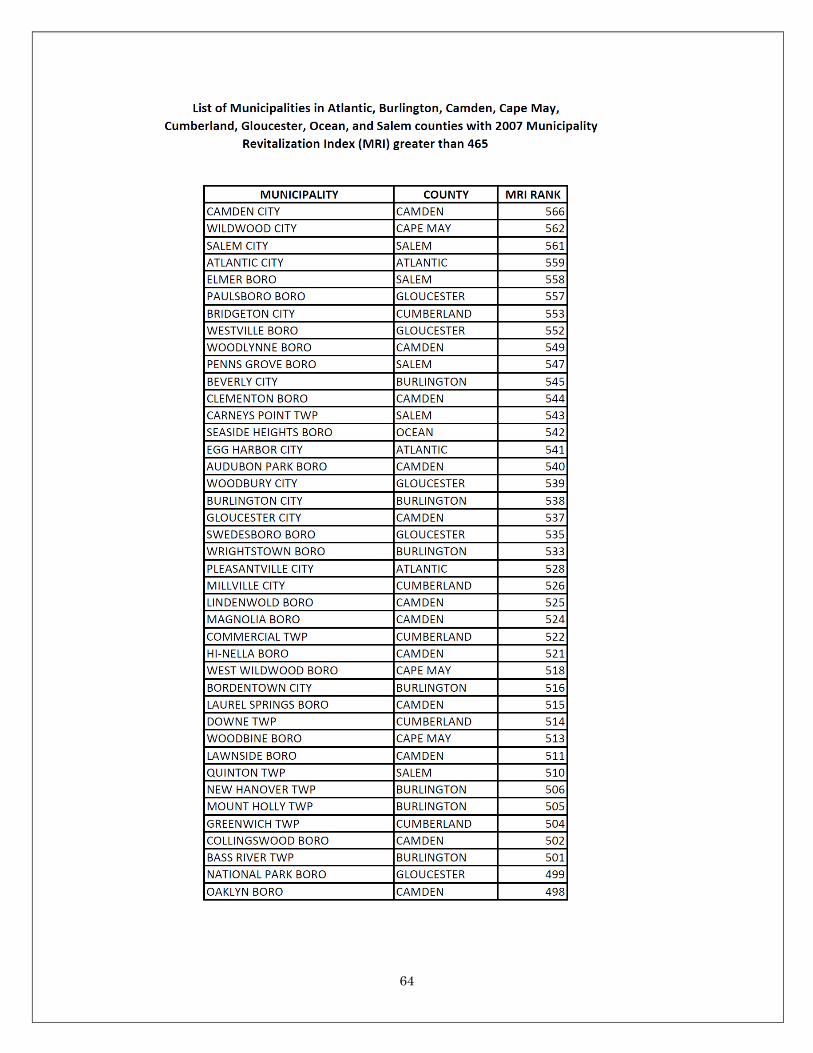
64
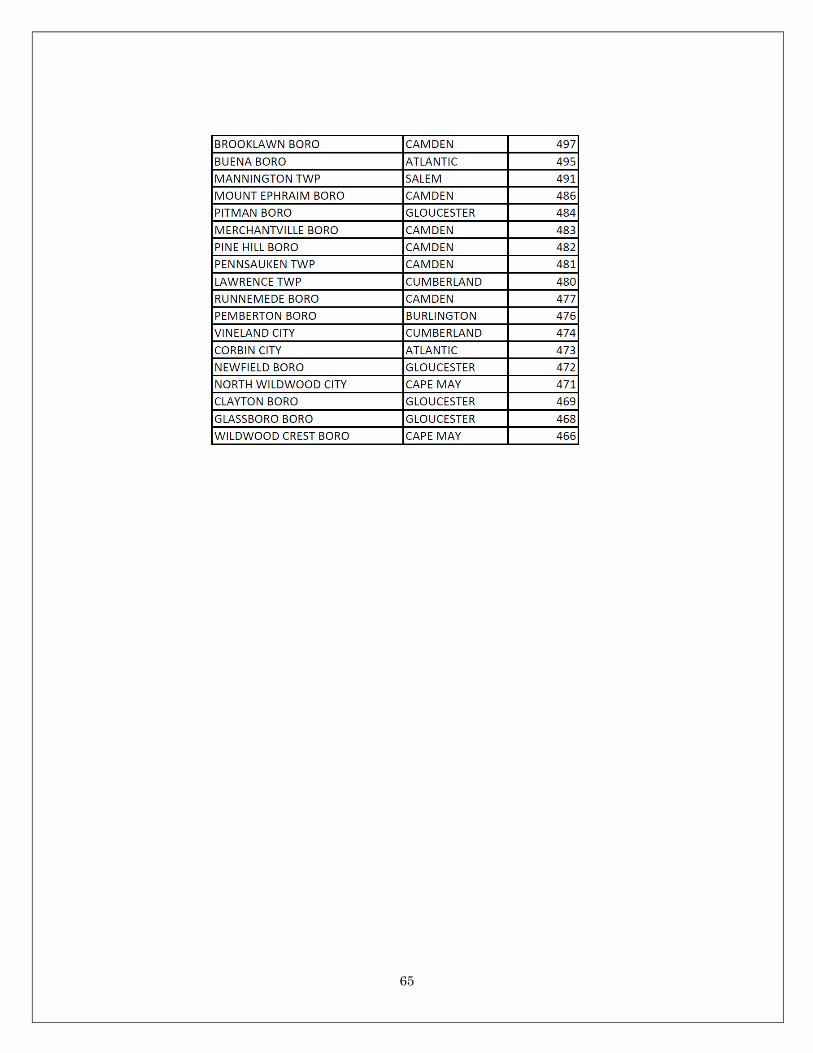
65
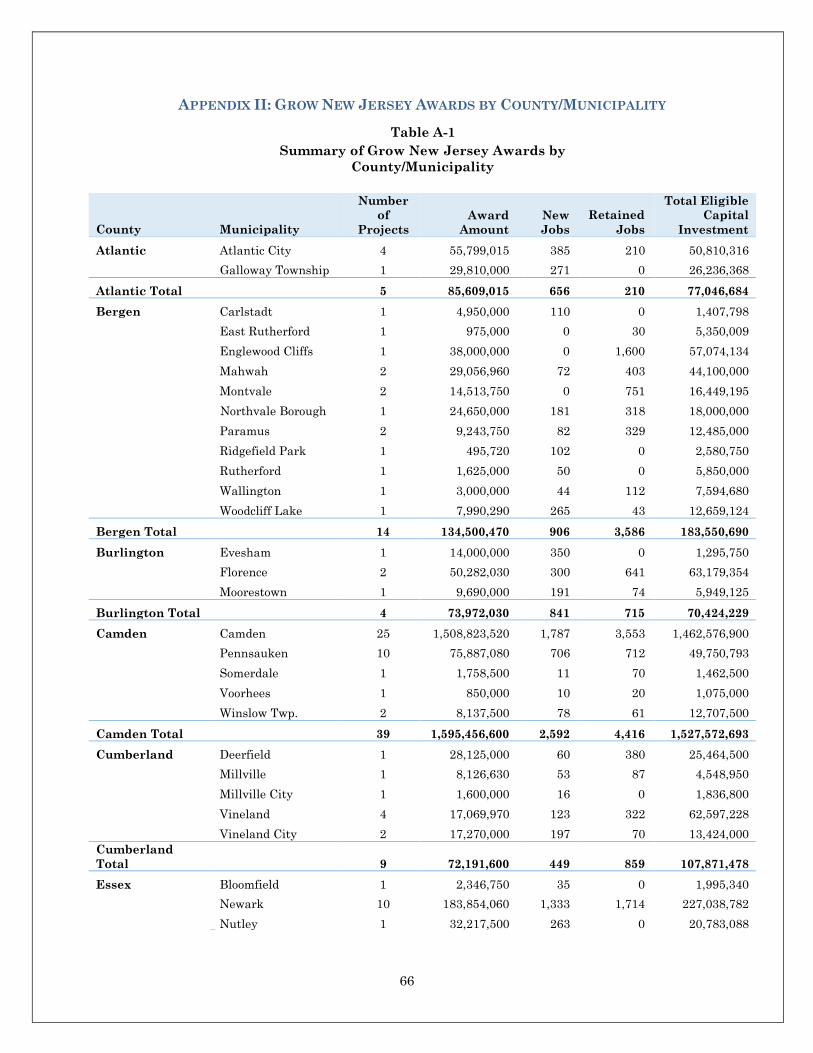
66
APPENDIX II: GROW NEW JERSEY AWARDS BY COUNTY/MUNICIPALITY
Table A-1
Summary of Grow New Jersey Awards by
County/Municipality
County
Municipality
Number
of
Projects
Award
Amount
New
Jobs
Retained
Jobs
Total Eligible
Capital
Investment
Atlantic Atlantic City 4 55,799,015 385 210 50,810,316
Galloway Township 1 29,810,000 271 0 26,236,368
Atlantic Total 5 85,609,015 656 210 77,046,684
Bergen Carlstadt 1 4,950,000 110 0 1,407,798
East Rutherford 1 975,000 0 30 5,350,009
Englewood Cliffs 1 38,000,000 0 1,600 57,074,134
Mahwah 2 29,056,960 72 403 44,100,000
Montvale 2 14,513,750 0 751 16,449,195
Northvale Borough 1 24,650,000 181 318 18,000,000
Paramus 2 9,243,750 82 329 12,485,000
Ridgefield Park 1 495,720 102 0 2,580,750
Rutherford 1 1,625,000 50 0 5,850,000
Wallington 1 3,000,000 44 112 7,594,680
Woodcliff Lake 1 7,990,290 265 43 12,659,124
Bergen Total 14 134,500,470 906 3,586 183,550,690
Burlington Evesham 1 14,000,000 350 0 1,295,750
Florence 2 50,282,030 300 641 63,179,354
Moorestown 1 9,690,000 191 74 5,949,125
Burlington Total 4 73,972,030 841 715 70,424,229
Camden Camden 25 1,508,823,520 1,787 3,553 1,462,576,900
Pennsauken 10 75,887,080 706 712 49,750,793
Somerdale 1 1,758,500 11 70 1,462,500
Voorhees 1 850,000 10 20 1,075,000
Winslow Twp. 2 8,137,500 78 61 12,707,500
Camden Total 39 1,595,456,600 2,592 4,416 1,527,572,693
Cumberland Deerfield 1 28,125,000 60 380 25,464,500
Millville 1 8,126,630 53 87 4,548,950
Millville City 1 1,600,000 16 0 1,836,800
Vineland 4 17,069,970 123 322 62,597,228
Vineland City 2 17,270,000 197 70 13,424,000 Cumberland
Total
9
72,191,600
449
859
107,871,478
Essex Bloomfield 1 2,346,750 35 0 1,995,340
Newark 10 183,854,060 1,333 1,714 227,038,782
Nutley 1 32,217,500 263 0 20,783,088
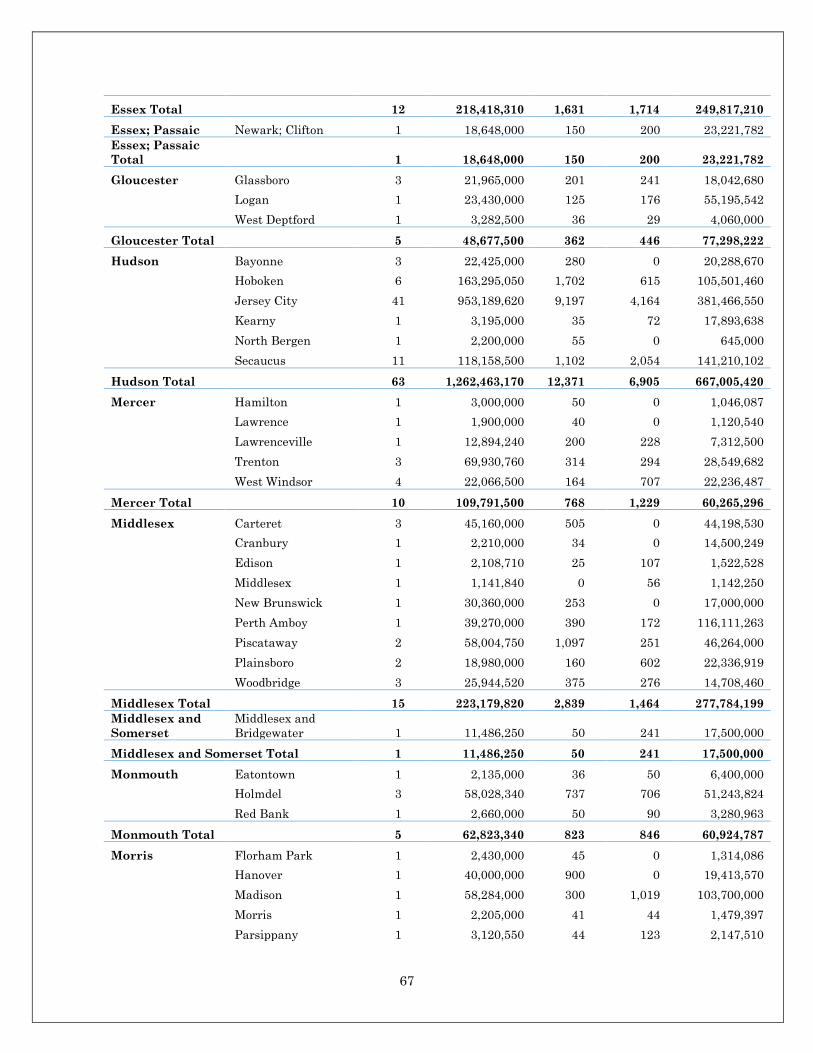
67
Essex Total 12 218,418,310 1,631 1,714 249,817,210
Essex; Passaic Newark; Clifton 1 18,648,000 150 200 23,221,782 Essex; Passaic
Total
1
18,648,000
150
200
23,221,782
Gloucester Glassboro 3 21,965,000 201 241 18,042,680
Logan 1 23,430,000 125 176 55,195,542
West Deptford 1 3,282,500 36 29 4,060,000
Gloucester Total 5 48,677,500 362 446 77,298,222
Hudson Bayonne 3 22,425,000 280 0 20,288,670
Hoboken 6 163,295,050 1,702 615 105,501,460
Jersey City 41 953,189,620 9,197 4,164 381,466,550
Kearny 1 3,195,000 35 72 17,893,638
North Bergen 1 2,200,000 55 0 645,000
Secaucus 11 118,158,500 1,102 2,054 141,210,102
Hudson Total 63 1,262,463,170 12,371 6,905 667,005,420
Mercer Hamilton 1 3,000,000 50 0 1,046,087
Lawrence 1 1,900,000 40 0 1,120,540
Lawrenceville 1 12,894,240 200 228 7,312,500
Trenton 3 69,930,760 314 294 28,549,682
West Windsor 4 22,066,500 164 707 22,236,487
Mercer Total 10 109,791,500 768 1,229 60,265,296
Middlesex Carteret 3 45,160,000 505 0 44,198,530
Cranbury 1 2,210,000 34 0 14,500,249
Edison 1 2,108,710 25 107 1,522,528
Middlesex 1 1,141,840 0 56 1,142,250
New Brunswick 1 30,360,000 253 0 17,000,000
Perth Amboy 1 39,270,000 390 172 116,111,263
Piscataway 2 58,004,750 1,097 251 46,264,000
Plainsboro 2 18,980,000 160 602 22,336,919
Woodbridge 3 25,944,520 375 276 14,708,460
Middlesex Total 15 223,179,820 2,839 1,464 277,784,199 Middlesex and
Somerset Middlesex and
Bridgewater
1
11,486,250
50
241
17,500,000
Middlesex and Somerset Total 1 11,486,250 50 241 17,500,000
Monmouth Eatontown 1 2,135,000 36 50 6,400,000
Holmdel 3 58,028,340 737 706 51,243,824
Red Bank 1 2,660,000 50 90 3,280,963
Monmouth Total 5 62,823,340 823 846 60,924,787
Morris Florham Park 1 2,430,000 45 0 1,314,086
Hanover 1 40,000,000 900 0 19,413,570
Madison 1 58,284,000 300 1,019 103,700,000
Morris 1 2,205,000 41 44 1,479,397
Parsippany 1 3,120,550 44 123 2,147,510
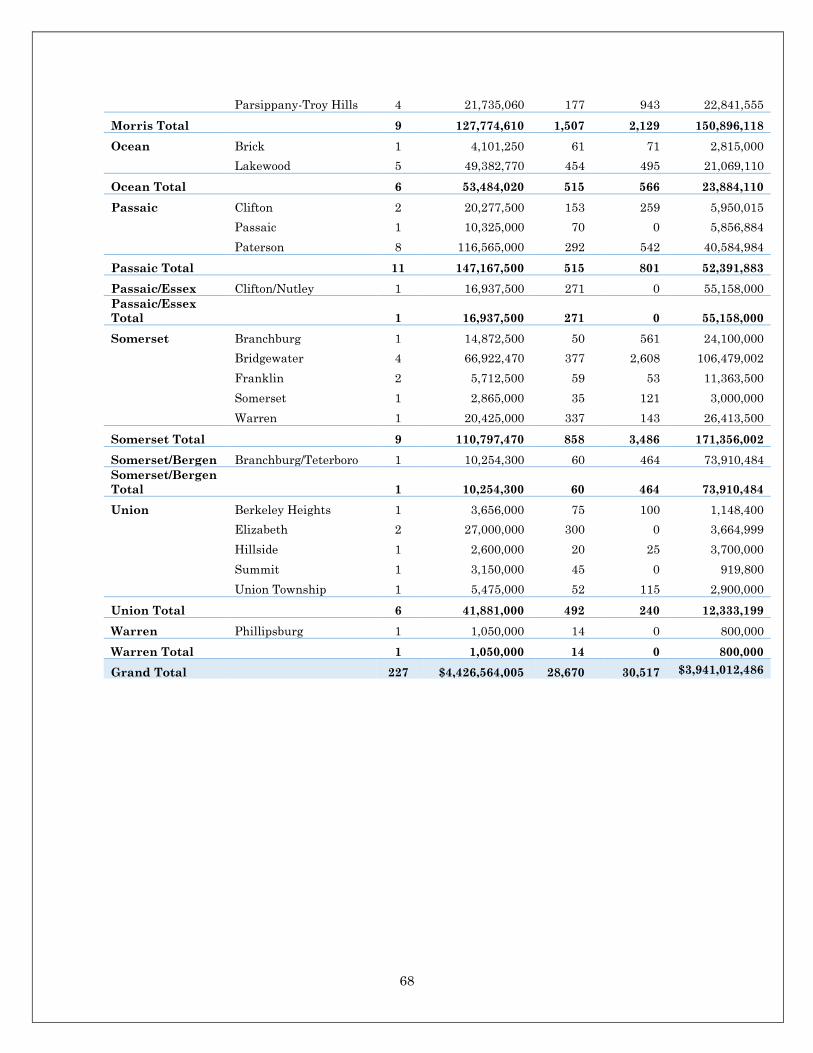
68
Parsippany-Troy Hills 4 21,735,060 177 943 22,841,555
Morris Total 9 127,774,610 1,507 2,129 150,896,118
Ocean Brick 1 4,101,250 61 71 2,815,000
Lakewood 5 49,382,770 454 495 21,069,110
Ocean Total 6 53,484,020 515 566 23,884,110
Passaic Clifton 2 20,277,500 153 259 5,950,015
Passaic 1 10,325,000 70 0 5,856,884
Paterson 8 116,565,000 292 542 40,584,984
Passaic Total 11 147,167,500 515 801 52,391,883
Passaic/Essex Clifton/Nutley 1 16,937,500 271 0 55,158,000 Passaic/Essex
Total
1
16,937,500
271
0
55,158,000
Somerset Branchburg 1 14,872,500 50 561 24,100,000
Bridgewater 4 66,922,470 377 2,608 106,479,002
Franklin 2 5,712,500 59 53 11,363,500
Somerset 1 2,865,000 35 121 3,000,000
Warren 1 20,425,000 337 143 26,413,500
Somerset Total 9 110,797,470 858 3,486 171,356,002
Somerset/Bergen Branchburg/Teterboro 1 10,254,300 60 464 73,910,484 Somerset/Bergen
Total
1
10,254,300
60
464
73,910,484
Union Berkeley Heights 1 3,656,000 75 100 1,148,400
Elizabeth 2 27,000,000 300 0 3,664,999
Hillside 1 2,600,000 20 25 3,700,000
Summit 1 3,150,000 45 0 919,800
Union Township 1 5,475,000 52 115 2,900,000
Union Total 6 41,881,000 492 240 12,333,199
Warren Phillipsburg 1 1,050,000 14 0 800,000
Warren Total 1 1,050,000 14 0 800,000
Grand Total 227 $4,426,564,005 28,670 30,517 $3,941,012,486
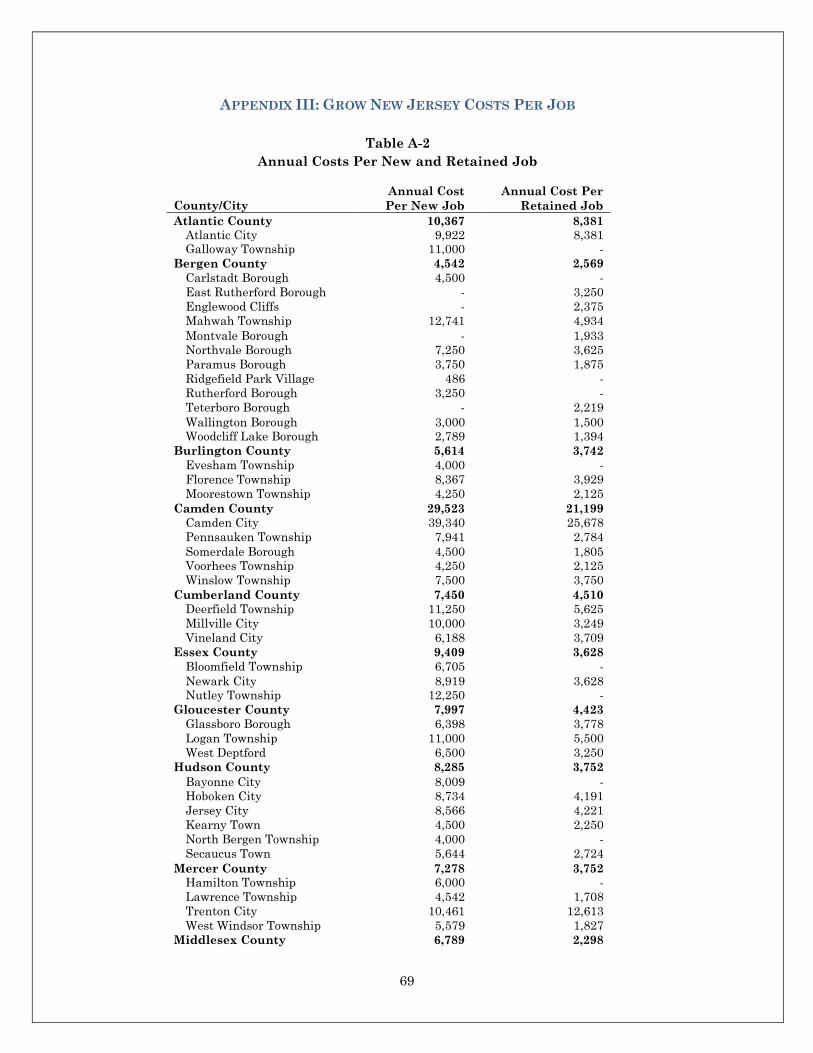
69
APPENDIX III: GROW NEW JERSEY COSTS PER JOB
Table A-2
Annual Costs Per New and Retained Job
County/City Annual Cost
Per New Job Annual Cost Per
Retained Job Atlantic County 10,367 8,381
Atlantic City 9,922 8,381 Galloway Township 11,000 -
Bergen County 4,542 2,569 Carlstadt Borough 4,500 - East Rutherford Borough - 3,250 Englewood Cliffs - 2,375 Mahwah Township 12,741 4,934 Montvale Borough - 1,933 Northvale Borough 7,250 3,625 Paramus Borough 3,750 1,875 Ridgefield Park Village 486 - Rutherford Borough 3,250 - Teterboro Borough - 2,219 Wallington Borough 3,000 1,500 Woodcliff Lake Borough 2,789 1,394
Burlington County 5,614 3,742 Evesham Township 4,000 - Florence Township 8,367 3,929 Moorestown Township 4,250 2,125
Camden County 29,523 21,199 Camden City 39,340 25,678 Pennsauken Township 7,941 2,784 Somerdale Borough 4,500 1,805 Voorhees Township 4,250 2,125 Winslow Township 7,500 3,750
Cumberland County 7,450 4,510 Deerfield Township 11,250 5,625 Millville City 10,000 3,249 Vineland City 6,188 3,709
Essex County 9,409 3,628 Bloomfield Township 6,705 - Newark City 8,919 3,628 Nutley Township 12,250 -
Gloucester County 7,997 4,423 Glassboro Borough 6,398 3,778 Logan Township 11,000 5,500 West Deptford 6,500 3,250
Hudson County 8,285 3,752 Bayonne City 8,009 - Hoboken City 8,734 4,191 Jersey City 8,566 4,221 Kearny Town 4,500 2,250 North Bergen Township 4,000 - Secaucus Town 5,644 2,724
Mercer County 7,278 3,752 Hamilton Township 6,000 - Lawrence Township 4,542 1,708 Trenton City 10,461 12,613 West Windsor Township 5,579 1,827
Middlesex County 6,789 2,298
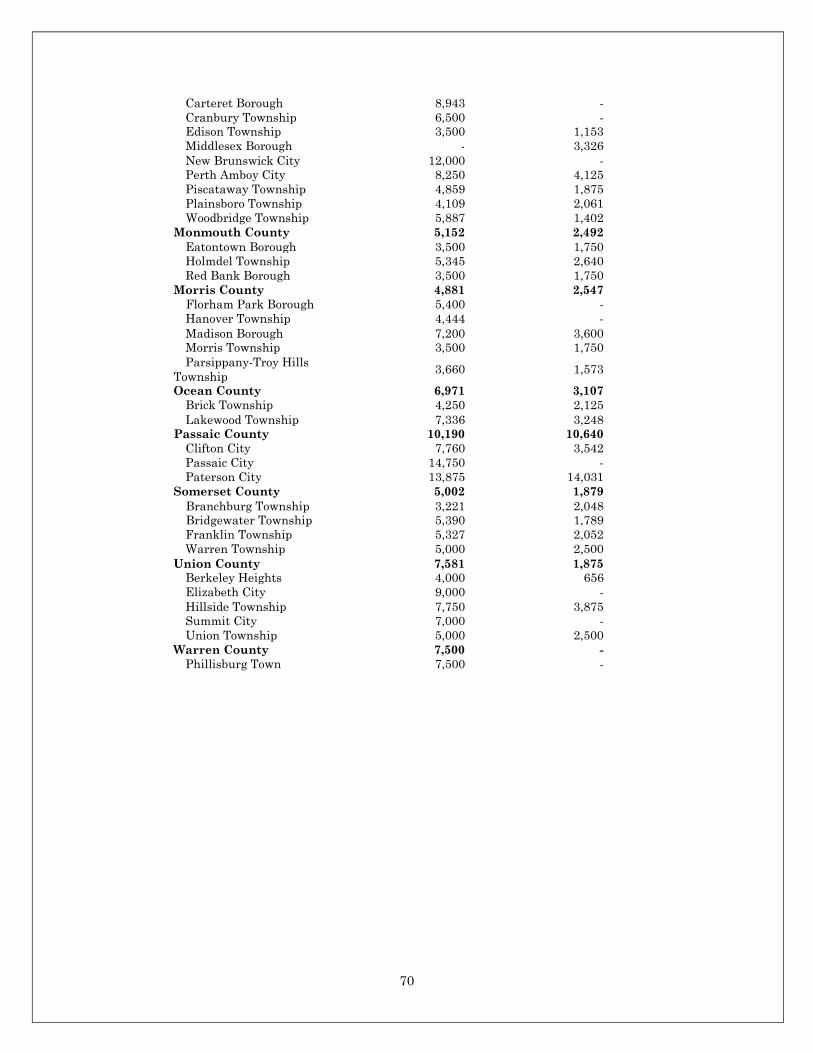
70
Carteret Borough 8,943 - Cranbury Township 6,500 - Edison Township 3,500 1,153 Middlesex Borough - 3,326 New Brunswick City 12,000 - Perth Amboy City 8,250 4,125 Piscataway Township 4,859 1,875 Plainsboro Township 4,109 2,061 Woodbridge Township 5,887 1,402
Monmouth County 5,152 2,492 Eatontown Borough 3,500 1,750 Holmdel Township 5,345 2,640 Red Bank Borough 3,500 1,750
Morris County 4,881 2,547 Florham Park Borough 5,400 - Hanover Township 4,444 - Madison Borough 7,200 3,600 Morris Township 3,500 1,750 Parsippany-Troy Hills
Township 3,660 1,573
Ocean County 6,971 3,107 Brick Township 4,250 2,125 Lakewood Township 7,336 3,248
Passaic County 10,190 10,640 Clifton City 7,760 3,542 Passaic City 14,750 - Paterson City 13,875 14,031
Somerset County 5,002 1,879 Branchburg Township 3,221 2,048 Bridgewater Township 5,390 1,789 Franklin Township 5,327 2,052 Warren Township 5,000 2,500
Union County 7,581 1,875 Berkeley Heights 4,000 656 Elizabeth City 9,000 - Hillside Township 7,750 3,875 Summit City 7,000 - Union Township 5,000 2,500
Warren County 7,500 - Phillisburg Town 7,500 -
71
APPENDIX IV: BENEFIT-COST RECOMMENDATIONS MEMORANDUM
72

73
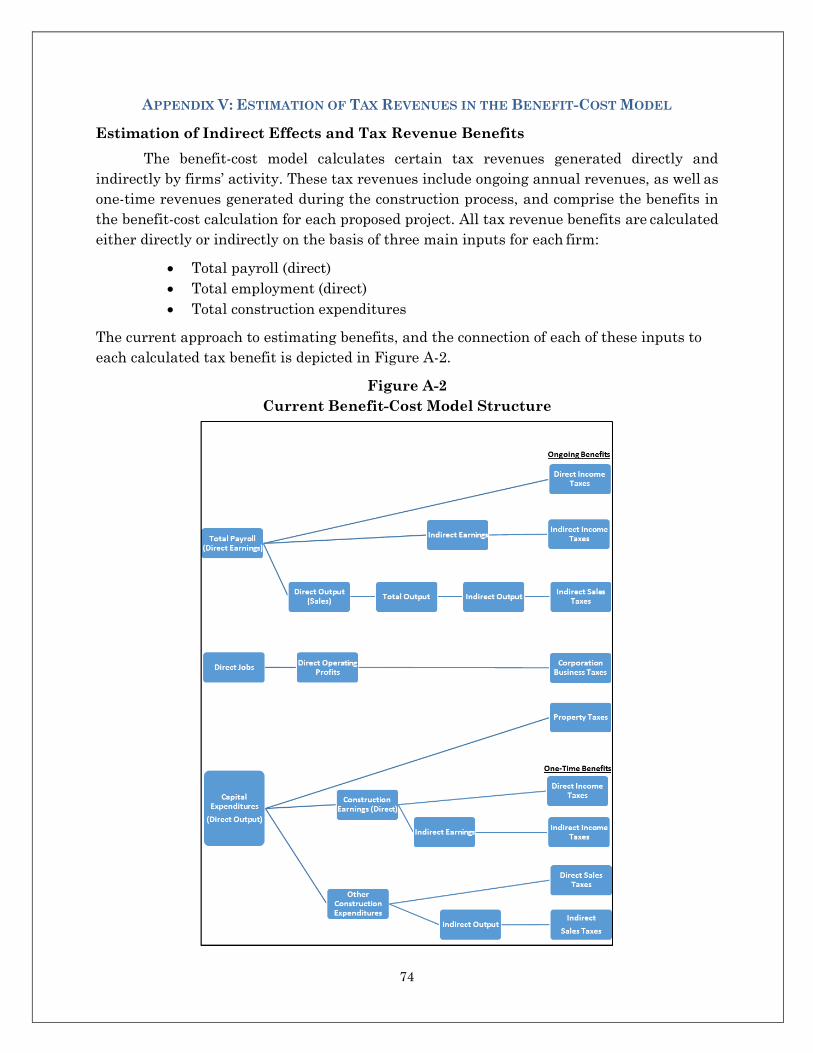
74
APPENDIX V: ESTIMATION OF TAX REVENUES IN THE BENEFIT-COST MODEL
Estimation of Indirect Effects and Tax Revenue Benefits
The benefit-cost model calculates certain tax revenues generated directly and
indirectly by firms’ activity. These tax revenues include ongoing annual revenues, as well as
one-time revenues generated during the construction process, and comprise the benefits in
the benefit-cost calculation for each proposed project. All tax revenue benefits are calculated
either directly or indirectly on the basis of three main inputs for each firm:
Total payroll (direct)
Total employment (direct)
Total construction expenditures
The current approach to estimating benefits, and the connection of each of these inputs to
each calculated tax benefit is depicted in Figure A-2.
Figure A-2
Current Benefit-Cost Model Structure
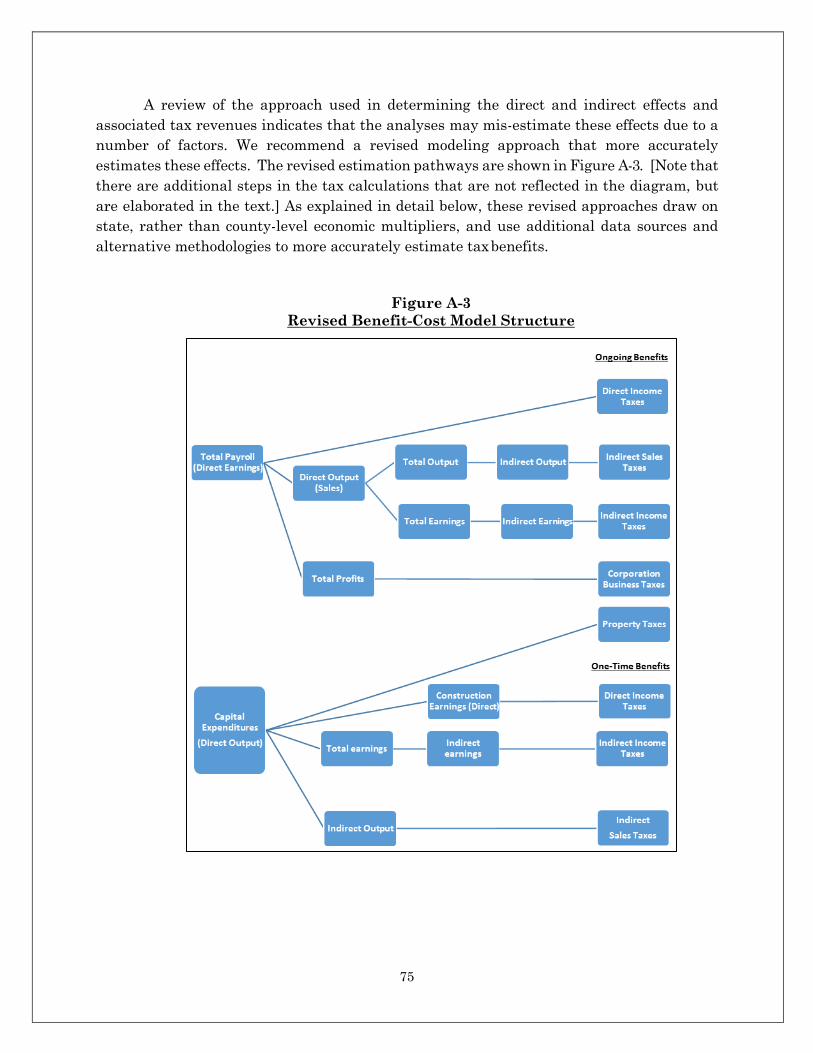
75
A review of the approach used in determining the direct and indirect effects and
associated tax revenues indicates that the analyses may mis-estimate these effects due to a
number of factors. We recommend a revised modeling approach that more accurately
estimates these effects. The revised estimation pathways are shown in Figure A-3. [Note that
there are additional steps in the tax calculations that are not reflected in the diagram, but
are elaborated in the text.] As explained in detail below, these revised approaches draw on
state, rather than county-level economic multipliers, and use additional data sources and
alternative methodologies to more accurately estimate tax benefits.
Figure A-3
Revised Benefit-Cost Model Structure
76
Economic multipliers are tools used to estimate the additional economic activity that
occurs as the result of an initial investment, expenditure or other economic event. The
benefit-cost model used by NJEDA was designed using county-level multipliers produced by
the U.S. Bureau of Economic Analysis’s RIMS II input-output modeling system. The use of
county-level multipliers was chosen in order to obtain relatively conservative benefit
estimates, given that multipliers for counties tend to be smaller than they are for states.
More conservative estimates of indirect economic effects would result in a more rigorous
benefit-cost test for Grow NJ applicants. It is true that use of county-level multipliers will
generally result in somewhat more conservative estimates of the income taxes calculated on
the basis of indirect earnings, and of the sales taxes on business expenditures generated
indirectly by the initial business activity. However, due to an incomplete understanding
within NJEDA’s benefit-cost model of how worker commuting between counties affects the use
of multipliers, we suggest that the use of county multipliers in the benefit-cost model
contributes to sometimes significant mis-estimation of benefits, including potential over-
estimation. Below we detail this issue and suggest an alternative approach using publicly
available national and/or state-level data.
NJEDA’s benefit-cost model estimates the tax revenues generated indirectly (i.e., via
the multiplier effect) by the firms’ business activity by applying tax rates to estimates of
indirectly generated corporate spending and personal income. The first step in this process
uses projected payroll (known as “direct earnings” for modeling purposes) of the Grow NJ
applicant to estimate the total regional earnings (direct + indirect) generated by the
applicant’s business activity. The total earnings are calculated by applying a direct effect
earnings multiplier to the direct earnings (payroll) of the firm in question. This direct effect
earnings multiplier – taken from the Regional Input-Output Modeling System (RIMS II)
produced by the U.S. Bureau of Economic Analysis – estimates the total change in earnings
for households employed in all industries for each dollar of earnings paid directly to
households employed by the industry of the firm in question.26 The direct earnings (payroll)
of the applicant firm is then subtracted from this total, and an effective income tax rate is
applied to the remaining indirect income to estimate the indirect gross income tax revenues
projected to result from the applicant’s business activity – one of the benefits used in the
benefit-cost analysis. This will generally result in more conservative estimates of indirect
income taxes, as the direct effect earnings multipliers for counties will generally be smaller
than those for the state (or nation).
In the next step, the total earnings (direct + indirect) calculated in the first step are
used to calculate “direct output” (used in the model as a proxy for the applicant’s revenue27)
by dividing total earnings by the RIMS II “final demand earnings multiplier” for the industry
in the region. The final demand earnings multiplier “represents the total dollar change in
earnings of households employed by all industries for each additional dollar of output
26 See https://www.bea.gov/regional/pdf/rims/RIMSII_User_Guide.pdf. 27 In input-output modeling, a firm or industry’s revenues are in most cases equivalent to its
expenditures (including payroll), plus profits, overhead and certain taxes.
77
delivered to final demand by the industry” of the applicant firm. This approach to calculating
total earnings and total output for a region is similarly set forth by the Bureau of Economic
Analysis in the RIMS II user handbook, which suggests first dividing the final demand
earnings multiplier by the direct effect earnings multiplier for the industry to obtain a ratio
of earnings to output for the industry, then dividing the direct earnings (payroll) by that ratio
to estimate direct output.28 The total output (direct + indirect) for the region is then calculated
using a final demand output multiplier, and the direct output is subtracted from that total to
derive an estimate of indirect output, to which the model applies a 3.5% tax rate (effectively
applying the 7% sales tax rate to 50% of a firm’s output).
However, when using the direct effect earnings multiplier for a region (county or
state), one assumes that the direct earnings are all attributable to residents (i.e., households)
of the region (e.g., county), and thus, that the indirect earnings are also limited to those within
the region. This is because the RIMS II system, in developing multipliers, only uses the part
of direct earnings that are earned by labor in households in the region. As a result, applying
the county direct effect earnings multiplier to the entire payroll of the firm will likely
overstate the total regional earnings that are then used to estimate (the firm’s) direct output.
In other words, if using this approach as outlined by the RIMS II handbook, the direct
earnings used in the model should be discounted to account for the leakage of earnings of the
firm’s workers who commute into the county.
This fundamental issue is reflected in the relationship between the final demand
earnings multiplier and the direct effects earnings multiplier for a region. Dividing the
former by the latter as indicated in the RIMS methodology derives a ratio of direct earnings
to direct output, but it is in fact the ratio of the direct earnings (payroll) of households in the
region (e.g. Hudson County) to the total output of the firm. If this ratio underestimates the
actual share of compensation (direct earnings) in an industry or firm’s output, the inverse
ratio (direct output to direct earnings) will be overstated (and vice versa), leading to
distortions in the representation of direct, and hence indirect output.
For example, assume a health insurance company in Hudson County (as in one of the
case studies presented below) has a payroll of $1 million. Using county level multipliers and
the RIMS suggested methodology as employed by NJEDA, resting on the assumption that all
workers reside in Hudson County, one would first multiply the total payroll by the direct
effect earnings multiplier for the health insurance industry in Hudson County
(approximately 2.0) to attain a total Hudson County earnings effect of $2 million (1). One
would then subtract direct earnings from total earnings to arrive at an estimate of indirect
earnings of $1 million (2), to be taxed as income. One would then divide the total earnings
estimate ($2 million) by the final demand earnings multiplier for the industry in Hudson
County (approximately 0.1) to arrive at direct output (i.e., firm sales revenue) of $20 million
(3). This total would then be multiplied by the final demand output multiplier (about 1.6) to
arrive at a total output of $32 million (4), and indirect output of $16 million (total output less
28 See https://www.bea.gov/regional/pdf/rims/RIMSII_User_Guide.pdf.
78
direct output) (5), to be taxed at 3.5%.
1. $1 million (payroll) x 2.0 (direct effect earnings multiplier) = $2 million (total earnings)
2. $2 million (total earnings) - $1 million (direct earnings) = $1 million (indirect earnings)
3. $2 million (total earnings) / 0.1 (final demand earnings multiplier) = $20 million (direct output)
4. $20 million (direct output) x 1.6 (final demand output multiplier) = $32 million (total output)
5. $32 million (total output) - $20 million (direct output) = $16 million (indirect output)
In the approach used by NJEDA, the estimate of $20 million in direct output would
imply that the share of the firm’s output (i.e., “direct output”) accounted for by payroll (i.e.,
“direct earnings”) is 5%. One can arrive at this result more directly using the RIMS Handbook
approach of dividing the final demand earnings multiplier by the direct effect earnings
multiplier to find the ratio of direct earnings to direct output: 0.1 / 2.0 = .05. Note again,
however, that this is a ratio of the direct earnings (payroll) of households in the county to the
total output of the firm. The actual share of the firm’s output that goes to payroll should
include the earnings not only of those residing in the county, but of all employees. National
input-output tables provide a breakdown of the “production recipe” for each industry – that is,
the share of each dollar of each industry’s output that is spent on other industries, and on
labor. Because these data are aggregated at the national level, they do not account only for
the local contribution of households to output. We can therefore determine from the national
data on the insurance industry29 that compensation’s share of output for the insurance
industry at the national level is in fact closer to 26% than to 5%. This would suggest that the
direct output as calculated here is over-estimated by a factor of five, leading to a significant
over-estimation of indirect output and associated taxes.
It should be noted that not all results calculated with county-level
multipliers will overstate indirect output or total tax revenues. As suggested in the
alternative approach outlined below, the direction and magnitude of the
adjustment will depend on the relative sizes of the county multipliers and the
suggested alternatives. Further, the state-level multiplier examples presented here
are based on older RIMS II multipliers and are provided and used only for
illustrative purposes, though the state-level inter-industry relationships are
unlikely to have changed significantly, and the most potentially impactful changes
recommended here rely not on RIMS II state multipliers but rather on up-to-date
national data (compensation-to-output ratios). In addition, the county-level
multipliers used in the JLL model have been updated since the model’s inception,
and those used in the examples presented below may not be those that would be
used going forward.
29 Specifically, the insurance industry vector in the Commodity-by-Industry Direct Requirements
Matrix of the national input-output tables produced by the U.S. Bureau of Economic Analysis. These
tables comprise the underlying source of the RIMS II multipliers.
79
The first step in the alternative approach would replace the two-step derivation of
direct output with the direct earnings (i.e., compensation) to direct output ratio at the
national level, in order to more accurately reflect the actual contribution of labor to firm
output.30 In this approach, all earnings are assumed to accrue to households in New Jersey.
We note, however, that model revisions adopted in Feburary 2017 do account for interstate
commutation when calculating the gross income taxes on direct earnings.31 Having thus
calculated a direct output estimate, we then suggest applying state-level multipliers to
calculate indirect earnings and output. While these multipliers will in most (though not all)
cases be larger (i.e., less conservative) than the county-level multipliers, we recommend that
they be used, as the calculations are intended to provide a basis for estimation of state income
and sales taxes. The following steps would thus replace steps 1-5 outlined above.
1. $1 million (direct earnings) / 0.26 (national compensation share of output) = $3.85 million
(direct output)
2. $3.85 million (direct output) x 2.3 (state level final demand output multiplier) = $8.85 million
(total output)
3. $8.85 million (total output) - $3.85 million (direct output) = $5 million (indirect output)
4. $3.85 million (direct output) x .6268 (state level final demand earnings multiplier) = $2.4
million (total earnings)
5. $2.4 million (total earnings) - $1 million (direct earnings) = $1.4 million (indirect earnings)
In this approach, step (1) calculates direct output as a function of direct earnings
based on the relationship at the national level, without using the intermediate step of
conversion to total earnings. This results in what we suggest is a more reliable estimate of
direct output on the basis of earnings. In this case, the estimate is significantly lower than in
the original approach, but this will not always be the case. For industries/counties that have
lower rates of commutation, the county estimates would more closely align with the national
ratio of earnings to output. As in the original approach, steps (2) and (3) calculate indirect
output using the final demand output multiplier, in this case at the state level. The state-
level multiplier is larger than that of the county (2.3 vs. 1.6) resulting in a higher estimate of
indirect output relative to direct output. Indirect earnings are calculated in step (4) and step
(5) by applying the state-level final demand earnings multiplier to the estimate of direct
30 Alternatively, one could use the suggested RIMS approach adopted by NJEDA (i.e., dividing the
final demand earnings multiplier by the direct effect earnings multiplier to estimate the direct
earnings to direct output ratio), but using New Jersey state-level multipliers instead of county
multipliers. However, we suggest using the national level data as a more direct representation of the
industry-level direct earnings to direct output ratio. 31 This modification is discussed in further detail in the section below discussing the tax
calculations. It does not address the issue of commutation as it regards the use of county-level
multipliers to calculate direct (and indirect) output.
80
output derived in step (1), and subtracting direct earnings from this total. Because state-
level final demand earnings multipliers will tend to be higher than at the county level (here,
0.6268 rather than 0.1), this will generally result in higher estimates of indirect earnings.
Implications for State Tax Revenue Benefits and Recommendations for Revisions
to Indirect Sales Tax Estimation
The effect of the changes suggested above on the calculation of indirect state tax
revenue benefits will depend on the direction and magnitude of the changes to the estimated
indirect income and output. We also recommend further revisions to the calculation of
indirect income and sales tax revenues.
Gross Income Tax on Indirect Earnings
Prior to model revisions adopted in February 2017, an effective gross income tax rate
of 4% was applied to direct and indirect earnings. With this approach, the change in gross
income taxes on indirectly generated earnings would simply change (likely increase) under
the new calculation by the same percentage as the change in indirect earnings resulting from
the application of a state-level, rather than a county-level multiplier. In the example above,
the 4% rate would be applied to indirect earnings (as well as direct earnings) of $1.3 million
to generate indirect gross income taxes of $52,000, compared to 4% of $1 million, or $40,000
under the current approach using county-level multipliers.
Based on revisions made in February 2017, the model now applies an average tax rate
to direct and indirect wages that draws on actual marginal tax rates applicable to the
projected actual or average wages of the directly generated jobs associated with Grow NJ
applicant firms’ activity. The revised model also accounts for interstate commuting of
employees in the direct jobs based on the county where the firm is located, thus more
conservatively projecting the income tax revenues associated with the direct earnings. We
note that the marginal tax rates applied to the direct earnings are an arithmetic average of
the calculated effective rates for single and married filers.
Recommendation: We would recommend weighting this average based on the division
between single and married filers in the most recent Statistics of Income report issued by the
New Jersey Division of Taxation.
We also note that the model presently applies the effective gross income tax rate
determined from the information on direct earnings to the aggregate indirect earnings as
well.
Recommendation: We recommend calculation of a separate effective rate for indirect earnings
based the average earnings per indirect job. The model already calculates the number of
indirect jobs by applying a county-level final demand employment multiplier (the number of
total jobs for each million dollars of direct output) to the estimate of direct output to estimate
total jobs, then dividing by the direct effect multiplier to estimate direct jobs, and subtracting
81
this number from the total jobs estimate.32 We agree with this approach, but to ensure
consistency with the previous calculations, state multipliers and the more direct approach to
estimating direct output described above should be used. The estimated indirect earnings
should then be divided by the estimated indirect jobs to derive average indirect earnings per
job, which can then serve as the basis for calculation of a separate effective income tax rate.
Sales Taxes on Indirect Output
The model currently applies an effective sales tax rate of 3.5% to all indirect output,
using indirect output as a proxy for expenditures and implicitly assuming that 50% of
expenditures (when the sales tax rate was 7%) are taxable.
Recommendation: We recommend that the RIMS state-level table of final demand output
multipliers by industry be used to more directly estimate these taxes. The table can be used to
calculate the share of indirect output associated with a given industry’s expenditures that is
spent on certain other industries. In this case, we suggest using the allocations to retail,
wholesale and food service industries, and applying the full sales tax rate (now 6.625%). We
recognize that this approach does not capture certain taxable services, but we believe it
accounts for the majority of taxable expenditures. Another important step in applying this
approach involves the recognition that RIMS data in the final demand output multiplier tables
count only wholesale and retail margins as output, rather than total sales. It is therefore
necessary to adjust the shares of output allocated to retail and wholesale expenditures to
reflect that they represent 28.7% and 18.3% of their actual sales (output) values,
respectively.33 This is a straightforward calculation and the resulting total shares of indirect
output by industry for retail, wholesale and food service expenditures are included as part of
Appendix VI.
Calculation of Corporation Business Tax Revenues
For firms subject to the corporation business tax (CBT), in the past the model has
calculated (CBT) revenues based on a per-job estimate of corporate net income, to which an
applicable rate of 9% or 4% is applied depending on the firm’s filing status. With the model
revisions of February 2017, the model now excludes CBT revenues from the benefit
calculation for projects that do not result in an increase in taxable income in the state. In
addition, applicants are now required to submit documentation of their state corporate tax
obligations (either in New Jersey or in another state if relocating from outside New Jersey)
32 This estimate of direct jobs will be different than the actual number of direct jobs associated with
the project. This is because it is derived on the basis of average earnings for the industry, rather than
the actual average salaries projected by the applicant. It is used only for the purpose of estimating the
indirect employment associated with the indirect earnings. 33 The adjustment factors for the retail and wholesale industries represent gross margins as a
percentage of sales at the national level as reported by the U.S. Census Bureau based on the Annual
Retail Trade Survey and the Annual Wholesale Trade Survey.
82
from prior years. This information is then used to estimate the CBT revenues included in the
benefit-cost analysis.
Recommendation: While the estimated CBT revenues for the benefit-cost analysis are now
calculated using data supplied by the applicant, we recommend that NJEDA still use an
independent estimating procedure. This can serve as a point of comparison for verifying that
the estimated CBT revenues calculated on the basis of applicant documentation are
comparable to those that would be estimated using current industry-standard data for the
state. Under the previous modeling approach, the per-job net income values used in
calculating the estimated taxable income range from $30,000 to $130,000 depending on the
broad industry group in which the firm is classified. As an alternative, we recommend using
the most recent state data on industry-level compensation and gross operating surplus
available from the U.S. Bureau of Economic Analysis to calculate an estimate of net taxable
income. The ratio of gross operating surplus to compensation by industry (currently available
for 2015) can be applied to estimated payroll (direct earnings) to derive this estimate. The
applicable industry ratios of gross operating surplus to compensation are provided in
Appendix VII.
83
Appropriate Inclusion of Property Tax Revenues
Benefits included in the model include local property taxes to be paid on the
improvements made to property by the capital expenditures associated with each project. These
taxes are usually estimated at 3% on the value of eligible construction expenditures. Garden
State Growth Zones have the option of offering tax exemptions on these improvements. In
Camden, Trenton and Passaic, Grow NJ projects are exempt from payment of property taxes on
these improvements for the first five years, or in the case of projects designated as Garden
State Growth Zone Development Entities, ten years after project completion. In the latter
cases, property taxes are then phased in at 10% per year over the subsequent 10-year period
(years 11-20). However, we note that, according to the program rules, the benefit-cost analyses
for projects in these areas nevertheless include these tax revenues in full in the benefit stream
for the entire analysis period. For projects with significant capital expenditures, these
estimated revenues can constitute a significant portion of the projected annual benefits even
though such benefits are not realized by the state or municipality. A review of a selection of
the Camden alternatives shows property taxes accounting for between 15% and 44% of annual
project benefits. For those projects with relatively low benefit-cost ratios where these taxes
represent a large share of the calculated benefits, their inclusion may have resulted in the
benefit-cost threshold of 1.0 being attained when it otherwise would not have been, even when
benefits were calculated over a 35-year period in cases prior to the adoption of the revised
modeling parameters.
Recommendation: We recommend that these non-realized tax revenues be excluded from
future benefit-cost analyses.
Averaging of Multipliers
We also note that in cases where a Grow NJ project has more than one industry
classification for different portions of its facility or for multiple sites, the current model
calculates aggregate multipliers by weighting the industry multipliers used for each site by
the square footage of the site. It then applies these weighted aggregate multipliers to the
aggregate earnings and output estimates. However, this derivation of aggregate multipliers
is not necessary, as the calculations of direct and indirect earnings and output for each
industry/site, when summed across sites, can be used to derive the aggregate multipliers
directly, rather than weighting by square footage, which may in some cases distort the value
of the multipliers.
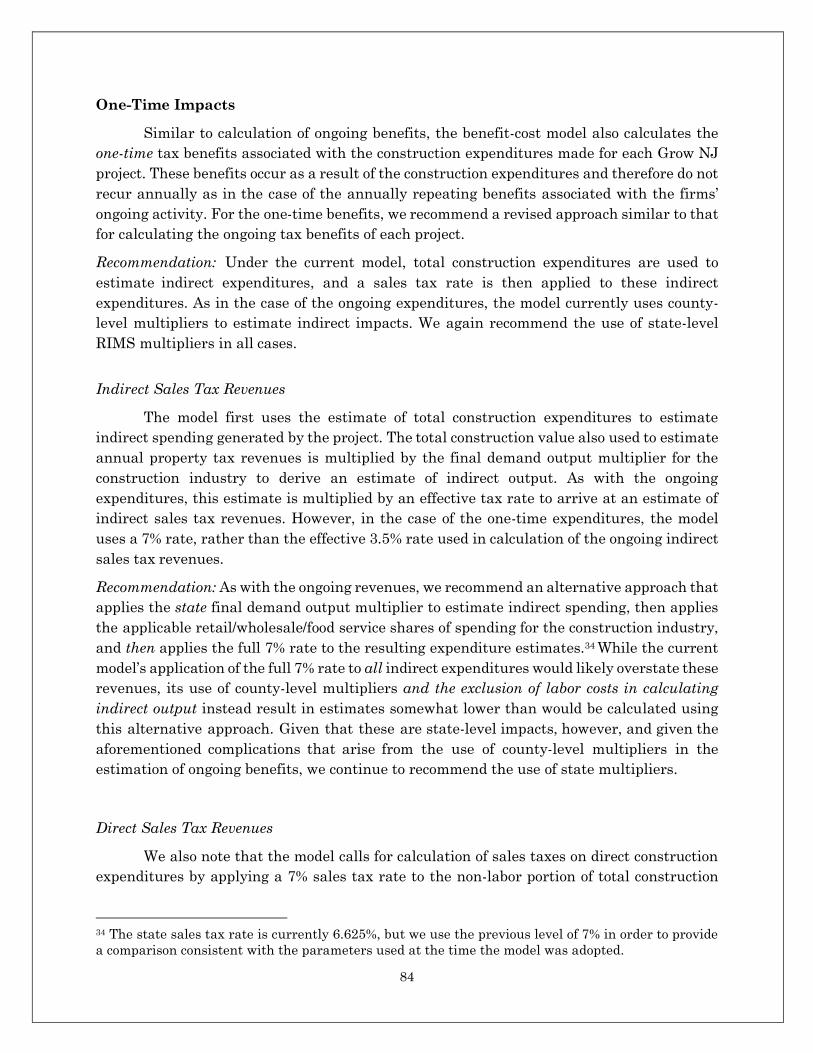
84
One-Time Impacts
Similar to calculation of ongoing benefits, the benefit-cost model also calculates the
one-time tax benefits associated with the construction expenditures made for each Grow NJ
project. These benefits occur as a result of the construction expenditures and therefore do not
recur annually as in the case of the annually repeating benefits associated with the firms’
ongoing activity. For the one-time benefits, we recommend a revised approach similar to that
for calculating the ongoing tax benefits of each project.
Recommendation: Under the current model, total construction expenditures are used to
estimate indirect expenditures, and a sales tax rate is then applied to these indirect
expenditures. As in the case of the ongoing expenditures, the model currently uses county-
level multipliers to estimate indirect impacts. We again recommend the use of state-level
RIMS multipliers in all cases.
Indirect Sales Tax Revenues
The model first uses the estimate of total construction expenditures to estimate
indirect spending generated by the project. The total construction value also used to estimate
annual property tax revenues is multiplied by the final demand output multiplier for the
construction industry to derive an estimate of indirect output. As with the ongoing
expenditures, this estimate is multiplied by an effective tax rate to arrive at an estimate of
indirect sales tax revenues. However, in the case of the one-time expenditures, the model
uses a 7% rate, rather than the effective 3.5% rate used in calculation of the ongoing indirect
sales tax revenues.
Recommendation: As with the ongoing revenues, we recommend an alternative approach that
applies the state final demand output multiplier to estimate indirect spending, then applies
the applicable retail/wholesale/food service shares of spending for the construction industry,
and then applies the full 7% rate to the resulting expenditure estimates.34 While the current
model’s application of the full 7% rate to all indirect expenditures would likely overstate these
revenues, its use of county-level multipliers and the exclusion of labor costs in calculating
indirect output instead result in estimates somewhat lower than would be calculated using
this alternative approach. Given that these are state-level impacts, however, and given the
aforementioned complications that arise from the use of county-level multipliers in the
estimation of ongoing benefits, we continue to recommend the use of state multipliers.
Direct Sales Tax Revenues
We also note that the model calls for calculation of sales taxes on direct construction
expenditures by applying a 7% sales tax rate to the non-labor portion of total construction
34 The state sales tax rate is currently 6.625%, but we use the previous level of 7% in order to provide
a comparison consistent with the parameters used at the time the model was adopted.
85
value. We have some concern that this may result in double counting of sales tax revenues,
which are by definition indirect (i.e., not collected and remitted by the construction
contractor). Contractors effectively pay the sales taxes on behalf of their clients, but few
contractors send sales taxes to the state. Like householders, the taxes they pay are sent in to
the State by retailers, wholesalers, and a relatively small set of service providers,
manufacturers, and subcontractors. That is, while the contractors pay for such taxes they
only do so indirectly. As such, no effective sales tax rate should be attached to the net income
of contractors. Taxes on purchases of construction materials are more accurately captured as
part of the taxes on the indirect output of the construction sector as described above. We thus
recommend that this element of the one-time impacts be excluded from the model.
Direct and Indirect Income Tax Revenues
The model currently applies an income tax rate of 5% to both direct and indirect
earnings generated through construction expenditures. We recommend a revised approach
to calculating indirect earnings and either the application of the already updated JLL income
tax calculation module or a lower effective rate of 3% to generate more refined income tax
estimates.
The model assumes construction earnings to be 50% of “hard construction costs.” A
county-level direct effect earnings multiplier is then applied to these direct earnings, and a
5% effective income tax rate is then applied to both direct and indirect earnings.
Recommendation: As in the case of the ongoing impacts, we recommend that the final demand
earnings multiplier for the state be applied to the total construction value (inclusive of labor).
The direct payroll (already estimated as 50% of “hard costs”) can then be subtracted from the
total earnings to derive an estimate of indirect earnings. Further, rather than using a 5%
aggregate income tax rate, we recommend using the articulated tax model developed by JLL
used in calculating the ongoing income tax benefits.
For this purpose, we suggest that average earnings and employment for the one- time direct
and indirect jobs be calculated as follows:
1. Direct earnings are first calculated under the assumption that they account for 50%
of total construction expenditures
Direct earnings = Hard costs x 0.5
2. The total state final demand earnings multiplier (.6956) should be applied to the total
construction expenditures (inclusive of direct earnings) to estimate total earnings.
Total earnings = .6956 x Direct output (Total construction costs)
3. Direct earnings – already calculated as 50% of “hard costs” – should then be
subtracted from the total earnings derived in step (2) to arrive at an estimate of
indirect earnings.
Indirect earnings = Total earnings – direct earnings
86
Because construction data in the RIMS model is not articulated by type of facility (and as
a result tends to underestimate construction sector earnings per job), the next steps use
state employment multipliers and state data on construction wages to calculate income
tax revenues for the direct and indirect employment generated by the construction
spending.
4. The New Jersey Department of Labor provides prevailing wage rates by detailed
construction type by county.
Recommendation: We recommend that these rates serve as the basis for calculating
taxes on direct earnings using JLL’s detailed income tax module. The project-
appropriate per-employee prevailing wages should be chosen and the taxes estimated.
The direct earnings should be divided by the prevailing wage rate to determine the
number of construction salaries to which the estimated tax rates should be applied.
Average Income Taxes = Prevailing Wage x Effective income tax rate (JLL module)
5. Number of direct jobs = Direct earnings/Prevailing Wage
6. Direct Income Taxes = Average Income Taxes x Number of Direct Jobs
7. To calculate indirect income taxes, we also recommend an approach that uses the JLL
tax module and average indirect earnings.
Implied total jobs = Total construction costs (incl. labor) x State final demand
employment multiplier/1 million
[Note: this calculation is used to derive the estimate of indirect jobs used in the
tax calculations. Due to the aforementioned lack of detail in the RIMS model’s
representation of the construction sector, it is not used to estimate the direct
construction jobs associated with the project, which are estimated in step (5)
above.]
8. Indirect jobs = Implied total jobs – (Implied total jobs/direct effect employment
multiplier)
9. Average indirect earnings = Indirect earnings (step (3)) / indirect jobs
10. Average indirect income taxes = Average indirect earnings x Effective income tax rate
(JLL module)
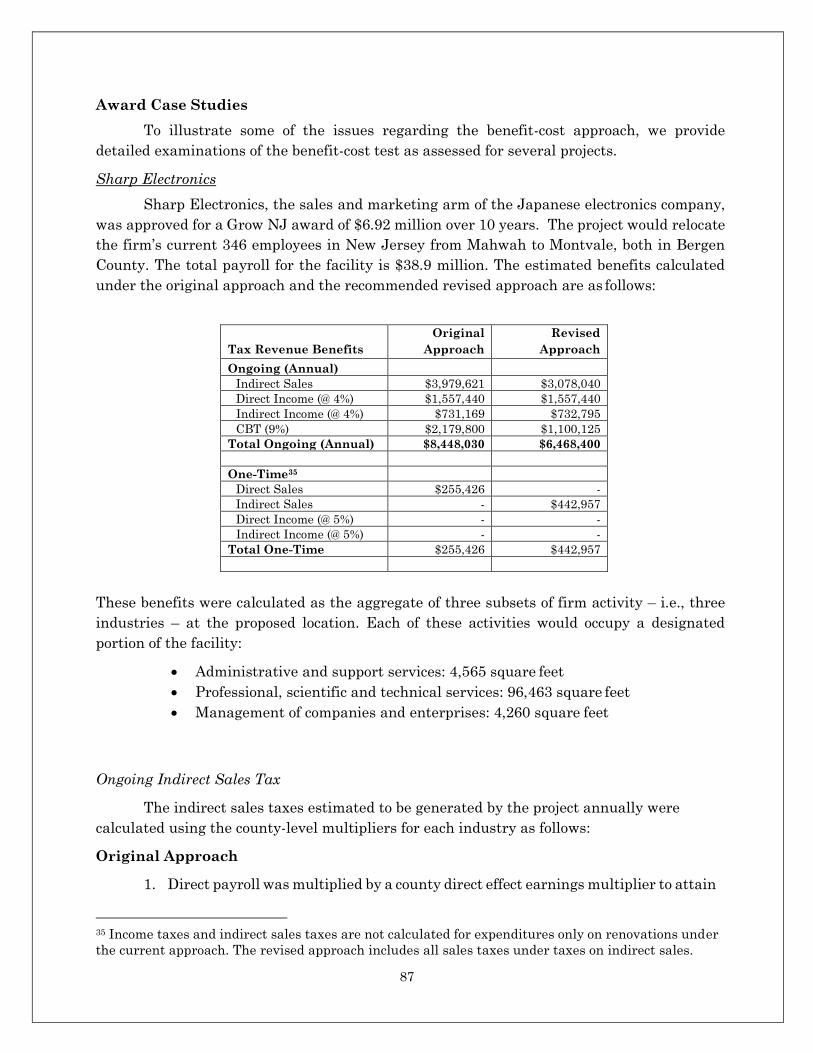
87
Award Case Studies
To illustrate some of the issues regarding the benefit-cost approach, we provide
detailed examinations of the benefit-cost test as assessed for several projects.
Sharp Electronics
Sharp Electronics, the sales and marketing arm of the Japanese electronics company,
was approved for a Grow NJ award of $6.92 million over 10 years. The project would relocate
the firm’s current 346 employees in New Jersey from Mahwah to Montvale, both in Bergen
County. The total payroll for the facility is $38.9 million. The estimated benefits calculated
under the original approach and the recommended revised approach are as follows:
Tax Revenue Benefits
Original
Approach Revised
Approach
Ongoing (Annual) Indirect Sales $3,979,621 $3,078,040 Direct Income (@ 4%) $1,557,440 $1,557,440 Indirect Income (@ 4%) $731,169 $732,795 CBT (9%) $2,179,800 $1,100,125
Total Ongoing (Annual) $8,448,030 $6,468,400 One-Time35
Direct Sales $255,426 - Indirect Sales - $442,957
Direct Income (@ 5%) - -
Indirect Income (@ 5%) - -
Total One-Time $255,426 $442,957
These benefits were calculated as the aggregate of three subsets of firm activity – i.e., three
industries – at the proposed location. Each of these activities would occupy a designated
portion of the facility:
Administrative and support services: 4,565 square feet
Professional, scientific and technical services: 96,463 square feet
Management of companies and enterprises: 4,260 square feet
Ongoing Indirect Sales Tax
The indirect sales taxes estimated to be generated by the project annually were
calculated using the county-level multipliers for each industry as follows:
Original Approach
1. Direct payroll was multiplied by a county direct effect earnings multiplier to attain
35 Income taxes and indirect sales taxes are not calculated for expenditures only on renovations under
the current approach. The revised approach includes all sales taxes under taxes on indirect sales.
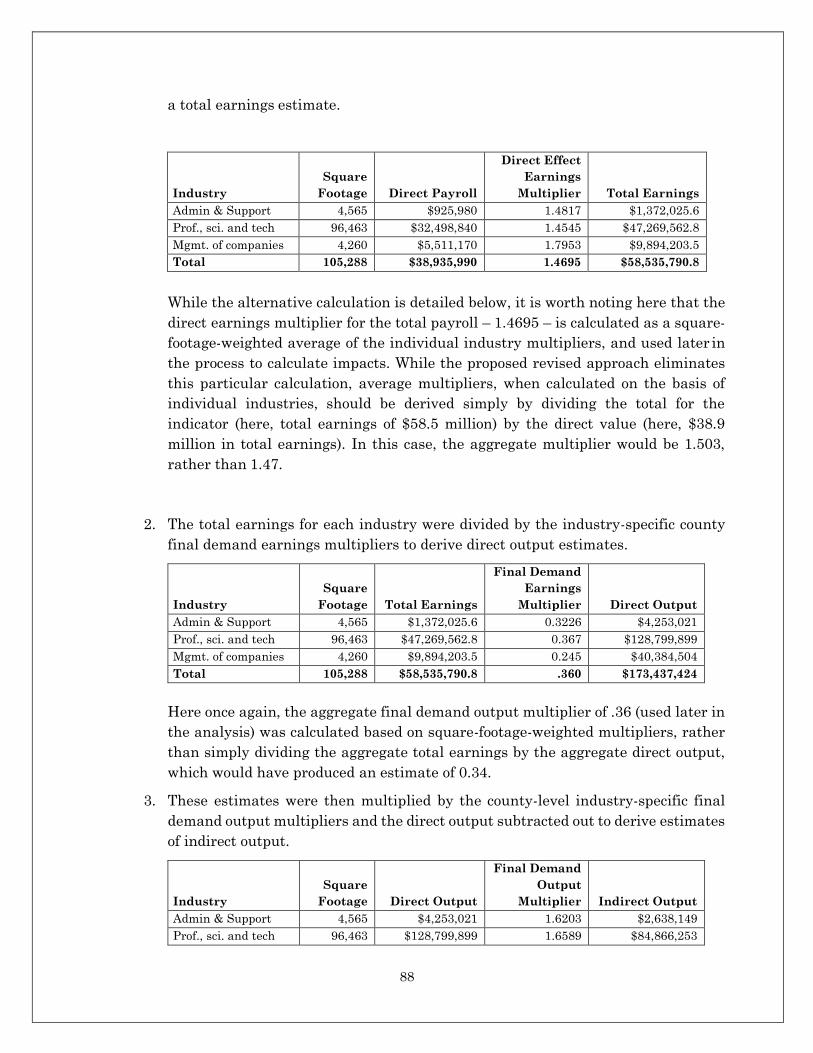
88
a total earnings estimate.
Industry
Square
Footage Direct Payroll
Direct Effect
Earnings
Multiplier Total Earnings
Admin & Support 4,565 $925,980 1.4817 $1,372,025.6
Prof., sci. and tech 96,463 $32,498,840 1.4545 $47,269,562.8
Mgmt. of companies 4,260 $5,511,170 1.7953 $9,894,203.5
Total 105,288 $38,935,990 1.4695 $58,535,790.8
While the alternative calculation is detailed below, it is worth noting here that the
direct earnings multiplier for the total payroll – 1.4695 – is calculated as a square-
footage-weighted average of the individual industry multipliers, and used later in
the process to calculate impacts. While the proposed revised approach eliminates
this particular calculation, average multipliers, when calculated on the basis of
individual industries, should be derived simply by dividing the total for the
indicator (here, total earnings of $58.5 million) by the direct value (here, $38.9
million in total earnings). In this case, the aggregate multiplier would be 1.503,
rather than 1.47.
2. The total earnings for each industry were divided by the industry-specific county
final demand earnings multipliers to derive direct output estimates.
Industry
Square
Footage Total Earnings
Final Demand
Earnings
Multiplier Direct Output
Admin & Support 4,565 $1,372,025.6 0.3226 $4,253,021
Prof., sci. and tech 96,463 $47,269,562.8 0.367 $128,799,899
Mgmt. of companies 4,260 $9,894,203.5 0.245 $40,384,504
Total 105,288 $58,535,790.8 .360 $173,437,424
Here once again, the aggregate final demand output multiplier of .36 (used later in
the analysis) was calculated based on square-footage-weighted multipliers, rather
than simply dividing the aggregate total earnings by the aggregate direct output,
which would have produced an estimate of 0.34.
3. These estimates were then multiplied by the county-level industry-specific final
demand output multipliers and the direct output subtracted out to derive estimates
of indirect output.
Industry
Square
Footage Direct Output
Final Demand
Output
Multiplier Indirect Output
Admin & Support 4,565 $4,253,021 1.6203 $2,638,149
Prof., sci. and tech 96,463 $128,799,899 1.6589 $84,866,253
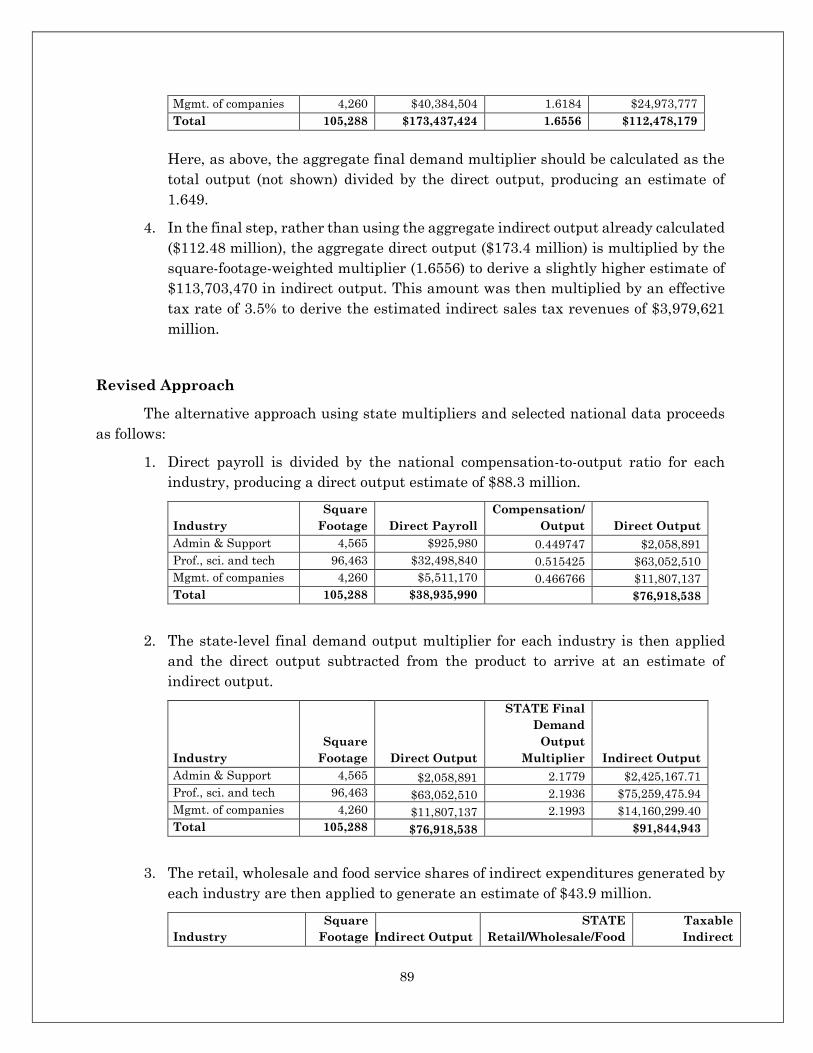
89
Mgmt. of companies 4,260 $40,384,504 1.6184 $24,973,777
Total 105,288 $173,437,424 1.6556 $112,478,179
Here, as above, the aggregate final demand multiplier should be calculated as the
total output (not shown) divided by the direct output, producing an estimate of
1.649.
4. In the final step, rather than using the aggregate indirect output already calculated
($112.48 million), the aggregate direct output ($173.4 million) is multiplied by the
square-footage-weighted multiplier (1.6556) to derive a slightly higher estimate of
$113,703,470 in indirect output. This amount was then multiplied by an effective
tax rate of 3.5% to derive the estimated indirect sales tax revenues of $3,979,621
million.
Revised Approach
The alternative approach using state multipliers and selected national data proceeds
as follows:
1. Direct payroll is divided by the national compensation-to-output ratio for each
industry, producing a direct output estimate of $88.3 million.
Industry
Square
Footage Direct Payroll
Compensation/
Output Direct Output
Admin & Support 4,565 $925,980 0.449747 $2,058,891
Prof., sci. and tech 96,463 $32,498,840 0.515425 $63,052,510
Mgmt. of companies 4,260 $5,511,170 0.466766 $11,807,137
Total 105,288 $38,935,990 $76,918,538
2. The state-level final demand output multiplier for each industry is then applied
and the direct output subtracted from the product to arrive at an estimate of
indirect output.
Industry
Square
Footage Direct Output
STATE Final
Demand
Output
Multiplier Indirect Output
Admin & Support 4,565 $2,058,891 2.1779 $2,425,167.71
Prof., sci. and tech 96,463 $63,052,510 2.1936 $75,259,475.94
Mgmt. of companies 4,260 $11,807,137 2.1993 $14,160,299.40
Total 105,288 $76,918,538 $91,844,943
3. The retail, wholesale and food service shares of indirect expenditures generated by
each industry are then applied to generate an estimate of $43.9 million.
Industry
Square
Footage Indirect Output
STATE
Retail/Wholesale/Food
Taxable
Indirect
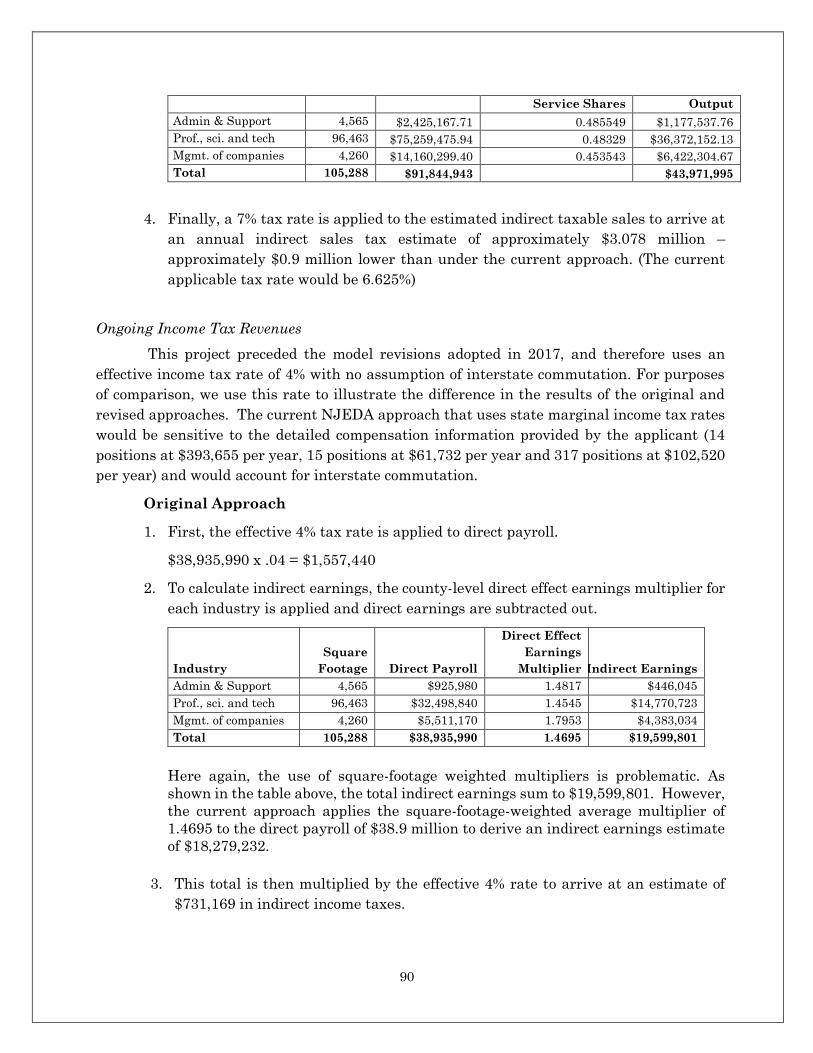
90
Service Shares Output
Admin & Support 4,565 $2,425,167.71 0.485549 $1,177,537.76
Prof., sci. and tech 96,463 $75,259,475.94 0.48329 $36,372,152.13
Mgmt. of companies 4,260 $14,160,299.40 0.453543 $6,422,304.67
Total 105,288 $91,844,943 $43,971,995
4. Finally, a 7% tax rate is applied to the estimated indirect taxable sales to arrive at
an annual indirect sales tax estimate of approximately $3.078 million –
approximately $0.9 million lower than under the current approach. (The current
applicable tax rate would be 6.625%)
Ongoing Income Tax Revenues
This project preceded the model revisions adopted in 2017, and therefore uses an
effective income tax rate of 4% with no assumption of interstate commutation. For purposes
of comparison, we use this rate to illustrate the difference in the results of the original and
revised approaches. The current NJEDA approach that uses state marginal income tax rates
would be sensitive to the detailed compensation information provided by the applicant (14
positions at $393,655 per year, 15 positions at $61,732 per year and 317 positions at $102,520
per year) and would account for interstate commutation.
Original Approach
1. First, the effective 4% tax rate is applied to direct payroll.
$38,935,990 x .04 = $1,557,440
2. To calculate indirect earnings, the county-level direct effect earnings multiplier for
each industry is applied and direct earnings are subtracted out.
Industry
Square
Footage Direct Payroll
Direct Effect
Earnings
Multiplier Indirect Earnings
Admin & Support 4,565 $925,980 1.4817 $446,045
Prof., sci. and tech 96,463 $32,498,840 1.4545 $14,770,723
Mgmt. of companies 4,260 $5,511,170 1.7953 $4,383,034
Total 105,288 $38,935,990 1.4695 $19,599,801
Here again, the use of square-footage weighted multipliers is problematic. As
shown in the table above, the total indirect earnings sum to $19,599,801. However,
the current approach applies the square-footage-weighted average multiplier of
1.4695 to the direct payroll of $38.9 million to derive an indirect earnings estimate
of $18,279,232.
3. This total is then multiplied by the effective 4% rate to arrive at an estimate of
$731,169 in indirect income taxes.
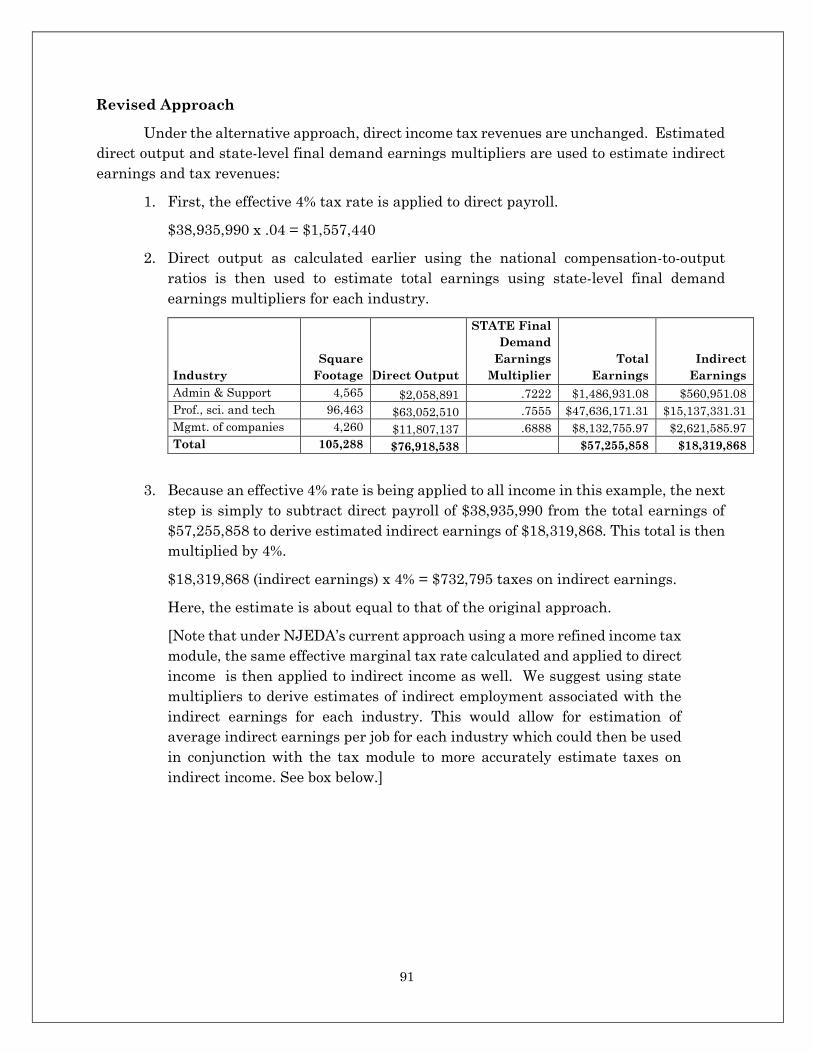
91
Revised Approach
Under the alternative approach, direct income tax revenues are unchanged. Estimated
direct output and state-level final demand earnings multipliers are used to estimate indirect
earnings and tax revenues:
1. First, the effective 4% tax rate is applied to direct payroll.
$38,935,990 x .04 = $1,557,440
2. Direct output as calculated earlier using the national compensation-to-output
ratios is then used to estimate total earnings using state-level final demand
earnings multipliers for each industry.
Industry
Square
Footage Direct Output
STATE Final
Demand
Earnings
Multiplier
Total
Earnings
Indirect
Earnings
Admin & Support 4,565 $2,058,891 .7222 $1,486,931.08 $560,951.08
Prof., sci. and tech 96,463 $63,052,510 .7555 $47,636,171.31 $15,137,331.31
Mgmt. of companies 4,260 $11,807,137 .6888 $8,132,755.97 $2,621,585.97
Total 105,288 $76,918,538 $57,255,858 $18,319,868
3. Because an effective 4% rate is being applied to all income in this example, the next
step is simply to subtract direct payroll of $38,935,990 from the total earnings of
$57,255,858 to derive estimated indirect earnings of $18,319,868. This total is then
multiplied by 4%.
$18,319,868 (indirect earnings) x 4% = $732,795 taxes on indirect earnings.
Here, the estimate is about equal to that of the original approach.
[Note that under NJEDA’s current approach using a more refined income tax
module, the same effective marginal tax rate calculated and applied to direct
income is then applied to indirect income as well. We suggest using state
multipliers to derive estimates of indirect employment associated with the
indirect earnings for each industry. This would allow for estimation of
average indirect earnings per job for each industry which could then be used
in conjunction with the tax module to more accurately estimate taxes on
indirect income. See box below.]
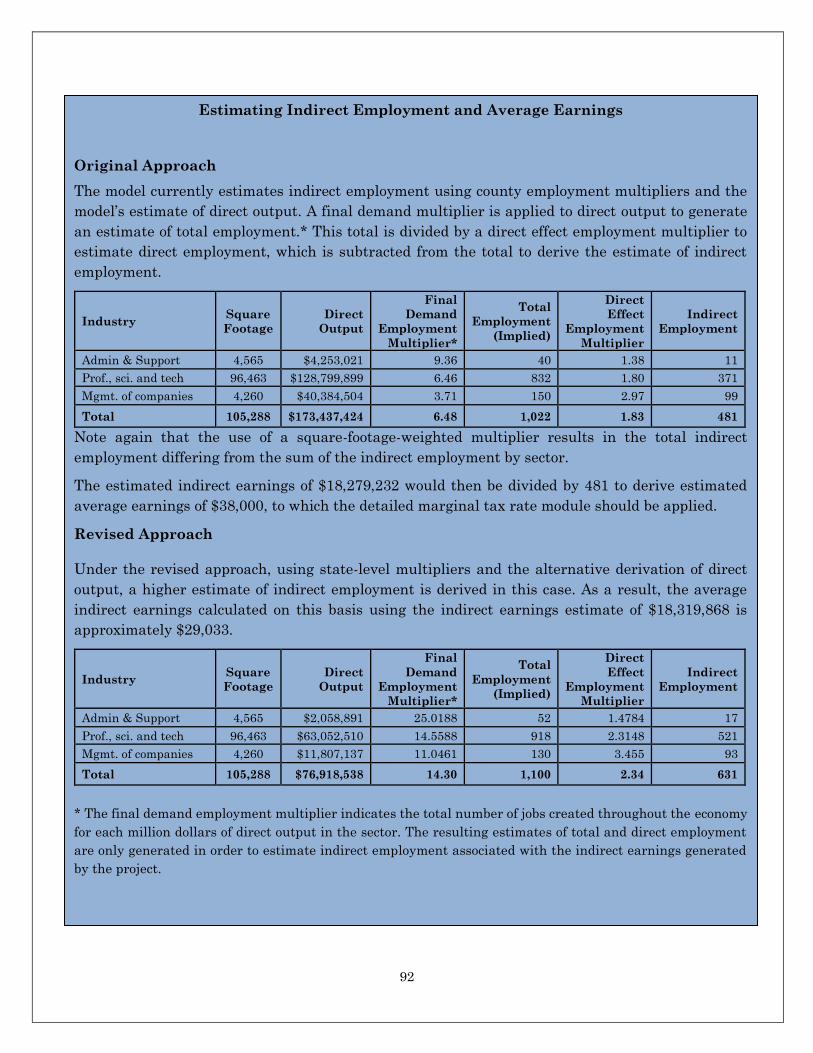
92
Estimating Indirect Employment and Average Earnings
Original Approach
The model currently estimates indirect employment using county employment multipliers and the
model’s estimate of direct output. A final demand multiplier is applied to direct output to generate
an estimate of total employment.* This total is divided by a direct effect employment multiplier to
estimate direct employment, which is subtracted from the total to derive the estimate of indirect
employment.
Industry Square
Footage
Direct
Output
Final
Demand
Employment
Multiplier*
Total
Employment
(Implied)
Direct
Effect
Employment
Multiplier
Indirect
Employment
Admin & Support 4,565 $4,253,021 9.36 40 1.38 11
Prof., sci. and tech 96,463 $128,799,899 6.46 832 1.80 371
Mgmt. of companies 4,260 $40,384,504 3.71 150 2.97 99
Total 105,288 $173,437,424 6.48 1,022 1.83 481
Note again that the use of a square-footage-weighted multiplier results in the total indirect
employment differing from the sum of the indirect employment by sector.
The estimated indirect earnings of $18,279,232 would then be divided by 481 to derive estimated
average earnings of $38,000, to which the detailed marginal tax rate module should be applied.
Revised Approach
Under the revised approach, using state-level multipliers and the alternative derivation of direct
output, a higher estimate of indirect employment is derived in this case. As a result, the average
indirect earnings calculated on this basis using the indirect earnings estimate of $18,319,868 is
approximately $29,033.
Industry Square
Footage
Direct
Output
Final
Demand
Employment
Multiplier*
Total
Employment
(Implied)
Direct
Effect
Employment
Multiplier
Indirect
Employment
Admin & Support 4,565 $2,058,891 25.0188 52 1.4784 17
Prof., sci. and tech 96,463 $63,052,510 14.5588 918 2.3148 521
Mgmt. of companies 4,260 $11,807,137 11.0461 130 3.455 93
Total 105,288 $76,918,538 14.30 1,100 2.34 631
* The final demand employment multiplier indicates the total number of jobs created throughout the economy
for each million dollars of direct output in the sector. The resulting estimates of total and direct employment
are only generated in order to estimate indirect employment associated with the indirect earnings generated
by the project.
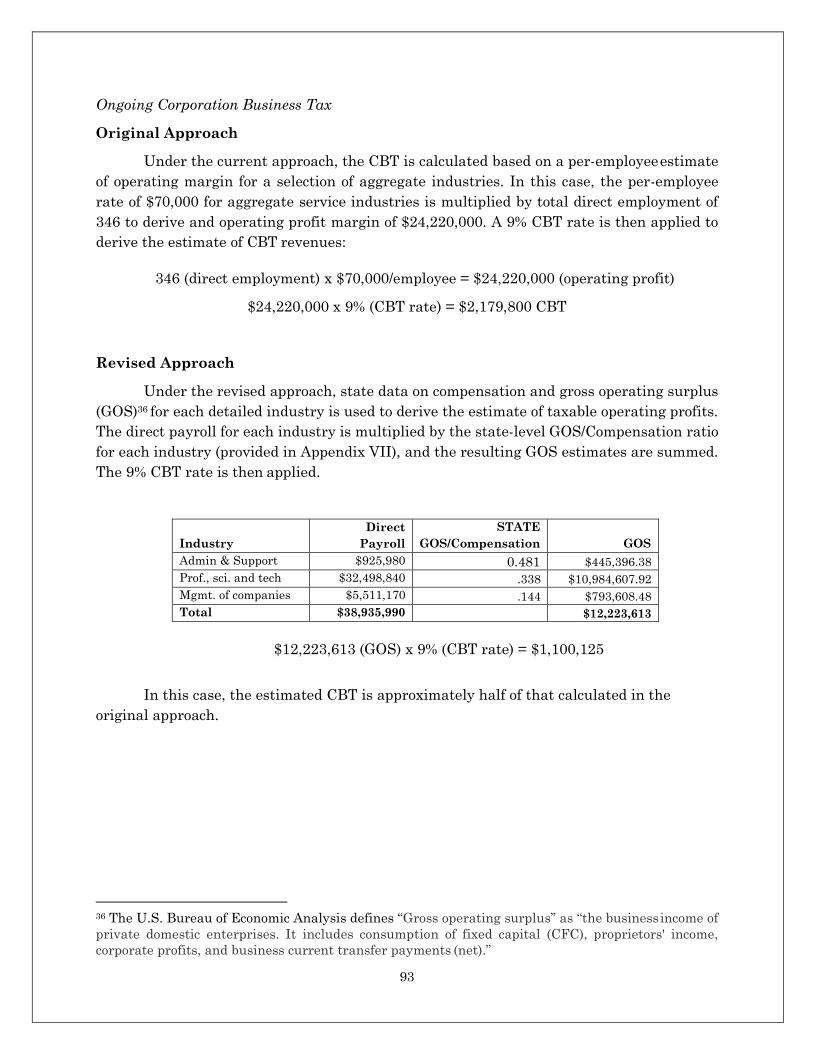
93
Ongoing Corporation Business Tax
Original Approach
Under the current approach, the CBT is calculated based on a per-employee estimate
of operating margin for a selection of aggregate industries. In this case, the per-employee
rate of $70,000 for aggregate service industries is multiplied by total direct employment of
346 to derive and operating profit margin of $24,220,000. A 9% CBT rate is then applied to
derive the estimate of CBT revenues:
346 (direct employment) x $70,000/employee = $24,220,000 (operating profit)
$24,220,000 x 9% (CBT rate) = $2,179,800 CBT
Revised Approach
Under the revised approach, state data on compensation and gross operating surplus
(GOS)36 for each detailed industry is used to derive the estimate of taxable operating profits.
The direct payroll for each industry is multiplied by the state-level GOS/Compensation ratio
for each industry (provided in Appendix VII), and the resulting GOS estimates are summed.
The 9% CBT rate is then applied.
Industry
Direct
Payroll STATE
GOS/Compensation
GOS Admin & Support $925,980 0.481 $445,396.38 Prof., sci. and tech $32,498,840 .338 $10,984,607.92 Mgmt. of companies $5,511,170 .144 $793,608.48 Total $38,935,990 $12,223,613
$12,223,613 (GOS) x 9% (CBT rate) = $1,100,125
In this case, the estimated CBT is approximately half of that calculated in the
original approach.
36 The U.S. Bureau of Economic Analysis defines “Gross operating surplus” as “the business income of
private domestic enterprises. It includes consumption of fixed capital (CFC), proprietors' income,
corporate profits, and business current transfer payments (net).”
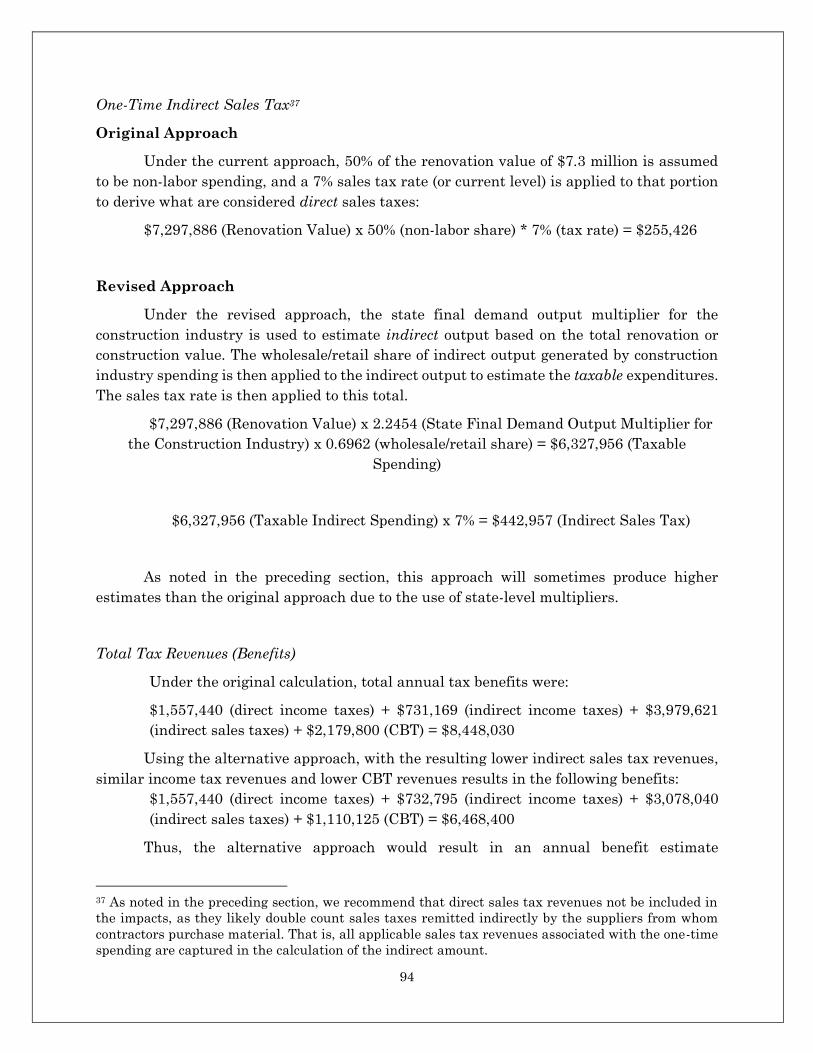
94
One-Time Indirect Sales Tax37
Original Approach
Under the current approach, 50% of the renovation value of $7.3 million is assumed
to be non-labor spending, and a 7% sales tax rate (or current level) is applied to that portion
to derive what are considered direct sales taxes:
$7,297,886 (Renovation Value) x 50% (non-labor share) * 7% (tax rate) = $255,426
Revised Approach
Under the revised approach, the state final demand output multiplier for the
construction industry is used to estimate indirect output based on the total renovation or
construction value. The wholesale/retail share of indirect output generated by construction
industry spending is then applied to the indirect output to estimate the taxable expenditures.
The sales tax rate is then applied to this total.
$7,297,886 (Renovation Value) x 2.2454 (State Final Demand Output Multiplier for
the Construction Industry) x 0.6962 (wholesale/retail share) = $6,327,956 (Taxable
Spending)
$6,327,956 (Taxable Indirect Spending) x 7% = $442,957 (Indirect Sales Tax)
As noted in the preceding section, this approach will sometimes produce higher
estimates than the original approach due to the use of state-level multipliers.
Total Tax Revenues (Benefits)
Under the original calculation, total annual tax benefits were:
$1,557,440 (direct income taxes) + $731,169 (indirect income taxes) + $3,979,621
(indirect sales taxes) + $2,179,800 (CBT) = $8,448,030
Using the alternative approach, with the resulting lower indirect sales tax revenues,
similar income tax revenues and lower CBT revenues results in the following benefits:
$1,557,440 (direct income taxes) + $732,795 (indirect income taxes) + $3,078,040
(indirect sales taxes) + $1,110,125 (CBT) = $6,468,400
Thus, the alternative approach would result in an annual benefit estimate
37 As noted in the preceding section, we recommend that direct sales tax revenues not be included in
the impacts, as they likely double count sales taxes remitted indirectly by the suppliers from whom
contractors purchase material. That is, all applicable sales tax revenues associated with the one-time
spending are captured in the calculation of the indirect amount.
95
approximately $2 million (about 23%) lower than in the current model. The model approach
in use at the time would grow benefits at an annual rate of 3% (effectively assuming a 3%
real growth rate) and then discount the results to net present value at a 6% rate over 20
years. In the original analysis, this resulted in total estimated benefits of $123 million (not
including one-time benefits, which were de minimis in this case - $255,426) and, based on the
total award of $6.92 million, a benefit-cost ratio of nearly 18. Under these same growth and
discounting assumptions, the alternative approach would result in estimated benefits of
$94.2 million and a benefit cost ratio of 13. If the current parameters of 2.25% annual growth
and a 15-year period of benefit calculation are applied, estimated benefits would be $72
million and the benefit-cost ratio would be 10.
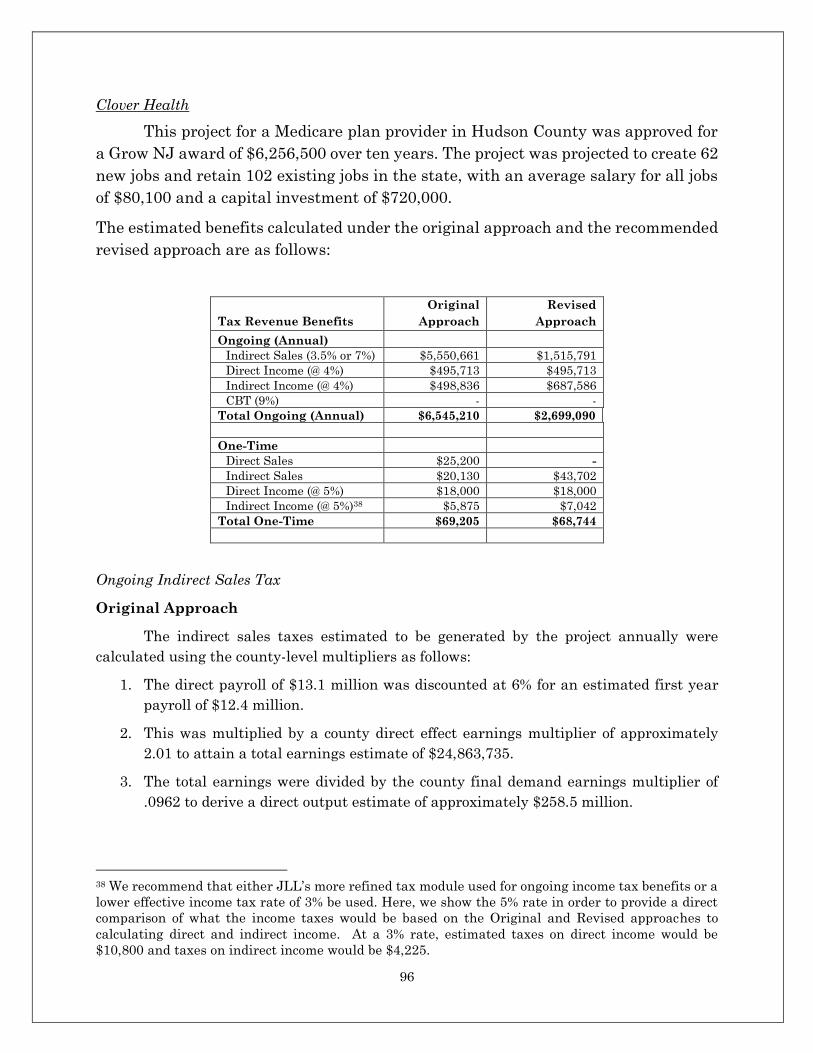
96
Clover Health
This project for a Medicare plan provider in Hudson County was approved for
a Grow NJ award of $6,256,500 over ten years. The project was projected to create 62
new jobs and retain 102 existing jobs in the state, with an average salary for all jobs
of $80,100 and a capital investment of $720,000.
The estimated benefits calculated under the original approach and the recommended
revised approach are as follows:
Tax Revenue Benefits
Original
Approach
Revised
Approach
Ongoing (Annual) Indirect Sales (3.5% or 7%) $5,550,661 $1,515,791
Direct Income (@ 4%) $495,713 $495,713
Indirect Income (@ 4%) $498,836 $687,586
CBT (9%) - -
Total Ongoing (Annual) $6,545,210 $2,699,090
One-Time
Direct Sales $25,200 -
Indirect Sales $20,130 $43,702
Direct Income (@ 5%) $18,000 $18,000
Indirect Income (@ 5%)38 $5,875 $7,042
Total One-Time $69,205 $68,744
Ongoing Indirect Sales Tax
Original Approach
The indirect sales taxes estimated to be generated by the project annually were
calculated using the county-level multipliers as follows:
1. The direct payroll of $13.1 million was discounted at 6% for an estimated first year
payroll of $12.4 million.
2. This was multiplied by a county direct effect earnings multiplier of approximately
2.01 to attain a total earnings estimate of $24,863,735.
3. The total earnings were divided by the county final demand earnings multiplier of
.0962 to derive a direct output estimate of approximately $258.5 million.
38 We recommend that either JLL’s more refined tax module used for ongoing income tax benefits or a
lower effective income tax rate of 3% be used. Here, we show the 5% rate in order to provide a direct
comparison of what the income taxes would be based on the Original and Revised approaches to
calculating direct and indirect income. At a 3% rate, estimated taxes on direct income would be
$10,800 and taxes on indirect income would be $4,225.
97
4. This estimate was then multiplied by the final demand output multiplier of 1.61 and
the direct output subtracted out to derive a n estimate of $158.6 million in indirect
output – the model’s proxy for indirect annual spending.
5. This amount was then multiplied by the effective tax rate of 3.5% to derive the
estimated indirect sales tax revenues of $5.551 million.
Due to the commutation effects described in the preceding section, we suggest that
the low county-level final demand earnings multiplier results in an overestimate of indirect
sales tax revenues.
Revised Approach
1. Direct payroll of $12.4 million is divided by the national compensation-to-output ratio
for the industry of approximately 0.263, producing a direct output estimate of $47.2
million.
2. The state-level final demand output multiplier of approximately 2.3 is then applied
and the direct output subtracted from the product to arrive at an estimate of $61.1
million in indirect output.
3. The retail, wholesale and food service shares of indirect expenditures generated by
the industry (approximately 35.4%) are then applied to generate an estimate of $21.65
million in taxable expenditures.
4. A 7% tax rate is then applied to the estimated indirect taxable sales to arrive at an
annual indirect tax estimate of approximately $1.5 million.
Ongoing Income Tax Revenues
Original Approach
In this example, for purposes of comparison, we use the 4% effective tax rate on
income used in the analysis at the time it was conducted. For projects approved since the
model revisions were adopted, income-level-specific marginal tax rates would be applied. As
such, the income taxes on direct earnings of $495,713 would not be changed.
For income taxes on indirect earnings, the indirect income was calculated by applying
the direct effect earnings multiplier for the county/industry to the direct earnings (payroll):
1. $12,392,830 (direct earnings) x 2.01 (direct earnings multiplier) - $12, 392,830 =
$12,470,905 (indirect earnings)
2. $12,470,905 x 4% = $498,836 taxes on indirect earnings
Revised Approach
Using the alternative approach, the estimated direct output and state-level final
demand earnings multipliers are used to estimate indirect earnings and tax revenues:
98
1. $47.2 million (direct output) x .6268 (final demand earnings multiplier) = $29,582,477
(total earnings)
2. $29,582,477 (total earnings) - $12,392,830 (direct earnings) = $17,189,647 (indirect
earnings)
3. $17,189,647 (indirect earnings) x 4% = $687,586 taxes on indirect earnings.
One-Time Sales Taxes
Original Approach
Under the current approach, 50% of the construction value of $720,000 million is
assumed to be non-labor spending, and a 7% sales tax rate (or current level) is applied to that
portion to derive what are considered direct sales taxes:
$720,000 (Construction Value) x 50% (non-labor share) * 7% (tax rate) = $25,200
Indirect expenditures and sales taxes are then calculated using the county direct output
multiplier for construction:
$720,000 (Construction Value) * .4 (Direct Construction Output Multiplier -1) *
7% (tax rate) = $20,130
Thus, total one-time taxes on spending are estimated as $25,200+$20,130 = $45,330
Revised Approach
Under the revised approach, the state final demand output multiplier for the
construction industry is used to estimate indirect output based on the total construction
value. The wholesale/retail share of indirect output generated by construction industry
spending is then applied to the indirect output to estimate the taxable expenditures. As
described earlier in this section, to avoid double counting of expenditures, only sales taxes on
the indirect portion of the expenditures are included. The sales tax rate is then applied to
this total.
1. $720,000 (Construction Value) x 1.2454 (State Final Demand Output Multiplier for the
Construction Industry-1) x 0.6962 (wholesale/retail share) = $624,308 (Taxable
Spending)
2. $624,308 (Taxable Indirect Spending) x 7% = $43,702 (Indirect Sales Tax)
One-Time Income Tax Revenues
Original Approach
Under the original approach, direct income is calculated as 50% of total construction
costs, and an effective income tax rate of 5% is applied to this total:
99
$720,000 (Construction Cost) * 50% * 5% = $18,000.
Income taxes on indirect income are then calculated by applying the county-level direct effect
earnings multiplier (minus one) to the estimated direct earnings ($360,000), and again
applying the 5% effective tax rate.
1. $360,000 (Direct Earnings) * 0.33 (County Direct Effect Earnings Multiplier -1) =
$117,504
2. $117,504 (Indirect earnings) x 5% = $5,875
Revised Approach
Under the revised approach, direct income is still calculated as 50% of total
construction costs.
$720,000 (Construction Cost) * 50% * 5% = $18,000.
As noted previously, we recommend that a lower effective tax rate of 3% be used, or that
JLL’s detailed income tax module be used with the appropriate prevailing wage rate and
estimated level of construction employment based on that rate. At a 3% effective rate, direct
income taxes would total $10,800.
Indirect income taxes are then calculated by applying the state-level final demand
earnings multiplier to the total construction cost, subtracting out the direct income, and
applying the effective income tax rate.
1. $720,000 (Construction Cost) * 0.6956 (final demand earnings multiplier) = $500,832
(Total Earnings)
2. $500,832 (Total Earnings) - $360,000 (Direct Earnings) = $140,832 (Indirect
Earnings)
3. $140,832 (Indirect Earnings) * 5% = $7,042 (Indirect Income Taxes)
Again, we recommend that income taxes on indirect earnings also either be calculated at a
lower effective rate of 3% (which would result in estimated indirect income taxes of $4,225
in this case), or that the JLL income tax module be used with estimated employment and
per-job earnings calculated as described in the box on page 91.
Total Tax Revenues (Benefits)
Under the original calculation, total annual tax benefits were:
$495,713 (direct income taxes) + $498,836 (indirect income taxes) + $5,550,661
(indirect sales taxes) = $6,545,210
Using the alternative approach, with the resulting lower indirect sales tax revenues
and higher indirect income tax revenues results in the following benefits:
100
$495,713 (direct income taxes) + $687,586 (indirect income taxes) + $1,515,791
(indirect sales taxes) = $2,699,090
Thus, the alternative approach would result in an annual benefit estimate
approximately $3.8 million (about 58%) lower than in the current model. The model approach
in use at the time would grow benefits at an annual rate of 3% (effectively assuming a 3%
real growth rate) and then discount the results to net present value at a 6% rate over 20
years. In the original analysis, this resulted in total estimated benefits of $95.4 million
(including one-time benefits, which were de minimis in this case - $69,205) and, based on the
total award of $6.26 million, a benefit-cost ratio of over 15. Under these same growth and
discounting assumptions, the alternative approach would result in estimated benefits of
$39.4 million and a benefit cost ratio of 6.3. If the current parameters of 2.25% annual growth
and a 15-year period of benefit calculation are applied, estimated benefits would be $30.1
million and the benefit-cost ratio would be 4.8.
On the cost side of the analysis, as noted previously, we recommend that awards (i.e.,
costs) be discounted over time in parallel to benefits, resulting in a net present value of costs
approximately 26% lower than the undiscounted award. In this case, discounting the award
at 6% would result in a net present value of $4.6 million and thus a benefit-cost ratio of
approximately 6.5.
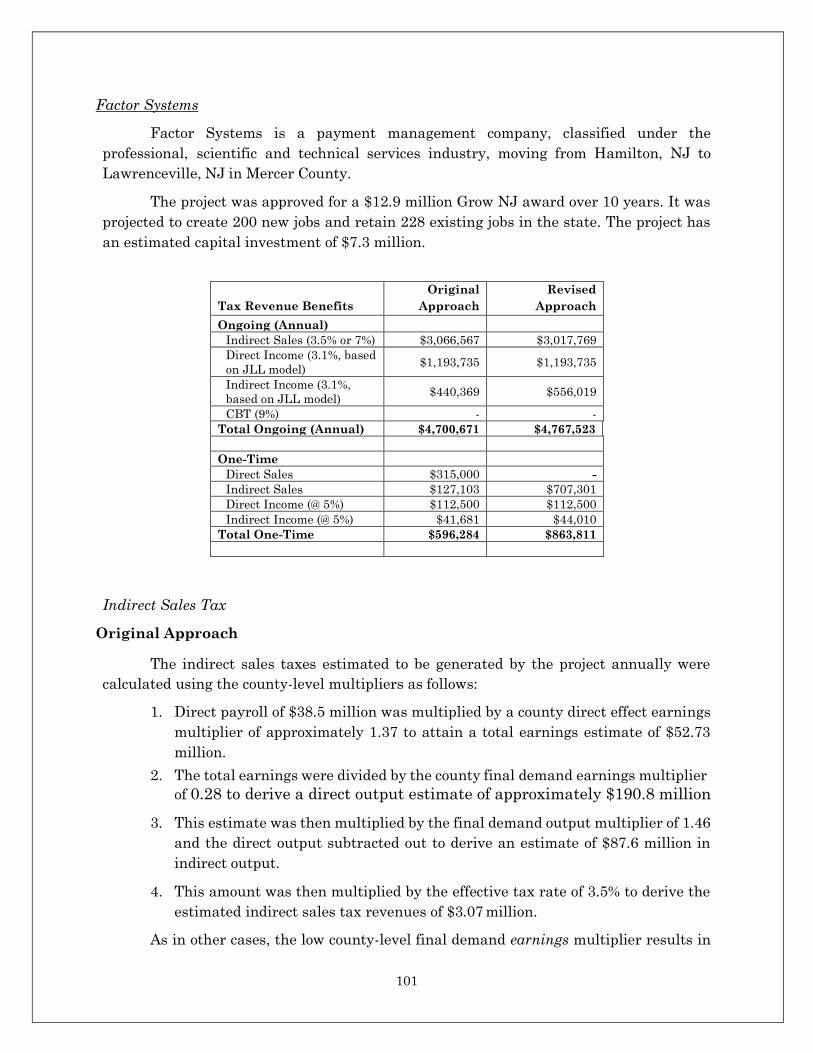
101
Factor Systems
Factor Systems is a payment management company, classified under the
professional, scientific and technical services industry, moving from Hamilton, NJ to
Lawrenceville, NJ in Mercer County.
The project was approved for a $12.9 million Grow NJ award over 10 years. It was
projected to create 200 new jobs and retain 228 existing jobs in the state. The project has
an estimated capital investment of $7.3 million.
Tax Revenue Benefits
Original
Approach
Revised
Approach
Ongoing (Annual) Indirect Sales (3.5% or 7%) $3,066,567 $3,017,769
Direct Income (3.1%, based
on JLL model) $1,193,735 $1,193,735
Indirect Income (3.1%,
based on JLL model) $440,369 $556,019
CBT (9%) - -
Total Ongoing (Annual) $4,700,671 $4,767,523
One-Time
Direct Sales $315,000 -
Indirect Sales $127,103 $707,301
Direct Income (@ 5%) $112,500 $112,500
Indirect Income (@ 5%) $41,681 $44,010
Total One-Time $596,284 $863,811
Indirect Sales Tax
Original Approach
The indirect sales taxes estimated to be generated by the project annually were
calculated using the county-level multipliers as follows:
1. Direct payroll of $38.5 million was multiplied by a county direct effect earnings
multiplier of approximately 1.37 to attain a total earnings estimate of $52.73
million.
2. The total earnings were divided by the county final demand earnings multiplier
of 0.28 to derive a direct output estimate of approximately $190.8 million
3. This estimate was then multiplied by the final demand output multiplier of 1.46
and the direct output subtracted out to derive an estimate of $87.6 million in
indirect output.
4. This amount was then multiplied by the effective tax rate of 3.5% to derive the
estimated indirect sales tax revenues of $3.07 million.
As in other cases, the low county-level final demand earnings multiplier results in
102
an overestimate of direct output. However, in this case, the state final demand output
multiplier for the industry is significantly larger than that of the county, so that the
alternative approach we suggest results in a higher estimate of indirect spending than in
the original approach.
Revised Approach
1. Direct payroll of $38.5 million is divided by the national compensation-to-output
ratio for the industry of approximately 0.515, producing a direct output estimate
of $74.7 million.
2. The state-level final demand output multiplier of approximately 2.2 is then
applied and the direct output subtracted from the product to arrive at an estimate
of $89.2 million in indirect output.
3. The retail, wholesale and food service shares of indirect expenditures generated
by the industry (approximately 0.48) are then applied to generate an estimate
of $43.1 million in taxable spending.
4. A 7% tax rate is then applied to the estimated indirect taxable sales to arrive at
an annual indirect tax estimate of approximately $3 million – about the same
as under the current approach.
Income Tax Revenues
Original Approach
In this example, based on the model revisions adopted in 2017, income-level-specific
marginal tax rates were applied to the estimated salaries for the direct jobs, resulting in
an effective income tax rate of approximately 3.1% applied to the direct earnings of $38.52
million. Unlike the approach used prior to the revisions, this approach does take into
account the effect of interstate commutation on income taxes. The 3.1% effective rate is
calculated as the estimated income tax based on employee salaries, less a percentage of
interstate commutation derived from Census commutation data.
For income taxes on indirect earnings, the indirect income was calculated by
applying the direct effect earnings multiplier for the county/industry to the direct earnings
(payroll):
1. $38,520,000 (direct earnings) x 1.37 (direct earnings multiplier) - $38,520,000 (direct
earnings) = $14,210,028 (indirect earnings)
2. $14,210,028 x 3.1% = $440,369 taxes on indirect earnings
Revised Approach
Using the revised approach, the estimated direct output and state-level final demand
earnings multipliers are used to estimate indirect earnings and tax revenues:
103
1. $74,734,477 (direct output) x .7555 (final demand earnings multiplier) =
$56,461,898 (total earnings)
2. $56,461,898 (total earnings) - $38,520,000 (direct earnings) = $17,941,898 (indirect
earnings)
3. $17,941,898 (indirect earnings) x 3.1% = $556,019 taxes on indirect earnings.39
One-Time Sales Taxes
Original Approach
Under the current approach, 50% of the construction value of $4.5 million is assumed
to be non-labor spending, and a 7% sales tax rate (or current level) should be applied to that
portion to derive what are considered direct sales taxes:
$4.5 million (Construction Value) x 50% (non-labor share) * 7% (tax rate) = $157,500
[Note: In this particular example, there appears to have been an error in the calculation of
direct sales taxes, as the 7% rate was applied to the entire Construction Value, resulting in
estimated direct sales taxes of $315,000.]
Indirect expenditures and sales taxes are then calculated using the county direct output
multiplier for construction:
$4.5 million (Construction Value) * .4 (Direct Construction Output Multiplier -1) *
7% (tax rate) = $127,103
Thus, total one-time taxes on spending are estimated as $315,000+$127,103 = $442,103
Revised Approach
Under the revised approach, the state final demand output multiplier for the
construction industry is used to estimate indirect output based on the total construction
value. The wholesale/retail share of indirect output generated by construction industry
spending is then applied to the indirect output to estimate the taxable expenditures. As
described earlier in this section, to avoid double counting of expenditures, only sales taxes on
the indirect portion of the expenditures are included. The sales tax rate is then applied to
this total.
1. $4.5 million (Construction Value) x 1.2454 (State Final Demand Output Multiplier for
the Construction Industry-1) x 0.6962 (wholesale/retail share) = $3.9 million (Taxable
Spending)
39 Here, as in the JLL model and for purposes of comparison, we apply the same 3.1% effective rate
calculated for the taxes on direct income to the indirect income as well. However, as described in the
methodology proposed on page 91, we recommend that a separate approach be used to derive an
estimate of average income for the indirect employment, and that the JLL income tax module then be
used to derive an appropriate effective income tax rate to apply to those estimated earnings.
104
2. $3.9 (Taxable Indirect Spending) x 7% = $707,301 (Indirect Sales Tax)
One-Time Income Tax Revenues
Original Approach
Under the original approach, direct income is calculated as 50% of total construction
costs, and an effective income tax rate of 5% is applied to this total:
$4.5 million (Construction Cost) * 50% * 5% = $112,500.
Income taxes on indirect income are then calculated by applying the county-level direct effect
earnings multiplier (minus one) to the estimated direct earnings ($2.25 million), and again
applying the 5% effective tax rate.
1. $2.25 million (Direct Earnings) * 0.37 (County Direct Effect Earnings Multiplier
-1) = $833,625
2. $833,625 (Indirect earnings) x 5% = $41,681
Revised Approach
Under the revised approach, direct income is still calculated as 50% of total
construction costs.
$4.5 million (Construction Cost) * 50% * 5% = $112,500.
As noted previously, we recommend that a lower effective tax rate of 3% be used, or that
JLL’s detailed income tax module be used with the appropriate prevailing wage rate and
estimated level of construction employment based on that rate. At a 3% effective rate, direct
income taxes would total $67,500.
Indirect income taxes are then calculated by applying the state-level final demand
earnings multiplier to the total construction cost, subtracting out the direct income, and
applying the effective income tax rate.
1. $4.5 million (Construction Cost) * 0.6956 (final demand earnings multiplier) = $3.13
million (Total Earnings)
2. $3.13 million (Total Earnings) - $2.25 million (Direct Earnings) = $880,200 (Indirect
Earnings)
3. $880,200 (Indirect Earnings) * 5% = $44,010 (Indirect Income Taxes)
Again, we recommend that income taxes on indirect earnings also either be calculated at a
lower effective rate of 3% (which would result in estimated indirect income taxes of $26,406
in this case), or that the JLL income tax module be used with estimated employment and
per-job earnings calculated as described in the box on page 91.
105
Total Tax Revenues (Benefits)
Under the original calculation, total annual tax benefits were:
$1,193,735 (direct income taxes) + $440,369 (indirect income taxes) + $3,066,567
(indirect sales taxes) = $4,700,671
Using the alternative approach, with the resulting higher indirect sales tax revenues
and higher indirect income tax revenues results in the following benefits:
$1,193,735 (direct income taxes) + $556,019 (indirect income taxes) + $3,017,769
(indirect sales taxes) = $4,767,523
Thus, the alternative approach would result in an annual benefit estimate
approximately $66,852 higher than in the current model. The model approach in use at the
time would grow benefits at an annual rate of 2.25% (effectively assuming a 2.25% real
growth rate) and then discount the results to net present value at a 6% rate over 15 years.
In the original analysis, this resulted in total estimated benefits of $52.9 million (including
one-time benefits) and, based on the total award of $12.9 million, a benefit-cost ratio of 4.1.
Under these same growth and discounting assumptions, the alternative approach would
result in estimated benefits of $53.7 million and a benefit cost ratio of 4.2.
On the cost side of the analysis, as noted previously, we recommend that awards (i.e.,
costs) be discounted over time in parallel to benefits, resulting in a net present value of costs
approximately 26% lower than the undiscounted award. In this case, discounting the award
at 6% over 10 years would result in a net present value of $9.5 million and thus a benefit-
cost ratio of approximately 5.7.
106
APPENDIX VI: ALTERNATIVE BENEFIT-COST MODEL PARAMETERS
Appendix VI is in digital form and was previously provided to JLL. It is intended
primarily to serve as a reference document as any of the proposed modeling changes are
adopted. It contains a set of spreadsheets providing the county-level RIMS II multipliers used
in some Grow NJ benefit-cost analyses, as well as examples of the state-level RIMS II
multipliers that would be used in the alternative modeling approaches described above. The
spreadsheets also provide estimates on a county/industry basis of the difference in estimated
annual sales and income tax benefits per dollar of income from Grow NJ jobs when calculated
using the current approach and when using the proposed alternatives.
As noted in Appendix V, the state-level multiplier examples shown in the spreadsheets
are based on older RIMS II multipliers and are provided only for illustrative purposes, though
the state-level inter-industry relationships are unlikely to have changed significantly, and the
most potentially impactful modeling changes rely not on RIMS II state multipliers but rather
on national data (compensation-to-output ratios). In addition, the county-level multipliers
used in the JLL model have been updated since the model’s inception, and those shown in the
spreadsheet may not correspond to those cited in the examples presented in Appendix V.
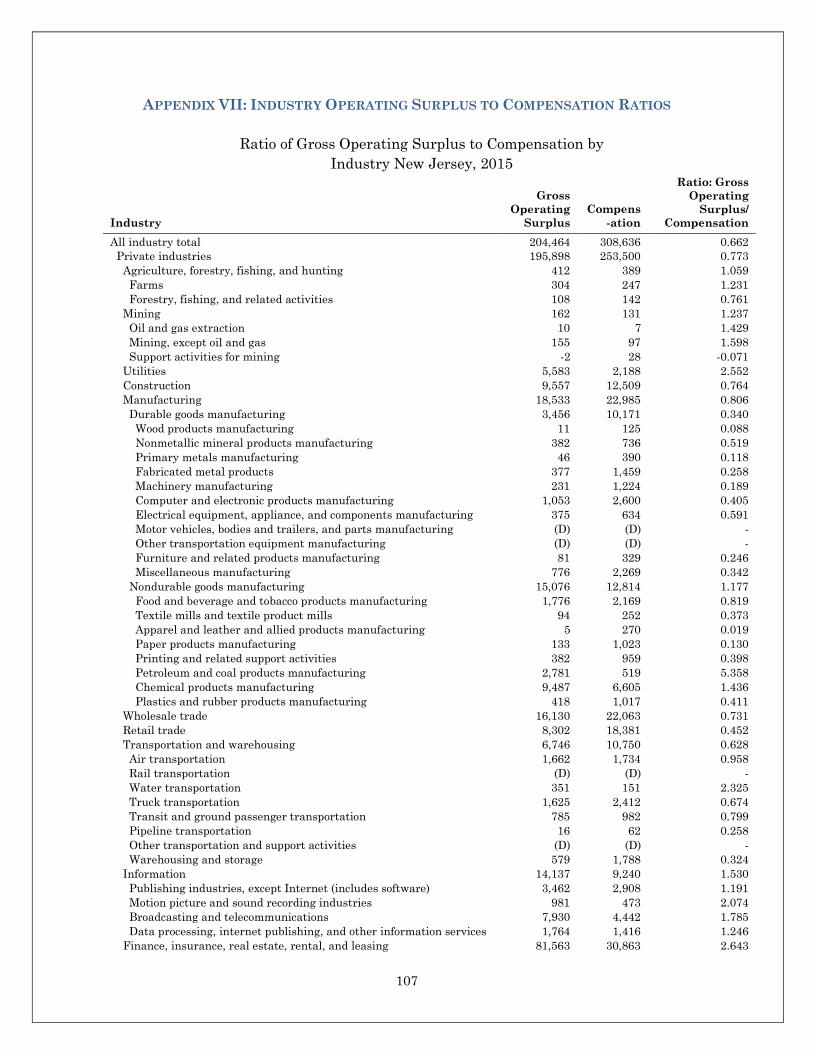
107
APPENDIX VII: INDUSTRY OPERATING SURPLUS TO COMPENSATION RATIOS
Ratio of Gross Operating Surplus to Compensation by
Industry New Jersey, 2015
Industry
Gross
Operating
Surplus
Compens
-ation
Ratio: Gross
Operating
Surplus/
Compensation
All industry total 204,464 308,636 0.662 Private industries 195,898 253,500 0.773
Agriculture, forestry, fishing, and hunting 412 389 1.059 Farms 304 247 1.231 Forestry, fishing, and related activities 108 142 0.761
Mining 162 131 1.237 Oil and gas extraction 10 7 1.429 Mining, except oil and gas 155 97 1.598 Support activities for mining -2 28 -0.071
Utilities 5,583 2,188 2.552 Construction 9,557 12,509 0.764 Manufacturing 18,533 22,985 0.806 Durable goods manufacturing 3,456 10,171 0.340 Wood products manufacturing 11 125 0.088 Nonmetallic mineral products manufacturing 382 736 0.519 Primary metals manufacturing 46 390 0.118 Fabricated metal products 377 1,459 0.258 Machinery manufacturing 231 1,224 0.189 Computer and electronic products manufacturing 1,053 2,600 0.405 Electrical equipment, appliance, and components manufacturing 375 634 0.591 Motor vehicles, bodies and trailers, and parts manufacturing (D) (D) - Other transportation equipment manufacturing (D) (D) - Furniture and related products manufacturing 81 329 0.246 Miscellaneous manufacturing 776 2,269 0.342
Nondurable goods manufacturing 15,076 12,814 1.177 Food and beverage and tobacco products manufacturing 1,776 2,169 0.819 Textile mills and textile product mills 94 252 0.373 Apparel and leather and allied products manufacturing 5 270 0.019 Paper products manufacturing 133 1,023 0.130 Printing and related support activities 382 959 0.398 Petroleum and coal products manufacturing 2,781 519 5.358 Chemical products manufacturing 9,487 6,605 1.436 Plastics and rubber products manufacturing 418 1,017 0.411
Wholesale trade 16,130 22,063 0.731 Retail trade 8,302 18,381 0.452 Transportation and warehousing 6,746 10,750 0.628 Air transportation 1,662 1,734 0.958 Rail transportation (D) (D) - Water transportation 351 151 2.325 Truck transportation 1,625 2,412 0.674 Transit and ground passenger transportation 785 982 0.799 Pipeline transportation 16 62 0.258 Other transportation and support activities (D) (D) - Warehousing and storage 579 1,788 0.324
Information 14,137 9,240 1.530 Publishing industries, except Internet (includes software) 3,462 2,908 1.191 Motion picture and sound recording industries 981 473 2.074 Broadcasting and telecommunications 7,930 4,442 1.785 Data processing, internet publishing, and other information services 1,764 1,416 1.246
Finance, insurance, real estate, rental, and leasing 81,563 30,863 2.643
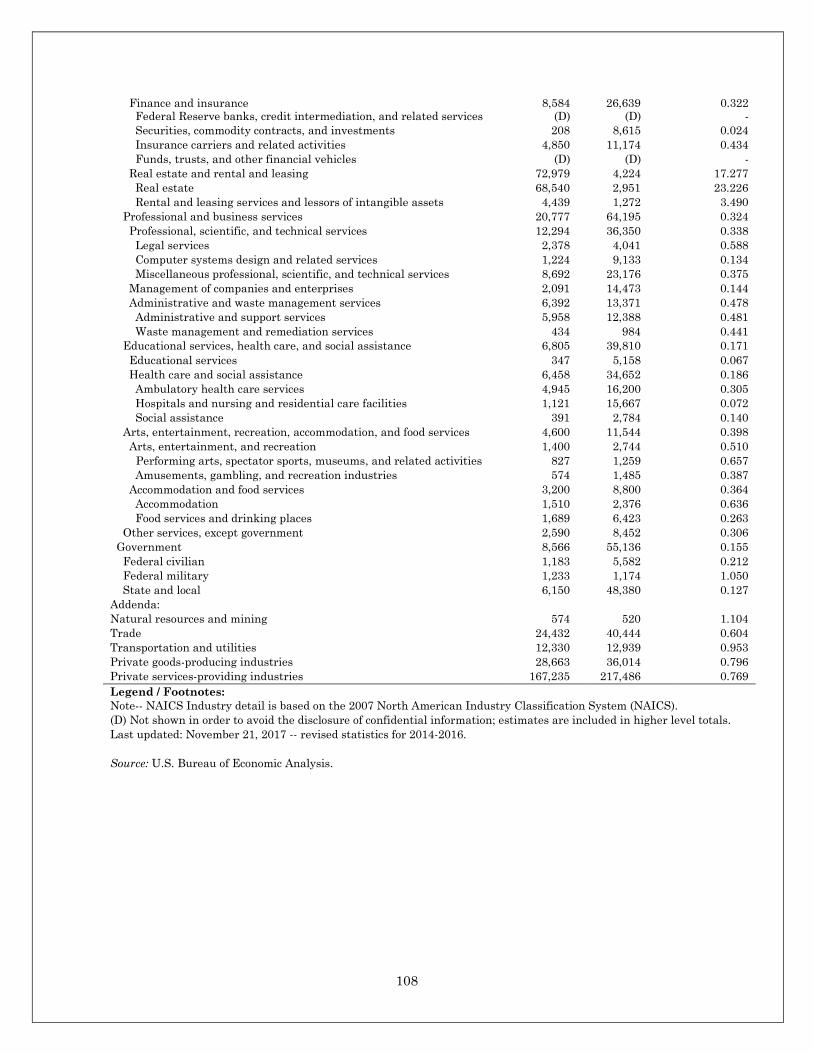
108
Finance and insurance 8,584 26,639 0.322 Federal Reserve banks, credit intermediation, and related services (D) (D) - Securities, commodity contracts, and investments 208 8,615 0.024 Insurance carriers and related activities 4,850 11,174 0.434 Funds, trusts, and other financial vehicles (D) (D) -
Real estate and rental and leasing 72,979 4,224 17.277 Real estate 68,540 2,951 23.226 Rental and leasing services and lessors of intangible assets 4,439 1,272 3.490
Professional and business services 20,777 64,195 0.324 Professional, scientific, and technical services 12,294 36,350 0.338 Legal services 2,378 4,041 0.588 Computer systems design and related services 1,224 9,133 0.134 Miscellaneous professional, scientific, and technical services 8,692 23,176 0.375
Management of companies and enterprises 2,091 14,473 0.144 Administrative and waste management services 6,392 13,371 0.478 Administrative and support services 5,958 12,388 0.481 Waste management and remediation services 434 984 0.441
Educational services, health care, and social assistance 6,805 39,810 0.171 Educational services 347 5,158 0.067 Health care and social assistance 6,458 34,652 0.186 Ambulatory health care services 4,945 16,200 0.305 Hospitals and nursing and residential care facilities 1,121 15,667 0.072 Social assistance 391 2,784 0.140
Arts, entertainment, recreation, accommodation, and food services 4,600 11,544 0.398 Arts, entertainment, and recreation 1,400 2,744 0.510
Performing arts, spectator sports, museums, and related activities 827 1,259 0.657 Amusements, gambling, and recreation industries 574 1,485 0.387
Accommodation and food services 3,200 8,800 0.364 Accommodation 1,510 2,376 0.636 Food services and drinking places 1,689 6,423 0.263
Other services, except government 2,590 8,452 0.306 Government 8,566 55,136 0.155
Federal civilian 1,183 5,582 0.212 Federal military 1,233 1,174 1.050 State and local 6,150 48,380 0.127
Addenda: Natural resources and mining 574 520 1.104 Trade 24,432 40,444 0.604 Transportation and utilities 12,330 12,939 0.953 Private goods-producing industries 28,663 36,014 0.796 Private services-providing industries 167,235 217,486 0.769 Legend / Footnotes: Note-- NAICS Industry detail is based on the 2007 North American Industry Classification System (NAICS). (D) Not shown in order to avoid the disclosure of confidential information; estimates are included in higher level totals. Last updated: November 21, 2017 -- revised statistics for 2014-2016.
Source: U.S. Bureau of Economic Analysis.