Embed Size (px)
Citation preview

A Deep Learning Approach to the Citywide TrafficAccident Risk Prediction
Honglei Ren*, You Song*, Jingwen Wang*, Yucheng Hu+, and Jinzhi Lei+
*School of Software, Beihang University, Beijing, China,[email protected], [email protected],[email protected]
+Zhou Pei-Yuan Center for Applied Mathematics, Tsinghua University, Beijing, China,[email protected], [email protected]
Abstract—With the rapid development of urbanization, theboom of vehicle numbers has resulted in serious traffic accidents,which led to casualties and huge economic losses. The ability topredict the risk of traffic accident is important in the preventionof the occurrence of accidents and to reduce the damagescaused by accidents in a proactive way. However, traffic accidentrisk prediction with high spatiotemporal resolution is difficult,mainly due to the complex traffic environment, human behavior,and lack of real-time traffic-related data. In this study, wecollected big traffic accident data. By analyzing the spatial andtemporal patterns of traffic accident frequency, we presentedthe spatiotemporal correlation of traffic accidents. Based on thepatterns we found in analysis, we proposed a high accurate deeplearning model based on recurrent neural network toward theprediction of traffic accident risk. The predictive accident riskcan be potential applied to the traffic accident warning system.The proposed method can be integrated into an intelligent trafficcontrol system toward a more reasonable traffic prediction andcommand organization.
I. INTRODUCTION
In modern society, the rapid development of urbanizationhas resulted in the boom of vehicles, causing a number ofproblems, such as traffic congestion, air pollution, and trafficaccidents. These problems have caused huge economic loss aswell as human casualties. According to Global Status Reporton Road Safety, published by World Health Organization in2015, about 1.25 million people were killed in traffic accidentsevery year. With the help of big traffic data and deep learning,real-time traffic flow prediction has enabled people to avoidtraffic jam by choosing less congested routes. Big traffic dataand deep learning may also provide a promising solution topredict or reduce the risk of traffic accidents.
One important task in traffic accident prevention is to buildan effective traffic accident risk prediction system. If the trafficaccident risk in a certain region can be predicted, we candisseminate this information to the nearby drivers to alert themor make them choose a less hazardous road. However, accurateprediction of traffic accident risk is very difficult becausemany related factors could affect traffic accident. For example,different regions have tremendous difference on traffic accidentrate. In addition, poor weather condition such as snow or fogcan reduce road visibility and traffic capacity, thus increasethe change of traffic accidents. Traffic accident rate variesat different time of a day, possibly related to the physical
condition of the drivers. Although many researchers havefocused on the identification of key factors associated withtraffic accident [1], effective prediction of the traffic accidentrisk dynamically remains to be a challenge problem.
With the development of deep learning, methods based ondeep learning and big data have shown favorable results intraffic related problems, such as traffic flow prediction [2],arrival time estimation [3], origin-destination forecasting [4],etc. As for traffic accident risk prediction based on deeplearning, to our best knowledge, the only work is done by Chenet. al., who use human mobility features extracted from Stackdenoise Autoencoder to infer traffic accident risk in Japan [5].However, they did not consider the periodical patterns and thespatial distribution patterns of traffic accidents. In particular,traffic accidents may closely related to the day of week.Other important factors they missed are weather condition,air quality, etc. To improve the power of traffic accident riskprediction, it is important to combine all these factors into acomprehensive model.
In this paper, we collected big traffic accident data andbuilt a deep model for traffic accident risk prediction basedon recurrent neural network. By analyzing the spatial andtemporal patterns of traffic accident frequency, we presentedthe spatiotemporal correlation of traffic accidents. Based onthe patterns we found in analysis, we proposed a high accuratedeep learning model for traffic accident risk prediction. Themodel can learn deep connections between traffic accidentsand its spatial-temporal patterns. As a potential application,the traffic accident prediction system based on our methodcan be used to help traffic enforcement department to allocatepolice forces in advance of traffic accidents.
The rest of this paper is organized as follows: Section2 introduces some previous works that are related with thepresent one. Section 3 describes the data source and thepattern analysis result of traffic accidents. Section 4 introducesour deep learning model for traffic accident risk prediction.Section 5 shows the results of experiment. Section 6 gives theconclusions and future works.
II. RELATED WORK
1) Identification of Traffic Accident Trigger: Tremendousefforts have been devoted to the identification of key con-
arX
iv:1
710.
0954
3v2
[cs
.CY
] 1
5 A
pr 2
018
Fig. 1. Workflow of our traffic accident risk prediction method. First, the big traffic accident data is collected. Second, the data is discretized in space andtime, and then feed to the deep model for training. After training, we feed recent historical data to the trained model and then obtained the real-time trafficaccident risk prediction.
ditions or particular traffic patterns that could lead to traf-fic accident. For instance, Oh proposed the assumption thatdisruptive traffic flow is a trigger to crash [6]. Based onthe loop detector data and crash data, they found that 5-minstandard deviation of speeds right before a traffic accident is aneffective indicator of crash. Although different crash indicatorshave been proposed, they could not meet the requirement ofaccurate accident prediction because numerous factors havecomplex connections with traffic accidents.
2) Real-time Traffic Accident Prediction: With the devel-opment of machine learning, many researchers start to focuson real-time traffic accident prediction. Lv chose featurevariables based on Euclidean metric and utilized k-nearestneighbor method to predict traffic accident [8].Park collectedbig traffic accident data of highway in Seoul and build aprediction workflow based on k-means cluster analysis andlogistic regression [9]. Recently, Chen used human mobilitydata in Japan and build a Stack denoise Autoencoder to inferthe real-time traffic risk [5]. One limitation of these works isthat, they did not incorporate several importance factors suchas traffic flow, weather condition, air quality into their model.Without these information, the predictive power of the modelcould be weakened.
3) Deep Learning: The success of deep learning hasproved its power in discovering intricate structures in high-dimensional data. It has been widely used as the state-of-the-art technique in image recognition speech recognition, naturallanguage understanding , etc. As for researches on intelligenttransportation system, a number of studies focus on trafficflow prediction based on deep learning [2]. In a longer timescale, some studies try to predict the congestion evolutionof large-scale transportation network [10]. Another interestingapplication utilized deep reinforcement learning to control the
timing of traffic signal [11].
III. PATTERN ANALYSIS OF TRAFFIC ACCIDENT
A. Big Traffic Accident Data
In this study, to predict traffic accident risk, the traffic acci-dent records of Beijing in 2016 and 2017 was collected. Eachrecord contains the time, GPS (Global Positioning System)coordinate of the accident event.
B. Data Preprocessing
Before we analyze the pattern of accident, and build ma-chine learning model, a proper data structure is necessary.Therefore, we first preprocess our raw data by discretization.
The traffic accident data was first discretized in space andtime. The temporal resolution was 1 hour for different timehorizon of prediction, and spatial resolution dimension was1000m×1000m in uniform grids.
After discretization, we obtained a matrix S whose elementSr,t is the count of traffic accidents happened within region rand time slot t.
C. Spatial Distribution of Traffic Accident
To explore whether traffic accident frequency is associatedwith the geographical position of a region, we plot the heatmapof traffic accident frequency in Beijing in 2016 (Figure 2). Asshown in Figure 2, the traffic accident frequency is not uniformdistributed, and it is highly related with the geographicalposition of a region. Usually, the highest traffic accident regionlies in the major commercial and business areas.
D. Temporal Pattern of Traffic Accident
To explore the temporal patterns of the traffic accidentfrequency, we first checked whether everyday’s traffic accidentcount varies in different time period. Figure 3 gives the
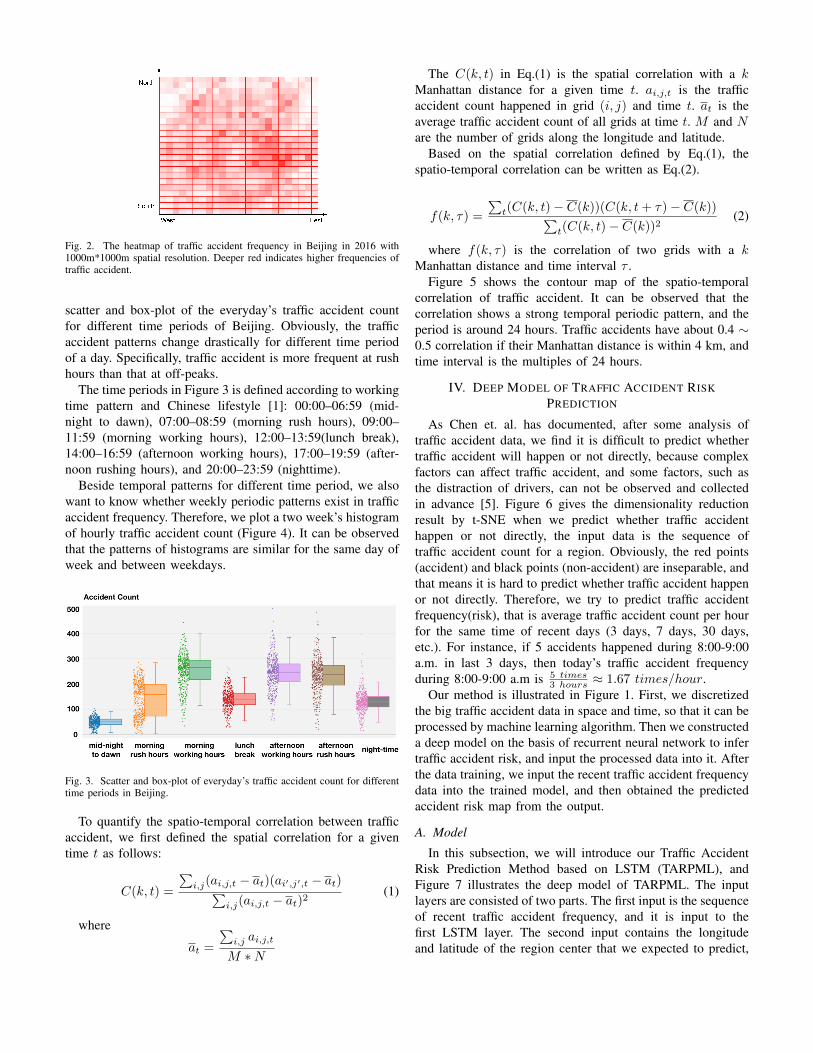
Fig. 2. The heatmap of traffic accident frequency in Beijing in 2016 with1000m*1000m spatial resolution. Deeper red indicates higher frequencies oftraffic accident.
scatter and box-plot of the everyday’s traffic accident countfor different time periods of Beijing. Obviously, the trafficaccident patterns change drastically for different time periodof a day. Specifically, traffic accident is more frequent at rushhours than that at off-peaks.
The time periods in Figure 3 is defined according to workingtime pattern and Chinese lifestyle [1]: 00:00–06:59 (mid-night to dawn), 07:00–08:59 (morning rush hours), 09:00–11:59 (morning working hours), 12:00–13:59(lunch break),14:00–16:59 (afternoon working hours), 17:00–19:59 (after-noon rushing hours), and 20:00–23:59 (nighttime).
Beside temporal patterns for different time period, we alsowant to know whether weekly periodic patterns exist in trafficaccident frequency. Therefore, we plot a two week’s histogramof hourly traffic accident count (Figure 4). It can be observedthat the patterns of histograms are similar for the same day ofweek and between weekdays.
Fig. 3. Scatter and box-plot of everyday’s traffic accident count for differenttime periods in Beijing.
To quantify the spatio-temporal correlation between trafficaccident, we first defined the spatial correlation for a giventime t as follows:
C(k, t) =
∑i,j(ai,j,t − at)(ai′,j′,t − at)∑
i,j(ai,j,t − at)2(1)
where
at =
∑i,j ai,j,t
M ∗N
The C(k, t) in Eq.(1) is the spatial correlation with a kManhattan distance for a given time t. ai,j,t is the trafficaccident count happened in grid (i, j) and time t. at is theaverage traffic accident count of all grids at time t. M and Nare the number of grids along the longitude and latitude.
Based on the spatial correlation defined by Eq.(1), thespatio-temporal correlation can be written as Eq.(2).
f(k, τ) =
∑t(C(k, t)− C(k))(C(k, t+ τ)− C(k))∑
t(C(k, t)− C(k))2(2)
where f(k, τ) is the correlation of two grids with a kManhattan distance and time interval τ .
Figure 5 shows the contour map of the spatio-temporalcorrelation of traffic accident. It can be observed that thecorrelation shows a strong temporal periodic pattern, and theperiod is around 24 hours. Traffic accidents have about 0.4 ∼0.5 correlation if their Manhattan distance is within 4 km, andtime interval is the multiples of 24 hours.
IV. DEEP MODEL OF TRAFFIC ACCIDENT RISKPREDICTION
As Chen et. al. has documented, after some analysis oftraffic accident data, we find it is difficult to predict whethertraffic accident will happen or not directly, because complexfactors can affect traffic accident, and some factors, such asthe distraction of drivers, can not be observed and collectedin advance [5]. Figure 6 gives the dimensionality reductionresult by t-SNE when we predict whether traffic accidenthappen or not directly, the input data is the sequence oftraffic accident count for a region. Obviously, the red points(accident) and black points (non-accident) are inseparable, andthat means it is hard to predict whether traffic accident happenor not directly. Therefore, we try to predict traffic accidentfrequency(risk), that is average traffic accident count per hourfor the same time of recent days (3 days, 7 days, 30 days,etc.). For instance, if 5 accidents happened during 8:00-9:00a.m. in last 3 days, then today’s traffic accident frequencyduring 8:00-9:00 a.m is 5 times
3 hours ≈ 1.67 times/hour.Our method is illustrated in Figure 1. First, we discretized
the big traffic accident data in space and time, so that it can beprocessed by machine learning algorithm. Then we constructeda deep model on the basis of recurrent neural network to infertraffic accident risk, and input the processed data into it. Afterthe data training, we input the recent traffic accident frequencydata into the trained model, and then obtained the predictedaccident risk map from the output.
A. Model
In this subsection, we will introduce our Traffic AccidentRisk Prediction Method based on LSTM (TARPML), andFigure 7 illustrates the deep model of TARPML. The inputlayers are consisted of two parts. The first input is the sequenceof recent traffic accident frequency, and it is input to thefirst LSTM layer. The second input contains the longitudeand latitude of the region center that we expected to predict,
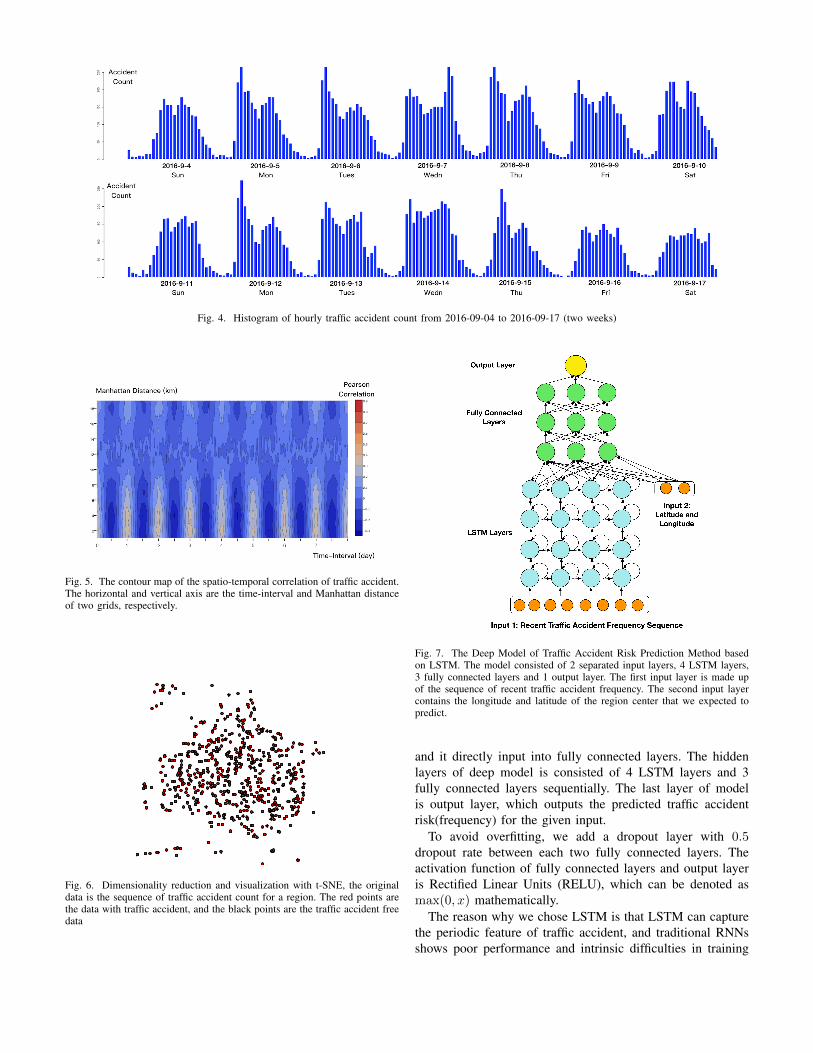
Fig. 4. Histogram of hourly traffic accident count from 2016-09-04 to 2016-09-17 (two weeks)
Fig. 5. The contour map of the spatio-temporal correlation of traffic accident.The horizontal and vertical axis are the time-interval and Manhattan distanceof two grids, respectively.
Fig. 6. Dimensionality reduction and visualization with t-SNE, the originaldata is the sequence of traffic accident count for a region. The red points arethe data with traffic accident, and the black points are the traffic accident freedata
Fig. 7. The Deep Model of Traffic Accident Risk Prediction Method basedon LSTM. The model consisted of 2 separated input layers, 4 LSTM layers,3 fully connected layers and 1 output layer. The first input layer is made upof the sequence of recent traffic accident frequency. The second input layercontains the longitude and latitude of the region center that we expected topredict.
and it directly input into fully connected layers. The hiddenlayers of deep model is consisted of 4 LSTM layers and 3fully connected layers sequentially. The last layer of modelis output layer, which outputs the predicted traffic accidentrisk(frequency) for the given input.
To avoid overfitting, we add a dropout layer with 0.5dropout rate between each two fully connected layers. Theactivation function of fully connected layers and output layeris Rectified Linear Units (RELU), which can be denoted asmax(0, x) mathematically.
The reason why we chose LSTM is that LSTM can capturethe periodic feature of traffic accident, and traditional RNNsshows poor performance and intrinsic difficulties in training
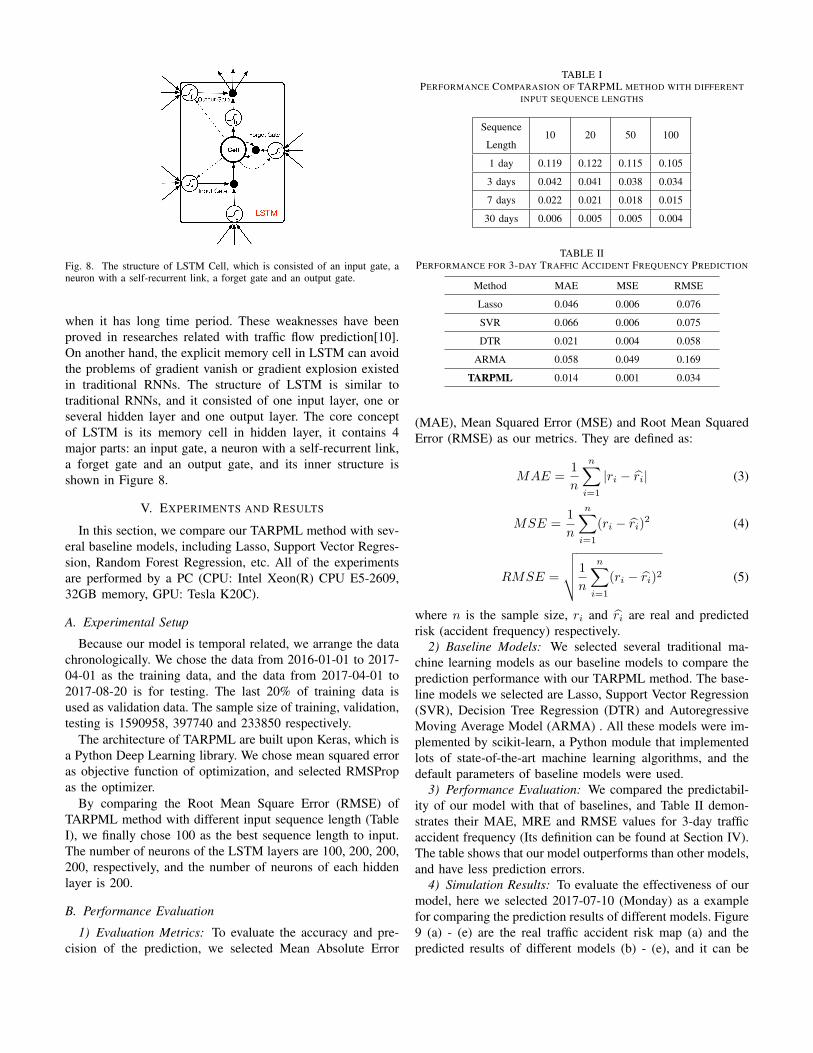
Fig. 8. The structure of LSTM Cell, which is consisted of an input gate, aneuron with a self-recurrent link, a forget gate and an output gate.
when it has long time period. These weaknesses have beenproved in researches related with traffic flow prediction[10].On another hand, the explicit memory cell in LSTM can avoidthe problems of gradient vanish or gradient explosion existedin traditional RNNs. The structure of LSTM is similar totraditional RNNs, and it consisted of one input layer, one orseveral hidden layer and one output layer. The core conceptof LSTM is its memory cell in hidden layer, it contains 4major parts: an input gate, a neuron with a self-recurrent link,a forget gate and an output gate, and its inner structure isshown in Figure 8.
V. EXPERIMENTS AND RESULTS
In this section, we compare our TARPML method with sev-eral baseline models, including Lasso, Support Vector Regres-sion, Random Forest Regression, etc. All of the experimentsare performed by a PC (CPU: Intel Xeon(R) CPU E5-2609,32GB memory, GPU: Tesla K20C).
A. Experimental Setup
Because our model is temporal related, we arrange the datachronologically. We chose the data from 2016-01-01 to 2017-04-01 as the training data, and the data from 2017-04-01 to2017-08-20 is for testing. The last 20% of training data isused as validation data. The sample size of training, validation,testing is 1590958, 397740 and 233850 respectively.
The architecture of TARPML are built upon Keras, which isa Python Deep Learning library. We chose mean squared erroras objective function of optimization, and selected RMSPropas the optimizer.
By comparing the Root Mean Square Error (RMSE) ofTARPML method with different input sequence length (TableI), we finally chose 100 as the best sequence length to input.The number of neurons of the LSTM layers are 100, 200, 200,200, respectively, and the number of neurons of each hiddenlayer is 200.
B. Performance Evaluation
1) Evaluation Metrics: To evaluate the accuracy and pre-cision of the prediction, we selected Mean Absolute Error
TABLE IPERFORMANCE COMPARASION OF TARPML METHOD WITH DIFFERENT
INPUT SEQUENCE LENGTHS
Sequence
Length10 20 50 100
1 day 0.119 0.122 0.115 0.105
3 days 0.042 0.041 0.038 0.034
7 days 0.022 0.021 0.018 0.015
30 days 0.006 0.005 0.005 0.004
TABLE IIPERFORMANCE FOR 3-DAY TRAFFIC ACCIDENT FREQUENCY PREDICTION
Method MAE MSE RMSE
Lasso 0.046 0.006 0.076
SVR 0.066 0.006 0.075
DTR 0.021 0.004 0.058
ARMA 0.058 0.049 0.169
TARPML 0.014 0.001 0.034
(MAE), Mean Squared Error (MSE) and Root Mean SquaredError (RMSE) as our metrics. They are defined as:
MAE =1
n
n∑i=1
|ri − ri| (3)
MSE =1
n
n∑i=1
(ri − ri)2 (4)
RMSE =
√√√√ 1
n
n∑i=1
(ri − ri)2 (5)
where n is the sample size, ri and ri are real and predictedrisk (accident frequency) respectively.
2) Baseline Models: We selected several traditional ma-chine learning models as our baseline models to compare theprediction performance with our TARPML method. The base-line models we selected are Lasso, Support Vector Regression(SVR), Decision Tree Regression (DTR) and AutoregressiveMoving Average Model (ARMA) . All these models were im-plemented by scikit-learn, a Python module that implementedlots of state-of-the-art machine learning algorithms, and thedefault parameters of baseline models were used.
3) Performance Evaluation: We compared the predictabil-ity of our model with that of baselines, and Table II demon-strates their MAE, MRE and RMSE values for 3-day trafficaccident frequency (Its definition can be found at Section IV).The table shows that our model outperforms than other models,and have less prediction errors.
4) Simulation Results: To evaluate the effectiveness of ourmodel, here we selected 2017-07-10 (Monday) as a examplefor comparing the prediction results of different models. Figure9 (a) - (e) are the real traffic accident risk map (a) and thepredicted results of different models (b) - (e), and it can be
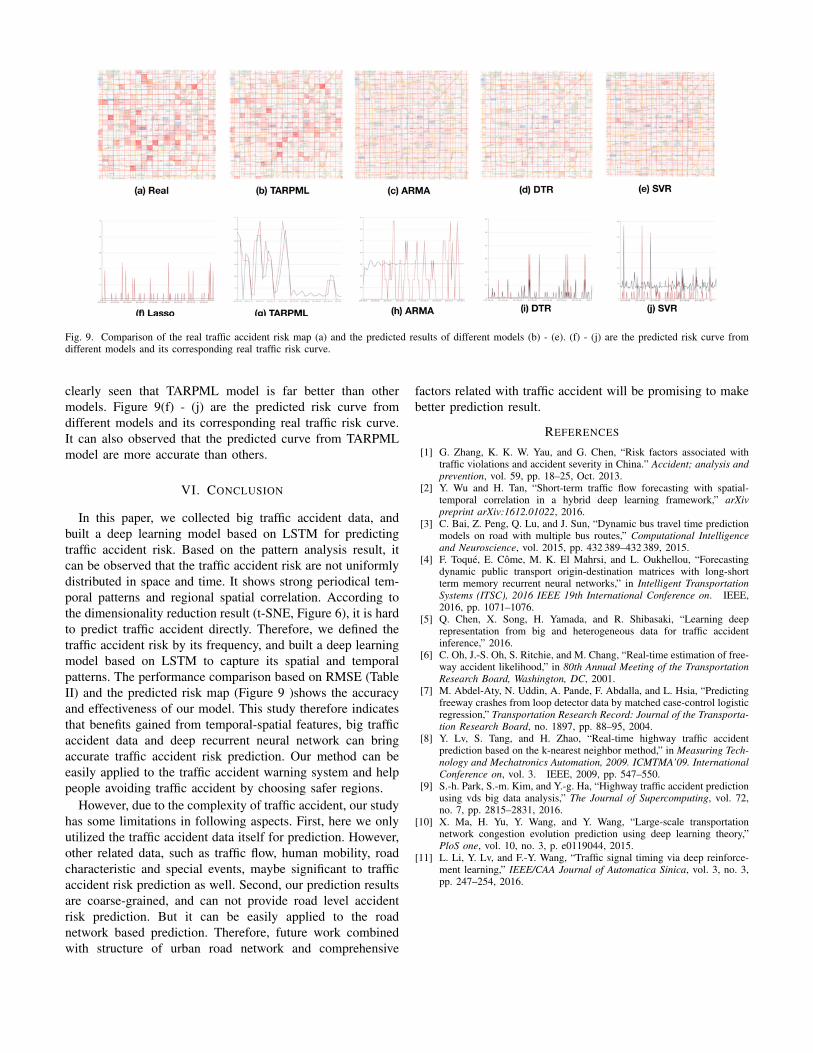
Fig. 9. Comparison of the real traffic accident risk map (a) and the predicted results of different models (b) - (e). (f) - (j) are the predicted risk curve fromdifferent models and its corresponding real traffic risk curve.
clearly seen that TARPML model is far better than othermodels. Figure 9(f) - (j) are the predicted risk curve fromdifferent models and its corresponding real traffic risk curve.It can also observed that the predicted curve from TARPMLmodel are more accurate than others.
VI. CONCLUSION
In this paper, we collected big traffic accident data, andbuilt a deep learning model based on LSTM for predictingtraffic accident risk. Based on the pattern analysis result, itcan be observed that the traffic accident risk are not uniformlydistributed in space and time. It shows strong periodical tem-poral patterns and regional spatial correlation. According tothe dimensionality reduction result (t-SNE, Figure 6), it is hardto predict traffic accident directly. Therefore, we defined thetraffic accident risk by its frequency, and built a deep learningmodel based on LSTM to capture its spatial and temporalpatterns. The performance comparison based on RMSE (TableII) and the predicted risk map (Figure 9 )shows the accuracyand effectiveness of our model. This study therefore indicatesthat benefits gained from temporal-spatial features, big trafficaccident data and deep recurrent neural network can bringaccurate traffic accident risk prediction. Our method can beeasily applied to the traffic accident warning system and helppeople avoiding traffic accident by choosing safer regions.
However, due to the complexity of traffic accident, our studyhas some limitations in following aspects. First, here we onlyutilized the traffic accident data itself for prediction. However,other related data, such as traffic flow, human mobility, roadcharacteristic and special events, maybe significant to trafficaccident risk prediction as well. Second, our prediction resultsare coarse-grained, and can not provide road level accidentrisk prediction. But it can be easily applied to the roadnetwork based prediction. Therefore, future work combinedwith structure of urban road network and comprehensive
factors related with traffic accident will be promising to makebetter prediction result.
REFERENCES
[1] G. Zhang, K. K. W. Yau, and G. Chen, “Risk factors associated withtraffic violations and accident severity in China.” Accident; analysis andprevention, vol. 59, pp. 18–25, Oct. 2013.
[2] Y. Wu and H. Tan, “Short-term traffic flow forecasting with spatial-temporal correlation in a hybrid deep learning framework,” arXivpreprint arXiv:1612.01022, 2016.
[3] C. Bai, Z. Peng, Q. Lu, and J. Sun, “Dynamic bus travel time predictionmodels on road with multiple bus routes,” Computational Intelligenceand Neuroscience, vol. 2015, pp. 432 389–432 389, 2015.
[4] F. Toque, E. Come, M. K. El Mahrsi, and L. Oukhellou, “Forecastingdynamic public transport origin-destination matrices with long-shortterm memory recurrent neural networks,” in Intelligent TransportationSystems (ITSC), 2016 IEEE 19th International Conference on. IEEE,2016, pp. 1071–1076.
[5] Q. Chen, X. Song, H. Yamada, and R. Shibasaki, “Learning deeprepresentation from big and heterogeneous data for traffic accidentinference,” 2016.
[6] C. Oh, J.-S. Oh, S. Ritchie, and M. Chang, “Real-time estimation of free-way accident likelihood,” in 80th Annual Meeting of the TransportationResearch Board, Washington, DC, 2001.
[7] M. Abdel-Aty, N. Uddin, A. Pande, F. Abdalla, and L. Hsia, “Predictingfreeway crashes from loop detector data by matched case-control logisticregression,” Transportation Research Record: Journal of the Transporta-tion Research Board, no. 1897, pp. 88–95, 2004.
[8] Y. Lv, S. Tang, and H. Zhao, “Real-time highway traffic accidentprediction based on the k-nearest neighbor method,” in Measuring Tech-nology and Mechatronics Automation, 2009. ICMTMA’09. InternationalConference on, vol. 3. IEEE, 2009, pp. 547–550.
[9] S.-h. Park, S.-m. Kim, and Y.-g. Ha, “Highway traffic accident predictionusing vds big data analysis,” The Journal of Supercomputing, vol. 72,no. 7, pp. 2815–2831, 2016.
[10] X. Ma, H. Yu, Y. Wang, and Y. Wang, “Large-scale transportationnetwork congestion evolution prediction using deep learning theory,”PloS one, vol. 10, no. 3, p. e0119044, 2015.
[11] L. Li, Y. Lv, and F.-Y. Wang, “Traffic signal timing via deep reinforce-ment learning,” IEEE/CAA Journal of Automatica Sinica, vol. 3, no. 3,pp. 247–254, 2016.


![Citywide Intelligence Hub e-Learning · A^ cWT CchfXST 8]cT[[XVT]RT HdQ Using the Citywide Intelligence Hub Data Profiler Using the Citywide Intelligence Hub Data Correlator Citywide](https://img.pdfslide.us/doc/110x75/5fb9423785d7246345058e12/citywide-intelligence-hub-e-learning-a-cwt-cchfxst-8ctxvtrt-hdq-using-the-citywide.jpg)