Embed Size (px)
Citation preview

A Customer-focused Framework for
Electric System Resilience
ALISON SILVERSTEIN | ALISON SILVERSTEIN CONSULTING
ROB GRAMLICH | GRID STRATEGIES LLC
MICHAEL GOGGIN | GRID STRATEGIES LLC
May 2018

1
Acknowledgments
This report was prepared for the Natural Resources Defense Council (NRDC) and the Environmental
Defense Fund (EDF). All views expressed are those of the authors alone, and any errors are the
responsibility of the authors rather than the sponsors of this research.
The authors appreciate the thoughtful input and critical review from John Moore (NRDC), Michael Panfil
(EDF), Rama Zakaria (EDF), Kim Smaczniak (Earthjustice) and Heather Thompson.
2
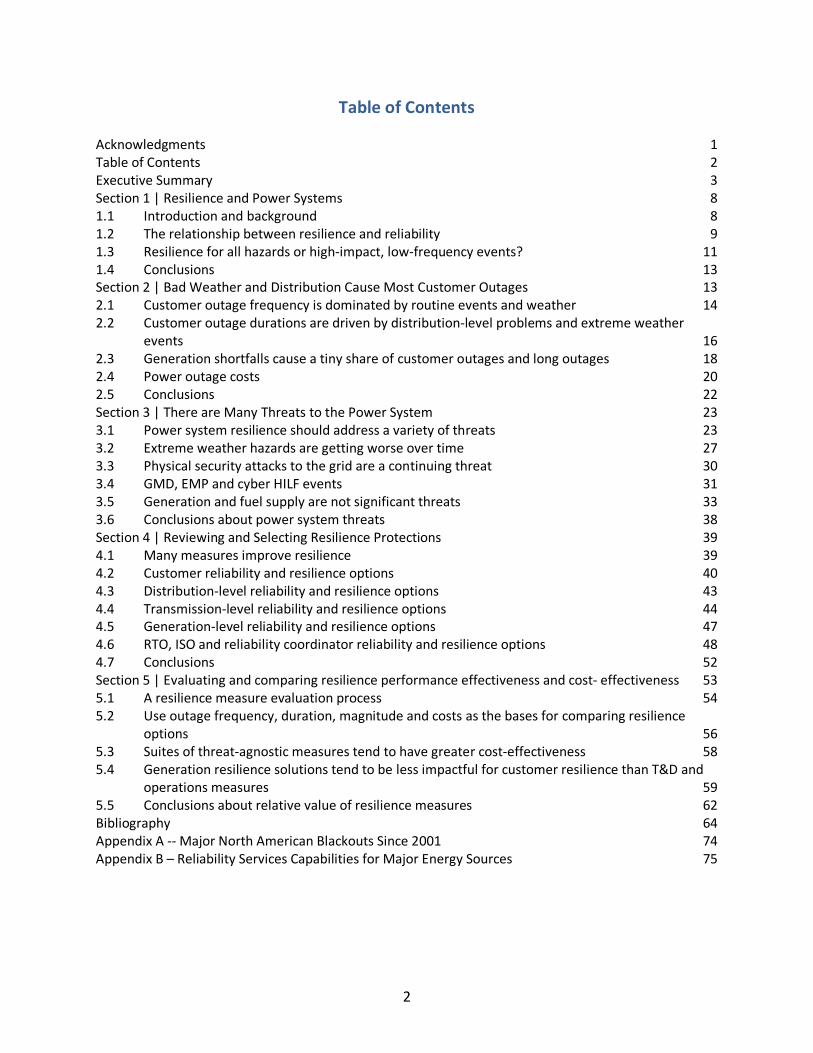
Table of Contents Acknowledgments 1Table of Contents 2Executive Summary 3Section 1 | Resilience and Power Systems 81.1 Introduction and background 81.2 The relationship between resilience and reliability 91.3 Resilience for all hazards or high-impact, low-frequency events? 111.4 Conclusions 13Section 2 | Bad Weather and Distribution Cause Most Customer Outages 132.1 Customer outage frequency is dominated by routine events and weather 142.2 Customer outage durations are driven by distribution-level problems and extreme weather
events 162.3 Generation shortfalls cause a tiny share of customer outages and long outages 182.4 Power outage costs 202.5 Conclusions 22Section 3 | There are Many Threats to the Power System 233.1 Power system resilience should address a variety of threats 233.2 Extreme weather hazards are getting worse over time 273.3 Physical security attacks to the grid are a continuing threat 303.4 GMD, EMP and cyber HILF events 313.5 Generation and fuel supply are not significant threats 333.6 Conclusions about power system threats 38Section 4 | Reviewing and Selecting Resilience Protections 394.1 Many measures improve resilience 394.2 Customer reliability and resilience options 404.3 Distribution-level reliability and resilience options 434.4 Transmission-level reliability and resilience options 444.5 Generation-level reliability and resilience options 474.6 RTO, ISO and reliability coordinator reliability and resilience options 484.7 Conclusions 52Section 5 | Evaluating and comparing resilience performance effectiveness and cost- effectiveness 535.1 A resilience measure evaluation process 545.2 Use outage frequency, duration, magnitude and costs as the bases for comparing resilience
options 565.3 Suites of threat-agnostic measures tend to have greater cost-effectiveness 585.4 Generation resilience solutions tend to be less impactful for customer resilience than T&D and
operations measures 595.5 Conclusions about relative value of resilience measures 62Bibliography 64Appendix A -- Major North American Blackouts Since 2001 74Appendix B – Reliability Services Capabilities for Major Energy Sources 75

3
Executive Summary
Although America’s power grid is very reliable, resilience is in the news for two reasons. Recent
hurricanes, winter storms, and other extreme weather events have violently awoken customers to the
realities of major, extended power outages by damaging transmission and distribution (T&D) assets. At
the same time, concerns over the changing generation fuel mix have led to claims that retirements of
uneconomic coal and nuclear plants threaten grid reliability and resilience.
Customers pay the ultimate price for power outages, whether through their electric bills or their own
personal losses and expenditures. Increasing numbers of bad weather events have led many customers
to expect that more outages will happen. We cannot prevent and mitigate all the hazards and threats
that cause outages, and we can mitigate some but not all of their consequences. So which risks should
we take, what level of resilience and mitigation cost are we willing to bear, and how should we choose
among resilience measures? This paper cannot answer the risk question, but it does offer a path for
assessing and selecting resilience regulatory policy options.
Power system reliability and resilience are deeply intertwined -- reliability covers those long-term and
operational steps that reduce the probability of power interruptions and prevent loss of customer load,
while resilience measures reduce damage from outages and hasten restoration and recovery to shorten
outage durations. Many reliability measures improve resilience and the same utilities and system
operators that are responsible for providing reliability also provide resilience. In practice, bulk power
system actors have been performing both reliability and resilience under the umbrella of “reliability,”
and the Federal Energy Regulatory Commission (FERC) and the North American Electric Reliability
Corporation (NERC) have been regulating both reliability and resilience under that same umbrella.
Although many discussions of reliability and resilience focus on the bulk power system, this study
recommends use of a much broader framework and metrics that are focused on customers’
experiences, rather than the grid alone. In a customer-centric framework, the power system should be
viewed end-to-end, spanning from the customer premises (including customer-sited energy efficiency
and distributed generation and storage) through distribution and transmission up to power generation
and fuel supply. Power system resilience should be measured from the end user’s perspective – how
many outages happen (frequency), the number of customers affected by an outage (scale), and the
length of time before interrupted service can be restored (duration). And since long outages do occur,
we should also consider customer survivability as an important element of resilience preparations.
The power system faces a wide variety of natural hazards and intentional threats. Natural hazards such
as hurricanes and ice storms cause extensive and costly damage to electric distribution and
transmission, causing multi-day outages for large numbers of customers. The number and magnitude of
storm and other major natural hazards have increased significantly over the past fifteen years, so these
are high impact and growing probability threats. The power system can also be harmed by geomagnetic
disturbances (GMD) from solar weather and electromagnetic pulses, and by cyber and physical attack.
Based on historic events, however, the vast majority of outage events arise at the distribution and
transmission levels from weather events. The Rhodium Group finds that the bulk of outage events are
due to routine causes (local storms, vegetation, squirrels, equipment problems), and the Department of
Energy reported that 90% of electric power interruptions arise on the distribution system, mostly
weather-related. But high-impact, low-frequency events such as hurricanes and winter storms cause
about half of customer outage-minutes, as shown in Figure ES-1. At the other end of the probability and
4
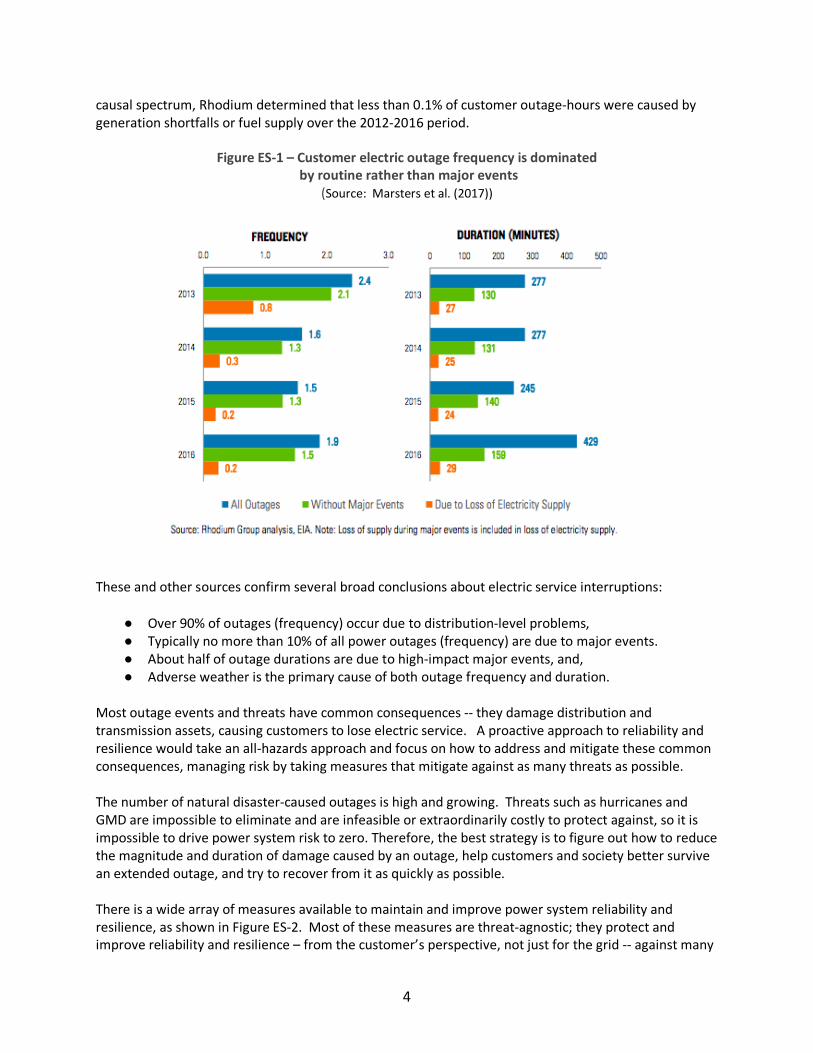
causal spectrum, Rhodium determined that less than 0.1% of customer outage-hours were caused by
generation shortfalls or fuel supply over the 2012-2016 period.
Figure ES-1 – Customer electric outage frequency is dominated
by routine rather than major events
(Source: Marsters et al. (2017))
These and other sources confirm several broad conclusions about electric service interruptions:
● Over 90% of outages (frequency) occur due to distribution-level problems,
● Typically no more than 10% of all power outages (frequency) are due to major events.
● About half of outage durations are due to high-impact major events, and,
● Adverse weather is the primary cause of both outage frequency and duration.
Most outage events and threats have common consequences -- they damage distribution and
transmission assets, causing customers to lose electric service. A proactive approach to reliability and
resilience would take an all-hazards approach and focus on how to address and mitigate these common
consequences, managing risk by taking measures that mitigate against as many threats as possible.
The number of natural disaster-caused outages is high and growing. Threats such as hurricanes and
GMD are impossible to eliminate and are infeasible or extraordinarily costly to protect against, so it is
impossible to drive power system risk to zero. Therefore, the best strategy is to figure out how to reduce
the magnitude and duration of damage caused by an outage, help customers and society better survive
an extended outage, and try to recover from it as quickly as possible.
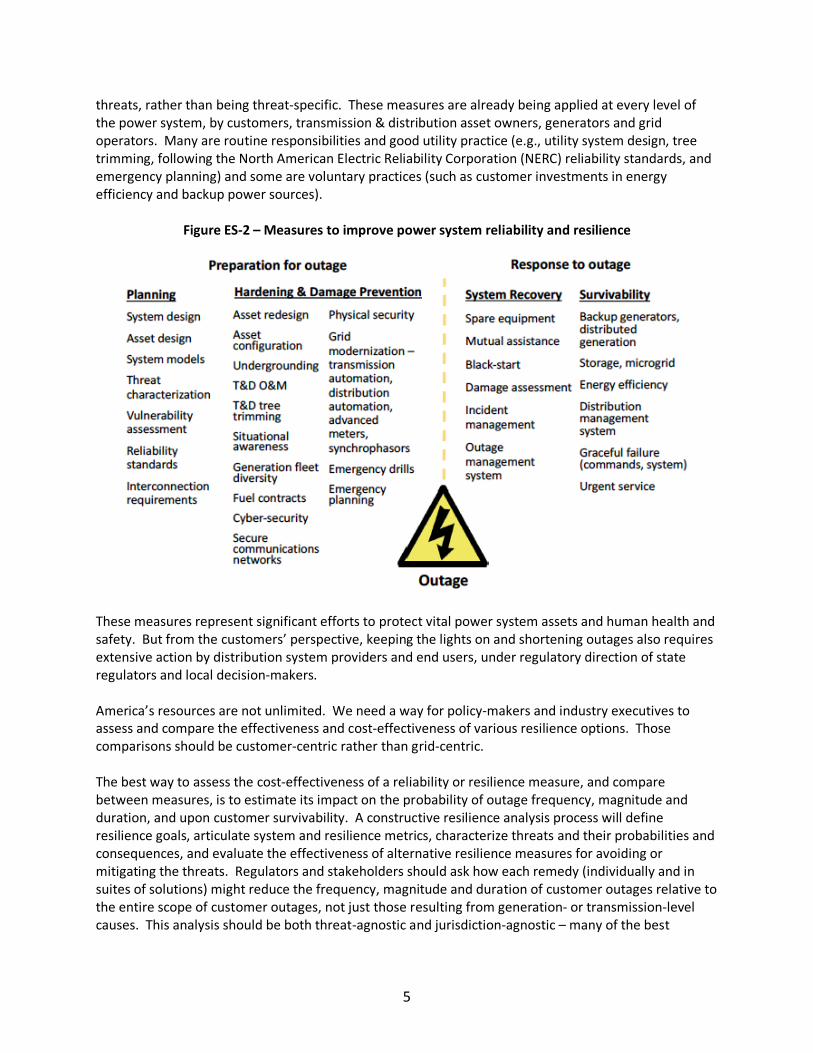
There is a wide array of measures available to maintain and improve power system reliability and
resilience, as shown in Figure ES-2. Most of these measures are threat-agnostic; they protect and
improve reliability and resilience – from the customer’s perspective, not just for the grid -- against many
5
threats, rather than being threat-specific. These measures are already being applied at every level of
the power system, by customers, transmission & distribution asset owners, generators and grid
operators. Many are routine responsibilities and good utility practice (e.g., utility system design, tree
trimming, following the North American Electric Reliability Corporation (NERC) reliability standards, and
emergency planning) and some are voluntary practices (such as customer investments in energy
efficiency and backup power sources).
Figure ES-2 – Measures to improve power system reliability and resilience
These measures represent significant efforts to protect vital power system assets and human health and
safety. But from the customers’ perspective, keeping the lights on and shortening outages also requires
extensive action by distribution system providers and end users, under regulatory direction of state
regulators and local decision-makers.
America’s resources are not unlimited. We need a way for policy-makers and industry executives to
assess and compare the effectiveness and cost-effectiveness of various resilience options. Those
comparisons should be customer-centric rather than grid-centric.
The best way to assess the cost-effectiveness of a reliability or resilience measure, and compare
between measures, is to estimate its impact on the probability of outage frequency, magnitude and
duration, and upon customer survivability. A constructive resilience analysis process will define
resilience goals, articulate system and resilience metrics, characterize threats and their probabilities and
consequences, and evaluate the effectiveness of alternative resilience measures for avoiding or
mitigating the threats. Regulators and stakeholders should ask how each remedy (individually and in
suites of solutions) might reduce the frequency, magnitude and duration of customer outages relative to
the entire scope of customer outages, not just those resulting from generation- or transmission-level
causes. This analysis should be both threat-agnostic and jurisdiction-agnostic – many of the best
6
solutions to maintain and enhance resilience lie beyond the limits of the bulk power system and federal
jurisdiction.1
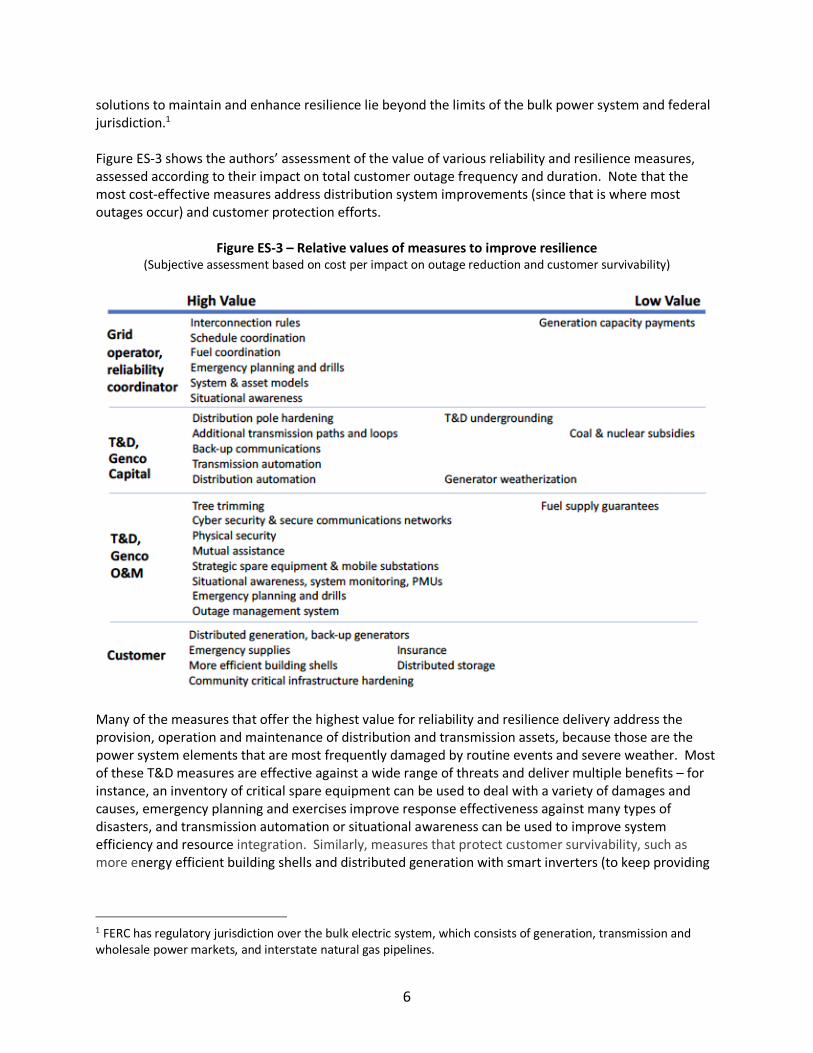
Figure ES-3 shows the authors’ assessment of the value of various reliability and resilience measures,
assessed according to their impact on total customer outage frequency and duration. Note that the
most cost-effective measures address distribution system improvements (since that is where most
outages occur) and customer protection efforts.
Figure ES-3 – Relative values of measures to improve resilience (Subjective assessment based on cost per impact on outage reduction and customer survivability)
Many of the measures that offer the highest value for reliability and resilience delivery address the
provision, operation and maintenance of distribution and transmission assets, because those are the
power system elements that are most frequently damaged by routine events and severe weather. Most
of these T&D measures are effective against a wide range of threats and deliver multiple benefits – for
instance, an inventory of critical spare equipment can be used to deal with a variety of damages and
causes, emergency planning and exercises improve response effectiveness against many types of
disasters, and transmission automation or situational awareness can be used to improve system
efficiency and resource integration. Similarly, measures that protect customer survivability, such as
more energy efficient building shells and distributed generation with smart inverters (to keep providing
1 FERC has regulatory jurisdiction over the bulk electric system, which consists of generation, transmission and
wholesale power markets, and interstate natural gas pipelines.

7
energy to the host after the surrounding grid is out of service), help customers under many adverse
threats and offer multiple benefits (such as customer bill savings and comfort).
Generation and fuel supply shortages rarely cause customer outages, and when they do it is almost
always due to an extreme weather event or operational failure that may also affect T&D assets. No
single unit or type of generation is critical or resilient in itself. Grid operators have always relied on a
portfolio of resources performing diverse roles to meet the range of reliability services needed; over the
past decade, those portfolios have expanded to include distributed resources such as demand response
and distributed generation. Many alternate portfolios of supply- and demand-side resources can
provide reliable power delivery.
To ensure that electricity markets operate efficiently and support reliability, reliability services should be
defined in functional, technology-neutral terms based on actual system needs, rather than in terms of
the characteristics or attributes of resources that historically provided those services.
The combination of a generation fleet and robust transmission system, with customer-side demand
response and distributed generation assets, generally offsets the outage risk from losing individual
plants or fuel sources. Because the marginal benefit for customers of protecting generation is quite low
(particularly when reserve margins are high), generation-related solutions are generally not the most
cost-effective means of reducing customer outages on power systems today. There is no evident need
to compensate generators or other assets for bulk power system resilience beyond the engineering-
based reliability services already being procured.
The authors encourage others to undertake the data collection and analysis required to assess reliability
and resilience measures at all power system levels using the customer-centric analytical approach
described above. Since most outages occur due to problems at the distribution level and long-duration
outages are caused primarily by severe weather events, it logically follows that measures that
strengthen distribution and hasten recovery would be highly cost-effective. In contrast, measures to
make generation more resilient are likely to have little impact on outage frequency, duration or
magnitude or on customer survivability.
Federal and state regulators do not coordinate the financial obligations they place upon the electric
providers and actors which they regulate. Electric utilities and customers must deal with the
consequences and costs of rules and decisions intended to foster reliability and resilience, including
well-intended policies that crowd out or preclude more useful and impactful investments and actions.
There is a great risk that if regulators and stakeholders do not conduct the type of analyses suggested
here to inform and coordinate resilience investments, we will end up committing significant amounts of
money and effort to improve resilience, yet have little constructive impact on the probabilities or actual
levels of future customer outages.
8
Section 1 | Resilience and Power Systems
1.1 Introduction and background
New conversations about power system resilience, whether it is different from reliability, and how it
should be measured and delivered, began on April 14, 2017 with the issuance of a memo from
Department of Energy (DOE) Secretary Rick Perry.2 That memo directed DOE staff to conduct a study on
the reasons why “baseload power plants” were retiring across America, and what impact these
retirements would have on grid resilience, reliability and affordability. His memo also asked whether
electric power markets are adequately compensating the attributes that strengthen grid resilience.
In response, on August 24, 2017 DOE released the “Staff Report to the Secretary on Electric Markets and
Reliability.”3 That report found that while cumulative power plant retirements have been significant,
the bulk power system remains reliable. But the study pointed to recent severe weather events and the
range of highly disruptive, low-probability events as demonstrating the need to improve system
resilience. Due to the framing of the Secretary’s memo, the Study defined resilience principally in the
context of generation resources, with particular attention to fuel diversity and “fuel assurance.”
On September 28, 2017, Secretary Perry sent the Federal Energy Regulatory Commission (FERC) the
proposed “Grid Resiliency Pricing Rule,”4 which proposed that FERC create mechanisms to provide
mechanisms for merchant coal and nuclear plants to recover their “fully allocated costs” in
“Commission-approved independent system operators or regional transmission organizations with
energy and capacity markets.” The cover letter explained that, “the resiliency of the electric grid is
threatened by the premature retirements of … fuel-secure traditional baseload resources,”5 and this
profit guarantee mechanism is necessary to protect people from the threat of energy outages resulting
from the loss of such capacity. The letter further asserted that organized power markets have under-
valued grid reliability and resilience attributes and should be modified accordingly.
On January 8, 2018, FERC issued an Order unanimously denying DOE’s proposed rule.6 FERC found “the
extensive comments submitted by the RTOs/ISOs do not point to any past or planned generator
retirements that may be a threat to grid resilience.”7 FERC thanked the Secretary for reinforcing, “the
resilience of the bulk power system as an important issue that warrants further attention,”8 and opened
a docket for the present inquiry.9
2 DOE Secretary Perry (2017a). 3 DOE (2017b). 4 DOE (2017c). 5 DOE Secretary Perry (2017b). 6 FERC (2018), Order 162 FERC ¶61,012. 7 FERC (2018), paragraph 15. 8 Ibid., paragraph 1. 9 FERC Docket No. AD18-7-000.
9
1.2 The relationship between resilience and reliability FERC’s Order offers an “understanding” of resilience to mean, “[t]he ability to withstand and reduce the
magnitude and/or duration of disruptive events, which includes the capability to anticipate, absorb,
adapt to, and/or rapidly recover from such an event.”10 The Order recognizes that resilience:
… could encompass a range of attributes, characteristics, and services that allow the grid to withstand, adapt to, and recover from both naturally occurring and man-made disruptive events. At the most basic level, ensuring resilience requires that we both (1) determine which risks to the grid we are going to protect against, and (2) identify the steps, if any, needed to ensure those risks are addressed.11
FERC’s Order notes that it has taken many actions over the years to address reliability and other issues
to ensure the uninterrupted supply of electricity in the face of fuel disruptions or extreme weather
threats,” and other high-impact threats such as cyber-security, physical security and geomagnetic
disturbances.12 FERC’s Order and proposed definition raises the question of how resilience relates to
reliability and whether it is a subset of reliability or a different yet related issue. Commissioner LaFleur’s
concurrence observes, “[i]n my view, resilience -- the ability to withstand or recover from disruptive
events and keep serving customers – is unquestionably an element of reliability.”13 In other words,
FERC’s authority over reliability appears to cover resilience on the bulk power system.
Commissioner LaFleur is correct. NERC has defined reliability to include post-outage recovery and
restoration as well as outage avoidance.14 NERC defines reliability as the ability of the electric system to
supply power at all times and withstand sudden disturbances15 – as so defined, reliability activities are
those that attempt to prevent a grid outage. In contrast, FERC’s definition of resilience acknowledges
10 FERC (2018), paragraph 23. 11 Ibid., paragraph 24. 12 Ibid., paragraph 12. 13 FERC (2018) LaFleur Concurrence, p.1. FERC has authorized jurisdiction over reliability by the Federal Power Act
(16 U.S. Code, Chapter 12, Subchapter II, §824o), which defines the term, “reliable operation,” to mean, “operating
the elements of the bulk power system within equipment and electric system thermal, voltage, and stability limits
so that instability, uncontrolled separation, or cascading failures of such system will not occur as a result of a
sudden disturbance, including a cybersecurity incident, or unanticipated failure of system elements.” 14 NERC (2013b). 15 NERC broadly defines a reliable bulk power system as “one that is able to meet the electricity needs of end-use
customers even when unexpected equipment failures or other factors reduce the amount of available electricity.”
It divides reliability between resource adequacy (“having sufficient resources to provide customers with a
continuous supply of electricity at the proper voltage and frequency, virtually all the time,” recognizing scheduled
and reasonably expected unscheduled outages of equipment) and security or operating reliability (the ability of the
bulk power system to withstand sudden disturbances to system stability and the unanticipated loss of system
elements due to natural causes and physical or cyber-attacks). (NERC (2013a) and NERC letter (2017)).
Both the long- and short-term meanings of reliability, traditionally divided between system planning and
system operating timescales respectively, have become complicated because the nature of both supply and
demand have changed – now that electric demand is manageable rather than fixed (because customers can use
demand response and distributed generation to alter demand in real time), supply-side resources on the bulk
power system are no longer the only way to meet customer demand and “resource adequacy” takes on new
meaning.
10
that its aim is reducing the damage from, surviving and recovering from disruptive events on the grid –
i.e., resilience aims to make outages less probable, severe, long and damaging.16
Functionally speaking, most reliability and resilience activities are performed by the same entities (T&D
owners and grid operators). Resilience and reliability have common elements including system
planning, maintaining real-time operational security to prevent system disturbances, threat
identification, and risk management. Many bulk power reliability measures can reduce the consequence
as well as probability of outages and therefore reduce the need for executing recovery and survival
measures afterwards. In practice, therefore, bulk power system actors have been performing both
reliability and resilience under the umbrella of “reliability,” and FERC and NERC have been regulating
both reliability and resilience under that same umbrella.
Reducing the frequency, duration and impact of outages for end-use customers also requires extensive
action by distribution system providers and end-users, and implicates decisions jurisdictional to state
regulators as well as FERC.
Table 1 shows many of the internal and external threats that cause power system outages. Most of the
events that cause outages have the same ultimate effects to the power system – they damage power
system equipment and cut off service to some customers. The difference in impact is often a matter of
scale -- how many pieces of equipment are damaged, whether it harms distribution, transmission and/or
generation, over how large a scale, affecting how many customers, and for how long. Because so many
of these threats have common consequences, sound reliability and resilience management requires
planning and acting on an all-hazards basis, managing risk by taking measures that mitigate against as
many threats as possible.
16 The National Academy of Sciences study, Enhancing the Resilience of the Nation’s Electricity System, finds that,
“Resilience is not the same as reliability. While minimizing the likelihood of large-area, long-duration outages is
important, a resilient system is one that acknowledges that such outages can occur, prepares to deal with them,
minimizes their impact when they occur, is able to restore service quickly, and draws lessons from the experience
to improve performance in the future.” (NAS (2017), p. 10).

11
Table 1 – Threats, hazards and vulnerabilities of the electric infrastructure
(Source: Argonne National Laboratory (2016), Table E.1, p. xiv)
1.3 Resilience for all hazards or high-impact, low-frequency events?
Most of the Independent System Operators’ (ISOs) and Regional Organizations’ (RTOs) submissions in
the FERC Resilience Docket (AD18-7) interpret the resilience threat from “disruptive events” as arising
from high-impact, low-frequency (HILF) events such as earthquakes, attack, extreme weather or
geomagnetic disturbances. HILF outages are significant events: Hurricane Sandy knocked out power to
8.5 million customers in all 2012;17 Hurricane Matthew caused 2.5 million customers to lose power in
October 2016;18 and the January 2016 snow and ice storm affected 14 states and over a million
customers lost power.19 Most major disruptive events such as hurricanes, ice storms and floods cause
extensive damage to distribution facilities as well as transmission and generation assets.
RTOs and ISOs focus on HILF events because such events can damage the bulk power system, and cause
very large outages by harming distribution as well as transmission (and some generation) assets. But
this focus obscures the fact that grid operators and asset owners are already taking many steps to
ensure resilience against all hazards, addressing both routine and extreme events. Their actions to
protect against routine problems such as equipment mis-operations, lightning strikes and routine tree
contacts improve the grid’s resilience against extreme events.
Consistent with Commissioner LaFleur’s view that resilience is an element of reliability, grid operators
manage the grid with the reliability goal of “keeping the lights on” and view resilience as part of their
17 DOE EIA (2012). 18 DOE EIA (2016c). 19 DOE EIA (2016a).
12
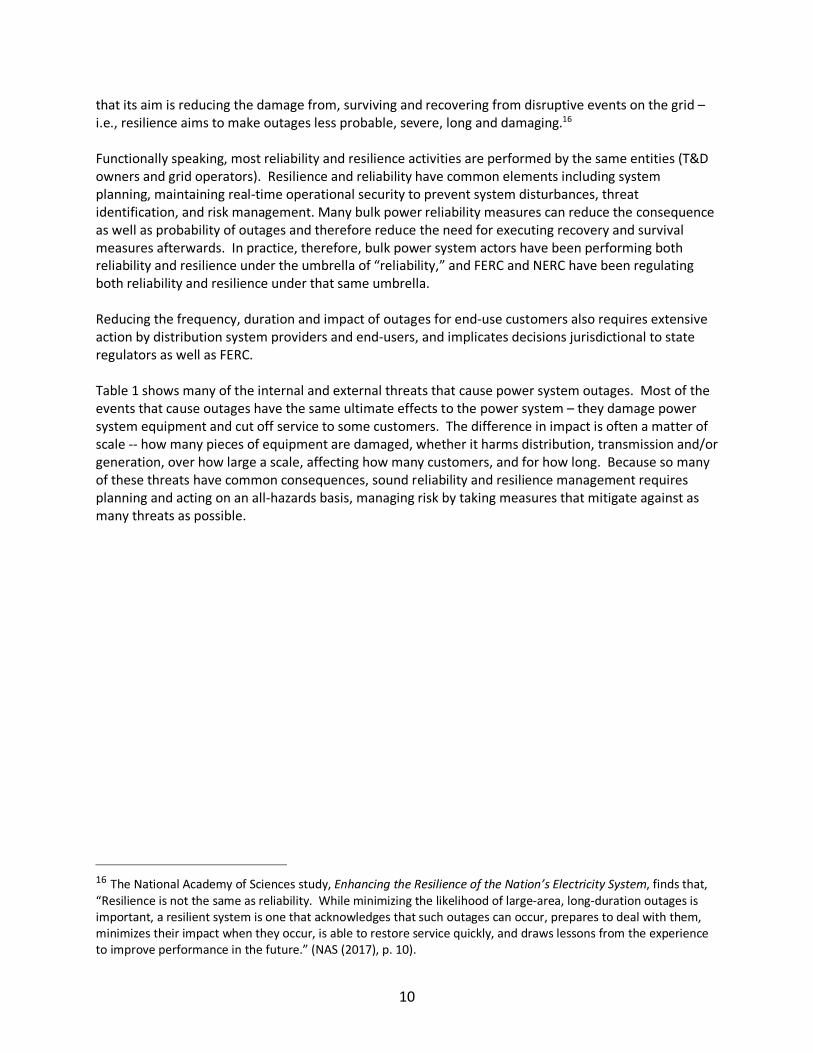
existing responsibility.20 These efforts work -- measures undertaken in the name of reliability actively
improve resilience, as shown in Figure 1. Reliability measures such as reserve margin requirements,
system planning and modeling requirements, and regional coordination and scheduling, also enhance
resilience by helping to absorb and adapt to a sudden disturbance on the grid and thereby reduce the
probability and magnitude of an outage. NERC has catalogued how its reliability requirements and other
activities address resilience, explaining that its mandatory standards make the system robust against a
range of threats and require operators to plan to respond to events, while other activities provide the
coordination and situational awareness to recover from events.21 For example, voltage and frequency
disturbance ride-through requirements reduce vulnerability to a number of operational threats, while
system restoration plans and black-start capability are key elements of system restoration.
Figure 1 – Measures to address reliability and resilience
Note that the reliability and resilience measures listed above are threat-agnostic – each addresses a
practice or solution that strengthens the power system against a variety of threats and failure modes,
rather than trying to address and prevent against a single, specific threat. A well-chosen suite of multi-
hazard, multi-benefit measures makes it less necessary to assume that every threat will occur, and less
necessary to design specific measures to protect against every individual threat or risk. It also
recognizes the reality that we cannot eliminate every risk nor ensure that the grid can operate through
any risk -- some threats are impossible to avoid (such as hurricanes), or too costly to mitigate (such as a
near-by replacement unit for every unique high-voltage transformer).
20 See, for instance, ERCOT & PUCT (2018), p. 2, filed in FERC AD18-7. Also, NERC’s definition of “Adequate Level
of Reliability” includes both avoidance of those grid events that could cause a blackout or grid collapse and
restoration of the bulk power system after widespread outages. (NERC (2013b), p. 2) 21 NERC (2018a), pages 58-65.

13
1.4 Conclusions
Power system reliability and resilience are closely interrelated. Reliability principally aims to do those
things that prevent uncontrolled loss of customer load, while resilience aims to reduce the probability of
power interruptions, reduce damage from outages, and hasten restoration and recovery to shorten
outage durations. FERC’s authority over reliability includes resilience of the bulk power system. But
from the customers’ perspective, keeping the lights on and shortening outages also requires extensive
action by distribution system providers and end users, under the regulatory direction of state regulators
and local decision-makers.
The power system spans the functional stretch from customer premises (including customer-sited
energy efficiency and distributed generation and storage) through distribution and transmission up to
power generation and fuel supply. That system faces many threats. Most of these threats have
common consequences – damage to distribution and transmission, causing customers to lose electric
service – so sound reliability and resilience management requires planning and acting on an all-hazards
basis, managing risk by taking measures that mitigate against as many threats as possible.
From a customer-centric perspective, the most cost-effective measures to advance reliability and
resilience are those that are effective against multiple threats and offer multiple benefits in addition to
their merits for reliability and resilience. Such high-value measures include those that reduce
distribution-level outages (e.g., tree-trimming and distribution automation systems), improve outage
recoverability (e.g., emergency management drills, outage management systems, critical spares and
mutual assistance programs), and improve customer survivability (e.g., energy efficient building shells,
emergency supplies and distributed generation and storage with smart inverters).
Section 2 | Bad Weather and Distribution Cause Most Customer Outages
We do not build electric generation or transmission for their own sakes. Every element of the end-to-
end power system -- generation, fuel transportation systems, transmission, distribution, distributed
generation and storage, end use devices and energy efficiency measures – exists to provide energy
services for end-use customers. For that reason, power system resilience should be measured from the
end user’s perspective – how many outages happen (frequency), the number of customers affected by
an outage (scale), and the length of time before interrupted service can be restored (duration).
This section reviews the causes and consequences of customer outages across the entire power system -
- not just on the bulk power system -- and then looks at the cost of those outages to customers and
society. This examination shows that the vast majority of outages across the power system are caused
by weather events rather than generation-level failures (including fuel supply failures). Furthermore,
most outages caused by natural events harm electric T&D assets in common ways, leading to the
conclusion that the most practical way to improve resilience and reliability is to address T&D and grid
operations rather than generation and fuel issues.
14
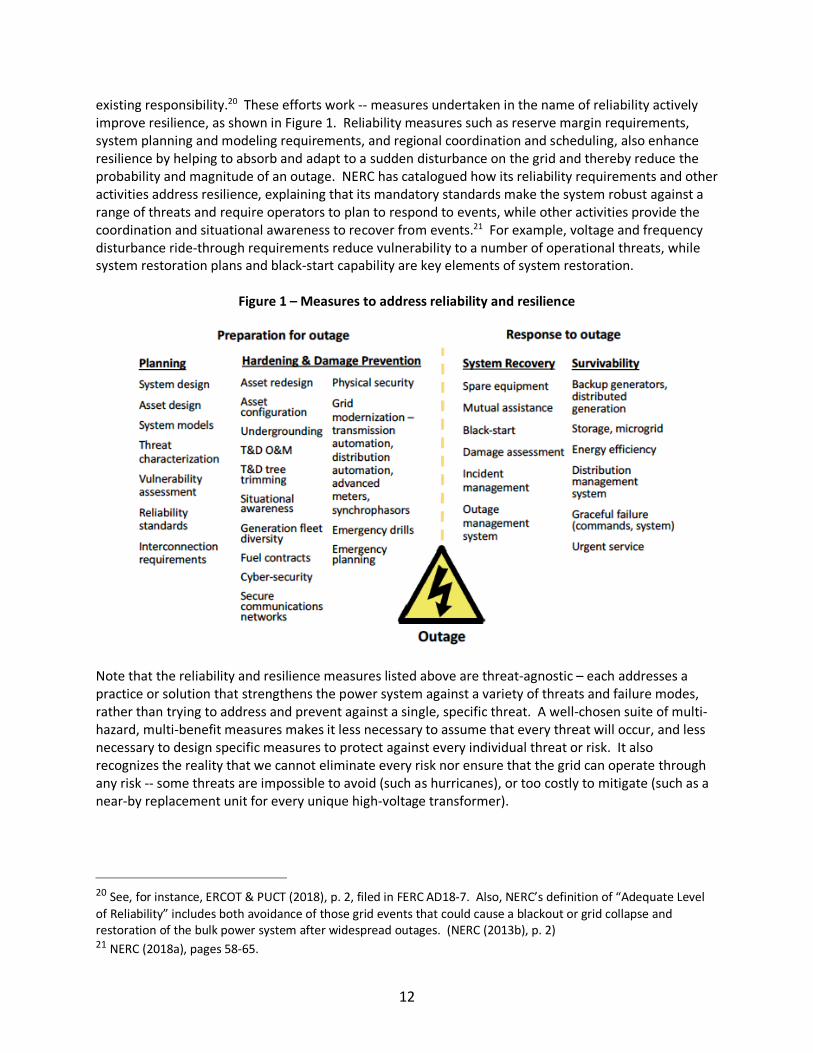
2.1 Customer outage frequency is dominated by routine events and weather
Many analyses have established that the bulk of power service interruptions arise from routine causes
at the distribution level, rather than from major events. This is illustrated in Figure 2, in which the
Rhodium Group uses utility-submitted data22 to count the average number of customer outages and
duration for the period 2013-2016. It shows that the bulk of customer outage events occur from routine
causes (shown as the green bars, due to such causes as squirrels on distribution lines, distribution
operations, and normal weather events such as local storms knocking tree limbs into lines) rather than
major events (such as hurricanes, floods or earthquakes). In contrast to outage frequency, in most years
about half of actual average customer outage minutes (outage duration) are due to routine events, and
half to major events.23
Figure 2 – U.S. average customer electric outage frequency
is dominated by routine rather than major events
(Source: Marsters et al. (2017))
22 This Rhodium analysis (Marsters et al. (2017)) draws on utility data submitted through the Energy Information
Administration (EIA) Form 861. Most other outage analyses rely on data on the cause, duration and magnitude
(customer count and MW) submitted by utilities using Form OE-417. Utility reporting criteria appear to be
inconsistent; and analyses such as those discussed here vary. Therefore, the reader should view the outage
information discussed here as ballpark estimates, rather than as precise statements about outage frequency and
duration. 23 DOE’s EIA forms define a major disturbance or event as one that causes the loss of electric service to more than
50,000 customers for one hour or more. DOE does not offer clear definitions or distinctions for “severe weather
(thunderstorms, ice storms, etc.),” or “natural disasters (hurricanes, floods, tornadoes, solar activity, etc.)”.
Utilities are supposed to report outages that last longer than 5 minutes. EIA reports that, “utilities … that reported
their outage information to EIA collectively made up only 34% of all utilities but accounted for about 91% of
electricity sales,” (EIA (2018)), which means that additional small outages occurred that are not counted in these
data.
15
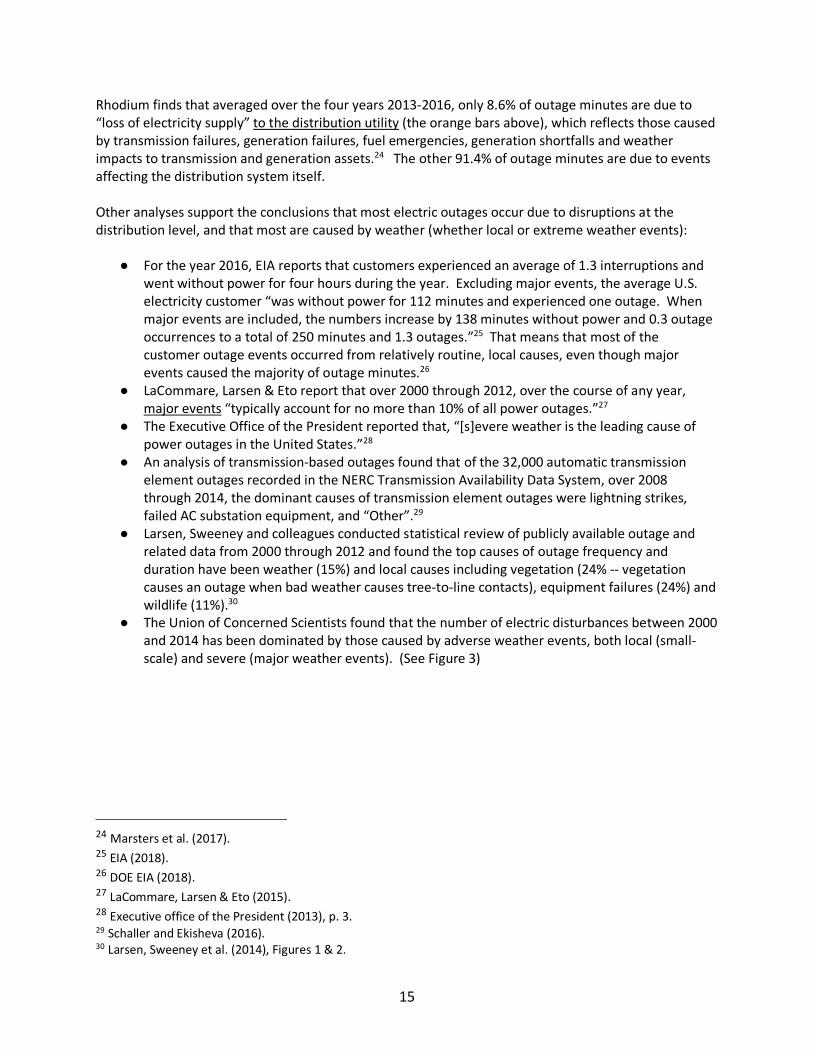
Rhodium finds that averaged over the four years 2013-2016, only 8.6% of outage minutes are due to
“loss of electricity supply” to the distribution utility (the orange bars above), which reflects those caused
by transmission failures, generation failures, fuel emergencies, generation shortfalls and weather
impacts to transmission and generation assets.24 The other 91.4% of outage minutes are due to events
affecting the distribution system itself.
Other analyses support the conclusions that most electric outages occur due to disruptions at the
distribution level, and that most are caused by weather (whether local or extreme weather events):
● For the year 2016, EIA reports that customers experienced an average of 1.3 interruptions and
went without power for four hours during the year. Excluding major events, the average U.S.
electricity customer “was without power for 112 minutes and experienced one outage. When
major events are included, the numbers increase by 138 minutes without power and 0.3 outage
occurrences to a total of 250 minutes and 1.3 outages.”25 That means that most of the
customer outage events occurred from relatively routine, local causes, even though major
events caused the majority of outage minutes.26
● LaCommare, Larsen & Eto report that over 2000 through 2012, over the course of any year,
major events “typically account for no more than 10% of all power outages.”27
● The Executive Office of the President reported that, “[s]evere weather is the leading cause of
power outages in the United States.”28
● An analysis of transmission-based outages found that of the 32,000 automatic transmission
element outages recorded in the NERC Transmission Availability Data System, over 2008
through 2014, the dominant causes of transmission element outages were lightning strikes,
failed AC substation equipment, and “Other”.29
● Larsen, Sweeney and colleagues conducted statistical review of publicly available outage and
related data from 2000 through 2012 and found the top causes of outage frequency and
duration have been weather (15%) and local causes including vegetation (24% -- vegetation
causes an outage when bad weather causes tree-to-line contacts), equipment failures (24%) and
wildlife (11%).30
● The Union of Concerned Scientists found that the number of electric disturbances between 2000
and 2014 has been dominated by those caused by adverse weather events, both local (small-
scale) and severe (major weather events). (See Figure 3)
24 Marsters et al. (2017). 25 EIA (2018). 26 DOE EIA (2018). 27 LaCommare, Larsen & Eto (2015). 28 Executive office of the President (2013), p. 3. 29 Schaller and Ekisheva (2016). 30 Larsen, Sweeney et al. (2014), Figures 1 & 2.

16
Figure 3 – Reported electric disturbance events are dominated by weather causes
(Source: Union of Concerned Scientists (2015))
2.2 Customer outage durations are driven by distribution-level problems and extreme
weather events
Short outages are irritating and inconvenient, but longer outages impose much greater costs and
hazards for customers and society as a whole.31 The U.S. Department of Energy’s Quadrennial Energy
Review32 (QER) reports that the average U.S. power customer experienced 198 minutes of “electric
power unavailability” in 2016. DOE reports that these outages:
… disproportionately stem from disruptions on the distribution system (over) 90 percent of electric power interruptions), both in terms of the duration and frequency of outages, which are largely due to weather-related events. Damage to the transmission system, while infrequent, can result in more widespread major power outages that affect large numbers of customers with significant economic consequences.33
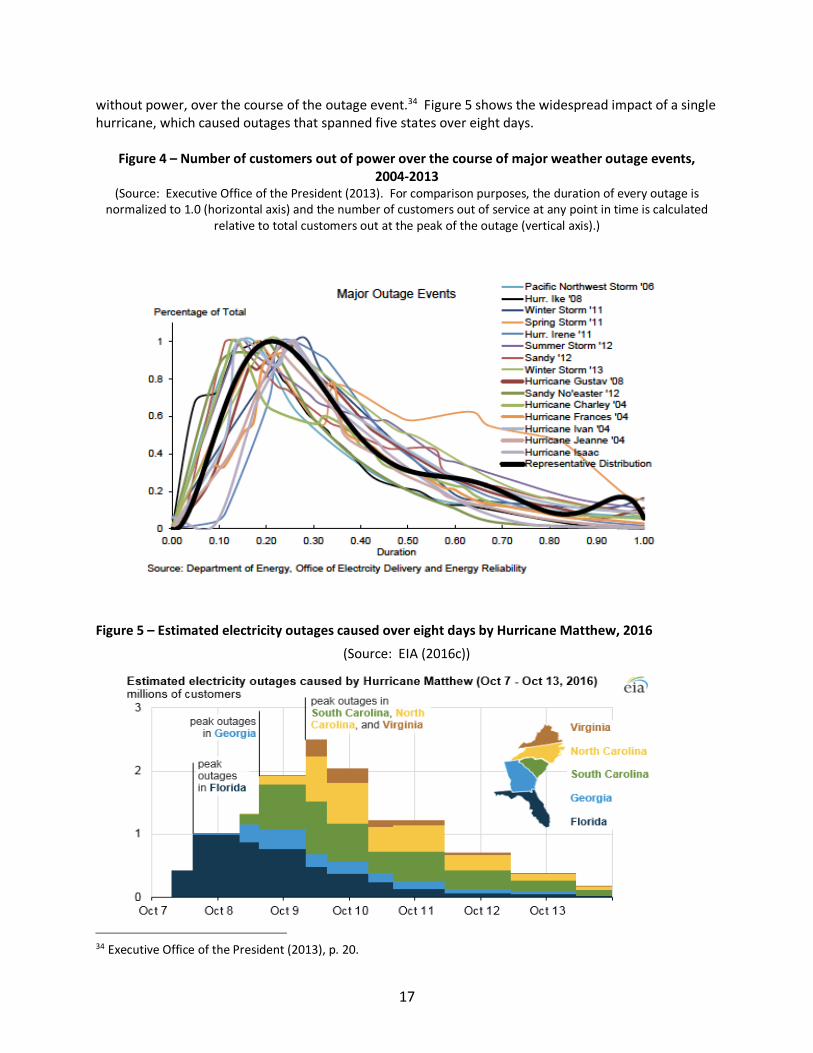
Reinforcing the impact of extreme weather events on outage duration, Figure 4 shows the distributions
of customers without power over time for fifteen major storms occurring between 2004 and 2013, in
terms of the fraction of customers without power as a percentage of the peak number of customers
31 When the common service quality metrics of SAIFI (System Average Interruption Frequency Index) and SAIDI
(System Average Interruption Duration Index) are calculated, major outage events dominate the SAIDI calculation
because the high number of customers out for a lengthy time period swamps the number of outage-minutes for
small groups of customers out of service for brief periods from numerous small outages. But because long outages
are much more socially and economically costly than short outages, small increases in SAIFI and SAIFI averages
mask the grave importance and cost of major events. 32 U.S. DOE QER (2017a), p. 4-5. Other than the timing difference between development of these QER outage
estimates in 2017 and the EIA estimate cited earlier (published in 2018), the authors are not aware of the reasons
why these two DOE average outage duration estimates differ by over an hour. More broadly, this points to the
challenge of finding consistent data and analytical methods for understanding U.S. customer outages. 33 DOE QER (2017a), p. 4-5.
17
without power, over the course of the outage event.34 Figure 5 shows the widespread impact of a single
hurricane, which caused outages that spanned five states over eight days.
Figure 4 – Number of customers out of power over the course of major weather outage events,
2004-2013 (Source: Executive Office of the President (2013). For comparison purposes, the duration of every outage is
normalized to 1.0 (horizontal axis) and the number of customers out of service at any point in time is calculated
relative to total customers out at the peak of the outage (vertical axis).)
Figure 5 – Estimated electricity outages caused over eight days by Hurricane Matthew, 2016
(Source: EIA (2016c))
34 Executive Office of the President (2013), p. 20.
18
Analysis drawing from earlier Lawrence Berkeley National Laboratory (LBNL) work on distribution system
outages35 found that distribution system failures account for more than 100 times more customer
outage hours than generation shortfalls. That analysis concluded, “[d]istribution system outages appear
to impose roughly two orders of magnitude more minutes of outage on customers than does resource
adequacy under the 1-in-10 criterion — i.e., 146 compared to 1.2 minutes a year.”36
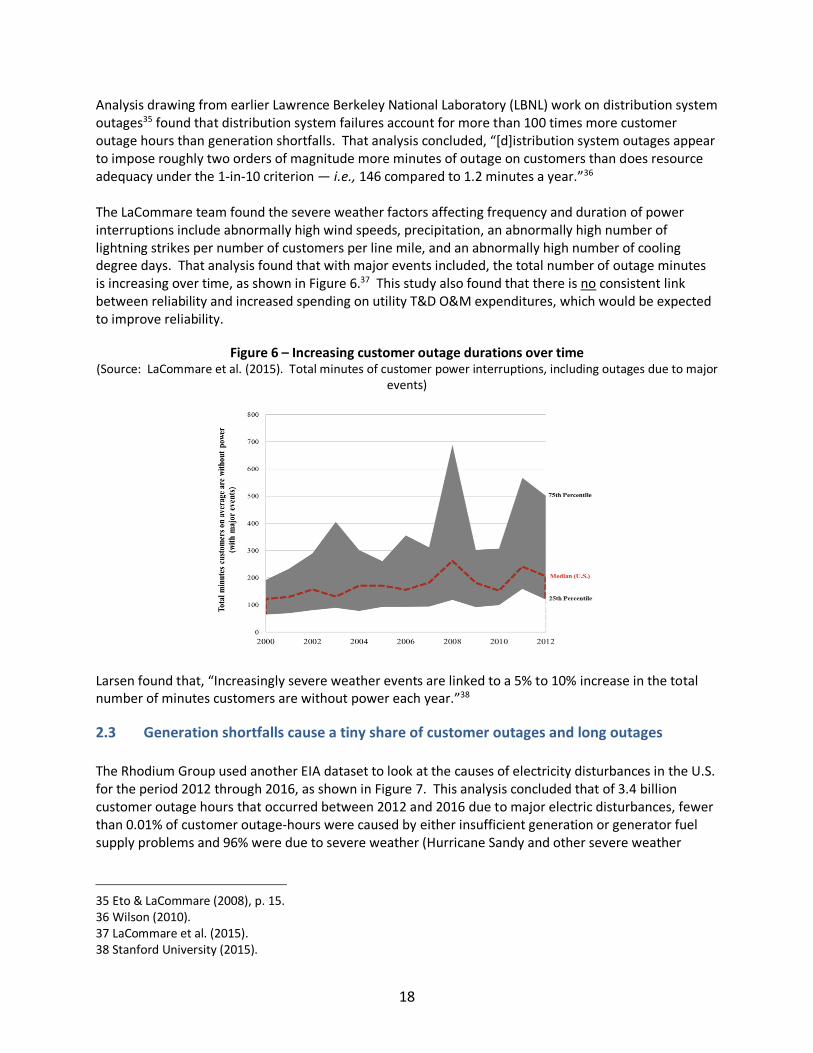
The LaCommare team found the severe weather factors affecting frequency and duration of power
interruptions include abnormally high wind speeds, precipitation, an abnormally high number of
lightning strikes per number of customers per line mile, and an abnormally high number of cooling
degree days. That analysis found that with major events included, the total number of outage minutes
is increasing over time, as shown in Figure 6.37 This study also found that there is no consistent link
between reliability and increased spending on utility T&D O&M expenditures, which would be expected
to improve reliability.
Figure 6 – Increasing customer outage durations over time
(Source: LaCommare et al. (2015). Total minutes of customer power interruptions, including outages due to major
events)
Larsen found that, “Increasingly severe weather events are linked to a 5% to 10% increase in the total
number of minutes customers are without power each year.”38
2.3 Generation shortfalls cause a tiny share of customer outages and long outages
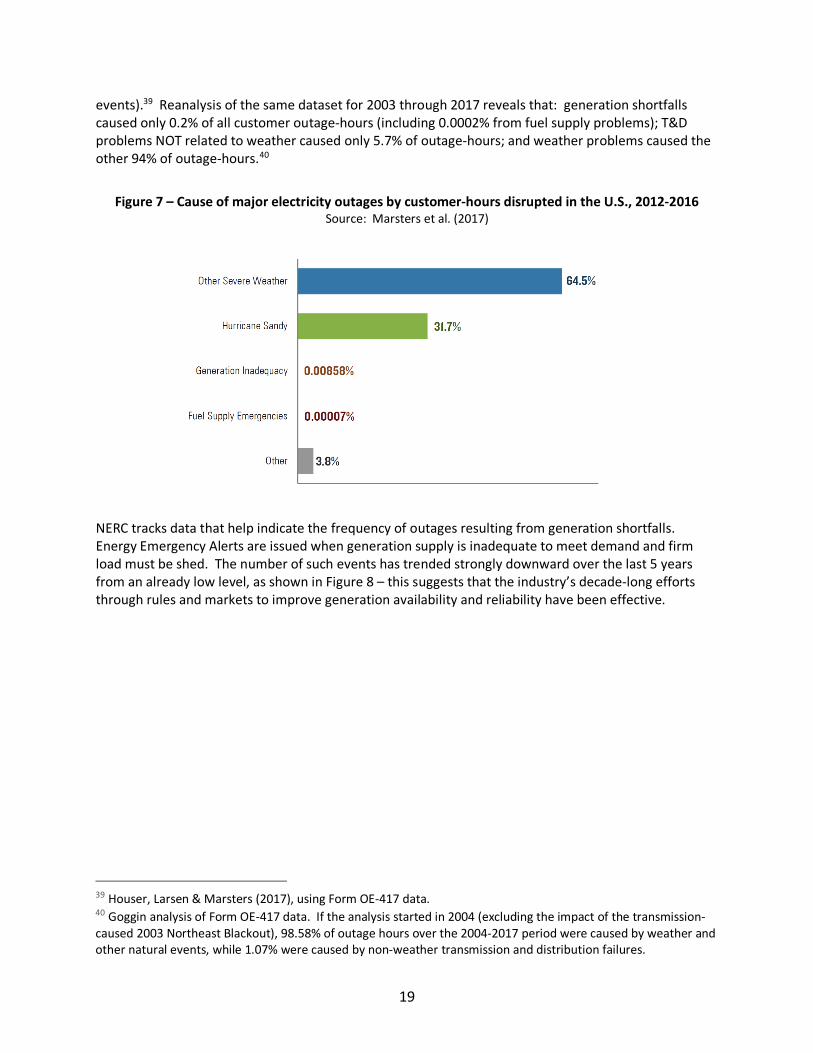
The Rhodium Group used another EIA dataset to look at the causes of electricity disturbances in the U.S.
for the period 2012 through 2016, as shown in Figure 7. This analysis concluded that of 3.4 billion
customer outage hours that occurred between 2012 and 2016 due to major electric disturbances, fewer
than 0.01% of customer outage-hours were caused by either insufficient generation or generator fuel
supply problems and 96% were due to severe weather (Hurricane Sandy and other severe weather
35 Eto & LaCommare (2008), p. 15.
36 Wilson (2010). 37 LaCommare et al. (2015).
38 Stanford University (2015).
19
events).39 Reanalysis of the same dataset for 2003 through 2017 reveals that: generation shortfalls
caused only 0.2% of all customer outage-hours (including 0.0002% from fuel supply problems); T&D
problems NOT related to weather caused only 5.7% of outage-hours; and weather problems caused the
other 94% of outage-hours.40
Figure 7 – Cause of major electricity outages by customer-hours disrupted in the U.S., 2012-2016 Source: Marsters et al. (2017)
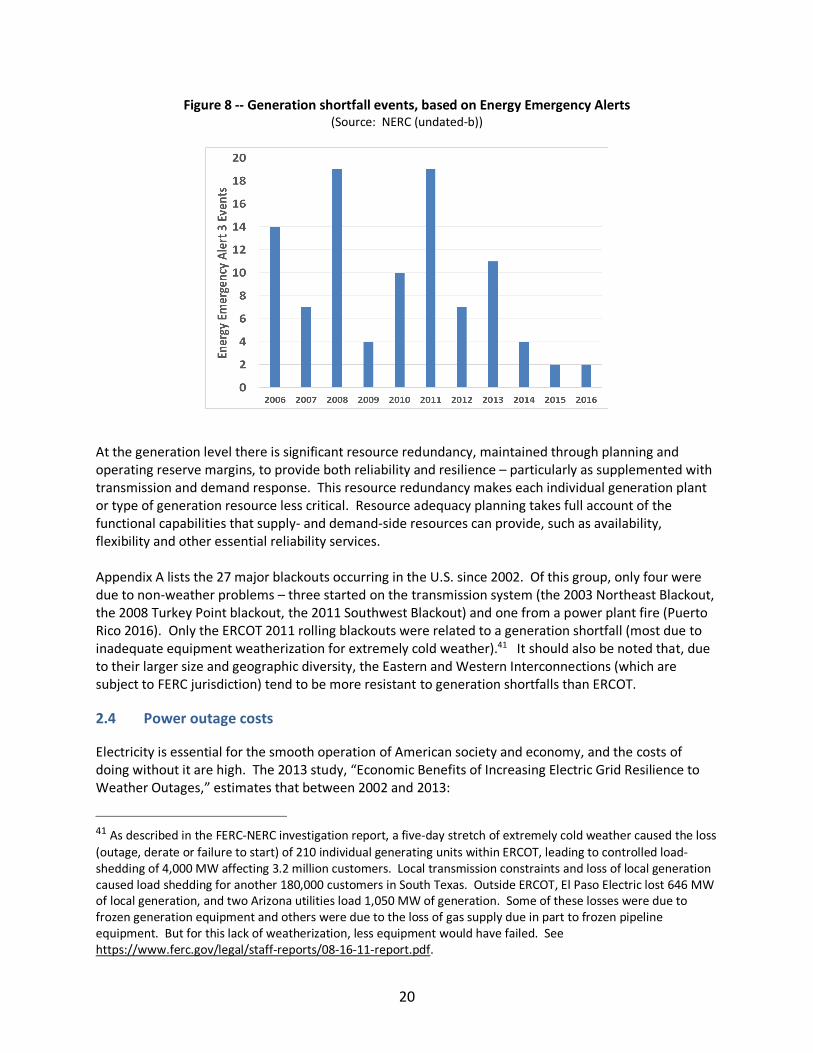
NERC tracks data that help indicate the frequency of outages resulting from generation shortfalls.
Energy Emergency Alerts are issued when generation supply is inadequate to meet demand and firm
load must be shed. The number of such events has trended strongly downward over the last 5 years
from an already low level, as shown in Figure 8 – this suggests that the industry’s decade-long efforts
through rules and markets to improve generation availability and reliability have been effective.
39 Houser, Larsen & Marsters (2017), using Form OE-417 data. 40 Goggin analysis of Form OE-417 data. If the analysis started in 2004 (excluding the impact of the transmission-
caused 2003 Northeast Blackout), 98.58% of outage hours over the 2004-2017 period were caused by weather and
other natural events, while 1.07% were caused by non-weather transmission and distribution failures.
20
Figure 8 -- Generation shortfall events, based on Energy Emergency Alerts (Source: NERC (undated-b))
At the generation level there is significant resource redundancy, maintained through planning and
operating reserve margins, to provide both reliability and resilience – particularly as supplemented with
transmission and demand response. This resource redundancy makes each individual generation plant
or type of generation resource less critical. Resource adequacy planning takes full account of the
functional capabilities that supply- and demand-side resources can provide, such as availability,
flexibility and other essential reliability services.
Appendix A lists the 27 major blackouts occurring in the U.S. since 2002. Of this group, only four were
due to non-weather problems – three started on the transmission system (the 2003 Northeast Blackout,
the 2008 Turkey Point blackout, the 2011 Southwest Blackout) and one from a power plant fire (Puerto
Rico 2016). Only the ERCOT 2011 rolling blackouts were related to a generation shortfall (most due to
inadequate equipment weatherization for extremely cold weather).41 It should also be noted that, due
to their larger size and geographic diversity, the Eastern and Western Interconnections (which are
subject to FERC jurisdiction) tend to be more resistant to generation shortfalls than ERCOT.
2.4 Power outage costs
Electricity is essential for the smooth operation of American society and economy, and the costs of
doing without it are high. The 2013 study, “Economic Benefits of Increasing Electric Grid Resilience to
Weather Outages,” estimates that between 2002 and 2013:
41 As described in the FERC-NERC investigation report, a five-day stretch of extremely cold weather caused the loss
(outage, derate or failure to start) of 210 individual generating units within ERCOT, leading to controlled load-
shedding of 4,000 MW affecting 3.2 million customers. Local transmission constraints and loss of local generation
caused load shedding for another 180,000 customers in South Texas. Outside ERCOT, El Paso Electric lost 646 MW
of local generation, and two Arizona utilities load 1,050 MW of generation. Some of these losses were due to
frozen generation equipment and others were due to the loss of gas supply due in part to frozen pipeline
equipment. But for this lack of weatherization, less equipment would have failed. See
https://www.ferc.gov/legal/staff-reports/08-16-11-report.pdf.

21
Weather-related outages are estimated to have cost the U.S. economy an inflation-adjusted
annual average of $18 billion to $33 billion. Annual costs fluctuate significantly and are greatest
in the years of major storms such as Hurricane Ike in 2008, a year in which cost estimates range
from $40 billion to $75 billion…. The costs of outages take various forms including lost output
and wages, spoiled inventory, delayed production, inconvenience and damage to the electric
grid.42
Table 2 estimates the cost per outage event (the cost for one customer for one interruption of the
indicated duration), cost per average kW of interrupted service (normalized by demand), and cost per
unserved kWh. These costs are based on review of many utility interruption cost estimates and
econometric analysis of outage data. The study concludes that outage costs are highest for medium and
large commercial & industrial (C&I) customers, but on a per kW basis, small C&I customers place the
highest value on a power service interruption. Residential customers (individually) experience lower
costs from a power interruption – but there are many more residential customers so cumulative outage
costs for the residential class are high. Customer interruption costs vary by season and time of day,
following expected patterns of each customer group’s electric usage and activities.
Table 2 – Estimated interruption cost by event, average kW and unserved kWh
(US 2013$) by interruption duration and customer class
(Source: Sullivan et al. (2015), Table ES-1)
Table 2 shows that outage costs increase as outage duration increases.43 The analysts caution that these
estimates are more accurate for shorter-duration outages (under 24 hours), and that the estimates do
not reflect the significant indirect spillover effects of an outage on the wider economy.44 These data
42 Executive Office of the President (2013), p. 3. 43 As will be discussed below, the number of major event outages has been increasing over the past decades and
appears likely to continue on that trend. 44 Sullivan et al. (2015), p. xiv.
22
and findings were used to update DOE’s Interruption Cost Estimate (ICE) calculator, which is available for
electric reliability planners and others to use to estimate outage costs.45
Many analysts agree that the per-customer economic costs of long, large outages are far greater than
the costs of short outages, and that those larger costs have not yet been well reported or well
estimated.46 Updated work on the annual cost of longer electric power interruptions estimates that for
2015, the nation-wide cost of sustained outages totaled $59 billion (28% for industrial customers, 70%
for commercial customers, and 2% to residential customers).47 Many recent severe, extended outages
such as the on-going Puerto Rico tragedy indicate that Value of Lost Load estimates such as those in
Table 2 above greatly under-estimate the full cost or burden that extended outages place upon affected
electric customers.
Public safety concerns arise for residential customers affected by long duration outages, particularly in
conditions of intense cold or heat or if access to clean water is impaired. The on-going, widespread,
multi-month power outages across Puerto Rico from Hurricane Maria will set new records for the costs
and impacts of American power failures. Beyond the economic costs, extended power outages can lead
to human deaths – the current months-long power outage in Puerto Rico due to Hurricane Maria is
reported to have caused at least 1,085 deaths between September and December 2017, from causes
including the inability to power home dialysis and respiratory machines, inability to contact emergency
services due to lack of cell phone power or tower service,48 and poisoning due to lack of power for food
and medicine refrigeration, clean water and sewers. On a more modest scale, a recent review of the
August 14, 2003 Northeast blackout attributes approximately 90 excess deaths in New York City alone.49
2.5 Conclusions
The data above show clearly that the vast majority of outage events (outage frequency) arise at the
distribution level from routine bad weather and other events. HILF events such as hurricanes and winter
storms cause the bulk of customer outage-minutes (outage duration) by damaging distribution and
some transmission assets. The fact that so few outages have been due to problems at the bulk power
system level may well demonstrate the effectiveness of the efforts by NERC, FERC and the industry to
improve reliability and resilience efforts over the past decade.
It follows that scarce resources and attention to reliability and resilience can best be focused on those
solutions (such as tree-trimming to reduce weather-related damages to both distribution and
45 LBNL ICE Calculator. 46 Keogh and Cody, writing for NARUC, observed that about half of reporting utilities exclude major event impacts
from their SAIDI and SAIFI reporting because, “Large scale events warp the math because restoration costs are so
high, and because they are likely to inflict longer-term service interruptions. In catastrophic situations the value to
ratepayers for surviving the event without losing service is especially high.” They hypothesize that the value of lost
electric services increases exponentially rather than arithmetically over time, because as the outage extends after
days and weeks without power “modern life becomes impossible.” (Keogh & Cody (2013), p. 10. 47 Eto (2017), p. 12. 48 Santos-Lozado (2018). 49 Anderson & Bell (2012), p. 189-193. Causes of blackout-associated deaths included carbon monoxide poisoning
(from inadequately vented back-up generators), heart attacks from exertion of evacuating tall buildings, lack of
access to food sources and prescription medicines, inability to use electric-operated home medical equipment,
slow ambulance response to emergency events, heat complications, and higher localized air pollution.
23
transmission) that are most effective and cost-effective at reducing outage frequency, duration and
magnitude. Jurisdictional limits between FERC and states should not limit recognition that some of the
best solutions to maintain and enhance resilience lie outside the bulk power system.
Section 3 | There are Many Threats to the Power System
Planners must account for many threats that can affect the power system. Resilience assessment needs
to identify that large set of hazards and threats relevant to each region and system, then recognize the
common range, magnitude and potential consequences of those threats. This section reviews the
various categories of significant threats to the power system. This analysis indicates that the electricity
distribution and transmission systems are among the most vulnerable to almost all major threats,
confirming the finding in preceding and subsequent sections that those systems should be the primary
focus of efforts to improve resilience.
3.1 Power system resilience should address a variety of threats
Although the bulk of customer outages occur at the distribution level, both distribution and transmission
are vulnerable. Damage to multiple transmission facilities can cause much larger outages, even though
there is often a high level of redundancy between transmission facilities and between transmission and
generation. From a customer-centric viewpoint, it is worthwhile to invest in reliability and resilience
measures for both transmission and distribution because such measures have meaningful impact and
benefits for a reasonable cost.
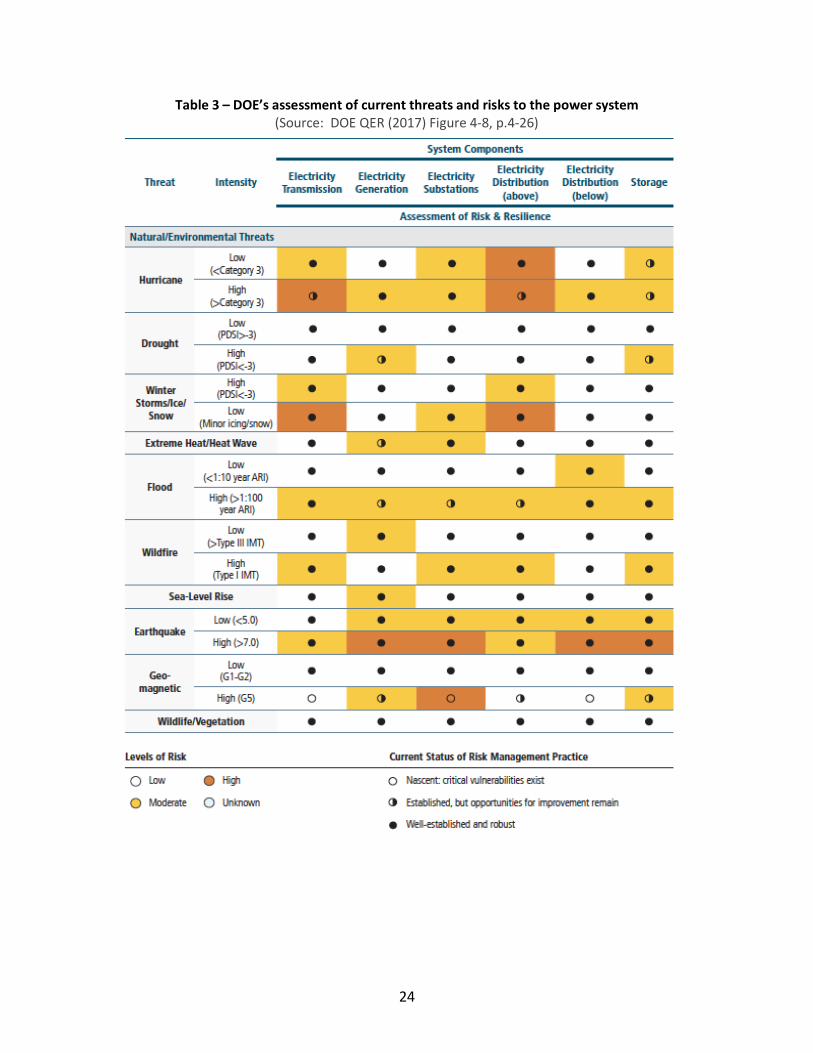
Table 3 lists a number of major events known to harm the power system and shows which parts of the
system each type of threat can harm. Electricity distribution and transmission wires and substations are
vulnerable to almost every type of threat, confirming that those systems should be a priority for efforts
to improve resilience. Recognition of the common consequences that cross numerous threats is the first
step in developing a constructive, cost-effective set of measures directed at common consequences
rather than only at specific threats.
24
Table 3 – DOE’s assessment of current threats and risks to the power system
(Source: DOE QER (2017) Figure 4-8, p.4-26)
25
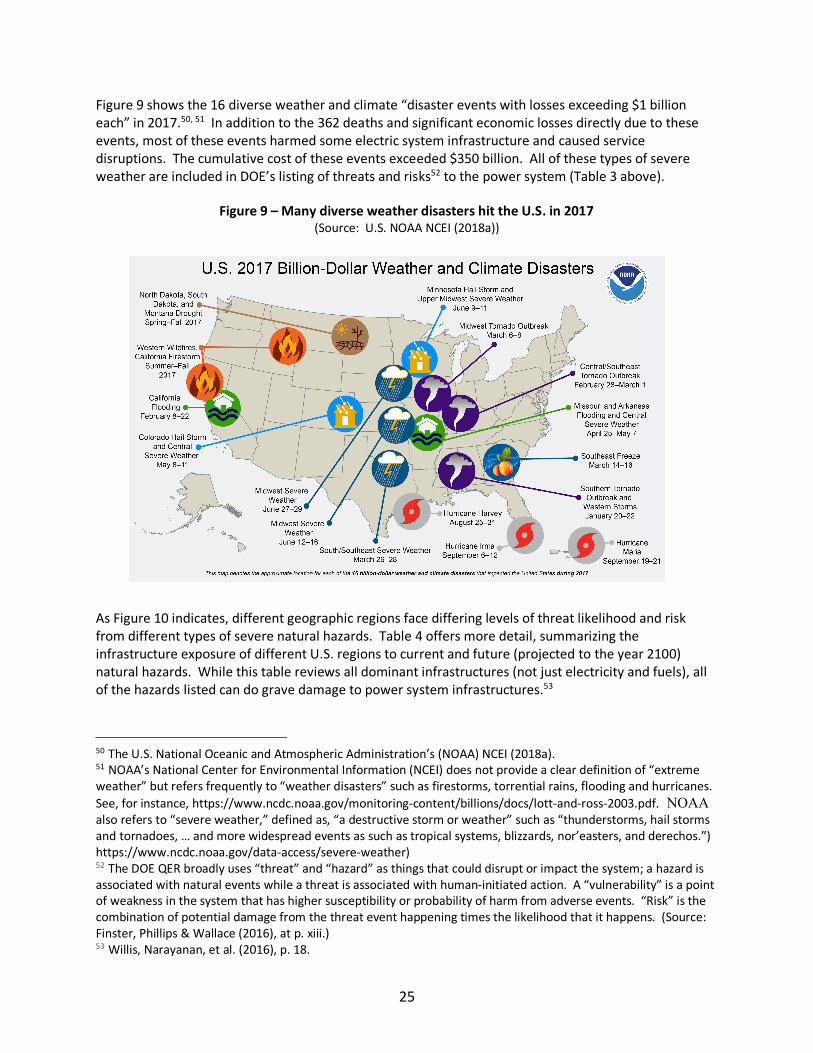
Figure 9 shows the 16 diverse weather and climate “disaster events with losses exceeding $1 billion
each” in 2017.50, 51 In addition to the 362 deaths and significant economic losses directly due to these
events, most of these events harmed some electric system infrastructure and caused service
disruptions. The cumulative cost of these events exceeded $350 billion. All of these types of severe
weather are included in DOE’s listing of threats and risks52 to the power system (Table 3 above).
Figure 9 – Many diverse weather disasters hit the U.S. in 2017 (Source: U.S. NOAA NCEI (2018a))
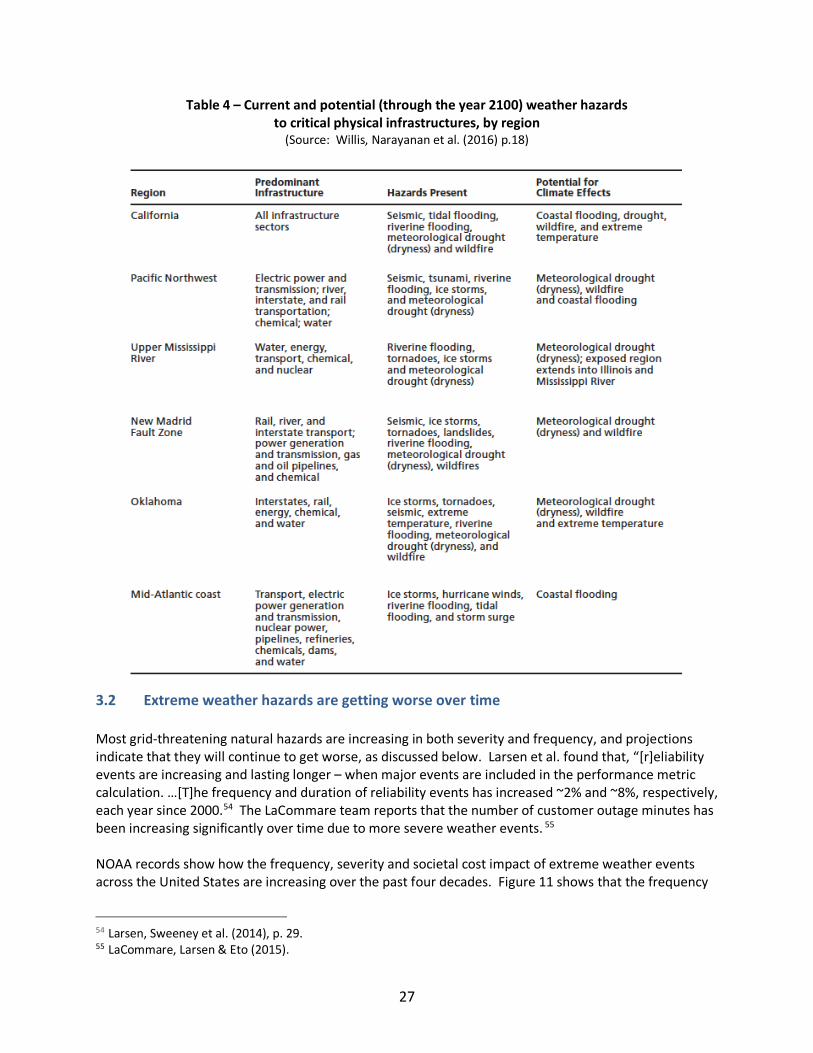
As Figure 10 indicates, different geographic regions face differing levels of threat likelihood and risk
from different types of severe natural hazards. Table 4 offers more detail, summarizing the
infrastructure exposure of different U.S. regions to current and future (projected to the year 2100)
natural hazards. While this table reviews all dominant infrastructures (not just electricity and fuels), all
of the hazards listed can do grave damage to power system infrastructures.53
50 The U.S. National Oceanic and Atmospheric Administration’s (NOAA) NCEI (2018a). 51 NOAA’s National Center for Environmental Information (NCEI) does not provide a clear definition of “extreme
weather” but refers frequently to “weather disasters” such as firestorms, torrential rains, flooding and hurricanes.
See, for instance, https://www.ncdc.noaa.gov/monitoring-content/billions/docs/lott-and-ross-2003.pdf. NOAA also refers to “severe weather,” defined as, “a destructive storm or weather” such as “thunderstorms, hail storms
and tornadoes, … and more widespread events as such as tropical systems, blizzards, nor’easters, and derechos.”)
https://www.ncdc.noaa.gov/data-access/severe-weather) 52 The DOE QER broadly uses “threat” and “hazard” as things that could disrupt or impact the system; a hazard is
associated with natural events while a threat is associated with human-initiated action. A “vulnerability” is a point
of weakness in the system that has higher susceptibility or probability of harm from adverse events. “Risk” is the
combination of potential damage from the threat event happening times the likelihood that it happens. (Source:
Finster, Phillips & Wallace (2016), at p. xiii.) 53 Willis, Narayanan, et al. (2016), p. 18.

26
Figure 10 – Regional vulnerabilities to tornado and
hurricane tracks, wildfires, earthquakes and coastal inundation (Source: U.S. DOE QER (2015), p. 2-5)
27
Table 4 – Current and potential (through the year 2100) weather hazards
to critical physical infrastructures, by region (Source: Willis, Narayanan et al. (2016) p.18)
3.2 Extreme weather hazards are getting worse over time
Most grid-threatening natural hazards are increasing in both severity and frequency, and projections
indicate that they will continue to get worse, as discussed below. Larsen et al. found that, “[r]eliability
events are increasing and lasting longer – when major events are included in the performance metric
calculation. …[T]he frequency and duration of reliability events has increased ~2% and ~8%, respectively,
each year since 2000.54 The LaCommare team reports that the number of customer outage minutes has
been increasing significantly over time due to more severe weather events. 55
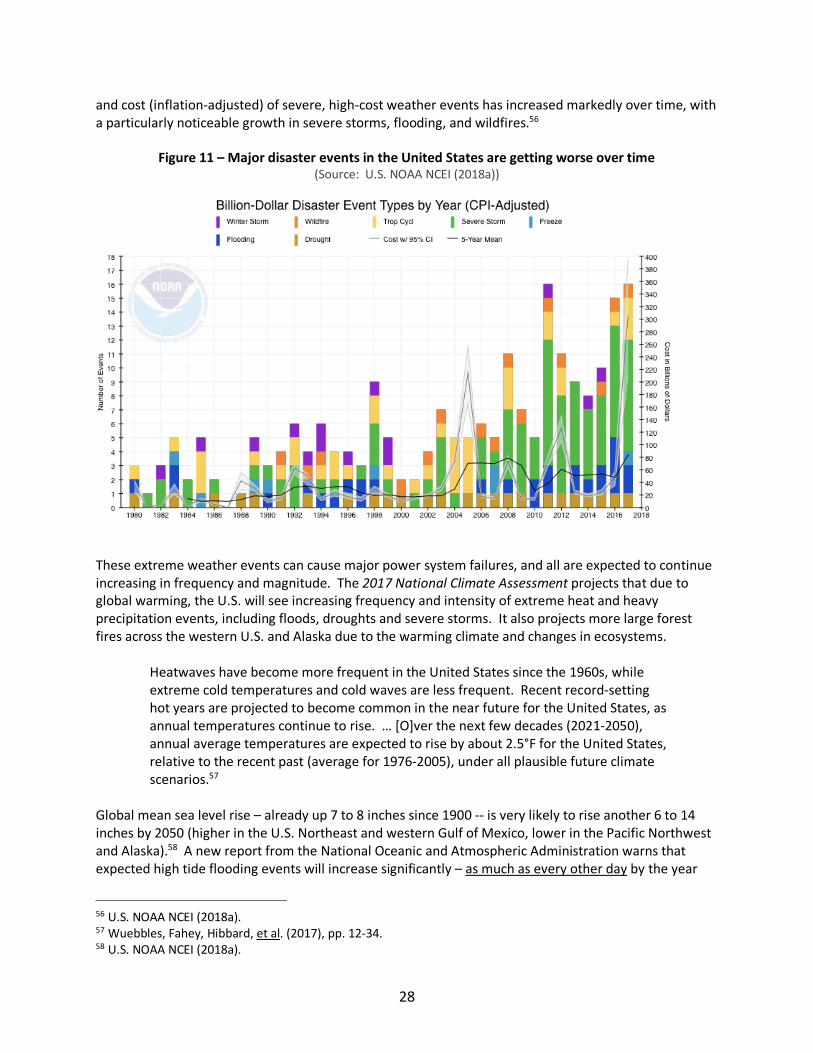
NOAA records show how the frequency, severity and societal cost impact of extreme weather events
across the United States are increasing over the past four decades. Figure 11 shows that the frequency
54 Larsen, Sweeney et al. (2014), p. 29. 55 LaCommare, Larsen & Eto (2015).
28
and cost (inflation-adjusted) of severe, high-cost weather events has increased markedly over time, with
a particularly noticeable growth in severe storms, flooding, and wildfires.56
Figure 11 – Major disaster events in the United States are getting worse over time
(Source: U.S. NOAA NCEI (2018a))
These extreme weather events can cause major power system failures, and all are expected to continue
increasing in frequency and magnitude. The 2017 National Climate Assessment projects that due to
global warming, the U.S. will see increasing frequency and intensity of extreme heat and heavy
precipitation events, including floods, droughts and severe storms. It also projects more large forest
fires across the western U.S. and Alaska due to the warming climate and changes in ecosystems.
Heatwaves have become more frequent in the United States since the 1960s, while
extreme cold temperatures and cold waves are less frequent. Recent record-setting
hot years are projected to become common in the near future for the United States, as
annual temperatures continue to rise. … [O]ver the next few decades (2021-2050),
annual average temperatures are expected to rise by about 2.5°F for the United States,
relative to the recent past (average for 1976-2005), under all plausible future climate
scenarios.57
Global mean sea level rise – already up 7 to 8 inches since 1900 -- is very likely to rise another 6 to 14
inches by 2050 (higher in the U.S. Northeast and western Gulf of Mexico, lower in the Pacific Northwest
and Alaska).58 A new report from the National Oceanic and Atmospheric Administration warns that
expected high tide flooding events will increase significantly – as much as every other day by the year
56 U.S. NOAA NCEI (2018a). 57 Wuebbles, Fahey, Hibbard, et al. (2017), pp. 12-34. 58 U.S. NOAA NCEI (2018a).
29
2100 – within the Northeast and Southeast Atlantic, the Eastern and Western Gulf coast, and the Pacific
Islands;59 storm flooding will be commensurately worse in terms of magnitude and frequency.
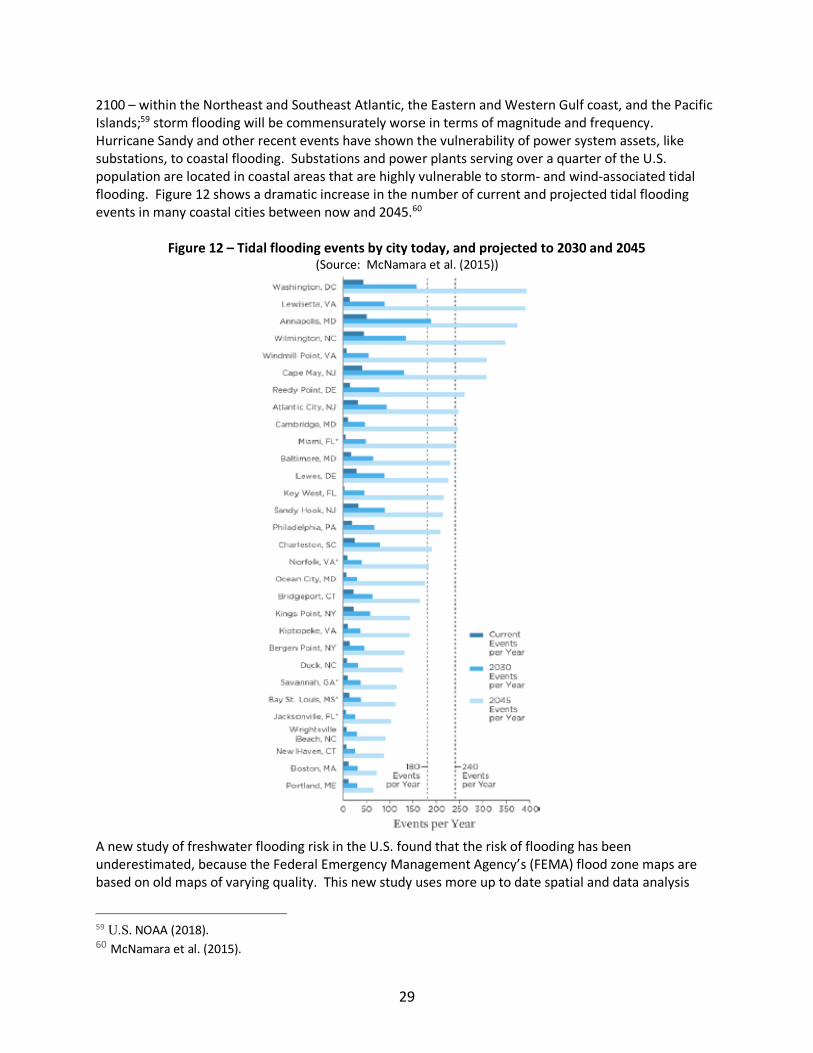
Hurricane Sandy and other recent events have shown the vulnerability of power system assets, like
substations, to coastal flooding. Substations and power plants serving over a quarter of the U.S.
population are located in coastal areas that are highly vulnerable to storm- and wind-associated tidal
flooding. Figure 12 shows a dramatic increase in the number of current and projected tidal flooding
events in many coastal cities between now and 2045.60
Figure 12 – Tidal flooding events by city today, and projected to 2030 and 2045
(Source: McNamara et al. (2015))
A new study of freshwater flooding risk in the U.S. found that the risk of flooding has been
underestimated, because the Federal Emergency Management Agency’s (FEMA) flood zone maps are
based on old maps of varying quality. This new study uses more up to date spatial and data analysis
59 U.S. NOAA (2018). 60 McNamara et al. (2015).
30
techniques and population data and concludes that 41 million Americans are exposed to severe rainfall-
based flooding risk -- 2.6 to 3.1 times higher than the numbers based on the FEMA maps. The study
notes that this reflects recent weather conditions and does not account for the increased rainfall and
flooding projected due to climate change-exacerbated extreme weather. 61
Climate change is altering the probability and impact severity of many bulk power system
hazards. It will require changes to electric reliability and resilience planning tools and measures.
Today, few utilities are designing their current or hardened transmission and distribution poles
and wires for more extensive and severe flooding, higher winds, more extensive ice storms, or
longer, hotter heat waves and forest fires. Current electricity demand models are just beginning
to adjust to the continuing rise in peak temperatures and loads and may not be forecasting
those accurately if severe heat and drought patterns occur as projected. All of these events will
increase the risks and threats to utility field crews and to electricity end-users and increase the
costs and consequences of power outages to individuals and society as a whole.
3.3 Physical security attacks to the grid are a continuing threat
Figure 13 shows the sequence of actual outages caused by intentional acts against physical assets,
including theft, vandalism and attacks, on domestic bulk power system assets over the period October
2013 through September 2014. Events such as these are not widely publicized, but they do not appear
to be slowing down. ICF reports that many of these specific incidents caused relatively minimal damage
and outages, but that does not mean that better informed, more motivated malicious attackers could
not produce more consequential damages.62
61 Schlesinger (2018), and Wing, Bates et al. (2018). 62 Many more physical attacks and grid vulnerabilities are described in the ICF report prepared for the DOE QER,
“Electric Grid Security and Resilience: Establishing a Baseline for Adversarial Threats,” at ICF (2016).

31
Figure 13 – Significant physical security incidents and outages, 2013-2014 (Source: U.S. DHS (2015), p. 15)
3.4 GMD, EMP and cyber HILF events
FERC and industry members are conducting analysis and planning to address HILF events such as
geomagnetic disturbances (GMD), electromagnetic pulse (EMP)attacks, and large-scale cyber-attacks.
These efforts include initiatives by FERC, NERC, the Electric Power Research Institute (EPRI), DOE and the
U.S. Department of Homeland Security (DHS) to characterize and determine the potential impacts of
GMD and EMP on electric infrastructure assets, extensive cyber-security research and reporting, and
aggressive reliability standards adoption including evolving Critical Infrastructure Protection (CIP)
Standards.63
Over the last century, several large geomagnetic storms have caused large-scale power system outages
(mostly on power systems at higher latitudes due to their greater exposure to solar weather). Industry
planners are well aware of the 1989 geomagnetic storm that triggered protective relays and collapsed
Hydro-Quebec’s transmission system, leaving six million people without power for nine hours, and the
Carrington geomagnetic event in 1859, estimated to have been about three times stronger than the
1989 event. Even small GMD events have the potential to cause significant disruption to the U.S. power
system. For example, the Tennessee Valley Authority (TVA) reports that:
Although the TVA service area is relatively southerly, solar storms or geomagnetic
disturbances (GMD) in 2000 and 2003 caused harmonics, leading to nuisance trips of
161-kV capacitor banks…. Since January 2015, there have been 10 GMD storms noted
63 See, for instance, the list of FERC orders on cyber-security at FERC Cyber & Grid Security home page, DOE
research initiatives at its Cyber Security for Critical Energy Infrastructure home page, and the NERC CIP standards
at NERC (2018b).

32
as K5 through K8 events on the EPRI Sunburst system; the maximum GIC measured in
500-kV transformer neutrals at TVA has been less than 17 A. TVA’s entire fleet of 500-kV
transformers has been analyzed for GIC-caused VAR and thermal response.64
Work continues at EPRI, NERC, FERC, DHS and elsewhere to identify the appropriate technical and
operational measures to address this hazard cost-effectively.
Electromagnetic pulse attacks can harm most electricity-using equipment, not just the power generation
and delivery system. EMPs could be delivered by the detonation of a nuclear weapon at extremely high
altitude above the United States and may be more difficult to protect against. Such an attack could only
be launched by a small number of state actors with sophisticated nuclear weapons and intercontinental
ballistic missile technology. As a result, responsibility for preparing for and deterring such an attack has
been given to the U.S. military rather than NERC and FERC.
Cyber-security threats to the power system are also significant and increasing. A 2016 Idaho National
Laboratory analysis reported that:
The likelihood for cyber-attacks against utilities is increasing in frequency and
severity of attacks. The 2015 Global State of Information Security Survey reported that
power companies and utilities around the world expressed a six-fold increase in the
number of detected cyber incidents over the previous year. The number of energy
sector incidents reported to ICS-CERT is significant each year, with 79 incidents (the
most reported incidents per sector) in 2014, and 46 incidents (the second most reported
incidents per sector) in 2015.65
Since that report, the level and severity of publicly admitted cyber-attacks on power systems have
increased markedly (or been more widely acknowledged). TVA illustrates the magnitude of the cyber
challenge:
In 2016, almost 14 billion events were visible against TVA operating technology, of
which 491 million were classified as potential security events and more than 54,000
required additional actions. Responses include defense in depth, NERC CIP, NIST/FISMA,
and NRC standards, continuous monitoring, security vulnerability scans, equipment
review audits, assessments, participation in E-ISAC, and in-house and industry-wide
incidence response drills.66
Experts have cause for alarm based on incidents including two malware campaigns against energy sector
targets in 2013-14, the cyber-attack that took down the Ukrainian grid in 2015-16,67 and recent reports
that Russia-linked hackers are infiltrating the U.S. grid.68 The Federal Bureau of Investigation (FBI) and
DHS report that Russian hackers have used phishing and other techniques to download malicious code
into the target systems, captured users’ credentials for later malicious use, and created local accounts
64 Cemp & Grant (2018). 65 Idaho National Laboratory (2016), p. 2. 66 Cemp & Grant (2018). 67 See, e.g., the SANS Institute (2016) and Dunietz (2017). 68 U.S.-CERT Alert (2018).
33
for later system access.69 These attacks have targeted business computing, IT networks, SCADA and
control systems of power plants and other critical assets, which “could be manipulated to cause
equipment failure or blackouts.” 70
At the same time, there are more ways for attackers to access and harm the power system. These rise
from the proliferation of two-way communications linking and automating elements and actors across
the power system, as well as the growth of accessible intelligent devices, Supervisory Control and Data
Acquisition (SCADA) and industrial control systems running so many of the interconnected devices.
Despite the use of cyber-security measures across much of the bulk power system, much of the energy
system overall remains accessible and vulnerable to cyber-attack.71
DOE Secretary Rick Perry told a congressional subcommittee on March 15, 2018, that he’s not confident
the grid is secure from cyber-intrusions, which are “literally happening hundreds of thousands of times a
day. … The warfare that goes on in the cyberspace is real, it’s serious….”72 Analysts report that China,
Russia, North Korea and other nations “likely have the capability to shut down the U.S. power grid,”73
potentially causing power outages across large portions of the grid for days or weeks.
Utilities and the government are exploring mutual cyber-assistance measures to protect against and
respond to cyber-attack; it appears that the current level of cyber-security measures have been
ineffective against the newly reported Russian intrusions. If a malicious cyber-attack successfully moves
from intrusion to a formal effort to harm generators and cause blackouts, it could take some time for an
industry-wide effort to rebuild the IT communication and controls networks. In such a case, customer-
level measures such as energy efficiency and cyber-islanded distributed generation would help
customers survive an extended outage.
3.5 Generation and fuel supply are not significant threats
As Section 2 showed, most outages and extended blackouts have been due to weather events harming
the transmission and distribution systems, while generation failures have to date accounted for an
extremely small share of customer outages. Going forward, utilities and grid operators will assess risks
from various scenarios including those with continued retirements of traditional generating sources. As
the ISOs and RTOs reported to FERC, most see no current, serious generation or fuel supply risks to bulk
power system resilience in most U.S. regions. In the generation sector, since no single source or
technology is essential, there are plenty of options to achieve reliability even as generators retire.
To assess generation and fuel security threats, it is important to distinguish system reliability or
resilience from plant- or technology-specific reliability or resilience. Power systems utilize a portfolio of
resources such that the loss of any one unit can be covered by activating others which are held in
reserve. Thus no individual unit or technology is critical, and it is not meaningful to assign a level of
“reliability” or “resilience” to a generating unit or a type of generating technology. Rather, all power
systems perform system-wide analyses to make sure they have enough aggregate energy and reliability
services. The metric of generation adequacy is the reserve margin. Reserve margins are set based on
69 U.S.-CERT Alert (2018). 70 St. John (2018). 71 See, for instance, Campbell (2016) testimony. 72 Ibid. 73 Knake (2017).

34
the probability of outages from different causes including fuel availability. Resource adequacy
mechanisms exist in both restructured and traditionally regulated areas; there is no aspect of resilience
that changes resource adequacy standards and guidelines (although considerations of resilience cost-
effectiveness, as discussed in Section 5 below, invite new discussion of resource adequacy levels).
There is little current basis for finding that generation supply -- as a generic issue -- is a serious threat to
power system resilience. DOE’s August 2017 Staff Report on grid reliability, drawing on NERC analysis,
concluded that, “all regions have reserve margins above resource adequacy targets.”74 Four RTOs and
ISOs reported to FERC that they do not have a generation supply (resource adequacy) or a resilience
problem associated with their generation resources. (The other three RTOs and ISOs (CAISO, ISO-NE,
and PJM) are discussed below).75 Some regions have very little to no coal or nuclear power left and
other resources provide needed energy and reliability services. All regions have some demand response
capability and growing levels of distributed generation affecting some portion of real-time demand. And
every region is improving its load and renewable generation forecasting capabilities, which enables
more accurate generation scheduling and reduces the likelihood of real-time generation shortfalls due
to forecast error rather than generation shortcomings.
Fuel security is normally assumed in resource adequacy and planning reserve margin calculations.
However, as reliance on natural gas has increased, at least two RTOs (PJM and ISO-NE) have raised
concerns about gas supply under periods of high gas usage or the loss of a large gas pipeline.76 While it
is helpful to assess fuel security under all potential circumstances, the experiences described below have
revealed primarily market design flaws that have caused or exacerbated physical fuel supply problems.77
No single resource or technology is essential because all of the needed energy and reliability services
can be provided by a wide range of technology combinations, including combinations that include no
nuclear, no coal, no gas, or no renewable sources. Figure 14 below shows capabilities from various
technologies to provide the three main types of essential reliability services defined by NERC.78 An
expanded version of the table in Appendix B includes textual explanations and hyperlinked citations for
each cell. Each of these resources have capabilities to provide some of the needed services, but none
74 U.S. DOE (2017c). 75 Submissions to FERC by SPP, NYISO, MISO, and ERCOT, March 9, 2018, FERC Docket No. AD18-7. 76 Events such as the loss of a natural gas pipeline that can affect production from multiple power plants are called
a “common failure mode.” Other common failure modes that can compromise electric generation include railroad
delivery problems for coal plants, extended heat and drought affecting plant cooling water, earthquake or storm
surge damaging multiple substations, or a large hurricane shutting down multiple nuclear plants (under Nuclear
Regulatory Commission rules), or a communications network failure. 77 A recent report by the National Energy Technology Laboratory argues that coal plants demonstrated their
resilience by operating at much higher levels of output during the Bomb Cyclone event than they did during the
earlier part of December 2017. However, this higher level of utilization primarily indicates that coal plants had
large amounts of idle capacity in the earlier December period because the coal generation was uneconomic
relative to gas and other energy sources. The report also incorrectly alleges renewable energy output was low
during the Bomb Cyclone event, even though grid operator data confirm it was well above average across the
Northeast. 78 Based on NERC (2016). Elements in this table reflect the capabilities of the most modern generation and
automated demand response offerings commercially available today; not all of the equipment currently deployed
across the grid are able to provide these reliability services on demand without controller, inverter or other
modifications.

35
can cost-effectively provide all essential reliability services and none are unique in their ability to
provide any one service.
Figure 14 – Reliability services by energy resource (Assessments below reflect the most modern equipment capabilities being installed in the U.S. today particularly
for inverter-connected resources; not all installed resources have the same capabilities)
Since no resource or class of resources is uniquely capable of providing a specific reliability service,
power systems can be run reliably if a particular generator or class of generators retire. One cannot
assume, however, that any type of resource replacement or combination will provide all the services
that are needed, so it is prudent to do scenario and engineering assessments of the options.
New England region
Among the RTO/ISO comments, ISO-NE raises the most significant fuel-security concerns. The grid
operator is concerned about supply adequacy in coming years during winter peaks with extended
extreme cold weather events, when natural gas has import constraints and competing uses within the
region.
ISO-New England has performed a series of post-hoc analyses, mostly focusing on its increasing gas
dependence and constrained gas delivery system.79 ISO New England’s review of the “Bomb Cyclone”
event in the winter of 2017-18 revealed that the power system was able to maintain reliability despite
79 ISO New England (2018d), van Welie (2018).
36
two weeks of sustained extreme cold and long-standing gas pipeline constraints, largely because dual-
fuel generators were able to switch to oil and LNG when spot gas prices spiked. ISO-NE’s event analyses
found market design flaws – in particular, that it was rewarding generators with capacity payments that
did not incent or assure that the generators would perform when needed -- but did not find major fuel
supply shortages given LNG availability. The report noted that some units began to run low on oil
supplies due to the unusually long duration of the event and weather-related challenges in delivering oil.
Exelon, the owner of several natural gas-fired power plants in New England, recently indicated its desire
to shut down four units. Decisions on retirements need to be made in the near term. In response, ISO-
New England has used its existing reliability analysis processes to determine that it should designate two
units (1,600 MW) of the natural gas-fired Mystic Power Station for Reliability Agreements, saying the
units’ retirement could put electric reliability at risk.80 The grid operator fears that retirement of these
two units could pose, “an unacceptable fuel security risk to the region during the winter months,” when
natural gas is diverted from electric generation to home heating.
ISO-NE also performed a study of long-term fuel security. This analysis tested alternative resource
portfolios against a variety of grid threats.81 It concluded that the region’s growing dependence on
natural gas-fueled generation, without additional pipeline or LNG delivery capability, could pose a threat
to system reliability and resilience under extreme cold weather and storm conditions in the year 2025.
The ISO-NE study was recently updated with a base case that incorporates updated assumptions and it
shows more portfolios with no lost load even with high levels of renewables, natural gas, and energy
efficiency.82 Several scenarios that included high levels of renewables are projected to deliver high
reliability and some with and without renewables were reliable with high retirements. The study also
found that LNG was a viable option for gas supply if appropriate contracting terms are resolved.
Studies and corrections of New England’s fuel supply and generation reliability issues are continuing in
the ISO-NE stakeholder process. Despite the threat of additional power plant retirements, these studies
may find several alternative ways to address these challenges effectively with a variety of resource
portfolios.
PJM region
PJM’s concerns reflect the stressed conditions experienced in the 2014 “Polar Vortex” event and the
winter 2017-18 “Bomb Cyclone.” But in PJM’s report on the January 2018 Bomb Cyclone, the RTO
concluded that, “the PJM footprint is diverse and strong and remains reliable,” and, “even during peak
demand, PJM had excess reserves and capacity.”83 PJM’s 2017 reliability report found that a number of
scenarios with greatly reduced coal and nuclear capacity should remain reliable and resilient.84
During the Polar Vortex event of 2014, PJM’s generation reserves were low, but its ultimate operational
problem was not total supply nor access to fuel, but rather an unusually large number of generation
failures. PJM CEO Andrew Ott stated, “even at the height of the Polar Vortex, we were not facing
imminent blackouts. However, the performance of the generation fleet was not where it needed to be
80 ISO-NE (2018c). 81 ISO-NE (2018a). 82 ISO-NE (2018e). 83 PJM (2018), p. 1. 84 PJM (2017).
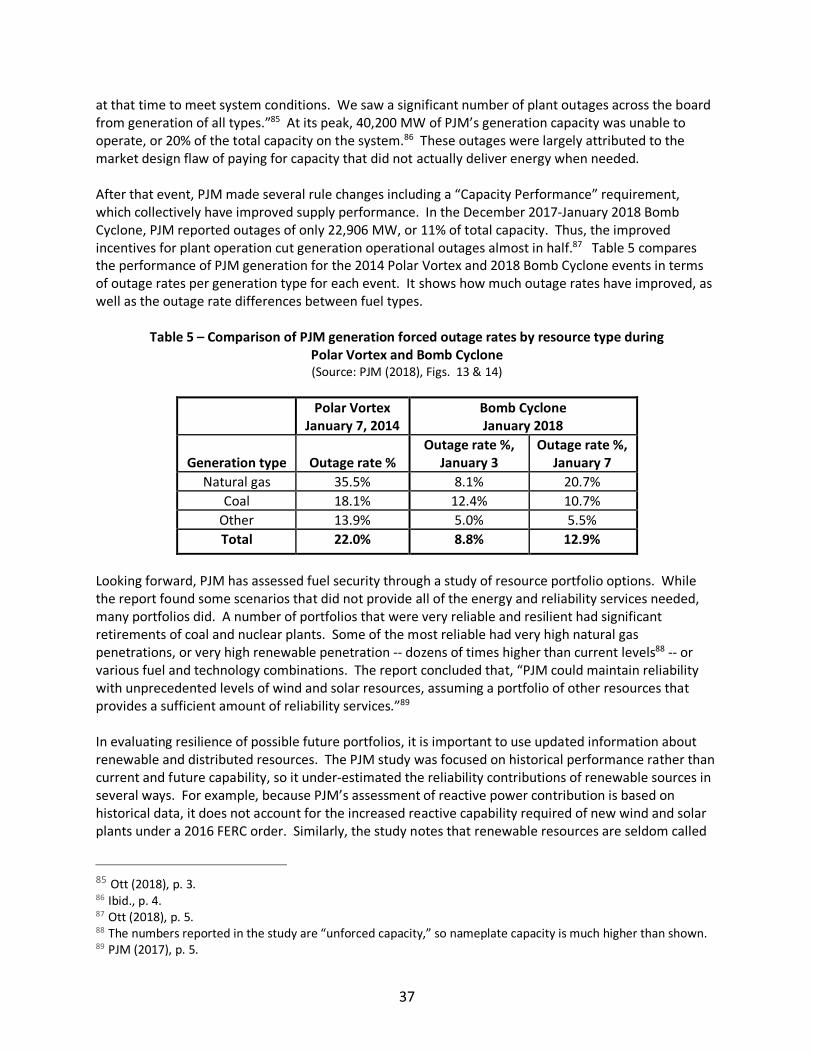
37
at that time to meet system conditions. We saw a significant number of plant outages across the board
from generation of all types.”85 At its peak, 40,200 MW of PJM’s generation capacity was unable to
operate, or 20% of the total capacity on the system.86 These outages were largely attributed to the
market design flaw of paying for capacity that did not actually deliver energy when needed.
After that event, PJM made several rule changes including a “Capacity Performance” requirement,
which collectively have improved supply performance. In the December 2017-January 2018 Bomb
Cyclone, PJM reported outages of only 22,906 MW, or 11% of total capacity. Thus, the improved
incentives for plant operation cut generation operational outages almost in half.87 Table 5 compares
the performance of PJM generation for the 2014 Polar Vortex and 2018 Bomb Cyclone events in terms
of outage rates per generation type for each event. It shows how much outage rates have improved, as
well as the outage rate differences between fuel types.
Table 5 – Comparison of PJM generation forced outage rates by resource type during
Polar Vortex and Bomb Cyclone (Source: PJM (2018), Figs. 13 & 14)
Polar Vortex
January 7, 2014
Bomb Cyclone
January 2018
Generation type Outage rate %
Outage rate %,
January 3
Outage rate %,
January 7
Natural gas 35.5% 8.1% 20.7% Coal 18.1% 12.4% 10.7%
Other 13.9% 5.0% 5.5% Total 22.0% 8.8% 12.9%
Looking forward, PJM has assessed fuel security through a study of resource portfolio options. While
the report found some scenarios that did not provide all of the energy and reliability services needed,
many portfolios did. A number of portfolios that were very reliable and resilient had significant
retirements of coal and nuclear plants. Some of the most reliable had very high natural gas
penetrations, or very high renewable penetration -- dozens of times higher than current levels88 -- or
various fuel and technology combinations. The report concluded that, “PJM could maintain reliability
with unprecedented levels of wind and solar resources, assuming a portfolio of other resources that
provides a sufficient amount of reliability services.”89
In evaluating resilience of possible future portfolios, it is important to use updated information about
renewable and distributed resources. The PJM study was focused on historical performance rather than
current and future capability, so it under-estimated the reliability contributions of renewable sources in
several ways. For example, because PJM’s assessment of reactive power contribution is based on
historical data, it does not account for the increased reactive capability required of new wind and solar
plants under a 2016 FERC order. Similarly, the study notes that renewable resources are seldom called
85 Ott (2018), p. 3. 86 Ibid., p. 4. 87 Ott (2018), p. 5. 88 The numbers reported in the study are “unforced capacity,” so nameplate capacity is much higher than shown. 89 PJM (2017), p. 5.
38
on to provide frequency regulation today, though renewables have excellent capability to regulate
frequency and are expected to increasingly provide this service as their penetration increases.90 Overall,
policy makers and the industry can use forward-looking portfolio analyses of energy and reliability
service requirements under different stressors to understand supply system resilience needs and how to
meet them in a variety of cost-effective ways.
California region
The California ISO studied resource portfolios and found scenarios that, “showed potential shortfalls in
load-following and reserves, with capacity insufficiencies occurring in the early evening after sunset,
based on 1,000-2,000 MW of retirements in the latest sensitivity analyses.”91 CAISO is working on a set
of market design changes to encourage energy and ramping resources at these times. CAISO
emphasizes this issue is being studied for reliability and there is not a need for a separate resilience
guideline or standard.
3.6 Conclusions about power system threats
The power system faces a wide variety of natural hazards and intentional threats. Natural hazards such
as hurricanes and ice storms cause extensive and costly damage to electric distribution and transmission
in particular, causing multi-day outages for large numbers of customers. The number and magnitude of
storm and other major natural hazards have increased significantly over the past fifteen years, so these
are high impact threats that are becoming more probable in the years ahead.
The power system can also be harmed by geomagnetic disturbances from solar weather and
electromagnetic pulses, and by cyber and physical attack. In contrast to weather hazards that physically
break great swathes of power system equipment, these events could shut equipment down without
extensive physical damage (although extreme levels of electromagnetic or clever cyber-attacks could
physically harm some individual assets). It is difficult to estimate the probabilities of these various
threats.
On the other hand, concerns about the importance of the outage threats from physical generation and
generic threat of fuel supply problems are misplaced. No single unit or type of generation is critical in
itself, and the combination of a generation fleet and robust transmission system, in combination with
customer-side demand response and distributed generation, generally offset the outage risk from losing
individual plants or fuel sources. The recent experiences of PJM and ISO-NE suggest that much of their
winter supply event problems stemmed from inappropriate definitions of and requirements for capacity
products, which did not incent needed resources to be available when actually needed.
90 Xcel Energy already uses wind plants to provide frequency regulation service (per Milligan et al (2015)) and
CAISO has found solar plants can do so as well (per CAISO, NREL, First Solar). 91 CAISO (2018), page 36.
39
Section 4 | Reviewing and Selecting Resilience Protections
Previous sections have established that most customer outages originate from failures on the low-
voltage electricity distribution system, which is regulated by state public utility commissions rather than
FERC. Since FERC’s statutory responsibility is the bulk power system (BPS), in its January 2018 Order the
agency appropriately directed its assessment and questions to exploring the events that threaten BPS
reliability and resilience, what attributes of the system contribute to resilience, and how should we
prepare for and mitigate those threats.
But the whole point of operating a power system is to serve end-use customers, and the point of a
reliable, resilient power system is to preserve service and minimize outages to those customers.
Therefore it is necessary to look at the entire power system and all of its components, from generators
and transmission through distribution, customers and their distributed generation and energy uses, to
properly evaluate the risks to reliable, resilient power delivery. The same end-to-end power system
perspective is needed to evaluate the effectiveness and cost-effectiveness of proposed solutions to
electric resilience. Section 2 established that most outages and customer outage-minutes occur due to
failures of the distribution system rather than to generation, and that most of those outages are due to
bad weather. Section 3 reviewed the range of power system threats and showed that the weather,
cyber and physical threats have been increasing and these trends are projected to continue.
This section looks at the measures that power system actors are using to address reliability and
resilience in the customer, distribution system, transmission system, and generation supply levels.
Many of the measures that can best improve reliability and resilience for end-use customers lie far
outside FERC’s jurisdiction over the bulk power system. 4.1 Many measures improve resilience
A wide array of measures and practices are valuable for reducing the risk of power interruptions for end-
use customers, and for speeding service restoration and diminishing customer and societal harm after
an outage occurs. Table 6 shows the Argonne National Lab’s description and summary of the primary
types of resilience measures for the power grid. This table omits important cyber-security measures
(hardening and prevention) and the many measures that can be implemented at the end-use customer
level (energy efficiency, back-up generation, and distributed renewables and storage). It also omits
measures that could protect against GMD and EMP (although the effectiveness of such measures is not
yet fully understood).

40
Table 6 – Electric utility resilience measures and options (Source: Argonne National Lab (2016), Table E2)
Some of these resilience activities are performed by asset owners and customers, others by reliability
coordinators. Other activities are cross-cutting, with responsibility for matters such as emergency
planning and drills, cyber-security and physical security standards, and coordination and learning efforts
(such as the Electricity Information Sharing and Analysis Center (ES-ISAC), North American Transmission
Forum, and EPRI) shared across many actors. Some resilience measures are regulated at the federal or
state level, but many customer options are unregulated.
4.2 Customer reliability and resilience options
Any outage that harms the grid affects customers. Customers have a variety of ways to prepare for the
effects of outages, but their ability to do so depends keenly on whether they can afford to make outage

41
mitigation investments or must wait and bear the outage and its costs (to business, health, possessions
and convenience) with little or no protection.
Before Hurricane Sandy in 2012, few customers had backup generation or energy storage systems.
Years ago, Carnegie Mellon estimated that there were about 12 million backup generators in the U.S.
with over 200 GW of generating capacity;92 another estimate placed about 1,320 MW of backup capacity
in New York City and another 500 MW in Long Island, intended to operate only when the grid failed.93
Since the multi-week outages following Hurricane Sandy and subsequent hurricanes, many people have
come to expect HILF weather events as quasi-routine and unavoidable. These recurring extreme
weather disasters have motivated many customers to rethink the costs and benefits of storm
survivability, including both waterproofing (as by relocating key equipment to higher levels) and
developing backup power supplies. More and more customers have been taking independent action to
improve their ability to survive extended outages comfortably. A few examples:
● After “two hurricanes in two years,” a condominium complex built in the Chelsea section of New
York City in 2014 includes, “a ‘waterproof concrete superstructure’ from the basement to the
second floor that has 13-foot floodgates; waterproofed rooms with submarine-style doors to
protect mechanical and electrical systems and a generator and a pumping system run on natural
gas.”94 Many Class A office buildings have backup generation.95
● Eighty percent of national critical infrastructure (as identified by the Department of Homeland
Security) have an outage mitigation system in place, including alternate generation or back-up
power supplies. Most critical banking and hospital facilities have alternative or backup power.
Of the facilities with internal backup generation, all can meet between 40% to 100% of peak
facility demand, including wastewater treatment plants and electric generators.96
● New York State is funding $12 million for installation of permanent emergency generators at
retail gas stations across down-state New York to ensure that they can function after major
storms and emergencies.97
● After Hurricane Sandy in 2011, residential customers nationwide began buying home
generators, leading to sustained growth in both portable and permanent generator sales.
Manufacturer Generac Holdings estimated in 2012 that only 1.25 million homes already had
permanent generators, with a potential market of 50 million homes. 98
● Tesla and National Grid recently won a $1.25 million grant from the Massachusetts Clean Energy
Center to install Powerwall batteries in 500 homes on the island of Nantucket.99
● System recovery effort installations and proposals for Puerto Rico include installation of
distributed battery systems (as at hospitals), possibly microgrids at customer sites such as water
and wastewater treatment plants, and more distributed solar PV.100
92 Zheng (undated). 93 Gilmore & Lave (undated). 94 Satow (2013). 95 Leighton (2013). 96 Phillips (2016), p. xi. 97 New York State press release (2016). 98 Tita (2012), on Generac’s pre-PV maturity market opportunity estimate. See also DOE’s guidance on backup
generator selection for homeowners to deal with power outages, at https://www.energy.gov/oe/community-
guidelines-energy-emergencies/using-backup-generators-choosing-right-backup-generator-0. 99 Chesto (2018). 100 Walton (2017) and NYPA (2017).
42
● The U.S. Department of Defense has been installing extensive solar PV on many military bases
and a growing number of microgrids on bases to assure resilient power in the event of an attack
or failure of the local grid.101
● Companies like Sonnen and Tesla are selling residential battery storage systems for islanded
backup power, solar-tied storage and off-grid uses.
Each example above represents a significant investment of time and money that customers believe is
necessary to reduce the risk of personal and property harm from increases in real and threatened
outages.102
Customer energy efficiency is also valuable to enhance individual and community outage survivability
and recovery. Energy-efficient buildings and high-performance appliances (particularly refrigerators) let
customers shelter in place longer and help vulnerable populations (like the poor, sick and elderly)
protect their food and medicines longer. High-performance building shells can make an extended
blackout in extreme heat or cold conditions more survivable, and uncomfortable rather than life-
threatening. 103
Customers of all types also invest in insurance and in site-specific protection measures including
emergency supplies (lighting, uninterruptible power supplies for phones and computers, food, and
security) and emergency shut-down procedures for key business and industrial processes. Customers
with older solar PV systems are beginning to replace old non-islanding inverters (that shut off PV
production when the grid shut down) with new smart islanding inverters that can provide power to the
host site when the grid is blacked out.
Many communities are investing in similar strategies, trying to storm-proof and protect critical
community assets to improve their ability to provide continuing critical services and shelter for their
residents if a disaster occurs.
Current Value of Lost Load studies do not recognize and reflect the full cost of the various measures that
customers undertake, as personal resilience efforts, to make expected outages more bearable.
While high-income, critical use and governmental end-users can afford more reliability and resilience
protections (whether self-funded, tax-funded, or otherwise subsidized), many customers have no option
but to suffer through an outage. As discussed previously, the costs of a lengthy outage can be very high.
Insurance (and sometime litigation) may compensate for some of those costs.
In the specific case of system-wide generation shortfalls or localized shortfalls caused by a loss of
transmission infrastructure, utilities implement rolling outages (also called rotating blackouts) –
controlled, temporary interruptions of electric service that are moved from feeder to feeder,
neighborhood to neighborhood sequentially to drop enough load to avoid a cascading outage. These
outages are generally assigned to feeders that serve residential and small businesses and exclude those
feeders that serve critical need customers such as hospitals and emergency services.
101 See, e.g., Gardner (2017), Navigant (2017), Castillo, Johnston (2017). 102 See Ribeiro, Mackres et al. (2015). 103 See Leigh, Kleinberg, et al., (2014).

43
Consider again the generation-based reliability target, “1 in 10 Loss of Load Probability” – the idea that
the power system should have sufficient generation and reserves that there should be less than one
event over a ten-year period when there is insufficient generation to meet load. This criterion was
developed in an age when the grid had relatively inflexible supply and demand, utilities couldn’t protect
specific feeders, and customers had few backup power options. But today, many customers have ways
to self-provide resilience, including generation behind the meter; customers can offer demand response
as a supply option for greater flexibility; and utilities can manage the grid to protect critical care
customers – so there is little rationale for placing all the reliability burden on generation alone.
Customers who value reliability highly are the most likely to have taken those steps, so the value of lost
load for the remaining customers who would be affected by an outage may be lower than previous
estimates. With so many flexibility factors available today, it is time to reexamine whether the 1 in 10
LOLP remains justifiable, and whether the funds used to provide the last increments of generation for a
“1 in 10 LOLP” goal might be better spent on other reliability and resilience measures.
4.3 Distribution-level reliability and resilience options
Since the predominant cause of outages and customer outage-minutes occurs from distribution-level
events and damages, state regulators need to think about how distribution systems can be made more
resilient. This is even more pressing given the implications of long-term extreme weather trends and
sea level rise for the customers and assets at risk.104
Distribution system resilience options (subject to regionally appropriate threats) include:
● Component upgrades, hardening and adaptation
o Reinforced concrete towers in wind-threatened regions
o Line coatings to prevent ice build-up in ice storm-threatened regions
o Locating or moving substations away from flood-threatened locations
o Dead-end structures to keep them upright and prevent sequential (domino) collapse
o Additional circuits and loops to avoid impacts from the loss of a radial connection,
and make critical facilities less critical
o Selective undergrounding of critical lines
● Vegetation management
● Training and exercises to practice responses to credible threats
● Energy efficiency programs (better building shells, better refrigerators) to reduce loads and
help customers survive long-term outages
● Use of distributed generation and storage to reduce dependence on particularly vulnerable
lines and protect critical customers and loads
● Distribution planning, construction and hardening (based on what is appropriate for the
regional risk factors and the system design, e.g. don’t underground distribution
infrastructure in areas with high or growing sea level rise and flooding risk and lower
weather risk to above-ground infrastructure)
● Grid modernization, T&D automation and smart meters, to collect grid condition quickly and
analyze and act on it more quickly, precisely and effectively
● O&M spending for T&D, including preventive and condition-based maintenance and
vegetation management
104 See Keogh & Cody (2013).

44
● Spare equipment programs such as Spare Transformer Equipment Program105 and Grid
Assurance106
● Mutual assistance alliances with other utilities107
● Outage management system
● Priority or critical customer lists to limit the scope of rolling blackouts and prioritize system
restoration
● Expanded weather forecasting and modeling using a wide network of utility-owned weather
stations108
● Use of demand response, automated load-shedding and interruptible rates for fast
frequency response and capacity provision.
Most of these measures are standard practice for distribution utilities and should qualify for regulated
cost recovery as rate-based capital or O&M expenditures.
In one example of how a distribution utility is addressing a growing grid hazard, PG&E recently
announced a new plan to address wildfires and other climate-driven extreme weather, which California
now views as “the new normal.” PG&E’s new plan includes wildfire prevention measures including
monitoring wildfire risks, coordinating response efforts with first responders, and increasing utility
firefighting resources. New safety measures include, “new standards to keep trees away from power
lines, refining protocols for proactively turning off electric power lines [at times of imminent fire risk]
and expanding PG&E’s practice of disabling line reclosers and circuit breakers in high fire-risk areas
during fire season.”109 Grid hardening efforts will include grid modernization and more community
microgrids for islanded operation after a disaster. Given the threat of litigation over wildfire damages,
PG&E is asking California legislators and regulators for “clearer standards for work it must complete to
mitigate the possibility of fires and avoid negligent behavior.”110
4.4 Transmission-level reliability and resilience options
Customer outages from transmission system problems are rare, but when they occur they tend to be
widespread and can be long-lasting. Reliability and resilience are supported through planned
redundancy such that the loss of one line or piece of equipment, however large, does not cause loss of
load. Another strategy is building in a cushion for extreme situations in the form of emergency ratings
which allow more power to flow over assets for a short period of time in the event of a disturbance.
Grid operators schedule line maintenance with reliability considerations in mind.
Resilience planning for transmission should consider a range of plausible threats with near-simultaneous
outages across many elements of the system. The primary goal of such planning should not be to
prevent any loss of load, which for many HILF events is not achievable at a reasonable cost, but rather
minimizing the extent of any disruptions and quickly restoring any outages. PG&E’s plan to reduce
equipment damage and facilitate firefighting with strategic cuts to customer loads is an example of this
approach.
105 See EEI (undated). 106 See AEP (2016). 107 See EEI (2016). 108 Walton (2018). 109 Ibid. 110 Luna (2018).
45
TVA has created a matrix of threats to its transmission system and identified solutions to harden against,
detect, and recover from each.111 TVA has implemented those solutions, including procuring spare
equipment and mobile transformers that enable the utility to respond to many different hazards and
events.
System planning
A first step to planning is the scenario assessment process. For example, MISO’s annual process
“evaluates approximately 6,500 extreme events impacting loss of multiple facilities on the transmission
grid.”112 MISO’s extreme event analysis includes reviewing the following potential bulk power system
outcomes that could result from a variety of threats:
● Loss of all circuits on a multi-circuit right-of-way
● Loss of three or more circuits on a common transmission tower
● Loss of all facilities at a switching station or a load service substation
● Loss of all generating units at a multiple unit generating station
● Loss of all generating units at two independent generating stations
● Loss of gas pipeline segments and all generation served by the pipeline.113
A reliability and resilience review examines such bulk power asset losses for their impact on a number of
operational parameters, such as these listed by PJM:
[T]ransmission design (robust and electrically dense versus sparse networks), proximity
of generation to load centers, geographic dispersity of load and generation resources,
margins on BES facility thermal and voltage limit loadings (i.e., the difference between
normal flow and emergency capability), generator megawatt and megavar reserves,
dynamic megavar reserves on transmission elements, level and availability of resource
reliability attributes, the effectiveness of the system restoration plan including the
proximity of Black Start Units to the next tier of Critical Restoration Units, the fuel
security of both Black Start Units and Critical Restoration Units, and the redundancy of
cranking paths used in restoration.114
Planning criteria should be reviewed with resilience in mind. The standard “n-1” criterion that guides
protection against the largest single contingency may not be enough when multiple contingencies could
happen at once, such as through an intentional attack. Thus “n-k” contingencies are being discussed in
some regions. Considering multiple contingencies may require new analytical tools. Some planners are
transitioning from deterministic planning based on several discrete scenarios to probabilistic analysis
that examines a very large number of possible futures.
Transmission planners are also reviewing the types of contingencies considered in their studies. As
some regions become more gas-dependent, planners are considering whether the loss of critical parts of
fuel supply infrastructure (such as gas pipelines or coal-bearing railroads) should be treated as a single
111 Clem & Grant (2018). 112 MISO (2018), p. 4. 113 MISO (2018), p. 18. 114 PJM (2018b), p. 43. PJM is considering how and whether to incorporate resilience as a stand-alone driver of
new transmission.
46
contingency or evaluated as a potential common mode failure (as opposed to treating every generator
affected by the fuel supply as an independent asset). However, these fuel delivery contingencies
develop more slowly than the instantaneous electrical contingencies that grid planners typically account
for, providing operators with more options for addressing them in real-time. As a result, there is a
argument that fuel contingencies should not be evaluated in the traditional n-1 electrical contingency
planning and operating framework.
The standards that apply to Transmission Planners and Planning Coordinators may need review. NERC’s
“Transmission System Planning Performance Requirements” standard TPL-001-4 was intended to,
“[e]stablish Transmission system planning performance requirements within the planning horizon to
develop a Bulk Electric System (BES) that will operate reliably over a broad spectrum of System
conditions and following a wide range of probable Contingencies.” 115 The standard provides guidance
on assumptions and methods of planning studies. It does not include a requirement to mitigate load
loss resulting from events classified as extreme events.116 NERC and FERC should examine this and other
reliability-based planning standards to ensure that mitigation of the consequences of extreme events
are properly considered in transmission planning.
It is important to account for all of the values and benefits of a given set of facilities, since the system
ends up being used for so many purposes.117 MISO “uses its value-based planning approach to
proactively identify infrastructure that is valuable under a number of long-term future scenarios.”118
Planners should account for uncertainty and attempt to identify “no regrets” infrastructure that is
valuable across a range of possible events and scenarios. They should also include consideration of how
demand-side resources such as demand response, energy storage, customer-owned generation and
other non-wires, non-central generation options could be used to complement, mitigate or complicate
bulk power system assets and scenarios.
Transmission operations
Once a system is planned and built, transmission operators need to operate the grid they have.
Reliability is central to every operating action and system in place, including aggressive efforts to
manage cyber-security.
MISO emphasizes inter-regional congestion management improvements that would support
resilience.119 Large regional RTOs and ISOs improve power flow compared to the balkanized system that
preceded them, but there are still many seams issues between them, especially given some complex
configurations between RTOs.
Better monitoring and control systems can improve reliability during extreme events by improving
situational awareness and analytical support for operations. Grid monitoring is improving beyond
SCADA, as reductions in the cost of synchrophasor technology enable better grid condition data
collection and analysis. Improved measurement of power flows improves reliability by avoiding
unintentional overloading of equipment, reduces costs by allowing higher utilization of equipment, and
115 NERC Transmission System Planning Performance Requirements, standard TPL-001-4. 116 MISO (2018), p. 19. 117 Pfeifenberger & Chang (2016). 118 MISO (2018), pp. 15-16. 119 MISO (2018), p. 45.
47
also benefits reliability and resiliency by increasing situational awareness. Such tools can also improve
reliability and resilience by allowing better understanding and modeling of power system behavior. As
MISO attests, “[s]ystem awareness tools such as synchrophasor information has been beneficial in
understanding the dynamic and transient behavior of the bulk power system” with better modeling and
performance analysis.”120 The lack of situational awareness has been a significant contributing factor in
many real-world blackouts.121
Operators must also consider how to continue operating systems without real-time electronic
communications, monitoring and control systems if those systems are knocked out by a disruption such
as GMD. The North American Transmission Forum is working on this challenge.
Utilities and grid operators already practice many other activities to support reliability and resilience.
Every region has emergency and crisis-management plans that include system restoration plans, disaster
recovery plans, black-start plans, and other measures to ensure that they can recover from a significant
event.122 Many transmission owners have joined mutual assistance programs and spare equipment
alliances for assets such as critical transformers.
Event simulation and training prepare human resources and systems for high-impact events and identify
potential flaws and weaknesses for improvement. Many utilities participate in NERC’s annual GridEx
drills, which simulate cyber and physical threats to practice response and recovery plans and prepare
communications protocols.123 FERC and state commissions can assist by ensuring sufficient participation
and execution of simulations and training programs.
4.5 Generation-level reliability and resilience options
As discussed in Section 3, there is not a demonstrated generation or fuel supply problem (other than in
New England) requiring attention, and reliability standards already account for generator services
needed by the system. It is important to recognize that reliability and resilience in the generation sector
are system concepts, not a generator-specific or generation technology-specific concept. The system
need, whether for routine disturbances such as a plant mechanical failure or a HILF event, is to ensure
that under all circumstances sufficient generation and other resources are collectively available to serve
load.
After events such as the 2011 freeze event in the Southwest and the 2014 Polar Vortex in PJM, NERC
and generators took steps to improve performance in severe cold weather. Whether driven by markets
or regulations, individual generators can act to increase the probability of producing electricity in times
of system stress. Those measures include:
● Weatherization for extreme cold and extreme heat conditions
● Modifying cooling methods to use water more efficiently and avoid closure due to water scarcity
(extreme drought) or over-warm cooling water (extreme heat)
● Develop better plant models and monitoring to better identify operational patterns and manage
plant O&M fuel effectively
120 Ibid., p.31. 121 FERC and NERC (2012). 122 See MISO (2018), p. 19. 123 NERC (2017).

48
● Develop alternate fuel sources (including a potential back-up fuel source) and even firm fuel
procurement to improve fuel assurance under system stress conditions
● Better staff training, drills and operating procedures (potentially including staff dependents as
well) to assure workforce availability and protection under system stress conditions.
4.6 RTO, ISO and reliability coordinator reliability and resilience options
RTOs, ISOs and other reliability coordinators are using many measures to advance bulk power system
resilience. At the operational level, such measures include:
● Improving wide-area situational awareness, as with better data collection inside and beyond the
grid operator’s formal boundaries and better data sources such as synchrophasor monitoring
● Gas-electric coordination and scheduling
● HILF event analysis, preparation and planning
● Emergency procedures and crisis management plans
● Emergency simulations and drills.
All of these functions, like other regional coordinator activities, are responsibilities that come with the
job of grid management. These activities are funded ultimately by payments from end-use customers.
These activities deliver substantive reliability and resilience benefits without requiring market subsidies
or redesign.
Where reliability issues arise within a region, they tend to reflect a specific problem such as local voltage
stability or an extended equipment outage, rather than a broad, generic problem. Often such issues can
be handled using other assets and dispatch patterns. In regions with ISO- or RTO-operated markets,
there are also short-term backstop mechanisms such as Reliability Must-Run Agreements for use in
cases where individual generators may be needed for reliability for a season or two.
Resource adequacy
All regions except ERCOT have planning reserve margins -- long-term planning requirements to ensure
that supply and demand resources equal or exceed forecast load plus a reserve margin. That is the
principal tool to ensure reliability and resilience related to generation supply on the planning timescale.
Some of the reserve margins are overseen by state regulators with vertically integrated utilities, some by
state regulators with restructured markets, and some through federally enforced capacity obligations
(PJM, NYISO, ISO-NE).
Common mode failures – a single problem that can affect multiple generators – are receiving increased
attention. Recent common mode failures include the loss of a gas compressor station or pipeline, or the
loss of multiple coal and nuclear generators due to frozen equipment or cooling water constraints. Until
recently, the loss of any single generator has been considered to be statistically independent – but if
multiple plants are subject to such a “common mode failure,” this assumed independence overstates
reliability. Common mode failures can be addressed through scenario analysis and by reducing the
capacity credit given to generators according to their combined probability of being available.
Further fleet performance analysis is needed (in supply- and demand-side resources, fuels and
capabilities as they affect ability to deliver energy and essential reliability service delivery when needed),
with modeling and testing against many threat scenarios. Effective Load Carrying Capability calculations
49
for renewable resources already account for correlations among different plants’ outputs due to
meteorological patterns, and similar methods could be employed for correlations in conventional
resources’ output.
Markets
The basic mechanisms of competitive centralized and bilateral electric markets are already doing a good
job at delivering reliability. Well-designed markets have economic incentives that reward performance
in providing needed services. The standard Security-Constrained Economic Dispatch (SCED) system
accounts for transmission and generation constraints, and continuously re-dispatches generation to
serve load at all times and places. The inherent flexibility in that system can address many disturbances
automatically.
Well-designed markets will support reliability and resilience by attracting resources at the right time and
place, over the short- and long-run. If prices are predictably high when scarce conditions occur,
generators can be expected to purchase firm fuel supply, develop dual fuel supply capability where
allowed, and improve plant weatherization. Well-designed markets include transparent prices for
energy and reliability services at each time and place, with efficient optimization to sort resources into
their best use, and with open participation from all resources that can potentially contribute.
Out-of-market payments such as Reliability Must-Run (RMR) agreements or cost-based compensation to
specific units reduce market and price transparency. They do not attract the desired behavior from all
potential sources of a service.124 Rather, they pre-judge which resources are able to provide a service
and pay only those resources without assuring that the needed service will be provided. RMR
agreements are necessary only when there is a single source of supply such as for reactive power at a
given location before transmission, load, or other generation options can serve a defined need. In
regions that rely on markets, subsidizing a few resources for specific services prevents other sources
from offering their services, thus reducing reliability and resilience. To partially address this problem,
any RMR agreement should be bid out to see whether other suppliers can deliver the identified system
need.
Generation diversity has been claimed as necessary to attain generation resilience, but it is an imprecise
objective, only indirectly tied to reliability and resilience. Economics dictates the generation fleet’s fuel
mix, but well-designed markets allow each resource to play its best role, including storage and demand-
side resources such as energy efficiency, distributed generation and demand response. Because no
resource excels, either economically or technically, at providing all needed services at all times, the
power system obtains needed services through a division of labor among different, pooled resources
connected to a well-designed transmission grid. For example, coal and nuclear plants do not excel at
providing many essential reliability services, such as flexibility, frequency regulation and response, and
disturbance ride-through. We do not need every resource to provide every reliability service at all times
– we only need aggregate supply from a portfolio of available resources.
Reliability products should be based on engineering needs. NERC recently defined the “Essential
Reliability Services” (ERS) needed for system reliability. These ERS include frequency support, voltage
support, and flexibility/ramping.125 There is no obvious service for resilience that is not already covered
124 Giberson (2017). 125 NERC (2016).

50
by the wholesale power market energy and reliability services; market products should not be defined in
terms of characteristics of supply such as “on-site fuel,” “baseload,” or “high capacity factor” because no
technical justification exists for such products.
Markets should compensate delivered services and avoid or reduce compensation for “attributes” or
“capacity.” Attributes are not the same as products or services. DOE Secretary Perry’s proposed rule
defined a generator’s on-site fuel as an attribute to be compensated, arguing that, “[o]rganized markets
do not necessarily pay generators for all the attributes that they provide to the grid, including
resiliency.”126 The proposed rule essentially defined on-site fuel as an end unto itself, rather than one
potential means to providing customers with something of value, such as energy, frequency support, or
voltage support. Supply characteristics may help some resources provide a service or product, but they
are not the product or service per se. Compensating for raw capacity has been shown to lead to poor
incentives to actually deliver services in New England and PJM, as explained in Section 3.5.
Markets will support reliability and resilience better if they compensate flexibility appropriately. Most
power systems have increasing need for energy increases and decreases that can be delivered on short
notice. NERC’s term “ramping/flexibility” is a suitable product definition describing these capabilities.
The National Renewable Energy Laboratory (NREL) illustrated the flexibility/ramping options with its
“flexibility supply curve” shown in Figure 15 below.127, 128
126 U.S. DOE (2017b), p. 3. 127 Cochran, et al. (2014), p. 11., and Milligan, Frew, Zhou et al. (2015). 128 A new analysis from the Massachusetts Institute of Technology and Argonne National Laboratory suggests that
it is both feasible and valuable for nuclear generators to operate in a more flexible and dynamic mode, to be more
responsive to market and regulation needs. However, that paper does not estimate the capital costs of modifying
the generator equipment and O&M costs needed to enable such operational flexibility, so it is not clear whether
such changes are an economically realistic option. See Jenkins et al. (2018).
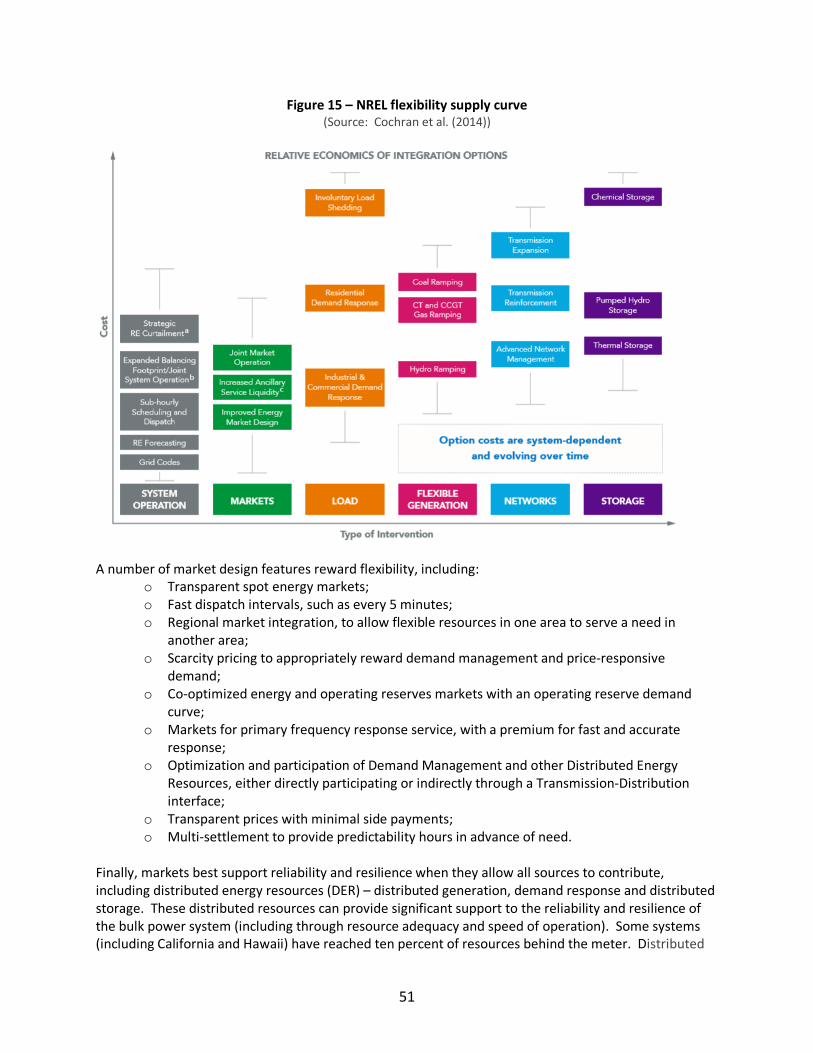
51
Figure 15 – NREL flexibility supply curve (Source: Cochran et al. (2014))
A number of market design features reward flexibility, including:
o Transparent spot energy markets;
o Fast dispatch intervals, such as every 5 minutes;
o Regional market integration, to allow flexible resources in one area to serve a need in
another area;
o Scarcity pricing to appropriately reward demand management and price-responsive
demand;
o Co-optimized energy and operating reserves markets with an operating reserve demand
curve;
o Markets for primary frequency response service, with a premium for fast and accurate
response;
o Optimization and participation of Demand Management and other Distributed Energy
Resources, either directly participating or indirectly through a Transmission-Distribution
interface;
o Transparent prices with minimal side payments;
o Multi-settlement to provide predictability hours in advance of need.
Finally, markets best support reliability and resilience when they allow all sources to contribute,
including distributed energy resources (DER) – distributed generation, demand response and distributed
storage. These distributed resources can provide significant support to the reliability and resilience of
the bulk power system (including through resource adequacy and speed of operation). Some systems
(including California and Hawaii) have reached ten percent of resources behind the meter. Distributed

52
storage systems in particular offer a great source of flexibility for grid operators, if they can be accessed
and used in constructive ways. Access could be direct, through metering and control between the DER
and the bulk power grid operator, or indirect, through a grid architecture that allows interaction at the
transmission-distribution interface. Either way would harness the responsiveness of distributed
resources to grow resource adequacy and help respond to any shortfall or imbalance on the bulk power
system.129
Standards
Along with planning and market solutions, RTOs/ISOs and reliability coordinators use technical
standards to support system reliability and resilience. These can generally be enforced through
interconnection agreements or market rules and are most appropriate for system needs that cannot be
effectively met through a market. Examples include:
● Disturbance ride-through capability standards;
● Frequency response capability standards;
● Reactive power requirements;
● SCADA connectivity;
● Providing high-resolution performance data for asset monitoring and model verification.
Interconnection requirements and standards should be applied in a non-discriminatory way across all
bulk power system-connected generation sources.130
4.7 Conclusions
The resilience measures reviewed above are available to, and practiced by, actors at every level of the
end-to-end power system. These measures include the wide array of activities and investments that
utilities undertake to make their systems more reliable and resilient. They also cover a large and costly
set of investments that customers make because they assume that utility efforts, no matter how well-
intentioned and effective, cannot fully protect the customers from extended power outages.
The National Academies of Science electric system resilience study warns:
In principle, an infinite amount of money could be spent hardening and upgrading the
system with costs passed on to ratepayers or taken from shareholder returns. However,
utilities and their regulators (or boards) are typically conservative in these investments.
All mitigation strategies have cost-performance trade-offs, and it may be difficult to
estimate the actual reduction in risk or improvement in resilience associated with a
specific action. In most cases, an electricity system that is designed, constructed, and
operated solely on the basis of economic efficiency to meet standard reliability criteria
will not be sufficiently resilient. If some comprehensive quantitative metric of resilience
129 Kristov (2017). 130 In a violation of this principle, the voltage and frequency ride-through standards applied to wind generators
under FERC Order 661A are more stringent than those for other generators. The ability of all resources to ride-
through grid disturbances is critical for power system reliability and resilience, so if the Commission would like to
address generation resilience it could expand the Order 661A standard to other generators.
53
becomes available, it should be combined with reliability metrics to select a socially
optimal level of investment.
This warning points to the need to assess and prioritize among all power system resilience measures.
Such prioritization should improve the system’s collective reliability and resilience effectiveness subject
to societal resource allocations, not just bulk power system costs and benefits. It should also promote
an appropriate balance between funds spent to improve reliability and resilience at the distribution and
customer level, versus those spent on generation and transmission. This is the topic of Section 5. Section 5 | Evaluating and comparing resilience performance effectiveness and
cost- effectiveness
Section 4 reviewed the wide set of tools and measures that customers, power system actors and
policymakers can use to improve power system reliability and resilience and reduce the impacts of
outages upon electricity consumers. Ideally customers’ dollars would be allocated to the highest impact
activities until incremental spending on any activity provides equal marginal benefit, as opposed to
spending excessive resources in one area for little additional benefit while higher value actions are left
unaddressed. The challenge is to evaluate the marginal impacts of these various solutions for reducing
both the number of outages and the number of customer outage-minutes, such that each action makes
a meaningful contribution to customer resilience. Federal and state regulators should ask how each
solution (individually and in suites of solutions) might reduce the frequency, magnitude and duration of
customer outages relative to the entire scope of customer outages, not just those resulting from
generation- or transmission-level causes.131
As Sections 2 and 3 established, many outages happen – most arising from bad weather affecting
distribution systems, and some noticeably large events arising from the combination of extreme events
harming distribution, transmission and some generation assets. Customers ultimately pay the price for
these outages, whether through their electric rates or their own personal losses and expenditures, and
most customers have come to expect that more outages will happen. The question therefore arises, if
we cannot prevent and mitigate all the hazards and threats that cause outages, and can mitigate some
but not all of their consequences, which risks should we take, what level of resilience and mitigation cost
are we willing to bear, and how should we choose between resilience measures? This paper cannot
answer the risk question, but it does offer a path for assessing and selecting resilience options.
131 All of the asset owners and policy makers with responsibility over the grid should be careful not to allow
confirmation bias or the availability heuristic to narrow or constrain consideration of valid resilience-improving
options that might help and protect customers and communities. Confirmation bias is the human tendency to
favor information and options that lie within and confirm our existing knowledge and beliefs, and to ignore or
dismiss ideas and options that lie outside our current knowledge and comfort range. The availability heuristic
drives people to overestimate the importance of information that is available to them, and ignore the possibility
that other, yet-unrecognized factors might be equally or more important. In the case of a federal regulator or
NERC, confirmation bias and the availability heuristic might lead them to assume that because their scope of
responsibility is bulk power system reliability: 1) they need to protect the system rather than the end-user; 2) the
only outages that matter are those arising on the bulk power system; 3) the only resilience measures that matter
are those relevant to the bulk power system; and, 4) the way to measure effectiveness is in terms of power system
characteristics rather than customer and community impacts.
54
Since the vast majority of customer outages result from outages on the distribution system and to a
lesser extent the transmission system, many effective and cost-effective ways to reduce outages and
improve resilience start at the distribution and transmission levels. Grid managers cannot prevent
lightning strikes or storms, but they can act to reduce the likelihood that a lightning strike or falling tree
limbs can take out a transmission or distribution line. In contrast, generation supply shortages rarely
cause customer outages, and when they do it is almost always due to an extreme weather event or
operational failure that also affects the transmission and distribution systems. Because the marginal
benefit for customers of protecting generation is quite low when reserve margins are healthy,
generation-related solutions are typically not the most cost-effective means of reducing customer
outages on power systems today.
Regulators and grid actors can find efficiencies by taking an all-hazards perspective, recognizing that
most effective measures protect power system assets and processes rather than trying to mitigate
against a specific threat. This approach eases the challenge of estimating the frequency and impact of
specific HILF events with difficult-to-quantify probabilities of occurrence.
5.1 A resilience measure evaluation process
A constructive resilience analysis process will define resilience goals, articulate system and resilience
metrics, characterize threats and their probabilities and consequences, and evaluate the effectiveness of
alternative resilience measures for avoiding or mitigating the threats.132 Such a process should ensure
that the resilience metrics and analyses of threats and mitigation measures recognize impacts on the
electricity end user, not just upon the physical elements of the power system.
Given the diverse causes for power outages and the widening set of threats across the power system,
industry leaders should look for portfolios of solutions that address multiple hazards, rather than
expecting that one or two magic bullets will solve all resilience and reliability problems. It is critical to
evaluate portfolios of complementary resilience-improving measures that can deliver significant
probability reductions in outage scale, frequency and duration for different customer classes in a
collectively cost-effective manner.
The following questions should be considered in evaluating individual resilience and reliability measures,
and then in building a risk-based portfolio of resilience solutions to deal with a set of outage threats
with intelligently constructed scenarios and probabilities of outage cause, frequency, duration and scale:
● The measure’s efficacy in reducing outage probabilities, frequency, scale and duration for
different customer groups
● What part of the power system it affects (distribution, transmission, generation)
● What stage of the reliability-resilience spectrum it affects (e.g., long-term planning, operations,
restoration and recovery, customer survival)
● What are the costs of the measure and how would the necessary resources be procured?
● If it is controllable, who controls it?
● How many types of outage causes or consequences the measure can mitigate
● Does the measure have any significant vulnerabilities?
132 The resilience analysis process laid out by the Sandia National Laboratory, in Watson, Guttromson et al. (2015),
is a useful starting point for this task.
55
● Is this measure already being performed under current practices, standards or regulatory
requirements?
● Given the impact of the measure upon multiple threats, how cost-effective is the measure in
terms of dollar cost per reduction in frequency of outages and customer outage-minutes (or
change in SAIDI)?
● Is there a better way to protect customers against outages than this measure? (For instance,
could customers survive a large outage better with an investment in more energy-efficient
buildings than in more transmission automation or coal-fired generation? Could a non-wires
measure such as distributed generation and storage protect customers better than a new
transmission line or generator?)
● Given that many customers are already taking precautions to protect themselves against
outages, does the measure deliver a substantive incremental reduction in the risk or duration of
outage-minutes, or a meaningful improvement in survivability, that customers aren’t already
positioned to bear?133
Quantifying the impact of a solution for reducing customer outages, particularly for transmission and
distribution system solutions, depends on regional risk factors and will be highly system-specific. For
example, undergrounding may be effective for a system that is frequently exposed to high winds or ice
storms, but would be ill-advised for areas that are prone to flooding and storm surge.
In many cases, precise calculations of benefits may not be feasible. First, the probability of many threats
is uncertain, particularly for HILF events and weather-related events that are increasing in frequency due
to climate change. In addition, many solutions for improving resilience have multiple benefits, many of
which cannot be precisely quantified -- for example, energy efficiency and transmission can reduce
emissions and energy costs as well as reduce customer vulnerability to outages,134 while undergrounding
distribution lines may improve community aesthetics as well as reduce vulnerability to high winds, ice
and tree contacts. Similarly, investments in generating capacity, energy storage, and demand response
resources increase supply capacity reserve margins while providing energy, flexibility, T&D investment
deferral, and other ancillary services. Careful resilience analysis will not assign the full cost of a multi-
benefit measure to the resilience benefit alone, but adjust the measure cost down to reflect the value of
these other benefits.
At the portfolio level:
● Can you construct a portfolio of diverse resilience solutions that effectively reduce risk and
protect the power system and customers against a wide variety of threats?
● Does addition of a specific measure to a resilience portfolio make the overall suite of measures
more effective at reducing the probability of outages and their impacts on customers?
● Does the portfolio of measures have any significant common vulnerabilities?
● Does the portfolio of measures have any significant customer equity implications? (For instance,
if we expect customers to bear the incremental costs of their own protection, and the losses
133 This was an easier question to ask and answer before the Hurricane Maria destroyed Puerto Rico’s grid and
redefined our collective expectations about the magnitude of a disastrous, widespread electric outage, and how an
electric system could or should be restored and redesigned to better protect customers and essential services from
such disasters. 134 For example, SPP documented the multiple benefits of transmission, including reliability benefits like reduced
loss of load probability, in SPP (2016), p. 29.
56
from any outages they can’t protect themselves from, then major outages will have a
disproportionately large impact on lower-income customers who can’t buy backup generators
and energy-efficient housing).
● How are the overall costs of the portfolio allocated? Which costs are already being incurred
(e.g., cyber-security and emergency drills), which get absorbed into utility retail customer
charges (e.g., basic levels of distribution upgrades, energy efficiency programs and tree-
trimming), which would be allocated to generators to be added into utility rates or competitive
market bids (weatherization or model development), and which could be spread across all
customers in a region (such as power plant RMR payments) or taxpayers (such as community
emergency shelters)?
● If all the portfolio measures work as anticipated, what outage risks and consequences would
remain for customers and for the power system? Are those consequences unavoidable or
extraordinarily costly to mitigate further?
5.2 Use outage frequency, duration, magnitude and costs as the bases for comparing
resilience options
It is possible to identify reliability and resilience investment costs and O&M costs, but it is harder to
identify and monetize the benefits of those investments to customers, the utility and society as a
whole.135 Regulators would like to identify specific investments for reliability and resilience (installation
and capital costs, financing cost and O&M costs) and to link those to impact on number of outage events
and reductions in restoration time using SAIDI and SAIFI.136 But regulators have a hard time estimating
the value of those benefits to customers.137
Customer outage frequencies, durations, magnitudes and their costs to customers should be a starting
point for assessing and comparing between resilience solutions, and for building portfolios of net-
beneficial solutions. It is important to accurately account for the impact of a solution on both the
frequency and duration of customer outages (for instance, two short outages totaling 50,000 outage
minutes might impose less total customer cost than a single outage of the same total duration), and
properly distinguish the impact of distribution-system solutions on different customer classes (for
example, small commercial and industrial customers experience far higher outage costs than other types
of customers).138 Tools such as LBNL’s outage calculator139 incorporate that data and provide useful
input into the analytic process for finding the best solutions for reducing customer outages.
The benefit-cost ratio of different solutions may be highly dependent on the topology of the
transmission and distribution systems. For example, undergrounding will be much more cost-effective
in a dense urban center than in a rural area with few customers per mile of line. A branching
distribution network with a few critical primary lines is more likely to find hardening those lines to be
cost-effective than a looped system with redundancy that reduces the risk from the loss of primary lines.
Because of these system differences, generalized data that can be used to assess the effectiveness of
transmission and distribution system solutions for reducing outages across different systems are
typically not available.
135 LaCommare, Larsen & Eto (2017), p. 4. 136 Ibid., pp. 2-3. 137 Ibid. 138 Sullivan, Schellenberg & Blundell (2015). 139 LBNL ICE Calculator.

57
Five analyses of reliability and resilience investments implement parts of the analytical approach
outlined above and merit review:
● “NARUC and MDPSC Cost-Benefit Analysis of Various Electric Reliability Improvement Projects
from the End Users’ Perspective,” Analysis Summary, November 15, 2013, by Mark Burlingame
& Patty Walton.140 It quantified the costs to customers of extended outages and reviewed the
mitigating measures to avoid outages, reduce outage duration, and restore power. The study
concluded that a number of mitigation measures were well-justified by the utility cost
reductions and customer benefits gained, but that further data collection is needed.
● “Formal Case No. 1116, In the Matter of the Application for Approval of Triennial
Underground Infrastructure Improvement Projects Plan, Order No. 17697,” DC Public Service
Commission, November 12, 2014.141 This analysis examined the prudency of Pepco’s
undergrounding proposal (undergrounding being a frequent and costly proposed remedy to
improve urban distribution system reliability). It scrutinizes the undergrounding costs and
tradeoffs with respect to continuing activities such as tree-trimming and pole inspection. There
is limited discussion of the potential impacts of the project upon customer outages, although it
does acknowledge that by undergrounding these specific 6% of feeders through this project, it
should account for 31.6% of customer interruptions and 35.9% of customer outage-minutes.142
The PSC uses Value of Service methods to calculate benefits from the project.
● “Valuing the Resilience Provided by Solar and Battery Energy Storage Systems,” NREL and
Clean Energy Group, January 2018.143 This paper summarizes a more detailed study that walks
through the elements of project cost estimation and benefits estimation. It considers the
impact of resilience – particularly, how many hours that a given PV and storage system can
power critical loads during an outage – on project sizing and shows how assumptions about the
value of resilience can affect the ultimate project economics.
● “Have Mandatory Standards Improved Reliability? Evidence, findings and raison d’etre,” by
Stephen Huntoon, Fortnightly Magazine, January 2015.144 This article scrutinizes the assertion
that NERC’s reliability standards have improved reliability by reducing the number of non-
weather-related significant outages due to transmission-related events. Huntoon assumes an
average firm load loss per outage and average outage duration and applies the FERC-accepted
Value of Lost Load dollar value to determine the annual value of the avoided load loss. This
figure turns out to be very small compared to the annual budget for statutory functions for
NERC and its Regional Entities, leading the author to conclude that because mandatory
reliability standards are developed absent cost-benefit analysis, we are paying too much for
them because the bulk of outages remain outside the influence of those standards.
● “Evaluation of the DOE’s Proposed Grid Resiliency Pricing Rule,” by Brattle Group’s Metin
Celebi et al., October 23, 2017.145 Section III of this analysis lays out the process and
assumptions required to estimate the payments proposed under the proposed rule. Additional
details and assumptions are provided in Appendix B of the Brattle analysis.
140 Watson & Burlingame (2013). 141 DC PSC Order No.17697 (2014). 142 DC PSC Order No. 17697 (2014), p.86. 143 McLaren & Mullendore (2018). 144 Huntoon (2015). 145 Celebi & Chang et al. (2017).
58
Regulators, utility executives, and other decision makers have enough information about the causes and
consequences of power system outages to think about how to allocate resilience resources across all
levels of the system, rather than only looking at the levels within their own jurisdictions. The regional
and distribution system-specific nature of resilience argues for a greater focus on state regulators and
distribution utilities in identifying relevant risk factors and appropriate solutions for their systems, and
less effort by FERC and ISOs to view wholesale generation markets as the primary solution for improving
resilience.
FERC and state commissions should work with the Department of Energy to explore how to formalize
some of the analytical questions suggested here and consider how to coordinate these analyses across
jurisdictions and power system levels. Although jurisdictional issues prevent a single entity from
directing investments across the distribution, transmission, and generation sectors, using common
impact measures and benefit-cost metrics across all levels and sectors should reveal to all parties which
investments are cost-effective.
5.3 Suites of threat-agnostic measures tend to have greater cost-effectiveness
Because most customer outages and outage-minutes are due to weather-related and distribution-level
events and damage, few of the resilience measures targeted to generation or transmission will reduce
the impact of a hurricane or flood upon customer outage-minutes. But tree-trimming and appropriately
designed distribution pole hardening could have a strong outage prevention impact by addressing and
mitigating the damages caused by a number of hazards. Measures that are “threat-agnostic,” providing
system-wide resilience against a wide range of known and unpredictable threats, may be much more
cost-effective than measures that only address a single threat.146
Grid monitoring, transmission automation and mutual assistance programs are good examples of
effective multi-hazard solutions. Several utilities that have invested in grid modernization methods
including extensive advanced metering, outage management and distribution automation systems,
report that they used these systems to significantly speed service restoration for many customers. A
good example is Florida Power & Light, as explained by CEO Eric Silagy:
Since 2006, Florida Power & Light Company has invested more than $3 billion to build a
stronger, smarter, and more resilient energy grid. We have strengthened transmission
lines, replaced poles, and cleared vegetation from more than 150,000 miles of power
lines. We’ve also invested in smart grid technology, including nearly 5 million smart
meters and more than 83,000 intelligent devices like automated feeder switches.
[Hurricane] Irma [2017] was our first major test since Hurricane Wilma in 2005, and our
investments were invaluable. Fewer than half as many substations were affected, and
those that were impacted came back online more quickly. We lost substantially fewer
poles, and automated switching helped to avoid nearly 600,000 customer interruptions.
Irma was a larger and stronger storm than Wilma – knocking out power to more than 90
percent of our customers – but all of our impacted customers were restored within 10
days, compared with 18 days following Wilma.147
146 See Preston, Backhaus et al. (2016). 147 Silagy (2018), p. 26. 2018, p. 26.

59
Similarly, CenterPoint reports that its distribution automation investments allowed them to avoid
almost 41 million outage minutes following Hurricane Harvey and associated flooding in Houston in
August 2017. CenterPoint’s advanced meters executed 45,000 operational orders remotely at 97%
performance accuracy, increasing restoration efficiency and speed. Even with these advantages,
CenterPoint had 1.2 million electric customers affected and 755 million total minutes of customer
outages over 10 days.148
Mutual assistance programs are particularly effective for major event outage restoration and recovery.
For Hurricane Harvey, CenterPoint used 2,200 employees and 1,500 contractors and mutual assistance
personnel from 7 states.149
TVA’s resiliency planning analyzed spare equipment needs under a variety of threat and hazard scenario.
The transmission provider now uses a small set of approved standard transformer designs with a high
degree of interchangeability, and also stocks spare bushings and components for these standard units.
This inventory of spare equipment will serve the system in the face of threats that include flooding,
tornados, physical attack, earthquakes, GMD and more.150
5.4 Generation resilience solutions tend to be less impactful for customer resilience than
T&D and operations measures
Since so few power outages experienced by customers are caused by generation or fuel shortages,
generation investment is unlikely to be a cost-effective way to reduce customer outages relative to
transmission and distribution system measures.
In planning to reduce even further the number of customer outages that could result from a generation
supply shortfall, grid operators use transmission expansion and more coordinated grid operations to
import supply from other regions. Transmission imports are often more cost-effective solutions than
adding new generation. An Xcel Colorado analysis found that 200 MW of transmission ties with
neighboring Balancing Authorities enabled a reserve margin reduction from 19.2% to 16.3% while
meeting the same standard for LOLP.151 Similarly, SPP found that the transmission upgrades it has built
provide $1.354 billion in net present value benefits by reducing the region’s LOLP and reserve margin
needs.152 MISO and PJM have each found that the reduction in reserve margin needs enabled by the
geographic diversity of supply and demand across their large footprints is the single largest benefit they
provide, worth over $1 billion per year in PJM and $2 billion per year in MISO.153
Transmission is particularly valuable for mitigating outages broadly, and for mitigating supply shortages
caused by extreme events. Because weather and other extreme events tend to be geographically
limited in scope, one region rarely experiences its extreme supply shortfall at the same time as all
neighboring regions. For example, during the Bomb Cyclone event in early January 2018, the low
temperature anomaly was far worse in eastern PJM than in western PJM, causing wholesale electricity
prices in eastern PJM to be consistently hundreds of dollars per MWh higher than in western PJM.
148 Greenley (2018). 149 Ibid., p.10. 150 Clem & Grant (2018). 151 Xcel (2011), p. 2-9. 152 SPP (2016). 153 PJM Value Proposition, MISO Value Proposition.
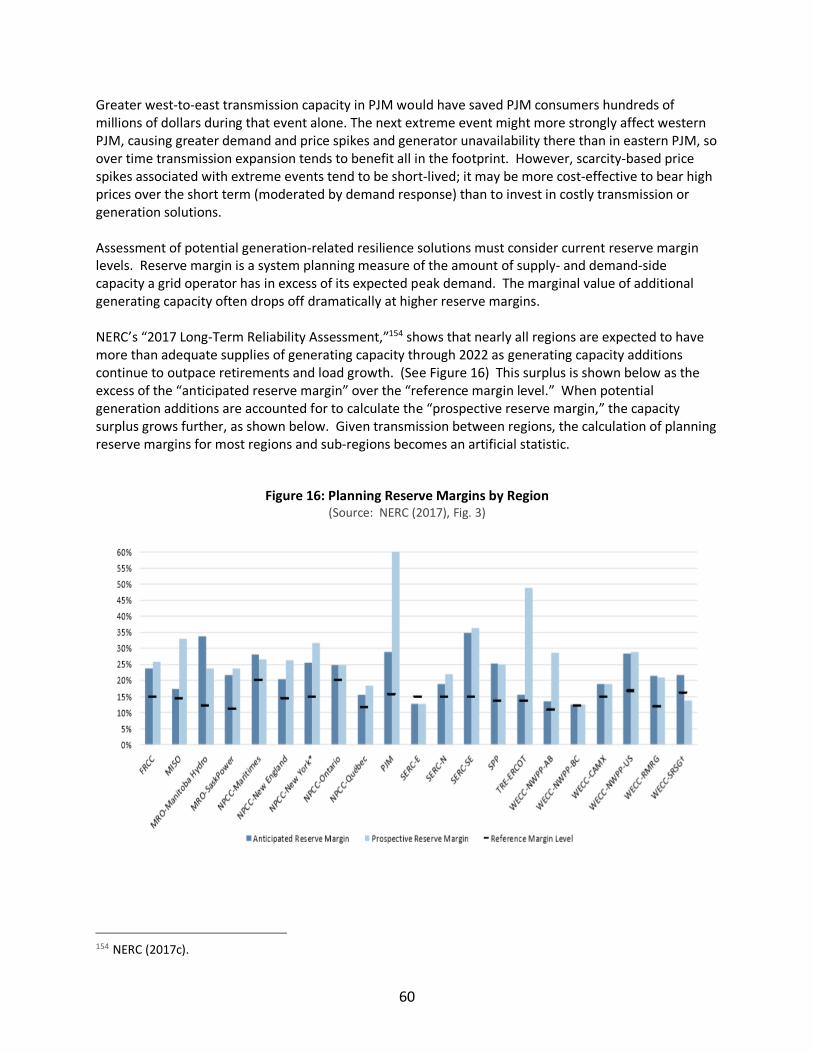
60
Greater west-to-east transmission capacity in PJM would have saved PJM consumers hundreds of
millions of dollars during that event alone. The next extreme event might more strongly affect western
PJM, causing greater demand and price spikes and generator unavailability there than in eastern PJM, so
over time transmission expansion tends to benefit all in the footprint. However, scarcity-based price
spikes associated with extreme events tend to be short-lived; it may be more cost-effective to bear high
prices over the short term (moderated by demand response) than to invest in costly transmission or
generation solutions.
Assessment of potential generation-related resilience solutions must consider current reserve margin
levels. Reserve margin is a system planning measure of the amount of supply- and demand-side
capacity a grid operator has in excess of its expected peak demand. The marginal value of additional
generating capacity often drops off dramatically at higher reserve margins.
NERC’s “2017 Long-Term Reliability Assessment,”154 shows that nearly all regions are expected to have
more than adequate supplies of generating capacity through 2022 as generating capacity additions
continue to outpace retirements and load growth. (See Figure 16) This surplus is shown below as the
excess of the “anticipated reserve margin” over the “reference margin level.” When potential
generation additions are accounted for to calculate the “prospective reserve margin,” the capacity
surplus grows further, as shown below. Given transmission between regions, the calculation of planning
reserve margins for most regions and sub-regions becomes an artificial statistic.
Figure 16: Planning Reserve Margins by Region (Source: NERC (2017), Fig. 3)
154 NERC (2017c).
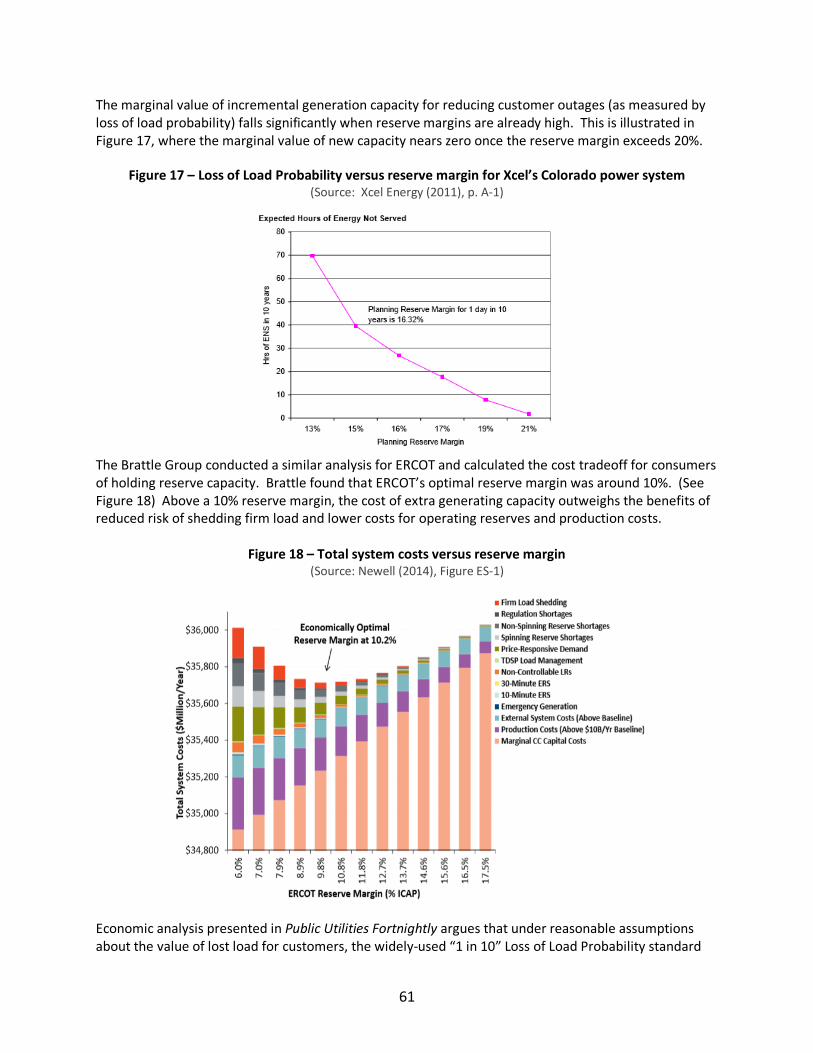
61
The marginal value of incremental generation capacity for reducing customer outages (as measured by
loss of load probability) falls significantly when reserve margins are already high. This is illustrated in
Figure 17, where the marginal value of new capacity nears zero once the reserve margin exceeds 20%.
Figure 17 – Loss of Load Probability versus reserve margin for Xcel’s Colorado power system (Source: Xcel Energy (2011), p. A-1)
The Brattle Group conducted a similar analysis for ERCOT and calculated the cost tradeoff for consumers
of holding reserve capacity. Brattle found that ERCOT’s optimal reserve margin was around 10%. (See
Figure 18) Above a 10% reserve margin, the cost of extra generating capacity outweighs the benefits of
reduced risk of shedding firm load and lower costs for operating reserves and production costs.
Figure 18 – Total system costs versus reserve margin (Source: Newell (2014), Figure ES-1)
Economic analysis presented in Public Utilities Fortnightly argues that under reasonable assumptions
about the value of lost load for customers, the widely-used “1 in 10” Loss of Load Probability standard
62
for the acceptable frequency of outages is about 10 times more stringent than the level of capacity
investment that optimally benefits customers.155 That article goes further to argue that, accounting for
the fact that a typical rolling blackout only affects about 10 percent of the customers, the 1 day in 10
years metric is about 100 times too conservative. In competitive wholesale markets, more of the risks
and costs of maintaining excess levels of generation (and other resources) fall on asset owners and
shareholders and less falls on captive end-use customers – but it may be useful for state and federal
regulators and policy advocates to think about whether and how to update current power system
planning standards. Raw capacity (MW) alone is no longer as valuable as it used to be. As discussed in the previous section,
today we need supply and demand resources that can deliver flexible services such as fast frequency
response, fast ramping speed and voltage support, and do so reliably when they are needed. Price-
responsive demand can play a key role in enabling customers to express their true value of lost load.
This is widely used in New England, where customers can reduce demand or disconnect entirely in
exchange for a payment that reflects their willingness to curtail. In ERCOT, large customers receive extra
payments for participating in the Load Acting as a Resource program, to automatically shed some
portion of site load to provide fast frequency response. Such programs reduce the need for additional
generating capacity that costs more than these marginal customers are willing to accept for curtailing
their energy use.
5.5 Conclusions about relative value of resilience measures
Summarizing the ideas discussed in this section, Figure 19 offers the authors’ ballpark representation of
how the resilience and reliability options discussed in Section 4 might rank in terms of relative value per
outage avoided and customer survivability improved.
155 Wilson (2010).

63
Figure 19 – Relative values of various resilience measures, compared on a
$/customer outage impact basis
The authors encourage others to undertake the data collection and analysis required to assess reliability
and resilience measures at all power system levels using the customer-centric analytical approach
described above. Since most outages occur due to problems at the distribution level and long-duration
outages are caused primarily by severe weather events, it logically follows that measures that
strengthen distribution and hasten recovery would be highly cost-effective. In contrast, measures to
make generation more resilient are likely to have little impact on outage frequency, duration or
magnitude or on customer survivability.
Federal and state regulators do not coordinate the financial obligations they place upon the electric
providers and actors which they regulate. Electric utilities and customers must deal with the
consequences and costs of rules and rulings intended to protect them in the name of reliability and
resilience, even when these well-intended policies crowd out or preclude more useful and impactful
investments and actions. There is a great risk that if regulators and stakeholders do not conduct the
type of analyses suggested here, we will end up committing significant amounts of money and effort to
improve resilience, yet have little constructive impact on the probabilities or actual levels of future
customer outages.
64
Bibliography American Electric Power (2016), “Energy Companies Launch Critical Transmission Equipment Sparing Company,”
May 9, at https://www.aep.com/newsroom/newsreleases/default.aspx?id=1947.
American Wind Energy Association (2017), http://awea.files.cms-
plus.com/FileDownloads/pdfs/Services%20Graphic.pdf.
Analysis Group (2017), “Electricity Markets, Reliability and the Evolving U.S. Power System,” June, at
http://www.analysisgroup.com/news-and-events/news/analysis-group-report-finds-that-the-transition-
underway-in-the-us-power-system-is-not-harming-reliability/
Anderson, G. Brooke & Michelle Bell, (2012), “Lights out: Impact of the August 2003 power outage on mortality in
New York, NY,” Epidemiology, March 2012, at https://www.ncbi.nlm.nih.gov/pmc/articles/PMC3276729/.
Argonne National Laboratory (2016), “Front-line Resilience Perspectives: The Electric Grid,” November, at
https://www.energy.gov/sites/prod/files/2017/01/f34/Front-
Line%20Resilience%20Perspectives%20The%20Electric%20Grid.pdf.
Bade, Gavin (2018), “ISO-NE designates 1,600 MW of gas generation as Reliability Must Run,” Utility Dive, April 4,
at https://www.utilitydive.com/news/iso-ne-designates-1600-mw-of-gas-generation-as-reliability-must-
run/520567/ .
Brattle Group (2016), “Advancing Past “Baseload” to a Flexible Grid: How Grid Planners and Power Markets Are
Better Defining System Needs to Achieve a Cost-Effective and Reliable Supply Mix,” June, at
http://files.brattle.com/system/publications/pdfs/000/005/456/original/advancing_past_baseload_to_a_
flexible_grid.pdf?1498246224.
CAISO (2018), “Comments of the California Independent System Operator Corporation in response to the
commission’s request for comments about system resiliency and threats to resilience,” March 9, 2018,
FERC Docket No. AD18-7. pp. 31-32, at https://www.caiso.com/Documents/Mar9_2018_Comments-
GridResilience_AD18-7.pdf.
CAISO, First Solar, NREL, “Using Renewables to Operate a Low Carbon Grid,” at
www.caiso.com/Documents/UsingRenewablesToOperateLow-CarbonGrid.pdf .
Campbell, Richard (2016), “Testimony – Blackout! Are we prepared to manage the aftermath of a cyber-attack or
other failure of the electrical grid?”, Memorandum to the U.S. Congress, House Committee on
Transportation and Infrastructure, Subcommittee on Economic Development, Public Buildings, and
Emergency Management, Congressional Research Service, April 11, at
https://transportation.house.gov/uploadedfiles/2016-04-14-campbell.pdf.
Castillo, “Military Installation Energy Resilience and Microgrid Overview Paper,” undated, at
https://www.acq.osd.mil/eie/Downloads/IE/ER%20and%20Microgrid%20One-Pager.pdf.
Celebi, Metin, Judy Chang et al. (2017), “Evaluation of the DOE’s Proposed Grid Resiliency Pricing Rule,” prepared
for NextEra Energy Resources, October 23, at
http://files.brattle.com/files/11635_evaluation_of_the_does_proposed_grid_resiliency_pricing_rule.pdf .
Chesto, Jon (2018), “For backup power, batteries join the mix as prices come down,” Boston Globe, March 7, at
https://www.bostonglobe.com/business/2018/03/06/for-backup-power-batteries-join-mix-prices-come-
down/UyQ0JkaUtc21PjGKL9buKN/story.html.
65
Clem, Clayton & Ian Grant (2018), “TVA Builds Resilience,” T&D World, March 20, at
http://www.tdworld.com/transmission/tva-builds-resilience.
Cochran, J., et al., (2014) “Flexibility in 21st Century Power Systems,” 21st Century Power Partnership, at
https://www.nrel.gov/docs/fy14osti/61721.pdf
DC PSC Order No. 17697 (2014), November 12, at
https://edocket.dcpsc.org/apis/pdf_files/e8c918a0-d080-4982-83a6-a649d7f64966.pdf .
Doggett, Trip (2011), ERCOT, “Review of February 2, 2011 Energy Emergency Alert (EEA) Event,” February, at
http://www.ercot.com/content/meetings/board/keydocs/2011/0214/Review_of_February_2,_2011_EEA
_Event.pdf.
Dunietz, Jesse (2017), “Is the Power Grid Getting More Vulnerable to Cyber-attacks?” Scientific American, August
23, at https://www.scientificamerican.com/article/is-the-power-grid-getting-more-vulnerable-to-cyber-
attacks/ .
Edison Electric Institute (undated), “Spare Transformers,” at
http://www.eei.org/issuesandpolicy/transmission/Pages/sparetransformers.aspx.
Edison Electric Institute (EEI) (2016), “Understanding the Electric Power Industry’s Response and Restoration
Process,” October, at
http://www.eei.org/issuesandpolicy/electricreliability/mutualassistance/Documents/MA_101FINAL.pdf.
Electric Reliability Council of Texas (ERCOT) (2018), “Joint Comments of the Electric Reliability Council of Texas, Inc.
and the Public Utility Commission of Texas,” submitted to FERC in Docket No. AD18-7-000, March 9, 2018.
Eto, Joseph (2017), “The National Cost of Power Interruptions to Electricity Customers – A Revised Update,”
presentation to the Distribution Reliability Working Group, 2017 IEEE PES Joint Technical Committee
Meeting, January 10, p. 12, at
https://www.google.com/url?sa=t&rct=j&q=&esrc=s&source=web&cd=2&ved=0ahUKEwiExvDd3_LZAhW
Lx4MKHTZpDrQQFggvMAE&url=http%3A%2F%2Fgrouper.ieee.org%2Fgroups%2Ftd%2Fdist%2Fsd%2Fdoc
%2F2017-01-
10%2520National%2520Cost%2520of%2520Power%2520Interruptions%2520to%2520Electricity%2520Cu
stomers%2520-%2520Eto.pdf&usg=AOvVaw1U2W0mBZxwIgZe7TB9AaaL.
Eto, Joseph H. and Kristina Hamachi LaCommare (2008), “Tracking the Reliability of the U.S. Electric Power System:
An Assessment of Publicly Available Information Reported to State Public Utility Commissions,” for the
Ernest Orlando Lawrence Berkeley National Laboratory, October 2008.
Executive Office of the President (2013), “Economic Benefits of Increasing Electric Grid Resilience to Weather
Outages,” August, at https://www.energy.gov/downloads/economic-benefits-increasing-electric-grid-
resilience-weather-outages.
Federal Energy Regulatory Commission (FERC) (2018), Order 162 FERC ¶ 61,012, Docket RM18-1-000, Order
Terminating Rulemaking Proceeding, Initiating New Proceeding, and Establishing Additional Procedures,
Docket No. AD18-7, January 8, 2018, at
https://elibrary.ferc.gov/idmws/common/OpenNat.asp?fileID=14792904.
FERC, Cyber & Grid Security, at https://www.ferc.gov/industries/electric/indus-act/reliability/cybersecurity.asp.
66
FERC and NERC (2012), “Arizona-Southern California Outage on September 8, 2011,” April, at
https://www.ferc.gov/legal/staff-reports/04-27-2012-ferc-nerc-report.pdf.
Finster, M., J. Phillips & K. Wallace (2016), Argonne National Laboratory, “Front-Line Resilience Perspectives: The
Electric Grid,” prepared for U.S. DOE, November, at https://www.osti.gov/biblio/1344876.
Gardner, Timothy (2017), “U.S. military marches forward on green energy, despite Trump,” March 1,
https://www.reuters.com/article/us-usa-military-green-energy-insight/u-s-military-marches-forward-on-
green-energy-despite-trump-idUSKBN1683BL
Giberson, Michael (2017). “Integrating Reliability Must-Run Practices Into Wholesale Electricity Markets,” R Street
Institute. http://www.rstreet.org/policy-study/integrating-reliability-must-run-practices-into-wholesale-
electricity-markets/.
Gilmore, Elisabeth A. & Lester B. Lave (undated), “Increasing backup generation capacity and system reliability by
selling electricity during periods of peak demand,” Carnegie Mellon University, at
https://www.google.com/url?sa=t&rct=j&q=&esrc=s&source=web&cd=4&ved=0ahUKEwiCpaOqq5_aAhW
m3oMKHYpLC84QFgg_MAM&url=https%3A%2F%2Fwww.iaee.org%2Fen%2Fpublications%2Fproceedings
abstractpdf.aspx%3Fid%3D249&usg=AOvVaw0yHJ9zV899Wb86Fnam4bXd.
Goggin, Michael (2018), “Fossil lab misses mark in cold weather “resilience” report,” March 28, at
http://sustainableferc.org/fossil-lab-misses-mark-in-cold-weather-resilience-report/ .
Greenley, Steve (2018), CenterPoint Energy, “Texas Strong: Hurricane Harvey Response and Restoration,”
powerpoint presentation, February 21, at
https://www.energy.gov/sites/prod/files/2018/02/f49/2_Emergency%20Response%20and%20Resilience
%20Panel%20-%20Steve%20Greenley%2C%20CenterPoint%20Energy.pdf.
Hartmann, Devin (2017), “Embracing Baseload Power Retirements,” R Street Institute, May, at
http://www.rstreet.org/policy-study/embracing-baseload-power-retirements/.
Houser, Trevor, John Larsen & Peter Marsters (2017), “The Real Electricity Reliability Crisis,” Rhodium Group,
October 3, at https://rhg.com/impact/enr/.
Hunt, Hannah (2018), “How did wind energy perform during the bomb cyclone?,”at
http://www.aweablog.org/wind-energy-perform-bomb-cyclone/ .
Huntoon, Steve (2015), “Have Mandatory Standards Improved Reliability?” Public Utilities Fortnightly, January, at
https://www.fortnightly.com/fortnightly/2015/01/have-mandatory-standards-improved-reliability
ICF Inc. (2016), “Electric Grid Security and Resilience: Establishing a Baseline for Adversarial Threats,” June, at
https://www.energy.gov/sites/prod/files/2017/01/f34/Electric%20Grid%20Security%20and%20Resilience
--Establishing%20a%20Baseline%20for%20Adversarial%20Threats.pdf .
Idaho National Laboratory (2016), “Cyber Threat and Vulnerability Assessment of the U.S. Electric Sector,” August,
at
https://www.energy.gov/sites/prod/files/2017/01/f34/Cyber%20Threat%20and%20Vulnerability%20Anal
ysis%20of%20the%20U.S.%20Electric%20Sector.pdf .
ISO-New England (2018a), “Operational Fuel-Security Analysis,” January, at https://www.iso-ne.com/static-
assets/documents/2018/01/20180117_operational_fuel-security_analysis.pdf.
ISO New England (2018b), “Response of ISO New England Inc., FERC Docket AD18-7,” March 9.
67
ISO New England (2018c) memo at https://d12v9rtnomnebu.cloudfront.net/library-page/4-
3_Memo_Immediate_and_NearTerm_Fuel_Security.pdf
ISO New England (2018d), “Cold Weather Operations,” January, at https://www.iso-ne.com/static-
assets/documents/2018/01/20180112_cold_weather_ops_npc.pdf .
ISO New England (2018e), Operational Fuel Security Analysis: Stakeholder Requests for Additional Scenarios, at
https://www.iso-ne.com/static-
assets/documents/2018/03/a2_operational_fuel_security_presentation_march_2018.pdf .
Jenkins, Jesse D., Z. Zhou, R. Ponciroli et al. (2018), “The benefits of nuclear flexibility in power system operations
with renewable energy,” Applied Energy, July 2018, at https://www.sciencedirect.com/science/article/pii/S0306261918303180 .
Johnston, Adam (2017), “Deploying Microgrid On US Domestic Military Bases,” May, at
https://cleantechnica.com/2017/05/22/deploying-microgrid-us-domestic-military-bases-report/.
Keogh, Miles & Christina Cody (2013), “Resilience in Regulated Utilities,” NARUC, November, at
https://pubs.naruc.org/pub/536F07E4-2354-D714-5153-7A80198A436D.
Knake, Robert (2017), “A Cyberattack on the U.S. Power Grid – Contingency Planning Memorandum No. 31,” April
3, at https://www.cfr.org/report/cyberattack-us-power-grid.
Kristov, Lorenzo (2017) “Modern Distribution Grid,” March, PNNL, at
https://gridarchitecture.pnnl.gov/media/Modern-Distribution-Grid_Volume-I_v1_1.pdf.
LaCommare, Kristina Hamachi, Peter Larsen & Joseph Eto (2015), “Severe Weather and Other Factors that Impact
Power System Reliability,” November 24, at http://www.brinknews.com/severe-weather-and-other-
factors-that-impact-power-system-reliability/.
LaCommare, Kristina, Peter Larsen & Joseph Eto (2017), “Evaluating Proposed Investments in Power System
Reliability and Resilience: Preliminary Results from Interviews with Public Utility Commission Staff,”
January, at http://eta-publications.lbl.gov/sites/default/files/lbnl-_1006971.pdf.
Larsen, Peter, James Sweeney et al. (2014), “Exploring the Reliability of U.S. Electric Utilities,” IAEEE Conference
Paper, April, at
http://www.usaee.org/usaee2014/submissions/OnlineProceedings/IAEE_ConferencePaper_01Apr2014.p
df.
Lavelle, Marianne (2013), “After Hurricane Sandy, Need for Backup Power Hits Home,” National Geographic,
October 29, 2013 at
https://www.google.com/url?sa=t&rct=j&q=&esrc=s&source=web&cd=1&ved=0ahUKEwjA06WxoZ_aAh
Wn7YMKHXf0AlIQFggpMAA&url=https%3A%2F%2Fnews.nationalgeographic.com%2Fnews%2Fenergy%2F
2013%2F10%2F131028-hurricane-sandy-aftermath-need-for-backup-
power%2F&usg=AOvVaw0A86XVF8lBtaN2GYYgjX4F.
Lawrence Berkeley National Laboratory (LBNL), “Interruption Cost Estimate (ICE) Calculator,” at
https://eaei.lbl.gov/tool/interruption-cost-estimate-calculator .
Leigh, Richard, Jamie Kleinberg, Cecil Scheib, et al. (2014), “Leaks and Lives: How Better Building Envelopes Make
Blackouts Less Dangerous,” at http://aceee.org/files/proceedings/2014/data/papers/1-439.pdf

68
Leighton, Lance (2013), “List of New York City Class A Office Buildings with Backup Generator Capacity,” at
http://www.hedgefundspaces.com/list-of-new-york-city-class-a-office-buildings-with-backup-generator-
capacity/.
Lloyd’s (2015) “Business Blackout, Lloyd’s Emerging Risk Report,” at
https://www.lloyds.com/news-and-risk-insight/risk-reports/library/society-and-security/business-
blackout.
Luna, Taryn (2018), “Let PG&E ‘off the hook’ for wildfire costs? If not, your utility bills could rise,” Sacramento Bee,
April 10, at http://www.sacbee.com/news/politics-government/capitol-alert/article208200204.html .
Marsters, Peter, John Larsen & Trevor Houser (2017), “Electric System Reliability: No Clear Link to Coal and
Nuclear,” October 23, at https://rhg.com/research/electric-system-reliability-no-clear-link-to-coal-and-
nuclear/.
McLaren, Joyce & Seth Mullendore (2018), “Valuing the Resilience Provided by Solar and Battery Energy Storage
Systems,” prepared for National Renewable Energy Laboratory, January 30, at
https://www.cleanegroup.org/ceg-resources/resource/valuing-resilience-solar-battery-energy-storage/.
McNamara, Julie, Steve Clemmer et al. (2015), “Lights Out? Storm Surge, Blackouts, and how Clean Energy can
Help,” October, Union of Concerned Scientists, at https://www.ucsusa.org/global-warming/science-and-
impacts/impacts/lights-out-storm-surge-and-blackouts-us-east-coast-gulf-of-mexico#.Wr5kTmaZOsF .
Milligan, Michael, Frew, Kirby, Schuerger, et al. (2015), IEEE Power & Engineering Magazine, November/December
2015.
Milligan, Frew, Zhou, Arent (2015), “Advancing System Flexibility for High Penetration Renewable Integration,”
October, NREL, at https://www.nrel.gov/docs/fy16osti/64864.pdf.
MISO (2018), “Responses of the Midcontinent Independent System Operator, Inc.,” March 9, FERC Docket No
AD18-7, at https://elibrary.ferc.gov/idmws/common/OpenNat.asp?fileID=14837832.
MISO Value Proposition, at https://www.misoenergy.org/about/miso-value-proposition/ .
The National Academy of Sciences (2017), Enhancing the Resilience of the Nation’s Electricity System, July, at
https://www.nap.edu/catalog/24836/enhancing-the-resilience-of-the-nations-electricity-system.
Navigant (2017), “Military Microgrids,” at https://www.navigantresearch.com/research/military-microgrids.
New York Power Authority, Puerto Rico Electric Power Authority, et al. (2017), “Build Back Better: Reimagining and
Strengthening the Power Grid of Puerto Rico,” December, at
https://www.governor.ny.gov/sites/governor.ny.gov/files/atoms/files/PRERWG_Report_PR_Grid_Resilien
cy_Report.pdf .
New York State press release (2016), “Governor Cuomo Announces $12 Million for Downstate Gas Station
Resiliency and Storm Hardening,” June 13, at https://www.governor.ny.gov/news/governor-cuomo-
announces-12-million-downstate-gas-station-resiliency-and-storm-hardening.
Newell, Samuel, Kathleen Spees et al. (2014), “Estimating the Economically Optimal Reserve Margin in ERCOT,” for
the Public Utility Commission of Texas, January 31, at
http://files.brattle.com/files/7641_estimating_the_economically_optimal_reserve_margin_in_ercot.pdf.
NYISO (2018), “Comments on Resilience”, March 9, FERC Docket No. AD18-7.
69
North American Electric Reliability Corporation (NERC) (2013a), “Frequently Asked Questions,” August, at
https://www.nerc.com/AboutNERC/Documents/NERC%20FAQs%20AUG13.pdf .
NERC (2013b), Letter to FERC, “Re: Informational Filing on the Definition of “Adequate Level of Reliability,” May
10, at https://legacyexternalwebsitefiles.balch.com/upload/5-10-13%20info%20filing.pdf .
NERC (undated-a), Under-frequency load-shedding data, at
https://www.nerc.com/pa/RAPA/ri/Pages/UnderFrequencyLoadShedding.aspx.
NERC (undated-b), “M-11 Energy Emergency Alerts data,”
https://www.nerc.com/pa/RAPA/ri/Pages/EEA2andEEA3.aspx.
NERC (2016), Essential Reliability Standards Working Group, “Essential Reliability Services Working Group
Sufficiency Guideline Report,” December, at
http://www.nerc.com/comm/Other/essntlrlbltysrvcstskfrcDL/ERSWG_Sufficiency_Guideline_Report.pdf.
NERC (2017a), letter from CEO Gerry Cauley to U.S. DOE Secretary Rick Perry, May 9, at
https://www.eenews.net/assets/2017/10/03/document_ew_01.pdf .
NERC (2017b), State of Reliability Report, June, at
http://www.nerc.com/pa/RAPA/PA/Performance%20Analysis%20DL/SOR_2017_MASTER_20170613.pdf .
NERC (2017c), “2017 Long-Term Reliability Assessment,” December, at
www.nerc.com/pa/RAPA/ra/Reliability%20Assessments%20DL/NERC_LTRA_12132017_Final.pdf
NERC (2017d), “GridEx,” at http://www.nerc.com/pa/CI/CIPOutreach/Pages/GridEX.aspx.
NERC (2018a), “PAS Update” (Performance Analysis Subcommittee), March 2018, at
https://www.nerc.com/comm/PC/Agenda%20Highlights%20and%20Minutes%202013/Draft_PC_Meeting
_Presentations_March_6-7_2018_Jacksonville_FL.pdf .
NERC (2018b), “Reliability Standards for the Bulk Electricity Systems of North America,” January 2018,
https://www.nerc.com/pa/Stand/Reliability%20Standards%20Complete%20Set/RSCompleteSet.pdf.
NERC Transmission System Planning Performance Requirements TPL-001-4, at https://www.nerc.com/files/TPL-
001-4.pdf .
Ott, Andrew (2018), PJM, Testimony before the U.S. Senate Energy and Natural Resources Committee, January 23,
at https://www.energy.senate.gov/public/index.cfm/files/serve?File_id=F15697F8-F7F1-411B-AC26-
40AF0337DF2D .
Pfeifenberger, Johannes & Chang, Judy (2016), “Well-Planned Electric Transmission Saves Customer Costs,” June,
Brattle Group, at
http://www.wiresgroup.com/docs/reports/WIRES%20Brattle%20Report_TransmissionPlanning_June2016
.pdf.
Phillips, Julia, Kelly Wallace et al. (2016), “Onsite and Electric Power Backup Capabilities at Critical Infrastructure
Facilities in the United States,” Argonne National Laboratory, April 10, at
https://emp.lbl.gov/publications/onsite-and-electric-power-backup.
PJM (2018a), “PJM Cold Weather Performance,” February, at http://www.pjm.com/-/media/library/reports-
notices/weather-related/20180226-january-2018-cold-weather-event-report.ashx .
70
PJM (2018b), “Comments and Responses of PJM Interconnection, L.L.C,” March 9, FERC Docket No AD18-7, at
https://elibrary.ferc.gov/idmws/common/OpenNat.asp?fileID=14838220
PJM (2017), “PJM’s Evolving Resource Mix,” March 30, at http://www.pjm.com/~/media/library/reports-
notices/special-reports/20170330-pjms-evolving-resource-mix-and-system-reliability.ashx,
http://www.pjm.com/~/media/library/reports-notices/special-reports/20170330-appendix-to-pjms-
evolving-resource-mix-and-system-reliability.ashx.
PJM, “PJM Value Proposition,” at http://www.pjm.com/about-pjm/value-proposition.aspx.
Preston, Benjamin, Scott Backhaus et al. (2016), “Resilience of the U.S. Electricity System: A Multi-Hazard
Perspective,” prepared for the DOE QER, August 18, at
https://www.energy.gov/sites/prod/files/2017/01/f34/Resilience%20of%20the%20U.S.%20Electricity%20
System%20A%20Multi-Hazard%20Perspective.pdf.
Ribeiro, David, Eric Mackres et al. (2015), “Enhancing Community Resilience Through Energy Efficiency,” American
Council for an Energy Efficient Economy, October 2, at http://aceee.org/research-report/u1508 .
St. John, Jeff (2018), “U.S. Government Accuses Russia of Hacking into Energy Infrastructure,” GreenTech Media,
March 19, at https://www.greentechmedia.com/articles/read/us-government-accuses-russia-of-hacking-
into-energy-infrastructure.
SANS Institute (2016) “Analysis of the Cyber-attack o the Ukrainian Power Grid, Defense Use Case,” March 18,
2016, at https://ics.sans.org/media/E-ISAC_SANS_Ukraine_DUC_5.pdf .
Santos-Lozado, Alexis R. (2018), “More than 1,000 deaths are missing from Puerto Rico’s official death toll,” PBS
“The Conversation,” January 4, at https://www.pbs.org/newshour/science/heres-why-more-than-1000-
deaths-are-missing-from-puerto-ricos-official-death-toll.
Satow, Julie (2013), “The Generator is the Machine of the Moment,” New York Times, January 11, at
https://www.nytimes.com/2013/01/13/realestate/post-sandy-the-generator-is-machine-of-the-
moment.html.
Schaller, J. and S. Ekisheva (2016), “Leading Causes of Outages for Transmission Elements of the North American
Bulk Power System,” IEEE Power & Engineering Society General Meeting, July 17-21, at
http://ieeexplore.ieee.org/stamp/stamp.jsp?tp=&arnumber=7741141.
Schlesinger, Richard (2018), “It’s Worse Than You Think –The Increased Risk Posed by Floods,” April 18, at
https://www.energycentral.com/c/um/its-worse-you-think-increased-risk-posed-
floods?utm_medium=eNL&utm_campaign=ub_net&utm_content=161461&utm_source=2018_04_26 .
Silagy, Eric (2017), “Investing in Resiliency,” Electric Perspectives, January/February 2018, September 28, at
http://mydigimag.rrd.com/publication/?i=466942#{"issue_id":466942,"page":28} .
Southwest Power Pool (SPP) (2016), “Value of Transmission,” at
https://www.spp.org/documents/35297/the%20value%20of%20transmission%20report.pdf .
SPP (2018), “Comments of Southwest Power Pool, Inc. on Grid Resilience Issues,” March 9, FERC Docket No AD18-
7, at https://elibrary.ferc.gov/idmws/common/OpenNat.asp?fileID=14838083 .
Stanford University press release (2015), “Increasingly severe weather linked to longer-lasting power outages,”
August 24, at https://peec.stanford.edu/news/increasingly-severe-weather-linked-longer-lasting-power-
outages.

71
Sullivan, Michael, Josh Schellenberg & Marshall Blundell (2015), “Updated Value of Service Reliability Estimates for
Electric Utility Customers in the United States,” January, at https://emp.lbl.gov/publications/updated-
value-service-reliability.
Tita, Bob (2012), “A Sales Surge for Generator Maker,” Wall Street Journal, Nov. 6, at
https://www.wsj.com/articles/SB10001424127887324894104578103334072599870.
U.S.-CERT Alert (2018), (TA18-074A) – “Russian Government Cyber Activity Targeting Energy and Other Critical
Infrastructure Sectors,” March 16, at https://www.us-cert.gov/ncas/alerts/TA18-074A.
U.S. Department of Energy (undated), Form OE-417, “Electric Disturbance Events,” at
https://www.oe.netl.doe.gov/docs/OE417_Instructions_03312018.pdf.
U.S. Department of Energy (DOE) Energy Information Administration (EIA) (2012), “Electricity restored to many in
the Northeast but outages persist,” November 9, 2012, at
https://www.eia.gov/todayinenergy/detail.php?id=8730.
U.S. DOE (2014), “Form OE-417, Electric Emergency Incident and Disturbance Report,” Form OMB No. 1901-0288,
November, at https://www.oe.netl.doe.gov/docs/OE417_Form_Instructions_03312018.pdf.
U.S. DOE EIA (2016a), “Winter storm knocks out power for more than a million customers,” January 29, at
https://www.eia.gov/todayinenergy/detail.php?id=24752.
U.S. DOE EIA (2016b), “EIA data show frequency and duration of electric power outages,” September 12, 2016, at
https://www.eia.gov/todayinenergy/detail.php?id=27892.
U.S. DOE EIA (2016c), “Hurricane Matthew caused millions of customers to go without power,” October 16, at
https://www.eia.gov/todayinenergy/detail.php?id=28372.
U.S. DOE, ICE calculator, at https://eaei.lbl.gov/tool/interruption-cost-estimate-calculator.
U.S. DOE (2015), Quadrennial Energy Review, First Installment, April, at U.S. DOE, Quadrennial Energy Review,
“Energy Transmission, Storage and Distribution Infrastructure,” at
https://www.energy.gov/policy/initiatives/quadrennial-energy-review-qer/quadrennial-energy-review-
first-installment .
U.S. DOE (2017a), Quadrennial Energy Review, Second Installment, Chapter IV, Figure 4-8, “Integrated Assessment
of Risks to Electricity Sector Resilience from Current Threats,” January 6, at
https://www.energy.gov/sites/prod/files/2017/02/f34/Chapter%20IV--
Ensuring%20Electricity%20System%20Reliability%2C%20Security%2C%20and%20Resilience.pdf.
U.S. DOE (2017b), Staff Report on Electricity Markets and Reliability, August 23, at https://www.energy.gov/staff-
report-secretary-electricity-markets-and-reliability.
U.S. DOE (2017c), Grid Resiliency Pricing Rule, 82 Fed. Reg. 46,940, October 10, at
https://www.energy.gov/sites/prod/files/2017/09/f37/Notice%20of%20Proposed%20Rulemaking%20.pdf
U.S. DOE (2018), “Average frequency and duration of electric distribution outages vary by states,” April 8, at
https://www.eia.gov/todayinenergy/detail.php?id=35652 .
U.S. DOE, Secretary Rick Perry (2017a), April 14, 2017 memorandum, at
https://s3.amazonaws.com/dive_static/paychek/energy_memo.pdf.
72
U.S. DOE, Secretary Rick Perry (2017b), Letter to the Federal Energy Regulatory Commission, cover letter to Grid Resiliency Pricing Rule, September 28, 2017, at
https://www.google.com/url?sa=t&rct=j&q=&esrc=s&source=web&cd=1&ved=0ahUKEwjqi4mnlOXZAhW
E3YMKHaiAAvwQFggpMAA&url=https%3A%2F%2Fwww.energy.gov%2Fsites%2Fprod%2Ffiles%2F2017%2
F09%2Ff37%2FSecretary%2520Rick%2520Perry%2527s%2520Letter%2520to%2520the%2520Federal%25
20Energy%2520Regulatory%2520Commission.pdf&usg=AOvVaw3KaJY5iu0z3HD7NV9iOW3j .
U.S. DOE, “Cyber Security for Critical Energy Infrastructure,” at
https://www.energy.gov/oe/activities/cybersecurity-critical-energy-infrastructure
U.S. Department of Homeland Security (2015), “Malicious Incidents Against the Electrical Sector, October 2013-
September 2014,” March.
U.S. National Oceanic & Atmospheric Administration, National Centers for Environmental Information (2018a),
“U.S. Billion-dollar weather and climate disasters,” at https://www.ncdc.noaa.gov/billions/.
U.S. NOAA, National Centers for Environmental Information (2018b), “1980-2017 Year-to-date United States
Billion-Dollar Disaster Event Frequency (CPI-adjusted),” at https://www.ncdc.noaa.gov/billions/.
U.S. NOAA (2018), “Patterns and Projections of High Tide Flooding Along the U.S. Coastline Using a Common
Impact Threshold,” Technical Report NOS CO-OPS 086, February, at
https://www.google.com/url?sa=t&rct=j&q=&esrc=s&source=web&cd=1&ved=0ahUKEwjYp9Omm5raAh
Ur4YMKHb64AJQQFgguMAA&url=https%3A%2F%2Ftidesandcurrents.noaa.gov%2Fpublications%2Ftechrp
t86_PaP_of_HTFlooding.pdf&usg=AOvVaw3-3s9oqfYK454AVZDkINSz.
Van Welie, Gordon (2018), Testimony of Gordon van Welie, US Senate Committee on Energy and Natural
Resources, Hearing to Examine the Performance of the Electric Power System Under Certain Weather
Condition, at https://www.energy.senate.gov/public/index.cfm/files/serve?File_id=6C8F4042-347A-4A43-
901D-943C058D5B70 .
Xcel Energy (2011), “Loss of Load Probability Study,” at
https://web.archive.org/web/20130131050153/https://www.xcelenergy.com/staticfiles/xe/Regulatory/R
egulatory%20PDFs/PSCo-ERP-2011/Attachment-2.10-1-LOLP-Study.pdf
Walton, Patty and Burlingame, Mark (2013), “NARUC and MDPSC Cost-Benefit Analysis of Various Electric
Reliability Improvement Projects from the End Users’ Perspective,” Analysis Summary, November 15,
2013, at
https://www.sandc.com/globalassets/sac-electric/content-callouts/outages/naruc.pdf.
Walton, Robert (2017), “DOE identifies possible microgrid opportunities in Puerto Rico,” Utility Dive, November 27,
at https://www.utilitydive.com/news/doe-identifies-possible-microgrid-opportunities-in-puerto-
rico/511730/.
Walton, Robert (2018), “PG&E rolls out plan to tackle wildfire threats,” Utility Dive, March 23, at
https://www.utilitydive.com/news/pge-rolls-out-plan-to-tackle-wildfire-threats/519878/ .
Watson, Jean-Paul, Ross Guttromson et al. (2015), “Conceptual Framework for Developing Resiliency Metrics for
the Electricity, Oil and Gas Sectors in the United States,” prepared for U.S. DOE QER, Sandia National
Laboratories, September, at
https://www.energy.gov/sites/prod/files/2015/09/f26/EnergyResilienceReport_%28Final%29_SAND2015-
18019.pdf.
73
Willis, Henry, Anu Narayanan, et al. (2016), “Current and Future Exposure of Infrastructure in the United States to
Natural Hazards,” Rand Corp. prepared for U.S. Department of Homeland Security, 2016, at
https://www.rand.org/pubs/research_reports/RR1453.html.
Wilson, James (2010), “Reconsidering Resource Adequacy, Part I,” Public Utilities Fortnightly, April 2010, at
https://www.fortnightly.com/fortnightly/2010/04/reconsidering-resource-adequacy-part-1 .
Wing, Oliver E., Paul D. Bates, Andrew M. Smith et al. (2018), “Estimates of present and future flood risk in the
conterminois United States,” February 28, in Environmental Research Letters, at http://iopscience.iop.org/article/10.1088/1748-9326/aaac65 .
Wuebbles, D.J., D.W. Fahey, K.A. Hibbard, et al. (2017), “2017: Executive summary,” in Climate Science Special Report: Fourth National Climate Assessment, Volume 1,” U.S. Global Change Research Program,
Washington DC USA, at https://science2017.globalchange.gov/chapter/executive-summary/.
Zheng, Alex (undated), “The Untapped Value of Backup Generation,” at
https://www.smartgrid.gov/files/the_untapped_value_of_backup_generation_10-2008.pdf .

74
Appendix A -- Major North American Blackouts Since 2001 (based on DOE OE-417 data and public reports)
Year Location Customers
affected (million)
Time until most power
restored
Cause
2002 – January 30 OK 1.9 1 week Ice storm 2003 – August 14 Northeast US &
Ontario 55 1 week Transmission in Ohio
2003 – September 19 VA, NC 1.8 12 days Hurricane Isabel 2004 – August 13 FL 1.2 10 days Hurricane Charley 2004 – September 4 FL 2.8 10 days Hurricane Frances 2004 – September 25 FL 3.4 10 days Hurricane Jeanne 2005 – August 29 FL, LA, MS,
AL, TN, AR, KY
2.6 2 weeks Hurricane Katrina
2005 – October 23 FL 3.2 1 week Hurricane Wilma 2005 – December 31 CA 1.7 1 week Severe storms 2006 – July 19 MO, IL 2.5 12 days Thunderstorms 2008 – January 4 CA 2.6 11 days Winter storm 2008 – February 26 FL 4 1 day Transmission at
Turkey Point plant 2008 – September 13 TX 2.5 3 weeks Hurricane Ike 2010 – January 18 CA 1.7 10 days Severe storms 2011 – February 2 TX 1 1 day rolling
outages Cold weather & generation failures
2011 - April 27 AL 1.2 1 week Storm, tornado 2011 – August 27-28 NC, VA 1 2 days Hurricane Irene 2011 – September 8-9 AZ, CA,
northern Mexico 2 2 days Transmission in AZ
2011 - late October ME, CT, MA, NH, RI
1.4 9 days Snowstorm
2012 – June 29 IA, IL, IN, OH, WV, PA, MD, NJ, VA, DE, NC, KY, DC
6 4 days Thunderstorms, wind storms, derecho,
2012 – October 29 NY, NJ, CT, MA, MD, DE, WV, OH, PA, NH, RI, VT
8 10 days Hurricane Sandy
2016 – September 21 Puerto Rico 3.5 3 days Power plant fire 2016 – October 6 FL 1.2 3 days Hurricane Matthew 2017 – March 8 MI 1 2 days Wind storm 2017 – August 26 TX 1.1 2 weeks Hurricane Harvey 2017 – September 10 FL, GA, SC,
Puerto Rico 4.5 1 week Hurricane Irma
2017 – September 20 Puerto Rico & islands
3.5 8+ months Hurricane Maria
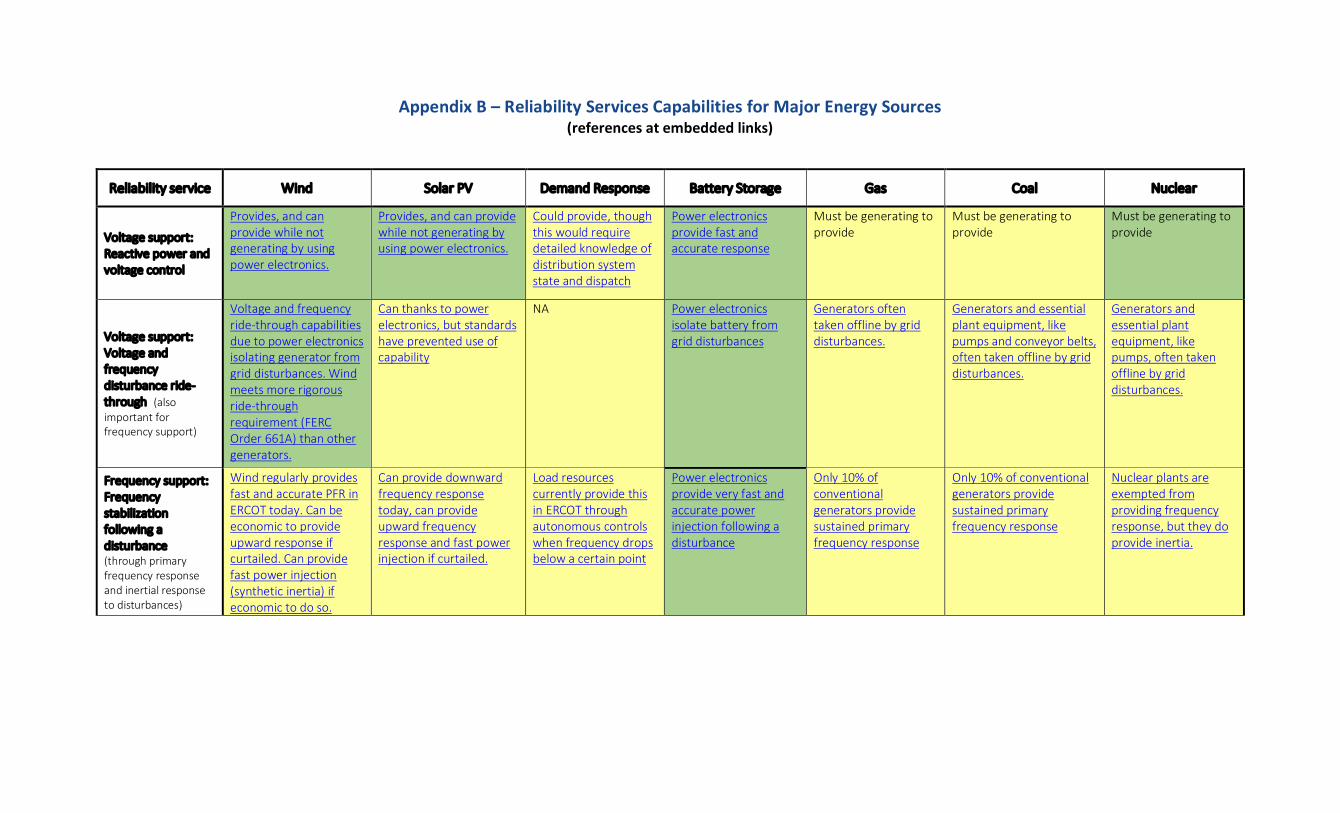
Appendix B – Reliability Services Capabilities for Major Energy Sources (references at embedded links)
Reliability service Wind Solar PV Demand Response Battery Storage Gas Coal Nuclear
Voltage support: Reactive power and voltage control
Provides, and can provide while not generating by using power electronics.
Provides, and can provide while not generating by using power electronics.
Could provide, though this would require detailed knowledge of distribution system state and dispatch
Power electronics provide fast and accurate response
Must be generating to provide
Must be generating to provide
Must be generating to provide
Voltage support: Voltage and frequency disturbance ride-through (also important for frequency support)
Voltage and frequency ride-through capabilities due to power electronics isolating generator from grid disturbances. Wind meets more rigorous ride-through requirement (FERC Order 661A) than other generators.
Can thanks to power electronics, but standards have prevented use of capability
NA Power electronics isolate battery from grid disturbances
Generators often taken offline by grid disturbances.
Generators and essential plant equipment, like pumps and conveyor belts, often taken offline by grid disturbances.
Generators and essential plant equipment, like pumps, often taken offline by grid disturbances.
Frequency support: Frequency stabilization following a disturbance (through primary frequency response and inertial response to disturbances)
Wind regularly provides fast and accurate PFR in ERCOT today. Can be economic to provide upward response if curtailed. Can provide fast power injection (synthetic inertia) if economic to do so.
Can provide downward frequency response today, can provide upward frequency response and fast power injection if curtailed.
Load resources currently provide this in ERCOT through autonomous controls when frequency drops below a certain point
Power electronics provide very fast and accurate power injection following a disturbance
Only 10% of conventional generators provide sustained primary frequency response
Only 10% of conventional generators provide sustained primary frequency response
Nuclear plants are exempted from providing frequency response, but they do provide inertia.
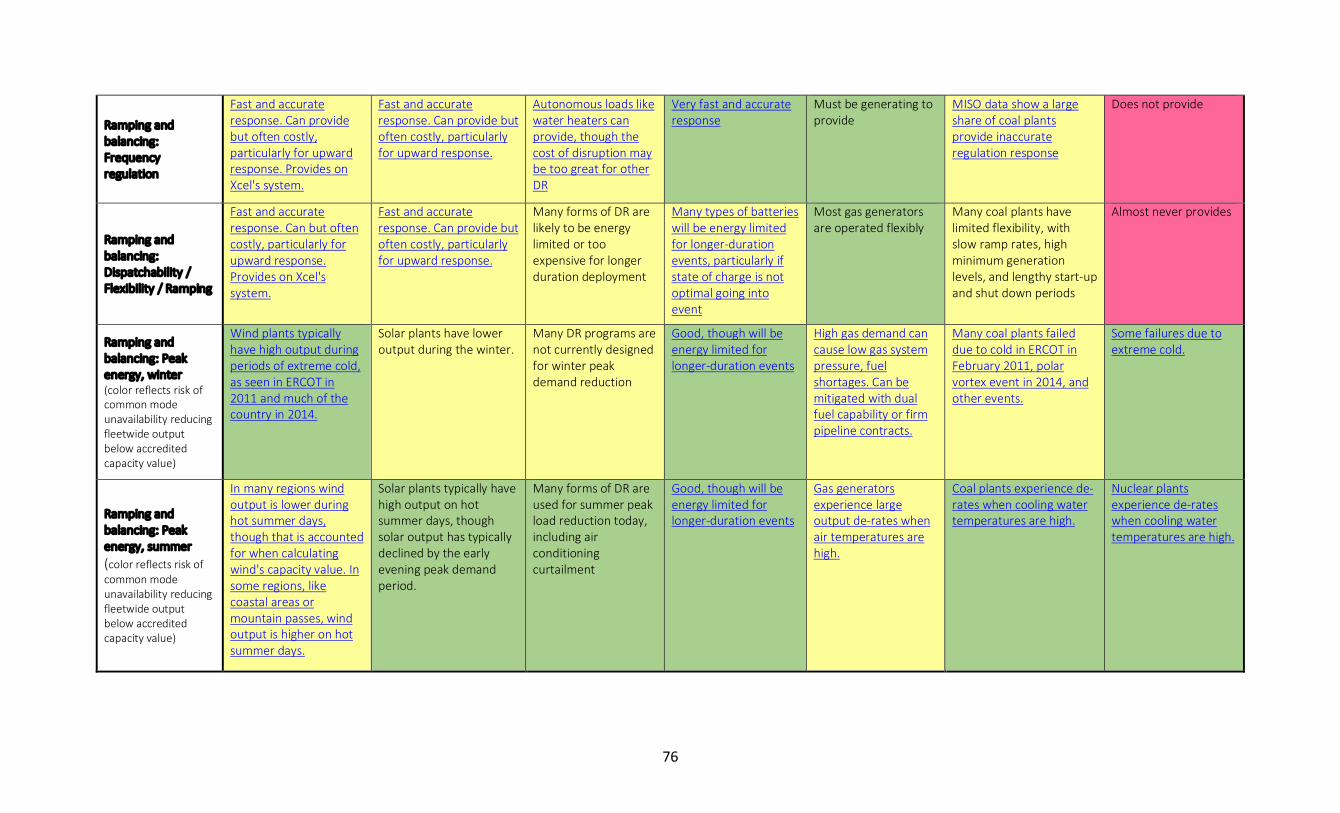
76
Ramping and balancing: Frequency regulation
Fast and accurate response. Can provide but often costly, particularly for upward response. Provides on Xcel's system.
Fast and accurate response. Can provide but often costly, particularly for upward response.
Autonomous loads like water heaters can provide, though the cost of disruption may be too great for other DR
Very fast and accurate response
Must be generating to provide
MISO data show a large share of coal plants provide inaccurate regulation response
Does not provide
Ramping and balancing: Dispatchability / Flexibility / Ramping
Fast and accurate response. Can but often costly, particularly for upward response. Provides on Xcel's system.
Fast and accurate response. Can provide but often costly, particularly for upward response.
Many forms of DR are likely to be energy limited or too expensive for longer duration deployment
Many types of batteries will be energy limited for longer-duration events, particularly if state of charge is not optimal going into event
Most gas generators are operated flexibly
Many coal plants have limited flexibility, with slow ramp rates, high minimum generation levels, and lengthy start-up and shut down periods
Almost never provides
Ramping and balancing: Peak energy, winter (color reflects risk of common mode unavailability reducing fleetwide output below accredited capacity value)
Wind plants typically have high output during periods of extreme cold, as seen in ERCOT in 2011 and much of the country in 2014.
Solar plants have lower output during the winter.
Many DR programs are not currently designed for winter peak demand reduction
Good, though will be energy limited for longer-duration events
High gas demand can cause low gas system pressure, fuel shortages. Can be mitigated with dual fuel capability or firm pipeline contracts.
Many coal plants failed due to cold in ERCOT in February 2011, polar vortex event in 2014, and other events.
Some failures due to extreme cold.
Ramping and balancing: Peak energy, summer (color reflects risk of common mode unavailability reducing fleetwide output below accredited capacity value)
In many regions wind output is lower during hot summer days, though that is accounted for when calculating wind's capacity value. In some regions, like coastal areas or mountain passes, wind output is higher on hot summer days.
Solar plants typically have high output on hot summer days, though solar output has typically declined by the early evening peak demand period.
Many forms of DR are used for summer peak load reduction today, including air conditioning curtailment
Good, though will be energy limited for longer-duration events
Gas generators experience large output de-rates when air temperatures are high.
Coal plants experience de-rates when cooling water temperatures are high.
Nuclear plants experience de-rates when cooling water temperatures are high.