Embed Size (px)
Citation preview
- 1 -
No. 149 — March 2018
A Critique of the U.S. Global Change Research Program’s 2017 Climate Science Special Report
Jay Lehr, Editor* Contributions from other scholars
Introduction
For many years, the U.S. government,
United Nations, and other national and
international organizations have issued
reports sounding the alarm about the
alleged dangers of global warming.
Domestic policies meant to curb the use
of fossil fuels, such as the Clean Power
Plan in the United States, and
international efforts, such as the Paris
climate accord, are premised on these fears. The latest addition to this alarmist literature is the
November 2017 Climate Science Special Report (CSSR). According to CSSR, “As a key part of
the Fourth National Climate Assessment, the U.S. Global Change Research Program (USGCRP)
oversaw the production of this stand-alone report of the state of science relating to climate
change and its physical impacts.”1
CSSR suffers from many of the same shortcomings and biases apparent in the previous work
produced by the USGCRP. For instance, the report relies heavily on information from the U.N.
Intergovernmental Panel on Climate Change (IPCC), which has a long history of producing
failed predictions and deeply flawed reports. Further, CSSR perpetuates the misperception
widespread in public policy circles and popular culture that “the science is settled” on the issue
of the role played by human activities in producing climate change. CSSR’s authors suggest
*Jay Lehr, Ph.D., is science director at The Heartland Institute. Other scholars contributed materials or information to or reviewed earlier drafts of this critique of the CSSR. For bios of this team, see page 51.
© 2018 The Heartland Institute. Nothing in this report should be construed as supporting or opposing any proposed or pending legislation, or as necessarily reflecting the views of The Heartland Institute.
1 D.J. Wuebbles et al., eds., Climate Science Special Report: Fourth National Climate Assessment, Vol.
1, U.S. Global Change Research Program, November 2017, p. 1,
https://science2017.globalchange.gov/downloads/CSSR2017_FullReport.pdf.
Domestic policies meant to curb the use
of fossil fuels, such as the Clean Power
Plan in the United States, and
international efforts, such as the Paris
climate accord, are premised on the
alleged dangers of global warming.
- 2 -
governments across the world, including the United Nations, should devise policies they say will
slow or stop global warming.
This Policy Study seeks to counter these
false claims by critiquing CSSR and, by
extension, the literature the report
depends on to formulate its faulty
conclusions.
Part One of this paper explains
foundational problems with CSSR,
including how its authors hide scientific
uncertainty about the causes and consequences of global warming, the pervasive politicization of
climate change throughout the report, CSSR’s over-reliance on computer models, and its
authors’ failure to comply with the principles of the scientific method. These are substantial
deficiencies, not minor flaws, that no number of pages, coauthors, or footnotes can fully offset.
Part Two provides basic facts about the role of carbon dioxide (CO2) in climate change, many of
which are missing from the CSSR report.
Part Three reviews nine assertions made by CSSR authors who believe climate change is now
and will continue to have serious life- and health-threatening consequences, and it reveals why
many of these claims should be rejected as fallacious.
Part Four offers a summation of the CSSR Task Force’s analysis of the CSSR report.
Part One Foundational Problems
CSSR might appear to the casual reader to be an exhaustive review of the literature on climate
science. It has 477 pages and three coordinating lead authors, 29 lead authors, three review
editors, 19 contributing authors, six volume editors, an eight-member Science Steering
Committee, and 17-member Subcommittee on Global Change Research.2 However, a closer look
reveals the report is far from an objective and authoritative review of climate science; it suffers
from severe foundational framing and methodology problems.
A. Hiding Scientific Uncertainty
CSSR attempts to describe the current status and maturity of climate science, a relatively new
field whose primary research focus for the past 40 years has been to prove the hypothesis human
activities, rather than naturally occurring phenomena and cycles, are the major causes of the
global climate changes observed since the beginning of the Industrial Age, which began about
two centuries ago.
2 Ibid., pp. iv–v.
This Policy Study seeks to counter false
claims, failed predictions and flawed
reports by critiquing CSSR and, by
extension, the literature the report
depends on to formulate its faulty
conclusions.
- 3 -
Climate scientists who have adopted this narrow focus often fail to properly contextualize the
more recent climate changes, which are not significantly dissimilar to those that have occurred
over the past two millennia and longer. This is notable, because Earth’s vacillating cooling and
warming climate periods occurring hundreds and thousands of years ago could not have been
caused by pre-Industrial Revolution human activities. (More details later in this paper.) It is far
more likely recent climate changes have been caused by poorly understood and complex
interactions of physical, chemical, geological, oceanographic, and biological forces, rather than
by humans’ carbon-dioxide emissions.
Despite the wealth of evidence
available, no admissions about the many
uncertainties in climate science can be
found in CSSR. Instead, it emphasizes
an alleged “consensus among scientists”
concerning the assumptions on which
the global warming hypothesis is based.
Yet science is not about consensus.
Consensus, in this case, is mostly about
politics.
Even some serious scientists who believe global warming is a problem admit there is much
uncertainty. For instance, Phil Jones of the University of East Anglia’s (UEA) Climatic Research
Unit acknowledged in a 2010 interview when asked whether most believe the debate on climate
change is over, “I don’t believe the vast majority of climate scientists think this. There is still
much that needs to be undertaken to reduce uncertainties.”
When asked specific questions about global temperature, Jones said, “Temperature data for the
period 1860–1880 are more uncertain, because of sparser coverage, than for later periods in the
20th
Century. … for the two periods 1910–40 and 1975–1998 the warming rates are
not statistically significantly different.”3 This is clearly not what consensus looks like.
Jones’ colleague at UEA, Mike Hulme, an IPCC contributor, acknowledged, “What is causing
climate change? By how much is warming likely to accelerate? What level of warming is
dangerous? – [these] represent just three of a number of contested or uncertain areas of
knowledge about climate change. … Uncertainty pervades scientific predictions about the future
performance of global and regional climates.”4 This, too, is not a consensus.
Sandrine Bony, a climate researcher at the Laboratory of Dynamic Meteorology in Paris, and her
colleagues wrote in 2015, “Fundamental puzzles of climate science remain unsolved because of
our limited understanding of how clouds, circulation and climate interact.”5 This is also not
consensus.
3 “Q&A: Professor Phil Jones,” BBC, February 13, 2010, http://news.bbc.co.uk/2/hi/8511670.stm.
4 Mike Hulme, Why We Disagree About Climate Change: Understanding Controversy, Inaction and
Opportunity, (New York, NY: Cambridge University Press, 2009), pp. 75, 83.
5 Sandrine Bony et al., “Clouds, Circulation and Climate Sensitivity,” Nature Geoscience, Vol. 8, 2015, pp.
261–68, https://www.nature.com/articles/ngeo2398.
Despite the wealth of evidence available,
no admissions about the many
uncertainties in climate science can be
found in CSSR. Instead, it emphasizes an
alleged “consensus among scientists”
concerning the assumptions on which the
global warming hypothesis is based.
- 4 -
The Nongovernmental International Panel on Climate Change has produced four volumes in its
Climate Change Reconsidered series, including separate volumes examining the physical science
and biological implications associated with climate change. The volumes constitute thousands of
pages of analysis and data provided by theoretical and research scientists and scholars.6 It is valid
for others to present different perspectives, but not to ignore or refuse to acknowledge thousands
of articles in the peer-reviewed literature contesting the claim Earth’s atmosphere is warming as
a result of human activities or that the warming is occurring at a dangerous pace.
Michael Crichton, in a 2003 lecture
delivered at the California Institute of
Technology titled “Aliens Cause Global
Warming,” called consensus the “first
refuge of scoundrels.”7 As Crichton
noted, claiming consensus is often a
strategy used to avoid debate. In
science, what ought to matter is the
presence of reproducible results, not claims of consensus. It’s worth remembering the greatest
scientists in history—including Albert Einstein, Galileo Galilei, and Isaac Newton—broke with
the scientific consensus of their time.
B. Pervasive Politicization
From its inception, climate science gained the attention of social activists, politicians, and
special-interest groups who saw in the issue a way to achieve ideological, political, and
commercial objectives.8 It’s common for scientific fields to encounter uncertainties concerning
their subject matter; indeed, their goal is to investigate a range of hypotheses that might explain
natural phenomena. It’s imperative these uncertainties be confronted objectively and the process
remain free from bias imposed by funding sources and political influence—a significant problem
in climate science.
MIT atmospheric physicist Richard Lindzen observed, “Outside any given specialty, there are
few – including scientists – who can distinguish one scientist from another, and this leaves a
great deal of latitude for advocates and politicians to invent their own ‘experts.’ … In effect,
once political action is anticipated, the supporting scientific position is given a certain status
6 These volumes can be obtained at http://climatechangereconsidered.org/; Also see Craig D. Idso,
Robert M. Carter, S. Fred Singer, Why Scientists Disagree About Global Warming, 2nd ed. (Arlington Heights: The Heartland Institute, 2015), https://www.heartland.org/_template-assets/documents/Books/Why%20Scientists%20Disagree%20Second%20Edition%20with%20covers.pdf
7 Michael Crichton, “Aliens Cause Global Warming: A Caltech Lecture,” Delivered at the California
Institute of Technology, January 17, 2003, http://s8int.com/crichton.html.
8 Rupert Darwall, Green Tyranny: Exposing the Totalitarian Roots of the Climate Industrial Complex (New
York: Encounter Books, 2017).
Michael Crichton, in a 2003 lecture
delivered at the California Institute of
Technology titled “Aliens Cause Global
Warming,” called consensus the “first
refuge of scoundrels.”
- 5 -
whereby objections are reckoned to represent mere uncertainty, while scientific expertise is
strongly discounted,”9 noting how easy it is for the scientific process to be corrupted.
As a candidate, Barack Obama famously
said, “So, if somebody wants to build a
coal-powered plant, they can; it’s just
that it will bankrupt them because
they’re going to be charged a huge sum
for all that greenhouse gas that’s being
emitted.”10
As president, Obama
fulfilled his campaign promise,
launching an aggressive war on fossil
fuels. Paul Driessen summarized
Obama’s politicization of the scientific method well, writing, “Under the Obama Administration,
the [Environmental Protection Agency] has become more politicized and agenda-driven, more
controlled by environmental activists, and more determined to use its vast regulatory power to
determine America’s energy, industrial, technological and economic future.”11
In a March 18, 2009, three-page email with the subject line “Strategic Communications
Conversation,” sent to Environmental Protection Agency (EPA) Administrator Lisa Jackson,
EPA’s Allyn Brooks-LaSure noted, “The number of Americans who say the global warming
threat has been exaggerated is at an all-time high.” The suggested action offered was revealing:
“If we shift from making this about polar caps and about our neighbor with respiratory illness we
can potentially bring this issue to many Americans.”12
This approach was especially
disingenuous, because at that time the email was authored, EPA did not have (and still doesn’t
have) data linking respiratory problems to global warming.
As the Brooks-LaSure email makes clear, EPA’s strategy focused on creating an emotional
narrative. Scientific studies, objective research, and fair analyses were pushed to the backburner
or eliminated entirely.
The remarkable and tragic situation involving Roger Pielke Jr. further illustrates the political,
rather than scientific, agenda of global warming alarmists and climate alarmist politicians. On
December 11, 2013, Pielke offered testimony before Congress titled “A Factual Look at the
9 Richard Lindzen, “Chapter 5. Science and politics: Global warming and eugenics,” in Robert W. Hahn,
ed., Risks, Costs, and Lives Saved: Getting Better Results from Regulation (New York, NY: Oxford
University Press, 1996), pp. 86–87.
10 An interview with Barack Obama by the San Francisco Chronicle, January 17, 2008,
https://www.youtube.com/watch?v=DpTIhyMa-Nw.
11 Paul Driessen, “The EPA’s Unrelenting Power Grab,” Committee for a Constructive Tomorrow, 2011, p.
4, https://www.heartland.org/_template-assets/documents/publications/The-EPA-Unrelenting-Power-Grab.pdf.
12 Allyn Brooks-LaSure, “Strategic Communications Conversation,” March 18, 2009, obtained by the
Competitive Enterprise Institute under the Freedom of Information Act and posted by Watts Up With That
(website), https://wattsupwiththat.files.wordpress.com/2015/01/march-09-epa-strategy-memo-to-lpj.pdf.
Paul Driessen summarized Obama’s
politicization of the scientific method
well, writing, “Under the Obama
Administration, the [Environmental
Protection Agency] has become more
politicized and agenda-driven, more
controlled by environmental activists.”
- 6 -
Relationship of Climate to Weather.” Most of his testimony focused solely on hard data.13
But as
Pielke explained in a subsequent appearance before Congress:
Several months after I testified before this committee in December, 2013, the White
House posted on its website a 6-page essay by the President’s Science Advisor, John
Holdren, which claimed falsely that my testimony before this committee was “not
representative of mainstream views on this topic in the climate-science community” and
was “seriously misleading.” … One year later, Congressman Raul Grijalva (D-AZ)
opened a formal investigation of me and six other professors … In his letter to my
university’s president, Mr. Grijalva justified the investigation of me by relying on the
science advisor’s false claims. … The communications director for the House Natural
Resources Committee explained how we seven academics were chosen to be investigated
by Mr. Grijalva: “The way we chose the list of recipients [of Mr. Grijalva’s letter] is who
has published widely, who has testified in Congress before, who seems to have the most
impact on policy in the scientific community.”14
The harassment endured by Pielke is clear proof politicians armed with government’s power and
threats of censorship—rather than scholars and scientists who utilize objectively collected and
analyzed data and facts—have dominated the climate change debate.
CSSR is unquestionably a political
document. It was compiled by EPA
holdovers from the Obama
administration who are more interested
in achieving their political objectives
than relying on the scientific method.
This critique of CSSR is made necessary
because EPA and its many publications,
reports, and projects were heavily and
often unapologetically politicized during Obama’s tenure.
C. Overreliance on Computer Models
Computer simulations are the primary tool climate science researchers use in their published
reports. There are few, if any, traditional experiments using physical systems and data that play
an integral role in most alarmist climate reports. These complex computer models have not only
13
Roger Pielke Jr., “A Factual Look at the Relationship of Climate to Weather,” testimony before the Subcommittee on Environment of the Committee on Science, Space, and Technology, U.S. House of Representatives, December 11, 2013, http://sciencepolicy.colorado.edu/admin/publication_files/2013.38.pdf.
14 Roger Pielke Jr., “Climate Science: Assumptions, Policy Implications, and the Scientific Method,”
testimony before the Committee on Science, Space, and Technology of the U.S. House of Representatives, March 29, 2017, pp. 1–2, https://science.house.gov/sites/republicans.science.house.gov/files/documents/HHRG-115-SY-WState-RPielke-20170329.pdf.
CSSR is unquestionably a political
document. It was compiled by EPA
holdovers from the Obama administration
more interested in achieving their
political objectives than relying on the
scientific method.
- 7 -
failed to predict future changes with accuracy, they have also failed to explain past climate
changes.
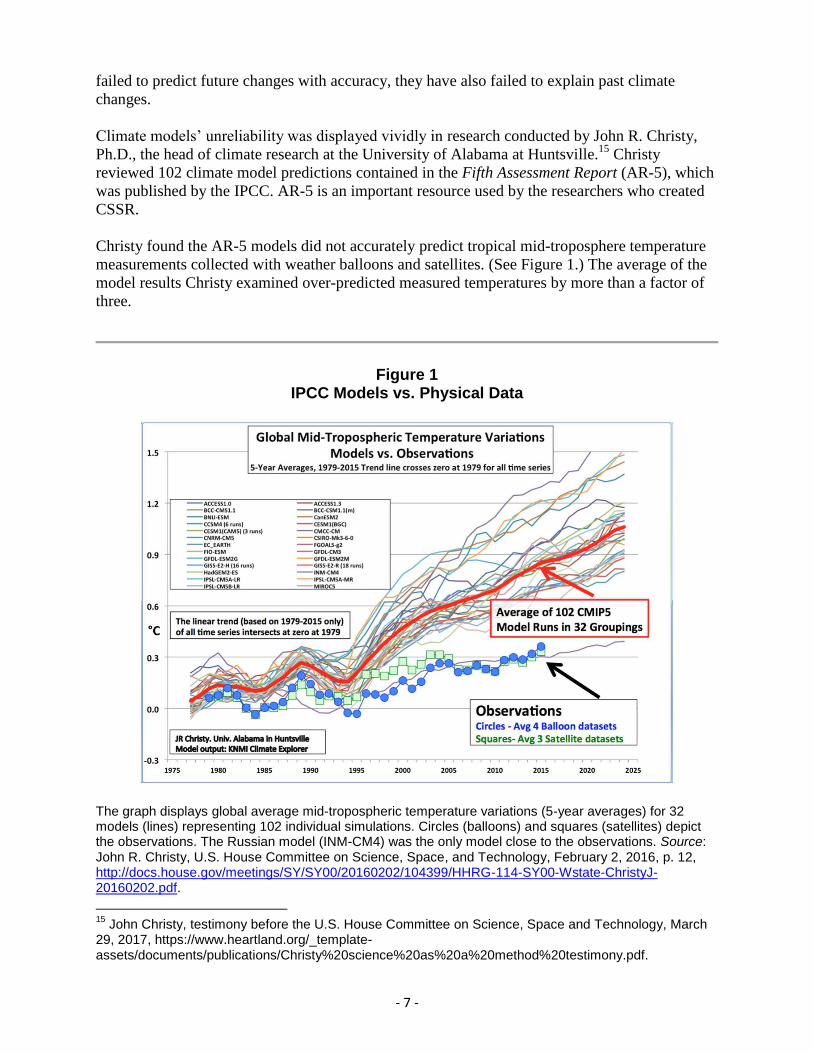
Climate models’ unreliability was displayed vividly in research conducted by John R. Christy,
Ph.D., the head of climate research at the University of Alabama at Huntsville.15
Christy
reviewed 102 climate model predictions contained in the Fifth Assessment Report (AR-5), which
was published by the IPCC. AR-5 is an important resource used by the researchers who created
CSSR.
Christy found the AR-5 models did not accurately predict tropical mid-troposphere temperature
measurements collected with weather balloons and satellites. (See Figure 1.) The average of the
model results Christy examined over-predicted measured temperatures by more than a factor of
three.
Figure 1 IPCC Models vs. Physical Data
The graph displays global average mid-tropospheric temperature variations (5-year averages) for 32 models (lines) representing 102 individual simulations. Circles (balloons) and squares (satellites) depict the observations. The Russian model (INM-CM4) was the only model close to the observations. Source: John R. Christy, U.S. House Committee on Science, Space, and Technology, February 2, 2016, p. 12, http://docs.house.gov/meetings/SY/SY00/20160202/104399/HHRG-114-SY00-Wstate-ChristyJ-20160202.pdf.
15
John Christy, testimony before the U.S. House Committee on Science, Space and Technology, March 29, 2017, https://www.heartland.org/_template-assets/documents/publications/Christy%20science%20as%20a%20method%20testimony.pdf.
- 8 -
Ignoring Feedback Loops
The inaccuracies produced by most computer climate models are due in part to the estimates
made about the effects of feedback loops and mechanisms. A feedback mechanism describes
how a natural process changes due to its underlying causal characteristics and other factors. A
wildfire, for example, begins with a positive feedback loop. With plenty of fuel on which to
draw, it grows larger, which means it can consume even more fuel and at a faster rate. However,
as fuel runs low and other factors, such as temperature and precipitation, change, the feedback
loop becomes negative and the fire dwindles. In nature, most positive feedback loops become
negative as natural phenomena return to equilibrium.
Concerning climate, if CO2 emissions produce a higher global temperature and a higher
temperature produces more CO2—an unchecked positive feedback loop—then Earth’s
atmosphere would have heated up much more than it has, possibly endangering all life, including
humans. We are often told Earth is approaching a tipping point or “point of no return,” during
which normal negative feedbacks of the climate system will suddenly turn positive, in defiance
of logic and all historical precedent.
Climate modelers usually include large
positive feedback loops in their
simulations, assuming the atmosphere is
extremely sensitive to CO2 while ignoring
data and other causal factors that suggest
this is not the case. (Interestingly, if they
were to include large negative feedback
loops, climate scientists’ models would
forecast a new ice age.)
Climate modelers ignore the fact that the heating effects of CO2 are not linear. This means that
whatever impact the near doubling of CO2 has had during the past two centuries, it will have
dramatically less impact with the next doubling. (More on this later in this paper.)
Weather and Climate
The discussion of global warming must also be considered with a proper understanding of
weather and climate. Weather is defined as the instantaneous state and/or conditions of the
atmosphere. Variables such as temperature, pressure, density, moisture content, cloud cover, and
precipitation describe the thermodynamic or dynamic state of the atmosphere. Climate, on the
other hand, is the long-term mean state of the atmospheric conditions, including the variability,
extremes, and recurrence intervals. “Long-term” is defined as at least a 30-year period by the
World Meteorological Organization.16
While these definitions suggest weather and climate are different, each is governed by the same
underlying physical causal factors. These factors are represented by seven mathematical
16
“What is Climate?” World Meteorological Organization, accessed February 8, 2018, http://www.wmo.int/pages/prog/wcp/ccl/faqs.php.
Climate modelers usually include large
positive feedback loops in their
simulations, assuming the atmosphere is
extremely sensitive to CO2 while
ignoring data and other causal factors
that suggest this is not the case.
- 9 -
equations, commonly referred to as the “primitive equations,” which form the dynamic core of
computer models that attempt to make weather forecasts and climate projections.17
Primitive equations, while important, represent physical processes for which there are no precise
formulations that allow for accurate predictions—processes such as cloud formation, heat
exchange between Earth’s surface and the atmosphere, precipitation generation, and solar
radiation. Therefore, the variables in the equations must be represented by “parameterizations,”
or ranges.
Because physical processes in the
atmosphere are not well-understood,
scientists make educated guesses about
the values of the variables in their
equations. Then they must “tune” these
parameters until they get an answer that
matches data, once they become
available. Much of the work researchers
do with computer models involves this fine-tuning.18
A lack of data that can be used to improve the accuracy of computer models is a significant
reason why weather forecasts often vary substantially from initial estimates, typically in as few
as three to five days. Weather forecasts are made with data measured as infrequently as twice per
day in the United States, and only once per day in most other locations. Further, most
measurements are gathered over land, even though three-quarters of Earth’s surface is covered
with water. Additionally, weather instruments cannot measure atmospheric quantities with
infinite precision. These, plus other factors, explain why weather predictions made two weeks or
more in advance are hopelessly inaccurate.
Climate predictions utilize these same imperfect weather forecasting equations, which, in part, is
why climate scientists have not been able to make predictions decades in advance that match
high-quality data. (See examples later in this paper.)
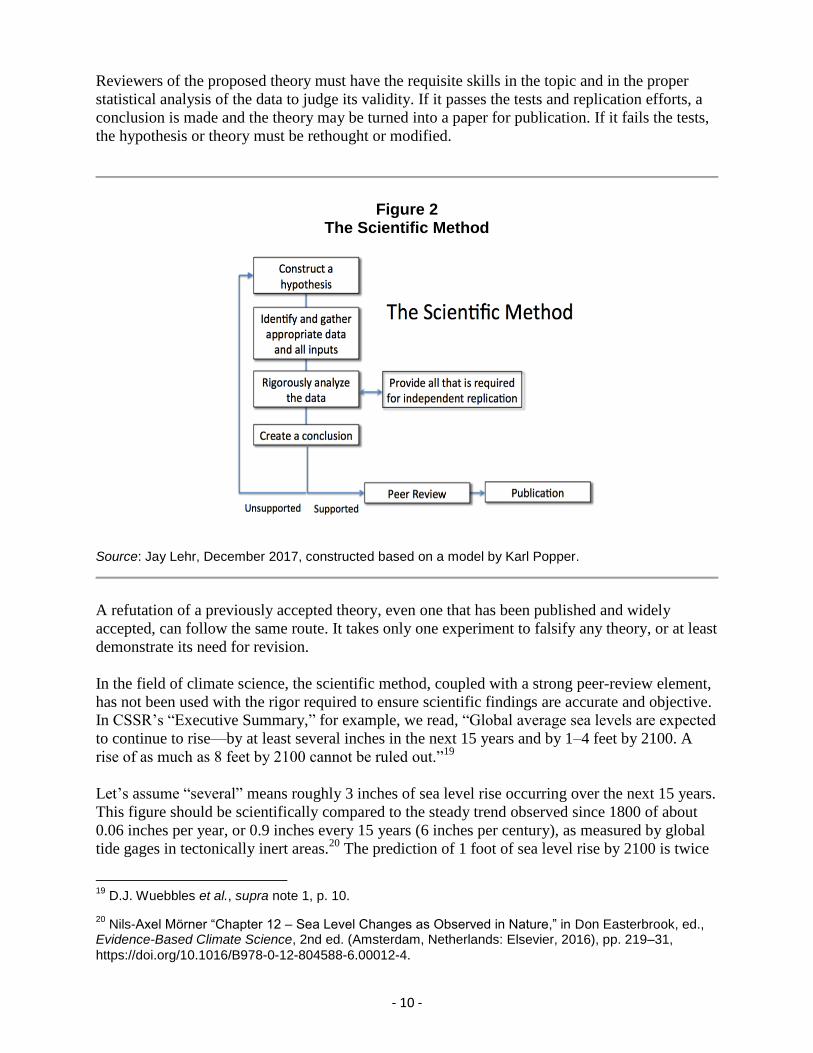
D. Failure to Follow the Scientific Method
Another problem with the climate science literature CSSR uses is much of it plays fast and loose
with the scientific method, a well-established iterative process for acquiring knowledge. (See
Figure 2.) The scientific method begins with a theory or hypothesis. The data needed to test the
hypothesis and all possible factors involved are identified and gathered. The data are then
processed and the results rigorously tested. The data and methods are then made available for
independent replication.
17
“Primitive Equations,” San Francisco State University, accessed February 16, 2018, http://tornado.sfsu.edu/Geosciences/classes/e465/PE_Equations/Primitive_equations.html.
18 Frédéric Hourdin, “The Art and Science of Climate Model Tuning,” Bulletin of the American
Meteorological Society, March 2017, https://journals.ametsoc.org/doi/abs/10.1175/BAMS-D-15-00135.1.
Because physical processes in the
atmosphere are not well-understood,
scientists make educated guesses about
the values of the variables in their
equations.
- 10 -
Reviewers of the proposed theory must have the requisite skills in the topic and in the proper
statistical analysis of the data to judge its validity. If it passes the tests and replication efforts, a
conclusion is made and the theory may be turned into a paper for publication. If it fails the tests,
the hypothesis or theory must be rethought or modified.
Figure 2 The Scientific Method
Source: Jay Lehr, December 2017, constructed based on a model by Karl Popper.
A refutation of a previously accepted theory, even one that has been published and widely
accepted, can follow the same route. It takes only one experiment to falsify any theory, or at least
demonstrate its need for revision.
In the field of climate science, the scientific method, coupled with a strong peer-review element,
has not been used with the rigor required to ensure scientific findings are accurate and objective.
In CSSR’s “Executive Summary,” for example, we read, “Global average sea levels are expected
to continue to rise—by at least several inches in the next 15 years and by 1–4 feet by 2100. A
rise of as much as 8 feet by 2100 cannot be ruled out.”19
Let’s assume “several” means roughly 3 inches of sea level rise occurring over the next 15 years.
This figure should be scientifically compared to the steady trend observed since 1800 of about
0.06 inches per year, or 0.9 inches every 15 years (6 inches per century), as measured by global
tide gages in tectonically inert areas.20
The prediction of 1 foot of sea level rise by 2100 is twice
19
D.J. Wuebbles et al., supra note 1, p. 10.
20 Nils-Axel Mörner “Chapter 12 – Sea Level Changes as Observed in Nature,” in Don Easterbrook, ed.,
Evidence-Based Climate Science, 2nd ed. (Amsterdam, Netherlands: Elsevier, 2016), pp. 219–31,
https://doi.org/10.1016/B978-0-12-804588-6.00012-4.
- 11 -
the extremely steady trend since 1800. The prediction of 4 feet is eight times higher, a deviation
well out of sync with the past two centuries of available physical data. The claim that “cannot be
ruled out” of 8 feet strains credulity. Given these extreme estimates, it’s not surprising CSSR
does not offer the data, analysis, or context that would constitute a scientific justification for such
assertions.
Part Two Carbon Dioxide in the Atmosphere
CSSR has been described by alarmists as a reflection of the best available science, but basic facts
about the role CO2 plays in climate change are strangely absent from CSSR. Further, the authors
do not include in their report recent research suggesting Earth’s climate is less sensitive to CO2
than previously thought, or that there is well-tested science suggesting CO2 generated by human
activities cannot physically have the warming effects claimed by many climate scientists and
their models.
A. Atmospheric CO2
CO2 is an invisible, odorless, tasteless,
non-toxic gas that is naturally present in
the air and essential for the existence of
all plants, animals, and humans on
Earth. In the photosynthesis process,
plants remove CO2 from the atmosphere
and release oxygen, which humans and
animals breathe in. If the authors of the CSSR had at least mentioned these obvious facts, it
might have removed the implied, emotive assumption CO2 is a pollutant that endangers human
life.
The CO2 emitted into Earth’s atmosphere from burning fossil fuels is less than 4 percent of the
ongoing large natural exchange of CO2 between Earth’s atmosphere, land masses, and oceans.
CO2 is a trace gas that makes up only about 0.04 percent, by volume, of all gases in the
atmosphere, up from about 0.03 percent in 1910.
CO2 in the atmosphere does not harm humans directly. In confined spaces, such as in submarines
or spacecraft, CO2 concentrations can build up and threaten human health and safety—but only at
concentrations that are more than 20 times the current trace levels in our atmosphere. Nuclear
submarines commonly contain 5,000 parts per million (ppm) of CO2 when submerged, and only
after more than a month.21
21
Ola Persson and Lars Wadsö, “Indoor air quality in submarines,” Hal Levin, ed., Ninth International Conference on Indoor Air Quality and Climate, 2002, pp. 806–11, http://portal.research.lu.se/portal/sv/publications/indoor-air-quality-in-submarines(354e50b5-7e4f-467d-a5ae-6c3c0e2e77c5).html.
CO2 is a trace gas that makes up only
about 0.04 percent, by volume, of all
gases in the atmosphere, up from about
0.03 percent in 1910.
- 12 -
Life on Earth would begin to fade at half of today’s CO2 levels, and much of it would almost die
out completely at one-quarter of today’s values. Geologic history shows life flourished
abundantly at double and triple the current levels.22
The recent increase in the amount of CO2 in
Earth’s atmosphere has produced a significant greening effect and reduced the amount of water
needed for growth. Transpiration of water from plants declines significantly as CO2
concentrations increase.
A study of satellite photographs by Rang Myeni and a team of researchers at Boston University
found during the past 30 years, 20 percent of Earth’s surface became greener. Only 3 percent of
Earth browned.23
This finding is extremely important, because as CO2 increases, so does plant
growth, and plants produce more oxygen, pushing the system toward equilibrium.
The magnitude of the greenhouse effect
associated with an atmospheric
component depends on its capacity to
modify heat radiated to space by Earth’s
surface and atmosphere. For the CO2
molecule, the dominant and only
effective absorption band lies at the
wavelength of 15 microns in the
infrared.24
There is already so much CO2
in Earth’s atmosphere that adding additional CO2 would likely make relatively little difference to
the radiative forcing. The forcing is no longer proportional to the CO2 concentration, as it would
be for much smaller concentrations; instead, it’s proportional to the logarithm of the
concentrations. Thus, if doubling CO2 were to increase the forcing by 4 watts per square meter
(Wm-2
), a number often used by IPCC,25
one would have to quadruple the CO2 concentration to
get twice as much forcing, or 8 Wm-2
.
No one knows if 4 Wm-2
is the correct forcing for a doubling of CO2. It is a purely theoretical
number that involves averaging factors over the entire surface of Earth, from the warm tropics to
the frigid poles. One must also average the complicated altitude profiles of temperature, pressure,
and clouds. One reason climate models have been so poor at predicting future climatic changes is
likely a result of scientists making incorrect guesses about the values of many key parameters,
including those just mentioned.
Similarly, additional amounts of CO2 added to the atmosphere absorb correspondingly less
radiant heat from the surface and produce a reduced amount of warming from the greenhouse
22
An interview with William Happer, “Focused Civil Dialogue on Global Warming,” The Heartland Institute, p. 27, (Originally published by TheBestSchools.org, 2017), https://www.heartland.org/_template-assets/documents/policy-documents/William%20Happer%20Interview%20on%20Global%20Warming.pdf.
23 Ibid., p. 39.
24 W.D. Collins et al., “Radiative forcing by well-mixed greenhouse gases: Estimates from climate models
in the Intergovernmental Panel on Climate Change (IPCC) Fourth Assessment Report (AP4),” Journal of Geophysical Research, Vol. 111, 2006, doi:10.1029/2005JD006713.
25 Gunnar Myhre et al., “New estimates of radiative forcing due to well-mixed greenhouse gases,”
Geophysical Research Letters, Vol. 15, 1998, pp. 2,715–18.
A study of satellite photographs by Rang
Myeni and a team of researchers at
Boston University found during the past
30 years, 20 percent of Earth’s surface
became greener. Only 3 percent of Earth
browned.
- 13 -
effect. Indeed, the first 20 ppm of CO2 added produces more warming than the next 400 ppm.26
This saturation effect means that nearly all the warming potential of CO2 has been realized at
concentrations in the atmosphere of less than 100 ppm. Concentrations higher than 100 ppm
produce negligible warming, including the pre-Industrial level of 280 ppm and the feared
doubling to 560 ppm. Atmospheric CO2 is not capable of producing catastrophic global warming
because warming potential is essentially exhausted after relatively low levels of additional CO2
have been added.27
Because these facts are often omitted
from alarmists’ climate models, the
models fail to describe the actual,
measurable temperature of Earth’s
atmosphere.
B. Climate Sensitivity
Properly calculating the sensitivity of global mean surface temperature (GMST) to atmospheric
concentrations of CO2 and other so-called greenhouse gases (GHGs) that can absorb infrared
radiation from Earth’s surface is crucial in determining whether those gases will warm the
atmosphere. It has been shown using simple experiments GHGs can absorb such radiation, but it
has not been proven this absorption causes a temperature increase in the gas itself.
IPCC uses two primary metrics—equilibrium climate sensitivity (ECS) and transient climate
response (TCR)—to describe the sensitivity for doubling CO2 concentrations in the atmosphere.
Despite decades of research, the climate science community has made no progress in reducing
the uncertainty range of its ECS metric. Even the CSSR acknowledges, “Various lines of
evidence constrain the likely value of climate sensitivity to between 2.7°F and 8.1°F (1.5°C and
4.5°C).”28
Several published papers that used physical data to determine ECS and TCR
concluded ECS is within or below the lower half of this uncertainty range.29
Although CSSR’s authors acknowledged such research findings exist, they chose to promote
climate simulation models as a valid method for determining ECS and TCR, and, therefore,
continued to emphasize global warming concerns and predictions resulting from climate models
that represent ECS sensitivity at or beyond the upper limit of the uncertainty range. Christopher
26
Based on work by Richard Lindzen and Yong-Sang Choi, “On the determination of climate feedbacks and Its Implications,” Asia-Pacific Journal of Atmospheric Sciences, Vol. 47, No. 4, 377–90, 2011,
http://www-eaps.mit.edu/faculty/lindzen/236-Lindzen-Choi-2011.pdf.
27 J.K. Ward et al., “Carbon starvation in glacial trees recovered from the La Brea tar pits, southern
California,” Proceedings of the National Academy of Sciences of the United States of America, Vol. 102, No. 3, January 18, 2005, 690–94, http://www.jstor.org/stable/3374310?seq=1#page_scan_tab_contents.
28 D.J. Wuebbles et al., supra note 1, p. 148.
29 See Alexander Otto, et al., “Energy budget constraints on climate response,” Nature Geoscience, Vol.
6, May 19, 2013, pp. 415–16, http://www.nature.com/articles/ngeo1836; Nicholas Lewis and Judith Curry, “The implications for climate sensitivity of AR5 forcing and heat uptake estimates,” Climate Dynamics,
Vol. 45, Nos. 3–4, 2015, pp. 1009–23, https://link.springer.com/article/10.1007/s00382-014-2342-y.
Atmospheric CO2 is not capable of
producing catastrophic global warming
because warming potential is essentially
exhausted after relatively low levels of
additional CO2 have been added.
- 14 -
Monkton and his coauthors identified 27 peer-reviewed articles “that report climate sensitivity to
be below current central estimates”30
If CSSR were the honest overview of the state of climate science its authors claim it is, this work
would have been cited and reviewed, not ignored.
C. Trajectory of GHG Concentrations in the Atmosphere
CSSR’s authors do not attempt to credibly calculate the most probable atmospheric greenhouse
gas concentration trajectory, a calculation that is essential for accurately predicting global
warming. Instead, they base their atmospheric GHG projections on hypothetical future scenarios
presented in the IPCC’s Fifth Assessment Report (AR-5). The future global emissions scenarios
analyzed in the AR-5 report were called “representative concentration pathways” (RCPs) and
included numerical ratings that indicated their projected global temperature forcing strength in
the year 2100 relative to the year 1750 baseline (measured in units of Watts/m2 of Earth’s surface
area).
The only scenario presented that did not
assume some degree of worldwide GHG
emissions controls would be
implemented (the only “business as
usual” scenario) was given the
designation “RCP8.5,” indicating this
scenario would create 8.5 Watts/m2
GHG forcing of global temperature in
2100. However, RCP8.5 is not a
“middle of the road,” “business as usual” scenario. It assumes abnormally high estimates of
world population growth and energy usage. It further assumes there will be few, if any,
technological improvements in energy efficiency that would result in lower per-capita
atmospheric CO2 and other GHG concentration growth that would achieve the 90th percentile
level of any emissions scenario ever published in the technical literature.31
The RCP8.5 scenario does not take into account the potential for fossil-fuel supply and demand
changes or price elasticity; as demand for energy and energy prices rise, fossil-fuel supplies
would be strained, making other energy sources more economical.
The RCP8.5 scenario ignores these facts. Further, the scenario assumes by 2100, there will be
930 ppm of CO2 in the atmosphere. This is 55 percent more than the 600 ppm of CO2 that could
be generated by burning all the currently known worldwide reserves of coal, oil, and natural gas,
according to the U.S. Energy Information Administration’s estimates.32
30
Christopher Monckton et al., “Keeping it simple: the value of an irreducibly simple climate model,” Science Bulletin, Vol. 60, No. 15, August 2015, pp. 1378–90, footnotes 7–33.
31 Keywan Riahi et al., “RCP 8.5—A scenario of comparatively high greenhouse gas emissions,” Climatic
Change, Vol. 33, No. 109, November 2011, https://link.springer.com/article/10.1007/s10584-011-0149-y.
32 Harold H. Doiron, “Recommendations to the Trump Transition Team Investigating Actions to Take at
the Environmental Protection Agency (EPA): A Report of The Right Climate Stuff Research Team,” November 30, 2016, p. 20,
As demand for energy and energy prices
rise, fossil-fuel supplies would be
strained, making other energy sources
more economical. Technological
advances will also make fossil-fuel use
more efficient.
- 15 -
The Right Climate Stuff (TRCS) research team of retired NASA scientists and engineers
developed and validated a simple algebraic model for forecasting global mean surface
temperature and the threat of manmade global warming as a function of any proposed future
atmospheric CO2 concentration projection. 33,34
The TRCS model uses the transient climate
sensitivity (TCS) variable for warming resulting from a doubling of atmospheric CO2, but unlike
other models, the TRCS model bases its variable rise rate of atmospheric CO2 concentration on
what has been discovered in the historical record. Additionally, a constant, “beta,” is included
with the TCS metric that’s also based on historical data to account for warming effects of
greenhouse gases other than CO2 and aerosols.35
The derivation and validation of this model is
presented in a report the TRCS team submitted to the Trump Transition Team in November
2016.36
The TRCS research team developed two
scenarios, RCP6.0 and RCP6.2, both of
which avoid the flaws of the RCP8.5
scenario used by IPCC and adopted by
the CSSR researchers. The RCP6.0 and
RCP6.2 models project CO2
concentrations of 585 ppm and 600
ppm, respectively, by the year 2100.
These scenarios determined a market-driven transition to alternative energy sources would need
to begin by 2060 to meet the growing worldwide energy demand for rising prices for declining
reserves of coal, oil, and natural gas. The RCP6.0 scenario projects this transition to alternative
fuels will be complete by 2130 and the RCP6.2 scenario considers that this transition will be
completed in 2100. The IPCC AR-5 report also presented an RCP6.0 scenario that assumed only
modest CO2 emissions controls would be implemented before 2100. The two RCP6.0 scenarios,
both the one by IPCC and the TRCS team’s model, projected similar trajectories of CO2
concentration in the atmosphere by 2100, but the IPCC assumes worldwide controls on the use of
fossil fuels, while the TRCS projection considers market forces of supply and demand and a
depleting supply of worldwide reserves of coal, oil, and natural gas.
http://nebula.wsimg.com/1ca304a328496c0c011ac02790fc56ed?AccessKeyId=4E2A86EA65583CBC15DE&disposition=0&alloworigin=1.
33 See therightclimatestuff.com.
34 Harold H. Doiron, supra note 32.
35 The sensitivity variable is known as the transient climate sensitivity metric, and in the TRCS model, it is
equivalent to the IPCC’s TCR metric, except that TCS is based on accurate recorded data. With the beta variable, the sensitivity metric is TCS(1+beta)=1.8 degrees Celsius in warming for a doubling of CO2, where beta accounts for the warming of GHG other than CO2.
36 Harold H. Doiron, supra note 32.
These scenarios determined a market-
driven transition to alternative energy
sources would need to begin by 2060 to
meet the growing worldwide energy
demand for rising prices for declining
reserves of coal, oil, and natural gas.
- 16 -
Large U.S. energy companies are much better at forecasting the availability of fossil fuels in the
future than IPCC climate scientists. Energy companies must invest billions of dollars based on
their forecasts, so they have a much stronger incentive to develop accurate models. The 25-year
forecasts for coal, oil, and natural gas consumption published by Exxon Mobil37
and British
Petroleum38
for 2040 align closely with the fossil-fuel consumption estimates included in TRCS’
RCP6.0 and RCP6.2 scenarios.
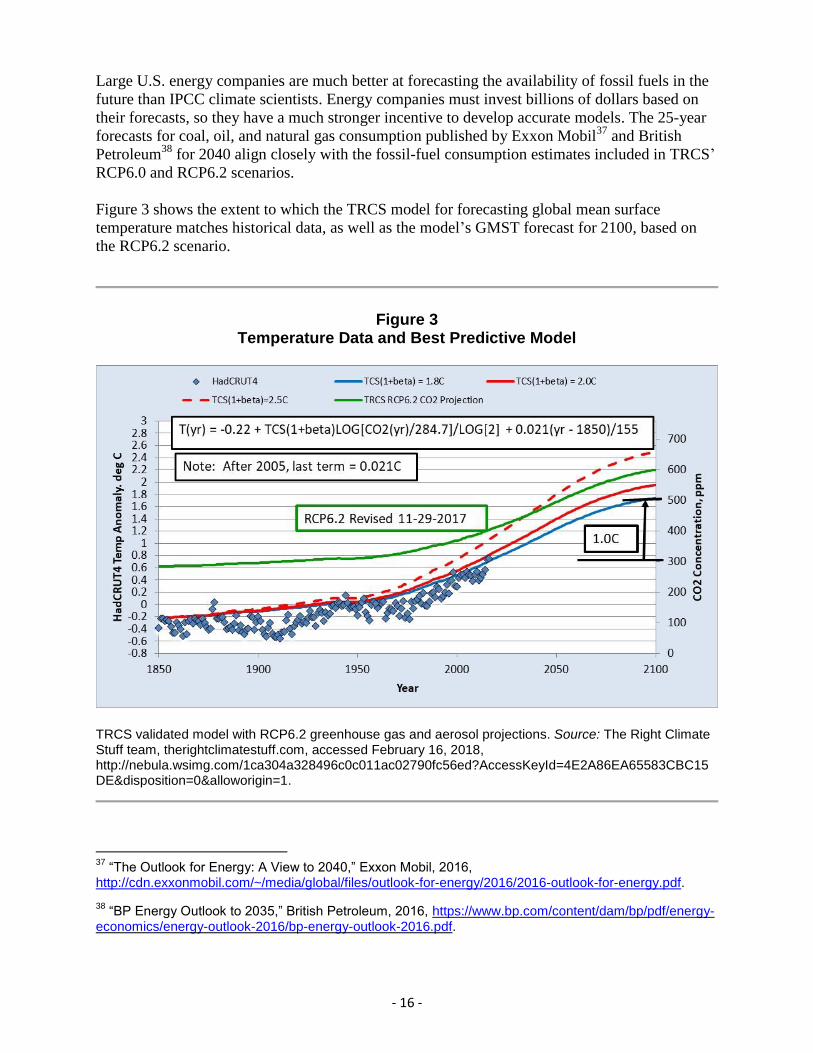
Figure 3 shows the extent to which the TRCS model for forecasting global mean surface
temperature matches historical data, as well as the model’s GMST forecast for 2100, based on
the RCP6.2 scenario.
Figure 3 Temperature Data and Best Predictive Model
TRCS validated model with RCP6.2 greenhouse gas and aerosol projections. Source: The Right Climate Stuff team, therightclimatestuff.com, accessed February 16, 2018, http://nebula.wsimg.com/1ca304a328496c0c011ac02790fc56ed?AccessKeyId=4E2A86EA65583CBC15DE&disposition=0&alloworigin=1.
37
“The Outlook for Energy: A View to 2040,” Exxon Mobil, 2016, http://cdn.exxonmobil.com/~/media/global/files/outlook-for-energy/2016/2016-outlook-for-energy.pdf.
38 “BP Energy Outlook to 2035,” British Petroleum, 2016, https://www.bp.com/content/dam/bp/pdf/energy-
economics/energy-outlook-2016/bp-energy-outlook-2016.pdf.
- 17 -
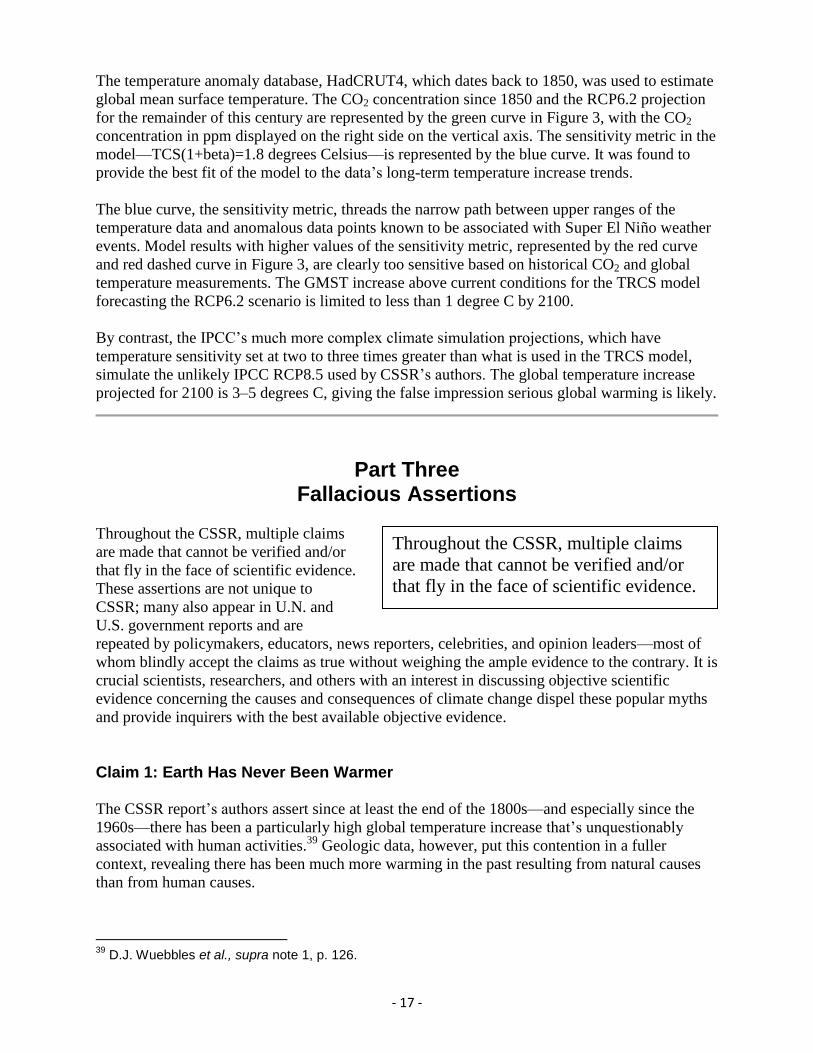
The temperature anomaly database, HadCRUT4, which dates back to 1850, was used to estimate
global mean surface temperature. The CO2 concentration since 1850 and the RCP6.2 projection
for the remainder of this century are represented by the green curve in Figure 3, with the CO2
concentration in ppm displayed on the right side on the vertical axis. The sensitivity metric in the
model—TCS(1+beta)=1.8 degrees Celsius—is represented by the blue curve. It was found to
provide the best fit of the model to the data’s long-term temperature increase trends.
The blue curve, the sensitivity metric, threads the narrow path between upper ranges of the
temperature data and anomalous data points known to be associated with Super El Niño weather
events. Model results with higher values of the sensitivity metric, represented by the red curve
and red dashed curve in Figure 3, are clearly too sensitive based on historical CO2 and global
temperature measurements. The GMST increase above current conditions for the TRCS model
forecasting the RCP6.2 scenario is limited to less than 1 degree C by 2100.
By contrast, the IPCC’s much more complex climate simulation projections, which have
temperature sensitivity set at two to three times greater than what is used in the TRCS model,
simulate the unlikely IPCC RCP8.5 used by CSSR’s authors. The global temperature increase
projected for 2100 is 3–5 degrees C, giving the false impression serious global warming is likely.
Part Three Fallacious Assertions
Throughout the CSSR, multiple claims
are made that cannot be verified and/or
that fly in the face of scientific evidence.
These assertions are not unique to
CSSR; many also appear in U.N. and
U.S. government reports and are
repeated by policymakers, educators, news reporters, celebrities, and opinion leaders—most of
whom blindly accept the claims as true without weighing the ample evidence to the contrary. It is
crucial scientists, researchers, and others with an interest in discussing objective scientific
evidence concerning the causes and consequences of climate change dispel these popular myths
and provide inquirers with the best available objective evidence.
Claim 1: Earth Has Never Been Warmer
The CSSR report’s authors assert since at least the end of the 1800s—and especially since the
1960s—there has been a particularly high global temperature increase that’s unquestionably
associated with human activities.39
Geologic data, however, put this contention in a fuller
context, revealing there has been much more warming in the past resulting from natural causes
than from human causes.
39
D.J. Wuebbles et al., supra note 1, p. 126.
Throughout the CSSR, multiple claims
are made that cannot be verified and/or
that fly in the face of scientific evidence.
- 18 -
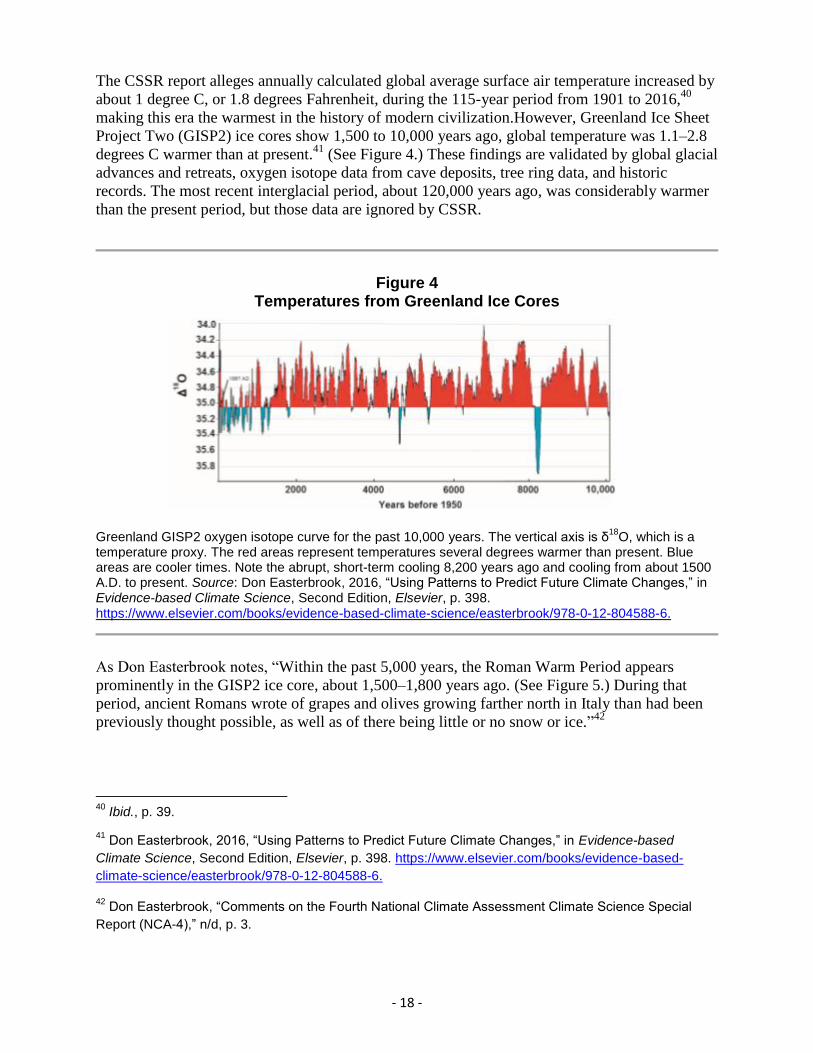
The CSSR report alleges annually calculated global average surface air temperature increased by
about 1 degree C, or 1.8 degrees Fahrenheit, during the 115-year period from 1901 to 2016,40
making this era the warmest in the history of modern civilization.However, Greenland Ice Sheet
Project Two (GISP2) ice cores show 1,500 to 10,000 years ago, global temperature was 1.1–2.8
degrees C warmer than at present.41
(See Figure 4.) These findings are validated by global glacial
advances and retreats, oxygen isotope data from cave deposits, tree ring data, and historic
records. The most recent interglacial period, about 120,000 years ago, was considerably warmer
than the present period, but those data are ignored by CSSR.
Figure 4 Temperatures from Greenland Ice Cores
Greenland GISP2 oxygen isotope curve for the past 10,000 years. The vertical axis is δ
18O, which is a
temperature proxy. The red areas represent temperatures several degrees warmer than present. Blue areas are cooler times. Note the abrupt, short-term cooling 8,200 years ago and cooling from about 1500 A.D. to present. Source: Don Easterbrook, 2016, “Using Patterns to Predict Future Climate Changes,” in Evidence-based Climate Science, Second Edition, Elsevier, p. 398. https://www.elsevier.com/books/evidence-based-climate-science/easterbrook/978-0-12-804588-6.
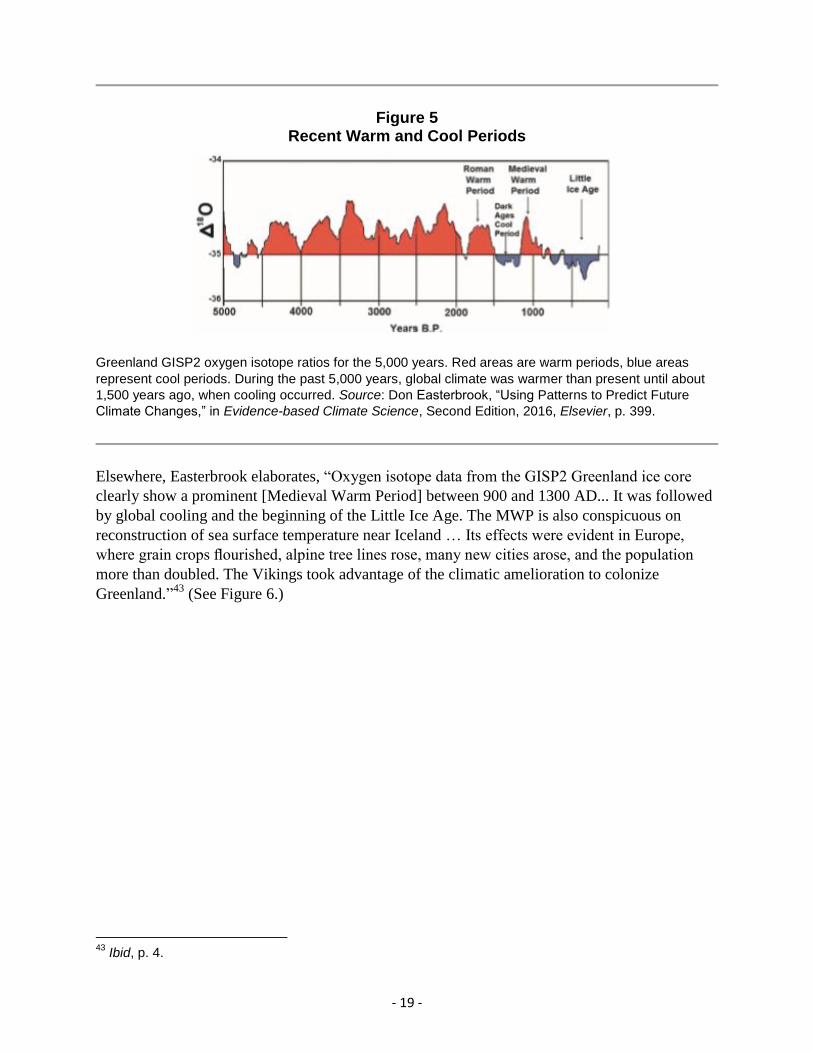
As Don Easterbrook notes, “Within the past 5,000 years, the Roman Warm Period appears
prominently in the GISP2 ice core, about 1,500–1,800 years ago. (See Figure 5.) During that
period, ancient Romans wrote of grapes and olives growing farther north in Italy than had been
previously thought possible, as well as of there being little or no snow or ice.”42
40
Ibid., p. 39.
41 Don Easterbrook, 2016, “Using Patterns to Predict Future Climate Changes,” in Evidence-based
Climate Science, Second Edition, Elsevier, p. 398. https://www.elsevier.com/books/evidence-based-
climate-science/easterbrook/978-0-12-804588-6.
42 Don Easterbrook, “Comments on the Fourth National Climate Assessment Climate Science Special
Report (NCA-4),” n/d, p. 3.
- 19 -
Figure 5 Recent Warm and Cool Periods
Greenland GISP2 oxygen isotope ratios for the 5,000 years. Red areas are warm periods, blue areas
represent cool periods. During the past 5,000 years, global climate was warmer than present until about
1,500 years ago, when cooling occurred. Source: Don Easterbrook, “Using Patterns to Predict Future
Climate Changes,” in Evidence-based Climate Science, Second Edition, 2016, Elsevier, p. 399.
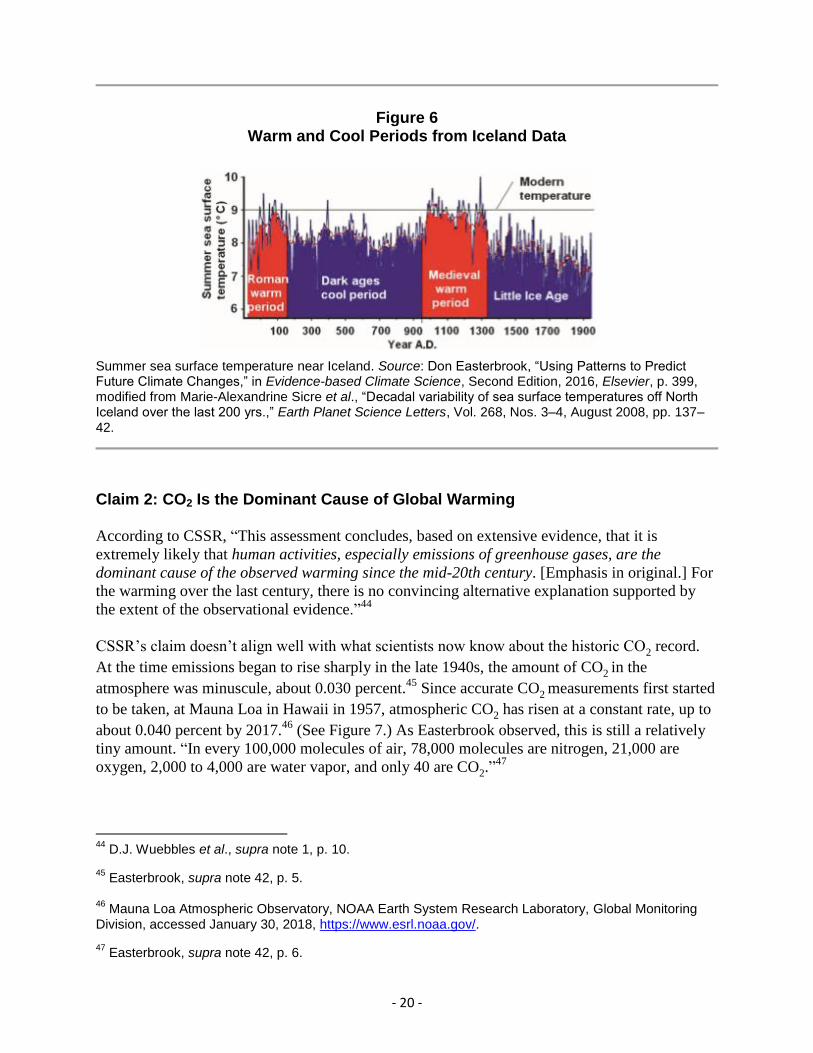
Elsewhere, Easterbrook elaborates, “Oxygen isotope data from the GISP2 Greenland ice core
clearly show a prominent [Medieval Warm Period] between 900 and 1300 AD... It was followed
by global cooling and the beginning of the Little Ice Age. The MWP is also conspicuous on
reconstruction of sea surface temperature near Iceland … Its effects were evident in Europe,
where grain crops flourished, alpine tree lines rose, many new cities arose, and the population
more than doubled. The Vikings took advantage of the climatic amelioration to colonize
Greenland.”43
(See Figure 6.)
43
Ibid, p. 4.
- 20 -
Figure 6 Warm and Cool Periods from Iceland Data
Summer sea surface temperature near Iceland. Source: Don Easterbrook, “Using Patterns to Predict Future Climate Changes,” in Evidence-based Climate Science, Second Edition, 2016, Elsevier, p. 399, modified from Marie-Alexandrine Sicre et al., “Decadal variability of sea surface temperatures off North Iceland over the last 200 yrs.,” Earth Planet Science Letters, Vol. 268, Nos. 3–4, August 2008, pp. 137–42.
Claim 2: CO2 Is the Dominant Cause of Global Warming
According to CSSR, “This assessment concludes, based on extensive evidence, that it is
extremely likely that human activities, especially emissions of greenhouse gases, are the
dominant cause of the observed warming since the mid-20th century. [Emphasis in original.] For
the warming over the last century, there is no convincing alternative explanation supported by
the extent of the observational evidence.”44
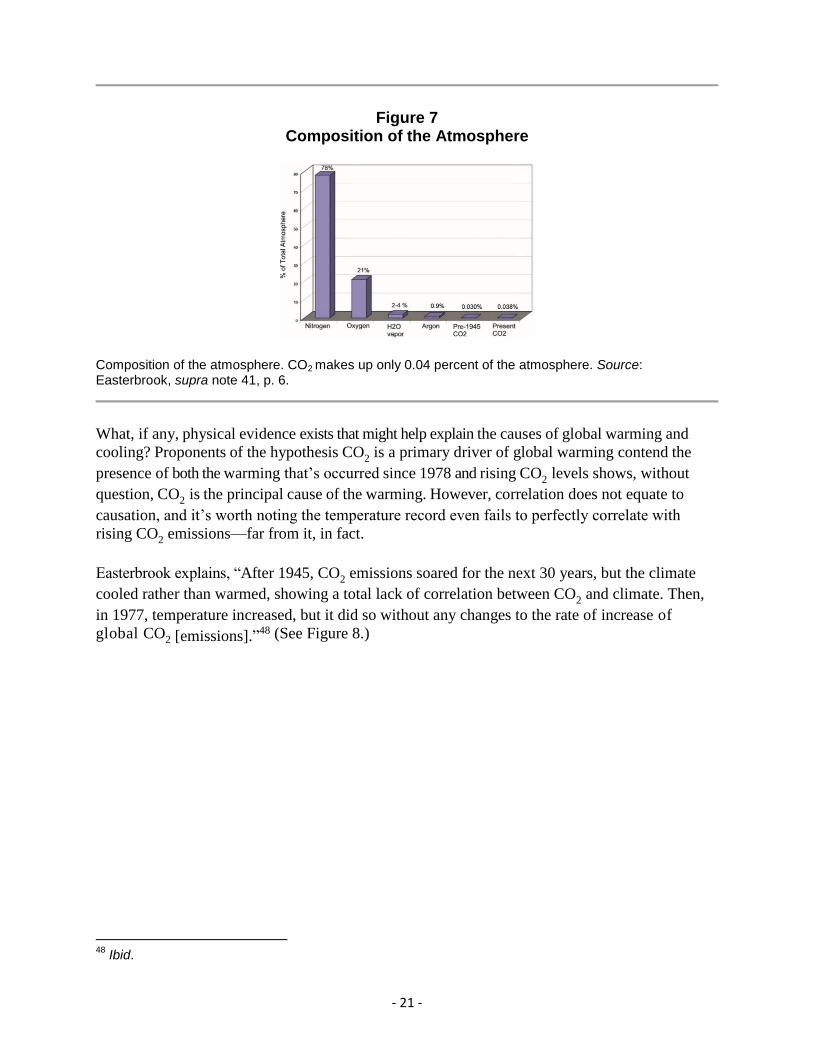
CSSR’s claim doesn’t align well with what scientists now know about the historic CO2 record.
At the time emissions began to rise sharply in the late 1940s, the amount of CO2 in the
atmosphere was minuscule, about 0.030 percent.45
Since accurate CO2 measurements first started
to be taken, at Mauna Loa in Hawaii in 1957, atmospheric CO2 has risen at a constant rate, up to
about 0.040 percent by 2017.46
(See Figure 7.) As Easterbrook observed, this is still a relatively
tiny amount. “In every 100,000 molecules of air, 78,000 molecules are nitrogen, 21,000 are
oxygen, 2,000 to 4,000 are water vapor, and only 40 are CO2.”47
44
D.J. Wuebbles et al., supra note 1, p. 10.
45 Easterbrook, supra note 42, p. 5.
46 Mauna Loa Atmospheric Observatory, NOAA Earth System Research Laboratory, Global Monitoring
Division, accessed January 30, 2018, https://www.esrl.noaa.gov/.
47 Easterbrook, supra note 42, p. 6.
- 21 -
Figure 7 Composition of the Atmosphere
Composition of the atmosphere. CO2 makes up only 0.04 percent of the atmosphere. Source: Easterbrook, supra note 41, p. 6.
What, if any, physical evidence exists that might help explain the causes of global warming and
cooling? Proponents of the hypothesis CO2 is a primary driver of global warming contend the
presence of both the warming that’s occurred since 1978 and rising CO2 levels shows, without
question, CO2 is the principal cause of the warming. However, correlation does not equate to
causation, and it’s worth noting the temperature record even fails to perfectly correlate with
rising CO2 emissions—far from it, in fact.
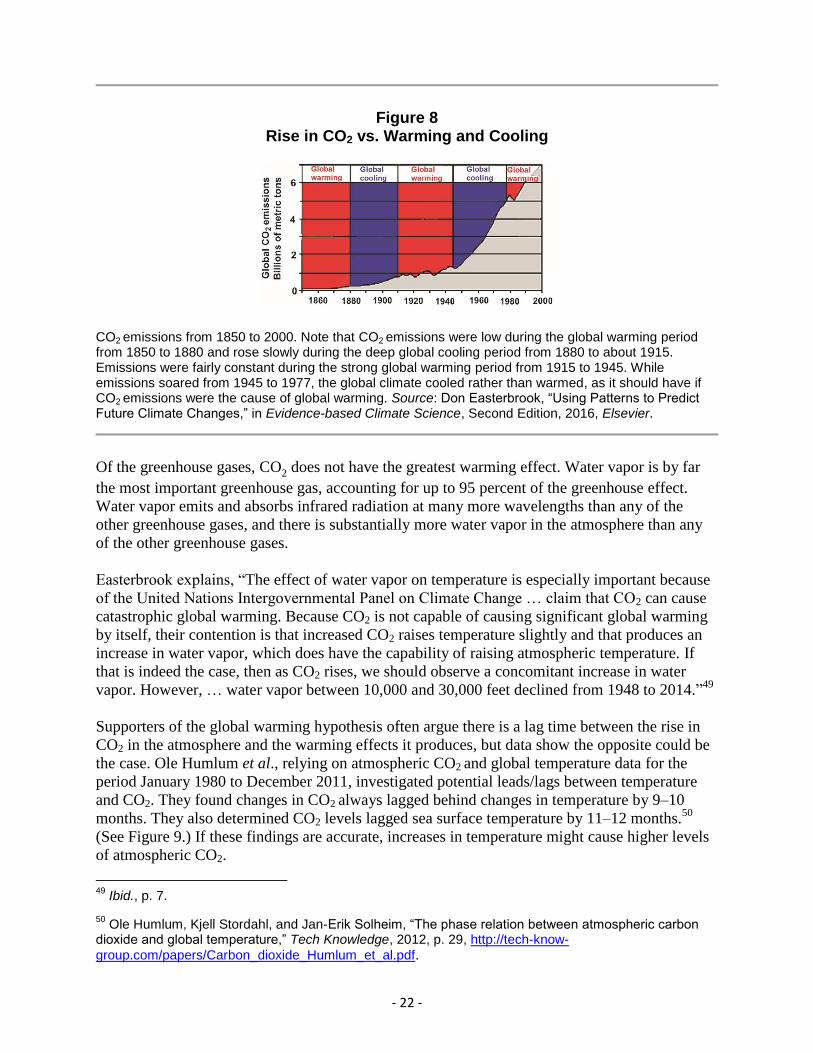
Easterbrook explains, “After 1945, CO2 emissions soared for the next 30 years, but the climate
cooled rather than warmed, showing a total lack of correlation between CO2 and climate. Then,
in 1977, temperature increased, but it did so without any changes to the rate of increase of
global CO2 [emissions].”48
(See Figure 8.)
48
Ibid.
- 22 -
Figure 8 Rise in CO2 vs. Warming and Cooling
CO2 emissions from 1850 to 2000. Note that CO2 emissions were low during the global warming period from 1850 to 1880 and rose slowly during the deep global cooling period from 1880 to about 1915. Emissions were fairly constant during the strong global warming period from 1915 to 1945. While emissions soared from 1945 to 1977, the global climate cooled rather than warmed, as it should have if CO2
emissions were the cause of global warming. Source: Don Easterbrook, “Using Patterns to Predict
Future Climate Changes,” in Evidence-based Climate Science, Second Edition, 2016, Elsevier.
Of the greenhouse gases, CO2 does not have the greatest warming effect. Water vapor is by far
the most important greenhouse gas, accounting for up to 95 percent of the greenhouse effect.
Water vapor emits and absorbs infrared radiation at many more wavelengths than any of the
other greenhouse gases, and there is substantially more water vapor in the atmosphere than any
of the other greenhouse gases.
Easterbrook explains, “The effect of water vapor on temperature is especially important because
of the United Nations Intergovernmental Panel on Climate Change … claim that CO2 can cause
catastrophic global warming. Because CO2 is not capable of causing significant global warming
by itself, their contention is that increased CO2 raises temperature slightly and that produces an
increase in water vapor, which does have the capability of raising atmospheric temperature. If
that is indeed the case, then as CO2 rises, we should observe a concomitant increase in water
vapor. However, … water vapor between 10,000 and 30,000 feet declined from 1948 to 2014.”49
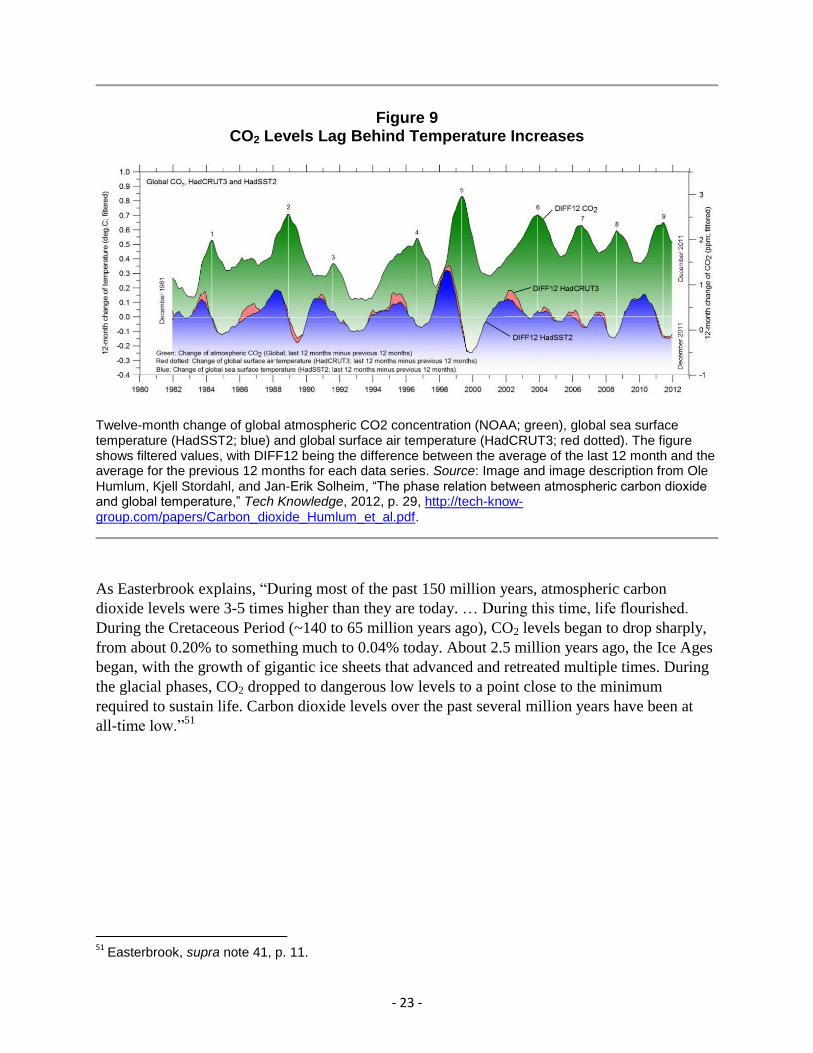
Supporters of the global warming hypothesis often argue there is a lag time between the rise in
CO2 in the atmosphere and the warming effects it produces, but data show the opposite could be
the case. Ole Humlum et al., relying on atmospheric CO2 and global temperature data for the
period January 1980 to December 2011, investigated potential leads/lags between temperature
and CO2. They found changes in CO2 always lagged behind changes in temperature by 9–10
months. They also determined CO2 levels lagged sea surface temperature by 11–12 months.50
(See Figure 9.) If these findings are accurate, increases in temperature might cause higher levels
of atmospheric CO2.
49
Ibid., p. 7.
50 Ole Humlum, Kjell Stordahl, and Jan-Erik Solheim, “The phase relation between atmospheric carbon
dioxide and global temperature,” Tech Knowledge, 2012, p. 29, http://tech-know-
group.com/papers/Carbon_dioxide_Humlum_et_al.pdf.
- 23 -
Figure 9 CO2 Levels Lag Behind Temperature Increases
Twelve-month change of global atmospheric CO2 concentration (NOAA; green), global sea surface temperature (HadSST2; blue) and global surface air temperature (HadCRUT3; red dotted). The figure shows filtered values, with DIFF12 being the difference between the average of the last 12 month and the average for the previous 12 months for each data series. Source: Image and image description from Ole Humlum, Kjell Stordahl, and Jan-Erik Solheim, “The phase relation between atmospheric carbon dioxide and global temperature,” Tech Knowledge, 2012, p. 29, http://tech-know-group.com/papers/Carbon_dioxide_Humlum_et_al.pdf.
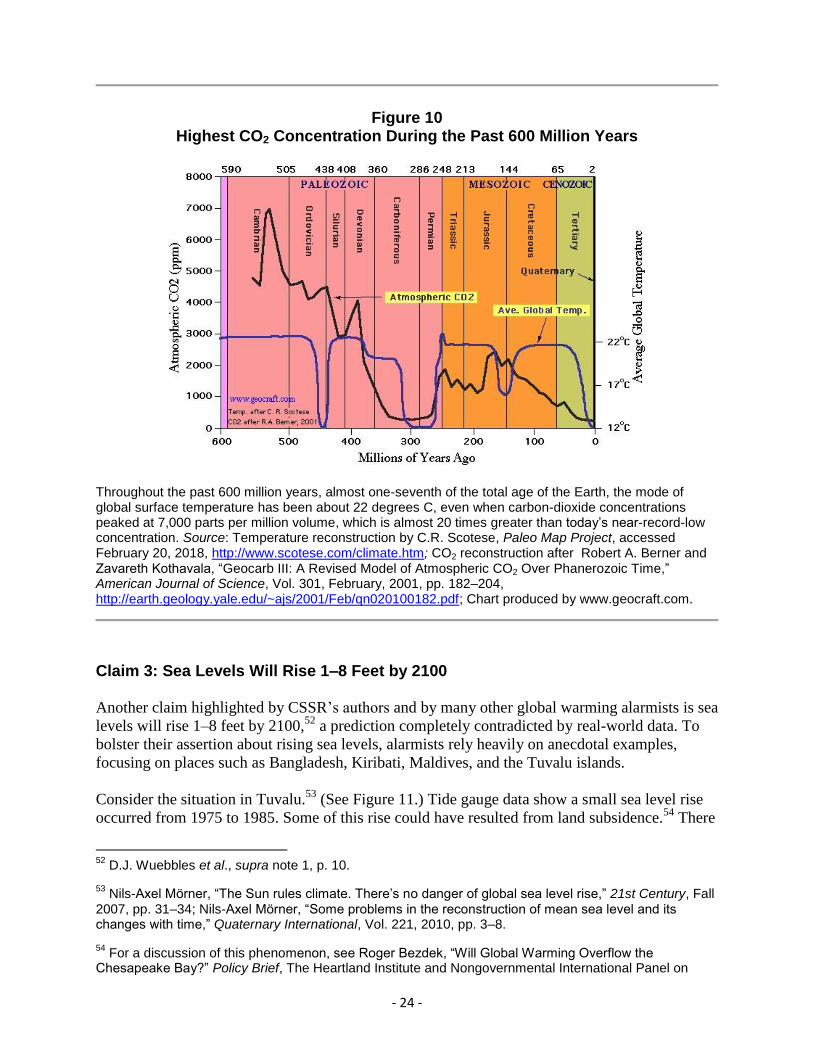
As Easterbrook explains, “During most of the past 150 million years, atmospheric carbon
dioxide levels were 3-5 times higher than they are today. … During this time, life flourished.
During the Cretaceous Period (~140 to 65 million years ago), CO2 levels began to drop sharply,
from about 0.20% to something much to 0.04% today. About 2.5 million years ago, the Ice Ages
began, with the growth of gigantic ice sheets that advanced and retreated multiple times. During
the glacial phases, CO2 dropped to dangerous low levels to a point close to the minimum
required to sustain life. Carbon dioxide levels over the past several million years have been at
all-time low.”51
51
Easterbrook, supra note 41, p. 11.
- 24 -
Figure 10 Highest CO2 Concentration During the Past 600 Million Years
Throughout the past 600 million years, almost one-seventh of the total age of the Earth, the mode of global surface temperature has been about 22 degrees C, even when carbon-dioxide concentrations peaked at 7,000 parts per million volume, which is almost 20 times greater than today’s near-record-low concentration. Source: Temperature reconstruction by C.R. Scotese, Paleo Map Project, accessed February 20, 2018, http://www.scotese.com/climate.htm; CO2 reconstruction after Robert A. Berner and Zavareth Kothavala, “Geocarb III: A Revised Model of Atmospheric CO2 Over Phanerozoic Time,” American Journal of Science, Vol. 301, February, 2001, pp. 182–204, http://earth.geology.yale.edu/~ajs/2001/Feb/qn020100182.pdf; Chart produced by www.geocraft.com.
Claim 3: Sea Levels Will Rise 1–8 Feet by 2100
Another claim highlighted by CSSR’s authors and by many other global warming alarmists is sea
levels will rise 1–8 feet by 2100,52
a prediction completely contradicted by real-world data. To
bolster their assertion about rising sea levels, alarmists rely heavily on anecdotal examples,
focusing on places such as Bangladesh, Kiribati, Maldives, and the Tuvalu islands.
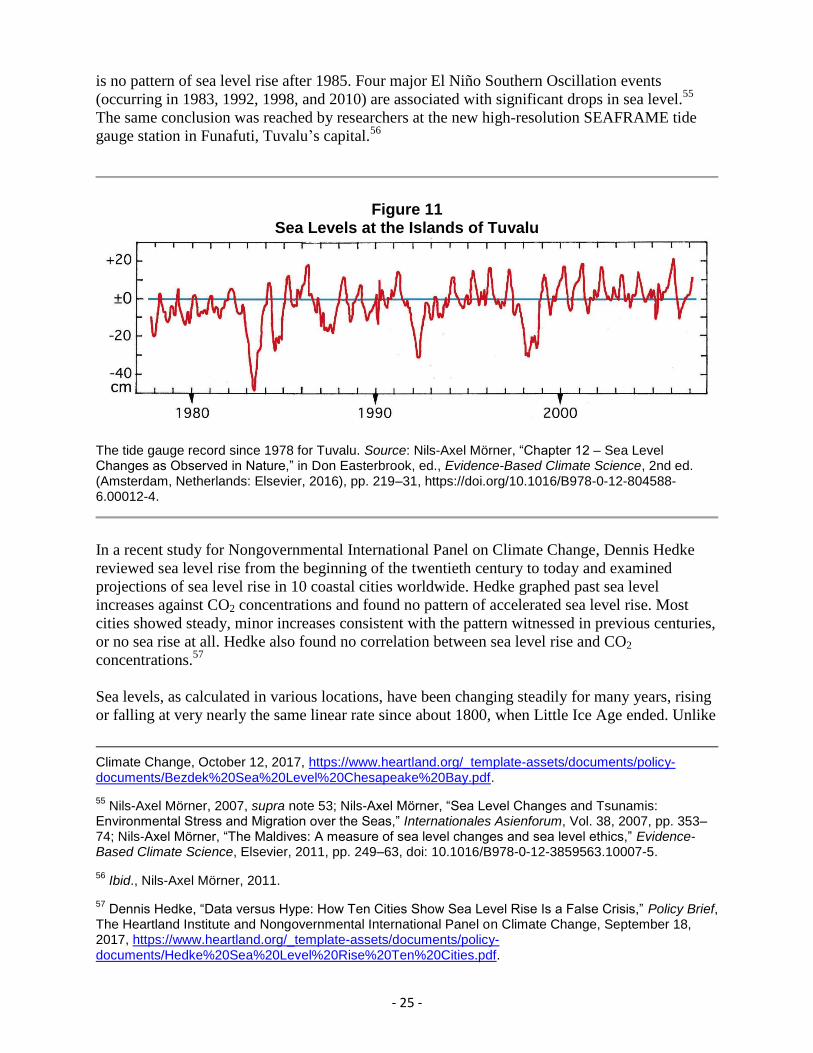
Consider the situation in Tuvalu.53
(See Figure 11.) Tide gauge data show a small sea level rise
occurred from 1975 to 1985. Some of this rise could have resulted from land subsidence.54
There
52
D.J. Wuebbles et al., supra note 1, p. 10.
53 Nils-Axel Mörner, “The Sun rules climate. There’s no danger of global sea level rise,” 21st Century, Fall
2007, pp. 31–34; Nils-Axel Mörner, “Some problems in the reconstruction of mean sea level and its changes with time,” Quaternary International, Vol. 221, 2010, pp. 3–8.
54 For a discussion of this phenomenon, see Roger Bezdek, “Will Global Warming Overflow the
Chesapeake Bay?” Policy Brief, The Heartland Institute and Nongovernmental International Panel on
- 25 -
is no pattern of sea level rise after 1985. Four major El Niño Southern Oscillation events
(occurring in 1983, 1992, 1998, and 2010) are associated with significant drops in sea level.55
The same conclusion was reached by researchers at the new high-resolution SEAFRAME tide
gauge station in Funafuti, Tuvalu’s capital.56
Figure 11 Sea Levels at the Islands of Tuvalu
The tide gauge record since 1978 for Tuvalu. Source: Nils-Axel Mörner, “Chapter 12 – Sea Level Changes as Observed in Nature,” in Don Easterbrook, ed., Evidence-Based Climate Science, 2nd ed. (Amsterdam, Netherlands: Elsevier, 2016), pp. 219–31, https://doi.org/10.1016/B978-0-12-804588-6.00012-4.
In a recent study for Nongovernmental International Panel on Climate Change, Dennis Hedke
reviewed sea level rise from the beginning of the twentieth century to today and examined
projections of sea level rise in 10 coastal cities worldwide. Hedke graphed past sea level
increases against CO2 concentrations and found no pattern of accelerated sea level rise. Most
cities showed steady, minor increases consistent with the pattern witnessed in previous centuries,
or no sea rise at all. Hedke also found no correlation between sea level rise and CO2
concentrations.57
Sea levels, as calculated in various locations, have been changing steadily for many years, rising
or falling at very nearly the same linear rate since about 1800, when Little Ice Age ended. Unlike
Climate Change, October 12, 2017, https://www.heartland.org/_template-assets/documents/policy-documents/Bezdek%20Sea%20Level%20Chesapeake%20Bay.pdf.
55 Nils-Axel Mörner, 2007, supra note 53; Nils-Axel Mörner, “Sea Level Changes and Tsunamis:
Environmental Stress and Migration over the Seas,” Internationales Asienforum, Vol. 38, 2007, pp. 353–74; Nils-Axel Mörner, “The Maldives: A measure of sea level changes and sea level ethics,” Evidence-Based Climate Science, Elsevier, 2011, pp. 249–63, doi: 10.1016/B978-0-12-3859563.10007-5.
56 Ibid., Nils-Axel Mörner, 2011.
57 Dennis Hedke, “Data versus Hype: How Ten Cities Show Sea Level Rise Is a False Crisis,” Policy Brief,
The Heartland Institute and Nongovernmental International Panel on Climate Change, September 18, 2017, https://www.heartland.org/_template-assets/documents/policy-documents/Hedke%20Sea%20Level%20Rise%20Ten%20Cities.pdf.
- 26 -
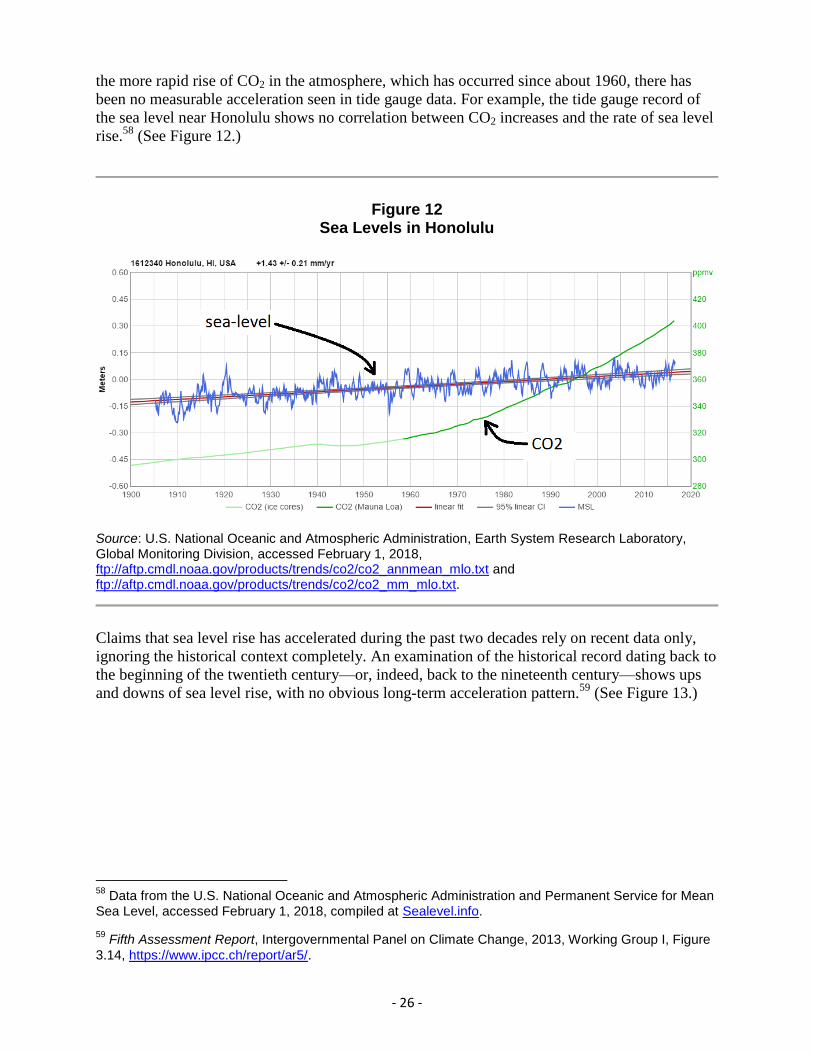
the more rapid rise of CO2 in the atmosphere, which has occurred since about 1960, there has
been no measurable acceleration seen in tide gauge data. For example, the tide gauge record of
the sea level near Honolulu shows no correlation between CO2 increases and the rate of sea level
rise.58
(See Figure 12.)
Figure 12 Sea Levels in Honolulu
Source: U.S. National Oceanic and Atmospheric Administration, Earth System Research Laboratory, Global Monitoring Division, accessed February 1, 2018, ftp://aftp.cmdl.noaa.gov/products/trends/co2/co2_annmean_mlo.txt and ftp://aftp.cmdl.noaa.gov/products/trends/co2/co2_mm_mlo.txt.
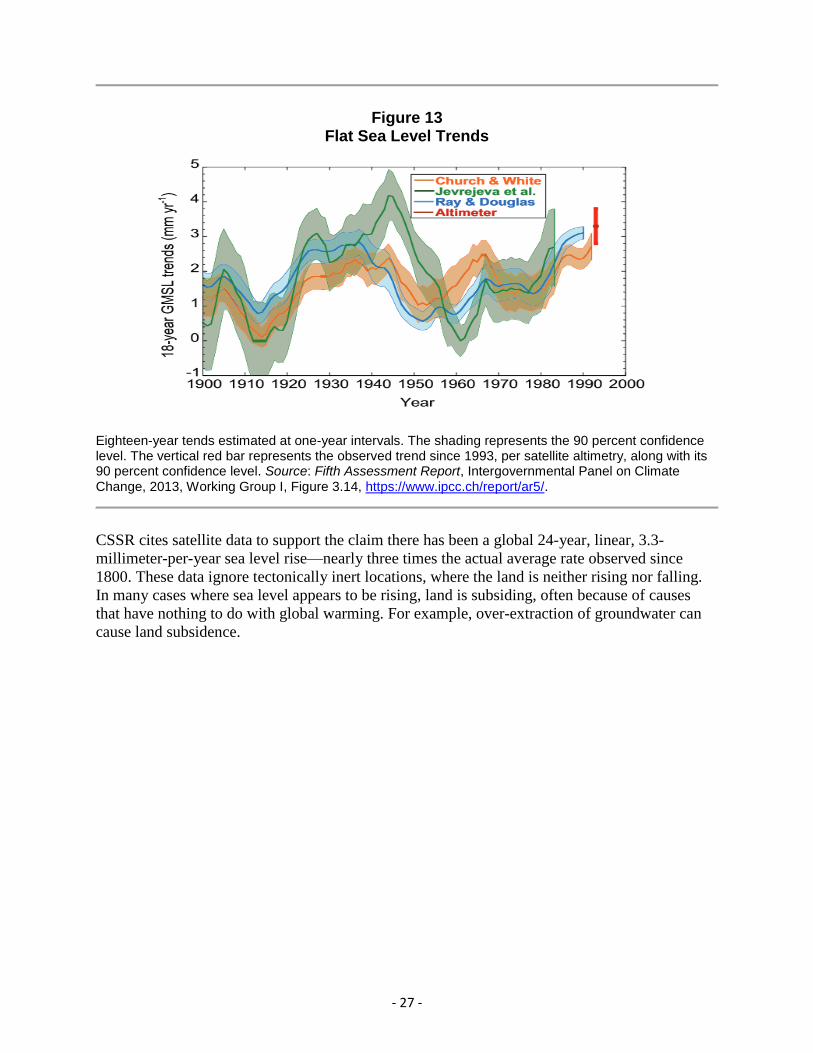
Claims that sea level rise has accelerated during the past two decades rely on recent data only,
ignoring the historical context completely. An examination of the historical record dating back to
the beginning of the twentieth century—or, indeed, back to the nineteenth century—shows ups
and downs of sea level rise, with no obvious long-term acceleration pattern.59
(See Figure 13.)
58
Data from the U.S. National Oceanic and Atmospheric Administration and Permanent Service for Mean Sea Level, accessed February 1, 2018, compiled at Sealevel.info.
59 Fifth Assessment Report, Intergovernmental Panel on Climate Change, 2013, Working Group I, Figure
3.14, https://www.ipcc.ch/report/ar5/.
- 27 -
Figure 13 Flat Sea Level Trends
Eighteen-year tends estimated at one-year intervals. The shading represents the 90 percent confidence level. The vertical red bar represents the observed trend since 1993, per satellite altimetry, along with its 90 percent confidence level. Source: Fifth Assessment Report, Intergovernmental Panel on Climate Change, 2013, Working Group I, Figure 3.14, https://www.ipcc.ch/report/ar5/.
CSSR cites satellite data to support the claim there has been a global 24-year, linear, 3.3-
millimeter-per-year sea level rise—nearly three times the actual average rate observed since
1800. These data ignore tectonically inert locations, where the land is neither rising nor falling.
In many cases where sea level appears to be rising, land is subsiding, often because of causes
that have nothing to do with global warming. For example, over-extraction of groundwater can
cause land subsidence.
- 28 -
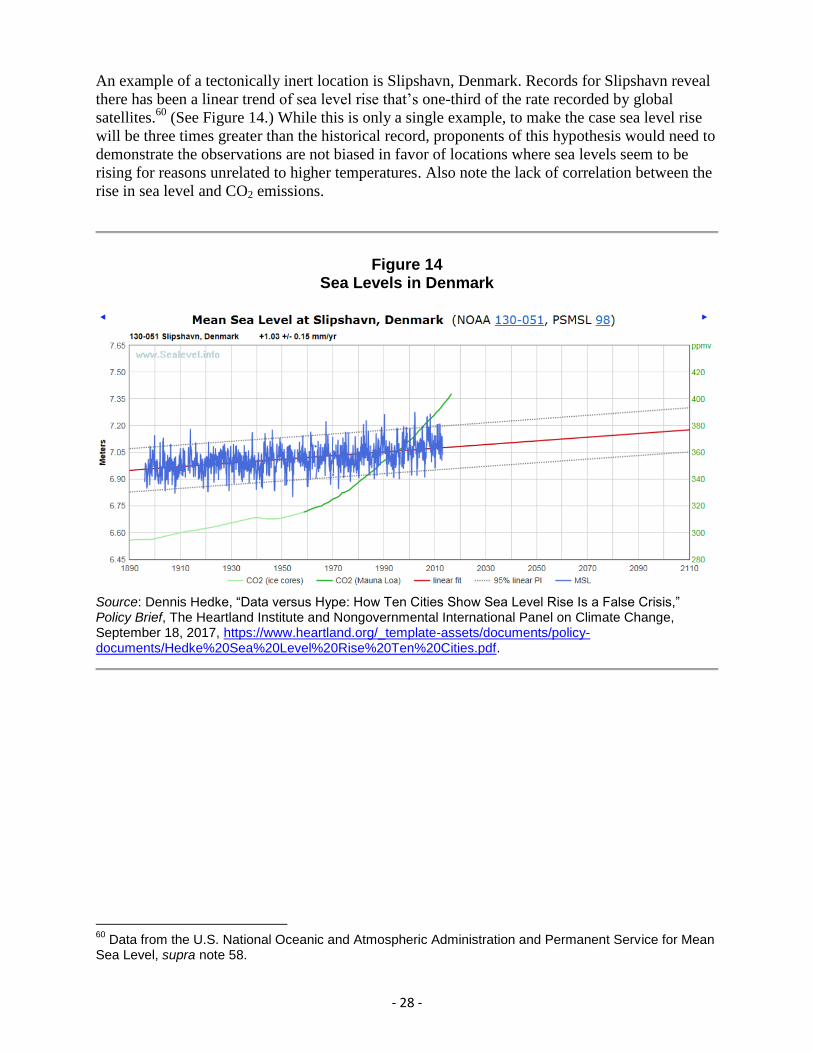
An example of a tectonically inert location is Slipshavn, Denmark. Records for Slipshavn reveal
there has been a linear trend of sea level rise that’s one-third of the rate recorded by global
satellites.60
(See Figure 14.) While this is only a single example, to make the case sea level rise
will be three times greater than the historical record, proponents of this hypothesis would need to
demonstrate the observations are not biased in favor of locations where sea levels seem to be
rising for reasons unrelated to higher temperatures. Also note the lack of correlation between the
rise in sea level and CO2 emissions.
Figure 14 Sea Levels in Denmark
Source: Dennis Hedke, “Data versus Hype: How Ten Cities Show Sea Level Rise Is a False Crisis,” Policy Brief, The Heartland Institute and Nongovernmental International Panel on Climate Change, September 18, 2017, https://www.heartland.org/_template-assets/documents/policy-documents/Hedke%20Sea%20Level%20Rise%20Ten%20Cities.pdf.
60
Data from the U.S. National Oceanic and Atmospheric Administration and Permanent Service for Mean Sea Level, supra note 58.
- 29 -
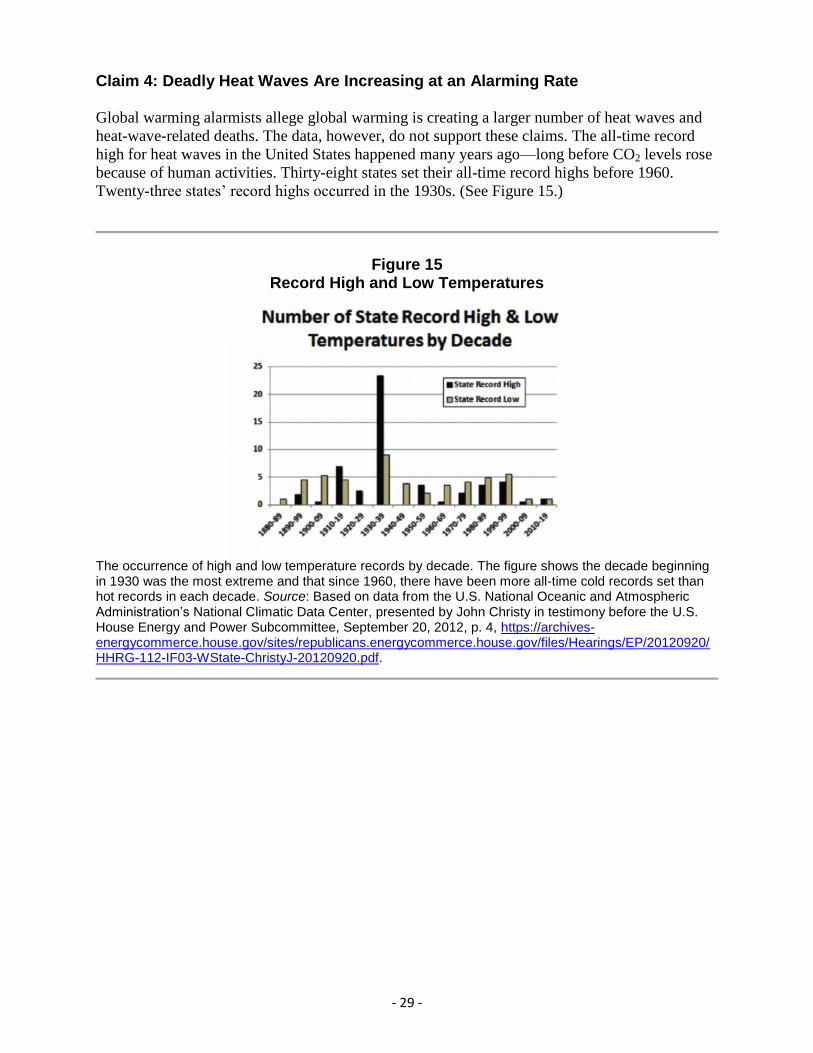
Claim 4: Deadly Heat Waves Are Increasing at an Alarming Rate
Global warming alarmists allege global warming is creating a larger number of heat waves and
heat-wave-related deaths. The data, however, do not support these claims. The all-time record
high for heat waves in the United States happened many years ago—long before CO2 levels rose
because of human activities. Thirty-eight states set their all-time record highs before 1960.
Twenty-three states’ record highs occurred in the 1930s. (See Figure 15.)
Figure 15 Record High and Low Temperatures
The occurrence of high and low temperature records by decade. The figure shows the decade beginning in 1930 was the most extreme and that since 1960, there have been more all-time cold records set than hot records in each decade. Source: Based on data from the U.S. National Oceanic and Atmospheric Administration’s National Climatic Data Center, presented by John Christy in testimony before the U.S. House Energy and Power Subcommittee, September 20, 2012, p. 4, https://archives-energycommerce.house.gov/sites/republicans.energycommerce.house.gov/files/Hearings/EP/20120920/HHRG-112-IF03-WState-ChristyJ-20120920.pdf.
- 30 -
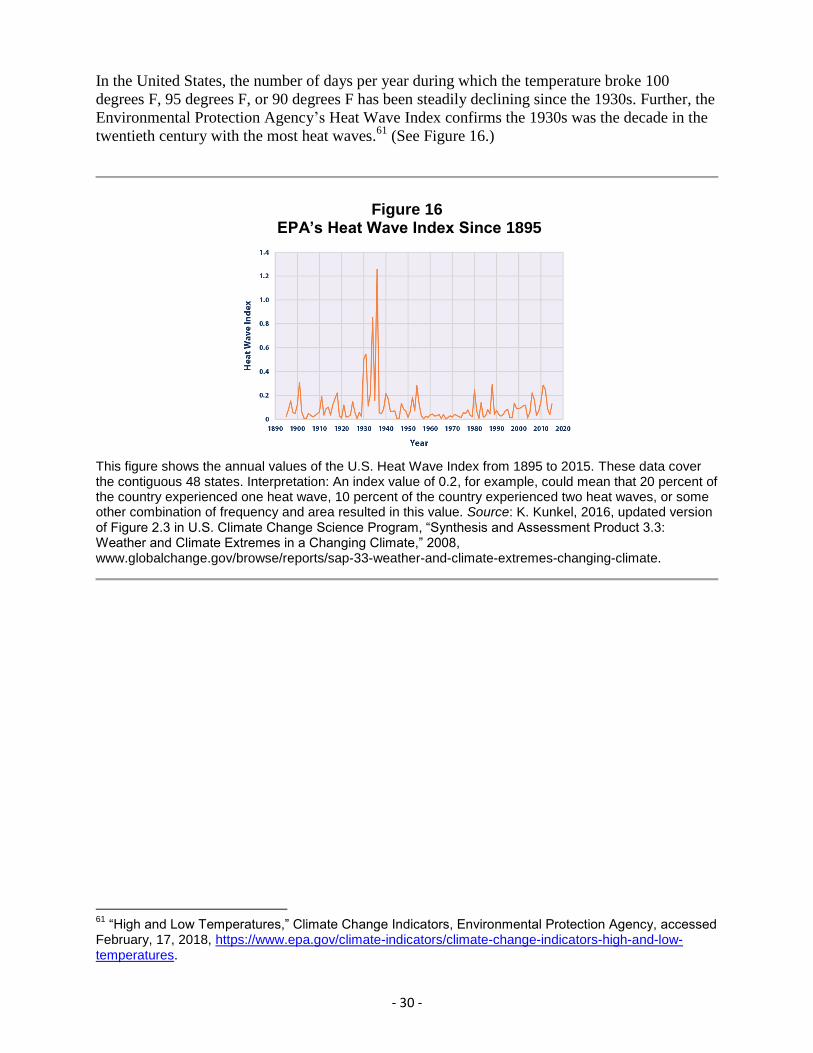
In the United States, the number of days per year during which the temperature broke 100
degrees F, 95 degrees F, or 90 degrees F has been steadily declining since the 1930s. Further, the
Environmental Protection Agency’s Heat Wave Index confirms the 1930s was the decade in the
twentieth century with the most heat waves.61
(See Figure 16.)
Figure 16 EPA’s Heat Wave Index Since 1895
This figure shows the annual values of the U.S. Heat Wave Index from 1895 to 2015. These data cover the contiguous 48 states. Interpretation: An index value of 0.2, for example, could mean that 20 percent of the country experienced one heat wave, 10 percent of the country experienced two heat waves, or some other combination of frequency and area resulted in this value. Source: K. Kunkel, 2016, updated version of Figure 2.3 in U.S. Climate Change Science Program, “Synthesis and Assessment Product 3.3: Weather and Climate Extremes in a Changing Climate,” 2008, www.globalchange.gov/browse/reports/sap-33-weather-and-climate-extremes-changing-climate.
61
“High and Low Temperatures,” Climate Change Indicators, Environmental Protection Agency, accessed February, 17, 2018, https://www.epa.gov/climate-indicators/climate-change-indicators-high-and-low-temperatures.
- 31 -
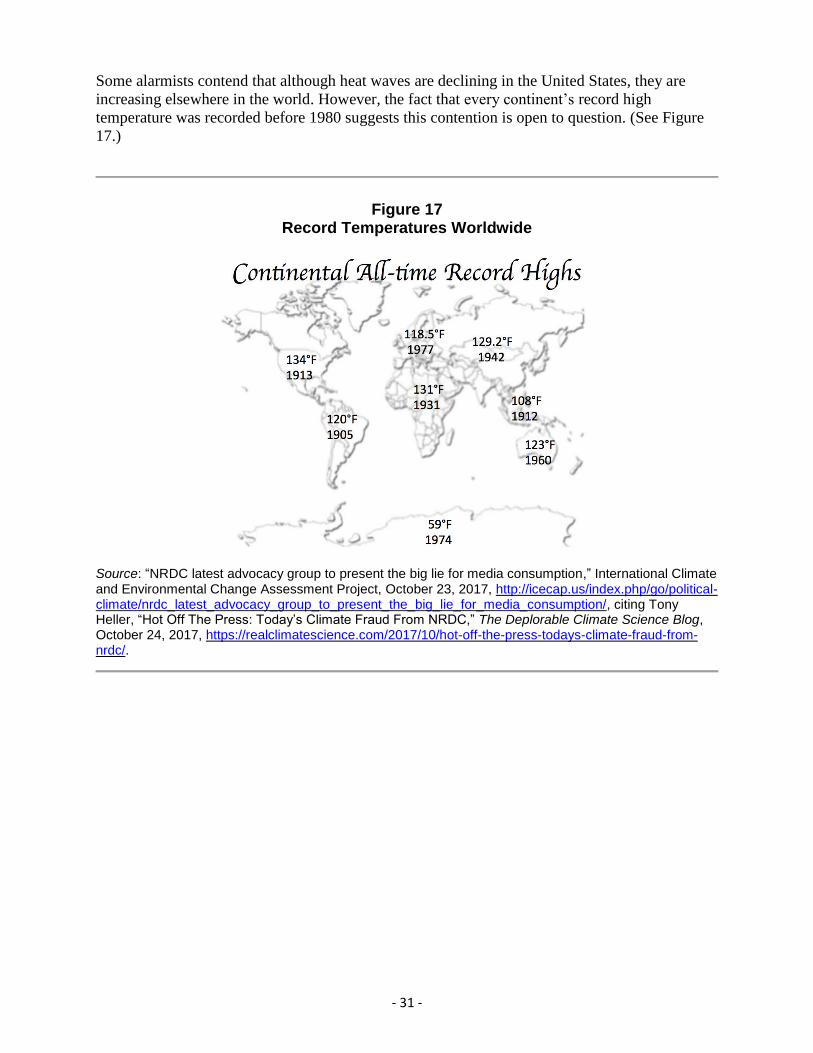
Some alarmists contend that although heat waves are declining in the United States, they are
increasing elsewhere in the world. However, the fact that every continent’s record high
temperature was recorded before 1980 suggests this contention is open to question. (See Figure
17.)
Figure 17 Record Temperatures Worldwide
Source: “NRDC latest advocacy group to present the big lie for media consumption,” International Climate and Environmental Change Assessment Project, October 23, 2017, http://icecap.us/index.php/go/political-climate/nrdc_latest_advocacy_group_to_present_the_big_lie_for_media_consumption/, citing Tony Heller, “Hot Off The Press: Today’s Climate Fraud From NRDC,” The Deplorable Climate Science Blog, October 24, 2017, https://realclimatescience.com/2017/10/hot-off-the-press-todays-climate-fraud-from-nrdc/.
- 32 -
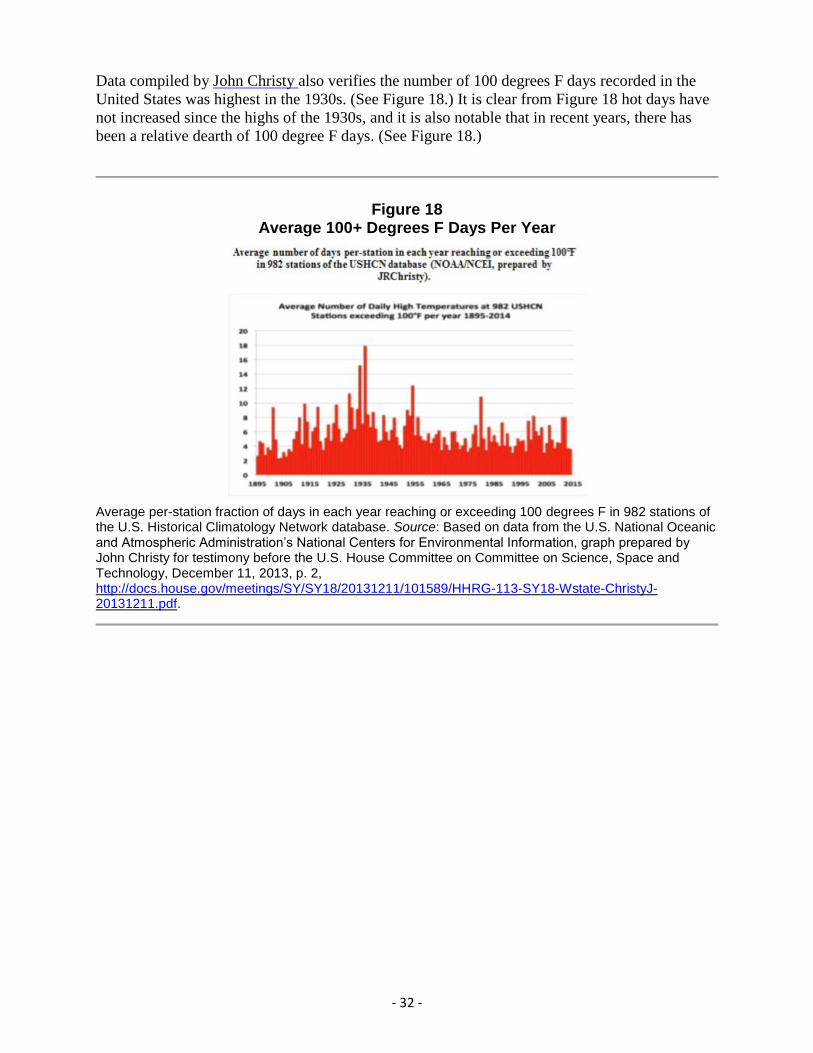
Data compiled by John Christy also verifies the number of 100 degrees F days recorded in the
United States was highest in the 1930s. (See Figure 18.) It is clear from Figure 18 hot days have
not increased since the highs of the 1930s, and it is also notable that in recent years, there has
been a relative dearth of 100 degree F days. (See Figure 18.)
Figure 18 Average 100+ Degrees F Days Per Year
Average per-station fraction of days in each year reaching or exceeding 100 degrees F in 982 stations of the U.S. Historical Climatology Network database. Source: Based on data from the U.S. National Oceanic and Atmospheric Administration’s National Centers for Environmental Information, graph prepared by John Christy for testimony before the U.S. House Committee on Committee on Science, Space and Technology, December 11, 2013, p. 2, http://docs.house.gov/meetings/SY/SY18/20131211/101589/HHRG-113-SY18-Wstate-ChristyJ-20131211.pdf.
- 33 -
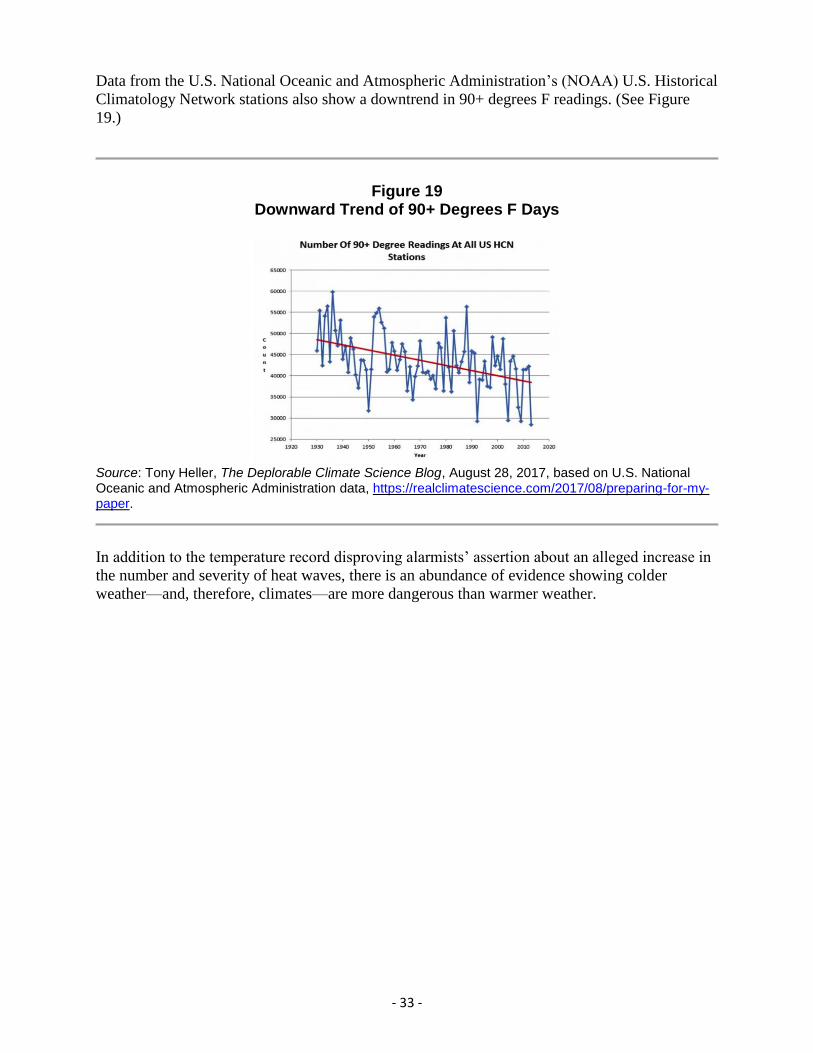
Data from the U.S. National Oceanic and Atmospheric Administration’s (NOAA) U.S. Historical
Climatology Network stations also show a downtrend in 90+ degrees F readings. (See Figure
19.)
Figure 19 Downward Trend of 90+ Degrees F Days
Source: Tony Heller, The Deplorable Climate Science Blog, August 28, 2017, based on U.S. National Oceanic and Atmospheric Administration data, https://realclimatescience.com/2017/08/preparing-for-my-paper.
In addition to the temperature record disproving alarmists’ assertion about an alleged increase in
the number and severity of heat waves, there is an abundance of evidence showing colder
weather—and, therefore, climates—are more dangerous than warmer weather.
- 34 -
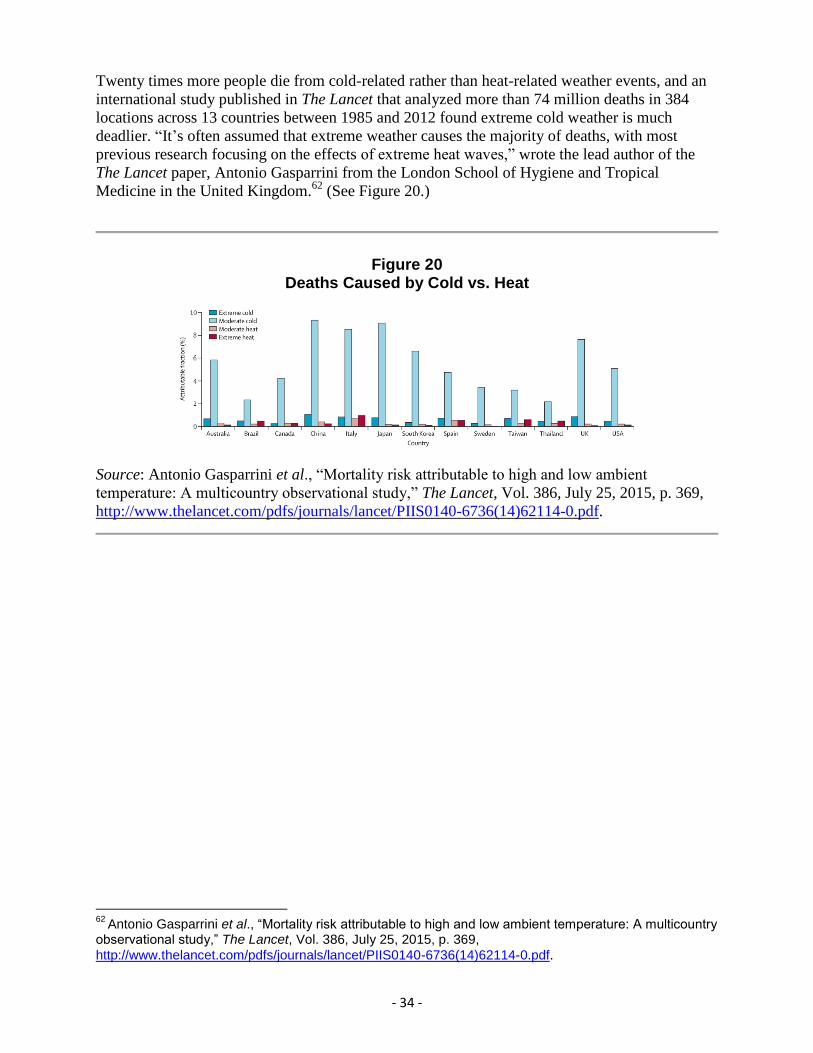
Twenty times more people die from cold-related rather than heat-related weather events, and an
international study published in The Lancet that analyzed more than 74 million deaths in 384
locations across 13 countries between 1985 and 2012 found extreme cold weather is much
deadlier. “It’s often assumed that extreme weather causes the majority of deaths, with most
previous research focusing on the effects of extreme heat waves,” wrote the lead author of the
The Lancet paper, Antonio Gasparrini from the London School of Hygiene and Tropical
Medicine in the United Kingdom.62
(See Figure 20.)
Figure 20 Deaths Caused by Cold vs. Heat
Source: Antonio Gasparrini et al., “Mortality risk attributable to high and low ambient
temperature: A multicountry observational study,” The Lancet, Vol. 386, July 25, 2015, p. 369,
http://www.thelancet.com/pdfs/journals/lancet/PIIS0140-6736(14)62114-0.pdf.
62
Antonio Gasparrini et al., “Mortality risk attributable to high and low ambient temperature: A multicountry observational study,” The Lancet, Vol. 386, July 25, 2015, p. 369,
http://www.thelancet.com/pdfs/journals/lancet/PIIS0140-6736(14)62114-0.pdf.
- 35 -
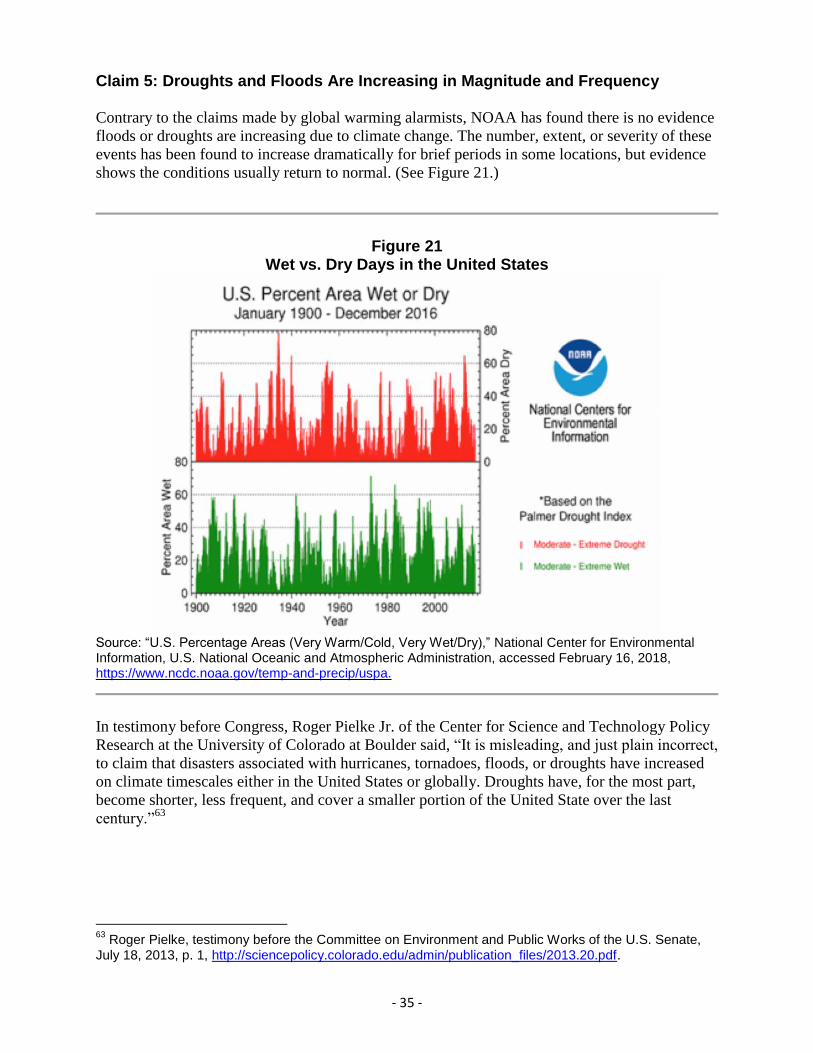
Claim 5: Droughts and Floods Are Increasing in Magnitude and Frequency
Contrary to the claims made by global warming alarmists, NOAA has found there is no evidence
floods or droughts are increasing due to climate change. The number, extent, or severity of these
events has been found to increase dramatically for brief periods in some locations, but evidence
shows the conditions usually return to normal. (See Figure 21.)
Figure 21 Wet vs. Dry Days in the United States
Source: “U.S. Percentage Areas (Very Warm/Cold, Very Wet/Dry),” National Center for Environmental Information, U.S. National Oceanic and Atmospheric Administration, accessed February 16, 2018, https://www.ncdc.noaa.gov/temp-and-precip/uspa.
In testimony before Congress, Roger Pielke Jr. of the Center for Science and Technology Policy
Research at the University of Colorado at Boulder said, “It is misleading, and just plain incorrect,
to claim that disasters associated with hurricanes, tornadoes, floods, or droughts have increased
on climate timescales either in the United States or globally. Droughts have, for the most part,
become shorter, less frequent, and cover a smaller portion of the United State over the last
century.”63
63
Roger Pielke, testimony before the Committee on Environment and Public Works of the U.S. Senate, July 18, 2013, p. 1, http://sciencepolicy.colorado.edu/admin/publication_files/2013.20.pdf.
- 36 -
David Legates, professor of Climatology at the University of Delaware, said in June 2014 in a
requested statement to the Environment and Public Works Committee of the U.S. Senate:
My overall conclusion is that droughts in the United States are more frequent and more
intense during colder periods. Thus, the historical record does not warrant a claim that
global warming is likely to negatively impact agricultural activities.
Given the limitations of the models not
only in predicting global air
temperatures but also in estimating
precipitation and soil moisture
conditions, it seems that a more
reasonable approach is not to rely on the
model prognostications, but rather to
focus on policies that allow for
adaptation to the observed variability in
precipitation and soil moisture.
Droughts that have happened in the past are likely to occur again, and with likely similar
frequencies and intensities; thus, preparation for their return is a better strategy than
trying to mitigate them through draconian CO2 emission control policies.64
A 2015 study by Cook et al. found megadroughts occurring during the past 2,000 years have
been generally worse and lasted longer in periods prior to humans’ increased reliance on fossil
fuels.65
Data showing no connection between droughts and climate change have largely been
ignored by alarmists, however.
The media and alarmists are often quick to see long-term dangers in short-term, transient event.
When an extended drought began in Texas in 2010 and worsened in 2011, there were fears this
this event marked the start of a “permadrought.” Three wet years followed the Texas drought,
culminating in major flooding caused by Hurricane Harvey in 2017. Many alarmists then alleged
climate change might be to blame for a new era of severe flood-causing storms.
64
David Legates, “Statement to the Environment and Public Works Committee,” U.S. Senate, June 3, 2014, p. 7, https://www.epw.senate.gov/public/_cache/files/a/a/aa8f25be-f093-47b1-bb26-1eb4c4a23de2/01AFD79733D77F24A71FEF9DAFCCB056.6314witnesstestimonylegates.pdf.
65 Edward Cook et al., “Old World megadroughts and pluvials during the Common Era,” Science
Advances, Vol. 1, No. 10, November 6, 2015,
http://advances.sciencemag.org/content/1/10/e1500561.full.
My overall conclusion is that droughts in
the United States are more frequent and
more intense during colder periods. Thus,
the historical record does not warrant a
claim that global warming is likely to
negatively impact agricultural activities.
- 37 -
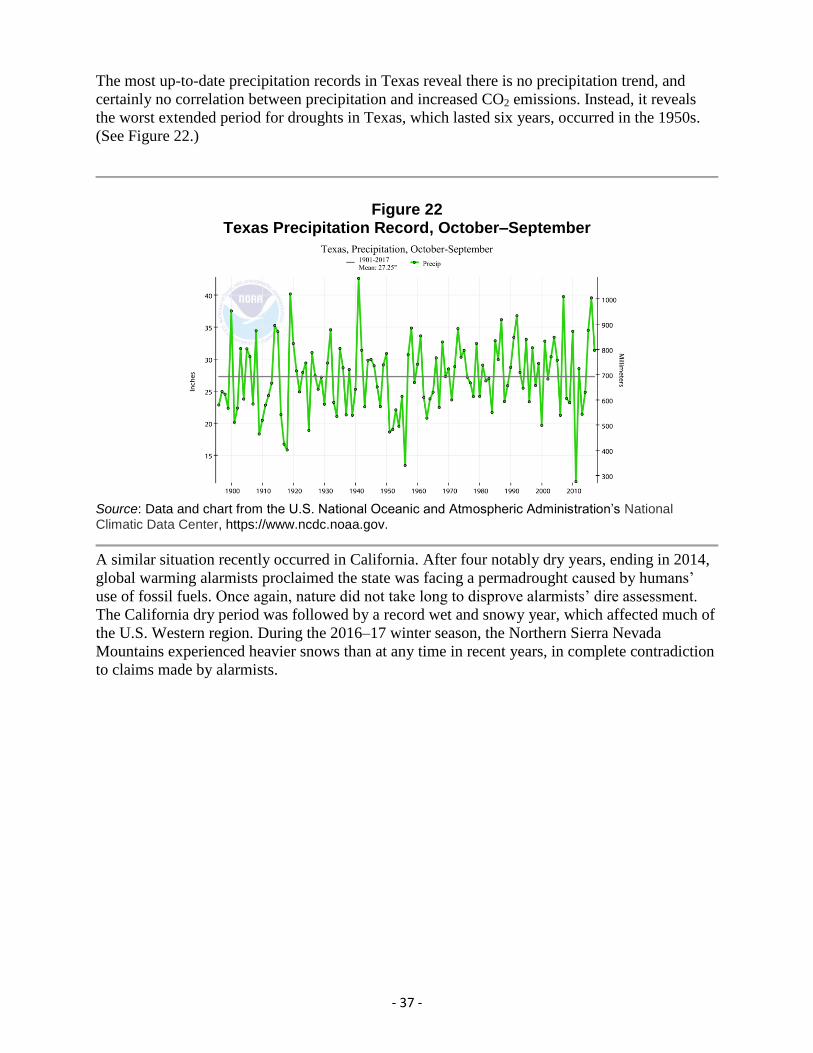
The most up-to-date precipitation records in Texas reveal there is no precipitation trend, and
certainly no correlation between precipitation and increased CO2 emissions. Instead, it reveals
the worst extended period for droughts in Texas, which lasted six years, occurred in the 1950s.
(See Figure 22.)
Figure 22 Texas Precipitation Record, October–September
Source: Data and chart from the U.S. National Oceanic and Atmospheric Administration’s National Climatic Data Center, https://www.ncdc.noaa.gov.
A similar situation recently occurred in California. After four notably dry years, ending in 2014,
global warming alarmists proclaimed the state was facing a permadrought caused by humans’
use of fossil fuels. Once again, nature did not take long to disprove alarmists’ dire assessment.
The California dry period was followed by a record wet and snowy year, which affected much of
the U.S. Western region. During the 2016–17 winter season, the Northern Sierra Nevada
Mountains experienced heavier snows than at any time in recent years, in complete contradiction
to claims made by alarmists.
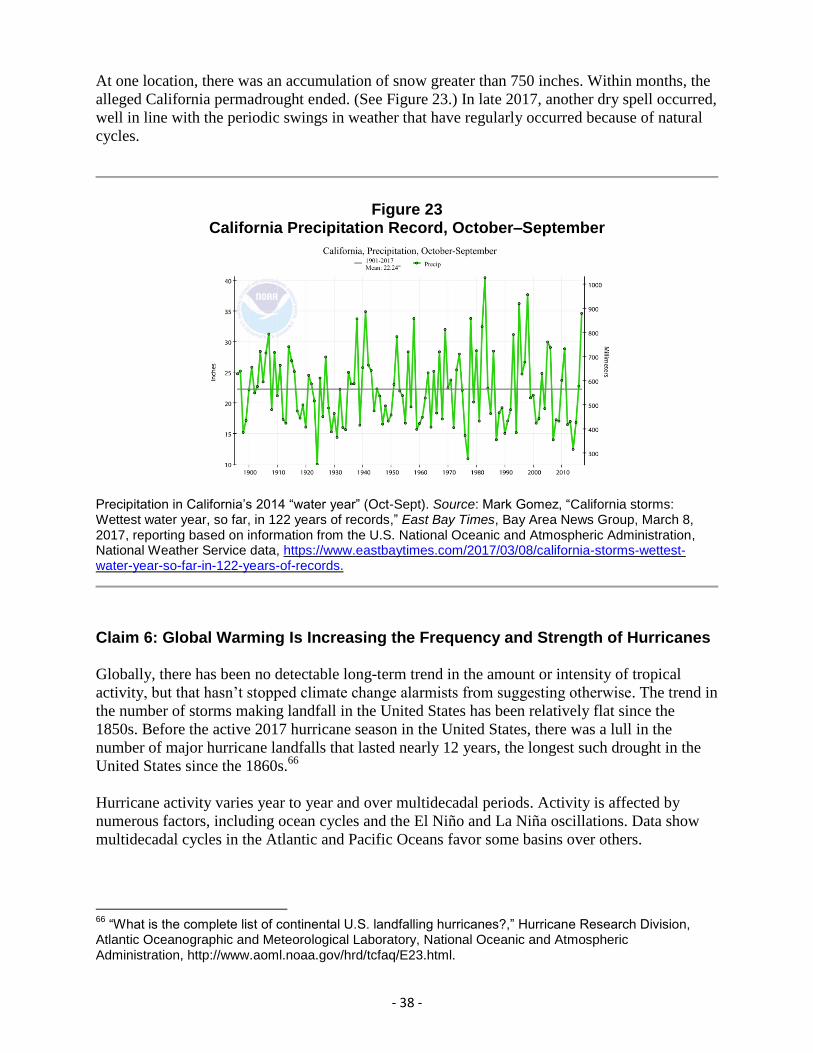
- 38 -
At one location, there was an accumulation of snow greater than 750 inches. Within months, the
alleged California permadrought ended. (See Figure 23.) In late 2017, another dry spell occurred,
well in line with the periodic swings in weather that have regularly occurred because of natural
cycles.
Figure 23 California Precipitation Record, October–September
Precipitation in California’s 2014 “water year” (Oct-Sept). Source: Mark Gomez, “California storms: Wettest water year, so far, in 122 years of records,” East Bay Times, Bay Area News Group, March 8, 2017, reporting based on information from the U.S. National Oceanic and Atmospheric Administration, National Weather Service data, https://www.eastbaytimes.com/2017/03/08/california-storms-wettest-water-year-so-far-in-122-years-of-records.
Claim 6: Global Warming Is Increasing the Frequency and Strength of Hurricanes
Globally, there has been no detectable long-term trend in the amount or intensity of tropical
activity, but that hasn’t stopped climate change alarmists from suggesting otherwise. The trend in
the number of storms making landfall in the United States has been relatively flat since the
1850s. Before the active 2017 hurricane season in the United States, there was a lull in the
number of major hurricane landfalls that lasted nearly 12 years, the longest such drought in the
United States since the 1860s.66
Hurricane activity varies year to year and over multidecadal periods. Activity is affected by
numerous factors, including ocean cycles and the El Niño and La Niña oscillations. Data show
multidecadal cycles in the Atlantic and Pacific Oceans favor some basins over others.
66
“What is the complete list of continental U.S. landfalling hurricanes?,” Hurricane Research Division, Atlantic Oceanographic and Meteorological Laboratory, National Oceanic and Atmospheric Administration, http://www.aoml.noaa.gov/hrd/tcfaq/E23.html.
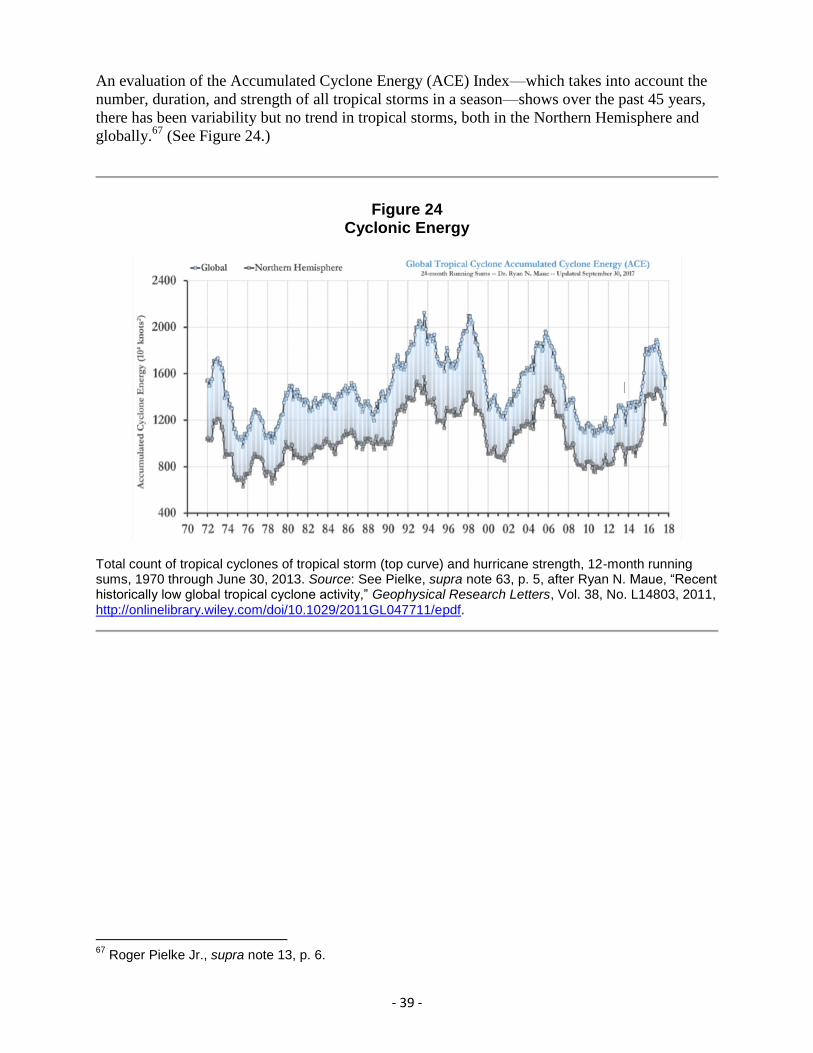
- 39 -
An evaluation of the Accumulated Cyclone Energy (ACE) Index—which takes into account the
number, duration, and strength of all tropical storms in a season—shows over the past 45 years,
there has been variability but no trend in tropical storms, both in the Northern Hemisphere and
globally.67
(See Figure 24.)
Figure 24 Cyclonic Energy
Total count of tropical cyclones of tropical storm (top curve) and hurricane strength, 12-month running sums, 1970 through June 30, 2013. Source: See Pielke, supra note 63, p. 5, after Ryan N. Maue, “Recent historically low global tropical cyclone activity,” Geophysical Research Letters, Vol. 38, No. L14803, 2011, http://onlinelibrary.wiley.com/doi/10.1029/2011GL047711/epdf.
67
Roger Pielke Jr., supra note 13, p. 6.

- 40 -
The ACE Index for the Atlantic shows cyclical behavior. There is no long-term trend, but spikes
are evident in 1893, 1926, 1933, 1950, 1995, 2004, and 2005. The year 2017 ranks seventh in the
ACE Index.
For the Atlantic Basin, ACE displays there has been normal up-and-down variations since 1900.
(See Figure 25.)
Figure 25 Atlantic Basin Cyclones
Source: Joseph D’Aleo, “What Made This Hurricane Season So Active in the Atlantic?” The Patriot Post, October 9, 2017, https://patriotpost.us/opinion/51739-what-made-this-hurricane-season-so-active-in-the-atlantic, from data provided by the Earth System Research Laboratory, U.S. National Oceanic and Atmospheric Administration.
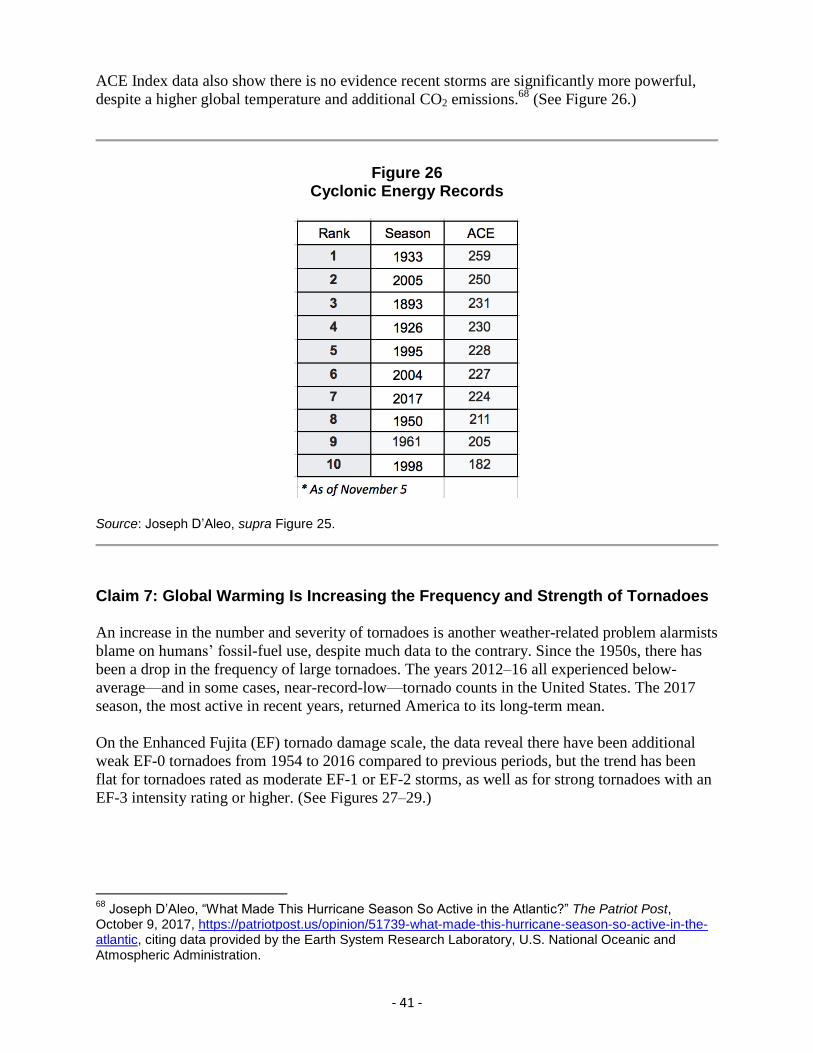
- 41 -
ACE Index data also show there is no evidence recent storms are significantly more powerful,
despite a higher global temperature and additional CO2 emissions.68
(See Figure 26.)
Figure 26 Cyclonic Energy Records
Source: Joseph D’Aleo, supra Figure 25.
Claim 7: Global Warming Is Increasing the Frequency and Strength of Tornadoes
An increase in the number and severity of tornadoes is another weather-related problem alarmists
blame on humans’ fossil-fuel use, despite much data to the contrary. Since the 1950s, there has
been a drop in the frequency of large tornadoes. The years 2012–16 all experienced below-
average—and in some cases, near-record-low—tornado counts in the United States. The 2017
season, the most active in recent years, returned America to its long-term mean.
On the Enhanced Fujita (EF) tornado damage scale, the data reveal there have been additional
weak EF-0 tornadoes from 1954 to 2016 compared to previous periods, but the trend has been
flat for tornadoes rated as moderate EF-1 or EF-2 storms, as well as for strong tornadoes with an
EF-3 intensity rating or higher. (See Figures 27–29.)
68
Joseph D’Aleo, “What Made This Hurricane Season So Active in the Atlantic?” The Patriot Post, October 9, 2017, https://patriotpost.us/opinion/51739-what-made-this-hurricane-season-so-active-in-the-atlantic, citing data provided by the Earth System Research Laboratory, U.S. National Oceanic and Atmospheric Administration.
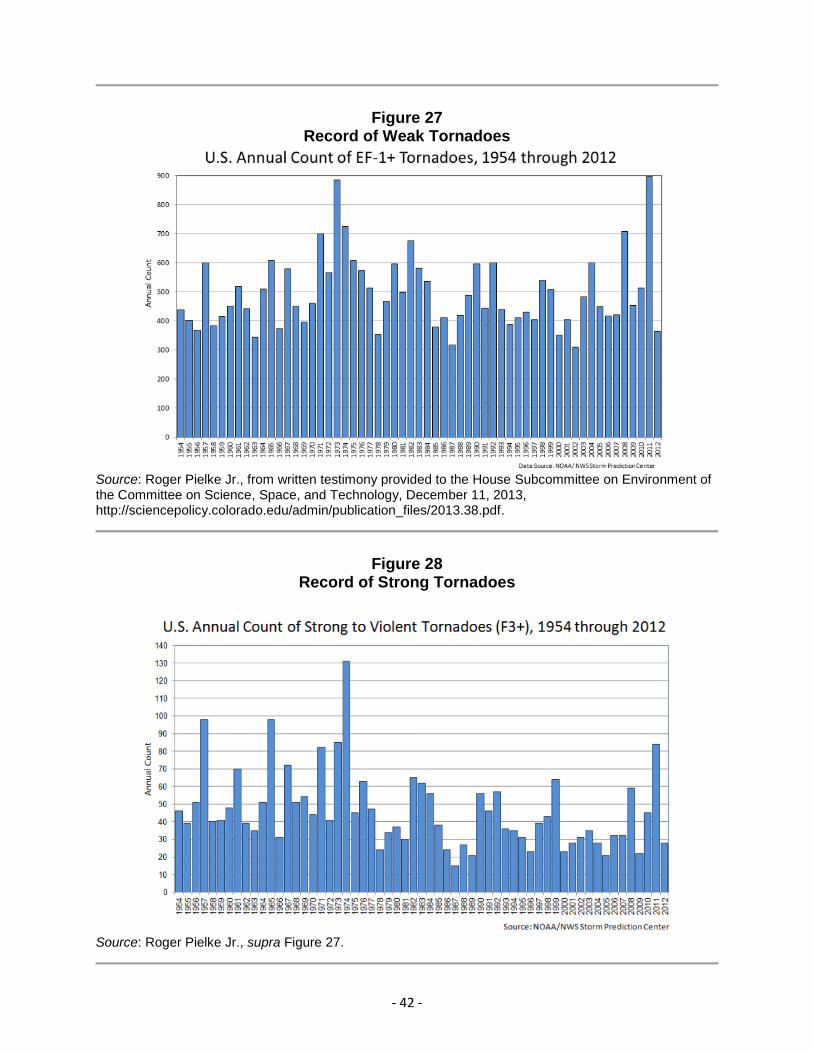
- 42 -
Figure 27 Record of Weak Tornadoes
Source: Roger Pielke Jr., from written testimony provided to the House Subcommittee on Environment of the Committee on Science, Space, and Technology, December 11, 2013, http://sciencepolicy.colorado.edu/admin/publication_files/2013.38.pdf.
Figure 28 Record of Strong Tornadoes
Source: Roger Pielke Jr., supra Figure 27.
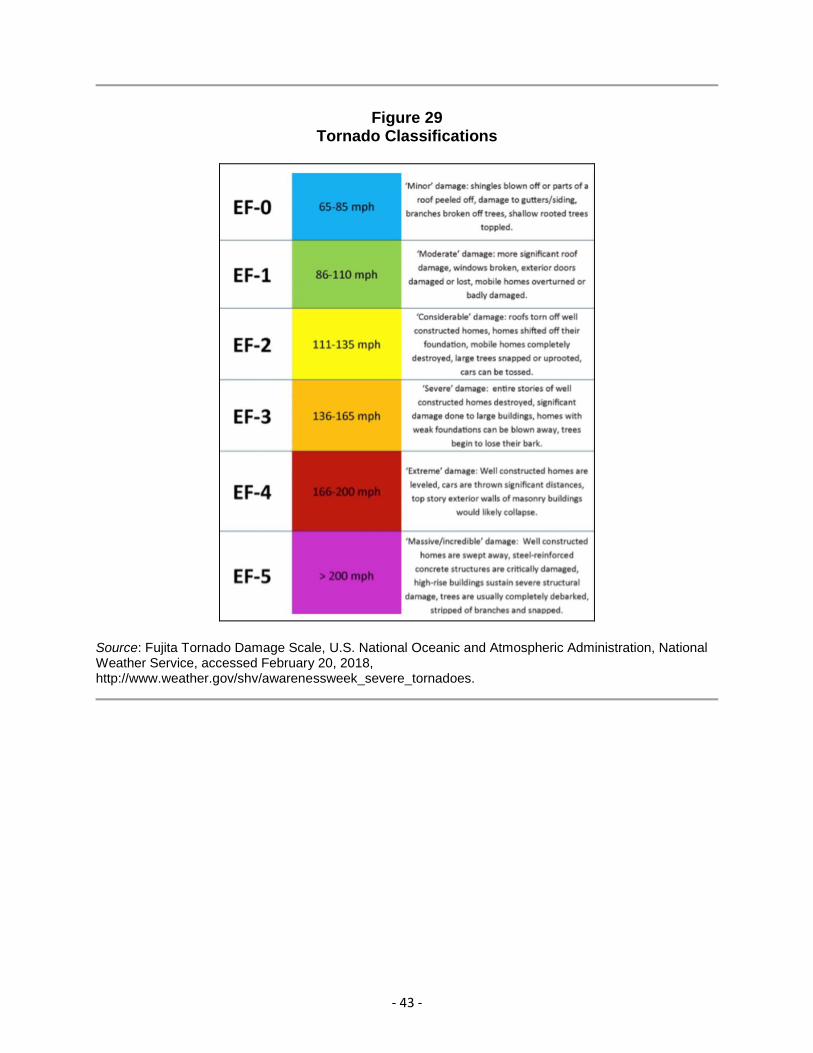
- 43 -
Figure 29 Tornado Classifications
Source: Fujita Tornado Damage Scale, U.S. National Oceanic and Atmospheric Administration, National Weather Service, accessed February 20, 2018, http://www.weather.gov/shv/awarenessweek_severe_tornadoes.
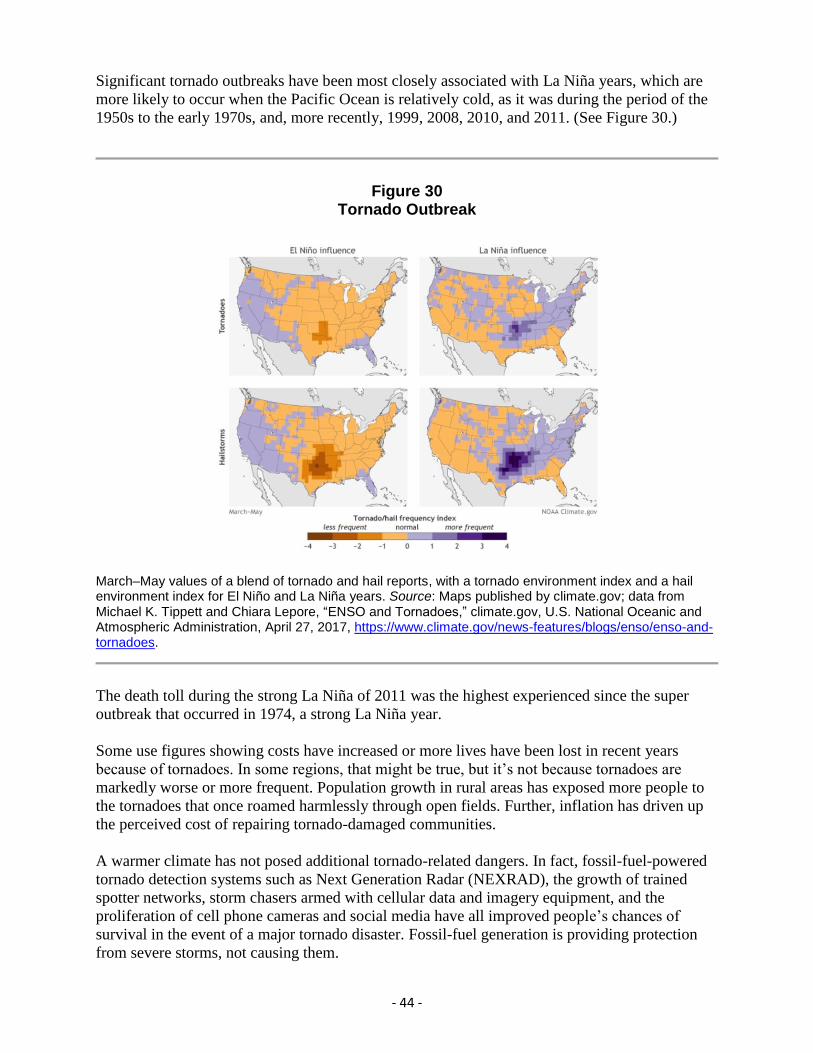
- 44 -
Significant tornado outbreaks have been most closely associated with La Niña years, which are
more likely to occur when the Pacific Ocean is relatively cold, as it was during the period of the
1950s to the early 1970s, and, more recently, 1999, 2008, 2010, and 2011. (See Figure 30.)
Figure 30 Tornado Outbreak
March–May values of a blend of tornado and hail reports, with a tornado environment index and a hail environment index for El Niño and La Niña years. Source: Maps published by climate.gov; data from Michael K. Tippett and Chiara Lepore, “ENSO and Tornadoes,” climate.gov, U.S. National Oceanic and Atmospheric Administration, April 27, 2017, https://www.climate.gov/news-features/blogs/enso/enso-and-tornadoes.
The death toll during the strong La Niña of 2011 was the highest experienced since the super
outbreak that occurred in 1974, a strong La Niña year.
Some use figures showing costs have increased or more lives have been lost in recent years
because of tornadoes. In some regions, that might be true, but it’s not because tornadoes are
markedly worse or more frequent. Population growth in rural areas has exposed more people to
the tornadoes that once roamed harmlessly through open fields. Further, inflation has driven up
the perceived cost of repairing tornado-damaged communities.
A warmer climate has not posed additional tornado-related dangers. In fact, fossil-fuel-powered
tornado detection systems such as Next Generation Radar (NEXRAD), the growth of trained
spotter networks, storm chasers armed with cellular data and imagery equipment, and the
proliferation of cell phone cameras and social media have all improved people’s chances of
survival in the event of a major tornado disaster. Fossil-fuel generation is providing protection
from severe storms, not causing them.
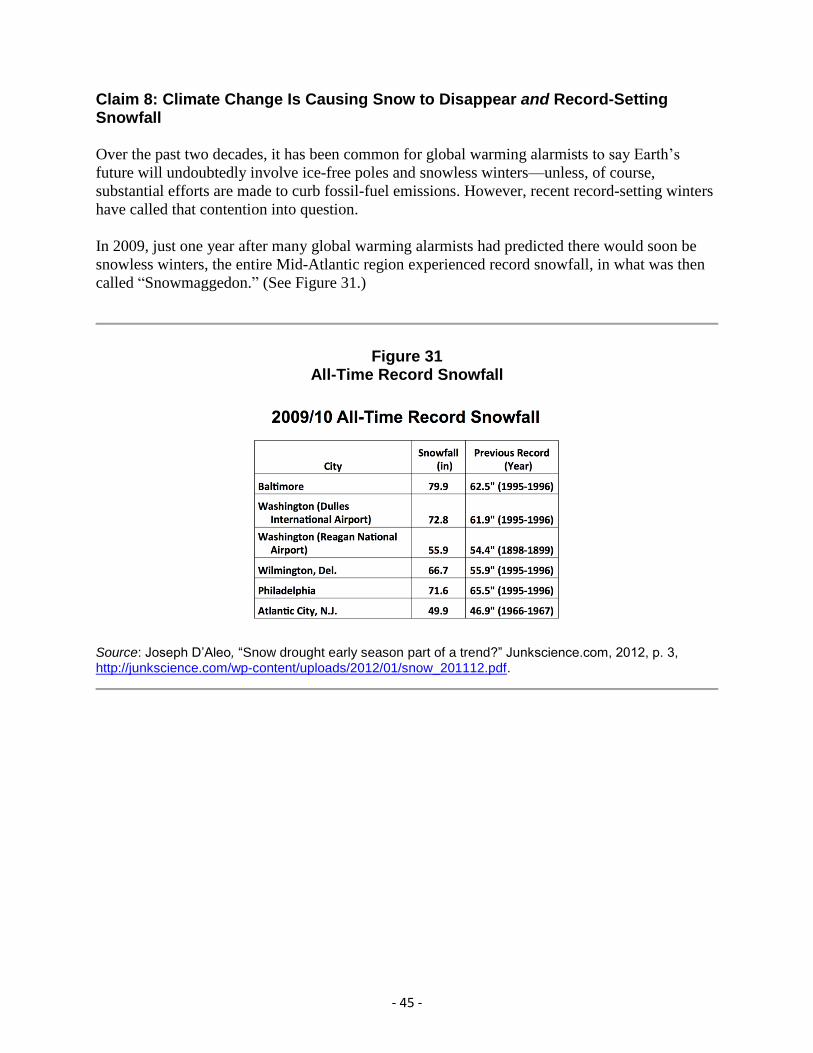
- 45 -
Claim 8: Climate Change Is Causing Snow to Disappear and Record-Setting Snowfall
Over the past two decades, it has been common for global warming alarmists to say Earth’s
future will undoubtedly involve ice-free poles and snowless winters—unless, of course,
substantial efforts are made to curb fossil-fuel emissions. However, recent record-setting winters
have called that contention into question.
In 2009, just one year after many global warming alarmists had predicted there would soon be
snowless winters, the entire Mid-Atlantic region experienced record snowfall, in what was then
called “Snowmaggedon.” (See Figure 31.)
Figure 31 All-Time Record Snowfall
Source: Joseph D’Aleo, “Snow drought early season part of a trend?” Junkscience.com, 2012, p. 3, http://junkscience.com/wp-content/uploads/2012/01/snow_201112.pdf.
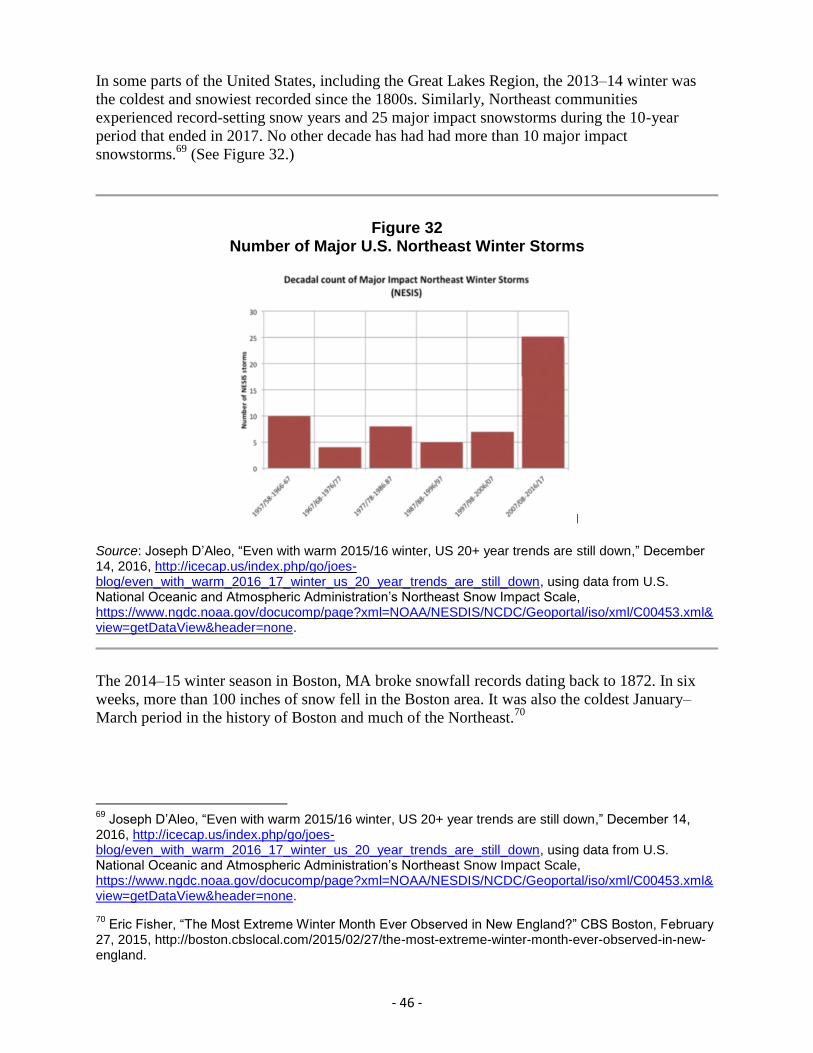
- 46 -
In some parts of the United States, including the Great Lakes Region, the 2013–14 winter was
the coldest and snowiest recorded since the 1800s. Similarly, Northeast communities
experienced record-setting snow years and 25 major impact snowstorms during the 10-year
period that ended in 2017. No other decade has had had more than 10 major impact
snowstorms.69
(See Figure 32.)
Figure 32 Number of Major U.S. Northeast Winter Storms
Source: Joseph D’Aleo, “Even with warm 2015/16 winter, US 20+ year trends are still down,” December 14, 2016, http://icecap.us/index.php/go/joes-blog/even_with_warm_2016_17_winter_us_20_year_trends_are_still_down, using data from U.S. National Oceanic and Atmospheric Administration’s Northeast Snow Impact Scale, https://www.ngdc.noaa.gov/docucomp/page?xml=NOAA/NESDIS/NCDC/Geoportal/iso/xml/C00453.xml&view=getDataView&header=none.
The 2014–15 winter season in Boston, MA broke snowfall records dating back to 1872. In six
weeks, more than 100 inches of snow fell in the Boston area. It was also the coldest January–
March period in the history of Boston and much of the Northeast.70
69
Joseph D’Aleo, “Even with warm 2015/16 winter, US 20+ year trends are still down,” December 14, 2016, http://icecap.us/index.php/go/joes-blog/even_with_warm_2016_17_winter_us_20_year_trends_are_still_down, using data from U.S. National Oceanic and Atmospheric Administration’s Northeast Snow Impact Scale, https://www.ngdc.noaa.gov/docucomp/page?xml=NOAA/NESDIS/NCDC/Geoportal/iso/xml/C00453.xml&view=getDataView&header=none.
70 Eric Fisher, “The Most Extreme Winter Month Ever Observed in New England?” CBS Boston, February
27, 2015, http://boston.cbslocal.com/2015/02/27/the-most-extreme-winter-month-ever-observed-in-new-england.
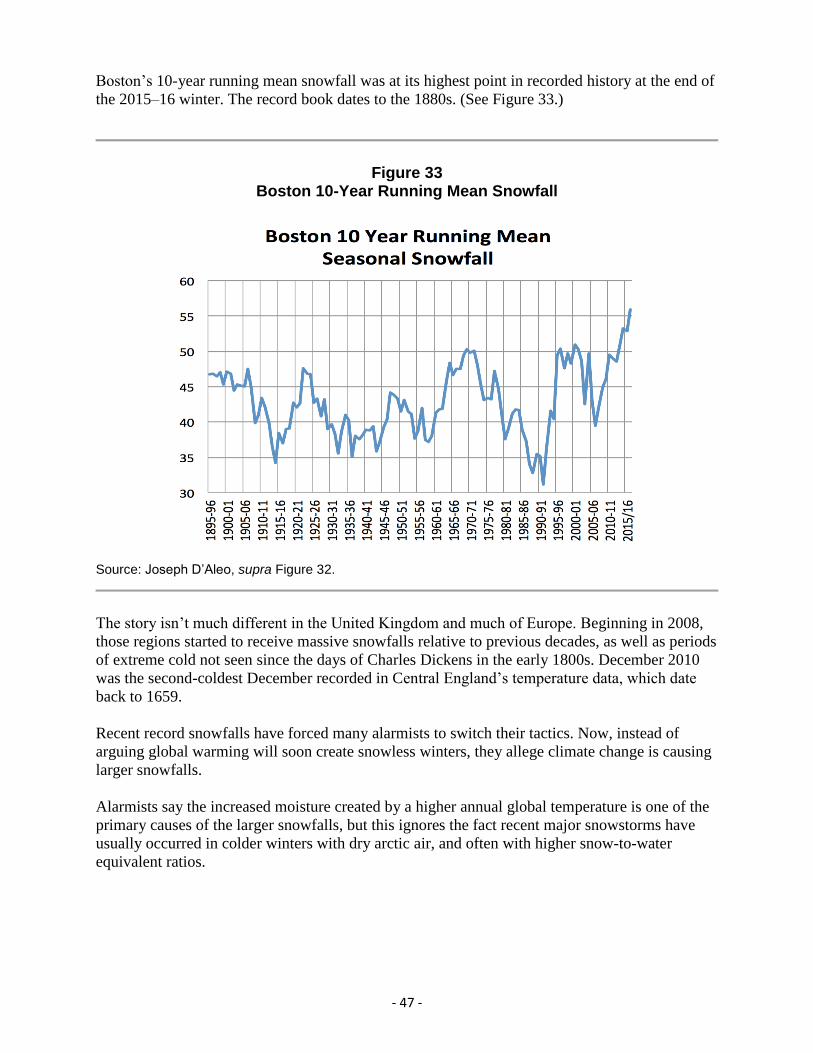
- 47 -
Boston’s 10-year running mean snowfall was at its highest point in recorded history at the end of
the 2015–16 winter. The record book dates to the 1880s. (See Figure 33.)
Figure 33 Boston 10-Year Running Mean Snowfall
Source: Joseph D’Aleo, supra Figure 32.
The story isn’t much different in the United Kingdom and much of Europe. Beginning in 2008,
those regions started to receive massive snowfalls relative to previous decades, as well as periods
of extreme cold not seen since the days of Charles Dickens in the early 1800s. December 2010
was the second-coldest December recorded in Central England’s temperature data, which date
back to 1659.
Recent record snowfalls have forced many alarmists to switch their tactics. Now, instead of
arguing global warming will soon create snowless winters, they allege climate change is causing
larger snowfalls.
Alarmists say the increased moisture created by a higher annual global temperature is one of the
primary causes of the larger snowfalls, but this ignores the fact recent major snowstorms have
usually occurred in colder winters with dry arctic air, and often with higher snow-to-water
equivalent ratios.
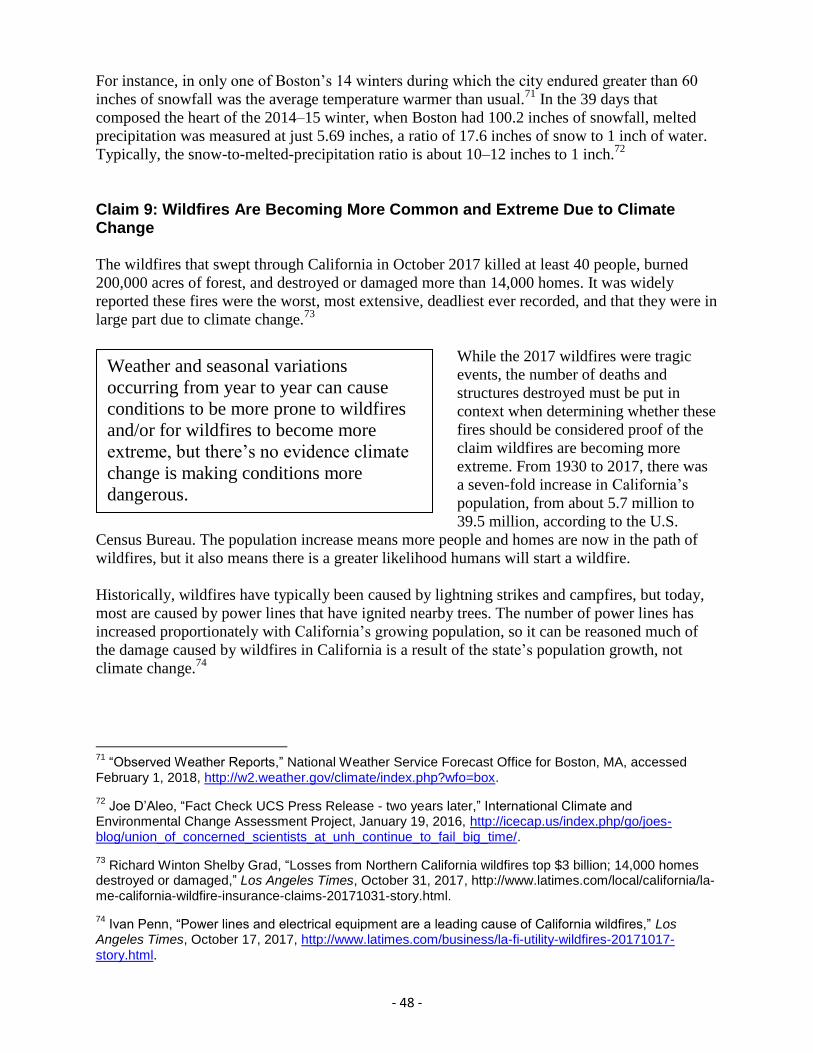
- 48 -
For instance, in only one of Boston’s 14 winters during which the city endured greater than 60
inches of snowfall was the average temperature warmer than usual.71
In the 39 days that
composed the heart of the 2014–15 winter, when Boston had 100.2 inches of snowfall, melted
precipitation was measured at just 5.69 inches, a ratio of 17.6 inches of snow to 1 inch of water.
Typically, the snow-to-melted-precipitation ratio is about 10–12 inches to 1 inch.72
Claim 9: Wildfires Are Becoming More Common and Extreme Due to Climate Change
The wildfires that swept through California in October 2017 killed at least 40 people, burned
200,000 acres of forest, and destroyed or damaged more than 14,000 homes. It was widely
reported these fires were the worst, most extensive, deadliest ever recorded, and that they were in
large part due to climate change.73
While the 2017 wildfires were tragic
events, the number of deaths and
structures destroyed must be put in
context when determining whether these
fires should be considered proof of the
claim wildfires are becoming more
extreme. From 1930 to 2017, there was
a seven-fold increase in California’s
population, from about 5.7 million to
39.5 million, according to the U.S.
Census Bureau. The population increase means more people and homes are now in the path of
wildfires, but it also means there is a greater likelihood humans will start a wildfire.
Historically, wildfires have typically been caused by lightning strikes and campfires, but today,
most are caused by power lines that have ignited nearby trees. The number of power lines has
increased proportionately with California’s growing population, so it can be reasoned much of
the damage caused by wildfires in California is a result of the state’s population growth, not
climate change.74
71
“Observed Weather Reports,” National Weather Service Forecast Office for Boston, MA, accessed February 1, 2018, http://w2.weather.gov/climate/index.php?wfo=box.
72 Joe D’Aleo, “Fact Check UCS Press Release - two years later,” International Climate and
Environmental Change Assessment Project, January 19, 2016, http://icecap.us/index.php/go/joes-blog/union_of_concerned_scientists_at_unh_continue_to_fail_big_time/.
73 Richard Winton Shelby Grad, “Losses from Northern California wildfires top $3 billion; 14,000 homes
destroyed or damaged,” Los Angeles Times, October 31, 2017, http://www.latimes.com/local/california/la-me-california-wildfire-insurance-claims-20171031-story.html.
74 Ivan Penn, “Power lines and electrical equipment are a leading cause of California wildfires,” Los
Angeles Times, October 17, 2017, http://www.latimes.com/business/la-fi-utility-wildfires-20171017-
story.html.
Weather and seasonal variations
occurring from year to year can cause
conditions to be more prone to wildfires
and/or for wildfires to become more
extreme, but there’s no evidence climate
change is making conditions more
dangerous.
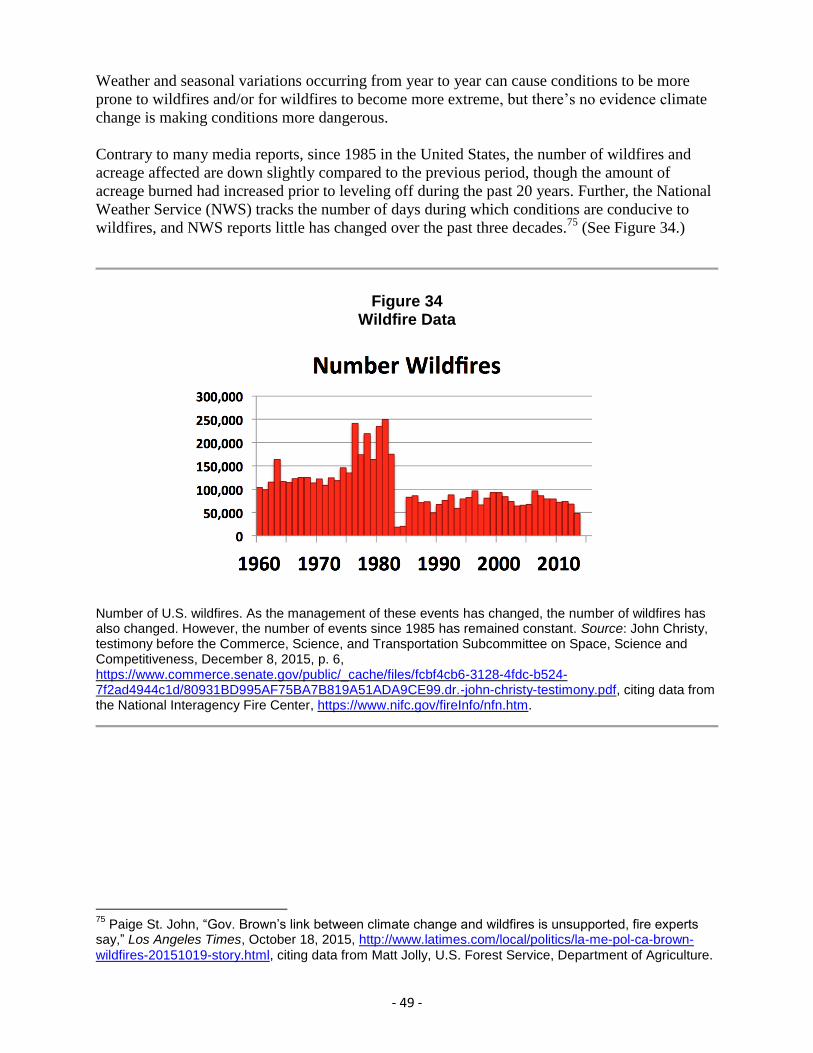
- 49 -
Weather and seasonal variations occurring from year to year can cause conditions to be more
prone to wildfires and/or for wildfires to become more extreme, but there’s no evidence climate
change is making conditions more dangerous.
Contrary to many media reports, since 1985 in the United States, the number of wildfires and
acreage affected are down slightly compared to the previous period, though the amount of
acreage burned had increased prior to leveling off during the past 20 years. Further, the National
Weather Service (NWS) tracks the number of days during which conditions are conducive to
wildfires, and NWS reports little has changed over the past three decades.75
(See Figure 34.)
Figure 34 Wildfire Data
Number of U.S. wildfires. As the management of these events has changed, the number of wildfires has also changed. However, the number of events since 1985 has remained constant. Source: John Christy, testimony before the Commerce, Science, and Transportation Subcommittee on Space, Science and Competitiveness, December 8, 2015, p. 6, https://www.commerce.senate.gov/public/_cache/files/fcbf4cb6-3128-4fdc-b524-7f2ad4944c1d/80931BD995AF75BA7B819A51ADA9CE99.dr.-john-christy-testimony.pdf, citing data from the National Interagency Fire Center, https://www.nifc.gov/fireInfo/nfn.htm.
75
Paige St. John, “Gov. Brown’s link between climate change and wildfires is unsupported, fire experts say,” Los Angeles Times, October 18, 2015, http://www.latimes.com/local/politics/la-me-pol-ca-brown-
wildfires-20151019-story.html, citing data from Matt Jolly, U.S. Forest Service, Department of Agriculture.
- 50 -
Part Four Concluding Remarks
CSSR’s authors claim their report is “designed to be an authoritative assessment of the science of
climate change, with a focus on the United States, to serve as the foundation for efforts to assess
climate-related risks and inform decision-making about responses.” It is not.
The study suffers from a number of
foundational problems. It hides behind
the assertion the theory humans are
primarily responsible for global
warming is “settled science,” and it
refuses to acknowledge the high degree
of uncertainty and many disagreements
in the field, making it anything but “authoritative.” For decades, serious scientists have produced
sound work challenging every aspect of global warming alarmists’ climate change dogma, which
relies on cherry-picked data and highly questionable assumptions. But alarmists, including those
that created the CSSR report, often refuse to address climate realists’ research and instead have
chosen to politicize climate science, often to their professional and financial benefit.
CSSR also ignores evidence showing many of the computer models the IPCC and others rely on
have failed to produce accurate results that match real-world data. The CSSR team plays fast and
loose with the scientific method, concealing or omitting important contextual issues so that it can
come to the conclusion it had when it began its study: Humans are responsible for climate
change, climate change is catastrophic, and only radical government controls will have a
measurable impact on climate change projections.
Similarly, CSSR makes several major mistakes concerning the role CO2 likely plays in the
atmosphere. Its authors ignore the limits of CO2 to absorb heat and effect atmospheric warming,
and they make crucial errors about water vapor that greatly impact their final conclusions about
CO2. CSSR’s authors promote unsupported assumptions about the sensitivity of global
temperature to CO2 concentrations, and the variables used in the equations the CSSR team relies
on to plot the trajectory of future temperature are not based on actual historical data or realistic
market assumptions about fossil-fuel use, technological innovation, electricity consumption,
population growth, and other vital factors.
CSSR’s authors also propagate a series of fallacious claims concerning the alleged impact of
global warming, including that Earth has never been warmer; droughts, floods, and wildfires are
increasing; and hurricanes and tornadoes are stronger and more frequently observed.
The CSSR team’s failure to present its evidence objectively—which would require including
data in its report that contradict commonly used global warming alarmist assertions—warrants
putting this flawed report alongside the many other flawed reports, studies, and research
produced by alarmist U.S. government agencies, the United Nations, and other government
bodies that are more interested in using global warming as a political tool than conducting fair
scientific analyses.
# # #
For decades, serious scientists have
produced sound work challenging every
aspect of global warming alarmists’
climate change dogma.
- 51 -
About the Editor
Jay Lehr, Ph.D., is science director at The Heartland Institute and one of the nation’s most
respected and widely cited experts on air and water quality, climate change, and biotechnology.
He has testified before Congress dozens of times and helped write the Clean Water Act. For 25
years, he headed the Association of Ground Water Scientists and Engineers.
Dr. Lehr is the author of more than 1,000 magazine and journal articles and 30 books. He is
editor of Rational Readings on Environmental Concerns (1992), McGraw-Hill’s Handbook on
Environmental Science, Health and Technology (2000), Wiley’s Remediation Technologies
Handbook (2004), Environmental Instrumentation and Analysis Handbook (2005), the six-
volume Water Encyclopedia (Wiley Interscience, 2005), and Nuclear Energy Encyclopedia:
Science, Technology, and Applications (Wiley Interscience, 2011). He is at work on a new Wiley
Interscience volume on shale gas and renewable energy.
Of special note is Dr. Lehr’s speaking ability. He has addressed more than 1,000 audiences and
currently speaks before approximately 100 audiences per year. He invariably gets the highest
approval rating from audiences and often receives a standing ovation. Dr. Lehr brings
enthusiasm and humor to a wide range of environmental topics, disarming critics and informing
the public about issues often thought too arcane or difficult to communicate.
Acknowledgements
The editor wishes to thank the following scholars for contributing materials and information to or
reviewing early drafts of this policy paper.
John R. Christy, Ph.D., is the distinguished professor of atmospheric science and director of the
Earth System Science Center at the University of Alabama at Huntsville, where he began
studying global climate issues in 1987. Since November 2000, he has been Alabama’s state
climatologist. He and Dr. Roy Spencer, a former NASA senior scientist and now UAH principle
research scientist, received NASA’s Exceptional Scientific Achievement Medal for their global
temperature monitoring work with satellites.
John Coleman (1934–2018) was a founder of The Weather Channel and the original
weathercaster on ABC’s Good Morning America with David Hartman and Joan Lunden. Prior to
passing away, on January 20, 2018, Coleman served as a policy advisor for The Heartland
Institute.
Carolynn Conley is an aerospace systems engineer integrating experiments onto the
International Space Station. She also worked on the Space Shuttle Project at NASA. Conley has
a Master’s Degree in geochemistry from the University of California at Los Angeles and physics
from the University of Houston – Clear Lake.
Joseph D’Aleo is a co-founder and the first director of meteorology at the cable TV Weather
Channel. He has over 45 years of experience in professional meteorology. Mr. D’Aleo is now co-
chief meteorologist with WeatherBell Analytics. He was previously chief meteorologist at
- 52 -
Weather Services International Corporation and the WSI Intellicast.com website. D’Aleo is a
policy advisor for The Heartland Institute.
Harold H. Doiron, Ph.D., is chairman of The Right Climate Stuff Research Team. He worked at
NASA’s Johnson Space Center from 1963–1979 on all the major manned space missions and
produced computer models necessary to allow Apollo spacecrafts to land safely on the Moon. He
also served as vice president for engineering at InDyne, Inc.
Don J. Easterbrook, Ph.D., is emeritus professor of geology at Western Washington University.
Laurence I. Gould, Ph.D., is a professor of physics at the University of Hartford and the former
chair of the New England Section of the American Physical Society.
Richard A. Keen, Ph.D., is instructor emeritus at the University of Colorado at Boulder’s
Department of Atmospheric and Oceanic Sciences. Keen is a policy advisor for The Heartland
Institute.
Jack Knight has a Bachelor of Science degree in electrical engineering from the Georgia
Institute of Technology. He worked from 1963 to 2006 at NASA’s Johnson Space Center,
including stints in the Apollo Flight Systems Branch, the Life Support Systems Section of the
Lunar Module and Shuttle Systems Branch, and as chief of the Advanced Operations and
Development Division.
David R. Legates, Ph.D., is a climatologist and professor of geography at the University of
Delaware. He previously served as Delaware’s state climatologist and is the former director of
the Center for Climatic Research at the University of Delaware.
Anthony R. Lupo, Ph.D., is an associate professor of atmospheric science in the Department of
Soil, Environmental, and Atmospheric Science at the University of Missouri at Columbia. Dr.
Lupo is a policy advisor for The Heartland Institute.
James Peacock is currently webmaster at therightclimatestuff.com and a member of the Right
Climate Stuff team. Peacock is an aerospace engineer who worked in the Apollo and Shuttle
Program Offices at NASA’s Johnson Space Center. Before joining NASA, he served in the
USAF Research & Development Command.
Thomas Wysmuller owns and operates colderside.com. He is a meteorologist, having forecasted
weather at Amsterdam’s Royal Dutch Weather Bureau and worked at NASA during Apollo. He
studied at New York University and Stanford. Wysmuller was administrative director of
government relations for Pratt & Whitney. He also produced the polynomial regression
mathematics and algorithms used by most climate scientists. In 2016 he chaired the
Oceanographic Section of the massive World Congress on Oceans at Qingdao, China, and in
2017 keynoted at the Rome Climate Conference.
- 53 -
© 2018 The Heartland Institute. Distributed by The Heartland Institute, a nonprofit and nonpartisan public policy research organization. Research director for this paper is Edward Hudgins, Ph.D. Executive editor is Justin Haskins. Publisher is Tim Huelskamp, Ph.D. Nothing in this report should be construed as supporting or opposing any proposed or pending legislation, or as necessarily reflecting the views of The Heartland Institute. Additional copies of this Policy Brief are available for $5.95 from The Heartland Institute, phone 312/377-4000; fax 312/277-4122; email [email protected]; web http://www.heartland.org.
- 54 -
About The Heartland Institute
The Heartland Institute is an independent national nonprofit research
organization founded in Chicago in 1984. It is a tax-exempt charity
under Section 501(c)(3).
The mission of The Heartland Institute is to discover, develop, and promote free-market
solutions to social and economic problems. Three things make Heartland unique among free-
market think tanks:
We communicate with more national and state elected officials, more often, than any other
think tank in the U.S. In 2017, we recorded nearly a million contacts with elected officials.
We produce three monthly public policy newspapers – Budget & Tax News, Environment &
Climate News, and School Reform News – which present free-market ideas as news rather
than research or opinion.
We promote the work of other free-market think tanks on our websites, in our newspapers, at
our events, and through our extensive government relations and media relations efforts.
Nobody else does more to promote the work of other think tanks than we do.
A telephone survey of 503 randomly selected state elected officials conducted in 2016 found 82
percent of state legislators read at least one of our publications. Forty-five reported a Heartland
publication “influenced my opinion or led to a change in public policy.”
We appeared in print and online, and on television or radio, nearly 4,700 times in 2017, and our
podcasts were downloaded 2.4 million times. Our Facebook page has more than 100,000 fans.
Heartland uses Twitter to promote its events and free-market mission to more than 75,000
followers every day.
Heartland’s annual budget of nearly $6 million supports a full-time staff of 39. Approximately
500 academics and professional economists participate in our peer-review process, and more
than 250 elected officials serve on our Legislative Forum. We are supported by the voluntary
contributions of approximately 5,500 supporters. We do not accept government funding.
Heartland is rigorously nonpartisan, working closely with Democrats and Republicans alike to
solve public policy problems. While our focus is on market-based solutions, 77 percent of state
Democratic legislators said they read at least one Heartland publication “sometimes” or “always”
and 33 percent said a Heartland publication influenced their opinions or led to a change in public
policy.
For more information, please visit our website at www.heartland.org or call 312-377-4000.


![Habermas's First Critique [I think] · Habermas's First Critique [I think]](https://img.pdfslide.us/doc/110x75/5aca735f7f8b9a5d718e228f/habermass-first-critique-i-think-s-first-critique-i-think.jpg)