Embed Size (px)
Citation preview
Stability Investment Solutions Diligence Client-centric Stability Investment Solutions Diligence Client-centric Stability Investment Solutions Diligence
A Critical Review of Correlation-based Measures of Portfolio Diversification
Presented to: Northfield 27th Annual Research
Conference October 7, 2014
Presented by: Randy O’Toole, CFA Federated Investors Senior Quantitative Analyst 212-905-4828 [email protected]
For Institutional/Investment Professional Use Only. Not for Distribution to the Public. Tracking number: 12-44015
Overview
1
The Portfolio Diversification Index (PDI) and the Diversification Ratio (DR) both aim to (1) quantify diversification characteristics expressly related to correlations and (2) provide frameworks for constructing diversified portfolios
The PDI and DR are in fact closely related to two very well-known risk-based portfolio construction approaches: Minimum Variance Portfolios (MVP) and Risk Parity Portfolios (RPP)
We introduce the Minimum Correlation Portfolio (MCP) and show how it can be used to solve for the maximum value of the DR
We clarify the properties of the PDI and show that it quantifies diversification characteristics specific to so-called “Naïve Risk Parity” portfolios
We highlight a significant weakness in the PDI and show that it can generate misleading estimates of diversification when there are negative correlations among assets, in contrast to the DR which clearly distinguishes the effects of positive and negative correlations on portfolio diversification
For Institutional/Investment Professional Use Only. Not for Distribution to the Public.
Diversification and risk-based portfolio construction
2
Risk-based portfolio construction approaches grew in popularity following the 2008 global financial crisis, when many portfolios and investment strategies thought to be well-diversified become spectacularly and dramatically undiversified
Risk-based methods eschew expected returns and focus solely on volatilities and correlations, with the goal of producing portfolios with “better” diversification characteristics vis-à-vis mean-variance optimal (MVO) portfolios
Several approaches to measuring diversification and constructing diversified portfolios have been proposed, which raises an important question:
What exactly do we mean by diversification?
For Institutional/Investment Professional Use Only. Not for Distribution to the Public.
Defining and measuring diversification
3
“Diversification strives to smooth out unsystematic risk events in a portfolio so that the positive performance of some investments will neutralize the negative performance of others. Therefore, the benefits of diversification will hold only if the securities in the portfolio are not perfectly correlated.” (investopedia.com)
“A well-diversified portfolio is one that is expected to be immune against shocks created by a single or a few assets.” (Meucci, 2009; Frahm and Weichers, 2011)
Market portfolio; equal-weighted portfolio (“naïve” diversification)
Number of assets; portfolio weights; breadth of positions
Information entropy
Minimum variance and risk parity portfolios
Low co-movement across assets (“most diversified portfolio”)
No definitive definition or unique measure of “diversification”
For Institutional/Investment Professional Use Only. Not for Distribution to the Public.
Defining and calculating portfolio risk
4
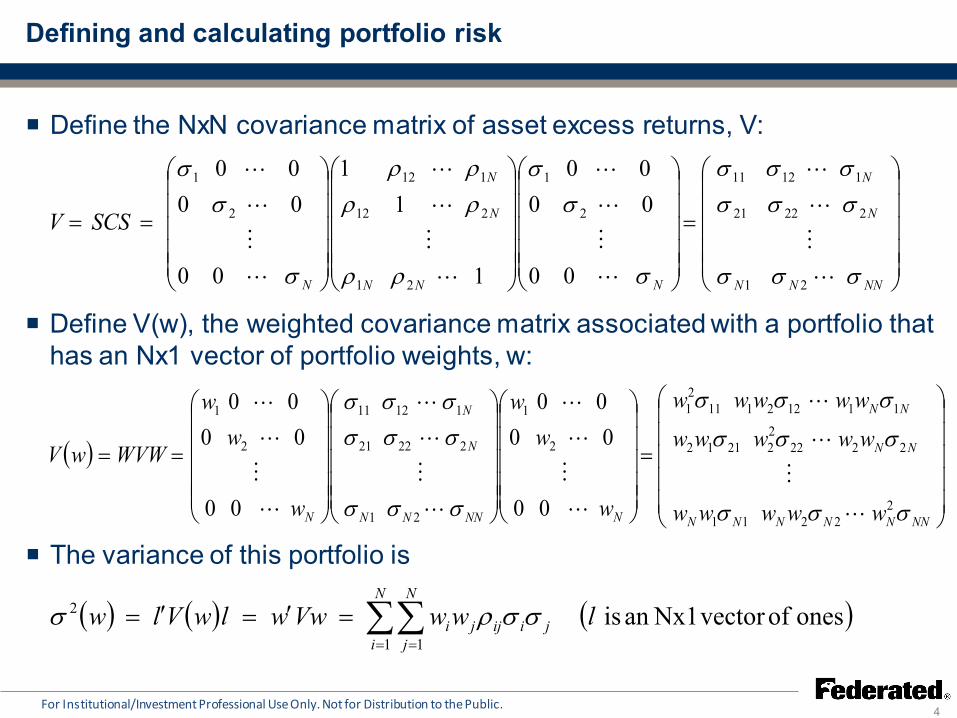
Define the NxN covariance matrix of asset excess returns, V:
For Institutional/Investment Professional Use Only. Not for Distribution to the Public.
Define V(w), the weighted covariance matrix associated with a portfolio that has an Nx1 vector of portfolio weights, w:
=
==
NNNN
N
N
NNN
N
N
N
SCSV
σσσ
σσσσσσ
σ
σσ
ρρ
ρρρρ
σ
σσ
21
22221
11211
2
1
21
212
112
2
1
00
0000
1
11
00
0000
( )
=
==
NNNNNNN
NN
NN
NNNNN
N
N
N wwwww
wwwwwwwwww
w
ww
w
ww
WVWwV
σσσ
σσσ
σσσ
σσσ
σσσσσσ
22211
2222222112
1112211121
2
1
21
22221
11211
2
1
00
0000
00
0000
The variance of this portfolio is
( ) ( ) ( )onesofvectorNx1anis1 1
2 lwwVwwlwVlwN
i
N
jjiijji∑∑
= =
=′=′= σσρσ
Contributions to portfolio risk
5
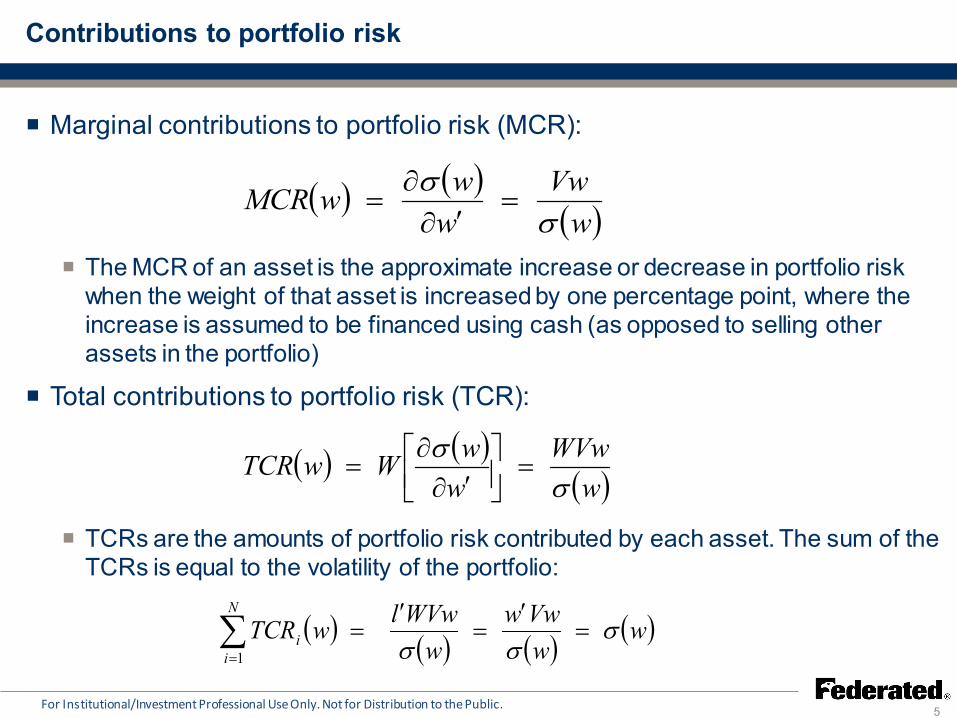
Marginal contributions to portfolio risk (MCR):
The MCR of an asset is the approximate increase or decrease in portfolio risk when the weight of that asset is increased by one percentage point, where the increase is assumed to be financed using cash (as opposed to selling other assets in the portfolio)
For Institutional/Investment Professional Use Only. Not for Distribution to the Public.
( ) ( )( )w
Vww
wwMCRσ
σ=
′∂∂
=
Total contributions to portfolio risk (TCR):
TCRs are the amounts of portfolio risk contributed by each asset. The sum of the TCRs is equal to the volatility of the portfolio:
( ) ( )( )w
WVww
wWwTCRσ
σ=
′∂∂
=
( ) ( ) ( ) ( )wwVww
wWVwlwTCR
N
ii σ
σσ=
′=
′=∑
=1
Minimum Variance Portfolio
6 For Institutional/Investment Professional Use Only. Not for Distribution to the Public.
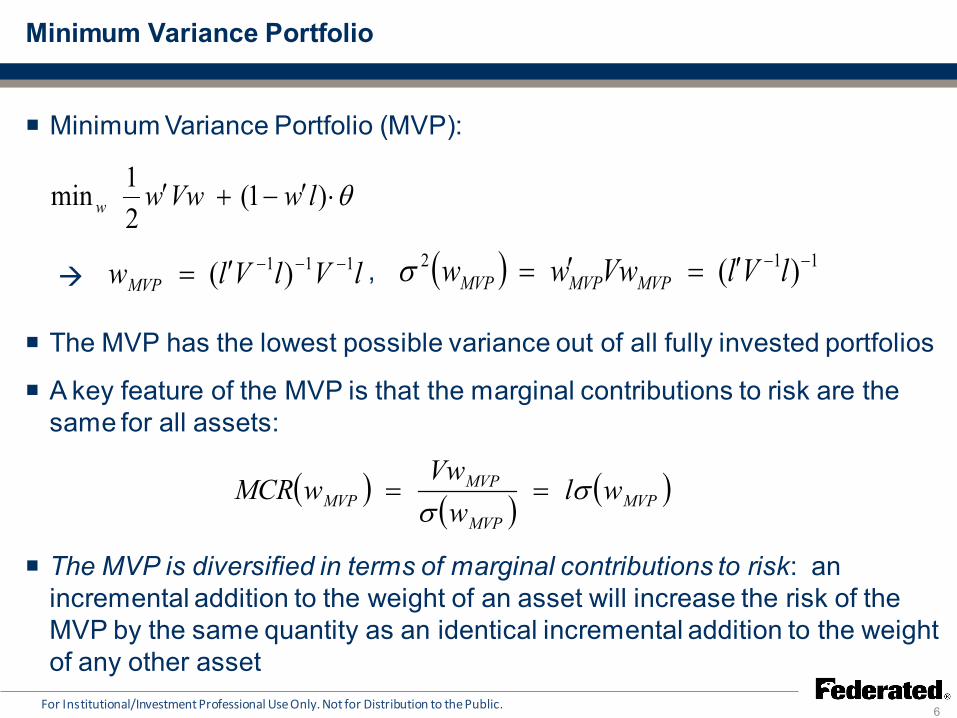
Minimum Variance Portfolio (MVP):
The MVP has the lowest possible variance out of all fully invested portfolios
A key feature of the MVP is that the marginal contributions to risk are the same for all assets:
The MVP is diversified in terms of marginal contributions to risk: an incremental addition to the weight of an asset will increase the risk of the MVP by the same quantity as an identical incremental addition to the weight of any other asset
θ⋅′−+′ )1(
21min lwVwww
lVlVlwMVP111 )( −−−′= ( ) 112 )( −−′=′= lVlVwww MVPMVPMVPσ ,
( ) ( ) ( )MVPMVP
MVPMVP wl
wVw
wMCR σσ
==
Risk Parity Portfolio
7 For Institutional/Investment Professional Use Only. Not for Distribution to the Public.
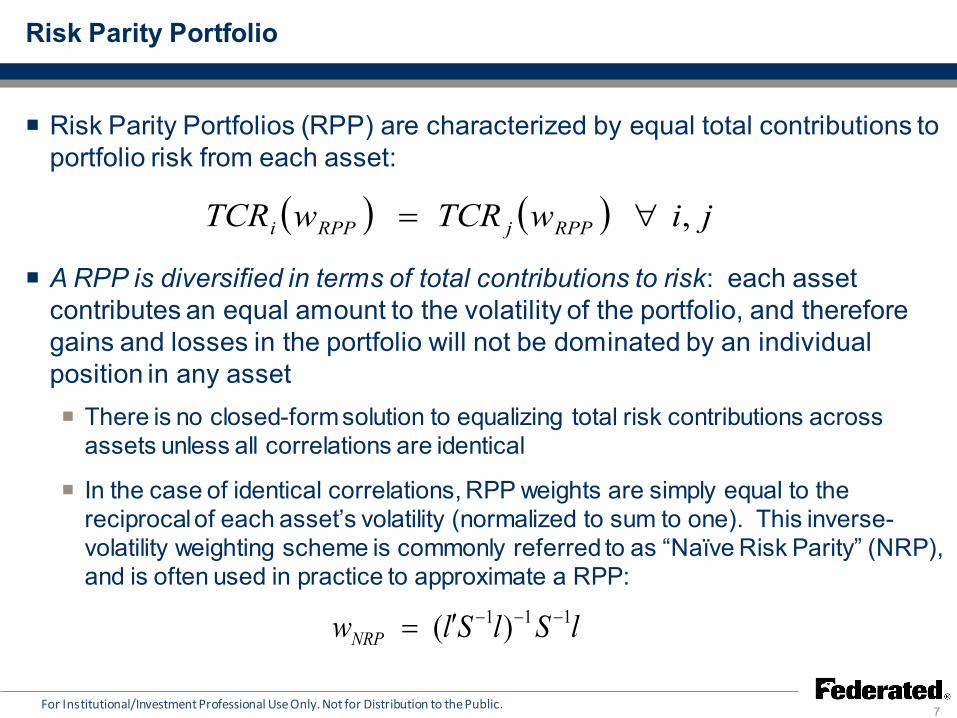
Risk Parity Portfolios (RPP) are characterized by equal total contributions to portfolio risk from each asset:
There is no closed-form solution to equalizing total risk contributions across assets unless all correlations are identical
In the case of identical correlations, RPP weights are simply equal to the reciprocal of each asset’s volatility (normalized to sum to one). This inverse-volatility weighting scheme is commonly referred to as “Naïve Risk Parity” (NRP), and is often used in practice to approximate a RPP:
( ) ( ) jiwTCRwTCR RPPjRPPi ,∀=
A RPP is diversified in terms of total contributions to risk: each asset contributes an equal amount to the volatility of the portfolio, and therefore gains and losses in the portfolio will not be dominated by an individual position in any asset
lSlSlwNRP111 )( −−−′=
Portfolio Diversification Index (PDI)
8
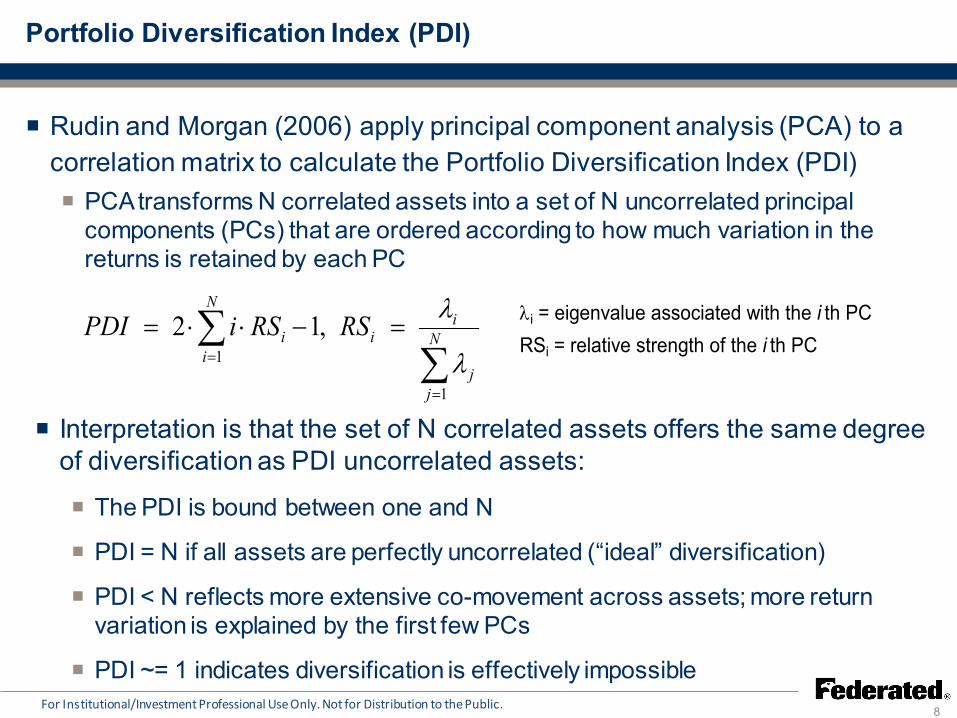
Interpretation is that the set of N correlated assets offers the same degree of diversification as PDI uncorrelated assets:
The PDI is bound between one and N
PDI = N if all assets are perfectly uncorrelated (“ideal” diversification)
PDI < N reflects more extensive co-movement across assets; more return variation is explained by the first few PCs
PDI ~= 1 indicates diversification is effectively impossible
Rudin and Morgan (2006) apply principal component analysis (PCA) to a correlation matrix to calculate the Portfolio Diversification Index (PDI)
For Institutional/Investment Professional Use Only. Not for Distribution to the Public.
∑∑
=
=
=−⋅⋅= N
jj
ii
N
ii RSRSiPDI
1
1,12
λ
λ
PCA transforms N correlated assets into a set of N uncorrelated principal components (PCs) that are ordered according to how much variation in the returns is retained by each PC
λi = eigenvalue associated with the i th PCRSi = relative strength of the i th PC
PDI and Risk Parity
9
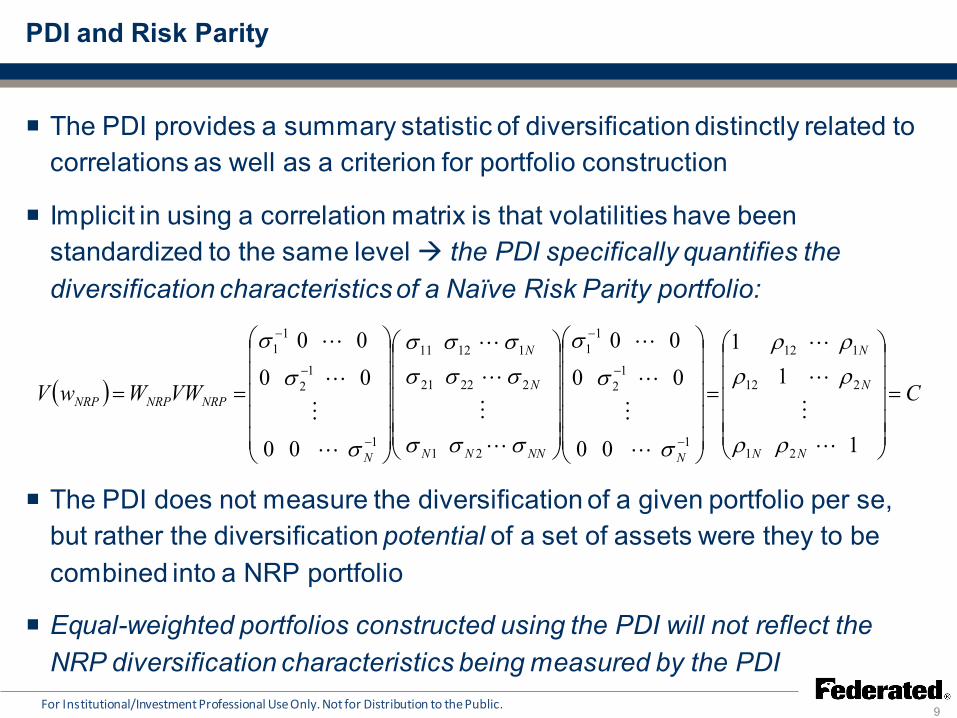
The PDI provides a summary statistic of diversification distinctly related to correlations as well as a criterion for portfolio construction
Implicit in using a correlation matrix is that volatilities have been standardized to the same level the PDI specifically quantifies the diversification characteristics of a Naïve Risk Parity portfolio:
The PDI does not measure the diversification of a given portfolio per se, but rather the diversification potential of a set of assets were they to be combined into a NRP portfolio
Equal-weighted portfolios constructed using the PDI will not reflect the NRP diversification characteristics being measured by the PDI
For Institutional/Investment Professional Use Only. Not for Distribution to the Public.
( ) CVWWwV
NN
N
N
NNNNN
N
N
N
NRPNRPNRP =
=
==
−
−
−
−
−
−
1
11
00
00
00
00
00
00
21
212
112
1
12
11
21
22221
11211
1
12
11
ρρ
ρρρρ
σ
σ
σ
σσσ
σσσσσσ
σ
σ
σ
Diversification Ratio (DR)
10
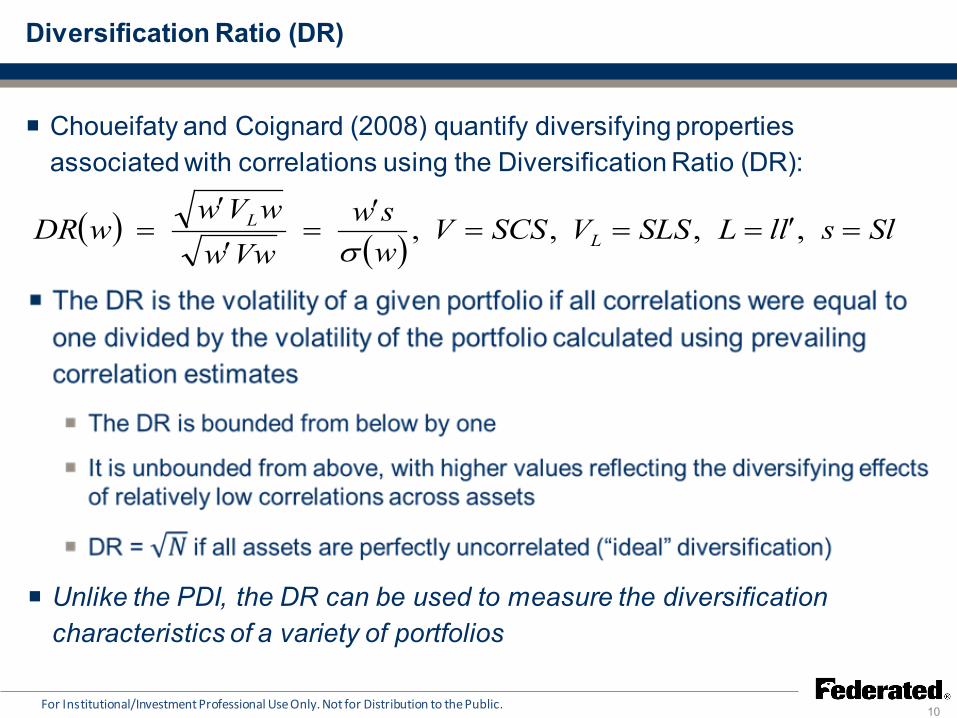
Choueifaty and Coignard (2008) quantify diversifying properties associated with correlations using the Diversification Ratio (DR):
For Institutional/Investment Professional Use Only. Not for Distribution to the Public.
( ) ( ) SlsllLSLSVSCSVwsw
VwwwVw
wDR LL =′===
′=
′
′= ,,,,
σ
Unlike the PDI, the DR can be used to measure the diversification characteristics of a variety of portfolios
Most Diversified Portfolio (MDP)
11
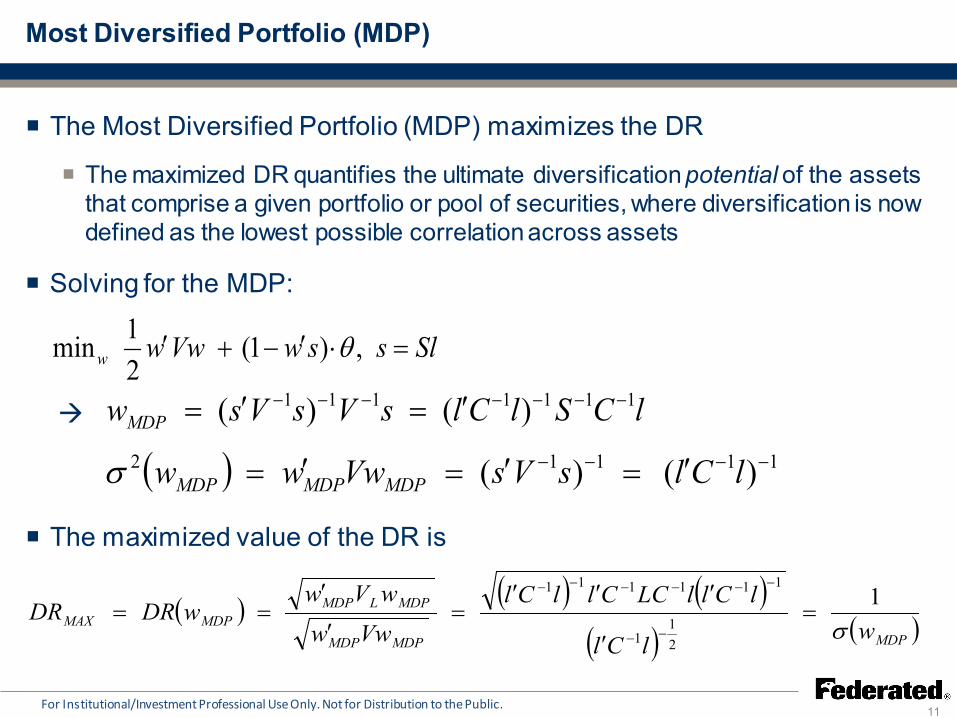
The Most Diversified Portfolio (MDP) maximizes the DR
The maximized DR quantifies the ultimate diversification potential of the assets that comprise a given portfolio or pool of securities, where diversification is now defined as the lowest possible correlation across assets
For Institutional/Investment Professional Use Only. Not for Distribution to the Public.
Solving for the MDP:
SlsswVwww =⋅′−+′ ,)1(21min θ
lCSlClsVsVswMDP1111111 )()( −−−−−−− ′=′=
( ) 11112 )()( −−−− ′=′=′= lClsVsVwww MDPMDPMDPσ
The maximized value of the DR is
( ) ( ) ( )
( ) ( )MDPMDPMDP
MDPLMDPMDPMAX wlCl
lCllLCCllClVww
wVwwDRDR
σ1
21
1
111111
=′
′′′=
′
′==
−−
−−−−−−
MDP and the Minimum Correlation Portfolio (MCP)
12 For Institutional/Investment Professional Use Only. Not for Distribution to the Public.
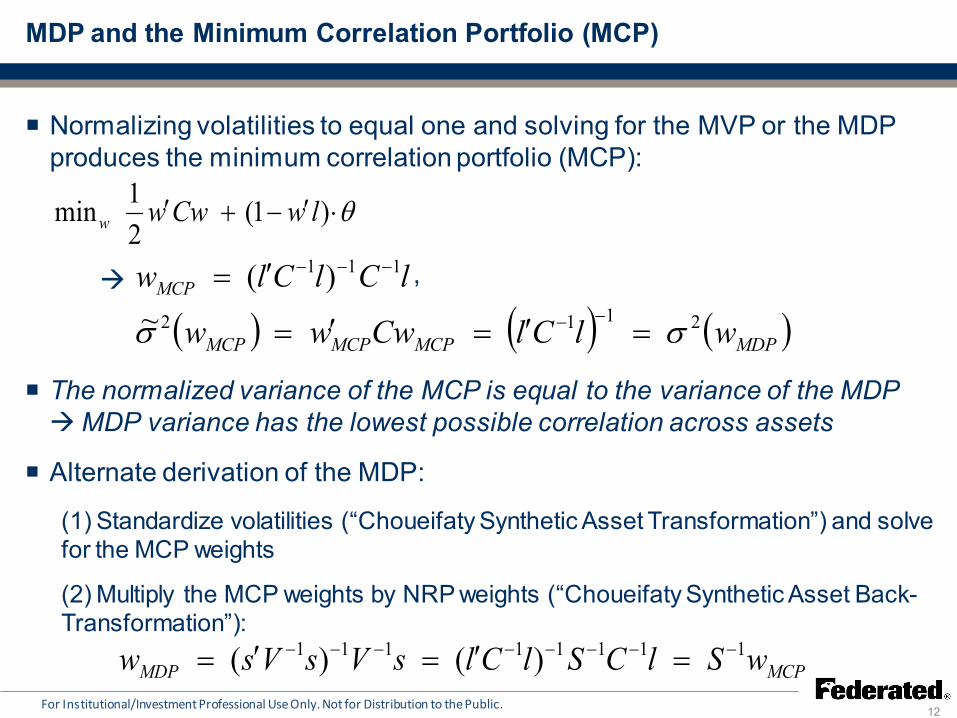
Normalizing volatilities to equal one and solving for the MVP or the MDP produces the minimum correlation portfolio (MCP):
θ⋅′−+′ )1(21min lwCwww
lClClwMCP111 )( −−−′=
( ) ( ) ( )MDPMCPMCPMCP wlClCwww 2112~ σσ =′=′=−−
,
The normalized variance of the MCP is equal to the variance of the MDP MDP variance has the lowest possible correlation across assets
Alternate derivation of the MDP:
(1) Standardize volatilities (“Choueifaty Synthetic Asset Transformation”) and solve for the MCP weights
(2) Multiply the MCP weights by NRP weights (“Choueifaty Synthetic Asset Back-Transformation”):
MCPMDP wSlCSlClsVsVsw 11111111 )()( −−−−−−−− =′=′=
DR and the variance of the MDP (VMDP)
13 For Institutional/Investment Professional Use Only. Not for Distribution to the Public.
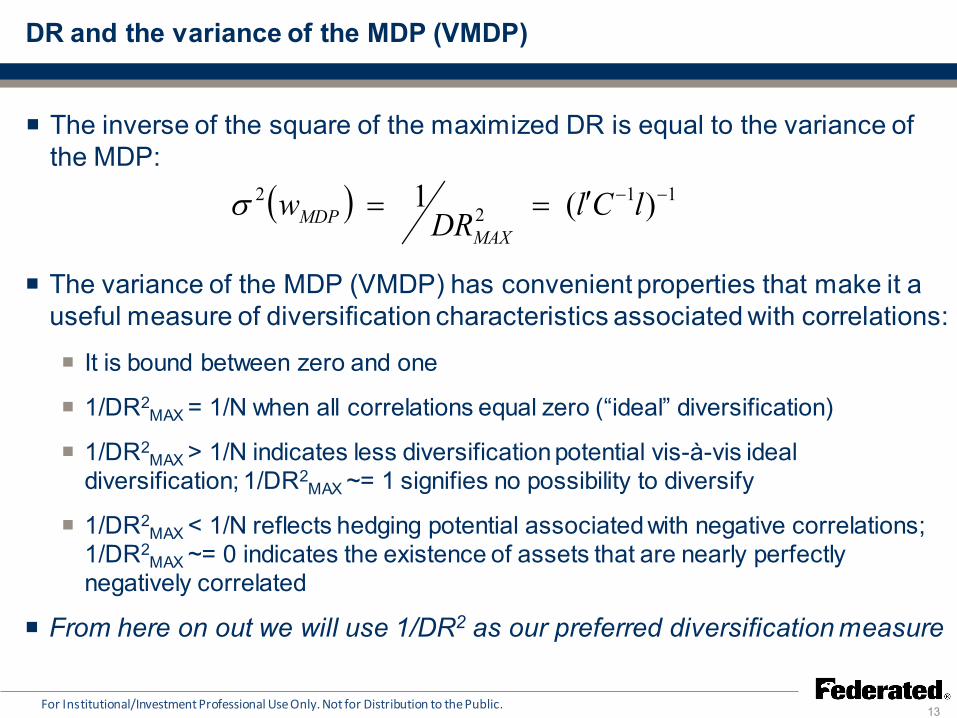
The variance of the MDP (VMDP) has convenient properties that make it a useful measure of diversification characteristics associated with correlations:
It is bound between zero and one
1/DR2MAX = 1/N when all correlations equal zero (“ideal” diversification)
1/DR2MAX > 1/N indicates less diversification potential vis-à-vis ideal
diversification; 1/DR2MAX ~= 1 signifies no possibility to diversify
1/DR2MAX < 1/N reflects hedging potential associated with negative correlations;
1/DR2MAX ~= 0 indicates the existence of assets that are nearly perfectly
negatively correlated
The inverse of the square of the maximized DR is equal to the variance of the MDP:
( ) 112
2 )(1 −−′== lClDRwMAX
MDPσ
From here on out we will use 1/DR2 as our preferred diversification measure
Comparing the DR and PDI
14
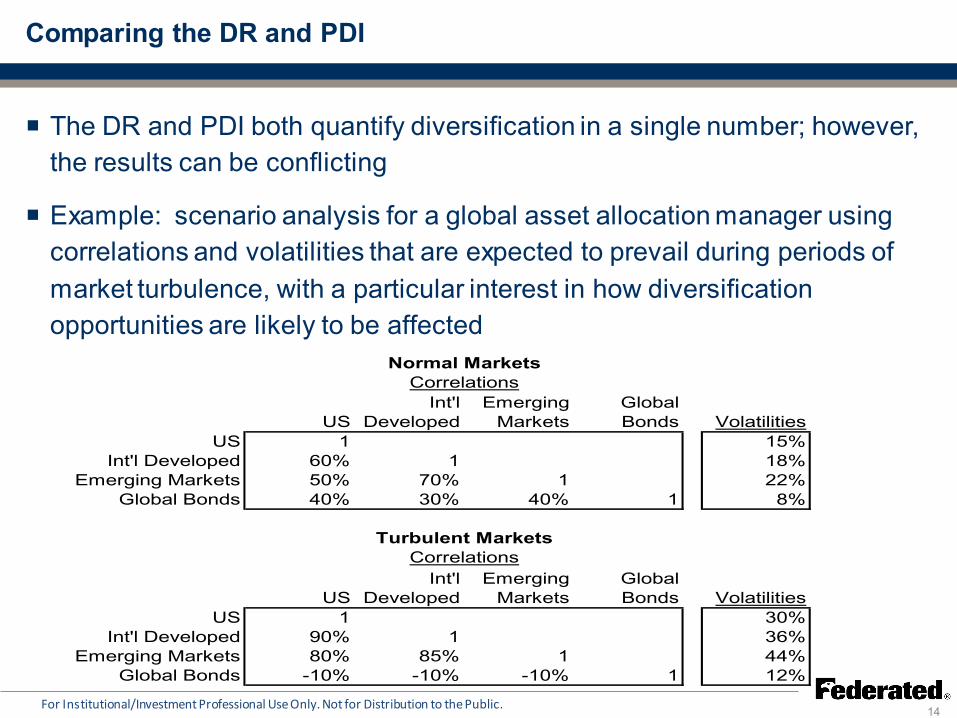
The DR and PDI both quantify diversification in a single number; however, the results can be conflicting
Example: scenario analysis for a global asset allocation manager using correlations and volatilities that are expected to prevail during periods of market turbulence, with a particular interest in how diversification opportunities are likely to be affected
For Institutional/Investment Professional Use Only. Not for Distribution to the Public.
USInt'l
DevelopedEmerging
MarketsGlobal Bonds Volatilities
US 1 15%Int'l Developed 60% 1 18%
Emerging Markets 50% 70% 1 22%Global Bonds 40% 30% 40% 1 8%
USInt'l
DevelopedEmerging
MarketsGlobal Bonds Volatilities
US 1 30%Int'l Developed 90% 1 36%
Emerging Markets 80% 85% 1 44%Global Bonds -10% -10% -10% 1 12%
Correlations
Normal Markets
Turbulent Markets
Correlations
Comparing the DR and PDI (con’t)
15
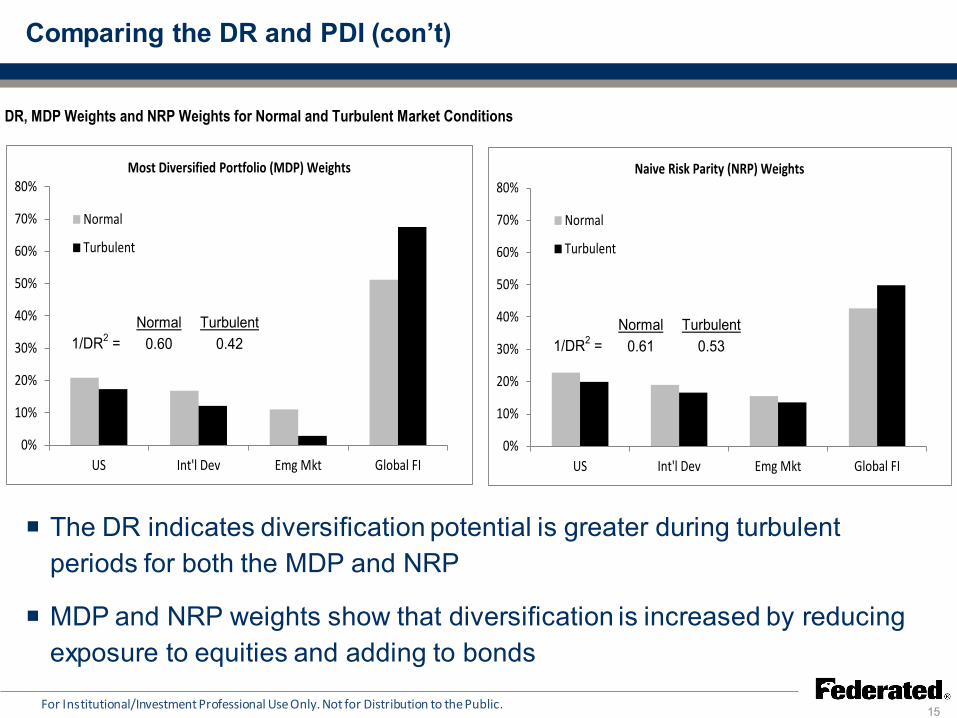
The DR indicates diversification potential is greater during turbulent periods for both the MDP and NRP
MDP and NRP weights show that diversification is increased by reducing exposure to equities and adding to bonds
For Institutional/Investment Professional Use Only. Not for Distribution to the Public.
DR, MDP Weights and NRP Weights for Normal and Turbulent Market Conditions
0%
10%
20%
30%
40%
50%
60%
70%
80%
US Int'l Dev Emg Mkt Global FI
Most Diversified Portfolio (MDP) Weights
Normal
Turbulent
0%
10%
20%
30%
40%
50%
60%
70%
80%
US Int'l Dev Emg Mkt Global FI
Naive Risk Parity (NRP) Weights
Normal
Turbulent
Normal Turbulent1/DR2 = 0.60 0.42
Normal Turbulent1/DR2 = 0.61 0.53
Comparing the DR and PDI (con’t)
16
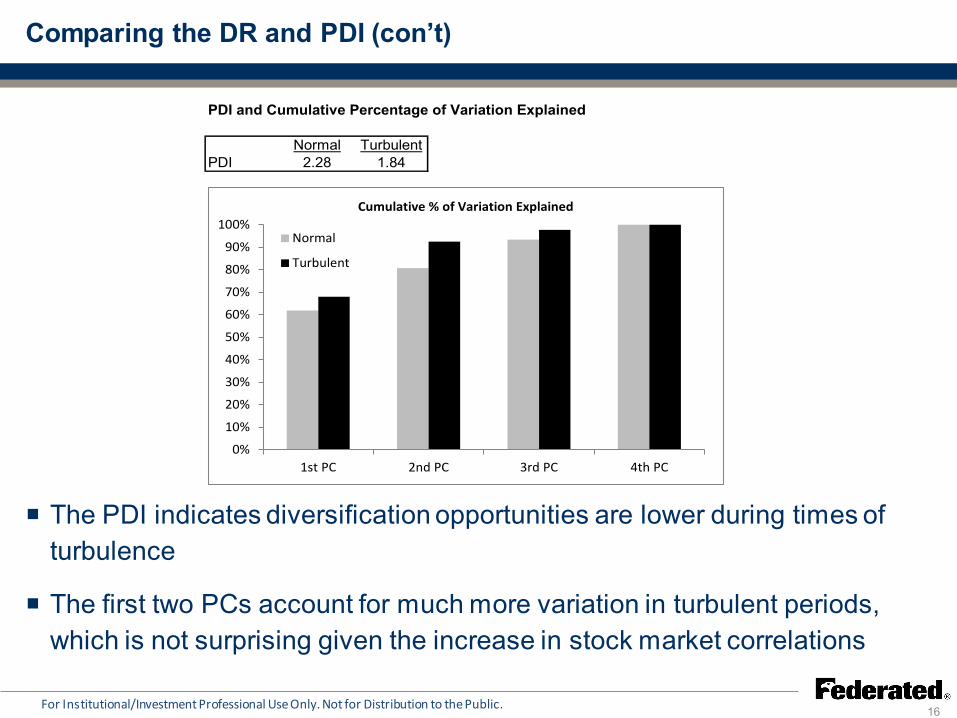
The PDI indicates diversification opportunities are lower during times of turbulence
The first two PCs account for much more variation in turbulent periods, which is not surprising given the increase in stock market correlations
For Institutional/Investment Professional Use Only. Not for Distribution to the Public.
PDI and Cumulative Percentage of Variation Explained
Normal TurbulentPDI 2.28 1.84
0%
10%
20%
30%
40%
50%
60%
70%
80%
90%
100%
1st PC 2nd PC 3rd PC 4th PC
Cumulative % of Variation Explained
Normal
Turbulent
Comparing the DR and PDI (con’t)
17 For Institutional/Investment Professional Use Only. Not for Distribution to the Public.
This example highlights a critical difference in these approaches to measuring diversification:
The PDI accurately reflects the fact that more substantial co-movement exists among the majority of assets (i.e., the equity markets) during times of turbulence
The maximized DR reflects the increase in diversification potential from the standpoint of a portfolio that is optimized to have the lowest possible correlation across assets
A stronger degree of positive correlation across most of the assets does not necessarily imply an overall reduction in the potential to diversify
The PDI may belie portfolio diversification opportunities that are more readily apparent from the perspective of the DR/MDP
Negative correlations and hedging characteristics
18
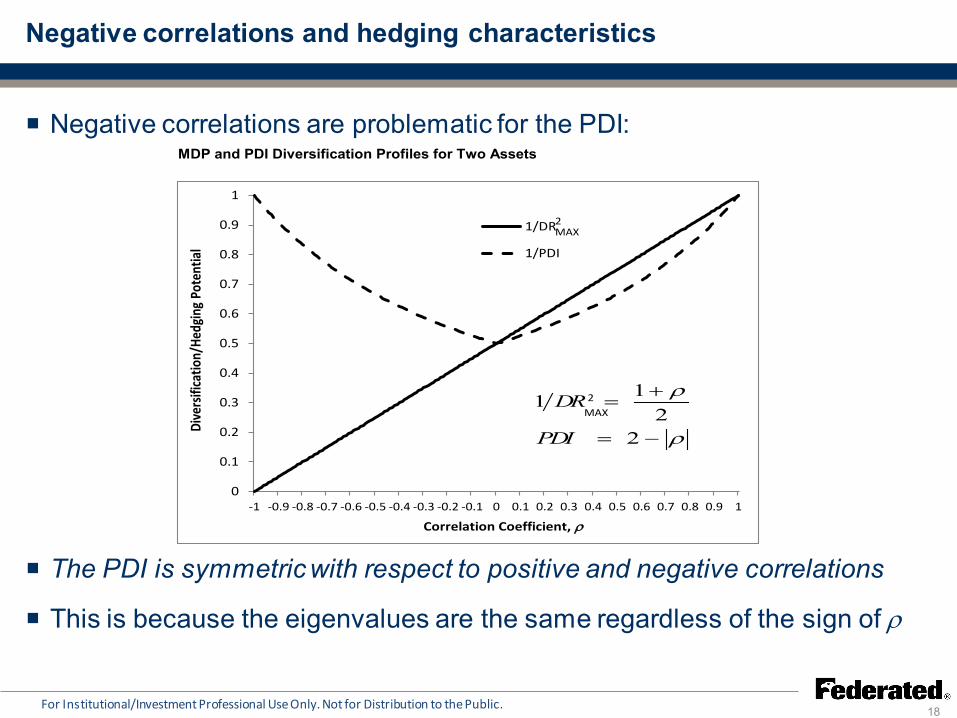
Negative correlations are problematic for the PDI:
The PDI is symmetric with respect to positive and negative correlations
This is because the eigenvalues are the same regardless of the sign of ρ
For Institutional/Investment Professional Use Only. Not for Distribution to the Public.
MDP and PDI Diversification Profiles for Two Assets
0
0.1
0.2
0.3
0.4
0.5
0.6
0.7
0.8
0.9
1
-1 -0.9 -0.8 -0.7 -0.6 -0.5 -0.4 -0.3 -0.2 -0.1 0 0.1 0.2 0.3 0.4 0.5 0.6 0.7 0.8 0.9 1
Dive
rsifi
catio
n/He
dgin
g Po
tent
ial
Correlation Coefficient, ρ
1/DR
1/PDI
2
2
MAX
MAX
ρ
ρ
−=
+=
22
11
PDI
DR
Example: three assets
19
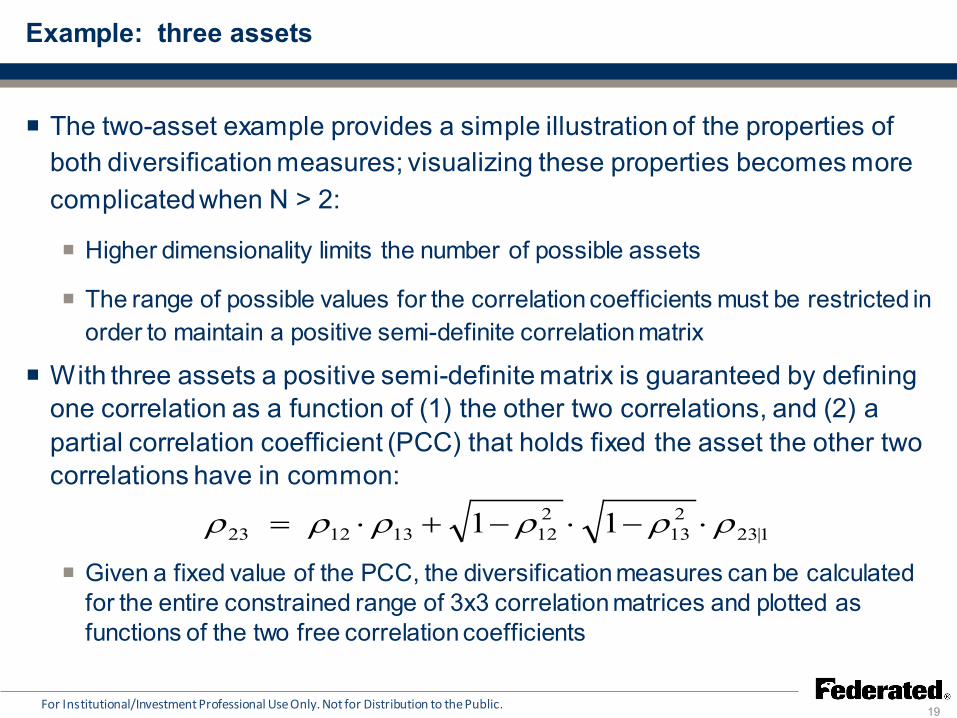
The two-asset example provides a simple illustration of the properties of both diversification measures; visualizing these properties becomes more complicated when N > 2:
Higher dimensionality limits the number of possible assets
The range of possible values for the correlation coefficients must be restricted in order to maintain a positive semi-definite correlation matrix
For Institutional/Investment Professional Use Only. Not for Distribution to the Public.
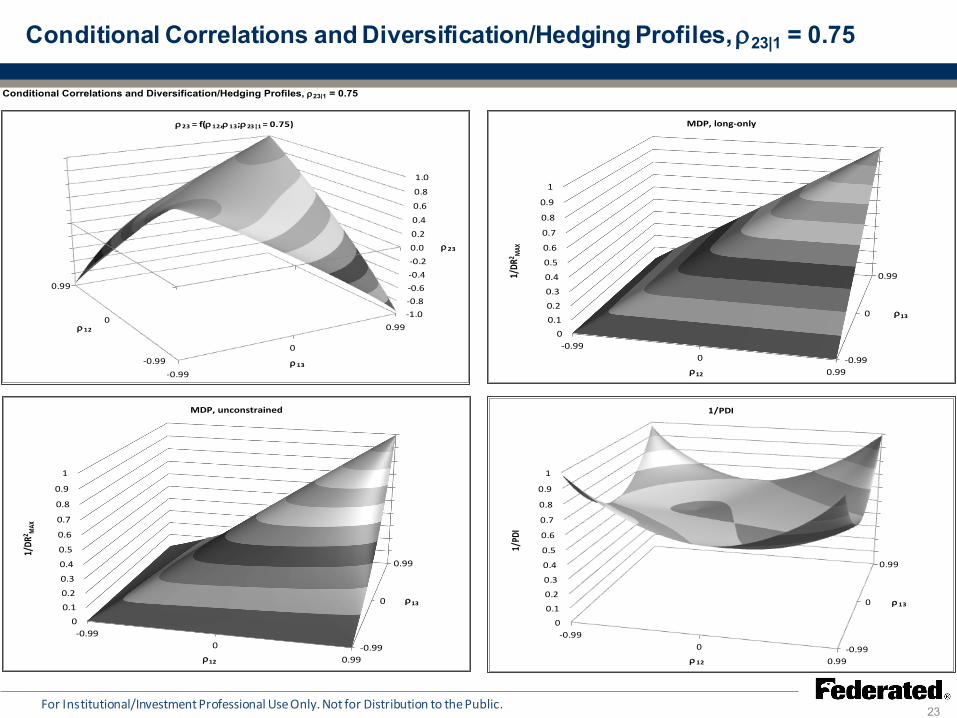
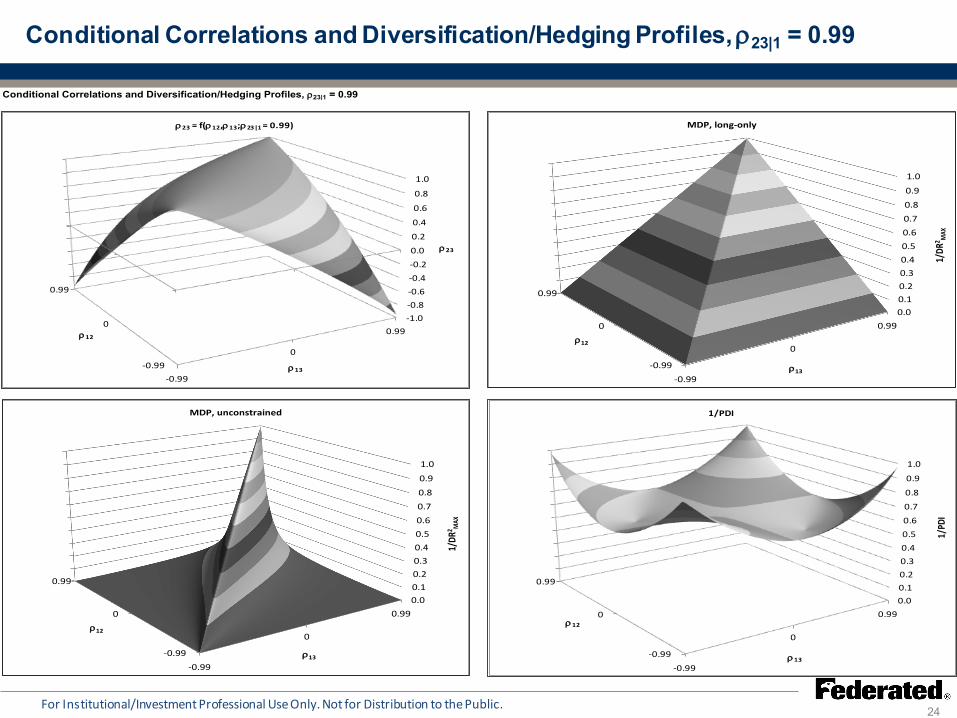
With three assets a positive semi-definite matrix is guaranteed by defining one correlation as a function of (1) the other two correlations, and (2) a partial correlation coefficient (PCC) that holds fixed the asset the other two correlations have in common:
Given a fixed value of the PCC, the diversification measures can be calculated for the entire constrained range of 3x3 correlation matrices and plotted as functions of the two free correlation coefficients
1|23213
212131223 11 ρρρρρρ ⋅−⋅−+⋅=
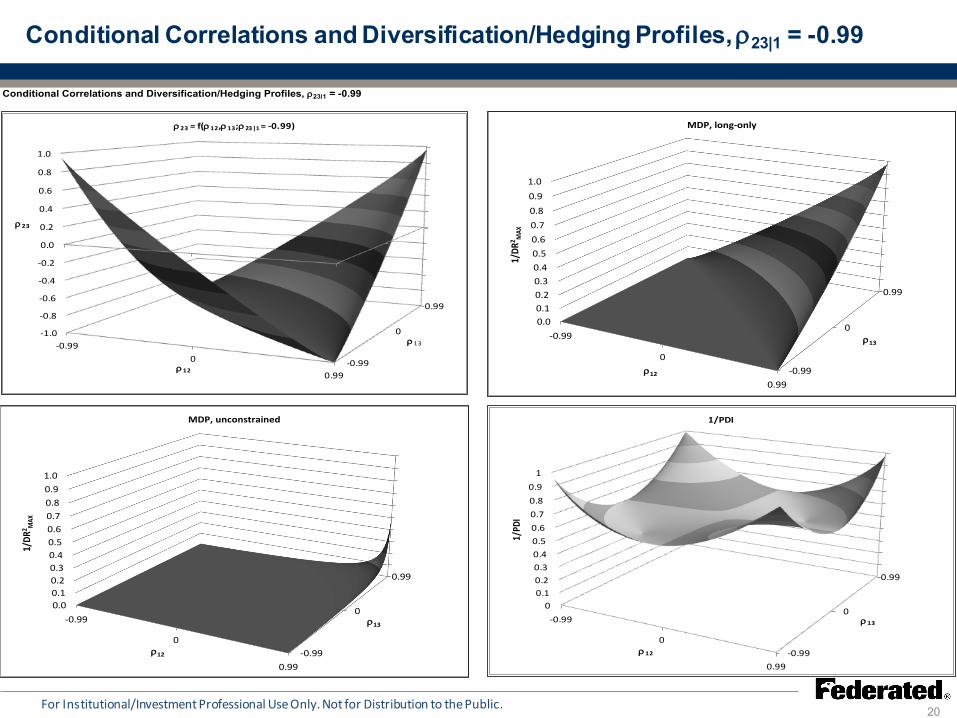
Conditional Correlations and Diversification/Hedging Profiles, ρ23|1 = -0.99
20 For Institutional/Investment Professional Use Only. Not for Distribution to the Public.
Conditional Correlations and Diversification/Hedging Profiles, ρ23|1 = -0.99
-0.99
0
0.99
00.10.20.30.40.50.60.70.80.9
1
0.99
0
-0.99ρ12
1/PD
I
ρ13
1/PDI
-0.990
0.99
-1.0
-0.8
-0.6
-0.4
-0.2
0.0
0.2
0.4
0.6
0.8
1.0
0.99
0
-0.99ρ12
ρ23
ρ13
ρ23 = f(ρ12,ρ13;ρ23|1 = -0.99)
-0.99
0
0.99
0.00.10.20.30.40.50.60.70.80.91.0
0.99
0
-0.99ρ12
1/DR
2 MAX
ρ13
MDP, unconstrained
-0.99
0
0.99
0.00.10.20.30.40.50.60.70.80.91.0
0.99
0
-0.99ρ12
1/DR
2 MAX
ρ13
MDP, long-only
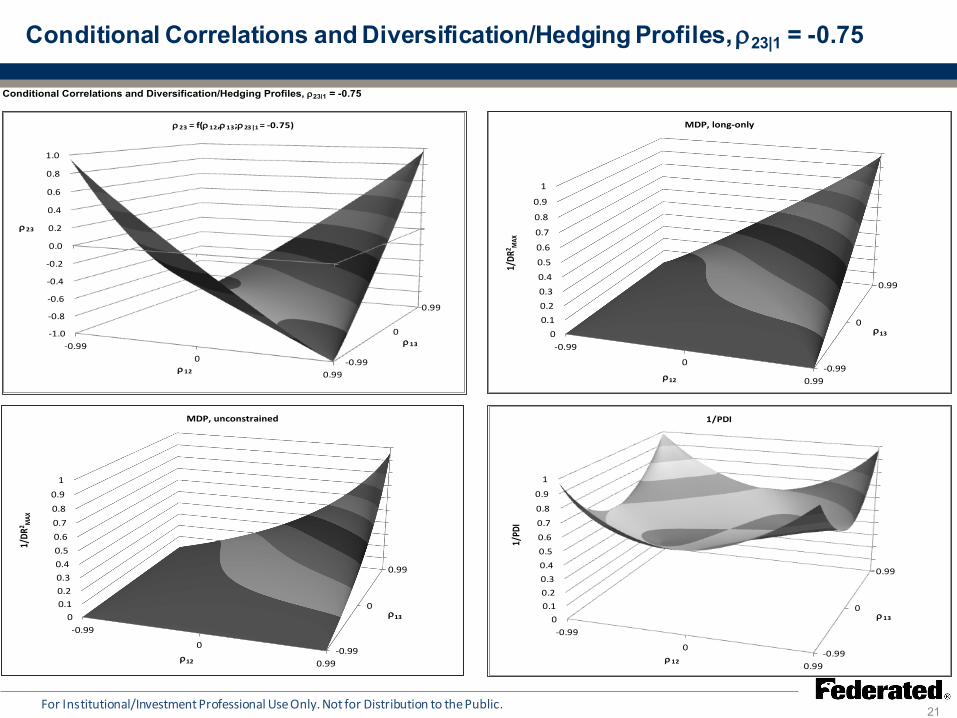
Conditional Correlations and Diversification/Hedging Profiles, ρ23|1 = -0.75
21 For Institutional/Investment Professional Use Only. Not for Distribution to the Public.
Conditional Correlations and Diversification/Hedging Profiles, ρ23|1 = -0.75
-0.99
0
0.99
00.10.20.30.40.50.6
0.7
0.8
0.9
1
0.99
0
-0.99ρ12
1/PD
I
ρ13
1/PDI
-0.990
0.99
-1.0
-0.8
-0.6
-0.4
-0.2
0.0
0.2
0.4
0.6
0.8
1.0
0.99
0
-0.99ρ12
ρ23
ρ13
ρ23 = f(ρ12,ρ13;ρ23|1 = -0.75)
-0.99
0
0.99
00.10.20.30.40.50.60.70.80.9
1
0.99
0
-0.99ρ12
1/DR
2 MAX
ρ13
MDP, unconstrained
-0.99
0
0.99
00.10.20.30.4
0.5
0.6
0.7
0.8
0.9
1
0.99
0
-0.99ρ12
1/DR
2 MAX
ρ13
MDP, long-only
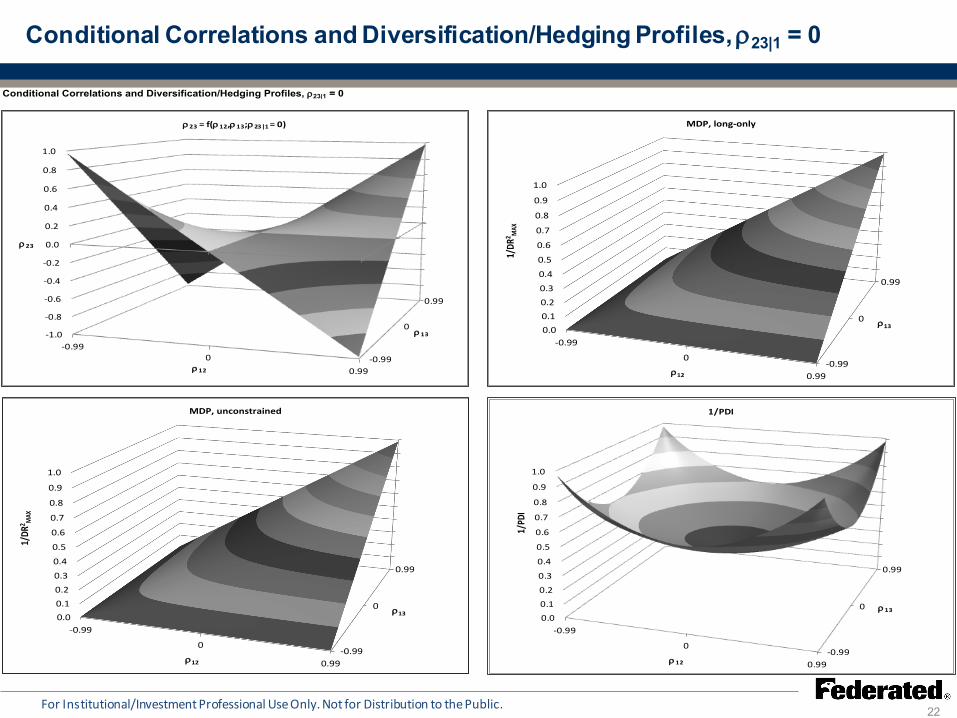
Conditional Correlations and Diversification/Hedging Profiles, ρ23|1 = 0
22 For Institutional/Investment Professional Use Only. Not for Distribution to the Public.
Conditional Correlations and Diversification/Hedging Profiles, ρ23|1 = 0
-0.99
0
0.99
0.0
0.1
0.2
0.3
0.4
0.5
0.6
0.7
0.8
0.9
1.0
0.99
0
-0.99ρ12
1/PD
I
ρ13
1/PDI
-0.990
0.99
-1.0
-0.8
-0.6
-0.4
-0.2
0.0
0.2
0.4
0.6
0.8
1.0
0.99
0
-0.99ρ12
ρ23
ρ13
ρ23 = f(ρ12,ρ13;ρ23|1 = 0)
-0.99
0
0.99
0.00.10.20.3
0.4
0.5
0.6
0.7
0.8
0.9
1.0
0.99
0
-0.99ρ12
1/DR
2 MAX
ρ13
MDP, unconstrained
-0.99
0
0.99
0.00.10.20.3
0.4
0.5
0.6
0.7
0.8
0.9
1.0
0.99
0
-0.99ρ12
1/DR
2 MAX
ρ13
MDP, long-only
Conditional Correlations and Diversification/Hedging Profiles, ρ23|1 = 0.75
23 For Institutional/Investment Professional Use Only. Not for Distribution to the Public.
Conditional Correlations and Diversification/Hedging Profiles, ρ23|1 = 0.75
-0.990
0.99
0
0.1
0.2
0.3
0.4
0.5
0.6
0.7
0.8
0.9
1
0.99
0
-0.99ρ12
1/PD
I
ρ13
1/PDI
-0.99
0
0.99-1.0-0.8-0.6-0.4-0.20.00.2
0.4
0.6
0.8
1.0
0.99
0
-0.99
ρ12
ρ23
ρ13
ρ23 = f(ρ12,ρ13;ρ23|1 = 0.75)
-0.990
0.99
00.1
0.2
0.3
0.4
0.5
0.6
0.7
0.8
0.9
1
0.99
0
-0.99ρ12
1/DR
2 MAX
ρ13
MDP, unconstrained
-0.990
0.99
00.10.2
0.3
0.4
0.5
0.6
0.7
0.8
0.9
1
0.99
0
-0.99ρ12
1/DR
2 MAX
ρ13
MDP, long-only
Conditional Correlations and Diversification/Hedging Profiles, ρ23|1 = 0.99
24 For Institutional/Investment Professional Use Only. Not for Distribution to the Public.
Conditional Correlations and Diversification/Hedging Profiles, ρ23|1 = 0.99
-0.99
0
0.990.00.10.20.30.40.50.6
0.7
0.8
0.9
1.0
0.99
0
-0.99 ρ13
1/PD
I
ρ12
1/PDI
-0.99
0
0.99-1.0-0.8-0.6-0.4-0.20.0
0.2
0.4
0.6
0.8
1.0
0.99
0
-0.99 ρ13
ρ23
ρ12
ρ23 = f(ρ12,ρ13;ρ23|1 = 0.99)
-0.99
0
0.990.00.10.20.30.40.50.60.70.80.9
1.0
0.99
0
-0.99 ρ13
1/DR
2 MAX
ρ12
MDP, unconstrained
-0.99
0
0.990.00.10.20.30.40.50.60.70.80.9
1.0
0.99
0
-0.99 ρ13
1/DR
2 MAX
ρ12
MDP, long-only
Comparing the MDP and PDI
25
The maximized DR profiles exhibit a number of distinctive characteristics:
1/DR2MAX is close to its maximum value of one only when all of the correlations
are nearly equal to one low diversification potential is due solely to relatively high positive correlations across all of the assets
1/DR2MAX is close to zero when negative correlations become relatively extreme
significant hedging potential exists whenever two of the assets are close to being perfectly negatively correlated
Constraining the MDP weights to be non-negative reduces diversification opportunities but does not affect the fundamental properties of the maximized DR
The no-shorting constraint also reflects more realistic investment possibilities as unconstrained MDP weights can take on large values that would require extreme leverage to implement
For Institutional/Investment Professional Use Only. Not for Distribution to the Public.
Comparing the MDP and PDI (con’t)
26
The profiles of the inverted PDI differ considerably from those of the MDP:
The values of the PDI are symmetric with respect to positive and negative correlations, with the inverse of the PDI close to one when all of the correlations are at extremes irrespective of sign
The inverse of the PDI reaches its lower bound of 1/N = 1/3 when all three correlations are equal to zero, which occurs only in the case of ρ23|1 = 0
The PDI can be viewed as operating on the absolute values of the correlations, and thus can produce misleading estimates of diversification potential
For Institutional/Investment Professional Use Only. Not for Distribution to the Public.
Example: hedge fund investment styles
27
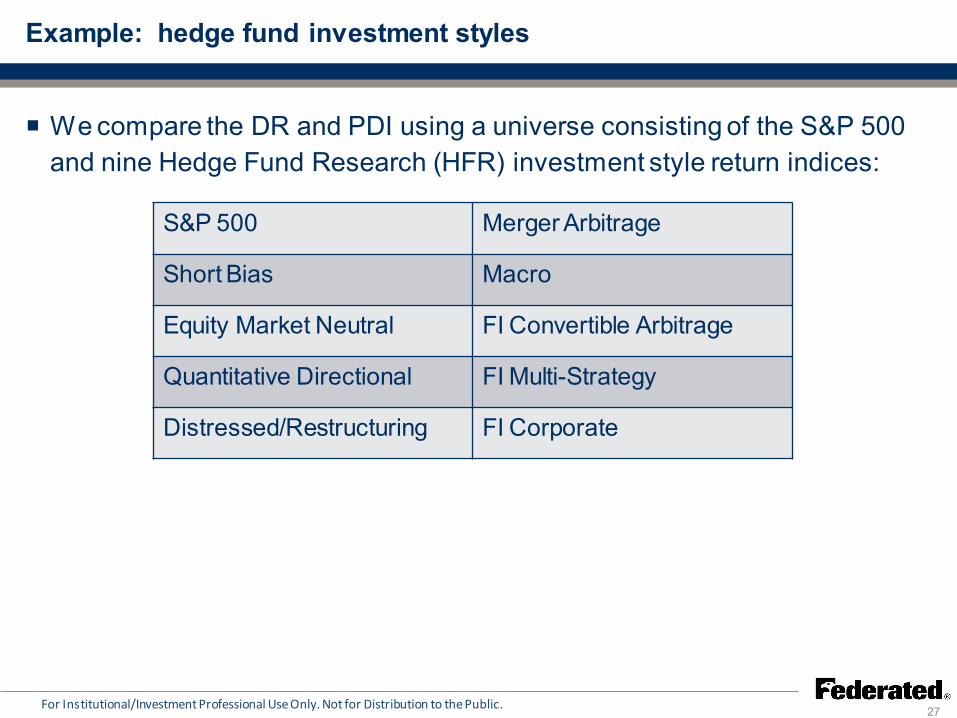
We compare the DR and PDI using a universe consisting of the S&P 500 and nine Hedge Fund Research (HFR) investment style return indices:
For Institutional/Investment Professional Use Only. Not for Distribution to the Public.
S&P 500 Merger Arbitrage
Short Bias Macro
Equity Market Neutral FI Convertible Arbitrage
Quantitative Directional FI Multi-Strategy
Distressed/Restructuring FI Corporate
DR and PDI with and without Short Bias
28 For Institutional/Investment Professional Use Only. Not for Distribution to the Public.
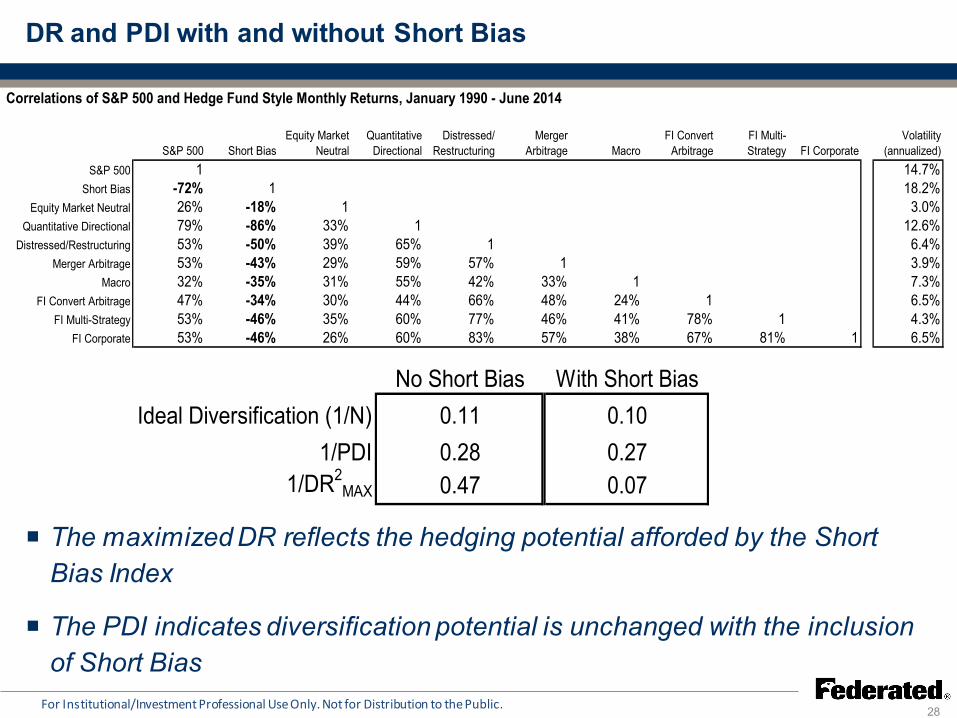
Correlations of S&P 500 and Hedge Fund Style Monthly Returns, January 1990 - June 2014
S&P 500 Short BiasEquity Market
NeutralQuantitative
DirectionalDistressed/
RestructuringMerger
Arbitrage MacroFI Convert
ArbitrageFI Multi-Strategy FI Corporate
Volatility (annualized)
S&P 500 1 -0.71994 0.263238 0.787162 0.5262449 0.5259978 0.3226473 0.4683566 0.5266504 0.533498 14.7%Short Bias -72% 1 -0.179312 -0.85868 -0.497944 -0.434324 -0.354031 -0.338706 -0.460593 -0.455842 18.2%
Equity Market Neutral 26% -18% 1 0.3265851 0.390303 0.2942456 0.3050155 0.3044569 0.3540019 0.2644231 3.0%Quantitative Directional 79% -86% 33% 1 0.6543599 0.5917771 0.5466663 0.43745 0.5983264 0.5995807 12.6%
Distressed/Restructuring 53% -50% 39% 65% 1 0.5694965 0.4162466 0.6606936 0.7726735 0.825681 6.4%Merger Arbitrage 53% -43% 29% 59% 57% 1 0.3261981 0.4768753 0.4639966 0.5671158 3.9%
Macro 32% -35% 31% 55% 42% 33% 1 0.2395271 0.4141915 0.3809597 7.3%FI Convert Arbitrage 47% -34% 30% 44% 66% 48% 24% 1 0.7791046 0.6722827 6.5%
FI Multi-Strategy 53% -46% 35% 60% 77% 46% 41% 78% 1 0.8142679 4.3%FI Corporate 53% -46% 26% 60% 83% 57% 38% 67% 81% 1 6.5%
The maximized DR reflects the hedging potential afforded by the Short Bias Index
The PDI indicates diversification potential is unchanged with the inclusion of Short Bias
No Short BiasIdeal Diversification (1/N) 0.11
1/PDI 0.281/DR2
MAX 0.47
With Short Bias0.100.270.07
DR and PDI with and without Short Bias (con’t)
29 For Institutional/Investment Professional Use Only. Not for Distribution to the Public.
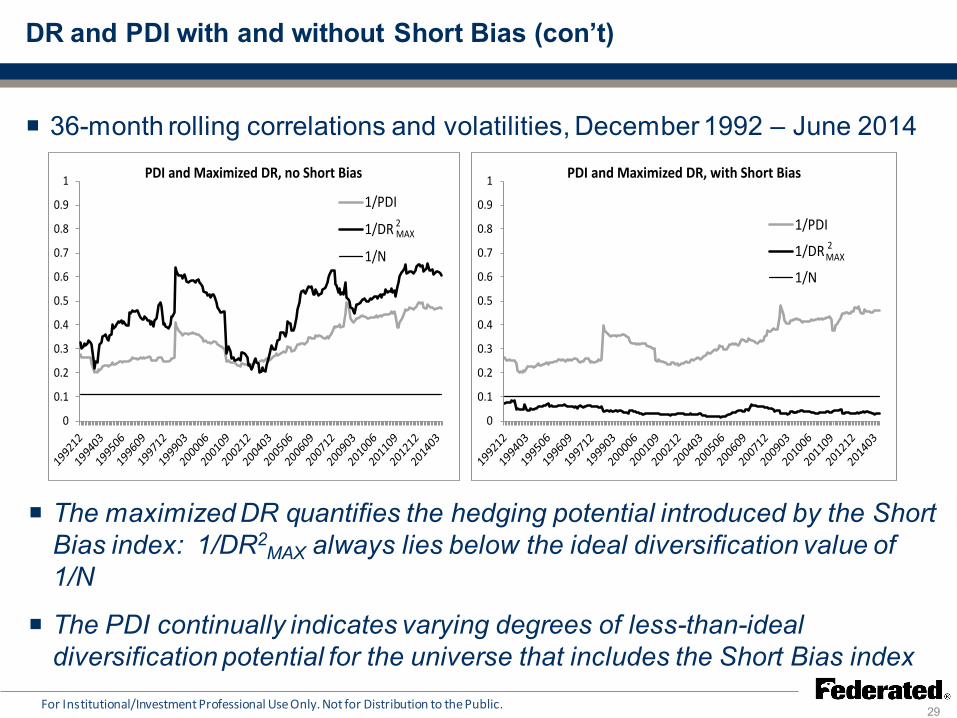
36-month rolling correlations and volatilities, December 1992 – June 2014
The maximized DR quantifies the hedging potential introduced by the Short Bias index: 1/DR2
MAX always lies below the ideal diversification value of 1/N
The PDI continually indicates varying degrees of less-than-ideal diversification potential for the universe that includes the Short Bias index
0
0.1
0.2
0.3
0.4
0.5
0.6
0.7
0.8
0.9
1 PDI and Maximized DR, no Short Bias
1/PDI
1/DR
1/N
2MAX
0
0.1
0.2
0.3
0.4
0.5
0.6
0.7
0.8
0.9
1 PDI and Maximized DR, with Short Bias
1/PDI
1/DR
1/N
2MAX
Portfolio construction
30 For Institutional/Investment Professional Use Only. Not for Distribution to the Public.
Methods that use the PDI as a tool to construct diversified portfolios have recently been introduced (for example, Crezee and Swinkels, 2010; Diyarbakirlioglu and Satman, 2014)
The approaches involve iterative procedures that combine assets until the maximum PDI is found for a portfolio with a pre-specified number of holdings
These maximized PDI rules are ubiquitously used to construct equally weighted portfolios, as opposed to Naïve Risk Parity portfolios
We use the maximum PDI to construct portfolios consisting of the S&P 500 combined with the hedge fund style indices, with and without the Short Bias Index
Use full-sample volatilities and correlations
Portfolios range from 2 assets to all 10 assets
Compare equal-weighted portfolio, NRP portfolios and long-only MDPs
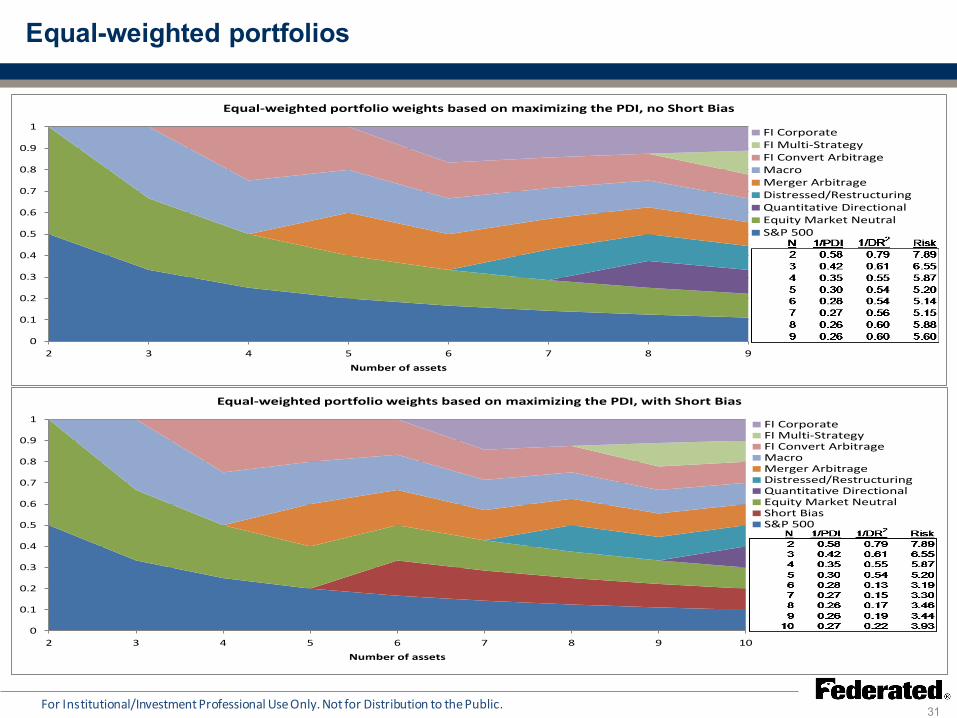
Equal-weighted portfolios
31 For Institutional/Investment Professional Use Only. Not for Distribution to the Public.
0
0.1
0.2
0.3
0.4
0.5
0.6
0.7
0.8
0.9
1
2 3 4 5 6 7 8 9 10Number of assets
Equal-weighted portfolio weights based on maximizing the PDI, with Short Bias
FI CorporateFI Multi-StrategyFI Convert ArbitrageMacroMerger ArbitrageDistressed/RestructuringQuantitative DirectionalEquity Market NeutralShort BiasS&P 500
0
0.1
0.2
0.3
0.4
0.5
0.6
0.7
0.8
0.9
1
2 3 4 5 6 7 8 9Number of assets
Equal-weighted portfolio weights based on maximizing the PDI, no Short Bias
FI CorporateFI Multi-StrategyFI Convert ArbitrageMacroMerger ArbitrageDistressed/RestructuringQuantitative DirectionalEquity Market NeutralS&P 500
Naïve Risk Parity (NRP) portfolios
32 For Institutional/Investment Professional Use Only. Not for Distribution to the Public.
0
0.1
0.2
0.3
0.4
0.5
0.6
0.7
0.8
0.9
1
2 3 4 5 6 7 8 9Number of assets
Naive Risk Parity portfolio weights based on maximizing the PDI, no Short Bias
FI CorporateFI Multi-StrategyFI Convert ArbitrageMacroMerger ArbitrageDistressed/RestructuringQuantitative DirectionalEquity Market NeutralS&P 500
0
0.1
0.2
0.3
0.4
0.5
0.6
0.7
0.8
0.9
1
2 3 4 5 6 7 8 9 10Number of assets
Naive Risk Parity portfolio weights based on maximizing the PDI, with Short Bias
FI CorporateFI Multi-StrategyFI Convert ArbitrageMacroMerger ArbitrageDistressed/RestructuringQuantitative DirectionalEquity Market NeutralShort BiasS&P 500
Most Diversified Portfolios (MDP)
33 For Institutional/Investment Professional Use Only. Not for Distribution to the Public.
0
0.1
0.2
0.3
0.4
0.5
0.6
0.7
0.8
0.9
1
2 3 4 5 6 7 8 9Number of assets
Most Diversified Portfolios, no Short Bias
FI CorporateFI Multi-StrategyFI Convert ArbitrageMacroMerger ArbitrageDistressed/RestructuringQuantitative DirectionalEquity Market NeutralS&P 500
0
0.1
0.2
0.3
0.4
0.5
0.6
0.7
0.8
0.9
1
2 3 4 5 6 7 8 9 10Number of assets
Most Diversified Portfolios, with Short Bias
FI CorporateFI Multi-StrategyFI Convert ArbitrageMacroMerger ArbitrageDistressed/RestructuringQuantitative DirectionalEquity Market NeutralShort BiasS&P 500
Portfolio construction -- summary
34 For Institutional/Investment Professional Use Only. Not for Distribution to the Public.
Equal-weighted portfolios The Short Bias Index is not included for portfolios with less than 6 assets The PDI indicates diversification is similar for portfolios with 5 or more assets The DR and portfolio risk both fall significantly once the Short Bias Index is
included
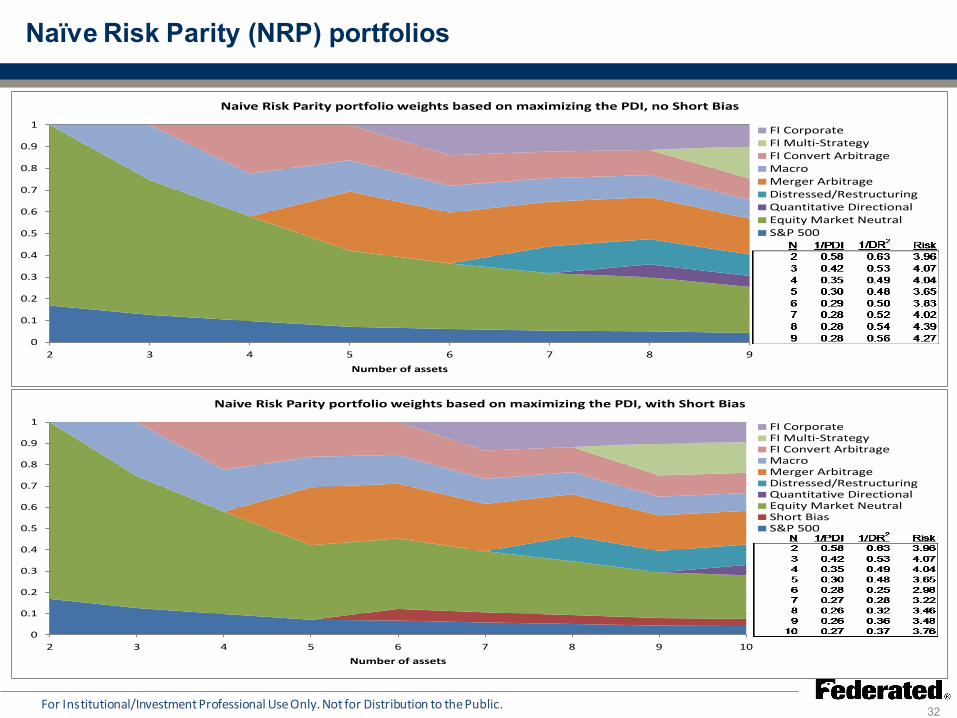
Naïve Risk Parity portfolios NRP weights differ considerably from equal weights Risk is much lower for portfolios with 5 or fewer holdings, even though positions
are more concentrated Compared with equal weights, DRs are lower for portfolios with N < 6 but higher
for 6 or more holdings when the Short Bias Index is included
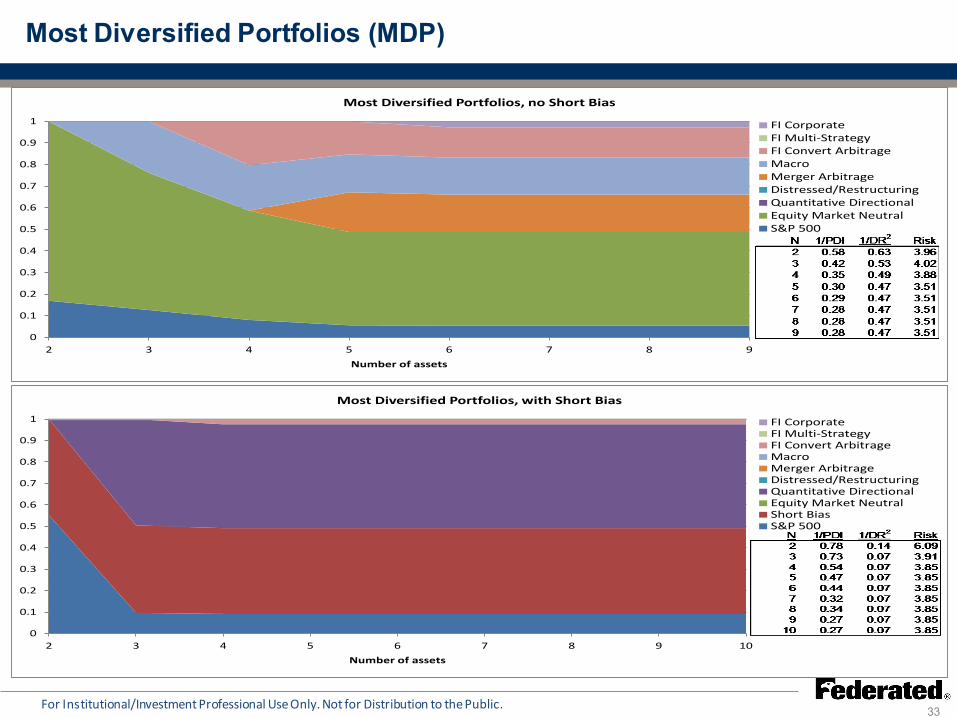
Most Diversified Portfolios Long-only MDPs are very different from maximum PDI portfolios Maximum diversification potential is reached with 6 assets ex-Short Bias and
just 4 assets including Short Bias All portfolios include the Short Bias Index when it is available for portfolio
selection
Conclusion
35
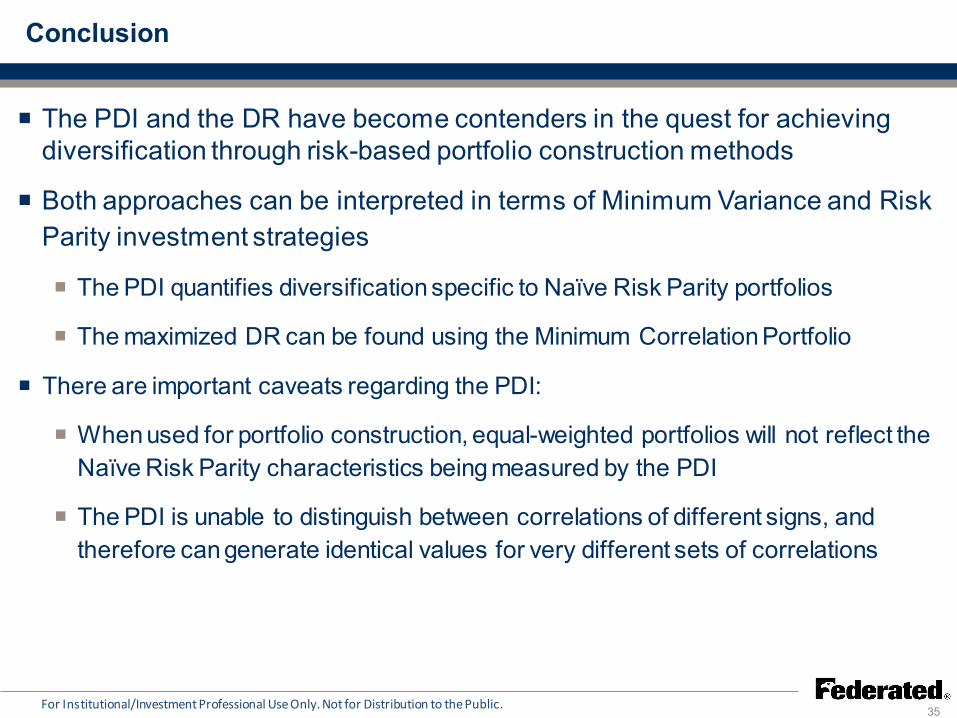
The PDI and the DR have become contenders in the quest for achieving diversification through risk-based portfolio construction methods
Both approaches can be interpreted in terms of Minimum Variance and Risk Parity investment strategies
The PDI quantifies diversification specific to Naïve Risk Parity portfolios
The maximized DR can be found using the Minimum Correlation Portfolio
For Institutional/Investment Professional Use Only. Not for Distribution to the Public.
There are important caveats regarding the PDI:
When used for portfolio construction, equal-weighted portfolios will not reflect the Naïve Risk Parity characteristics being measured by the PDI
The PDI is unable to distinguish between correlations of different signs, and therefore can generate identical values for very different sets of correlations
References
36 For Institutional/Investment Professional Use Only. Not for Distribution to the Public.
Ang, A. H., and J. Chen. “Asymmetric Correlations of Equity Portfolios.” Journal of Financial Economics, Vol. 63, No. 3 (2002), pp. 443-494.
Campbell, R., K. Koedijk, and P. Kofman. “Increased Correlations in Bear Markets.” Financial Analysts Journal, Vol. 58, No. 1 (2002), pp. 87-94.
Cappiello, L., R.F. Engle, and K. Sheppard. “Asymmetric Dynamics in the Correlations of Global Equity and Bond Returns.” Journal of Financial Economics, Vol. 4, No. 4 (2006), pp. 385-412.
Choueifaty, T. “Methods and Systems for Providing an Anti-Benchmark Portfolio.” Unites States Patent and Trademark Office, patent number US 7958038 B2 (2006).
Choueifaty, Y., and Y. Coignard. “Toward Maximum Diversification.” The Journal of Portfolio Management, Vol. 35, No. 1 (2008), pp. 40-51.
Chua, D. B., M. Kritzman, and S. Page. “The Myth of Diversification.” The Journal of Portfolio Management, Vol. 36, No. 1 (Fall 2009), pp. 26-35.
Clarke, R., H. de Silva, and S. Thorley. “Minimum Variance Portfolios in the U.S. Equity Market.” The Journal of Portfolio Management, Vol. 33, No. 1 (2006), pp. 10-24.
Clarke, R., H. de Silva, and S. Thorley. “Risk Parity, Maximum Diversification, and Minimum Variance: An Analytic Perspective.” The Journal of Portfolio Management, Vol. 39, No. 3 (2013), pp. 39-53.
Crezee, D. P., and L. A. P. Swinkels. “High-conviction Equity Portfolio Optimization.” Journal of Risk, Vol. 13, No. 2 (Winter 2010/2011), pp. 57-70.
Diyarbakirlioglu, E., and M. H. Satman. “The Maximum Diversification Index.” Journal of Asset Management, Vol. 14, No. 6 (2014), pp. 400-409.
Fragkiskos, A. “What is Portfolio Diversification?” State Street White Paper (September 2013).
Frahm, G., and C. Wiechers. “On the Diversification of Portfolios of Risky Assets.” University of Cologne Discussion Paper in Statistics and Econometrics, No. 2/11 (January 2011).
Goetzmann, W.N., and A. Kumar. “Equity Portfolio Diversification.” Review of Finance, Vol. 12 (2008), pp. 433-463.
Goetzmann, W.N., L. Li, and K.G. Rouwenhorst. “Long-Term Global Market Correlations.” NBER Working Paper No. 8612 (November 2001).
Gongloff, M. “Hedge Funds Kiss Their Alpha Goodbye.” Wall Street Journal MarketBeat (November 21, 2011).
Jolliffe, I.T. Principal Component Analysis, 2nd ed. Springer-Verlag, 2002.
Kirchner, U., and C. Zunckel. “Measuring Portfolio Diversification.” arXiv.org Quantitative Finance Paper No. 1102.4722 (February 2011).
Kritzman, M., and Y. Li. “Skulls, Financial Turbulence, and Risk Management.” Financial Analysts Journal, Vol. 66, No. 5 (2010), pp. 23-35.
References (con’t)
37 For Institutional/Investment Professional Use Only. Not for Distribution to the Public.
Lee, W. “Risk-Based Asset Allocation: A New Answer to an Old Question?” The Journal of Portfolio Management, Vol. 37, No. 4 (Summer 2011), pp. 11-28.
Lewis, K. “Is the International Diversification Potential Diminishing? Foreign Equity Inside and Outside the US.” NBER Working Paper 12697 (November 2006).
Lhabitant, F., and M. Learned. “Hedge Fund Diversification: How Much is Enough?” FAME Research Paper No. 52 (July 2002).
Longin, F., and B. Solnik. “Is the Correlation in International Equity Returns Constant: 1960 – 1990?” Journal of International Money and Finance, Vol. 14, No. 1 (1995), pp. 3-26.
Longin, F., and B. Solnik. “Extreme Correlation of International Equity Returns Markets.” Journal of Finance, Vol. 61, No. 2 (2001), pp. 649-676.
Loretan, M., and W.B. English. “Evaluating “Correlation Breakdowns” During Periods of Market Volatility.” International Finance Discussion Papers, Board of Governors of the Federal Reserve System, Vol. 658 (2000).
Maillard, S., T. Roncalli, and J. Teiletche. “The Properties of Equally Weighted Risk Contribution Portfolios.” The Journal of Portfolio Management, Vol. 36, No. 4 (Summer 2010), pp. 60-70.
Meucci, A. “Managing Diversification.” Risk (May 2009), pp. 74-79.
O’Toole, R. “Measuring the Diversification and Hedging Properties of Correlations.” SSRN working paper, 2012.
Philips, C., D. Walker, and F. Kinniry Jr. “Dynamic Correlations.” Journal of Indexes, Vol. 15, No. 5 (September/October 2012), pp. 34-41.
Qian, E. “Risk Parity Portfolios: Efficient Portfolios Through True Diversification.” PanAgora Asset Management White Paper (September 2005).
Qian, E. “Risk Parity Portfolios: The Next Generation.” PanAgora Asset Management White Paper (September 2009).
Qian, E. “Risk Parity and Diversification.” Journal of Investing, Vol. 20, No. 1 (Spring 2011), pp. 119-127.
Rudin, A.M., and J.S. Morgan. “A Portfolio Diversification Index.” The Journal of Portfolio Management, Vol. 32, No. 2 (Winter 2006), pp. 81-89.
Sancetta, A., and S.E. Satchell. “Changing Correlation and Equity Portfolio Diversification Failure for Linear Factor Models during Market Declines.” Applied Mathematical Finance, Vol. 14, No. 3 (2007), pp. 227-242.
Solnik, B., C. Boucrelle, and Y. Le Fur. “International Market Correlation and Volatility.” Financial Analysts Journal, Vol. 52, No. 5 (1996), pp. 17-34.
Van Royen, A. S. “Hedge Fund Index Returns.” Hedge Fund Strategies, Vol. 36, No. 1 (2002), pp. 111-117.
Woerheide, W., and D. Persson. “An Index of Portfolio Diversification.” Financial Services Review, Vol. 2, No. 2 (1993), pp. 73.