Embed Size (px)
Citation preview

Energy Procedia
Energy Procedia 00 (2008) 000–000 www.elsevier.com/locate/XXX
__________ * Corresponding author. Tel.: +44-20-7594-7374; fax: +44-20-7594-7354. E-mail address: [email protected].
GHGT-9
A coupled reservoir-geomechanical simulation study of CO2 storage in a nearly depleted natural gas reservoir
Ji-Quan Shi*, Sevket Durucan Department of Earth Sceince and Engineering, Imperial College London, Exhibition Road, London SW7 2AZ, UK
Elsevier use only: Received date here; revised date here; accepted date here
Abstract
Atzbach-Schwanenstadt natural gas field located in Upper Austria Molasse Foreland basin was one of the four European sites selected for subsurface CO2 storage feasibility/performance evaluation in the recently completed EU-funded research project CASTOR. The objectives of the coupled reservoir-geomechanical modelling effort at Aztbach-Schwanenstadt gas field were: 1) evaluation of the hydro-mechanical response of the reservoir rock and overburden formations to historical and current gas production rates, different CO2 injection scenarios and its long-term storage; and 2) assessment of the potential for shear failure and/or re-activation of pre-existing faults as a result of changes in the reservoir pressure due to natural gas production and CO2 injection. The simulation results in terms of changes in the reservoir stresses and associated reservoir compaction/uplifting are presented and their likely impact on reservoir integrity discussed. The widely used Mohr-Coulomb shear failure analysis was carried out for the gas reservoir undergoing reservoir pressure depletion and then re-pressurisation due to CO2 injection, in particular under the regional strike-slip fault stress regime relevant to the gas field. An equation was derived to estimate the maximum sustainable pore pressure under different horizontal/vertical stress ratios and rock strength properties, with reference to the stress path hysteresis during reservoir re-pressurisation.
Keywords: coupled geomechanical modelling; depleted gas reservoir; CO2 storage; fault re-activation.
1. Introduction
Atzbach-Schwanenstadt natural gas field located in Upper Austria Molasse Foreland basin was one of the four European sites selected for subsurface CO2 storage feasibility/performance evaluation in the recently completed EU-funded research project CASTOR. The Puchkirchen Formation forms the main gas reservoir, containing an estimated gas-in-place (GIP) of 4,353 million sm3. The gas reservoir is overlain by an approximately 500 m thick mudstone sequence, which forms the primary immediate seal for the potential storage site. Gas production at Aztbach-Schwanenstadt gas field, operated by Rohöl-Aufsuchungs AG (RAG), started in 1963 and is still on-going. By the end of 2006, over 84% of the GIP (3,666 million sm3) has been recovered. The reservoir pressure dropped to below 20 bars in parts of the gas field, from an initial pressure of approximately 160 bars at a depth of ~1,600 m from the ground surface.
The nearly depleted Atzbach-Schwanenstadt gas reservoir has been proposed as a potential storage site by the site operator
RAG, who has identified two potential CO2 emission sources in the region, a paper mill and a fertilizer plant which generate an aggregate of about 300,000 metric tons of CO2 per year. In addition to the site operator, the research partners consisted of SINTEF Petroleum Research (SINTEF-PR), Natural Environment Research Council-British Geological Survey (BGS), Bundesanstalt für Geowissenschaften und Rohstoffe (BGR), Imperial College London and the Istituto Nazionale di Oceanografia
c© 2009 Elsevier Ltd.
Energy Procedia 1 (2009) 3039–3046www.elsevier.com/locate/procedia
doi:10.1016/j.egypro.2009.02.082
Open access under CC BY-NC-ND license.
Ji-Quan Shi, Sevket Durucan / Energy Procedia 00 (2008) 000–000
e di Geofisica Sperimentale (OGS). An integrated research programme, which was planned for the CO2 storage feasibility/performance assessment of the gas field, included:
1. Construction of a digital geological model of the gas field and building a detailed reservoir model 2. Calibration of the reservoir model by history matching the historical gas production and pressure data 3. Simulation of CO2 injection scenarios, focusing on storage and/or possible enhanced gas recovery 4. Laboratory mechanical testing of reservoir and caprock samples 5. Coupled geomechanical simulations to assess the geomechanical impact of CO2 injection scenarios as well as historical
and current gas production on the caprock and reservoir rocks 6. Laboratory tests on caprock (shale) CO2 breakthrough pressure and diffusivity 7. Laboratory geochemical tests on the reaction of CO2 with the host fluids and rocks 8. Investigation of the sensitivity of seismic monitoring techniques to potential CO2 leakage through the caprock 9. Design and implementation of a field soil gas monitoring programme to establish baseline data on the surface This paper reports the results of the coupled reservoir-geomechanical modelling work carried out at Imperial College London.
The objectives of the geomechanical modelling effort at Aztbach-Schwanenstadt gas field were: 1) evaluation of the hydro-mechanical response of the reservoir rock and overburden formations to historical and current gas production rates, different CO2 injection scenarios and its long-term storage; and 2) assessment of the potential for shear failure and/or re-activation of pre-existing faults as a result of changes in the reservoir pressure due to natural gas production and CO2 injection.
2. The geological model of the gas field and the reservoir model developed
As an integral part of the work programme, SINTEF-PR, together with the gas field operator RAG, developed a digital geological model of the gas field [1] and a reservoir model for performance assessment of CO2 injection and storage in the (nearly) depleted gas reservoir [2]. A brief summary of some of the key features of the two models is presented below.
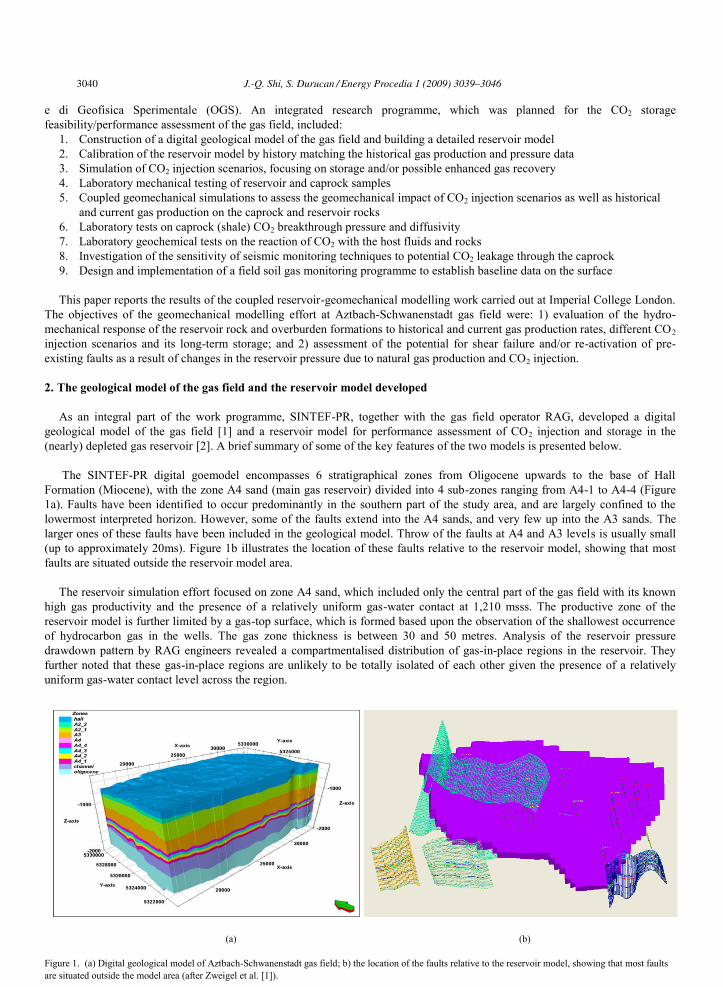
The SINTEF-PR digital goemodel encompasses 6 stratigraphical zones from Oligocene upwards to the base of Hall
Formation (Miocene), with the zone A4 sand (main gas reservoir) divided into 4 sub-zones ranging from A4-1 to A4-4 (Figure 1a). Faults have been identified to occur predominantly in the southern part of the study area, and are largely confined to the lowermost interpreted horizon. However, some of the faults extend into the A4 sands, and very few up into the A3 sands. The larger ones of these faults have been included in the geological model. Throw of the faults at A4 and A3 levels is usually small (up to approximately 20ms). Figure 1b illustrates the location of these faults relative to the reservoir model, showing that most faults are situated outside the reservoir model area.
The reservoir simulation effort focused on zone A4 sand, which included only the central part of the gas field with its known
high gas productivity and the presence of a relatively uniform gas-water contact at 1,210 msss. The productive zone of the reservoir model is further limited by a gas-top surface, which is formed based upon the observation of the shallowest occurrence of hydrocarbon gas in the wells. The gas zone thickness is between 30 and 50 metres. Analysis of the reservoir pressure drawdown pattern by RAG engineers revealed a compartmentalised distribution of gas-in-place regions in the reservoir. They further noted that these gas-in-place regions are unlikely to be totally isolated of each other given the presence of a relatively uniform gas-water contact level across the region.
(a) (b)
Figure 1. (a) Digital geological model of Aztbach-Schwanenstadt gas field; b) the location of the faults relative to the reservoir model, showing that most faults are situated outside the model area (after Zweigel et al. [1]).
3040 J.-Q. Shi, S. Durucan / Energy Procedia 1 (2009) 3039–3046

Ji-Quan Shi, Sevket Durucan / Energy Procedia 00 (2008) 000–000
Covering an area of 12 km x 7.5 km, the SINTEF-PR reservoir model has a total of 876,000 (120 x 73 x 100) grid blocks, with just over 400,000 active cells. The average gridblock size is 100m x 108m x 1.9m. The transport properties of the reservoir model (porosity, horizontal and vertical permeabilities) are upscaled from the geomodel using the arithmetic, geometric and harmonic mean respectively. The upscaled porosity of the favourable sandstone layers is in the range 0.01 to 0.2, with the permeabilities ranging from 0.01 to 200 mD (1mD = 10-15m2). Although faults are included in the reservoir model, their transport properties were not modelled explicitly.
There are a total of 28 production wells in the reservoir model. There has been very little production of water from the gas
reservoir, indicating that the water is largely immobile in the gas zone. The residual (connate) water is found to be around 15%. Analysis of the reservoir pressure drawdown with respect to cumulative gas production suggests that there is no aquifer support to the pressure.
3. Construction of a geomechanical model based on the SINTEF-PR reservoir model
The STINTEF reservoir model was initially built in Eclipse 100, a blackoil reservoir simulator. In a blackoil reservoir model, CO2 injection may be simulated by assigning the relevant CO2 properties to the built-in oil phase, assuming that this is an immiscible process. In order to better handle the CO2 injection process, especially the EGR aspect, a more sophisticated 8-component (N2, CO2, C1, C2, C3, iC4, C3, iC5) compositional model was later constructed and history-matched towards the end of the project [2]. The coupled reservoir modelling work reported in this paper was carried out based upon the earlier blackoil model, in parallel to the reservoir model upgrading work carried out at SINTEF-PR.
3.1. A coarser reservoir model for coupled geomechanical simulation
The compositional simulator Eclipse 300 was used for coupled geomechanical modelling. The simulator features a geomechanics module and uses the same reservoir grid for deformation and stress calculations. In the current version, the number of grid blocks that can be accommodated in coupled simulations is fairly limited compared to normal reservoir simulations. In this study, a much coarser grid (48 x 29 x 40) than that of the SINTEF-PR reservoir model (120 x 73 x 100) was used for coupled geomechanical simulations, representing an up-scaling factor of 2.5 in all the three dimensions. Unlike the SINTEF-PR reservoir model, the upscaled geomechanical model includes both the regions below the gas-water contact level and above the top gas surface as part of the active grid for the stress calculations. The gridblocks in these regions are however assigned a very low nominal permeability (10-10 mD) to make them effectively inactive during flow computations. In addition, a porosity cut-off of 0.002 was applied to the model to ensure computational convergence. During coupled geomechanical simulations, the porosity at each gridblock is updated by = -(1- ) v, where v is the change in volumetric strain.
The flow performance of the scaled-up model was compared with that of the fine-gridded reservoir model. The simulated gas
productions from the 28 wells are compared fairly well - the total gas production of 3,230.49 million m3 was lightly (3.4%) lower than that of the fine-gridded model (3,343.67 million m3). Simulated pressure drawdown in the coarser model was over-predicted (by ~14 bars) in one of the fluid in place (FIP) sub-regions (rightmost), but under-predicted (by up to 20 bars) in the other two FIP sub-regions. The SINTEF-PR model has been calibrated by local fine-tuning of the reservoir parameters (permeability and porosity). In the coupled geomechanical model no explicit effort was made to history-match the field pressure data.
(a) (b)
Figure 2. (a) Well cumulative gas production: 250m grid vs.100m grid; (b) simulated distribution of reservoir pressure at the end of August 2004.
0
50
100
150
200
250
300
350
400
450
500
Cum
ulat
ive
gas
prod
uctio
n (s
td. 1
06m
3 )
Production well
250m grid
100m grid
J.-Q. Shi, S. Durucan / Energy Procedia 1 (2009) 3039–3046 3041
Ji-Quan Shi, Sevket Durucan / Energy Procedia 00 (2008) 000–000
3.2. Rock mechanical testing of cap rock and gas reservoir sandstone plugs
The geomechanical characterisation of the host and cap rocks at the Atzbach-Schwanenstadt gas reservoir and the assessment of the long term behaviour of the overburden in a CO2 storage scenario required the establishment of the mechanical and elastic properties of these rocks in the laboratory. Of the initial core samples received and tested by partner BGS, it was only possible to carry out a limited number of tests on the overburden rock [3]. The Young’s modulus of the two successfully cored caprock samples (laminated siltstone/mudstone) from uniaxial test was reported to be in the range 5.3 to 7.4 GPa. Higher values (8.75 -15.5 GPa) were obtained for one of the cores in a triaxial test subjected to a confining pressure of 12 MPa.
Following discussions with RAG on the geomechanical data requirements, Imperial College was provided with nine reservoir
rock samples taken from one of the production wells (SCH-022) for geomechanical testing. The cored sandstone plugs were trimmed and prepared for testing. The Uniaxial Compressive Strength (UCS), Young’s modulus and Poisson’s ratio of the reservoir rock were determined using the complete stress-strain curves obtained in the laboratory [4]. Young’s modulus values ranging from 5 to 15 GPa and Poisson’s ratio in the range 0.15 to 0.25 were used in the coupled geomechanical simulations.
3.3. The in situ stress state and boundary conditions
In addition to the elastic properties of the rock formations, which are required as input for each grid block, the initial stress state and stress/displacement boundary conditions are needed to be defined. Müller et al. [5] reviewed nearly 1,500 stress orientation determinations, which came from a variety of sources such as earthquake focal mechanisms, overcoring measurements, well bore breakouts, hydraulic fracturing measurements, and young fault slip studies. Review of the regional stress patterns covering the gas field suggested a strike-slip fault stress regime (where the major principal stress is horizontal and the intermediate principal stress vertical) and that the orientation of maximum horizontal stress was estimated to be roughly N145E, though the magnitudes were not available at the time. In the absence of regional horizontal stress values, an initial hydrostatic stress state was assumed during the coupled geomechanical simulations. The following boundary conditions were assigned to the model domain:
a distributed load of 400 bars (1,600 m overburden with a mean rock density of 2,500 kg/m3) at the top surface; the model boundaries are constrained vertically at the base and laterally in both x and y directions.
4. The analysis of re-activation of pre-existing faults
4.1. Mohr-Coulomb failure criterion
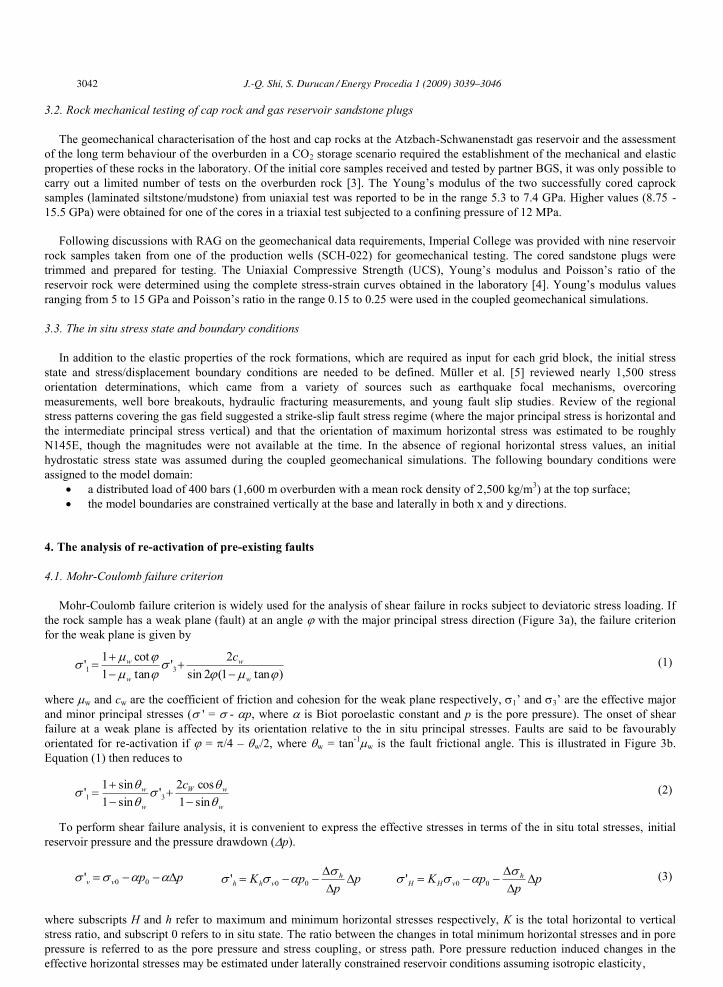
Mohr-Coulomb failure criterion is widely used for the analysis of shear failure in rocks subject to deviatoric stress loading. If the rock sample has a weak plane (fault) at an angle with the major principal stress direction (Figure 3a), the failure criterion for the weak plane is given by
)tan1(2sin
2'tan1cot1' 31
w
w
w
w c (1)
where w and cw are the coefficient of friction and cohesion for the weak plane respectively, 1’ and 3’ are the effective major and minor principal stresses ( ' = - p, where is Biot poroelastic constant and p is the pore pressure). The onset of shear failure at a weak plane is affected by its orientation relative to the in situ principal stresses. Faults are said to be favourably orientated for re-activation if = /4 – w/2, where w = tan-1
w is the fault frictional angle. This is illustrated in Figure 3b. Equation (1) then reduces to
w
wW
w
w csin1cos2'
sin1sin1' 31
(2)
To perform shear failure analysis, it is convenient to express the effective stresses in terms of the in situ total stresses, initial reservoir pressure and the pressure drawdown ( p).
ppvv 00' pp
pK hvhh 00' p
ppK h
vHH 00' (3)
where subscripts H and h refer to maximum and minimum horizontal stresses respectively, K is the total horizontal to vertical stress ratio, and subscript 0 refers to in situ state. The ratio between the changes in total minimum horizontal stresses and in pore pressure is referred to as the pore pressure and stress coupling, or stress path. Pore pressure reduction induced changes in the effective horizontal stresses may be estimated under laterally constrained reservoir conditions assuming isotropic elasticity,
3042 J.-Q. Shi, S. Durucan / Energy Procedia 1 (2009) 3039–3046
Ji-Quan Shi, Sevket Durucan / Energy Procedia 00 (2008) 000–000
)1
1(p
h . (4)
However, large-scale hydrocarbon reservoirs often don’t behave in this manner due to a number of factors including inelastic/plastic behaviour, reservoir heterogeneity and stress arcing in overburden formations [6]. Therefore Equation (4) should be used with caution for predicting the stress path, and whenever possible, the stress path should be measured during field production. To aid interpretation of the field data, a pseudo Poisson’s ratio maybe defined [6]
)1
1(| *
*
fieldh
p (5)
Equations (3) to (5) suggest that increase in the horizontal effective stress would generally be only a fraction of that in the vertical stress following a reduction in the reservoir pressure. This observation has direct implications for shear failure analysis during hydrocarbons production. The knowledge of which stresses are the major and minor principal stress is essential for the assessment of shear failure. Under strike-slip fault stress regime ( H > v > h), the deviatoric stresses acting on the reservoir is largely maintained, until 'H is overtaken by 'v, with reservoir pressure depletion. On the other hand, there tends to be an immediate increase in the deviatoric stresses under the normal fault stress regime ( v > H > h).
(a)
1
33
1 (b) 3 1
1
1.1
1.2
1.3
1.4
1.5
1.6
0.7 0.75 0.8 0.85 0.9
Kh
KH
= 25o
= 20o
Figure 3. (a) Fault plane orientation with respect to the principal stress directions; Figure 4. Estimated maximum KH as a function of Kh for pm = (b) Mohr’ circle corresponding to a critical stress state in - space. 40 bars ( = 1 and = 0.2).
4.2. Maximum sustainable pore pressure increase – reversible stress path
During CO2 injection into a depleted hydrocarbon reservoir the initial stress state would be recovered as the reservoir pressure is brought back to its initial value provided that the stress path is reversible during CO2 injection. Further increase in the reservoir pressure would generally result in an increase in the deviatoric stresses as well as a general reduction in the effective minor stress, thus leading to an increasing risk of shear failure under the strike-slip fault stress region. This leads to the concept of maximum sustainable pore pressure (for safe CO2 storage), above which rock shear failure or fault re-activation might occur [7].
The maximum sustainable pore pressure increase (over the initial reservoir pressure) under strike-slip fault regime may be
obtained by substituting Equation (3) into Equation (2) to yield
*
*00
1)1(
)1()(
vvA
BpAKAKp vHhm
(6)
where A and B are respectively given by the friction term (without 'm) and the cohesion term at the right hand side of equation (2). Note that, for strike-slip fault stress regime, the effective vertical and minimum horizontal stresses may cross the path as the pore pressure is increased. Equation (6) can also be applied to CO2 storage in saline aquifers, in which case the measured stress path for reservoir over-pressurisation should be used.
Equation (6) maybe used to study the sensitivity of pm to the various parameters. For example pmvaries more strongly with
Kh than KH in a linear manner. Alternatively, the equation can be used to find an upper bound for KH for an estimated Kh, which would allow the reservoir to be over-pressurised safely by pm without compromising the reservoir and existing fault integrity. An example is given in Figure 4, where it is assumed that there is a cohesionless fault, which is orientated in a favourable angle
J.-Q. Shi, S. Durucan / Energy Procedia 1 (2009) 3039–3046 3043
Ji-Quan Shi, Sevket Durucan / Energy Procedia 00 (2008) 000–000
for shear failure. The estimated maximum KH is plotted as a function of Kh for pm = 40 bars for two scenarios with two frictional angles (20o and 25o).
4.3. Stress path hysteresis
There is field evidence that the stress path may not be reversible during re-pressurisation of a partially depleted hydrocarbon reservoir [6]. In a similar fashion to Equation (5), a pseudo Poisson’s ratio during CO2 injection maybe defined as
)1
1(| *
*
inj
injfield
inj
hinj
p (7)
Note that inj and pinj are with respect to the reservoir state at the start of CO2 injection. Accordingly, during CO2 injection following a reservoir drawdown of ppro, Equation (3) becomes
)(' 00 injprovv ppp
)11
(' *
*
*
*
00 injinj
injprovhh p
vvp
vvpK )
11(' *
*
*
*
00 injinj
injprovHH p
vvp
vvpK (8)
Substituting the two stress equations representing the major and minor principal stresses into Equation (2), an estimation of the maximum allowable reservoir pressure recovery pinj maybe obtained.
5. Coupled reservoir-geomechanical simulation results
In Eclipse 300, the coupled geomechanical model can be run in two modes: full coupling, where deformation and stress calculations are performed at each time step to maintain accuracy, or partial coupling, where stresses are updated at each report step only to speed up the computation. In this study, the latter approach was adopted as the induced deformation at the sandstone reservoir was expected to be small. The coupled geomechanical simulation was carried out in two phases: gas production phase and CO2 injection/storage phase.
5.1. Gas production
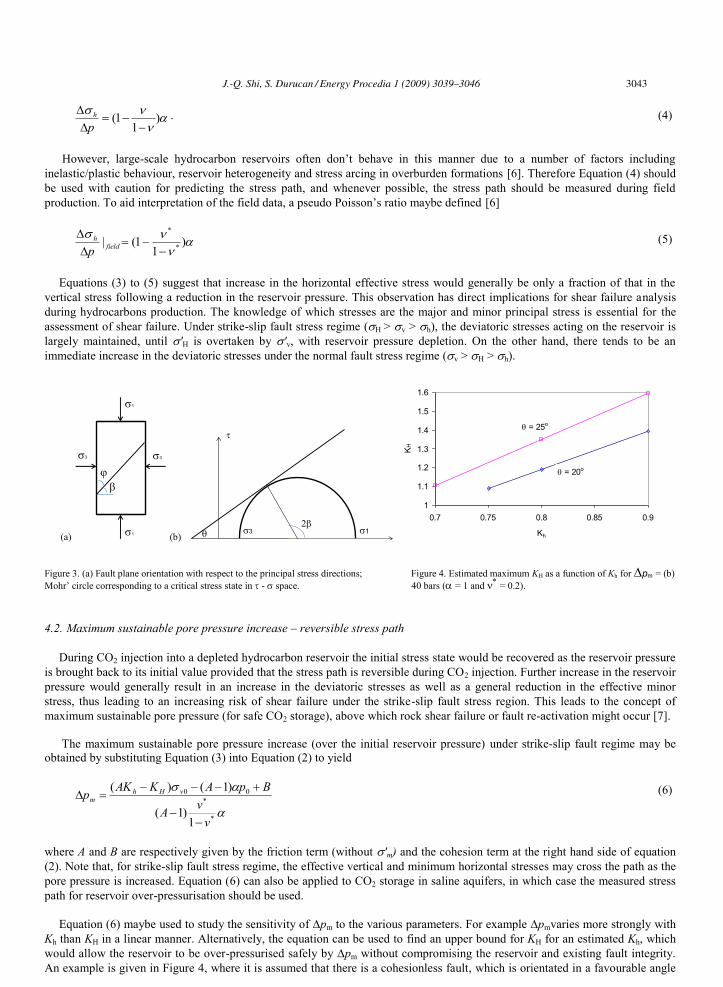
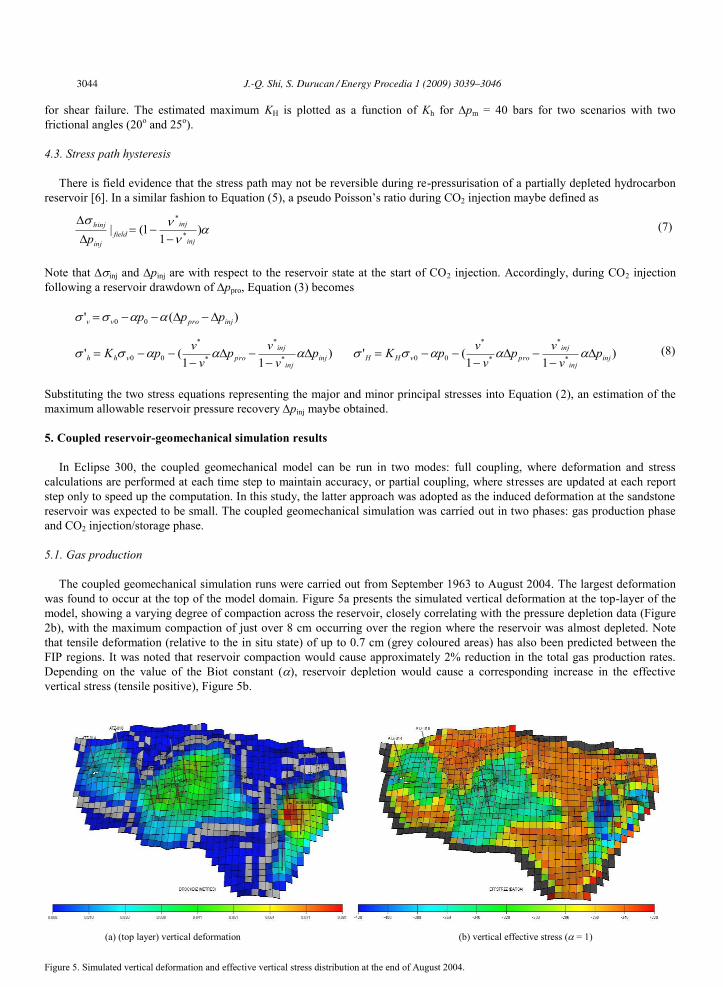
The coupled geomechanical simulation runs were carried out from September 1963 to August 2004. The largest deformation was found to occur at the top of the model domain. Figure 5a presents the simulated vertical deformation at the top-layer of the model, showing a varying degree of compaction across the reservoir, closely correlating with the pressure depletion data (Figure 2b), with the maximum compaction of just over 8 cm occurring over the region where the reservoir was almost depleted. Note that tensile deformation (relative to the in situ state) of up to 0.7 cm (grey coloured areas) has also been predicted between the FIP regions. It was noted that reservoir compaction would cause approximately 2% reduction in the total gas production rates. Depending on the value of the Biot constant ( , reservoir depletion would cause a corresponding increase in the effective vertical stress (tensile positive), Figure 5b.
(a) (top layer) vertical deformation (b) vertical effective stress ( = 1)
Figure 5. Simulated vertical deformation and effective vertical stress distribution at the end of August 2004.
3044 J.-Q. Shi, S. Durucan / Energy Procedia 1 (2009) 3039–3046
Ji-Quan Shi, Sevket Durucan / Energy Procedia 00 (2008) 000–000
5.2. CO2 storage
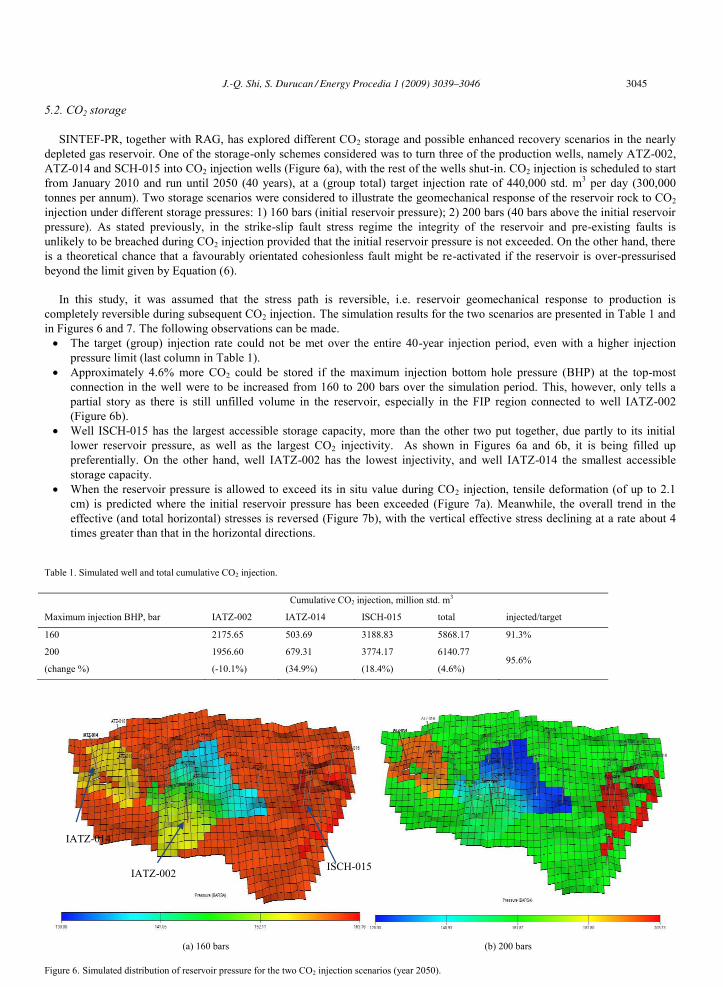
SINTEF-PR, together with RAG, has explored different CO2 storage and possible enhanced recovery scenarios in the nearly depleted gas reservoir. One of the storage-only schemes considered was to turn three of the production wells, namely ATZ-002, ATZ-014 and SCH-015 into CO2 injection wells (Figure 6a), with the rest of the wells shut-in. CO2 injection is scheduled to start from January 2010 and run until 2050 (40 years), at a (group total) target injection rate of 440,000 std. m3 per day (300,000 tonnes per annum). Two storage scenarios were considered to illustrate the geomechanical response of the reservoir rock to CO2 injection under different storage pressures: 1) 160 bars (initial reservoir pressure); 2) 200 bars (40 bars above the initial reservoir pressure). As stated previously, in the strike-slip fault stress regime the integrity of the reservoir and pre-existing faults is unlikely to be breached during CO2 injection provided that the initial reservoir pressure is not exceeded. On the other hand, there is a theoretical chance that a favourably orientated cohesionless fault might be re-activated if the reservoir is over-pressurised beyond the limit given by Equation (6).
In this study, it was assumed that the stress path is reversible, i.e. reservoir geomechanical response to production is
completely reversible during subsequent CO2 injection. The simulation results for the two scenarios are presented in Table 1 and in Figures 6 and 7. The following observations can be made.
The target (group) injection rate could not be met over the entire 40-year injection period, even with a higher injection pressure limit (last column in Table 1).
Approximately 4.6% more CO2 could be stored if the maximum injection bottom hole pressure (BHP) at the top-most connection in the well were to be increased from 160 to 200 bars over the simulation period. This, however, only tells a partial story as there is still unfilled volume in the reservoir, especially in the FIP region connected to well IATZ-002 (Figure 6b).
Well ISCH-015 has the largest accessible storage capacity, more than the other two put together, due partly to its initial lower reservoir pressure, as well as the largest CO2 injectivity. As shown in Figures 6a and 6b, it is being filled up preferentially. On the other hand, well IATZ-002 has the lowest injectivity, and well IATZ-014 the smallest accessible storage capacity.
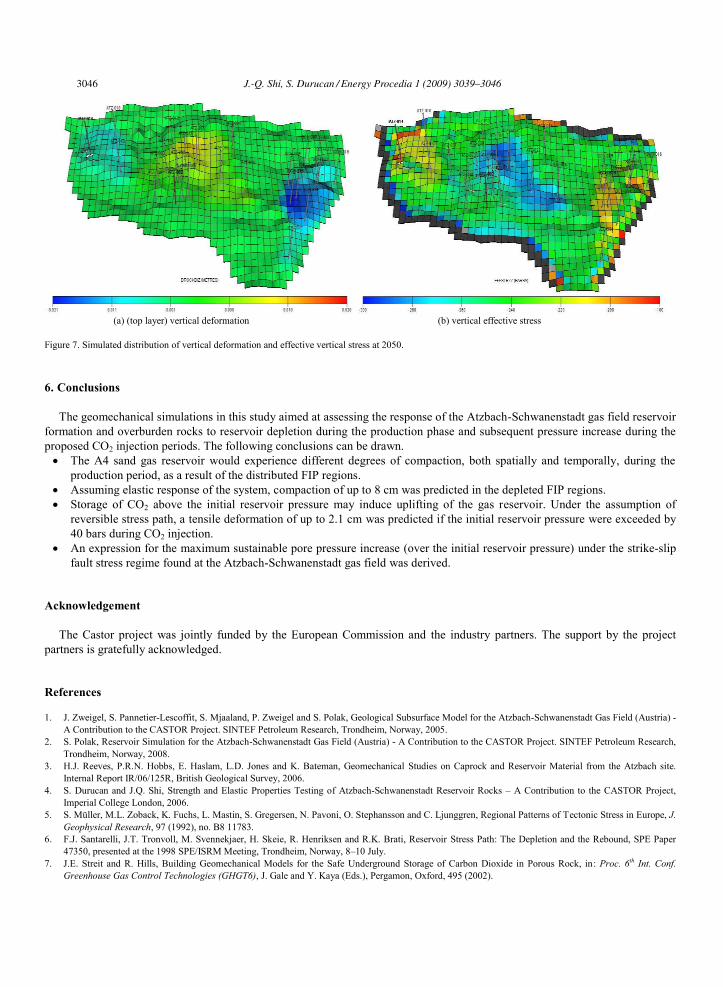
When the reservoir pressure is allowed to exceed its in situ value during CO2 injection, tensile deformation (of up to 2.1 cm) is predicted where the initial reservoir pressure has been exceeded (Figure 7a). Meanwhile, the overall trend in the effective (and total horizontal) stresses is reversed (Figure 7b), with the vertical effective stress declining at a rate about 4 times greater than that in the horizontal directions.
Table 1. Simulated well and total cumulative CO2 injection.
Cumulative CO2 injection, million std. m3
Maximum injection BHP, bar IATZ-002 IATZ-014 ISCH-015 total injected/target
160 2175.65 503.69 3188.83 5868.17 91.3%
200
(change %)
1956.60
(-10.1%)
679.31
(34.9%)
3774.17
(18.4%)
6140.77
(4.6%) 95.6%
(a) 160 bars (b) 200 bars
Figure 6. Simulated distribution of reservoir pressure for the two CO2 injection scenarios (year 2050).
IATZ-014
IATZ-002 ISCH-015
J.-Q. Shi, S. Durucan / Energy Procedia 1 (2009) 3039–3046 3045
Ji-Quan Shi, Sevket Durucan / Energy Procedia 00 (2008) 000–000
(a) (top layer) vertical deformation (b) vertical effective stress
Figure 7. Simulated distribution of vertical deformation and effective vertical stress at 2050.
6. Conclusions
The geomechanical simulations in this study aimed at assessing the response of the Atzbach-Schwanenstadt gas field reservoir formation and overburden rocks to reservoir depletion during the production phase and subsequent pressure increase during the proposed CO2 injection periods. The following conclusions can be drawn.
The A4 sand gas reservoir would experience different degrees of compaction, both spatially and temporally, during the production period, as a result of the distributed FIP regions.
Assuming elastic response of the system, compaction of up to 8 cm was predicted in the depleted FIP regions. Storage of CO2 above the initial reservoir pressure may induce uplifting of the gas reservoir. Under the assumption of
reversible stress path, a tensile deformation of up to 2.1 cm was predicted if the initial reservoir pressure were exceeded by 40 bars during CO2 injection.
An expression for the maximum sustainable pore pressure increase (over the initial reservoir pressure) under the strike-slip fault stress regime found at the Atzbach-Schwanenstadt gas field was derived.
Acknowledgement
The Castor project was jointly funded by the European Commission and the industry partners. The support by the project partners is gratefully acknowledged.
References
1. J. Zweigel, S. Pannetier-Lescoffit, S. Mjaaland, P. Zweigel and S. Polak, Geological Subsurface Model for the Atzbach-Schwanenstadt Gas Field (Austria) - A Contribution to the CASTOR Project. SINTEF Petroleum Research, Trondheim, Norway, 2005.
2. S. Polak, Reservoir Simulation for the Atzbach-Schwanenstadt Gas Field (Austria) - A Contribution to the CASTOR Project. SINTEF Petroleum Research, Trondheim, Norway, 2008.
3. H.J. Reeves, P.R.N. Hobbs, E. Haslam, L.D. Jones and K. Bateman, Geomechanical Studies on Caprock and Reservoir Material from the Atzbach site. Internal Report IR/06/125R, British Geological Survey, 2006.
4. S. Durucan and J.Q. Shi, Strength and Elastic Properties Testing of Atzbach-Schwanenstadt Reservoir Rocks – A Contribution to the CASTOR Project, Imperial College London, 2006.
5. S. Müller, M.L. Zoback, K. Fuchs, L. Mastin, S. Gregersen, N. Pavoni, O. Stephansson and C. Ljunggren, Regional Patterns of Tectonic Stress in Europe, J. Geophysical Research, 97 (1992), no. B8 11783.
6. F.J. Santarelli, J.T. Tronvoll, M. Svennekjaer, H. Skeie, R. Henriksen and R.K. Brati, Reservoir Stress Path: The Depletion and the Rebound, SPE Paper 47350, presented at the 1998 SPE/ISRM Meeting, Trondheim, Norway, 8–10 July.
7. J.E. Streit and R. Hills, Building Geomechanical Models for the Safe Underground Storage of Carbon Dioxide in Porous Rock, in: Proc. 6th Int. Conf. Greenhouse Gas Control Technologies (GHGT6), J. Gale and Y. Kaya (Eds.), Pergamon, Oxford, 495 (2002).
3046 J.-Q. Shi, S. Durucan / Energy Procedia 1 (2009) 3039–3046