Embed Size (px)
Citation preview

International Tax and Public Finance, 7, 63–82 (2000)c© 2000 Kluwer Academic Publishers, Boston. Manufactured in The Netherlands.
A Cost-Benefit Analysis of the ThailandTaxpayer Survey
NIPON POAPONGSAKORN [email protected] of Economics, Thammasat University, Bangkok
KOVIT CHARNVITAYAPONG [email protected] of Economics, Thammasat University, Bangkok
DUANGMANEE LAOVAKUL [email protected] of Economics, Thammasat University, Bangkok
SOMCHAI SUKSIRISEREKUL [email protected] of Economics, Thammasat University, Bangkok
BEV DAHLBY [email protected] of Economics, University of Alberta, Edmonton
Abstract
We investigate whether more resources should be devoted to a Thai tax enforcement program which is aimedat bringing small businesses into the tax system. We show that the appropriate criteria for determining whethermore resources should be devoted to tax enforcement is whether the Atkinson–Stern condition for the optimalprovision of a publicly-provided good is satisfied, or equivalently, whether the marginal cost of finds obtainedthrough additional tax enforcement,SMCFp, is less than the marginal cost of funds obtained through raising taxrates,SMCFt . In our base case scenario, theSMCFp is 11.60 which exceeds our estimate of theSMCFt for anacross-the-board increase in income tax rates on wage earners. The use of pro-poor distributional weights makesexpanding the survey less attractive if the alternative way of obtaining additional tax revenue is an across-the-boardincome tax rate increase, while aversion to tax evasion makes it more attractive.
Keywords: tax enforcement, tax evasion, cost-benefit analysis, marginal cost of public funds
JEL Code: H26, H43
1. Introduction
The economics of tax enforcement has received relatively little attention from public financeeconomists, and “how much revenue a country should allocate to the administration of taxesremains a largely unexplored subject.” (Tanzi and Shome (1993, p. 814)). A number ofeconomists have developed theoretical models of tax enforcement, but with the exceptionof Fortin and Lacroix (1994) there have been no empirical studies concerning optimal taxenforcement.1
We were asked by the Internal Revenue Department of the Kingdom of Thailand in 1994to prepare a cost-benefit study of their taxpayer survey. The taxpayer survey is an on-going program which since 1982 has attempted to bring small businesses into the Thai

64 POAPONGSAKORN
tax system. In 1993, 1,019 man-years were devoted to the survey, 377,674 firms werecontacted, and 45,488 firms were added to the total number registered with the InternalRevenue Department. The tax survey does not audit the firms’ tax payments. Rather,its goal is to update information on existing taxpaying firms and to contact firms whichare not currently registered with the Internal Revenue Department, in order to get themto start paying corporate and personal income tax and VAT. The target group for the taxsurvey is the small business sector in Thailand. Large established businesses, such as banksand hotels, and farmers are excluded. Given the considerable resources (approximately6.7 percent of the Internal Revenue Department’s total manpower is devoted to the survey)and the widespread feeling that there are large numbers of small businesses in Thailandwhich operate outside the tax system, it is natural to ask whether more resources, or fewerresources, should be devoted to the taxpayer survey.
This paper contributes to the literature by showing how a tax enforcement program canbe evaluated in a cost-benefit framework. We show that the criterion for devoting moreresources to tax enforcement is equivalent to the Atkinson and Stern (1974) condition foroptimal public expenditures financed by distortionary taxation and that the key componentsin the cost-benefit criterion are the social marginal cost of public funds obtained by increas-ing tax rates,SMCFt , the marginal revenue and marginal cost from increasing the size ofthe survey, and the social marginal loss inflicted on the owners of small businesses as aresult of expanding the survey. We show how these components can be measured from thedata on the 1993 survey and other “inputs” such as the social marginal cost of public funds,the degree of risk aversion displayed by the owners of small businesses, and distributionalweights which are used to evaluate the gains and losses by the various groups in the Thaieconomy. We also calculate the social marginal cost of funds obtained by devoting moreresources to the survey,SMCFp. As Fortin and Lacroix (1994) showed, more resourcesshould be devoted to tax enforcement if theSMCFp is less thanSMCFt .
We find that the revenue generated by taxpayer survey exceeds its administration cost, butwe do not think that this justifies its existence or expansion. We find that the social marginalloss to the small business sector—tax payments and compliance costs—may exceed theincrease in net revenues from expanding the survey because the amount of tax collectedfrom each firm and their “survival” rates in the tax system are relatively low. With thebase case survival rates, theSMCFp is 11.60, and possibly as high as 23.00 if risk aversionis relatively low. Thus the shadow price of tax revenue to the Thai government must bevery high in order to justify the expansion of the survey under the base case survival rates.However, if the survival rates of small businesses are similar to those observed in NorthAmerica, then theSMCFp ranges between 1.40 and 2.77.
Increased tax enforcement will almost certainly make some people worse off (the taxevaders) while making other individuals better off because the government can lower taxrates or increase spending. Therefore it is important to make explicit the social preferencesfor vertical equity and aversion to tax evasion that are used to evaluate the survey. Wefind that the net social gain from expanding the survey is lower when more emphasis isplaced on vertical equity if the additional net revenue from the survey is used to finance anacross-the-board cut in the marginal tax rates on wage earners under the personal incometax. On the other hand, aversion to tax evasion, which takes the form of lower distributional
A COST-BENEFIT ANALYSIS 65
weights for tax evaders, makes the expansion of the survey more attractive. We calculatethe aversion to tax evasion that is required to justify expanding the survey.
The outline of the paper is as follows. In section 2, we derive the cost-benefit criterionfor evaluating the taxpayer survey. Section 3 describes the taxpayer survey. The keycomponents of the cost-benefit criterion are calculated in Section 4. The final sectioncontains our conclusions.
2. A Cost-Benefit Criterion for Evaluating the Taxpayer Survey
The cost-benefit criterion can be described using a simplified version of our model. Supposethere are two groups of individuals in a society—the owners of small businesses who arecurrently evading taxes, but who can be identified through the survey, and other individualswho are currently paying taxes. The evaders are contacted through the survey with prob-ability p, in which case they incur some compliance costs and have to pay tax at the ratet . If they are not contacted by the survey, they do not pay tax or incur the compliance cost.The expected utility of the tax evaders will be represented as the functionW(t, p) whichis decreasing in the tax rate,Wt < 0, and the probability of being contacted by the survey,Wp < 0. The expected utility of the individuals who are currently paying tax is representedby V(t, p) whereVt < 0. It is assumed the existing taxpayers who are contacted by thesurvey will also incur some compliance costs and thereforeVp < 0. Policy decisions arebased on the social welfare function,S(V(t, p),W(t, p)) whereS1 > 0 andS2 ≥ 0. It isassumed that an increase in the well-being of the regular taxpayers always increases socialwelfare. An increase in the well-being of the tax evaders may, or may not, have a positivesocial value because they achieve their well-being as a result of an illegal activity—taxevasion. It is assumed that the social welfare preferences are not vindictive, i.e.S2 < 0.The change in social welfare from the changes int and p is:
dS= S1Vtdt + S1Vpdp+ S2Wtdt + S2Wpdp (1)
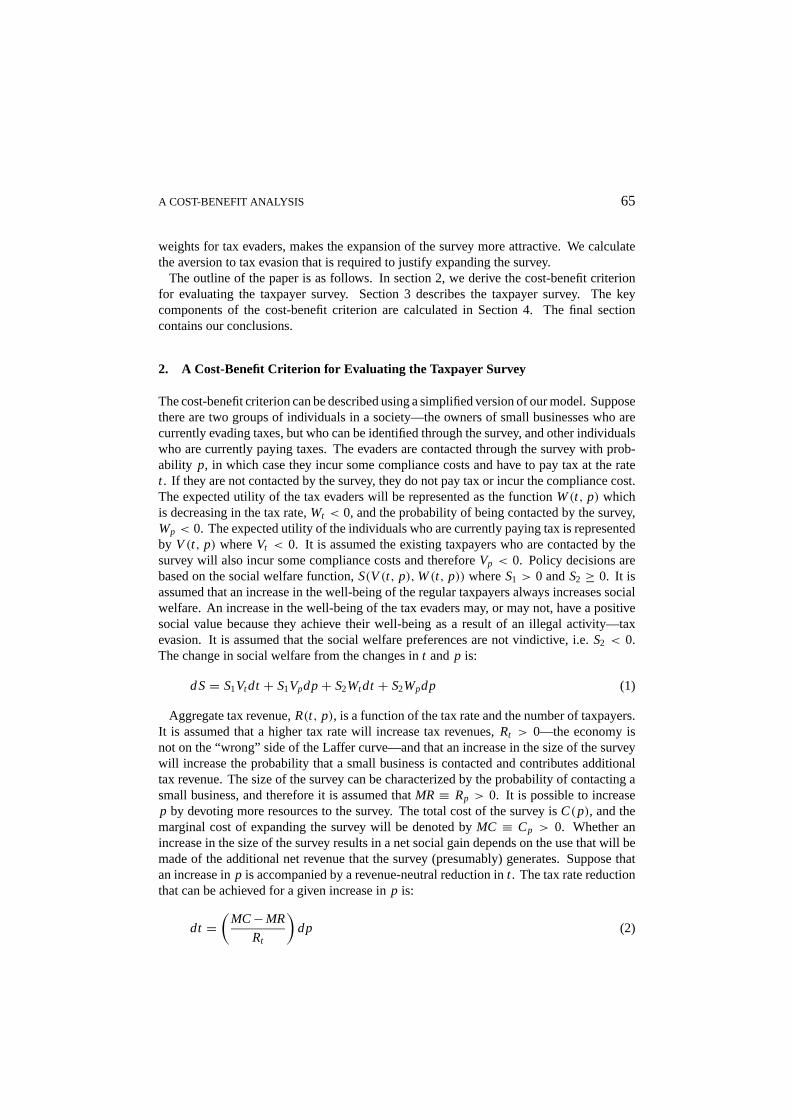
Aggregate tax revenue,R(t, p), is a function of the tax rate and the number of taxpayers.It is assumed that a higher tax rate will increase tax revenues,Rt > 0—the economy isnot on the “wrong” side of the Laffer curve—and that an increase in the size of the surveywill increase the probability that a small business is contacted and contributes additionaltax revenue. The size of the survey can be characterized by the probability of contacting asmall business, and therefore it is assumed thatMR ≡ Rp > 0. It is possible to increasep by devoting more resources to the survey. The total cost of the survey isC(p), and themarginal cost of expanding the survey will be denoted byMC ≡ Cp > 0. Whether anincrease in the size of the survey results in a net social gain depends on the use that will bemade of the additional net revenue that the survey (presumably) generates. Suppose thatan increase inp is accompanied by a revenue-neutral reduction int . The tax rate reductionthat can be achieved for a given increase inp is:
dt =(
MC−MR
Rt
)dp (2)

66 POAPONGSAKORN
Substituting the expression fordt in (2) into (1), we obtain:
dS=[(S1Vt + S2Wt )
(MC−MR
Rt
)+ S1Vp + S2Wp
]dp (3)
A revenue neutral increase in the size of the survey is worthwhile if the expression thesquare brackets is positive.
In using this criteria to evaluate whether more resources should be devoted to a taxenforcement measure, it is important to note that a government can obtain additional taxrevenues by increasing tax rates or by devoting more resources to tax enforcement. Bothmethods of raising revenues are costly. Increasing tax rates imposes an additional directburden on taxpayers, which has a social valuation ofSMLt ≡ −(S1Vt + S2Wt ), and anindirect cost through the distortion of economic decisions. Increased tax enforcementimposes an additional direct burden on tax evaders (and possibly on taxpayers throughadditional compliance costs), which has social valuation ofSMLp ≡ −(St Vp+ S2Wp), andan indirect cost because more resources are diverted from productive uses. The social costsof raising an additional unit of tax revenue (also referred to as the social marginal cost ofpublic funds,SMCF) which is obtained either through a tax rate increase or increased taxenforcement can be defined as:2
SMCFt = −(S1Vt + S2Wt )
Rt(4)
SMCFp = −(S1Vp + S2Wp)
MR−MC(5)
Substituting these definitions in (3), an increase in the size of the survey is desirable if:
N SG= SMCFt ·(MR−MC)− SMLp > 0 (6)
In other words, the net social gain,NSG, from increasing the size of the survey is positiveif the increase in net revenue,MR−MC, valued at the social marginal cost of public funds,SMCFt , is greater than the social marginal loss caused by increased tax enforcement,SMLp.
The condition for optimal tax enforcement in (6) has previously been derived by Sandmo(1981), Slemrod and Yitzhaki (1987), Kaplow (1990) and Yamada (1990) although theseauthors did not explicitly identify the components of the NSG in this manner.3 Equation (6)is equivalent to the Atkinson and Stern (1974) condition for the optimal public expenditureswith distortionary taxation.4 If S2 is positive, anecessarycondition for an increase inp toimprove social welfare isMR > MC. If net revenue were maximized by expanding thesurvey untilMR = MC, then too many resources would be devoted to the survey ifS2 ispositive. However, if the well-being of the tax evaders has no weight in social decision-making (S2 = 0) because tax evaders are engaged in an illegal activity or if theSMCFt isvery high, then more resources should be devoted to the survey ifMR> MC. From (6), itcan also be seen that the net social gain from devoting more resources to tax enforcementis positive if and only ifSMCFt > SMCFp i.e. if the social cost of raising an additionalrevenue through a tax rate increase exceeds the social marginal cost of obtaining more netrevenues through increased enforcement. While there is a considerable literature on the

A COST-BENEFIT ANALYSIS 67
Figure 1. Risk aversion and the tax evaders’ marginal loss.
theory and measurement ofSMCFt , theSMCFp has, with the exception of the Fortin andLacroix (1994) been neglected. One of the goals of this paper is to show how theSMCFp
can be calculated for a tax enforcement program.A key component in the measurement of theSMCFp is the social cost imposed by increased
tax enforcement,SMLp. Below we indicate the approach we use to measure theSMLp. Theexpected utility of tax evaderi is equal to the following:
Wi = (1− p)U (yi )+ pU(yi − τ(yi )) (7)
whereU (·) is a von Neumann–Morganstern utility function,yi is income if the individualis not contacted by the survey, andτ(yi ) is the tax payment and compliance cost imposedon the individual if he is contacted by the survey. The private loss from increasing theprobability of detection,M Li
p, is equal toU (yi ) − U (yi − τ(yi )) and this loss can beapproximated as:
M Lip ≈ U ′(yi − τ(yi ))τ (yi )
[1− 1
2Ai τ(Yi )
](8)
whereAi is individuali ’s coefficient of absolute risk aversion, evaluated at(yi − τ(yi )). Inorder for this approximation to be valid, the expression in square brackets in (8) must bepositive and therefore the degree of risk aversion cannot be “too large” if this approximationis to be used.
Note that theMLip will be smaller the greater the degree of risk aversion displayed by the
owner of the firm. This is illustrated in Figure 1 which compares the marginal losses oftwo individuals with the same incomes, but different degrees of risk aversion. Individual 2is more risk averse than individual 1, and therefore the utility functionU2 is more concavethanU1. By construction,U1(y−τ(y)) = U2(y−τ(y)). Because individual 2 is more riskaverse, he places a lower value on the gain from tax evasion. ThereforeU2(y) < U1(y),

68 POAPONGSAKORN
Table 1.The parameters from the 1993 taxpayer survey in Thailand.
0.262
p
0.738
1− p
Firms that arealready in the taxsystem (84%)
a
315,336
α
889,067
Firms thatcooperate with thesurvey (12%)
b
45,448
β
128,137
Firms that do notcooperate with thesurvey (4%)
c
16,980
γ
47,620
Small Firms Not Included in the Taxpayer Survey
and consequently,ML2p < ML1
p. for taxpayers, the expression forMLip is equivalent to THE
(8) except that theτ(y) is interpreted as compliance cost imposed on the taxpayer whencontacted by the survey.
The final step is to sum the marginal social losses over all the individuals who are affectedby the survey, including taxpayers who incur compliance costs when they are contacted bythe survey:
SMLp =N∑
i=1
ωi τ(yi )
[1− 1
2Ai τ(yi )
](9)
whereωi = Sj U ′(yi − t (yi )) is the distributional weight that is attached to income receivedby individuali andN is the total number of individuals (or businesses) subject to the survey.In general, the social marginal loss will depend on the distributional weights that are usedto evaluate the income changes of the tax evaders and regular taxpayers and on the degreeof risk aversion displayed by the tax evaders and taxpayers.
In the following section, we describe the taxpayer survey, and then in Section 4 we showhow each of the components of the cost-benefit criterion in (6) can be calculated for thetaxpayer survey.
3. The Taxpayer Survey
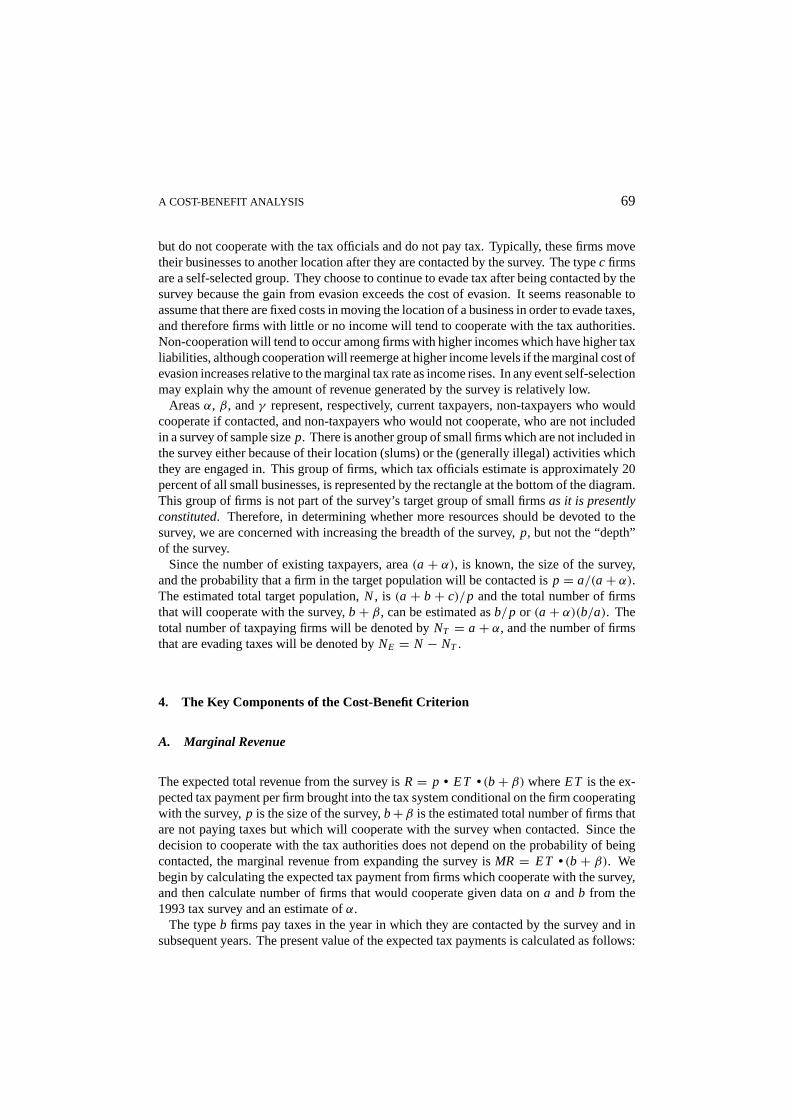
Table 1shows the relationship between the survey and the population of small businesses.It is assumed that the survey represents a random sample drawn from the population ofsmall businesses in Thailand. The total number of businesses contacted through the surveyis (a + b+ c). Areaa represents the number of firms that are already taxpayers. Areabrepresents the number of firms that are contacted by the survey and subsequently cooperatewith the tax officials and pay tax. Areac represents the number of business that are contacted
A COST-BENEFIT ANALYSIS 69
but do not cooperate with the tax officials and do not pay tax. Typically, these firms movetheir businesses to another location after they are contacted by the survey. The typec firmsare a self-selected group. They choose to continue to evade tax after being contacted by thesurvey because the gain from evasion exceeds the cost of evasion. It seems reasonable toassume that there are fixed costs in moving the location of a business in order to evade taxes,and therefore firms with little or no income will tend to cooperate with the tax authorities.Non-cooperation will tend to occur among firms with higher incomes which have higher taxliabilities, although cooperation will reemerge at higher income levels if the marginal cost ofevasion increases relative to the marginal tax rate as income rises. In any event self-selectionmay explain why the amount of revenue generated by the survey is relatively low.
Areasα, β, andγ represent, respectively, current taxpayers, non-taxpayers who wouldcooperate if contacted, and non-taxpayers who would not cooperate, who are not includedin a survey of sample sizep. There is another group of small firms which are not included inthe survey either because of their location (slums) or the (generally illegal) activities whichthey are engaged in. This group of firms, which tax officials estimate is approximately 20percent of all small businesses, is represented by the rectangle at the bottom of the diagram.This group of firms is not part of the survey’s target group of small firmsas it is presentlyconstituted. Therefore, in determining whether more resources should be devoted to thesurvey, we are concerned with increasing the breadth of the survey,p, but not the “depth”of the survey.
Since the number of existing taxpayers, area(a + α), is known, the size of the survey,and the probability that a firm in the target population will be contacted isp = a/(a+ α).The estimated total target population,N, is (a + b+ c)/p and the total number of firmsthat will cooperate with the survey,b+ β, can be estimated asb/p or (a+ α)(b/a). Thetotal number of taxpaying firms will be denoted byNT = a+ α, and the number of firmsthat are evading taxes will be denoted byNE = N − NT .
4. The Key Components of the Cost-Benefit Criterion
A. Marginal Revenue
The expected total revenue from the survey isR= p • ET • (b+ β) whereET is the ex-pected tax payment per firm brought into the tax system conditional on the firm cooperatingwith the survey,p is the size of the survey,b+β is the estimated total number of firms thatare not paying taxes but which will cooperate with the survey when contacted. Since thedecision to cooperate with the tax authorities does not depend on the probability of beingcontacted, the marginal revenue from expanding the survey isMR = ET • (b+ β). Webegin by calculating the expected tax payment from firms which cooperate with the survey,and then calculate number of firms that would cooperate given data ona andb from the1993 tax survey and an estimate ofα.
The typeb firms pay taxes in the year in which they are contacted by the survey and insubsequent years. The present value of the expected tax payments is calculated as follows:

70 POAPONGSAKORN
ET = T0+ P1T1
1+ i+ P2T2
(1+ i )2+ P3T3
(1+ i )3+ · · · (10)
whereTj is the tax paid by the firmj years after being contacted by the tax survey,Pj isthe survival rate (the probability that the firm will pay taxes) in yearj , andi is the discountrate, which was assumed to be 5.0 percent. ThePj s are less than one because the firmsgo out of business or they cease cooperation and stop paying taxes. In estimating theTj s,it was assumed that the firm’s tax payments would increase at 6.0 percent per year in realterms (which was the average rate of growth of real per capita GDP in Thailand over theperiod 1980–1992) for the first 10 years and then by 3.0 percent a year thereafter. Datafrom the Internal Revenue Department indicated that the average tax payment, net of fines,by the typeb firm contacted in 1993 was 827.87 baht ($US 32.72), and this figure was usedin calculating theTj s.5 Although our model is based on the assumption that no fines arelevied, in fact some fines are levied on the typeb firms. In 1993, 54 percent of the typebfirms were fined and the average fine was 655 baht ($US 25.89). The figure forT0 includedthe average expected fine levied in 1993. The implications of these fines for tax evasion isconsider in Section 4.D.
The survival rates of firms were calculated from two sources of information. The firstsource was two random samples of firms contacted for the first time in 1991 and 1992. In1992, only 3,120 (68%) out of the sample of 4,565 firms contacted in 1991 were paying taxes.In 1993, 2,421 (53%) of the firms contacted in 1991 were paying taxes. The percentage ofthe firms that continued to pay taxes in 1993 from the 1992 sample of firms was 72%. Thefollow-up periods for these samples were very short because it was not possible to constructa sample of firms contacted before 1991. On the basis of random samples, it was assumedthat Pj equals(1− δ) j whereδ = 0.28. The survival rates and the resulting calculatedvalues forET are shown in Table 2. Because the samples covered only a short time period,it was decided to check whether the survival rates were consistent with the tax officials’prior beliefs. A questionnaire was sent to the tax collection officials which elicited theiropinions regarding the survival rates of firms which pay corporate income tax and personalincome tax and the average number of years that a firm would continue to pay tax. Theresponses to the two questions generated the “optimistic” and “pessimistic” scenarios forthe survival rates shown in Table 2, and these alternative scenarios are used to test thesensitivity of the calculations to the firms’ survival rates. It is interesting to note that theoptimistic survival rates are similar to those observed in North America.6 Although thereis no reason to suppose that the small business failure rates are the same in North Americaand Thailand, the stylized facts—“failure rates are high and. . . the majority of failuresoccur in the first two to five years” Timmons (1994, p. 11)—are probably the same. Theconsequence of the high failure rates for small businesses is that it diminishes the revenuegenerated from tax enforcement measures.
Of the 377,674 firms contacted by the tax survey in 1993, 315,336 (84%) were alreadypaying taxes, and they were classified as type “a” firms. See Table 1. The number of typebfirms that were contacted and brought into the tax system was 45,448 (12%), and 16,890(4%) firms that were contacted did not cooperate and were classified as typec firms. Thetotal number of taxpaying firms which were not contacted in the 1993 survey was calculatedfrom data supplied by the Internal Revenue Department to be 889,067 firms.

A COST-BENEFIT ANALYSIS 71
Table 2.Calculation of the present value of the expected tax payments.
Projected Survival Rates Based on:
The 1991 and 1992 Tax Officials’ Opinions Tax Officials’ OpinionsRandom Samples of Firms Regarding Firms’ Survival Regarding Firms’ Survival
(Base Case) Rates RatesYear (Optimistic Case) (Pessimistic Case)
1 0.720 0.905 0.662 0.518 0.81 0.333 0.373 0.715 04 0.269 0.62 05 0.193 0.525 06 0.139 0.43 07 0.100 0.335 08 0.072 0.24 09 0.052 0.145 0
10 0.037 0.05 0
ET 3355 baht 5283 baht 2012 baht
The calculation of ET is based on the various survival rates, a discount rate of 5 percent, and theassumption that annual tax payments grow at 6.0 percent for the first 10 years and then 3.0 percentthereafter. The revenue in year 0 is the tax of 827.87 baht and an expected fine of 354 baht.
Given our assumption that the taxpayer survey is a random sample of the target groupof small firms, the estimate ofp for the 1993 taxpayer survey is 0.262, the estimate ofβ
is 128,137 and the estimate ofγ is 47,620. The estimated total number of firms,N, thatpotentially could be included in the taxpayer survey, given its current structure and orga-nization, is 1,442,498. To put these numbers in perspective, the number of self-employedindividuals reported in the 1992 Labor Force Survey of Thailand was 1,726,500.7 The dif-ference between the labor force survey figure and the estimate ofN for the taxpayer surveysuggests that the taxpayer survey, as it is presently constituted, could potentially contactonly 84 percent of all small businesses.8
Combining the estimates ofET with the estimates of(b + β) yields the estimates oftheMR from expanding the size of the taxpayer survey in Table 3. Using the base casesurvival rates, the estimatedMR is 582.451 million baht ($US 23.022 million). With theoptimistic survival rate, theMR is 1.57 times as high as in the base case scenario, and withthe pessimistic survival rate, theMR is 59 percent of the base caseMR.
B. Marginal Cost
In this section, we calculate the marginal cost to the Internal Revenue Department ofexpanding the survey. (The calculation of the compliance costs which the taxpayer surveyimposes on the private sector in included in Section D.) The total cost of a survey isC(p) = (w + v)L(p) whereL(p) is the total number of officials employed in a surveyof size p, w is the wage rate andv is other variable costs per unit of labor employed. Itis assumed that the survey is subject to constant returns to scale so thatp • MC = C(p).

72 POAPONGSAKORN
Table 3. Calculation of the main components of the cost benefit criterion (inmillions of baht).
Base Case Survival Optimistic Survival Pessimistic SurvivalRate Rate Case Rate Case
MR 582.451 917.04 349.18MC 552.935 552.935 552.935MR−MC 29.517 364.106 −203.751
Intermediate Risk Aversion ρ = 1.276
SMLp 342.337 508.471 226.512NSG −311.551 −128.709 −439.025SMCFp 11.60 1.40 na
Moderate Risk Aversion ρ = 0.564
SMLp 679.000 1,008.51 449.27NSG −648.214 −628.752 −661.783SMCFp 23.00 2.77 na
The net social gain was calculated usingSMCFt = 1.043. See Table 6. All theωi ’s = 1.
Therefore the marginal cost of increasing the size of the survey isMC = ((w+v)L(p))/p.In other words,MC can be interpreted as the estimated cost of contacting all firms in thetarget population, and it can be estimated by dividing the total cost of the 1993 taxpayersurvey by the estimated size of the survey.
The labor cost of the 1993 taxpayer survey is composed of salaries, lump-sum payments(which are paid to the tax survey officers at the rate of 50 baht ($US 1.98) for contactingsix firms per day), and fringe benefits. See Table 4. Total labor cost for the 1993 taxpayersurvey has been estimated at 110.461 million baht ($US 4.366 million). Other costs arecomposed of the implicit rental cost of equipment and land, office rental, supervision andadministration, and materials and utilities. Some of these costs had to be estimated on thebasis of total expenditure by the Internal Revenue Department and were allocated to thetaxpayer survey on the basis of the proportion of the Internal Revenue Department’s totalworkforce that is engaged in the taxpayer survey. In total, other costs were 34.3 millionbaht. The total cost of the 1993 taxpayer survey was 144.768 million baht ($US 5.722million), and labor costs were 76 percent of total cost.
Using the estimate ofp derived in Section A, theMC was calculated as 552.935 millionbaht ($US 21.855 million). The marginal net revenue,MR−MC, is also shown in Table 3.Marginal net revenue is positive with the base case and the optimistic case survival ratesand negative in the pessimistic survival rate case. The latter scenario implies that thetaxpayer survey generates less revenue than it costs, and that the taxpayer survey should bescaled back, in fact eliminated, assuming that our assumption of constant returns to scaleis correct and that the social marginal value of income received by the tax evading firms isnon-negative. Whether the taxpayer survey should be expanded given the base case or theoptimistic scenario, depends on theSMCFt and theSMLp which will be computed in thenext two sections.

A COST-BENEFIT ANALYSIS 73
Table 4.The total cost of the 1993 taxpayer survey to theInternal Revenue Department.
Category Millions of baht
Labor costsSalaries 96.304Lump-sum payments 2.717Fringe Benefits 11.440Total 110.461
Other costsRental cost of equipment and land 1.551Office rental 1.132Supervision and administration 6.903Materials and utilities 24.722Total 34.308
Total Cost 144.768
C. TheSMCFt
TheSMCFt was calculated for a reduction in the income tax on wage earners in Thailand.Although we do not know if the Kingdom of Thailand would reduce its income taxes on thisgroup of taxpayers if it received additional revenue from expanding the taxpayer survey,the calculation of theSMCFt for this group provides a useful reference shadow price forrevenue.
The computation of theSMCFt was based on the following formula:9
SMCFt =∑n
j=1ωj gj dtj∑nj=1 gj
[dtj − mj
1−mj(ηc
j dmj + θj dtj )] (11)
where the taxpayersj = 1, . . . ,n are ordered in terms of increasing income,ωj is thedistributional weight that is used in evaluating an increase in income by taxpayerj , gj isj ’s share of total gross income,mj is j ’s marginal tax rate,ηc
j > 0 is the compensated laborsupply elasticity,θj is the marginal propensity to earn income out of non-labor income, anddmj anddtj are the changes inj ’s marginal and average tax rates for the particular taxchange is being evaluated. The numerator is the social loss from a tax increase, and thedenominator is the change in tax revenue which may be affected by changes in the supplyof labor that are induced by the tax rate changes.10 If the tax rate increase results in a directsocial loss of 1 baht, and if tax revenues only increase by 0.50 baht because of a reduction inthe amount of labor supplied, then theSMCFt is 2.00 because the government has to inflicta social loss of 2.00 baht in order to raise 1.00 baht of revenue. The labor supply responsedepends on the income and substitution effects from the tax change. If leisure is a normalgood, thenθj < 0, and the uncompensated labor supply elasticity,ηj = ηc
j + θj , may bepositive or negative. For each taxpayer, there is a substitution effect,ηc
j dmj , which dependson the change in the taxpayer’s marginal tax rate change, and an income effect,θj dtj , whichdepends on the change in the average tax rate. In general,dtj 6= dmj when the marginal

74 POAPONGSAKORN
Table 5.Data used in computing theSMCFt for Thailand.
Distributional Weights
Computed MTR PercentageAverage Taxable Under the of Gross ω1 = 5 ω1 = 20Income Income PIT Income
6,059 0 0.00 0.02 5.000 20.00015,354 0 0.00 0.08 4.124 13.98925,522 0 0.00 0.21 3.711 11.49535,793 0 0.00 0.60 3.461 10.08645,348 0 0.00 1.57 3.294 9.21055,054 0 0.00 4.57 3.165 8.54364,833 1,940 0.05 4.26 3.061 8.02174,735 5,952 0.05 4.12 2.973 7.60885,061 9,569 0.05 3.86 2.898 7.24794,871 14,432 0.05 3.48 2.835 6.957
121,295 25,726 0.05 16.92 2.697 6.344172,535 61,953 0.05 10.68 2.517 5.581242,620 128,536 0.10 13.82 2.352 4.919378,127 260,966 0.10 14.26 2.158 4.194598,759 478,228 0.10 7.18 1.971 3.532859,185 732,965 0.20 3.47 1.847 3.134
1,342,858 1,209,811 0.30 5.29 1.709 2.7102,701,893 2,555,713 0.30 3.59 1.515 2.1674,780,061 4,625,666 0.37 1.24 1.364 1.7856,744,516 6,579,110 0.37 0.44 1.286 1.5978,670,407 8,487,815 0.37 0.17 1.228 1.468
11,887,231 11,745,231 0.37 0.11 1.158 1.31725,279,333 25,104,000 0.37 0.05 1.000 1.000
tax rates under a progressive income tax are changed, and therefore the substitution andincome effects do not have equal “weight” in determining the labor supply response.
From data on 23 groups of taxpayers who received only labor income in 1992, we cal-culated the average income, average deduction, average expense allowance claimed, andaverage taxable income for each group. See Table 5. These calculations indicate that thefirst six income groups do not earn enough to pay personal income tax, and the next fivegroups, earning between 64,833 baht and 172,535 baht, have taxable incomes that put themin the five percent tax rate bracket. The marginal PIT tax rates for the remaining groupwere assigned in a similar fashion. The total marginal tax rate on labor income includesboth MTR under the personal income tax and an implicit MTR of approximately 20 percentfrom the indirect taxes that are levied in Thailand.
Table 5 also shows the percentage shares of gross income for each group. In 1992, 43.32percentage of gross income was earned in the five percent tax bracket, 35.26 percent wasearned in the 10 percent bracket, 3.47 percent was earned in the 20 percent bracket, 8.88percent was earned in the 30 percent bracket, and 2.01 percent was earned in the 37 percentbracket.
The estimates of the labor supply elasticities were based on a study by Poapongsakorn(1979) where theηc
j was estimated to be 0.191 for males and 0.203 for females and theθj

A COST-BENEFIT ANALYSIS 75
was estimated to be−0.232 for males and−0.133 for females. The average of the maleand female labor supply elasticities,ηc
j = 0.20 andθj = −0.18 was used in calculatingthe SMCFt . Note that this implies that the aggregate labor supply curve has a (slight)positive slope. We also calculated theSMCFt usingηc
j = 0.30 andθj = −0.20 in orderto compare the results with the calculations of theSMCFt in North American and otherwestern countries.11
TheSMCFt will depend on which tax rates are changed because this will determine thelabor supply responses and the distributional effects. In the absence of other informationon how tax rates in Thailand would change in response to an increase in tax revenues, wedecided to calculate theSMCFt for a one percentage point cut in the marginal tax rate in eachpersonal income tax bracket. Given these assumed marginal tax rate changes, we calculatedthe average tax rate change for each of the income groups in Table 5. The six groups withthe lowest incomes would see no change in their average and marginal tax rates. For thegroups earning more than 64,833 baht, the average tax rate change would be smaller than themarginal tax rate change, but the ratiodtj /dmj would increase with income because at higherincome levels a larger fraction of the individual’s income is subject to the tax cut. Thus, at the64,833 baht level,dt = −0.00015 anddm= −0.01 whereas at the 25,279,333 baht leveldt = −0.00998 anddm= −0.01. Because the income effects of the tax changes are smallerat the lower income levels, the labor supply responses will be larger at the lower incomelevels.
The distributional weights were based on the following formula:
ωi
ω23=((1− t23)y23
(1− ti )yi
)ξ(12)
whereyi is the average income for groupi , ti is the average tax rate,ωi is groupi ’s distri-butional weight, the parameterξ ≥ 0 reflects the strength of the concern for distributionalequity, and the indexi is equal to 23 for the highest income class. The distributional weightswere normalized so thatω23 was always equal to one. Three sets of distributional weightswere used in calculating theSMCFt . The first set, withωi = 1 for all i , indicates the privatemarginal cost of public funds. With the other two sets of distributional weights,ω1 = 5 and20. The distributional weights for the other intermediate income groups were calculatedusing values forξ from the following formula:12
ξ =ln(ω1ω23
)ln(1− t23)y23− ln(1− t1)y1
(13)
The distributional weights at the various income levels forω1 equal to 5 and 20 are shownin Table 5.
Table 6 shows the calculatedSMCFt . When all of the distributional weights are equalto 1, theSMCFt is 1.043 using the base case labor supply elasticities. Note that when thehigher compensated labor supply elasticity is used, theSMCFt is only somewhat higher at1.110. Table 6 also shows the calculatedSMCFt with the distributional weights ofω1 = 5andω1 = 20.
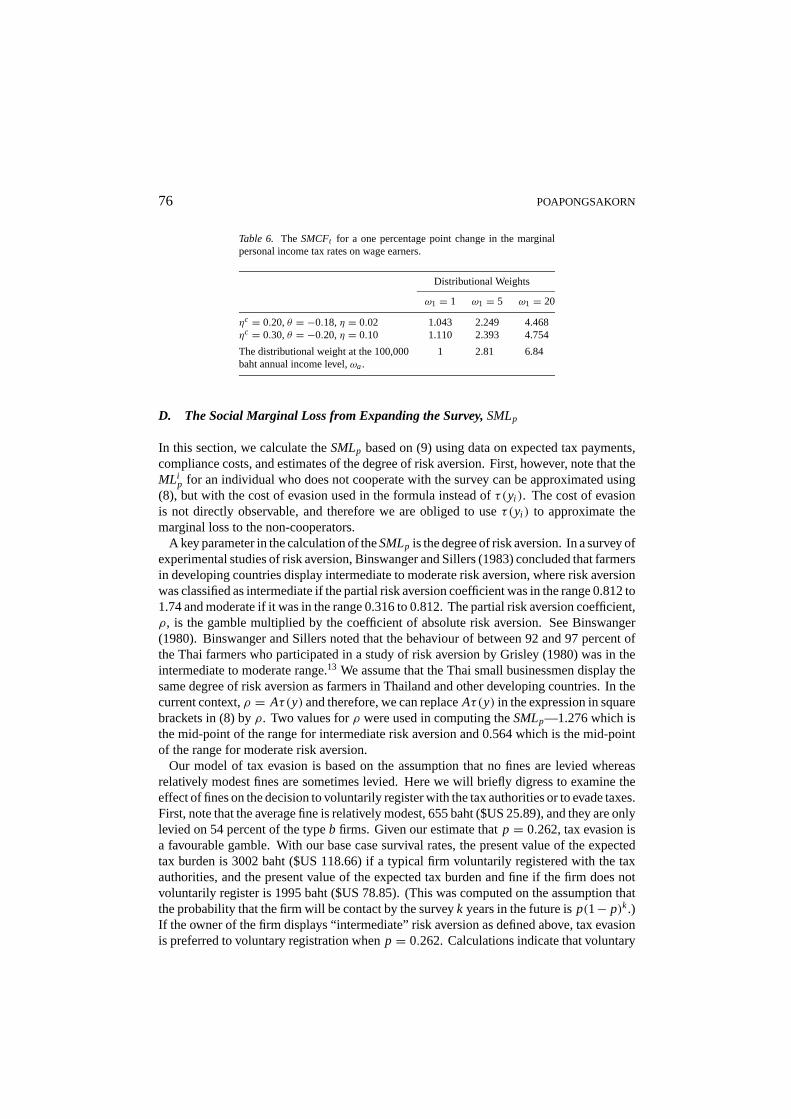
76 POAPONGSAKORN
Table 6. The SMCFt for a one percentage point change in the marginalpersonal income tax rates on wage earners.
Distributional Weights
ω1 = 1 ω1 = 5 ω1 = 20
ηc = 0.20,θ = −0.18,η = 0.02 1.043 2.249 4.468ηc = 0.30,θ = −0.20,η = 0.10 1.110 2.393 4.754
The distributional weight at the 100,000 1 2.81 6.84baht annual income level,ωa.
D. The Social Marginal Loss from Expanding the Survey,SMLp
In this section, we calculate theSMLp based on (9) using data on expected tax payments,compliance costs, and estimates of the degree of risk aversion. First, however, note that theMLi
p for an individual who does not cooperate with the survey can be approximated using(8), but with the cost of evasion used in the formula instead ofτ(yi ). The cost of evasionis not directly observable, and therefore we are obliged to useτ(yi ) to approximate themarginal loss to the non-cooperators.
A key parameter in the calculation of theSMLp is the degree of risk aversion. In a survey ofexperimental studies of risk aversion, Binswanger and Sillers (1983) concluded that farmersin developing countries display intermediate to moderate risk aversion, where risk aversionwas classified as intermediate if the partial risk aversion coefficient was in the range 0.812 to1.74 and moderate if it was in the range 0.316 to 0.812. The partial risk aversion coefficient,ρ, is the gamble multiplied by the coefficient of absolute risk aversion. See Binswanger(1980). Binswanger and Sillers noted that the behaviour of between 92 and 97 percent ofthe Thai farmers who participated in a study of risk aversion by Grisley (1980) was in theintermediate to moderate range.13 We assume that the Thai small businessmen display thesame degree of risk aversion as farmers in Thailand and other developing countries. In thecurrent context,ρ = Aτ(y) and therefore, we can replaceAτ(y) in the expression in squarebrackets in (8) byρ. Two values forρ were used in computing theSMLp—1.276 which isthe mid-point of the range for intermediate risk aversion and 0.564 which is the mid-pointof the range for moderate risk aversion.
Our model of tax evasion is based on the assumption that no fines are levied whereasrelatively modest fines are sometimes levied. Here we will briefly digress to examine theeffect of fines on the decision to voluntarily register with the tax authorities or to evade taxes.First, note that the average fine is relatively modest, 655 baht ($US 25.89), and they are onlylevied on 54 percent of the typeb firms. Given our estimate thatp = 0.262, tax evasion isa favourable gamble. With our base case survival rates, the present value of the expectedtax burden is 3002 baht ($US 118.66) if a typical firm voluntarily registered with the taxauthorities, and the present value of the expected tax burden and fine if the firm does notvoluntarily register is 1995 baht ($US 78.85). (This was computed on the assumption thatthe probability that the firm will be contact by the surveyk years in the future isp(1− p)k.)If the owner of the firm displays “intermediate” risk aversion as defined above, tax evasionis preferred to voluntary registration whenp = 0.262. Calculations indicate that voluntary

A COST-BENEFIT ANALYSIS 77
registration is only preferable to tax evasion ifp > 0.731. Thus, even if the size of the 1993survey were doubled, the typical firm would still not voluntarily register, which is one ofthe key assumptions of our tax evasion model, and therefore we do not think that our resultsare significantly biased because we ignored fines in developing our model of tax evasion.
Compliance costs are imposed on tax evaders as well as the firms that are currentlypaying taxes, and these costs are included in the computation of theSMLp. Based oninformation concerning the length of the initial interview with the owner of a firm, the timeand travel costs of attending a subsequent meeting with the tax officials, and estimates of theentrepreneurs’ opportunity cost of time, we have calculated that the average compliance costin 1993 was 70 baht ($US 2.77) for typea firms and 262 baht ($US 10.36) for typeb firms.Although the compliance cost imposed on the typea firms was relatively low, they represent84 percent of the firms contacted and account for 65 percent of the total compliance costs.The compliance costs for the typeb firms was 7.8 percent for their expected tax payment inthe base case. Total compliance cost were estimated to be 34.003 million baht ($US 1.344million), which was about 23 percent of the total administration cost incurred the InternalRevenue Department.
The modified version of (9), which was used in calculating theSMLp, is presented below:
SMLp = [ωa · NT · CCa + ωb · NE · (CCb + ET)]
[1− 1
2ρ
](14)
whereCCi is the compliance cost andωi is the distributional weight for the typei firm,i = a,b. The calculatedSMLp with ωi = 1 are shown in Table 3. Using the base casesurvival rates, theSMLp was 342.337 million baht ($US 13.531 million) with intermediaterisk aversion and 679 million baht ($US 26.482 million) with moderate risk aversion.Relative to the base case, theSMLp was about 50 percent higher in the high survival ratecase because of the higher value for ET and about 33 percent lower in the low survivalrate case. The effect of alternative distributional weights will be discussed in Section 4.E.below.
E. The Net Social Gain and theSMCFp
Having computedSMCFt ,MR,MC, andSMLp, the net social gain and the social marginalcost of funds from expanding the taxpayer survey can be calculated. Table 3 shows that theNSG, with theSMCFt = 1.043 and theωi = 1, is negative in all six cases under consider-ation. These calculations indicate the taxpayer survey should not be expanded; indeed ourmodel implies, given our assumption of constant returns to scale, that the taxpayer surveyshould be eliminated. However we do not think that these conclusions are warranted on thebasis of these results because the shadow price of revenue to the Kingdom of Thailand maybe significantly greater than 1.043 and concern for distributional equity may be importantin evaluating the benefits and costs of tax enforcement.
As noted earlier, we do not know how the Kingdom of Thailand would use any additionaltax revenue that an expansion of the taxpayer survey would generate. The shadow priceof a baht spent on some expenditure projects, such as education or health care, or theSMCFt from cutting some particularly distorting taxes, may be high enough to justify the

78 POAPONGSAKORN
expansion of the survey in the base or high survival rate scenarios.14 Given this ambiguity,we have calculated theSMCFp for the base case and high survival rate scenarios. If thevalue of the additional revenue to the Kingdom of Thailand exceeds these critical values,then the expansion of the taxpayer survey is warranted. TheSMCFp is 11.60 and 1.40 underthese two scenarios with intermediate risk aversion and 23.00 and 2.77 with moderate riskaversion. Thus, in the base case, the shadow price of revenue to the Kingdom of Thailandmust be very high in order to justify the expansion of the survey, but theSMCFp in the highsurvival rate scenario is much lower in the intermediate risk aversion case and is similar tothe figure derived by Fortin and Lacroix (1994) in their study of tax evasion in Quebec.15 Itshould also be noted that as more resources are devoted to the survey, the “survival rate” ofsmall businesses in the tax system may increase.16 This effect onMRhas not been includedin our calculations (because we are unable to measure this effect given our limited data onsurvival rates) and therefore theSMCFp may be underestimated.
It is assumed that the distributional weights for the owners of the small businesses inThailand are based on the same formula, and reflect the same preference for vertical equity,as was used in determining theSMCFt from raising tax revenues from wage earners. Datafrom the taxpayer survey indicated that the average annual income of owners of the typeafirms was 100,000 baht in 1993, and this income level was used to infer theωa. As shown inTable 6, when the distributional weight applied to a wage earner in the lowest income bracketis 5, theωa is 2.81, and when the distributional weight applied to an individual in the lowestincome bracket is 20,ωa is 6.84. Pro-poor distributional weights make expanding the surveyless attractive if the additional revenue is used to finance an across-the-board cut in incometax rates for wage earners. The reason is that whenω1 increases from 1 to 5, theSMCFt
increases by a factor of 2.16 whereas theωa increase by a factor of 2.81. Thus, the use ofpro-poor distributional weights increases theSMLp term more than theSMCFt (MR−MC)term, and therefore a stronger preference for vertical equity weakens the case for expandingthe taxpayer survey. This result is contingent on the assumed tax cut. A more pro-poor taxcut or expenditure increase would strengthen the case for expanding the survey.
If tax policy in Thailand reflects an aversion to tax evasion, then we should use a lowerdistributional weight in evaluating a loss sustained by a tax evader than we use in evaluatinga loss sustained by a taxpaying individual. In other words, theωb should be less than theωa evaluated at the same net income because the typeb firms are evading taxes. A lowerωb reduces theSMLp and makes expansion of the taxpayer survey more attractive. Figure 2shows theSMCFp whenωb varies between 0 and 1 withωa is equal to 1.0 and individuals’display intermediate risk aversion. For example, theSMCFp is 6.317 in the base case and0.740 in the optimistic survival rate case whenωb = 0.5. The figure also shows that if theSMCFt is equal to 1.043, then the aversion to tax evasion must be very strong in the basecase,ωb ≤ 0.0076, to justify an expansion of the survey, whereas in the optimistic survivalrate case,ωb ≤ 0.731 is required.
5. Conclusion
In this paper, we have described a cost-benefit analysis of a tax enforcement program inThailand. We have derived a criterion for evaluating the taxpayer survey and shown that

A COST-BENEFIT ANALYSIS 79
Figure 2. TheSMCFp as a function ofωb.
it is equivalent to the Atkinson and Stern (1974) condition for the optimal expenditure ona public good with distortionary taxation. Our empirical analysis, based on data for the1993 taxpayer survey, indicates that the net revenue generated by the survey exceeds itsadministration cost but that the losses imposed on the small business sector exceed the(social value) of the marginal net revenue unless the shadow price of revenue to the Thaigovernment is very high, or there is a strong aversion to tax evasion. More concern forvertical equity diminishes the attractiveness of the survey if additional revenue would beused to finance an across-the-board cut personal income tax rates for wage earners. Wehope that the framework that we have developed and the issues that our analysis has revealedwill help economists in analyzing tax enforcement in other countries.
Given the very high cost of raising additional revenue through the taxpayer survey, onemight ask whether there are other measures that might have a higher payoff. We have notedthat fines do not play an important role in the tax enforcement system, and economists havegenerally stressed the advantage of using fines, instead of devoting resources to detection, inreducing tax evasion. Our analysis does not indicate whether stiffer fines would significantlyreduce tax evasion, but we think that the use of stiffer fines would increase administrationand compliance costs because of the appeals and litigation that would inevitably arise iffines became a significant feature of the tax enforcement strategy. These costs, which aregenerally ignored in the academic literature, would probably make increased reliance onfines less attractive than the academic literature on tax enforcement suggests. Our analysisalso indicated that there are a significant number of small businesses which are not includedin the survey, either because of their location (slums) or the nature of their (generally illegal)activities. Bringing these firms into the tax system would probably require a substantialincrease in resources and as well as coordination with the police or military, and we donot have the necessary information to assess whether this would be a desirable direction topursue. Finally, there may be scope for improving the survey by changing the way in which

80 POAPONGSAKORN
the survey officials are remunerated. Under the current arrangement, survey officers do nothave to look for tax evaders. As long as they can contact six entrepreneurs who are alreadypaying taxes, they will receive a bonus. Changing the remuneration system so that bonusesare only paid for bringing in firms that were not previously paying taxes might generateadditional revenues without significantly increasing costs.
Acknowledgments
Nipon Poapongsakorn was Vice-President of the Thailand Development Research Institutewhen the research on this project was conducted. We would like to thank Sake Math-rusraruk for his research assistance and Frank Flatters, Robin Boadway, Angela Dunphy,and Trairong Sarasook of the John Deutsch Institute for the Study of Economic Policy atQueen’s University for arranging Bev Dahlby’s participation in the project. We would espe-cially like to thank Michael Keen and an anonymous referee for their useful comments andsuggestions. The financial support for the project provided by the Canadian InternationalDevelopment Agency is gratefully acknowledged.
Notes
1. See Welch (1954), Brownlee (1972), Goode (1981), Sandmo (1981), Slemrod and Yitzaki (1987), Yitzhakiand Vakneen (1989), Kaplow (1990), Yamada (1990) and Toma and Toma (1992). For an overview of theliterature on tax evasion, see Cowell (1990).
2. On the measurement and use of theSMCFt in evaluating public expenditures, see Mayshar (1991), Ballardand Fullerton (1992), and Snow and Warren (1996). See Dahlby (1998) on how the various measures of themarginal cost of public fund measures in the literature can be derived from this basic definition.
3. For example, (6) is equivalent to Slemrod and Yitzhaki’s equation (5) or (A5) when theirτ is interpretedas the social marginal cost of public funds. Their interpretation of the condition for optimal enforcement isthat the reduction in the excess burden of tax evasion from increasingp should equal the marginal resourcecost of increasingp multiplied by the social marginal cost of public funds, or−d E B/dp = SMCFt ·MC.This condition is equivalent to the Atkinson and Stern rule because in their model−d E B/dp is equal toSMCFt ·M R− SMLp.
4. If, instead of a tax cut, the additional net revenue from expanding the survey had been used to financeadditional government spending, then theSMCFt in (6) would be re-interpreted as the social value of additionalexpenditure in the public sector in Thailand. With the optimal fiscal system, the social marginal benefit ofan additional baht spent in the public sector in Thailand would equal the commonSMC F of raising taxrevenues from all tax sources. However, in applying the cost-benefit criterion to the tax enforcement we arenot assuming that the fiscal system in Thailand is optimal.
5. In 1993, the exchange rate was 25.3 baht per US dollar.6. Timmons (1994, p. 10) indicates that the two, four, and six year survival rates for small businesses in the U.S.
are 0.763, 0.483, and 0.373 respectively. We would like to thank Lloyd Steier for bringing these data to ourattention.
7. National Statistical Office of Thailand,Report of the Labor Force Survey, August 1992, Bangkok, Thailand,Table 7, pp. 22–23.
8. The number of large firms, which are excluded from the taxpayer survey and which can be proxied by thenumber of firms receiving certificates of promotion by the Board of Investment (BOI), is 4274, and this doesnot explain the difference between the two figures.
9. See Dahlby (1994 and 1998) for the derivation of this formula and its use in computing theSMCFt in Canada.10. The model is based on the assumption that the demand for labor is perfectly elastic.11. Comparable elasticities were used by Hansson and Stuart (1985), Ballard (1998), and Fortin, Truchon, and
Beausejour (1993).
A COST-BENEFIT ANALYSIS 81
12. The implicit distributional weights in the Atkinson (1970) inequality index are based on this formula.13. They note that the degree of risk aversion and its dispersion is very similar across different countries where
the experiments have been conducted—India, Philippines, Thailand, and El Salvador—with the exception thatthere was more dispersion displayed among the participants of the experiments in El Salvador. They also notethat the degree of risk aversion displayed by the participants does not seem to be related to the participant’snet household wealth.
14. A higherSMCFt in the pessimistic survival rate case makes expansion of the survey even less attractivebecause, in this scenario, the taxpayer survey is a net drain on the government’s net revenues.
15. Fortin and Lacroix (1994) calculated that theSMCFp to be 1.47. However, as they acknowledged, theircalculation understates theSMCFp because they did not deductMC from MR in calculating the net additionalrevenue from increased tax enforcement.
16. We would like to thank Niels Frederiksen for pointing this out.
References
Atkinson, A. (1970). “On the Measurement of Inequality.”Journal of Economic Theory2, 244–263.Atkinson, A., and N. Stern. (1974). “Pigou, Taxation, and Public Goods.”Review of Economics Studies41,
119–128.Ballard, C. L. (1988). “The Marginal Efficiency Cost of Redistribution.”American Economic Review78, 1019–
1033.Ballard, C. L., and D. Fullerton. (1992). “Distortionary Taxation and the Provision of Public Goods.”Journal of
Economic Perspectives6, 117–131.Binswanger, H. (1980). “Attitudes toward Risk: Experimental Measurement in Rural India.”American Journal
of Agricultural Economics62, 395–407.Binswanger, H., and D. Sillers. (1983). “Risk Aversion and Credit Constraints in Farmers’ Decision-Making: A
Reinterpretation.”Journal of Developmental Studies20, 5–21.Brownlee, O. (1972). “The Optimal Amount of Resources to Devote to Tax Collection.”Journal of Business25,
14–17.Cowell, F. A. (1990).Cheating the Government. Cambridge, MA: The MIT Press.Dahlby, B. (1994). “The Distortionary Effect of Rising Taxes.” In R. Robson and W. Scarth (eds.),Deficit
Reduction: What Pain; What Gain?Toronto: The C. D. Howe Institute.Dahlby, B. (1998). “Progressive Taxation and the Social Marginal Cost of Public Funds.”Journal of Public
Economics67, 105–122.Fortin, B., and G. Lacroix. (1994). “Labour Supply, Tax Evasion, and the Marginal Cost of Public Funds: An
Empirical Investigation.”Journal of Public Economics55, 407–431.Fortin, B., M. Truchon, and L. Beaus´ejour. (1993). “On Reforming the Welfare System: Workfare Meets the
Negative Income Tax.”Journal of Public Economics51, 119–151.Goode, R. (1981). “Some Economic Aspects of Tax Administration.”IMF Staff Papers28, 249–274.Grisley, W. (1980). “Effect of Risk and Risk Aversion on Farm Decision-Making: Farmers in Northern Thailand.”
PhD. Thesis, University of Illinois.Hansson, Ingemar, and Charles Stuart. (1985). “Tax Revenue and the Marginal Cost of Public Funds in Sweden.”
Journal of Public Economics27, 331–353.Kaplow, L. (1990). “Optimal Taxation with Costly Enforcement and Evasion.”Journal of Public Economics43,
221–236.Mayshar, J. (1991). “On Measuring the Marginal Cost of Funds Analytically.”American Economic Review81,
1329–1335.National Statistical Office of Thailand. (1992).Report of the Labor Force Survey. Bangkok, Thailand.Poapongsakorn, N. (1979). “Labor Supply, Demand for Children and Wage Rates of Paid Employees in Thailand.”
Ph.D. dissertation, Department of Economics, University of Hawaii.Sandmo, A. (1981). “Income Tax Evasion, Labour Supply, and the Equity-Efficiency Tradeoff.”Journal of Public
Economics16, 265–288.Slemrod, J., and S. Yitzhaki. (1987). “The Optimal Size of a Tax Collection Agency.”Scandinavian Journal of
Economics89, 183–192.

82 POAPONGSAKORN
Snow, A., and R. Warren. (1996). “The Marginal Welfare Cost of Public Funds: Theory and Estimates.”Journalof Public Economics61, 289–305.
Tanzi, V., and P. Shome. (1993). “A Primer on Tax Evasion.”IMF Staff Papers40, 807–828.Toma, E. F., and M. Toma. (1992). “Tax Collection with Agency Costs: Private Contracting or Government
Bureaucrats?”Economica59, 107–120.Timmons, J. A. (1994).New Venture Creation(4th edition). Boston, MA: Irwin.Welch, R. B. (1954). “Measuring the Optimum Size of a Field Audit Staff.”National Tax Journal7, 210–221.Yamada, M. (1990). “An Analysis of Optimal Tax Evasion.”Public Finance35, 470–490.Yitzhaki, S., and Y. Vakneen. (1989). “On the Shadow Price of a Tax Inspector.”Public Finance44, 492–505.