Embed Size (px)
Citation preview

Cost-benefit Analysis:Cost-benefit Analysis: Return to Taxpayer Investment
in Public Libraries
Sponsored by
Institute of Museum and Library Services
Donald Elliott, Ph.D.
Professor of Economics and Finance
Southern Illinois University Edwardsville
October 16, 2003

Public Crises in America
Public-sector budgetary crisis– Declining state and local government revenues– Resistance to raising tax rates– Cuts in budgets for libraries, as well K-12 and
higher education, and even fire and police

Public Crises in America
Crisis of trust– In government– In business
Call for accountability– Recall of governor in California– Accounting oversight

Public Crises in AmericaIf an objective, external agency were to ask
your cardholders about the library services they receive, the value they get, and their willingness to support taxes for services, what would your cardholders say?
Could you use the results… – to improve the management of your library?– bolster budgetary support for your library?– How?

StudyStudy
Federally funded by a grant to St. Louis Public Library from the Institute of Museum and Library Services (IMLS)
Demonstrated previously… – at 5 major urban libraries– now 9 additional libraries in Texas, Washington state,
and Illinois, including 3 libraries in the Chicago area– Successfully replicated at St. Louis Public Library—
recipient of the IMLS grant Invitation from American Library Association to
publish study

PurposePurpose
Develop a practical, conservative, transportable methodology to estimate a lower bound for libraries’ direct return on taxpayer investment.– How much benefit do public library patrons
receive for each dollar of annual tax support?– What return do citizens get for the capital
invested in their public library?

MethodologyMethodology
Cost-benefit analysis– Measure dollar value of direct benefits to
library patrons– Measure library costs– Measure return to taxpayer investment
Benefits measured conservatively based on scientific surveys of local library users

METHODOLOGYMETHODOLOGY
Research question: How valuable is your public library to the community it serves?
Strategy: estimate defensible lower boundAnalytical tools:
– Cost-benefit analysis (CBA) – NOT economic impact analysis
Valuable to whom?Why? How much?

FRAMEWORKFRAMEWORK
Role of mission statementCustomer-focused
– WHOM do you serve?
Service focus– HOW do you serve them?
Framework for benefits: service-user matrix

SERVICE-USER MATRIXSERVICE-USER MATRIX
Taxonomy Households Teachers Business
Books x x x
Repair manuals
x
Staff help x x x
Financial x
Computer x x x

MEASURING BENEFITSMEASURING BENEFITS
Which benefits?– Direct
E.g., reading a book for pleasure
– Indirect benefitsE.g., impact on intergenerational literacy
How?– Units: dollars

MEASUREMENT TECHNIQUES: MEASUREMENT TECHNIQUES: CONTINGENT VALUATIONCONTINGENT VALUATION
Willingness to pay (WTP)– How much would a household pay to retain
access to the library?– Example: Suppose that public libraries did
not exist. How much would your household be willing to pay per year to establish your public library as it exists today?
Willingness to accept (WTA)

MEASUREMENT TECHNIQUES: MEASUREMENT TECHNIQUES: CONSUMER SURPLUS CONSUMER SURPLUS
Defining the market substitutes– Customer perspective, not librarian perspective– Example: dictionary
Pricing the market substitutes– Customer perspective, not librarian perspective– Example: encyclopedia or videotape

COMPARISON OF COMPARISON OF WTP AND CSWTP AND CS
Willingness to pay (WTP)– Based on willingness to pay taxes and fees– Negatively influenced by
Free rider problems Perceptions of tax equity Lack of control over mix of services produced
Consumer surplus (CS)– Item by item comparison in familiar shopping
format– Total spending confirmed by follow-up
question

INTERNET AND TELEPHONE SURVEYS
All measures require information available ONLY from library customers directly => surveys
Random sampling Conducted by university survey center Pre-announcement letter (Schaumburg)
– Respondents were invited to respond by Internet.– Anyone who had responded by Internet and had NOT notified the
library to decline was called. Post-incentives Household survey responses weighted to ensure against response bias Average telephone interview time: 15 minutes

SURVEY INSTRUMENTSURVEY INSTRUMENT
Framework designed by team of market researchers and economists
Branched and tailored by self-selected customer class: household and teacher Includes both categorical and open-ended questions

SURVEY INSTRUMENT:SURVEY INSTRUMENT:OverviewOverview
Greeting Verification of user categories General user questions
– Market substitutes– CVA
Demographic questions Teacher Anything else to say to library director? Thank you

RESPONSE RATESRESPONSE RATES
0%
5%
10%
15%
20%
25%
30%
35%
40%
45%
Response rate
Joliet
Skokie
Schaumburg
SURVEY CONTEXTSURVEY CONTEXT
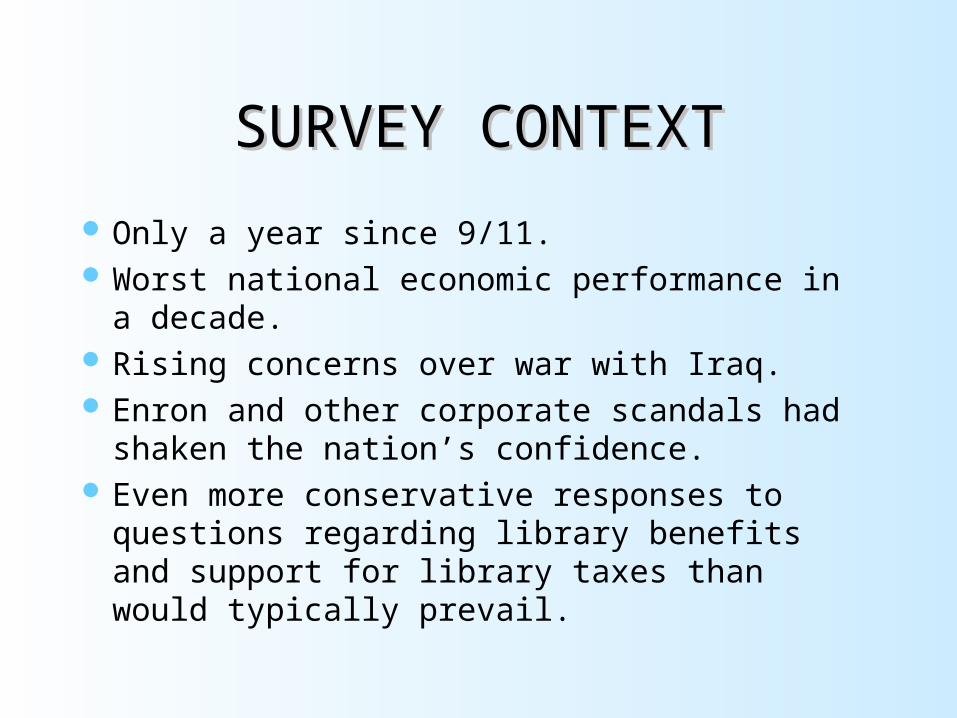
Only a year since 9/11. Worst national economic performance in a decade. Rising concerns over war with Iraq. Enron and other corporate scandals had shaken the
nation’s confidence. Even more conservative responses to questions
regarding library benefits and support for library taxes than would typically prevail.

MEASURING COSTSMEASURING COSTS
Benefits arise from services produced by– Current operating staff and outlays– Capital assets such as land, buildings,
furnishings, collections, computers, vehiclesAnnual operating costs: annual revenues less
capital outlays less end-of-year surplusCapital assets: valued at replacement cost
newNo consideration of depreciation

RESULTSRESULTS
Illinois Participating Libraries:
Joliet, Schaumburg Township, and Skokie

Cardholder Demographics Cardholder Demographics Available from SurveyAvailable from Survey
Education level of head of householdAge composition and size of householdComputer ownership and connectivityHome ownership EthnicityHousehold incomeDistance to library

COMPARE CENSUS AND COMPARE CENSUS AND CARDHOLDER CARDHOLDER
DEMOGRAPHICSDEMOGRAPHICSEven though there are striking differences
in the census demographics of the general populations, the differences among cardholder demographics are less distinct:– Income– Poverty rates– Education and occupation

Striking Differences in 2000 Striking Differences in 2000 Census DemographicsCensus Demographics
LIBRARY PER CAP INCOME
PERCENT POVERTY
PERCENT PROFESSIONAL
Joliet $19,390 8% 28%
Schaumburg $30,587 2% 44%
Skokie $27,136 4% 46%

Differences Among Cardholder Differences Among Cardholder Demographics Are Less Distinct.Demographics Are Less Distinct.
LIBRARY AVERAGE HOUSEHOLD
INCOME
PERCENT ADVANCED
DEGREE
PERCENT COMPUTER OWNERSHIP
Joliet $49,440 13% 78%
Schaumburg $50,499 23% 93%
Skokie $47,318 33% 83%

But there are substantial differences among the three libraries in funding, capital assets, and benefit levels…

Library Operating Funds and Library Operating Funds and Assets Per Active HouseholdAssets Per Active Household
LIBRARY OPERATING FUNDS ASSETS
Joliet $250 $2,350
Schaumburg $325 $2,700
Skokie $350 $1,350

Yet, all three libraries provide a positive net return to local operating funds and to community capital investment.

Range of Returns to Taxpayer Range of Returns to Taxpayer Investment for 3 LibrariesInvestment for 3 Libraries
Returns to local operating revenues– Based on WTP, $1.04 to $1.24.– Based on consumer surplus, $1.22-$1.87.
Returns to community investment in library assets– Based on WTP, 1% to 3%.– Based on consumer surplus, 6% to 10%.

Conservative Because:Conservative Because:
Study captures benefits to cardholders only:– No walk-ins– No third party beneficiaries
Consumer surplus estimates:– Use conservative pricing– Count benefits only if would substitute
Capital valuations exclude depreciation

Results by Type of Patron and Results by Type of Patron and by Type of Serviceby Type of Service
Measurement of Benefits:
Households
Educators

Who Benefits?Who Benefits?
0%
10%
20%
30%
40%
50%
60%
70%
80%
90%
Joliet Schaumburg Skokie
Educators
Households

Analysis of Services Used by Analysis of Services Used by HouseholdsHouseholds
Services– Staff help– Magazines and
newspapers (domestic and foreign)
– Books for adult readers– Computer services and
classes– Electronic information
services
– Reference materials– Audio and visual
media– Programs for adult
patrons– Children’s books– Programs for children
Analysis of Services Used by Analysis of Services Used by HouseholdsHouseholds
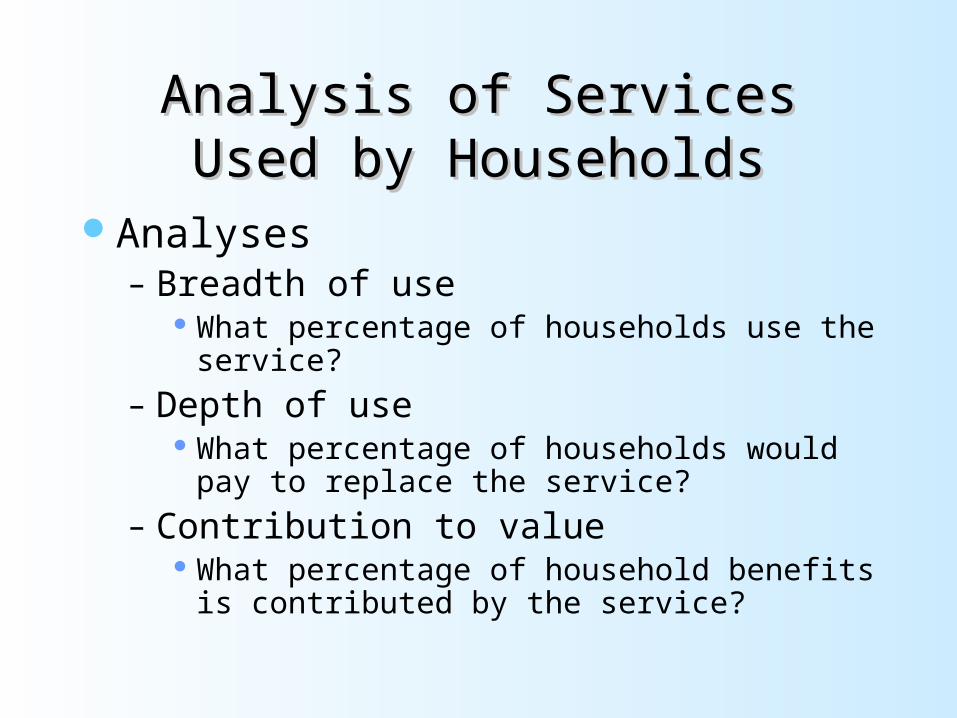
Analyses– Breadth of use
What percentage of households use the service?
– Depth of use What percentage of households would pay to
replace the service?
– Contribution to value What percentage of household benefits is
contributed by the service?

Skokie: Contribution to Household Benefits by Type of Service
BOOKS 33%
MAGAZINES & NEWSPAPERS
9%
SPECIAL EVENTS 1%CHILDREN'S PROGRAMS
1%
DISKS AND TAPES27%
COMPUTERS4%
REFERENCE 0%
ELECTRONIC INFORMATION
1%
CHILDRENS' BOOKS23%
STAFF 1%

Schaumburg: Benefits to Schaumburg: Benefits to TeachersTeachers
Library ServicePercentage of teachers using
service
Staff help 22%
Magazines and newspapers 13%
Children’s books and programs 53%
Books and programs for adults 31%
CDs, DVDs, and tapes 38%
Library computers or computer classes 12%
Electronic information sources 17%
Encyclopedias 19%

Results—An ExampleResults—An Example
Active users of Joliet Public Library include:– Over 9500 households– Over 900 teachers
At least 78% of all benefits to the community accrue to households, while as much as 22% of benefits arise from library services used by teachers to supplement educational resources in the community.

Results--householdsResults--households
Households report, on average, that the services they use are worth – more than $235-$389 per year per household. – more than $2.25-$4.35 million per year.
Households place the greatest value on adult and children’s books and audio and visual media. – 32 cents of each dollar attributable to books for
adults– 27 cents to children’s books– 21 cents to audio and visual media.

Results--teachersResults--teachers
Over 9% of cardholding households include a teacher who uses Joliet Public Library
Library services save schools and teachers, on average, more than $700 each per year.
Supporting services to teachers and schools are worth almost $640,000 per year.

Results--teachersResults--teachers
Educators use and value children’s books, audio and visual media, and electronic information services much more than general households.
Educators are less likely to use staff help.

ResultsResultsFor each dollar of taxes contributed annually to
the Joliet Public Library, its patrons receive benefits of more than one dollar.
If outlays used to build library collections, new furniture, equipment, buildings, and other capital assets are excluded, patrons receive benefits of more than $1.24 for each dollar of operating outlays.
An alternative method of measuring benefits suggests benefits of at least $1.87 for each dollar of operating outlays.

Each dollar of local operating Each dollar of local operating outlays produces $1.24-$1.87 outlays produces $1.24-$1.87 of benefits to library patrons.of benefits to library patrons.
$1 in taxes
$1.24-$1.87 in benefits
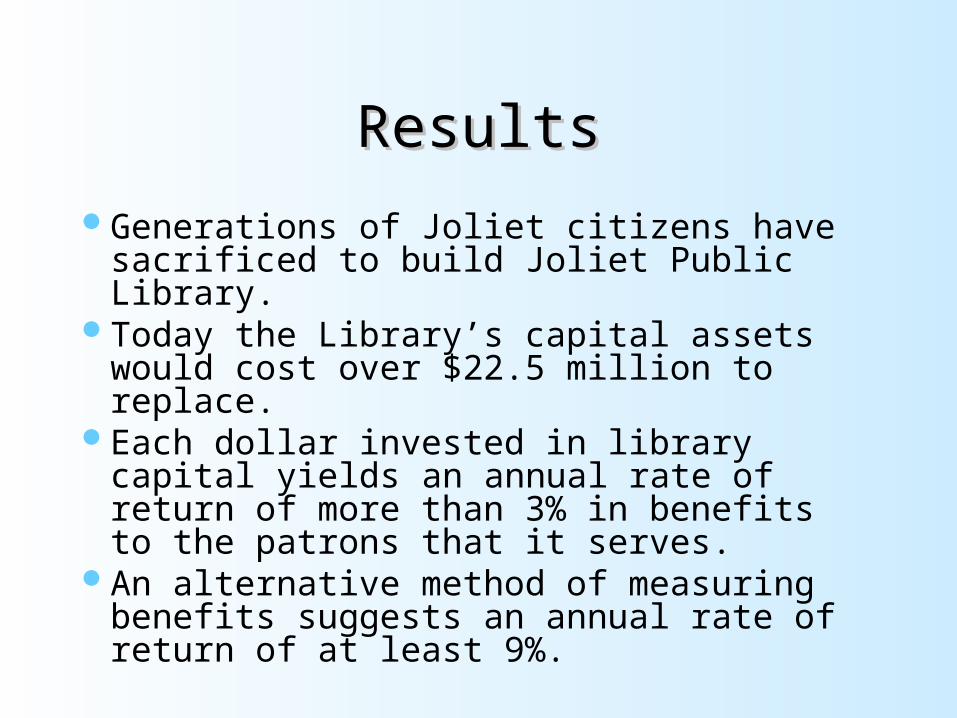
Generations of Joliet citizens have sacrificed to build Joliet Public Library.
Today the Library’s capital assets would cost over $22.5 million to replace.
Each dollar invested in library capital yields an annual rate of return of more than 3% in benefits to the patrons that it serves.
An alternative method of measuring benefits suggests an annual rate of return of at least 9%.
ResultsResults

Joliet, Schaumburg, and Joliet, Schaumburg, and Skokie cardholders view their Skokie cardholders view their
libraries aslibraries asessential community assetsessential community assets
and and productive investmentsproductive investments of of
their tax dollars.their tax dollars.

Joliet, Schaumburg and Joliet, Schaumburg and Skokie LibrariesSkokie Libraries
Sound Investments
in
People!

For additional information:For additional information:
See St. Louis Public Library website http://www.slpl.lib.mo.us/using/research.htm– Dr. Glen Holt– Dr. Leslie Holt
E-mail– Professor Donald Elliott, Southern Illinois
University Edwardsville– [email protected]


![Principles and Standards for Benefit–Cost Analysis] Introduction- Professionalizing Benefit–Cost Analysis](https://img.pdfslide.us/doc/110x75/56d6beb21a28ab30169333bb/principles-and-standards-for-benefitcost-analysis-introduction-professionalizing.jpg)