Embed Size (px)
Citation preview
A Cost Benefit Analysis of an Automated Circulation System
for a Small Public Library
Darlene Berghammer
An Applied Research Project IPolitical Science 5397) Submitted to The Department of Political Science Southwest Texas State University
For the Requirement for the Degree of
Masters of Public Administration
(Fall of 1995)
Faculty Approval

TABLE OF CONTENTS
.................................................................................... CHAPTER I: Introduction I
CHAPTER II: Liierature Review .................................................................. 7
..................................................................................... Systematic Analysis 7 ............................................................. Overview of Cost-Benefit Analysis 9
................................................................. Theory of Cost-Benefit Analysis 10 .................................. A Description of the Steps of Cost-Benefit Analysis 16
................................................... Estimating Costs and Benefits in Dollars 19 ............................................................. Introduction of the Time Dimension 21
Cost-Effectiveness Analysis ....................................................................... 26
CHAPTER Ill: The Organizational Framework of the Public Library ... 30
National Perspective .................................................................................. 30 .......................................................... Public Library Development in Texas 31
.................................... Organization of the Central Texas Library System 39 Library Automation Setting ........................................................................ . 48
.................................................................................. CHAPTER N: Analysis 60
Method ........................................................................................................ 60 Identifying Benefits ...................................................................................... 62
............................................................. Identifying Dollar Value of Benefits 65 Identifying Automation Costs .............. .. .................................................... 67
CHAPTER V: Summary and Findings .................................................. 77

CHAPTER I
INTRODUCTION
A great deal has been written on the importance of automation in libraries. There
is growing interest to automate the small public library. As the costs for computer
hardware continue to decline, automation is becoming more of a reality for small public
libraries. In the past, both mini computers and mainframe computers were cost
prohibitive and beyond the ability of small public library to purchase. One reason for
this situation was that the mainframe computers were extremely expensive and
somewhat limited in scope and flexibility for library functions. The computer industry
did not have the capacity of developing a specialized library system that was cost
effective. The present technology includes integrated library systems, with ordering,
serial control, cataloging and circulation capabilities. The present generation of
computer systems can be very useful in bridging the demand for library services and
the ability to provide these services. As a result, now is the time for smaller libraries to
examine the possible utility of automation in their library.
In 1993, there were 9,097 public library jurisdictions in the United States. The
majority of these libraries served populations of less than 10,000 and typically
employed staffs of five full-time employees or less.' According to a survey done by the
National Center for Educational Statistics, "64% of all public libraries serving

populations of 10,000 or less had operating budgets of $50,000 or less.2 This is an
environment where everyone does everything, from shelving and checking out books to
mopping floors. Due to these constraints, the administrators of most small public
libraries may believe they cannot afford to automate. Perhaps the truth is the small
public library cannot afford NOT to be automated.
Deciding the most effective program for establishing an automated circulation
system is a task that confronts library administrators today. Automation services
provided by a local system, or network, are becoming the heart of library and
information services. Thus, it is important to the development of the small public library
to make a rational decision regarding automation. Expensive equipment, very
specialized software, training, consultant fees, continuous support and maintenance
are some of the variables that drive the computerization costs up. According to
Bierman, the planning of an automation system also requires the following:
"... a cost-benefit analysis should be undertaken to see if your library can afford automation and if so, on what basis. You must determine what you are currently spending on the area or service of the library under consideration for automation, ... Then evaluate the benefits in comparison with the net cost increases and make the management decision - - is it worth it or is it not?"3
There are two purposes for this applied research project; first, a cost-benefit
analysis (CBA) and cost-effectiveness analysis (CEA) dealing with library automation in
Taylor, Texas will be performed. It will be used to evaluate the costs and benefits of an
'Sager, 1983, p. 1.
automated circulation system. Secondly, the aforementioned CBA and CEA will serve
as a template for library managers to utilize in evaluating costs and benefits of an
automated circulation system for the Central Texas Library System. The analysis is
intended to serve as a model. It may be duplicated or modified, and used as a guide
for library administrators.
Technology has changed throughout the years and the belief that automation
was only beneficial for larger libraries no longer holds true. The advancement in
technology has grown so quickly that automation for small public libraries has become
a necessity for the future. In the last twenty years, research has shown that computers
continue to influence library and information science services and "it is safe to assume
that the public will become more conversant with computers and better prepared to
access the library's services through direct use of a automated s~stern. '~
This predictive research examines the costs and benefits of two different
circulation systems. In this analysis, the benefits of an automated circulation system
will be compared with those of a manual circulation system. The first alternative
focuses on providing an online circulation system that keeps track of checkouts and
checkins, automatically prints overdue and fine notices, catches delinquent patrons and
frees staff time for better patron service.' In contrast, the manual circulation system
provides the same service but requires more labor and becomes more cumbersome as
growth occurs. The objective of providing automated library service is to reduce

andlor stabilize cost and to improve customer service. This is done by automating
labor-intensive activities to save time and personnel cost.
"The administration must balance what automation can accomplish compared with the future maintenance of these manual files. If the collection or records can be effectively maintained manually and not deteriorate to the state they were in before the upgrading effort, then automation may not be needed. On the other hand, if growth in the collection or in usage is anticipated, or if it is anticipated that staff and revenues will not be sufficient to cope with existing or projected levels of use, then it would be well to consider automating that process to ensure that the effort is not wasted and to maintain the quality of records and services.'"
The role of the decision-maker is to try and achieve this objective in the most
cost effective way. Severe budget constraints on library budgets have forced decision-
makers to carefully analyze the different options that are provided within a program.
Limited resources force administrators to make difficult choices among
competing projects. The most fundamental proposition of economics is that resources
are always limited, compared with what people want. "These scarce resources must be
allocated among competing wants, so that citizens of the community receive the largest
benefits p~ssible."~ The allocation of resources involves comparing alternatives. Cost-
benefit analysis has been used as a method for comparing the worth of competing
projects. The objective of a cost-benefit analysis is to provide administrators with a
criterion with which they can make choices among competing alternatives.
'Sager, 1983, p. 8.
7Galambos, 1978, p. 3.

Administrators must decide if the gain to society (benefit) from the project is greater
than the social sacrifice (cost) required to produce the project. If so, the project is
recommended as a worthwhile project. A worthwhile project improves society's
economic condition because these projects direct resources where their uses provide a
greater return than would an alternative use. This is the essence of cost-benefit. The
two key decision-making techniques pertaining to the costs of providing automated
library service are cost-benefit analysis and cost-effectiveness analysis.
In Chapter 11, Literature Review, cost-benefit and cost effectiveness analysis are
discussed. This will include a historical discussion of these particular techniques as a
decision-making criteria regarding the construction of dams, bridges, roads and other
infrastructure during the early 1930's. However, the chapter also outlines a discussion
of the different elements of both cost-benefit and cost-effective analysis.
Chapter Ill provides the organizational setting und.er which this analysis has
been conducted. An overview of the literature pertaining to library automation and a
review of the different applications of CBA and CEA to library services is presented.
The Chapter provides a framework for making decisions among competing government
programs based on the discussions of cost-benefit and cost effectiveness analysis.
This chapter does not identify specific answers regarding the automation of public
libraries, rather, the research presents a review of different applications of cost-benefit
analysis methods in different studies. The research material provides the historical
foundation for assessing the benefits and costs of automated library services in this
analysis.

Chapter IV applies both cost-benefit analysis and cost-effectiveness analysis
evaluation research methods to the data that was collected for this project. This
involves determining the cost savings for an automated circulation system and
comparing them to a manual system. The results of this analysis determines the
feasibility of purchasing online automated circulation systems for the small public
libraries in the Central Texas Library System.
Chapter V presents the summary of the cost-benefit and cost-effectiveness
analysis of an automation system for the Taylor Public Library. Current costs, together
with comparative costs for a computerized system suggests that automation is feasible
alternative for the library. In times of restrained budgets, it becomes crucial to get the
most value for the dollar. Although the analysis shows that an automated system may
require a high initial outlay, over time, it saves money. In conclusion, the data analysis
indicates that costs are no longer the barrier they once were, but are still high enough
that a library should consider all its options in acquiring an automated system.

CHAPTER II
LITERATLIRE REVIEW
2.1 SYSTEMATIC ANALYSIS
The purpose of this chapter is to review the literature on cost-benefit analysis
and cost-effectiveness analysis and the need for systematic methods to evaluate
alternative programs. These are techniques that are applicable across programs and
across policy areas. Later on, these methods will be applied to library programs.
What distinguishes these different forms of systematic analysis is that there is a logic
that can be translated into specific steps. Systematic analysis is generally applied to
resource allocation issues.
Systematic analysis can be an essential part of the decision-making process. It
is a method that accounts for both tang~ble and intangible objectives. The analysis is a
means by which information is presented and used to determine what can be
accomplished with a specific level of resources. The results of the analysis feed into
the political process. The need for this type of evaluation is self-evident. Evaluation
enables the examination of investment proposals to ensure government accountability.
This type of analysis presents information about what government plans to do and the
costs associated with accomplishing a desired outcome.
There are many different forms of analysis, such as operations research and
economic analysis. Much of the discussion in this chapter focuses on economic
analysis, which is divided into two topics, cost-benefit and cost-effectiveness analysis.

Cost-benefit and costeffectiveness analysis are management tools which are used to
determine the costs and benefits of a particular project. After costs and benefits are
determined these methodologies are used to choose between alternative projects.
Hence, they represent a method to make decisions about funding among different types
of library functions such as cataloging, circulation and collection devel~pment.~
Many small libraries cannot keep up with the rapid increase in technological
advancements. The associated costs of expanding computerized library and
information services increase faster than library administrators can incorporate such
changes in their budgets.' This, coupled with an overall reduction in funds, makes it
difficult for small libraries to consider automation an option. Currently, 45 percent of
small libraries have operating budgets of $50,000 or less.I0
Public programs and services are funded by local taxes that are based on the
value of local property. The escalating cost in all areas of public services continues to
be a problem. This is especially true when considering the provision of automated
services for small public libraries. It is not likely that public service budgets will be
increased. Library administrators are thus faced with the task of incorporating new
technology in a stressful fiscal environment. Priorities need to be identified, a
continuum of services developed and program costs delineated. The issues
surrounding costs for automation of small public libraries reflect a need for an effective
BVan House, 1984, p. 408.
'Bierman, 1982, p.7
I0Gertzog, 1994, p. 52.

method of outlining priorities and selection of those priorities. This method should also
take into account efficiency. Benefit-cost analysis and cost-effective analysis are such
methods.
The need for cost-benefit analysis in library and information services has
become more important as the competition for dollars with other governmental
agencies increases. This chapter discusses cost-benefit and cost-effectiveness
analysis in general and delineate the steps that are needed to accomplish this type of
analysis.
2.2 OVERVIEW OF COST-BENEFIT ANALYSIS
Evaluation of public projects has occurred throughout history. The modern
literature on cost-benefit analysis (CBA) dates back to an article published in 1844 by
J. Dupuit. This essay, "On the Measurement of the Utility of Public Works," was written
by Jules Dupuit, a French engineer, Dupuit stated:
Legislators have prescribed the formalities necessary for certain works to be declared of public utility; political economy has not yet defined in any precise manner the conditions which these works must fulfill in order to be really useful; at least, the ideas which have been put about on the subject appear to us to be vague, incomplete, and often inaccurate. Yet the latter question is more important than the former; inquiries - be they so numerous - laws and ordinances will not make roads, a railway, or a canal useful if it is not already. The law ought to confirm the facts demonstrated by political economy. How is such demonstration to be made? Upon what principles, upon

what formula, does it rest? How in a word is public utility to be measured?"''
In the 1920's Professor A. C. Pigou refined this concept of public ut i l i t~. '~ He
introduced the concepts of social benefit and social cost and a need for measuring
public utility. During this period of history, policymakers accepted the idea that
projects, public or private, should have a broader social justification for public
investment. Further, these justifications should include the positive and negative
consequences of public decisions. This was the beginning of a new way of thinking,
though actual applications of the CBA started much later. The United States Flood
Control Act of 1936 was probably the first major legislation to mandate CBA.
2.3 THE THEORY OF COST-BENEFIT ANALYSIS
Cost-benefit analysis can be applied to a variety of proposals, such as,
modification of equipment for a library's computer system, the purchase of a new phone
system, construction of an airport or highway, or travel to an annual conference. The
purpose of Table 2.1 is to illustrate the application of the cost-benefit formula which is
the basis of this research. Table 2.1 shows how benefit-cost analysis might be
performed and ranked. In this table, five hypothetical public programs are shown.
Total benefits and total costs are highlighted and the criteria to choose between the
programs are discussed. In interpreting the table, the use of ($000) is a notation for

thousands, and the data presented is in thousands. Costs and benefits will be defined
in another section.
Table 2.1
Benefit-Cost Analysis for proposed Library Activities (000's)
Net Benefit-Cost Program Benefit
Net B
The essence of cost-benefit principles is that public financial resources are best
allocated to those programs which benefit the community. There are two decision
criteria 1) net-benefit and 2) benefit-cost ratio. According to the net-benefit method,
total costs are subtracted from the total benefits. When the difference between benefit
and cost is greater than zero, society is better off. In the benefit cost ratio, the ratio is
computed by dividing the total benefits (B) of a program by the program's total costs
(C). If the ratio is greater than 1, then the benefits from the program exceed its costs
and the program is considered acceptable. If the ratio is less than 1, then costs exceed
benefits and the allocation of scarce resources to the program would be rejected. It
would be inefficient to support the program. The decision criterion in both net benefit
and benefit cost ratio may yield different rankings; however, they both tell you if the
project is acceptable or not.'=
The usefulness of cost-benefit analysis, for example, is in determining whether it
would be worth the public resources to purchase an automated circulation system,
rather than continue to operate a manual circulation system, for a small public library.
In this example, a library would purchase equipment and stabilize personnel cost to
increase customer service. The benefits of the new equipment and fewer staff must be
weighed against the current level of staff and against the cost of no system and more
staff. Another example might be whether a library should purchase pay telephones to
receive revenue. The analysis for this example would consist of comparing the
revenue received from the pay phones to the cost of purchasing the new phone system.
The results of a hypothetical analysis, illustrated in Table 2.1, show that the
benefits exceed the costs for all activities except for program three. In other words, the
cost-beneflt ratio is greater than 1 for all activities except for the third program. The
benefit-cost ratio of the third program is 27,000/30,000 = .09. Assuming there are not
other valid reasons for keeping this program, it should be rejected because its costs
exceed its benefits
Programs where benefits exceed costs could be ranked from the highest to
lowest benefit-cost ratio. The ranking of the programs in this example would be 2, 5, 1,
and 4. Program 2 has the highest benefit-cost ratio of all programs and the fourth
program has the lowest. Another method of ranking the projects is the net benefit,
I3Galambos, 1978, p.36.
12

which is the numeric difference between benefits and costs (B-C) (Galambos, 1978
p.36). Using this method, the rank order changes. The order of choice using this
second method is 1, 2, 4, and 5. If an administrator has ample resources, a choice
based either on net benefit or the benefitcost ratio is acceptable. Program 2 shows an
investment of $30,000, which results in three times the benefit per dollar of cost.
However, choosing between the two criteria would depend on the different costs and
benefits of the projects being compared even though In most cases the two criteria will
lead to the same conclusion. According to Gupta, the literature prefers the net benefit
approach over the ratio method."14
Cost-effectiveness analysis, like cost-benefit analysis, assumes that all costs of
a project can be calculated. The differences arise in the determination of the
denominator. Rather than using only a dollar amount, a meaningful unit of
effectiveness measure (or unit of service) is attached (e.g. the value of lives saved) to
the formula for cost-effectiveness. The utility of this kind of design is traditionally
associated with the exploration of a number of different alternatives to a desired
outcome. In cost-effective analysis, the results of a project are assumed to be
worthwhile to society. This type of analysis predicts the efficiency of different inputs or
approaches. Its primary advantage is in making a comparison among programs
achieving similar objectives within given cost restraints.15

Both cost-benefit and cost-effectiveness deal with decisions about the allocation
of scarce resources. These two approaches assume that society will compare costs
and benefits, including time and money, to maximize utility or well-being.16 One of the
distinctions of cost-benefit analysis is to determine the costs and benefits and consider
a monetary unit of measure for both. A cost-benefit analysis relates the benefits
(outcomes) of a service to the cost (inputs) of providing that service. The problem
within a government setting is the benefits tend to be social values and are not so
easily expressed in the same dollar unit as the costs.17
Cost-effectiveness is concerned with efficiency of benefits and costs. In this
method, the analyst assumes that all benefits are substitutes for each other, and
considers them all equal. By holding all of the benefits constant, the objective becomes
to choose the least expensive alternative. Cost-effectiveness evaluates the
effectiveness of ongoing public programs to ensure the efficient use of resources.
Both methods attempt to relate costs of programs to performance and to
quantify costs in dollar values. The major distinction between cost benefit and cost
effectiveness analysis is how the outcomes are quantified. Cost effectiveness
measures outcomes in a quantitative but nonmonetary unit of measure. For example,
the unit of measure might be the number of lives saved or the amount of time saved. In
a cost benefit analysis, outcomes are measured in a monetary unit. This allows for the
development of the benefit cast ratio and net benefit. The advantage to this is the
' v a n House, 1984, p. 407.
17~ancaster, 1988, p. 8.

analyst is able to make comparisons across policy areas. In contrast, cost
effectiveness would not be able to make such direct comparisons because the unit of
measure is different.
Both methods attempt to assess the desirability of alternatives. Both have the
same kinds of methodological problems in identifying and measuring costs and
benefits. Many of the problems associated with these methodologies relate to the
assumptions that must be made by the analyst. The analyst must determine cost and
benefit data, and select a discount rate which can bias the final analysis. Despite the
difficulties in conducting this type of analysis, it provides useful information about the
use of resources.
When economists speak of costs, they are considering something more
than explicit costs. Economists are concerned with full opportunity costs. The
"opportunity costs" are the costs of using resources for one purpose rather than
another. CBA refers to a specific technique for comparing the negative and positive
consequences of alternative uses of resources, including money, manpower, facilities
and preferences. The CBA method requires an analyst or evaluator to identify,
measure and compare all the measurable significant costs and desirable outcomes of
alternative programs. CBA is a method by which administrators can systematize the
selection process of alternatives by offering specific steps and decision rules. This
section outlines the main steps that are listed by Galambos (1 978). These steps are 1)
identify, 2) measure, 3) consider time, and 4) decide. Each of these steps are
discussed in detail in the following section.

2.4 A DESCRIPTION OF THE STEPS IN A COST-BENEFIT ANALYSIS1'
Public administrators must decide which services to provide, and how to allocate
these resources. Cost-benefit analysis in the public sector is concerned with
maximizing the community's welfare; therefore, the methodology and the technical
application of CBA is an important part of the analysis. Cost-benefit analysis involves
the following steps to determine whether a project is worthwhile. For the purpose of
illustration, examples from the actual analysis are used to explain each step.
1. ldentifv the costs and the benefits that will result from a project or program;
2. Measure in dollars the costs and benefits so that both costs and benefits are stated in common denominator units that can be compared with potential alternative uses of revenues;
3. Incorporate the time dimensions in the evaluation, because costs and benefits must be examined for the entire life of the project, not just for the current fiscal year.
4. Decide whether the result of the first steps vield a larae enouah social profit (net social benefits) to justify the expenditures of limited funds.lg
Public administrators make a variety of financial decisions that support program
activities. ldentifvina the costs and the benefits sounds like a relatively simple
process; however, it is often difficult to determine the actual costs and benefits.
18Galambos, 1978, pp. 36-41.
lgGalambos, 1978, pp. 36-39.

Determining which costs and benefits are relevant is very important to the analysis.
Benefits can generally be classified as real benefits. Real benefits are described as
direct and indirect as well as tangible and intangible. Direct benefits are closely related
to the main project while indirect benefits are by-products of the project. The indirect
effects are known as e~ternalities.'~
Sometimes we receive benefits or costs that nobody intended. These costs and
benefits of by-products can be priced on the market." They represent added benefits
or costs to the community as a whole. Some examples of external costs are: the
hazards to rivers when business firms pour dangerous chemicals into rivers;
construction of a convention center externalities could be identified in terms of
increased levels of sales tax, parking fees, sales at retail stores and restaurants.
These are the benefits and costs that spill over to the larger community. There are
positive and negative e~temal i t ies.~~ Examples of negative externalities for the
construction of a convention center could be increases in traffic congestion, crime and
pollution.
The various types of benefits and costs can be categorized as tangible or
intangible.23 The term "tarlgible" is applied to benefits and costs which can be priced in
the market, while intangible benefits and costs cannot. Pollution would be considered

an intangible cost. Table 2.2 is an illustration of the different types of benefits and
costs for public programs.
Tab e 2.2 lllustr i ion of P o'
IRRIGATION PROJECT
Real Direct tangible Increased farm output intangible Beautification of area
Indirect tangible Reduced soil erosion
Costs of pipes Loss of wilderness Diversion of water
EDUCATION PROJECT
Real Direct tangible Increased future earnings
intangible Enriched life
Loss of student's earnings teachers' salaries cost of buildings, books
Foregone leisure time
Indirect tangible Reduced costs of crime prevention intangible More intelligent electorate
LIBRARY PROJECT
Real Direct tangible Increased circulation output Cost of books & materials
intangible Enriched life Foregone leisure time
Indirect tangible Reduced costs of literacy programs intangible More literate community
*Source: Illustrative example from Musgrave and Musgrave, 1973, p. 142

Costs may be defined as the amount of money needed in order to provide a
service or product. The sum of all costs associated with an activity is known as total
cost. To determine total cost of a service or activity, two key cost elements are capital
costs and operational costs. Capital costs relate to the purchase of physical
infrastructure or equipment that is expected to provide benefits for several years.
"More technically, a capital expenditure can be defined as an outlay that produces
benefits ... in periods beyond the current accounting period."24 Examples of capital
expenditures are public buildings and highways, or motor vehicles and computers. The
distinction of a capital expenditure is the life of the purchase. Operational costs relate
to specific activities; examples of operational costs are personnel, materials, and
supplies that are associated with an on-going project. Indirect operational costs cannot
be related to specific activities. These costs are referred to as overhead. A local
government performs many different administrative functions that incur costs that
indirectly support program activities. If we want to know the cost of program activity, we
must include this as part of the analysis.
2.4.1 ESTIMATING COST AND BENEFITS IN DOLLARS
Step 2 is to measure in dollars the cost and benefits of the project. The problem
with estimating dollar values for a CBA is that most governmental programs do not
have corresponding market prices. There are some pricing standards for business-like
goods and services but not for social values.
24Mikesell, 1991, p. 167.
19
In a cost-benefit analysis, the dollar value of a program benefit is the sum of
both direct and indirect benefits produced by that program. Direct benefits are easier
to quantify than are indirect benefits. Examples of cost savings due to direct benefits
are lower costs through reduced supply expenses, or reduced personnel expenses or
reduced service hours. Examples of indirect items which cannot be assigned a
monetary value are the pleasure children receive from a storytelling program, value of
self-improvement received from an adult literacy program, and the value of new
knowledge received through a seminar.
Intangibles have no market comparison; however, for the purpose of conducting
a CBA, an analyst must estimate monetary values for these items. For example, a
winning football team could include the intangible benefit of renewed enthusiasm for
the home city. "Enthusiasm" is primarily a qualitative benefit and cannot be expressed
in a monetary value. The analyst must develop a value for "enthusiasm." "Since
market imperfections do exist, market prices and costs do not reflect true social values
and costs, and they must be adjusted according~y."~~ This practice is known as shadow
pricing, a pricing technique to establish social values. Establishing monetary values for
intangibles involves measuring these items as if they were bought and sold in open
markets:
The total benefit of an intangible is the maximum amount of money that users would pay in order to have its service, and the total cost of an
25Musgrave and Musgrave, 1973, p. 143.

intangible is the minimum amount that would be accepted by the bearers of the cost in order to agree willingly to bear it."
Another way of dealing with these intangible effects is to describe their nature, and
when possible, establish a minimum value of the unmeasurable effect. This allows for
some sensitivity to intangible effects within a CBA frame~ork. '~
2.4.2 INTRODUCTION OF THE TIME DIMENSION
Step 3 is the process of incomoratina a time dimension within the analysis. The
discount rate is what translates costs and benefits over time into present value^.'^ This
allows the analyst to take into account the benefits and costs that do not accrue
instantaneously, but over time. The essential feature of the net present value method is
to establish the value of money today. 'The time value of money is called a discount
rate. This concept recognizes a time preference and that one dollar today is valued
more highly than a one dollar in the future. Most investment projects involve an
immediate cost of capital and in subsequent years increase in operating costs. Returns
are small in the first few years and then increase through the expected life of the
project. The comparison of costs to benefits over time make it necessary to discount
over the life of the project. The benefits that occur later are valued less because of the
time factor. Long-term projects are less desirable than short-term projects because
"Boadway, 1984, p. 206.
27Haveman and Margolis, 1983, p. 97-98.
ZBMusgrave and Musgrave, 1973 p. 147.
2 1

distant benefits are discounted so heavily. Therefore, costs and benefits are usually
compared from year to year, and the difference summed over the life of the project.
Once time is accounted for, the economic feasibility of a project or program is
dependent on the net present benefit (discounted benefits exceeds discounted costs).2e
The purpose of the time dimension is to calculate the stream of benefits and costs over
the life of the project. This is determines the net present value of a project.30 The net
present value can be calculated using the following formulas.
Public expenditures represent a movement of resources from the private to the
public sector and a movement of resources from current consumption to investment in
future returns. The premise of assigning a discount rate or an opportunity cost is that
it is acceptable to invest in a government project only if the returns are greater than if
the same funds were left in the private sector and if the future returns are worth the
current sacrifice.
"The proponents of opportunity cost for investment argue that since government pays for its investments by taking money away from private citizens, unless the returns of these investments are at least equal to those of the private sector, it does not make any economic sense for the government to invest.'"'
The analyst must consider the value of the benefits forgone by not leaving the
money in the private sector where it would have been consumed or invested. The
assumption is that dollars removed from the private sector (consumption today) to the
=Mikesell, 1991, P. 189.
"Gupta, 1994, p. 346.
"Gupta, 1994, p. 351.

public sector (future consumption) is not the same dollar value. That is to say that a
dollar spent today is worth more than a dollar spent ten years from now. Therefore, in
order to compare current consumption to a government is future returns on investment,
we must translate these future streams of benefits and costs into their present values.32
An interest charge must be made against that dollar investment in order to compare
current values to future consumption. This is known as the discount rate.
The discount rate reflects the cost of removing a dollar from the private sector to
be used in a public sector investment. 'The discount rate should reflect a rate of return
consistent with the private sector
According to this point of view, while evaluating a public project, the analyst should take into account the opportunity of alternate investment opportunity in the private sector, and hence discount the project by a rate equal to the private rate of return. For example, suppose that the U.S. Space Agency is proposing building a new kind of space vehicle which will be able to deploy satellites with a greater degree of efficiency than the existing space shuttles. If the market is yielding 10 cents on a $1 investment, unless it can be shown that the return from this project is going to be at least 10% (i.e., the project carries a positive net present value, when discounted at lo%), the project should not be undertaken.%
The net present value discounts future net benefits to their present value. The
chosen discount rate will affect whether the net present value is greater or less than
zero. High discount rates penalize project with benefits occuring farther in the future.
Therefore, the discount rate must reflect the cost of government borrowing. The
interest rate at which the market is willing to lend money to the government is used to

determine whether to undertake a project. The discount rate selected for public sector
investment can determine the outcome of the project. The Office of Management and
Budget (1972) states its discount rate policy in the following terms:
The discount rates to be used for evaluations of programs and projects subject to the guidance of this Circular are as follows:
a. a rate of 10 percent; and, where relevant,
b. any other rate prescribed by or pursuant to law, executive order, or other relevant circular^.^
The assumption here is that the prescribed discount rate of 10 percent represents an
estimate of the average rate of return on private investment, before taxes and after
inflation. A discount rate of 10% would be considered a conservative rate, and a case
could be argued that it is too high since in 1978 interest rates were much higher than
they are today. The literature supports no single best approach in selecting a discount
rate. 'The analysis in this paper is directed toward improving the quality of the decision
process and not aimed at finding the true social discount rate.
It is important to emphasize that the choice of a discount rate influences the
decisions of a cost-benefit analysis. If the analyst uses a low discount rate, this favors
investments in the future. A high discount rate favors consumption over future
benefits. Therefore, the relative desirability of a project depends on the choice of a
discount rate.% An analyst may employ several discount rates to determine a project's
=Sassone, 1978, p. 123
%Gupta, 1994, P. 349.

PRESENT VALUE CALCULATION
NPVB = PVB - PVC
n Where: @&
i-0 (k)'
This is the formula used in subsequent calculations. Simple mathematical manipulation reveal the equivalencies. The Net Present value of the benefits can be calculated on a year by year basis.
Bi = Benefits in Year i
Ci = Costs in Year i
r = Discount Rate
n = Number of years - the life of the project
PVB = Present Value af Benefits
W C = Present Value of Cost
NWB = Net Present Value d the Benefits

sensitivity to discounting. On page 24-A outlines the calculations needed for present
valuation.
The final stacle of the analysis is to identifv whether a ~roiect is accepted or
reiected. CBA offers a two decision criteria: the benefitcost ratio (present value of
benefits divided by the present value of costs) and the net benefit (the present value of
benefits less the present value of costs). If the benefit cost ratio exceeds 1, or if the net
benefit is greater than zero, then the project passes the test of economic efficiency.%
In many cases, the use of these4wo criteria will lead to the same conclusion. However,
net benefit is the approach preferred by the economic literat~re.~'
Cost-benefit is a very important tool to assist decision-makers. It allows an
analyst to make comparisons among competing programs on the ways service is
delivered. Care should be taken in interpreting the results. Some major ethical
considerations should be made in the interpretation. Researchers must be extremely
careful in assigning cost and benefits.
Cost-benefit is an easy process to conceptualize and appreciate. The
researcher gathers all the costs of providing a good or service. If the benefits outweigh
the costs, the good or service should be continued. If the costs exceed the benefits,
the service should be terminated. In cost-effectiveness, the evaluator explores how
"Gupta, 1994, P. 355. (A more detailed discussion of the criteria for choosing a discount rate can be found in Mishan, 1976, Chapters 30-34).

results might be efficiently achieved and which costs are attached to the results for
reaching a desired outcome.
2.4.3 COST-EFFECTIVENESS ANALYSIS
In cost-effectiveness analysis, the benefits of a project are assumed to be
worthwhile and are difficult to mea~ure.~' The benefit for using cost-effectiveness is
that it integrates the results of activities with their costs in such a way that an individual
can select those activities thatprovide the best results. This method emphasizes that
both the costs and effectiveness aspects are important and must be measured.% Cost
effectiveness analysis is the prefered method when it is impossible to measure
benefits. It is used to evaluate two or more alternatives that will achieve the same
objective without measuring the benefits. It may also be used in a situation where an
objective is mandated and program termination is not a option.
Hence, the purpose of this type of analysis becomes to achieve a desired
program goal or objective at minimum costs. Cost effectiveness is an analytical
technique related to cost benefit analysis. Benefits, however, are not considered. If
the benefits of each alternative are the same, it is not necessary to give them a dollar
value. Cost-effectiveness analysis is a good substitute for cost-benefit analysis. The
38Galambos, 1978, p. 51.
"Galambos, 1978, p. 51.

costs of each alternative must be identified and measured. Then, the most efficient
alternative is se~ected.~'
There are difficulties in performing a cost-benefit analysis. It is not always a
totally objective procedure that can guarantee an evaluation free of error. Identifying
the benefits and measuring them in dollars is the most difficult part of cost-benefit
analysis. Choosing different discount rates to compute the present value of net social
benefits can drastically affect the outcome of an analysis. Placing a dollar value on
benefits can be very subjective, Inflation and other intangible items make placing dollar
amounts on future and present value difficult. When many of the important benefits are
intangible, cost-benefit analysis is probably not worthwhile. Also, if the needed
information is not available at reasonable cost within the time period in which a
decision must be made, a major cost-benefit effort is probably not a good idea.41
Politicians support cost-benefit analysis to make government decisions;
administrators view it as a way of choosing between competing alternatives in light of
declining budgets. Evaluators use it as a way of providing more complete information
to decision-makers.
The cost-effectiveness approach has a number of strengths. Most important is
that it merely requires combining cost data with the effectiveness data that should be
readily available. It's one major disadvantage is that you can compare the cost-
"Galambos, 1978, p. 77.
41Galambos, 1978, p. 75.

effectiveness ratios among alternatives only if they all have the same goaL4* For
example, it would not be possible to compare the cost-effectiveness of programs
dealing with reading and mathematics, or education versus health. Cost-effectiveness
analysis explores how results can be achieved and which costs are attached to them
for reaching different levels of the desired outcomes. The steps in cost benefit and
cost effectiveness overlap and there are also some differences. Table 2.3 ~llustrates
the similarities and differences of cost benefit and cost effectiveness analysis.
Van House (1983) feels that the field of library and information services is
appropriate for cost-benefit and cost-effectiveness analysis. Libraries have begun to
redefine their services through cost analysis. Careful planning and evaluation are
required to provide the most cost-effective programs. Local governments have a
declining tax base and ever-increasing demands for public services. Local and State
governments must make decisions that pertain to choosing among competing
alternatives. Standard evaluation approaches take into account only the effects of
alternatives, such as the number of citizens served. But, cost benefit and cost-
effectiveness analysis take account of both the costs and effects of selecting
alternatives. This makes it possible to choose the alternative that provides the best
results for any given amount of resources, or that minimizes the resources that need to
be used, for any outcome. Cost benefit and Cost-effectiveness analysis can lead to a
more efficient use of Library and Information Science resources; it can reduce the costs
of selected programs and of budget resources.
42~evin, 1983, p. 18.
28
Table 2.3 A Description of Cost Benefit and Cost Effectiveness Analysis Tect-~niques~~
Cost Benefit Analysis
Defi_nition: a tecnique for evaluating the social profitability of altemative uses of scarce resources
m: 1) Identib the costs and benefits that will result from a program or projed 2) Measure in dollars those costs and benefits 3) Incorporate the time dimension in the evaluation, because costs and benefits must be examined for the entire life of the project 4) Decide whether the results of the first three steps yields a large enough social profit to justify the expenditure of limited funds.
Advantaaes:
1) Assists decision makers in making decisions by providing better information 2) Helpful in deciding which major projects to under take 3) Helpful in analyzing recuning similar projects 4) Can determine whether or not alternative projects are socially profitable
Disadvantaoes:
1) Hard to identify all relevant costs and benefits 2) Erroneously including "transfers" that are not real costs or benefits 3) Hard to place dollar values on certain beneftts and costs 4) impossible to convert some costs and benefits into dollar values (intangibles) 5) Hard to identify the proper discount rate 6) Considerable time, costs and expertise usually required to do a cost-benefit analysis 7) Some decisions have to be subjective
Definitions: used to evaluate two or more alternatives that will achieve the same objective without measuring the benefits
Steps: 1) ldentifv the costs of each altemative 2) Measure the costs of each alternative 3) Incorporate the in the evaluation, because costs and benefits must be examined for the entire life of the project 4) Decide which alternative has the lowest cost
Advantages:
1) Assist decision makers in making deusions by providing better information 2) Much easier than a cost-benefrt analysis because it does not require the measurement of benerib 3) Require less time, effort and expertise
Disadvantaaes:
1) Cannot tell whether or not alternatives are socially prolitable 2) Assessment of additional alternatives requires analysis of additional functions and costs 3) Costeffectiveness analysis is valid only if alternatives under consideration have the same objective and identical outputs 4) Frequently hard to define "outpur' 5) If it is not possible to identify all costs in dollars, subjective decisions may still have to be made 6) If alternatives are compared whose time &earns are not all the same, determining the lowest cost alternative will involve choosing a discount rate and computing the present value of the altemative
Cost Effectiveness Analysis
43 Cowan, T., 1993, p. 33
CHAPTER Ill
THE ORGANIZATIONAL FRAMEWORK OF THE PUBLIC LIBRARY
3.1 NATIONAL PERSPECTIVE
The American Library Association defines a public library as:
Any library which provides general library services without charge to all residents of a given community, district, or region. Supported by public or private funds, the public library makes its basic collections and basic services available to the population of its legal service area without charges. Products and services beyond the library's basic services may or may not be provided to the public at large and may or may not be provided without individual charges."
As to organizational framework, the public library functions as a firm, a firm that
is financed primarily through local tax dollars. This firm offers a variety of services to
the people of a particular community. The firm usually defines a geographical area that
it serves. This area is the firm's legal jurisdiction and it is.able to provide its services
based on the taxes collected by that jurisdiction. Most public libraries operate many
sites, a central branch with one or more branch units.
In 1993, the nation's largest public library, the New York Public Library,
operated 760 libraries. California, the most populous state in the country, has only 168
libraries, while Iowa has 500. The typical library in the United States is categorized as
a small library, serving populations of less than 25,000. In aggregate they employ 108,
44ALA, Glossary, 1993, p. 181.
30
246 paid staff members, expend about 4.1 million dollars and circulate 1.4 billion items
ann~ally."~
According to the 1993 Statewide Public Library Statistics, there were 499 tax
supported public libraries operating in Texas. In total, these libraries expended
approximately 172 million dollars on their operations. They undertook almost 71 million
transactions of library material. The largest public library in the state is the Houston
Public Library, which in fiscal 1993 spent almost 30 million dollars on its operations and
had transactions totalling slightly over 8 million. The Central Texas Library System
(CTLS) serves a population of one million, expended about 15 million dollars and
circulated over 6 million items in the same time period. System supported libraries in
the state are identified in Table 3.1 .46
3.2 PUBLIC LIBRARY DEVELOPMENT IN TEXAS^^
The Library Systems Act, adopted in 1969, enabled the Texas State Library and
Archives Commission, acting through the Texas State Library, to establish a state
library system consisting of a network of public library systems, related by contract, to
the State. While the Act enabled the Commission to encourage and assist in the
establishment of individual public libraries, the commission is not authorized or
46Texas Public Library Statistics for 1993, Austin, Texas: Texas State Library Library Development Division, 1994.
47The references from this section were taken from the Texas State Library Svstem Historv, Library Development Division, October, 1988.

Austin Bartlett Bastrop Belton Blanco Brenham Bryan Buda Buffalo Burnet Caldwell Cameron Cedar Park Copperas Cove Dripping Springs Elgin Fairfield Florence Gatesville Georgetown
CTLS MEMBER LIBRARIES
Giddings Groesbeck Hamilton Harker Heights Hearne Hewitt Hills boro Johnson City Jonestown Killeen Kyle La Grange Lake Travis Lampasas Leander Llano Lockhart Luling Madisonville Marlin
McGregor Mexia Mount Calm Navasota PflugerviUe Rockdale Round Rock Salado San Marcos San Saba Schulenburg Srnithville Taylor Teague Temple Wac0 West Westbank Whitney Wmberley

required to establish such libraries itself. The commission is only authorized to bring
existing public libraries together in a system formed to improve statewide library service
and to serve, collectively, the entire population of the state. To accomplish this, the Act
authorized the Commission to divide the state into geographical regions, each including
at least 4,000 square miles, and to designate a large public library in each region as a
Mqjor Resource Center (MRC).
The Commission was also authorized to establish standards as a prerequisite for
system membership, with membership being on a voluntary basis. Within each region,
the libraries which applied for membership and met accreditation standards were
attached to the regional MRC for system services. These services were funded and
provided through contracts made between the MRC's municipal government and the
State Library.
Public libraries depend almost entirely on local support, most of which comes
from city or county governing bodies through appropriation of local public funds.
Historically, local government has been very reluctant to appropriate funds for library
support in Texas, and this has substantially hindered library development at the local
level. To accomplish its objective of improving statewide library service through a state
system, the Commission first had to encourage increased local library support. This
was done with a carrot and a stick technique. Local support efforts were necessary to
meet system membership accreditation standards, but membership also provided
services which, in many cases, could not be afforded at the local level.

In fiscal year (FY) 1983, 79% of the public libraries reporting to the Texas State
Library had qualified for and accepted state system membership. By FY 1991, this
figure had risen to 90% of the libraries reporting. During these eight years, the total
number of public libraries increased from 428 to 471, or 10%. At the same time, the
number of libraries qualifying for membership increased 25%, from 338 to 447. This
suggests that system services are successful in improving the local libraries' services.
3.2.1 HOW PUBLIC LIBRARIES ARE ESTABLISHED IN TEXAS4'
Many of the public libraries in Texas were formally established by women's
clubs, then later formally and legally established as municipal public libraries, county
free libraries, or libraries operated by nonprofit corporations but open to the public.
Here is a brief summary concerned with the manner in which public libraries are legally
established.
Local Government Code Section 315.005 (VTCA) enables city governing bodies
to establish municipal public libraries. Adopted in 1874, this article is brief, broad, and
permissive, allowing city government great latitude in the manner of library
establishment. Local Government Code Sections 323.001 through 323.013 enables
county commissioners' courts to establish county free libraries, to join with other cities
and/or counties to provide library services, and to contract for library services with
48The references cited here may be found by their section numbers in Vernon's Texas Code Annotated (VTCA) or Vernon's Annotated Civil Statutes (VACS).

already established libraries such as those operated by non-profit corporations, cities,
or other counties.
Privately funded libraries open to the public may be established under the
provisions of Article 1396, VACS, the Texas Non-Profit Corporation Act. A library
established under the Texas Non-Profit Corporation Act must receive its financial
support in whole or in part from public funds and be freely open to all persons to be
designated as a "public library." Under the provisions of Article 441 13 (32C), VACS,
the Texas Interlocal Cooperative Act, cities and counties may also make agreements or
contracts concerning library services, while both libraries continue to operate
independently.
Under the authority given by the Library Systems Act (government code
441.121 ) through 441.138, VTCA), the State Library and Archives Commission adopts
Rules for Administrating the Library Systems Act which establishes policy for the Texas
Library System. These include standards which public libraries must attain to qualify
for system membership. The issues that pertain to qualifying standards are annual per
capita expenditures, library collections size, staffing, and hours of operation. These
four standards are scaled according to the size of the population which the library
serves.
The State Library Commission's policy has been to grant membership to
individual public libraries, to consolidated library systems as systems, and to federated
library systems as systems. Therefore, when we speak of a state system "member," it
can denote one of three categories, an individual library, a consolidated local system,
or a federated local system. This difference identifies the type of governing authority in
which the library operates. The individual library and the consolidated system operate
under one local governing body, while the federated system does not. In addition, the
Major Resource Center (MRC) provides service to the main library of a consolidated
system, not to its branches, but service is given directly to each member of a federated
system.
To test the viability of the system concept, the Texas State Library awarded
$1.8 million in Federal Library Services and Construction Act Title I funds to ten
regional systems in FY 1975. In that year 233 public libraries serving 83.3 percent of
the State's population participated in system programs. Then in FY 1976, the system
received the first meaningful state appropriation in the amount of $1.08 million.
Together with the federal appropriation for that year of $1.7 million, the system
expanded their programs. The number of member libraries participating in the system
increased to 247 with 86% percent of the state's population residing in communities
served by member libraries.
System funding continued to grow through the rest of that decade and the early
80's, the total funding remained a constant $3.92 million which included state funding of
$2,092, 764. In 1984, the systems began a period of cost reduction. Faced with high
inflationary increases in materials, operating costs, and staff salaries, the development
of new programs was halted. Systems began cutting back, limiting their costs, and
sharing cost where possible. This began a series of reduced levels of funding starting
with a 3.2% percent reduction in state funding and then in federal funding. The State

Library and Archives Commission receives funds for operation of the Texas System
operation from both state and federal sources. After the expenses of the State Library
itself have been met, the Library Systems Act requires that remaining state funds be
allocated to the ten regional systems, with 25% being divided equally among the
regions and with the other 75% being apportioned on a per capita basis. Available
federal funds are allocated on a similar basis. The State Library informs each MRC of
the approximate amount of funds which that MRC can anticipate for the coming state
fiscal year, which begins September 1. With this as general guide, the MRC, with
advice from its advisory council and regional system membership, updates its long-
range plan of service and prepares a detailed proposed annual plan of service and
budget estimate. When this has been approved by the State Library, it acts for the
Commission to contract with the MRC's municipality to provide the services in question.
3.2.3 CRITERIA FOR MEMBERSHIP IN CENTRAL 'TEXAS LIBRARY SYSTEM 49
The Library Systems Act assumes that a local community must give reasonable
support to their library before the library can receive the benefits of System
membership. Criteria for membership in CTLS is found in the current edition of Texas
Librarv Svstems Act and Rules for Administerina the Act, published by the State
Library. A library may apply for membership at the time it sends its annual report to the
State Library. The State Library evaluates the application on the basis of the
4BThe references for this section were taken from working document provided by CTLS office to its members.

information supplied in the annual report. Membership becomes effective on
September 1 of the next state fiscal year. Current members must continue to meet the
criteria in order to maintain membership.
Rule 1.72 The library must provide services on a free and equitable basis to the public in its tax supported area.
Rule 1.73 The library must be legally established as department of the city or county government by character, resolution, or ordinance; or must be chartered as a non-profit corporation; or by contract as provided for by the Interlocal Cooperation Act.
Rule 1.74 The library must maintain local effort annually by maintaining or increasing local operating expenditures or per capita local operating expenditures.
Rule 1.75 The library must have a non-discrimination statement on file with the State Library.
Rule 1.77 At least 50% of the annual local operating expenditures required to meet the minimum level of per capita support for accreditation (see table 3.5 ) must be from local tax sources. A public library that expends at least $10.00 per capita is exempt from this membership criteria if it shows evidence of some library expenditures from local tax sources and is either established by the city or county government or is under contract to the city or county government as a public library freely open to citizens under identical conditions.
Rule 1.78 If a library receives county funds, the librarian must have a county librarian's certificate.
Rule 1.83 The library must have a telephone with a listed number.
Rule 1.85 The library must file an annual report with the State Library.
Rule 1.81 Depending on the population the library serves, it must meet the following additional criteria.

Table 3.5 Criteria for Membership" 51
PER CAPITA SUPPORT
HOURS OF MATERIAL
COLLECTION POPULATION ACCESS STAFF
200,001 8 over
I item per capita or expend 25% of budget on library
64 hours 6 professional librarians per week and I additional for
every 50,000 or more persons
1 item per capita or expend 25% of budget on library
54 hours 4 professional librarians per week and I additional for
every 50,000 or more persons
I item per capita or expend 25% of budget on library
48 hours 2 professional librarians per week or more
I item per capita or expend 25% of budget on library
40 hours 1 professional librarians per week or more
1 item per capita or expend 25% of budget on library
40 hours 1 professional librarians per week (full time) or more
$1.20 or $5000 whichever greater
1 item per capita or expend 25% of budget on library
20 hours 1 head professional per week librarian at least 20 or more hours per week
v h e State Library defines a "professional librarian" as one holding an ALA accredited fifth year degree in librarianship or a master's degree from an ALA-accredited program.
51The population served by the library is determined by the State Library
38

3.3 ORGANIZATION OF CENTRAL TEXAS LIBRARY SYSTEM (CTLS)
The Central Texas Library System is composed of 60 autonomous public
libraries serving 1.7 million persons in 30 central Texas counties. The System is
organized by the Texas Librarv Svstems Acts and the Rules for Administerinn the
Librarv System Act, published by the State Library, and the System's own bylaws. It is
funded by the State Library and the Federal Library Services and Construction Act.
Membership is open to all public libraries which meet the minimum criteria stated in the
Texas Librarv Svstems Act and the Rules for Administerinn the Librarv Svstems Act.
The State Library has designated the Austin Public Library as the Major Resource
Center Library for central Texas. The State Library contracts annually with the Austin
Public Library to operate the Central Texas Library System. Table 3.6 is an illustration
of the system libraries in the Central Texas area. The System staff is composed of five
professional librarians, a business manager, an administrative aide, a media assistant,
and an account clerk.
COLLECTION DEVELOPMENT ALLOCATION FORMULA
The collection development formula for the Central Texas Library System
member libraries was adopted in 1992 after extensive consultation with the entire
membership. One third of the total allotment for collection development is allocated to
the member libraries as an equal base grant. This third is divided by the total number
of member libraries, so that each library gets the same amount from this third. One-
third of the total allotment for collection development is a variable grant based on the

size of the population served by a member library. The total population served by
CTLS member libraries is added and the percentage each library serves is computed.
The percentage of population served is then multiplied by a third of the collection
development allocation to give a population amount. One third of the total allotment for
collection development is allocated to the member libraries based on the amount of
local spending for collection development of a member library. The total amount of
local collection development expenditures of all member libraries is determined and the
percentage each library spends is calculated. The population percentage is multiplied
by one-third of the collection development allocation to give a local collection
development amount. In addition to this formula, a set of conditions were imposed on
libraries which, if not met, could result in the loss of a portion of the collection
development allocation.
3.3.1 SYSTEM GOALS AND PLANNING
The goal of CTLS is to strengthen library services and to equalize access to
information for all Central Texas residents by encouraging cooperative efforts among
members and by providing services which would be too expensive or too time
consuming for local libraries to furnish on their own. All System services are provided
to develop stranger local libraries, to encourage local governing bodies to give better
support to their libraries, to promote cooperative library efforts and to cross political
subdivisions. CTLS members adopted a long range plan in 1993 which specified
strategies for System services for the next five years. That plan is now being reviewed
by the Long Range Planning Committee, and a revised plan will be published in August
of 1996. The CTLS staff develops the Biennial Budget and annual Plan of Service
under the direction of the System members and lay representatives. Services change
as the needs of member libraries and their users change. The following are the
services offered to all System members during the current fiscal year.
Automation and Cooperation
On-site consultations are provided to assist librarians who are planning to share
resources with other libraries or to automate their own libraries. Telephone
consultation on computer and software questions is also available. The primary means
for sharing resources is CaTaLySt, the CTLS Union Catalog, a CD-ROM catalog begun
in 1990. CaTaLySt contains the holdings of 31 members, representing about 80% of
the 1.3 million holdings of CTLS members. As of 1995, 55 members and branches
have a CaTaLySt installation. The System also provides three retrospective
conversion units so that members can convert their paper catalog records into a
machine-readable form, both to add to CaTaLySt and to prepare for a local automated
system.
Consulting Services
The three consultants and the coordinator maintain competencies in specific
areas: youth services, collection management, library automation, and library
management and planning. Assistance on other topics is also available from System

staff. On-site consultation visits are available upon request. Members may also use a
toll free number to contact the consultants or the System Office.
Collection Development
The System provides an allocation to each member to purchase books, audio
tapes, compact disks, and videotapes. This allocation is determined in part by the
amount of local funds spent on materials; it is intended to encourage local governments
to increase library support and not to take the place of local funding. Because CTLS
purchases several hundred thousand dollars of materials each year, members receive
larger discounts than would be available to them individually. Consulting staff will
assist a library's staff in evaluating their collection and services for specific user
groups, and they will provide bibliographies for enhancing the collection.
Media Services
Approximately 6,000 16mm films and VHS videocassettes are available to
System libraries and their patrons from the CTLS Media program. Items may be
reserved by mail, fax, or telephone a least two weeks prior to show date. Films and
videocassette have public performance rights and may be used for library programs
and by groups and individuals in the community. Under a reciprocal borrowing
agreement between CTLS and the North Texas Regional Library System (Fort Worth)
and the North East Texas Library System (Garland), CTLS libraries also have assess to

those systems' collections of films and videos. The Media Librarian consults on film
and video programming for all groups and age levels.
Continuing Education
Continuing Education is a high priority among System members. More than 25
on-site, on-demand workshops on topics of greatest interest to members, such as
automation or weeding of dated material on book shelves, are provided each year.
One or two large-scale workshops on topics of general interest, such as the Summer
Reading Program, are also offered. The System office maintains a small callection of
library science materials. Self-instructional materials for staff development are also
available from the CTLS Media Collection.
Publicity
Publicity materials that support the statewide Summer Reading Program, such
as individual flyers, are provided to each member library. A prize, such as a
refrigerator magnet, is provided for children who complete the program.
Services to the Visually Impaired and Elderly
Rotating packets of approximately forty large print books are provided to
supplement local library collections. A deposit collection of large print books is
available for periods of up to three months.

lnterlibrary Loan
lnterlibrary Loan (ILL) is a resource sharing program. ILL is a library-to-library
lending and borrowing program. During the past 20 years, this library to library sharing
has become an essential service as the cost of books and other library materials have
made self-collections a financial impossibility even for the largest libraries. All types of
materials can be obtained through interlibrary loan, although the vast majority of the
materials lent and borrowed are either books or photocopies of periodical articles.
During the last year, over 7 million interlibrary loans were processed among libraries in
the United States. Through interlibrary loan, the smallest, most remote library can
provide the same access to its library users as a large metropolitan library can.
Parallel with the growth in interlibrary loan activity has been the development of
a resources sharing network to encourage and facilitate ILL services. One such
network is the Texas Resource Sharing Network, which offers a program of interlibrary
loan services to Texas public, special, and limited a number of academic libraries. Ten
regional Interlibrary Loan Referral Centers contract with the Texas State Library to
offer interlibrary services. These centers operate out of large public libraries
throughout the state. Funding for these services comes from a state grant which is
comprised of LSCA funds. These funds have made it possible for interlibrary loan to be
provided at no charge to borrowing libraries. The System contract calls for the Austin
lnterlibrary Loan Centers to handle 49,500 transactions and to fill 17,800 loans from its
collections annually.

3.3.2 GRANT PROGRAM REQUIREMENTS
Maintenance of Local Support Requirement
To receive the population and local support grants, the member library must
have spent a least as much of its local funds on collection development in the previous
fiscal year as it would receive in System grants for population and for local support.
This requirement is intended to help members persuade local funding sources to
provide at least a minimal level of support and to discourage them from reducing
support. Current CTLS members will have until FY 1996 to meet this requirement, and
new CTLS members must meet this requirement by the beginning of their first year of
System membership.
Continuing EducationlSvstem Participation Reauirement
A monthly newsletter keeps librarians and supporters informed of System
activities, as well as state and national news about libraries. Members are encouraged
to contribute information about their special events and projects, staff vacancies, or
about materials they wish to sell or donate. System membership meetings are held
each fall and winter. In addition to transacting System business, such as selecting
Advisory Council members, there are usually opportunities for continuing education,
such as Lay Representative orientation or a grant-writing workshop. System members
believe that a library's staff must take advantage of continuing education opportunities
in order to provide high-quality service to their patrons. Participation in System
meetings by the librarian and lay representative(s) re is necessary to provide informed

direction to the System and to engender cooperation among System members. To
encourage such participation and to help persuade local governing authorities of its
importance, a library is required to send a representative to each of three specific types
of CTLS-approved events during the preceding year to receive the entire amount of the
population, local support, and base grants for which it is eligible. If the library attends
only two events, each of its grants will be reduced by one-third. If the library attends
only one event, each of its grants will be reduced by two-thirds. The library receives no
grant if it fails to attend any events. The three types of events and the representatives
who must attend are:
1. The head librarian must attend annually one CTLS general membership meeting, regional meeting, Advisory Council, or CTLS committee meeting.
2. Any library staff member must annually attend one CTLS-sponsored continuing education event.
3. Any representative of the member library must annually attend one event from the following list:
a. CTLS membership, regional, or Advisory Council meeting b. CTLS committee meetings such as the Planning, Media,
Collection Development, or any other standing or ad hoc committee created by the Advisory Council.
c. CTLS sponsored or co-sponsored workshops d. Texas State Library sponsored workshops e. Continuing education events sponsored by an ALA accredited
school of library science f. Workshops sponsored by another Texas library program g. Small Community Library Network meetings
Any library may appeal to the Advisory Council at is meeting prior to the Fall
Membership meeting for a waiver to the continuing education1System participation

requirement due to extenuating circumstances. The Advisory Council will make the
final decision whether sufficient cause exists to grant a wavier from this requirement of
the Collection Development Grant Allocation Policy.
3.3.3 TAYLOR PUBLIC LIBRARY5'
The Taylor Public Library serves the community of Taylor, Texas which is
located in southeast Williamson County about 34 miles northeast of Austin. The city is
a farming and light industrial community with a population of 11,472. The population is
growing slowly but steadily; the 1970 population was 9,616, and the 1980 population
was 10,619. According to the Texas Data Center, Taylor's projected population for
1995 is 11,971.
The Taylor Public Library, which has been providing library services longer than
any other public library in Williamson County, has always had strong community
support. The original library building and the building extensions were constructed
through fundraising efforts of the community with matching federal grants. The original
library building consisted of 2170 square feet of floor space and the two additions
added 6845 square feet. The second addition was completed in 1990; now the library
operates 9,015 square feet of building.
The library has an annual budget allocation from the city of $95,183. There is a
building fund of $1 9,338 for facility improvements and $1,833 for books. These two
52The reference for this section was provided by the Taylor Public Library and Bob Gaines CTLS automation consultant

funds are supported through donations, trusts and memorial gifts and fund raising
projects sponsored by the Friends of the Taylor Public Library. The group currently has
about 250 members. This is a volunteer group of community individuals who assist the
library with not only fundraising activities, but also by volunteering their time in the
library. The Friends coordinate the annual book sale and fund drive, in addition to the
Summer Reading Program, "Children's Story Time".
The library recently extended their hours and is now open a total of 44 hours a
week. The library collection contains 32,951 books, over 1,000 paperbacks, and 100
audio books on tape. The library has 4393 registered card holders, and circulation
averages about 30,000 items annually. The staff consists of a library director, three
assistant librarians and a library aide. The goals of the Taylor Public Library are to
provide materials and services to support the informational, educational, and
recreational needs of its citizens.
3.3 LIBRARY AUTOMATION SETTING
Before the study proceeds any further, a brief discussion on the history of library
automation and information is pertinent. Since the term "library automation" can
connote a wide range of ideas and images, it would be useful at this point to discuss
what library automation is, where it has been and where it is now. Included under
this umbrella are related technologies such as micrographics, video, facsimile
transmission, and telecommunications.
The library community has long been interested in the application of computers
to library functions. In the 1950's there were few attempts to use computers in libraries.
The mainframe computers of this period made almost all computer applications
unfeasible for small public libraries. During the 1960's, interest in using computers in
library settings continued to grow. Most of the automation efforts of this period involved
processes such as acquisitions, catalog and production, printed book catalogs and
circulation control. Most systems were locally developed and invariably involved batch
p r~cess ing .~~
Typically, large academic and public libraries experimented with these systems
with indifferent success. Few small public libraries ever considered the possibility. By
the 1970's the third generation computer technology began to exert its influence upon
daily life on many levels and libraries were anxious to take the plunge into library
automation. The three most influential factors making automation so much more
attractive and feasible in the 1970's were 1) improved technology i. e., interactive
systems, 2) improved communication systems that allowed on-line interactive systems
to transcend great distances and 3) acceptance by the library community of a machine
readable bibliographic record (the MARC format) as the standard for communicating
bibliographic data. These three factors working in combination encouraged, aided, and
abetted a tremendous growth in the application of computer technology to library
53~ierrnan, 1982, p. 2
54Bierman, 1982, pp. 2-7
The focus of library automation changed from the individually operated system of
the 60's to the cooperative networks of the 70's. The improved micro computer and
communications technologies allowed both high development and operational costs of
sophisticated library systems to be shared by many users. The major contributing
factor of automation was the freeing of staff from many repetitive, labor intensive tasks.
Computerization of libraries has given patrons throughout the world access to
thousands of holdings, permitted the rapid transmission of information, and allowed
interlibrary loan libraries to develop, access and share indexes and files with other
information providers. Technology has completely altered previous held concepts
regarding storage, retrieval and delivery of library and information servicess5. This
process has evolved to such a degree that it is being considered by small public
libraries. Automation has become more accessible and economically feasible to a wide
range of smaller libraries. It is a tool small public libraries may use for these purposes:
for extending to the administrator control over hislher work, improving the quality of
service, and by offering a wide range of services to the public.
The circulation transaction is a lending operation, rather than a transfer of
ownership operation. Materials charged out are expected to be returned to the library
in good condition and in a timely manner. From the viewpoint of a data processing
professional, circulation is somewhat similar to inventory control. Registration, charge
and discharge, and overdue procedures are so cumbersome in many small public
libraries that they are a constant source of public and staff dissatisfaction. This type of
"Sager, 1989, p.203
50

activity handled on a online circulation system can provide instant information on the
status of patrons and materials. The system would be able to automatically generate a
variety of reports for management inf~rmation.~~ An automated circulation system
controls two majors problem categories: recording-keeping, and materials flow. Bad
recording-keeping is the number one problem for most small libraries. Record-keeping
problems encompass the maintenance of and access to patron records; bibliographic
records; loan records of overdue, fines and other delinquencies; and statistical records.
Materials flow problems are related to the physical movement of library materials out of
or into the library. The single largest task that faces small libraries is the record
keeping involved in the initial transaction of notifying overdue patrons of delinquent
fees in any of several respects. Online circulation systems would automate this
function and would be able to provide much more detailed management information.
Kantor stated that short range automation techniques, applied to library operations,
may produce substantial savings in time and effort, effect improvements in control, and
suggest the reallocation of personnel and funds. They affect, as the intermediate
outputs, the technical and management services of a library. The effects on service
delivered to the user is likely to be improved quality rather than changes of cost or
quantity."
Cost benefit analysis has been applied to some aspects of the library's
operations. It has been used to either justify the continued existence of a library
'%ager, 1989, p. 205.
57Kantor, 1981, p. 40.

service or as a framework for choosing between major library investment alternatives.
"Policy making research is imperative for public library practitioner^."^' The need for
this type of research is growing because of the dynamic changes that are associated
with the information age. As knowledge has broadened and as society's needs
change, public libraries have taken on new jobs. All agencies will have to compete for
resources at every level. Public libraries are making institutional shifts and must find
income for those shift, i.e., electronic access.5B To present viable policy alternatives,
policy makers need to know the costs of new programs. Libraries are expected to
develop benefit cost ratios for library expendit~res.~' The following discussion will
center around how libraries have used the application of cost benefit analysis to library
functions. These studies are an attempt to demonstrate that the benefits derived from
a service are worth the cost of providing the service. In conducting a cost benefit
analysis, the object is to compare inputs (costs) and outputs (benefits) in monetary
terms. There are three categories of costs which must be considered in automating a
library system; 1) direct costs, which are determined and applied directly toward the
purchase and operation of the automation system, 2) indirect costs, termed overhead,
and 3) fixed costs, which are proportional to the volume of work done by the system.
Assigning them an equivalent quantifiable weight as part of the analysis is a method
used by most studies reviewed.
=Halt, 1991, p. 5
59Holt, 1991, p. 13.
60Holt, 1991, p. 19

A major issue in a number of studies that have used cost-benefit analysis was
the value of time and the unit of time. Some these studies have utilized cost-
effectiveness and cost benefit analysis methodology in the costing of a reference
transaction. In one study, Paul Kantor developed an hourly cost of $10.80 per
reference tran~action.~' Such studies depicted "reference" as expensive and exposed
the activity for reduction.* A disadvantage in using this type of hourlylyearly
methodology was that it accounted for more than just the reference activity. Secondly,
it provided benefits for libraries with a large volume and penalized the library with a
lower volume. Murfin maintains that in order to accurately reflect a true cost to an
activity, it is necessary to (1) decide the areas of cost that should be included, and (2)
determine the different output and costs allocated to each output, (3) determine a
methodology for measuring these e~ements.'~
In the evolving electronic age, the way public libraries do business is changing.
The need to access information and the advancement of technology to provide that
need has changed how we look at libraries in the community. As libraries change from
a provider of materials to a provider of information they begin to compete with other
information services offered by the marketa There are several constraints which
libraries must confront in the forseeable future; one will be the demand for greater

accountability for funding decisions. Research that directly supports decision making is
a essential for the continued development of library and information services.B5 The
literature emphasized the importance of libraries to be able to analyze their own
operations and to present themselves as competitive players for public funds. Libraries
in general are still 85% percent locally funded and compete for support funds with other
public services (i.e. parks, police, and fire). Cost-benefit analysis becomes a tool by
which libraries can evaluate library operations to compete for local funds.
The problem of applying a cost benefit analysis within a library setting is that the
benefits of information services tend to be intangible and not so easily expressed in
the same dollar unit as the cost.66 The studies that used cost benefit analysis with
varying degrees of success could not develop a single method to determine the
monetary value of different outputs. The time methodology developed by Kantor was
used in other studies because it was considered the best available method." In
addition to methods of costing by the hour and by the minute, another method was
developed, known as a task analysis. This method based the cast of time on the actual
time of the task, not a block of time, which is similar to the hourly methodology, except
that the calcuation was based on wages per minute. This method was used by Weech

in a study at the Los Angles Public Library and Beverly Hills Library resulting in a much
smaller cost figure."
The difficulty is in determining what costs to include and what costs not to
include. According to Rothstein, costs can appear more costly when it is assumed that
all costs went into one activity (i.e. reference transaction). This overstates costs
because a good part of the personnel time was devoted to other outputs. The
estimates of wst need to reflect real cost that relate to the activity.
An important issue raised by the literature is that collection size is a better
explanatory variable for a library budget than is service delivery. This reflects an
historic view of the library as a collection of books. Libraries that continue to be funded
on this assumption will find it hard to maintain their budget levels as the nature of
service changes. Public libraries need to make a paradigm shift in the way they do
business. The addition of computer technology changes the library environment and
libraries must adapt in order to compete in this changing world. Libraries will have a
new role in this information age of technology, one that enables the public to learn how
to use information technology within a library.
In the past twenty years, this nation has invested trillions of dollars in computers
and communication technology, and we continue to see increases in productivity.
Libraries will continue to invest in new technology so staff and patrons have access to
current databases. Public libraries that do not invest in technology risk limiting future
options.
"Murfin, 1993, p. 5

Almost thirty years ago, Baumo emphasized the importance of library staff in the
delivery of library services and argued that the possibilities for improved labor
productivity are extremely limited. He further argues that library costs will rise relative
to averge cost increases in the economy. The possibility for improved labor
productivity depends critically on the possibility of introducing labor-saving innovations
in library technology. Thirty years later, automation of library services is still the
answer for libraries. It is clear that there are automation techniques which are
applicable to certain functions of library operations, in particular cataloging and
circulation procedures. Other parts of library service, for example reference, depend
more on personnel service by librarians and are therefore more difficult to automate.
For small libraries with annual transactions that exceed 30,000, the limitations of
the typical manual system become increasingly evident. The preparation of overdue
notices is a time consuming task. In this type of system, files must be searched
manually and notices either typed or written out. Another time consuming task is filing.
For example, if a library circulated 200 items on a extremely busy day, the staff knew
that half of the next day would be devoted to filing. Usually, two people are needed to
file previous day's book cards, which are separated into a number of categories. For
example, children's fiction is separated from children's nonfiction. Using automated
circulation, the library's filing is eliminated and over due notices are mailed within 10
days rather than after four weeks. Fines are calculated automatically. Other benefits
include: records show borrower's statistics, reservation of materials occurs
automatically, delinquent borrowers are identified promptly and inquiries about the

status of a particular item may be answered without a manual search.
The ease of automation reduces time consuming clerical routines in order that
staff may provide better service and exert greater control over the collection. In most
cases, it has been determined that an automated circulation system would reduce staff
by three or four full-time persons, an annual savings of between $45,000 - $100,000.
In a comparative costs analysis of an automation system, Washington State University
indicated that the automated system was about 20% percent less costly than a manual
system.eg In a manual circulation system, the borrower fills out a card, the card is filled
and recalled when the material is returned. Books and cards are then matched to be
shelved at a later date. A computer based circulation system performs similar functions
as the manual system, but with substantially less effort. When a item is checked out, a
computer creates a readable book card, and the borrower's card is read by machine.
The computer creates a computerized record of the item. When the item is returned,
the information is again entered into the computer. The computer can match returns
with check outs, identify overdue materials, and print overdue notices using information
in a computer file on borrowers.
The capability of the computer-based system exceeds that of the manual
system. The computer can check the borrower's card against a list of borrowers with
overdue materials. An item can be placed on reserve with the assurance that item is
retrievable. Request for items from other libraries can be honored. The advantage of
an on line system is that it is able to give rapid credit checks and updates the loan file
immediately. As the costs of small computers fall, the on-line circulation control
systems are likely to become important.
Computer-based circulation control can produce very specific information about
circulation as a by-product. Materials can be categorized by subject, level, and topic,
making information more accessible for customer requests. Information on the kinds of
items inventoried; can be used to evaluate acquisistions and polices; for example,
multiple copies, length of loan period, damaged and lost materials.
3.4 GOALS FOR THE AUTOMATION PROJECT
In order to better meet patron's needs, the library is planning to change from a
manual system of performing routine library functions to an automated system of
managing these tasks, thus providing better access to the collection and freeing staff
time for other services. This automation project will include three functions: cataloging,
circulation, and the public access catalog. The automation process will be
accomplished through following steps: I) weeding of dated material and an inventory of
the library collection, 2) clean up of the shelf list, 3) reviewing and rewriting policies, 4)
conversion of the library's record to MARC format, 5) barcoding the collection, 6)
selecting and purchasing library automation software and hardware, 7) installing
equipment and staff training, and 8) introduction of the new service to the community.
Depending upon the efficiency of current operations, automation may offer
opportunities for substantial cost savings for the Taylor Public Library.

The initial planning began by examining the library's needs. The objective was
to identify the costs and benefits of an automation system that would free staff time for
better patron service. Staff members from the Central Texas Library System (CTLS)
and the Texas State Library participated in the planning and implementation of the
automation project. As part of the planning process, site visits were made by the staff
and interested library board members. The purpose of the site visits were to view
installed automated systems similar to one that would be suitable for the Taylor Public
Library.
The Central Texas Library System will help with the data conversion process.
Data conversion will be done in house by library staff. CTLS will furnished a CD-ROM
to match with Taylor Public Library's record. Staff training for weeding the collection
and the conversion process will be provided by CTLS; the only data conversion costs
will be for staff time. Worksheets developed by Bob Gaines, the automation consultant
for CTLS, and its members were used to determined the number of hours needed for
weeding, inventory and cleaning up the shelf list at 1555 hours. The worksheets are
attached in Appendix A.

CHAPTER IV
ANALYSIS
4.1 METHOD
The Central Texas Area is expected to add 600,000 new residents in the next
twenty years. This will increase library services dramatically. Small public libraries in
this area can only meet the demand for services by increasing labor or automation. The
assumption is that an automated circulation system for libraries would cost less than a
manual circulation system and provide more benefits per dollar spent. This chapter
compares the benefits and costs of a manual circulation system with that of an
automated circulation system.
Based on the theoretical discussions of cost-benefit analysis, those theories are
used to determine which circulation system should be selected. Using the concepts
and theories described in the Literature Review Chapter, the following elements of a
CBA are identified, 1) the selction and quantification of the benefits, 2) the costs of two
different automated systems, 3) the discount rate used in the analysis. The full cost of
purchasing an automated system compared to the existing manual system is
determined by taking the difference between the cost of present operations and those
of the proposed new system over time. The application of the cost-benefit method
reduces a stream of costs and benefits to a single number. These costs and benefits
are compared over to determine if the project is acceptable. Implementation of an
automated system involves start up costs and fluctauating operating costs for several
years. For the purpose of this study, the benefits and costs over time for two different
automated systems will be identified and normalized into dollars. A 10% percent
discount rate will be applied to this benefit cost analysis. The present value calculation
of both the benefits and costs are to be accrued over a five year period. The basic
criterion for choosing a desirable project among various alternatives is to select the one
that maximizes the net present value of benefits. Table 4.1 presents a cost benefit
analysis which shows the comparison between the two systems.
The second application of this study is a cost-effectiveness analysis presented
in Table 4.2. Instead of measuring benefits, this technique measures the impact of an
alternative (i.e. automation) in terms of the effectiveness of the program on a specific
o u t ~ o m e . ~ A uniform objective function is assumed as part of the analysis. Cost-
effective refers to the evaluation of alternatives based on their costs and effects with
regard to producing some outcome or set of outcomes. In this study the outcome is
library circulation or library use. Library use/circulation can be assessed in terms of
how many visits; number of transactions per population; number of completed
responses to references questions; number of juvenile transactions. Library programs
can also be viewed in terms of the level of use by various target populations. Cost-
effectiveness allows for the evaluation of alternative programs that have the same
objectives. In different situations these two methods maybe appropriate. The outcome
of both types of analysis is to provide information for decision making and to compare
alternative programs.
69Levin, 1 983, p. 1 13

-
- - -
TA
BL
E:4
.1
Be
ne
fit C
os
t A
na
lysi
s
Ap
pli
ca
tio
n t
o A
uto
ma
tio
n C
os
t r
1
SOCLA
L B
EN
EFIT
S
Yea
r P
erso
nnel
C
ircul
atio
n O
pera
ting
Incr
ease
in F
ee
Tot
al
Pmje
cted
Cap
ital
Mai
nten
ace
Tota
l S
avin
gs
Cos
t Sa
vin
g
Col
lect
ions
C
ost
Cos
ts
Tot
al
81.2
91
$1 61.
856
$39.
819
$252
,966
$3
1,45
2 $1
2.96
6 $4
4,41
8
Col
umn
A
calc
ulat
ions
are
bas
ed o
n T
able
4.4
C
olum
n B
are
the
com
bine
d co
st o
f su
pplie
s, m
ater
ial
& s
hare
res
ourc
es T
able
4.6
C
olum
n C
are
bas
ed o
n c
alcu
latio
ns o
n T
able
4.6
and
adj
uste
d fo
r 3
% in
flatio
n S
ourc
e: C
entr
al T
exas
Lib
rary
Sys
tem
Net
Soc
ial
Tim
e D
isco
unt
Ben
eM C
ost
Ben
eits
10
%
Rat
io

-.
Tab
le:
4.2
C
ost
Eff
ectiv
enes
s A
naly
sis
CO
ST
EFF
EC
TIV
EN
ES
S A
NA
LYS
IS
1 N
umbe
r o
f clr
cula
tlons
ann
ually
2 C
ircu
latio
ns p
er h
ou
r
3 T
ota
l an
nu
al h
ou
rs re
qu
ired
44
hrs
per w
eekx
52
we
ek
4 La
bor
cost
for
circ
ula
tio
n fu
nctio
n 2
pe
mx
$5
pe
rho
urX
Ln
4
5 C
lrcu
laU
on o
per
atin
g c
ost
clrc
car
ds
patro
n ca
rds
date
due
car
ds
plat
es
rl
bh
6 C
apit
al In
vest
men
t In
crea
sed
Pm
nn
el
auto
mat
ion
syst
em
7 A
dmln
lsba
Uve
cos
ts
card
fllln
g J3
3hrs
x $
5 pe
r ho
ur
over
dues
B
5hrs
x $5
per
hou
r In
vent
ory
1 nl h
rs 6
10
per h
our
inve
ntor
y 1 nl h
rs x$
!j pe
r hou
r ca
talo
g 42
hrs
x $
10 pe
r hou
r ca
talo
g 16
7 hr
s 6
10
per h
our
cntn
lq
Eih
rsx$
5p
erh
ou
r re
ports
48
hrs
x $
10 pe
r hou
r
8 T
ota
l Co
sts
Diff
eren
ce b
etw
een
syst
ems
9 C
ircu
lati
on
co
st p
er u
nit
AU
TOM
ATI
ON
M
AN
UA
L
AN
NU
AL
CIR
CU
LATI
ON
CO
ST
244
site
pre
pera
tiin
1,33
3 su
pplie
s 281
21 2
183
183

4.2 IDENTIFYING THE BENEFITS
There are five different categories where an automated system can provide
potential benefits over an existing manual system. They are 1 ) cost reduction or
avoidance, 2) error reduction, 3) shared resources, 4) increased speed of activity and
5) improved management and customer service. This section attempts to address each
of these benefits, determine which system might provide better service, save money, or
perhaps do both.
4.3 PERSONNEL SAVINGS
Cost Reduction or Avoidance. Most costs in a manual system are staff costs.'O
Labor costs are the single most expensive item in Taylots operations budget. On
average, libraries have .50 FTE per thousand population. Staff are employed to provide
direct public service. They perform such tasks as selecting materials, controlling
circulation and responding to reference questions. Technical service staff are involved
with the acquisition and cataloging of materials. Therefore, if a library can provide as
much service as possible within a given budget, it will substitute less expensive for
more expensive activities. In particular, small libraries that face rising costs may
economize on the use of labor by automating. In reducing a specific time consuming
task; (i.e. files with catalogs, overdue files, customer files) existing positions can be
eliminated from the budget. A library would realize benefits from a reduction in
personnel costs. Table 4.3 identifies the type, the year and the number of positions the
'O~ash, 1980, p. 80
62

TA
BLE
4.3
P
ositi
on C
ost
Sav
ings
- A
nnua
l Pro
ject
ions
CIR
CU
LAT
ION
A
B
C
D
E
F
G
1)
Titl
e Y
R1
YR
2 Y
R3
YR
4 Y
R5
TO
TA
L A
VE
RA
GE
2)
Pag
e 0.
50
0.75
0.
50
0.50
0.
25
2.50
0.
83
3) L
TA
0.
50
0.75
0.
50
0.25
0.
25
2.25
0.
75
4) S
LA
0.25
0.
50
0.00
0.
00
0.00
0.
75
0.25
6) T
EC
HN
ICA
L Y
R1
YR
2 Y
R3
Y
R4
Y R
5 T
OT
AL
AV
ER
AG
E
6)
LCA
0.
00
0.50
0.
50
0.50
0.
00
1.50
0.
50
7) S
CA
0.
50
0.25
0.
00
0.00
0.
00
0.75
0.
25
7 N
w
Hou
rly S
alar
y P
age
- SH
ELV
ES
BO
OK
S
$5.0
0 LT
A - L
IBR
AR
Y T
EC
HN
ICA
L A
SS
IST
AN
T
$6.8
0 S
LA - S
UP
ER
VlS
lNG
LIB
RA
Y A
SS
IST
AN
T
$1 1.
88
LCA
- LIB
RA
RY
CA
TA
LOG
ING
AS
SIS
TA
NT
$6
.80
SC
A -
SU
PE
RV
ISIN
G C
AT
ALO
GIN
G A
SS
IST
AN
T
$1 1.
88
NO
TE:
Pos
ition
Sav
ings
are
ref
lect
ed a
s a
budg
eted
Ful
l-Tim
e E
quiv
alen
t.
Sou
rce:
C
entr
al T
exas
Lib
rary
S
yste
m

library would need if automation did not occur. Without an automated circulation
system, a growth in both technical services personnel is anticipated over the next 5 to 7
year period. Table 4.4 shows the salary cost savings that these positions represent.
This is an illustration of the personnel costs over time if the library would continue with
a manual circulation system. In contrast, automation would eleminate the need for
additional positions.
Improved Manaaement and Customer Service. Automation of this type would
improve the reporting of library indicators. Information on customer files, circulation
occurrences, collection utilization and inventory control are a few of the indicators that
would be more accessible on a automated system than a manual system. Management
and customer service represents an area where benefits can be recognized but are
incalculable.
Error Reduction. The increased accuracy of an automated system will free up
work time of current staff. This allows for redirection of staff time to provide direct
public service with the location of material, and selection and interpretation of material.
Automated systems identify bottlenecks and other problems areas, i.e. record-keeping
and identifing peak times. Identification of such factors enables remedial measures to
be taken which will improve productivity. This type of benefit has a significant impact
on the way work is performed; however, the value of such a function can not be
calculated.

- -
-
-
Sal
ary
Co
st S
avin
gs:
A
nn
ual
Pro
ject
ions
A
6
C
D
E
Pos
ition
Titl
e Y
R1
Y R
2 Y
R3
Y R
4 YR
5
1) P
AG
E
2) L
TA
3) L
CA
4)
SLA
6)
SC
A
TOTA
LS
$1
00
,12
2
$1
03
,12
6
$1
03
,21
6
$1
03
,21
8
$1
03
,21
9
m '1:
AS
SU
MP
TIO
N
$1 0,0
12
$1
0,3
13
$1
0,3
22
$1
0,3
22
$
10
,32
2
a
DIR
EC
T S
ALA
RIE
S P
LUS
23
% F
RIN
GE
BE
NE
FITS
AN
D
FIC
A , 3
% R
ATE
OF
INFL
A T
lON
IF
W
OR
KE
D 1
00
% O
N C
IRC
ULA
TIO
N F
UN
CT
ION
A
SS
UM
PT
ION
IS
BA
SE
D O
N 1
0% O
F TH
E T
OTA
L S
ALA
RY
CO
ST
SA
VIN
GS
. T
HIS
AS
SU
ME
S T
HA
T
10
%
IS D
EV
OTE
D T
O T
HE
CIR
CU
LA T
lON
FU
NC
TIO
N
So
urc
e:
Cen
tral
Tex
as L
ibra
ry
Sys
tem
4.4 CIRCULATION OPERATIONAL SAVINGS
Shared Resources. The use of an automated system allows the library to
participate in cooperative activities now rendered impossible by a manual system. An
automated system allows bibliographic data to be transported and merged with other
libraries' data for resource sharing purposes. Direct benefits to the library would be the
facilitation of future resource sharing, whether by reciprocal borrowing, interlibrary loan
or special co-operative projects. This allows for individual libraries to focus their
resources for their community interests i.e. high usage materials like best sellers and
still address the needs of the smaller requests by providing titles through cooperative
activities. 71
Supplies and Materials. An ability to decrease damaged and lost materials by
the installation of anti-theft devices provides more control of material at the time of
discharge. The current estimate for replacing a lost or damaged book is $25.00 per
item, including cataloging and processing. In addition to these savings, the library
would no longer need supplies for manual circulation. Material, (i.e. circ cards, patron
cards, book pockets, plates and ribbons) needed to maintain the existing manual
circulation system are no longer used. These are replaced by barcodes in an
automated system. If one assumes conservatively that one percent of the collection is
damaged or lost annually and consider a base collection of 30,000 items, the estimated
cost savings would be $7,500 annually. Table 4.5 sumarizes the cost savings of
71Nash, 1980, p. 81

Soc
ial B
enef
its
of A
uto
mat
ion
F
org
on
e C
ost
of
Man
ual
Sys
tem
: A
nnua
l Pro
ject
ions
1
1)
PE
RS
ON
NE
L
SU
PP
LIE
S
2) C
lRC
CA
RD
S
3) P
AT
RO
N C
AR
DS
4)
DA
TE
DU
E C
AR
DS
6)
BO
OK
PO
CK
ET
S
6)
PLA
TE
S
7) R
IBB
ON
S
8)
TO
TA
L
9)
MA
TE
RIA
LS
$7
,600
$7
,600
$7
,600
$7
,600
$7
,600
10
) R
ES
OU
RC
ES
$7
,600
$7
,600
$7
,600
$7
,600
$7
,600
11
) D
ELQ
. FE
ES
$7
,600
$7
,600
$7
,600
$7
,600
$7
,600
Line
1 i
s ba
sed
on
th
e a
ssum
ptio
n th
at
wag
es a
re c
alcu
late
d a
t 1
0%
per
cent
of
sala
ry c
ost
sav
ing
of t
he
circ
ulat
ion
func
tion.
Thi
s w
as
used
as
no
t to
ove
rsta
te s
alar
y co
st s
avin
gs.
Line
s 2
-7 it
emiz
ed li
st o
f su
pply
co
st a
ssoc
iate
d w
ith
a m
anua
l sys
tem
Li
nes
9- 1
0 a
re b
ased
on
the
assu
mpt
ion
tha
t an
ite
m is
val
ued
at
$2
5.0
0 m
ultip
lied
by
1 %
per
cent
of
30
,00
0
volu
me
colle
ctio
n (3
00
X 2
5.00
).
See
Cha
pter
IV
Sou
rce:
C
entr
al T
exas
Lib
rary
S
yste
m

cooperative purchasing lending activities and quantifies recaptured delinquent
borrowers' fines and materials losses used for this analysis.
4.5 INCREASE IN FEE COLLECTIONS
Increased Speed of Circulation activity. A circulation transaction previously
taking several minutes to complete can now be completed in a matter of seconds.
Benefits realized in this area would increase the collection of delinquent fines. An
automated system would have the ability to automatically check on borrower's
transactions. The automation of delinquencies would result in a 50% percent increase
in the collection of overdue books and material^.'^ The anticipated cost savings from
this benefit is shown on Table 4.6.
4.6 IDENTIFYING THE DOLLAR VALUE OF BENEFITS
It is necessary to know the relationship between a library's output and cost
before any meaningful examination can be undertaken. The American Library
Association, in defining a library, indicates that an output can be identified in three
forms: information, education, and recreation. Unfortunately, these outputs are not
easily quantifiable. The primary means by which these functions are identified is
through the utilization of library materials, i.e, books/materials. The output of a library
can be indentified as books used or circulation of materials. Two types of measures
maybe used to assess functional areas. These vary along four different levels from
72Nash, 1980, p. 81

hA
BL
E:
4.6
S
um
mar
y o
f B
enef
its:
A
nn
ual
Pro
ject
ion
s
BE
NE
FITS
1) P
ER
SO
NN
EL
2) S
UP
PLI
ES
3)
MA
TER
IALS
4)
DE
LQ.
FEE
S
6) S
HA
RE
D R
ES
OU
RC
ES
$7,500
$15,000 $22,500
$30,000 $37,500
TO
TA
LS
$34,858
$42,665
$50,195
$57,710 $65,219
LIN
E
I: A
SS
UM
PT
ION
IS B
AS
ED
ON
10%
OF
THE
TO
TAL
SA
LAR
Y C
OS
T S
AV
ING
S.
TH
IS A
SS
UM
ES
TH
AT
10
%
IS D
EV
OTE
D T
O T
HE
CIR
CU
LA T
lON
FU
NC
TIO
N
LIN
E 2
.3,
&
4:
CA
LCU
LATI
ON
S B
AS
ED
ON
TA
BLE
4.5
LI
NE
5:
CA
LCU
LATI
ON
IS O
N T
HE
AS
SU
MP
TIO
N T
HA
T C
OO
PE
RA
TIV
E L
EN
DIN
G W
ILL
INC
RE
AS
E B
Y 3
00
IT
EM
S B
OR
RO
WE
D A
YE
AR
VA
LUE
D A
T $
25
.00
Sou
rce:
C
entr
al T
exas
Lib
rary
S
yste
m
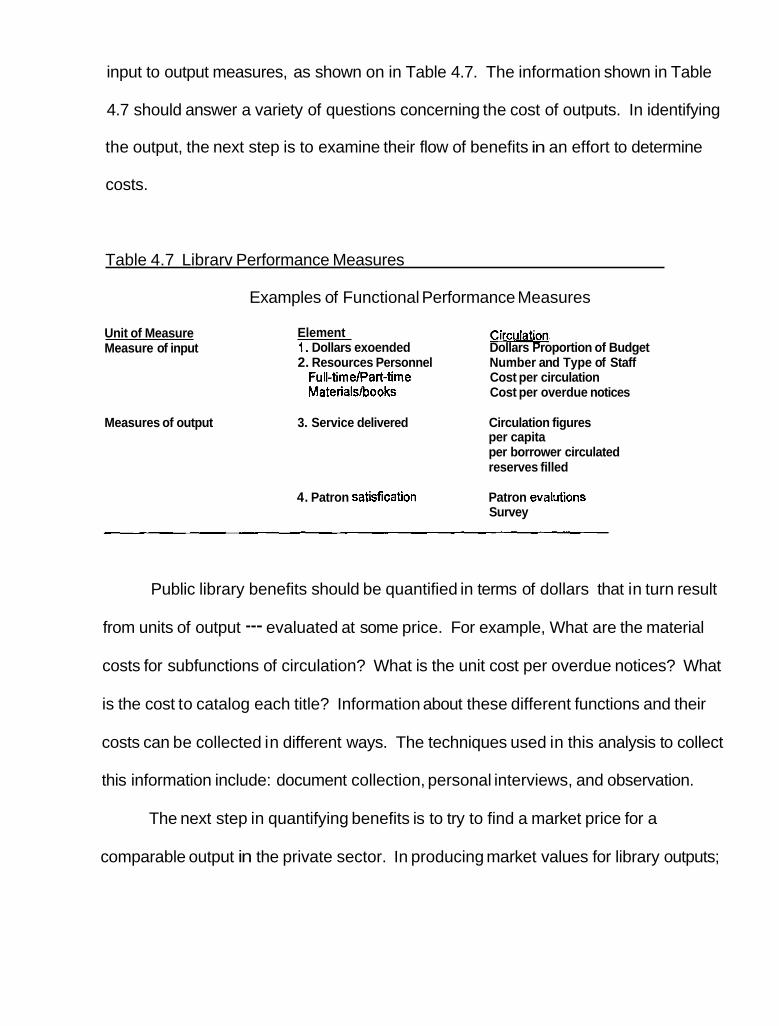
input to output measures, as shown on in Table 4.7. The information shown in Table
4.7 should answer a variety of questions concerning the cost of outputs. In identifying
the output, the next step is to examine their flow of benefits in an effort to determine
costs.
Table 4.7 Librarv Performance Measures
Examples of Functional Performance Measures
Unit of Measure Element Circulation Measure of input 1. Dollars exoended Dollars Proportion of Budget
2. Resources Personnel Number and Type of Staff Full-timelpart-time Cost per circulation Materialslbooks Cost per overdue notices
Measures of output 3. Service delivered Circulation figures per capita per borrower circulated reserves filled
4. Patron satisfication Patron evalutions Survey
Public library benefits should be quantified in terms of dollars that in turn result
from units of output --- evaluated at some price. For example, What are the material
costs for subfunctions of circulation? What is the unit cost per overdue notices? What
is the cost to catalog each title? Information about these different functions and their
costs can be collected in different ways. The techniques used in this analysis to collect
this information include: document collection, personal interviews, and observation.
The next step in quantifying benefits is to try to find a market price for a
comparable output in the private sector. In producing market values for library outputs;

Pfister and Millman suggests two rules of thumb: 1) that the benefit of the intangibles
can be considered as being worth no more than cost, 2) that the intangible benefits can
be valued at a figure at least as much as the cost of producing them. However, not all
dimensions of benefits are quantifiable in dollar terms. Benefits which are not easily
quantifiable are conceptually as important as those easily measureable in dollars and
have been included in this analysis. These type of benefits are more difficult to interpret
and require a greater amount of judgement on the part of the decision-maker.
Many assumptions are used in estimating benefits and calculating the value of
those benefits for this analysis. For example, percentage increases in personal
positions; percentage increase in workload; percentage increase in circulation usage;
percentage increase in cooperative lending. These assumptions influence the resulting
dollar evaluation and provide the underlying foundation for thisanalysis. Each table
has its own set of notes that provide a listing of contributing variables on which
estimations for that table were based.
4.7 IDENTIFICATION OF AUTOMATION COSTS
Costs for an automated circulation system can be identified in two major
categories: 1) start up costs; these are one-time costs associated with the initial
implementation of the project, 2) operational costs; these are recurring costs that
support and maintain the circulation system. For the purpose of this analysis, a list

provided by Walton identifies initial costs, operating costs, and special costs (see
2.1 Computer equipment 2.2 Telecommunications 2.3 Computer software 2.4 Site preparation 2.5 Consultant fees 2.6 Training 2.7 Legal expense 2.8 Shipping and installation 2.9 Finance charge
Onaoina Annual Cost Elements
Personnel Personnel benefits Hardware maintenance (computer and telecommunications) Software support Supplies and computer consumables Travel Postage (if system produces large mass mailings) Dues (user groups etc.) Site rentalllease, if appropriate Insurance Management support costs Telecommunications costs Indirect costs

S~ecial Costs Associated with Some or all Modes
2.23 Special vendor assumed costs (vendor agrees to perform) 2.24 Retrospective data conversion 2.25 Special vendor discounts 2.26 Performance bonding fees.
In this analysis, not all of these costs identified were part of this analysis. Table
4.8 identifies the specific costs connected to this analysis. The impact of automation
depends on the efficiency of the library's current operations compared to the costs of
an automation system. Each of these two systems, whether manual or automated will
offer different degrees of service delivery. The objective here is to identify the costs of
both systems to determine the best alternative.
To have a consistent set of information on which to make informed choices, data
must be gathered about the library's current manual operations. A project team was
formed to gather information on Taylor's current practices. Then after the current
practices were reviewed, the project team began to focus on the areas with the greatest
potential for improvement. This was done by systematic gathering of data about each
function area and breaking down each area. In this case, the area of concern was
circulation. The goal was to break up this broad area into manageable units so that
problem areas were easily identified. The units that were identified were based
standard units of check-out activities, check-in and return areas, reserve lists and
overdue notices and fines. The project team prepared a task activity analysis.
This analysis was performed to determined how much time was spent on various

TAB
LE:
4.8
A
uto
mat
ion
Co
sts-
5 Y
ear
Pro
ject
ion
s
CO
ST
S
HA
RD
WA
RE
M
AIN
TE
NA
NC
E
1 S
OF
TW
AR
E
SIT
E P
RE
PA
RA
TIO
N
I FU
RN
ITU
RE
I S
UP
PLI
ES
I T
RA
ININ
G
TOTA
L
Cal
cula
tions
bas
ed o
n W
orks
heet
#6
Equ
ipm
ent
& S
uppl
y B
udge
t A
ppen
dix
A
So
urc
e:
Cen
tral
Tex
as L
ibra
ry
Sys
tem

activities dealing with circulation. This is not a precise information gathering tool, but
provides readily available data for cost comparison of the two systems.
The time spent on each task was mutliplied by the appropriate salary rate plus
fringe benefits then mutliplied by number of times done in a year providing a yearly cost
for each activity. This information, together with data about the equipment,
maintenance and supply costs provides a fairly accurate account of how much various
activities currently cost. If the calculations show that total time spent on a activity
exceeds one full-time employee, the library has the option of eliminating postions or
reassigning the time for other library activities. The following is a standardized costing
for a manual circulation system based on a 30,000 item col le~t ion.~~
Card Filing. The library clerk can file and unfile 4 cards per minute, 240 per
hour. With 40,000 annual circulation transactions, 80,000 cards are filed per year.
Dividing 80,000 cards by 240 cards per hour, equals 333 hours, then multipling the
results by the clerk's wage of $5.00 an hour equals annual cost savings of $1,665 if the
card filing was automated.
Overdues Production. The circulation clerk types 20 notices per hour. Based on
a 3 percent overdue rate, 1,200 notices are typed annually. Dividing 1,200 by 20
notices per hour equals 60 hours. Then each patron averages 2 notices per envelope,
74C. Rebecca Garcia and Frank R. Bridge,Small Libraries OnLine, Automating, Circulation and Public Access Catalog, Texas State Library, August, 1991.

which equals 600 envelopes at a rate of 120 per hour. Dividing 600 envelopes by 120
equals 5 hours and the previous 60 hours for a total of 65 hours for processing overdue
notices. Multipling 65 hours by $5.00 hourly wage equals annual cost savings of $325
if the overdue production process was automated.
Monthly Statistics. Monthly circulation statistics reports required approximately 4
hours a month for the librarian to compile, equaling 48 hours per year multiplied by $10
hourly wage equals annual cost savings of $480 if the reporting of monthly statistics
were automated.
lnventorv Report. The librarian and one library clerk compiled the inventory in
approximately one month over the summer. They spent approximately 170 hours on
the inventory. First, multipling 170 hours by $10 hourly wage of librarian equals $1,700
plus the clerk's 170 hours multiplied by $5.00 hourly wage equals an annual costs
savings of $2,550 if the inventory report was automated.
Card Cataloaina Filinq. The librarian filed an average of 2 cards per minute, or
120 per hour. The library adds 1,000 titles per year. Each card set averages 5 cards,
so 5,000 cards are filed annually. Dividing 5,000 cards by 120 cards per hour equals
42 hours needed for filing, multiplied by $10.00 hourly wage equals a annual cost
savings of $420 if the card cataloging filing were automated.

Cataloq Card Production. The librarian cataloged the materials and typed the
main entry card at a rate of one every 10 minutes, or 6 per hour. The clerk then
photocopied the card and typed the remaining added entry cards at a rate of one every
5 minutes, or 12 per hour. The Librarian processes 1,000 titles divided by 6 titles per
hour equals 167 hours, multiply by $1 0.00 hourly wage equals $1,670. The clerk
processes 1,000 titles divided by 12 titles per hour equals 83 hours, multiplied by $5.00
hourly wage equals $415, added to the librarian cost of $1,670 for annual cost savings
of $2,085 if the catalog card production was automated.
Administration Production. The librarian spends about 4 hours per week or
about 200 hours annually, in supervision and management duties related specifically to
the manual circulation and card catalog processes. Multipling 200 hours by $10.00
hourly wage equals an annual cost savings of $2,000 if the the circulation and card
catalog processes were automated.
The method used in this analysis produced a net present value and a benefit-
cost ratio calcuation of the benefits and costs of an automation circulation system. The
present value of net benefits is the difference between the discounted value of the
benefits streams and the cost streams. The program with the largest net present value
is the accepted project. The benefit cost ratio uses benefits as the numerator and the
costs as the denominator. A project should have a benefit cost ratio larger than or
equal to one in order to be considered worthwhile. The higher the ratio, the greater the

payoff. The benefit cost ration is used to measure effectiveness. In this analysis the
benefit cost ration and the net benefits of this library project is examined.
It is necessary to analyze the net present value of future benefits and costs that
will accrue with an automated circulation system. To do so requires that time value of
both costs and benefits be calculated for the year in which they accure. Construction of
the net benefit value must be done so that the net present values can be determined for
each year of the project's life. These yearly net present values must then be summed
and an overall net present value for the project determine. This formula is translated
into a net present value in Table 4.1. The use of the cost effectiveness analysis is
depicted in Table 4.2. The analysis compares the efficiency of a manual circulation
system to that of an automated system. The computations were based on the cost
figues in Tables 4.4, 4.5 and 4.6.
Personnel savings benefits were measured in terms of reduction. There was a
general assumption that the implementation of an automation system would provide
time savings. The number of employees needed per year as shown in Table 4.3 could
be elimnated. It is estimated that as circulation increases the circulation function could
expect to add on average 1 FTE a year. Table 4.4 estimates the dollar value of the
different positions. Either the entire salary amount or the dollar amount connected to a
specific task could be used in the analysis. The value of the personnel cost savings is
based on 10% percent of wages. Table 4.4 gives the estimated dollars in personnel
time. This value was used in order not to overstate the personnel calculations.

The second category of benefits is identified as circulation operating cost
savings; which include materials, supplies, and shared resources. These benefits are
estimated on Table 4.6. Shared resources, delinquent fines and material losses are
calculated on the following premise given by the State Library; shared resources, fines,
and material losses can be calculated at 1 % percent of the collection. A study done by
Teh-Wei Hu in 1975 maintained that the average lost rate was 3 percent and the
average price per book was $5.00.~' Based on several discussions with librarians
within the System, a 3% percent loss rate was fairly accurate but so as not to overstate
the cost, the analysis used a rate of 1 Oh percent of the collection to define shared
resources, fines and materials losses. In the process of collecting data for this
analysis, it was found that there is not a standard form or unique definition of various
costs and benefits for the circulation function. The participating library could not
provide information on the monetary value of the benefits, only automation costs. The
determining of benefit values were based on a series of consversations with Bob
Gaines and Mark Smith, experts within the field of library automation with the State
Library. They estimated, for example, a collection of 30,000 would experience a loss of
1 % percent of their collection which equals 300 items a year. The average cost af a
book is $25 dollars, this includes processing and cataloging. The cost savings is
calculated at 300 times $25, which equals $7,500 as shown in Table 4.6. This annual
benefit is carried over to Table 4.1 and adjusted at 3% percent inflation. Because of
greater control of the circulation function, the library has greater control of collecting
75H~ , 1975, p. 149

fines, monitoring damages, and the ability to share resources. The estimated value for
shared resources which translates into an increased collection for patron use is shown
in Table 4.6. The estimated value for supplies is shown in Table 4.5 this information
was given by the participating library. Appendix A gives a detailed summary of the
cost figures prepared by the participating library. The detail of the adjustments are
described on each table.
The analysis reveals the automation project has a postive net present value of
$834 the first year, with cumulative savings of $205,976 for the five years. The benefits
of an automated system over a manual circulation system is estimated to be $205,976.
Based on total net benefits, the automation alternative appears to be the best economic
choice for Taylor Public Library. It should be recognized that the actual overall benefits
of an automation system are larger than the three categories presented here. There
other benefits which could not be measured in monetary values of, i.e. the value of
community satisfaction was not included. The next step in the analysis is the
application of the benefit-cost ratio criteria shown in Table 4.1. The program has a
benefit cost ratio greater than one. The implication of the benefit cost ratio is that the
program is worth the investment.
Table 4.2 presents a cost effectiveness analysis on the examination of the two
different systems. The assumption in this case is that the project is intrinsically
worthwhile. This type of analysis explores the difference of cost per unit measurement
between programs. The objective in this analysis is to determine how much of an
objective can be obtained within a given amount of resources. Comparing costs

between both circulation systems shows that the automation is more efficient at a cost
of .91 cents per circulation compared to a manual system cost at 1.72 per circulation.
The analysis predicts this cost based on the assumption that the automation can
handle a 50% percent increase in circulation. The performance indicators use for this
analysis are shown in Table 4.2. The analysis indicates that this cost increase for
automated services is affordable. The notion that a library can afford less in the way of
services because technology has driven the cost up is not true. While services will
undoubtly continue to grow more expensive, the analysis shows that the community will
be able to afford to pay for these rising costs if they choose to do so. The analysis
offers an explanation of what is expected, in terms of relative cost for library automation
in the future. The analysis indicates that automation of a significant portion of library
operations may perhaps have become more affordable. The point of this analysis is
not to argue that computeization of services will replace all library functions, but to
acknowledge that as the cost for computers becomes more feasible, they become more
cost effective in a library environment.

CHAPTER V
SUMMARY
As shown in this analysis, the benefits and costs that are associated with an
automated on-line circulation system can be identified and quantified. Those
quantifiable benefits and costs can be measured in monetary values. In order to
completely understand the full impact of an automated system, other considerations
should also be taken into account. The qualitative factor and the improvements of
efficiency weighed together support an automated circulation system for small public
libraries, and the automation option should be seriously considered. The following are
the empirical findings of the analysis.
This analysis is based on a limited observations of one small public library,
Taylor Public Library in Taylor, Texas. Because this analysis is based on supported
data, it is impossible to make generalizations about the efficiency of an automation
system. While the benefitcost ratio implies that the system is an efficient use of
resources, it would strengthen the analysis to show how much efficiency was
increased. The results suggest that libraries should track their inputs and outputs as
part of the program evaluation.
One way to improve efficiency is to automated the circulation function. This is
true because the cost-effectiveness analysis showed a lower per unit cost in circulation
function with automation. The library should be able to expand services for relatively
small cost increase. An increase in book circulation would further reduce the average
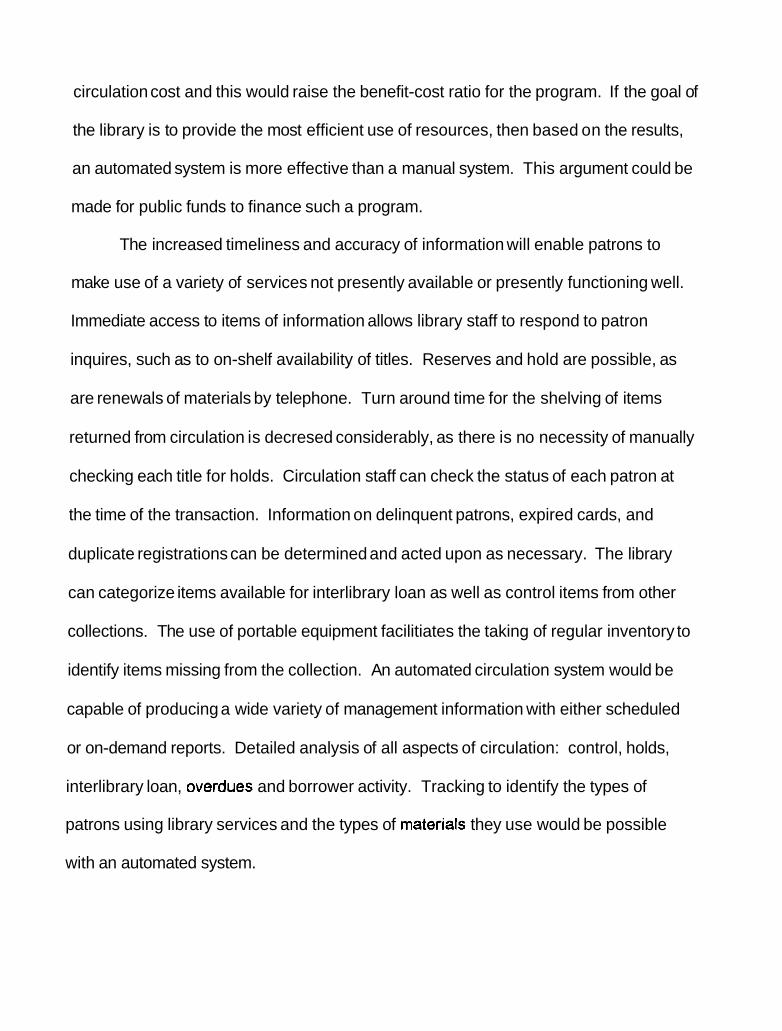
circulation cost and this would raise the benefit-cost ratio for the program. If the goal of
the library is to provide the most efficient use of resources, then based on the results,
an automated system is more effective than a manual system. This argument could be
made for public funds to finance such a program.
The increased timeliness and accuracy of information will enable patrons to
make use of a variety of services not presently available or presently functioning well.
Immediate access to items of information allows library staff to respond to patron
inquires, such as to on-shelf availability of titles. Reserves and hold are possible, as
are renewals of materials by telephone. Turn around time for the shelving of items
returned from circulation is decresed considerably, as there is no necessity of manually
checking each title for holds. Circulation staff can check the status of each patron at
the time of the transaction. Information on delinquent patrons, expired cards, and
duplicate registrations can be determined and acted upon as necessary. The library
can categorize items available for interlibrary loan as well as control items from other
collections. The use of portable equipment facilitiates the taking of regular inventory to
identify items missing from the collection. An automated circulation system would be
capable of producing a wide variety of management information with either scheduled
or on-demand reports. Detailed analysis of all aspects of circulation: control, holds,
interlibrary loan, overdues and borrower activity. Tracking to identify the types of
patrons using library services and the types of materials they use would be possible
with an automated system.

Murfin, Marjorie, E. "Cost Analysis of Library Reference Services." Advances in Librarv Administration and Organizations. ed. Gerard B. MaCabe and Bernard Kreissman. Jai Press Inc. Volume 1 1, 1993.
Musgrave, R. A. and P. B. Musgrave. Public Finance in Theorv and Practice. 2nd ed. New York: McGraw Hill, 1 976.
Nash, Mary and Sandra Hession. "Justifying An Automated Library System - A Case Study." American Society for Information Science Proceedings of the 43rd ASlS Annual Meetinq. Chicago: American Library Association, 1980.
Newton, Trevor. Cost-Benefit Analvsis in Administration. London: Allen and Unwin, 1 972.
Raffel, J. A. and R. Shiska. Svstematic Analvsis of Universitv Libraries: On A~ulication of Cost-Benefit Analvsis to the MIT Libraries. Cambridge, MA.: MIT Press, 1969.
Roberts, Stephen A. Cost Manaaement for Librarv and lnformation Services, London: Butterworth & Co and The British Library, 1985.
Rosenburg, Philip. Cost Findina for Public Libraries: A Manaaefs Handbook, Chicago: American Library Association, 1985.
Sager, Donald J. Manaaina The Public Librarv. 2nd ed. New York: G.K. Hall and Co., 1983.
Sassone, P. and W. A. Schaffer. Cost-benefit analysis - A handbook. New York: Academic Press, 1978.
Swisher and Mclure. Research for Decision Makina: Methods for Librarians. Chicago: American Library Association, 1984.
White, Herbert S. "Cost-Benefit Analysis and Other Fun and Games." Librarv Journal, February 15, 1.985.
Young, Heartsill, editor. The ALA Glossarv of Librarv and lnformation Science. Chicago: American Library Association, 1983.
Van House, Nancy. "Research on the Economics of Libraries." Librarv Trends Vol. 32 1984.

APPENDIX A
SOURCE WORKSHEETS
1. Automating Small Libraries - How Long Will It Take 2. Automating Small Libraries - Time Table Exercise 3. Time Line 4. Staff Time Budget 5. Automating Small Libraries - How Much Will My Automation Project Cost? 6. Equipment and Supply Budget 7. City of Taylor Budget 94-95 8. Hardware and Software Specifications

AUTOMATING SMALL LIBRARIES
How tons Will It Take? - Weeding and Inventory
Step I: 32.000 t i t les divided by 100 mquals 320 hours
Step 2: 2 Hours per week a p a i r of your s t a f f can work on weeding/inventory
Step 3: Step 1 320 divided by Step 2 14_ equals a weeks t o complete
Step 4: 23 weeks divided by 4 equals 6 months t o complete t h e p r o j e c t
Retrospective Conversion
Step 1 : -32,000 t i t l e s divided by 40 equala a hours
Step 2: _32 Hours per week you and your a t a f f can vork on recon
Step 3: Step 1 800 divided by Step 2 _lil equal6 a weeks t o complete
Step 4: 25 weeks divided by 4 equale J- months ta complete t h e p ro j ec t
Barcoding Collec+ion *
Step 1: Label and l i nk 32.090 volumen divided by 40 equals 80_Q hours
Step 2: - Hours per week you and your s t a f f can work on barcoding
Step 3: Step 1 - divided by Step 2 - equals - waeke t o complete
Step 41 - weeks divided by 4 equale m o n t h s t o ccmplate t h e p ro j ec t
Entering Patron Data
Step 1: 4 . 5 0 0 patrons divided by 100 equale hours
Step 2: -4- Hours per week you and your s t a f f can work on da t a en t ry
Step 3: Step 1 45 divided by Step 2 jL equals weeks t o complete
Step 4: 12 weeks divided by 4 equals 2 month6 t o complete t he pro jec t
4 Preliminary plans are t o c lose t he l ibraFy f o r barcoding.
ce/time CTLS 8-90

AUTOMATING SMALL LIBRARIES
TIME TABLE EXERCISE
Sample Automation Project Time Table
Prepare 5-year plan and budget
Weeding and inventory
Retrospective conversion
Re-register patrons
Select hardware and software
Earcode collection
Install and test hardware and software
Enter patron data
Train staff in new circulation procedures Begin automated circulation
September - October 1990
November 1990 - February 1991 March - September 1991 August - November 1991
October 1991
October - December 1991 November 1991
November - December 1991 December 1991
January 1991
Time Table for My Automation Project
Prepare 5-year plan and budget
Weeding and inventory
Retrospective conversion
Re-register patrons
Select hardware and software
Barcode collection
Install and test hardware and software
Enter patron data
Train staff in new circulation procedures
Begin automated circulation
March - August 1995
March - August 1995
May - October 1995 September - November 1995
November 1995
January - February 1996 February 1996
November - December 1996 February 1996
March 1996
ce/micr~ws APPENDIX A - 2 CTLS 8- 3 0

Xm
e L
ine

Staf
f Tim
e B
udge
t
TO
TA
L 1
1 $1
5,63
6.00
I
* F
igu
res
for
this
fo
rm a
re f
rom
Bob
Gai
nes'
w
orks
heet
s an
d e
stim
ate
s b
ase
d o
n th
e t
ime
lin
e.
Task
Q
uant
ity
Uni
t U
nit C
ost
Cos
t P
erso
n(s)
1.
Con
vers
ion -
-
1.1
plan
ning
35
ho
ur
$6.0
0 $2
10.
00
libra
ry d
irect
or a
nd s
taff
--
1.2
trai
ning
--
$480
.00
libra
ry s
taff
and
stud
ent a
ssis
tant
s -
1.3
wee
ding
& in
vent
ory
-
libra
ry s
taff
and
stud
ent a
ssis
tant
s
Sub
tota
l 1
39
5
hour
$6
.00
$B,1
60.0
0 --
--
--
----
2. Im
plem
enta
tion
- - - - - -
2.1
plan
ning
2.2
re-r
egis
ter p
atro
ns
2.3
vend
or s
elec
tion
- -
-
2.4
site
pre
para
tion
-
2.5
barc
odin
g
2.6
patr
on
--
data
ent
ry -
-
2.7
netw
ork
trai
ning
2.8
softw
are
trai
ning
- - -
. - - -- - - -
2.9
circ
ulat
ion
trai
ning
-~
2.10
pub
licity
2.1
1 po
licy
deve
lopm
ent
60
ho
ur
$6.0
0 $3
60.0
0 lib
rary
dire
ctor
and
libr
ary
boar
d of
dire
ctor
s -
Sub
tota
l 1
24
6
haw
$6
.00
$7,4
76.0
0 --
-- -
--m
u-
-
1 00
ho
ur
$6.0
0 T
- -
--
- $6
00.0
0 - -. . -
libra
ry d
irect
or a
nd s
taff
-
----
45
hour
$6
.00
$270
.00
libra
ry s
taff
II -.
-
-
> 6
25 - -- h
our --
$6.0
0 $1
50.
00
libra
ly d
irect
or a
nd li
brar
y bo
ard
of d
irect
ors
-
.- --- - -- - --
-- - -- - .
--
L i 2
5
hour
$6
.00
$1
50.0
0 lib
rary
sta
ff an
d ci
ty s
taff
K ~
c
80
0
hour
-
$6.0
0 -
$4.8
00.0
0 -- --
libra
ry s
taff
and
vol
unte
ers ---
-
45
-
32
hour
$6
.00
$270
.00
-
hour
$6
.00
- .-
32
libra
ty s
taff
----
-
.-
vend
or a
nd lib
rary
sta
ff
-- -
vend
or a
nd li
brar
y st
aff
p-------.----.-p
p~
~
- $ - -
192.
00
-- - .-
vend
or a
nd
~
libra
ry s
taff
-~
ho
ur
$6.0
0
3 2
hour
$6
.00
~
$192
.00
$192
.00 -
$300
.00
libra
ry
~
dire
ctor
and
sta
ff .
-- .-
50
ho
ur
$6.0
0 ~

AUTOJIATING SHALL LIBRARIES
Up-! !&sh U i l l flx flutonation Project Cost?
Step 1 Tndicate the following for your library: 3 q 1 1 number of volumes (not titles) ~ 3 4 number of circulations per year 4 3 9 3 Number o f registered borrowers
Step 2 Indicate the number of workstations you will need b~- 1993: -.- -I- circulation station >' second circulation station (for high circulations or as backup)
2 public access catalog stations (PRCS) 1_ staff workstation
step 3 Now pick a budget that seems closest to your circumstances. This will give you a middle-of-the-road figure (expect r variation o f plus or minus 25%. depending on the software vendor YOU choose) with whlch to start your planning. Note that the cost of staff time is not included.
. Typical Budget A (Assumes 20,000 volumes,' 20.000 circulations/year, 2,000 borrowers)
Hardware (1 circulation station. 1 PAC) ~irculation/catalog software Dumb labels and paper borrower's cards
Staff time (1,250 llours for recon, labeling, and implementation) ~ n n u a l cost f o r maintenance and materials
Alternate Budget A (phase 1 is circulation only, Phase 2 adds PAC; not recommended because you must maintain card catalog during Phase 1)
Phase L Hardware (1 circulation station) ~ i r c u ~ a t i o n software only Dumb labels and paper borrower's cards
Staif time (1,250 hours for recon, labeling, and implementation) Annual cost for maintenance and nat3rinis $1.000
Phase 2 Hardware (1 pfic station, network hardware) Catalog/network software upgrade
APPENDIX A 1 '5 Page I CTLS 8-90

Typical Budget B (fissumes 25,000 volumes, 40,000 circulations/year, 3,000 borrowers)
Hardware (2 circulation stations, 2 PRCs, 1 staff station) Circulation/catalog software Dumb labels and paper borrowerDs cards
Staff time (1.500 hours for recon, labeling, and implementation) Annual cost for maintenance and materials
Typical Budget C (Assumes 35,000 volumes. 75.000 circulations/year, 5.000 borrowers)
HardwareJ.2 circ stations, 3 PACs. 1 staff station, file server) Circulation/catalog software Dumb labels and paper borrower's cards . Staff time (2,000 hours for recon, labeling, and implementation) Annual cost for maintenance and materials
Added Costs
Step 4 Workstations: If you require more workstations (PACS. e.tc.) than the typical budget shows, add $1,000 for each additional workstation. $ 1 . n 0 0
Step 5 Bar Code Labels: Add.(or subtract) $40 per 1.000 volumes or patrons as required. s 1,560
Step 6 ~ l e c t r i c a l Circuits: If you do not have dedicated 30 amp electrical circuits specifically for computers and printers (that is, the circuits were installed according to electrical code specifications for computer circuits. and non-compu?er equipment such as photocopiers or microwaves won't also be using them), add $200 for each location below where you will need one: - circulation desk
phcs (if they are widely separated, one circuit for each PAC) - staff workstation/file server
Total for electrical circuit* $
Step 7 Datacabling; You must run data cabling from the main computer (which will be either at the circulation desk, as in Typical Budget d or 6 , or in the workroom. as in Typical Budget C) to the other workstations. 6dd $100 for each location below where the cabling must be run from the main computer:
2 circulation desk 7 - PQCS (if they are widely separated, one cable for each PAC) 2 staff workstation
Total for data cabling S 800
Step 8 Add the amounts in Steps 4-7 tol the typical budget total (omit annual cost)
Grand Total: $ 2 0 9 6 6 0 --.- ---- (for first year only)
. - C ~ ~ C O S ~ APPENDIX A-5 Pd9e 2 C T L S 0 - 9 0
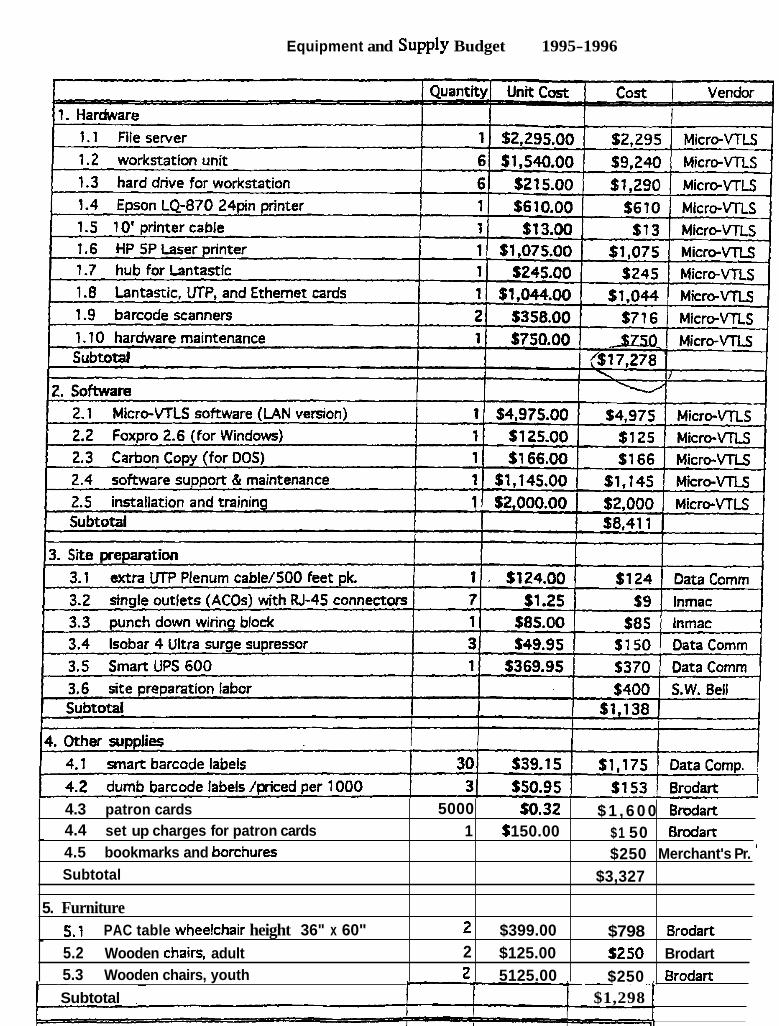
Equipment and Supply Budget 1995-1996
4.3 patron cards 4.4 set up charges for patron cards - 4.5 bookmarks and borchures Subtotal
5. Furniture 5.1 PAC table wheelchar height 36" x 60" . 5.2 Wooden charrs, adult 5.3 Wooden chairs, youth
--
Subtotal $1,298
5000 1
2 2 2
$0.32 $ 150.00
$399.00 $125.00 5125.00
-
$ 1 , 6 0 0 $1 50 $250
$3,327
$798 $250 $250
&art Brodart
Merchant's Pr. '
Brodart Brodart Brodart -

Equipment and Supply Budget
Automation Budget for 1996-1997
The 1996-1997 budget includes a 3% increase for i n f l a t i o n over the 1995-1996 budget not including maintenance contract costs. The patron cards item i s a 2 year supply.
Automation Budget for 1997- 1998
The 1997-1998 budget includes a 3% increase for i n f l a t i o n over the 1996-1997 budget.
APPENDIX A - 6 Paqe 2

CITY OF TAYLOR BUDGET 94-95
" LIBRARY DEPARTMENT-CONTROL NO. 77 BUDGET 93-94 AMENDED BUDGET BUDGET 94-85
100-SALARIES AND WAGES 77- Salaries 58.1 11.00 58,111.00 61,593.00 77-1 11 Career Ladder 580.00 0.00 616.00
200-SUPPLIES 77-202 Office Supplies 1,200.00 1.800.00 1,800.00 77-204 Natural Gasffropane 700.00 700.00 700.00 77-208 Food 100.00 100.00 100.00 77-214 Minor Tools 1U).00 120.00 120.00 77-2 1 6 Cleaning and Toilet Supplles 100.00 150.00 150.00
300-MA!NTENANCE OF BUILDINGS 77-302 ~ainlenance of Buildings 200.00 500.00 500.00
400-MAINTENANCE OF EQUIPMENT 77-402 Fumilure and Fixlums 1.000.00 1 ,000.00 1.000.00 77-416 Ubrary Books 0.00 0.00 0.00
500-SERVICES AND FEES 77-501 NEMl Cofltnct 0.00 395.00 1.570.00 . . 77-502 Telephone Equlprnent 1,000.00 1,000.00 1,000.00 77-506 Insurance and Bonds 2,570.00 3,600.00 3,600.00 77-508 Special Services 180.00 190.00 190.00 77-522 Ught and Power 4,880.00 3,800.00 3.000.00
6OO-CONTRIBUTIONS AND BENEFlTS 77-601 "125" Agreement 0.00 77-607 Administration *125" 88.00 860.00 66.00 77-808 FICA-Social Securlty 4,450.00 3.800.00 4,700.00 77-610 RetRernent - T.M.R.S. 1,500.00 1,500.00 1,000.00 77-615. slate ~nernployment Taxes 533.00 533.00 533.00 77-6 16 Workers Compensation , 1,14200 220.00 1 .I 00.00 77-618 Health Insurance 4,000.00 3,600.00 4,000.00
70DCAPITAL OCmAY FAClUTlES 77-702 Capital Outlay - Buildings 0.00 0.00 . , 0.00
800-CAPITAL OUTIAY EQUIPMENT 77-802 Capital Outlay - Furniture and Fixtura 300.00 300.00 1.800.00 77-816 Capital Outlay - Boob 8,000.00 6,000.00 6,000.00
TOTAL 87,485.00 95.1 38.00
APPENDIX A - 7
- .,,?

HARDWARE AND SOFTWARE SPECIFICATIONS
File Server
486 DX2/66 Mhz computer with 486 processor,
8 MB RAM memory expansion to 32 MB 528 MB hard drive
3.5" 1.44 MB floppy drive keyboard
14" VGA color monitor
Jumbo3M internal backup with 1 tape Asynchronous communication port Parallel printer port
38.8 internal modem
Elhernet local area network card - 16 bit, 10 Mbs with 10 base-T RJ-45 ready
CD-ROM player
B a d e scanners (workstation or fileserver compatible)
Workstations
486 D U 6 6 Mhz computer with 486 processor, 8 MB RAM 428 MB hard drive
3.5" 1.44 MB floppy drive Pnncer port
Asynchronous commu~cafions port Ethernet local a r a network card - 16 bit, 10 Mbs with 10 base-T RJ-45 ready
Printers
HP 5P Laser printer
Epson LQ-870 24 pin printer
10' printer cable
APPENDIX A - 8 Page 1

Software LANtastic networking software Micro-VTLS, Lan version DOS 6.22 (7 copies) Dial-in support softwvare
Foxpro 2.6 (for Windows) Carbon Copy (for DOS)
Network Euuipment Hub for Lantastic
445 feet of Unshielded twisted pair (UTP) cable (category 5) 9%) feet with package + 195 feet additional cable
Standard AT&T punchdown blocks Amp communication outlets with RJ-45 jacks
APPENDIX A - 8 Page 2
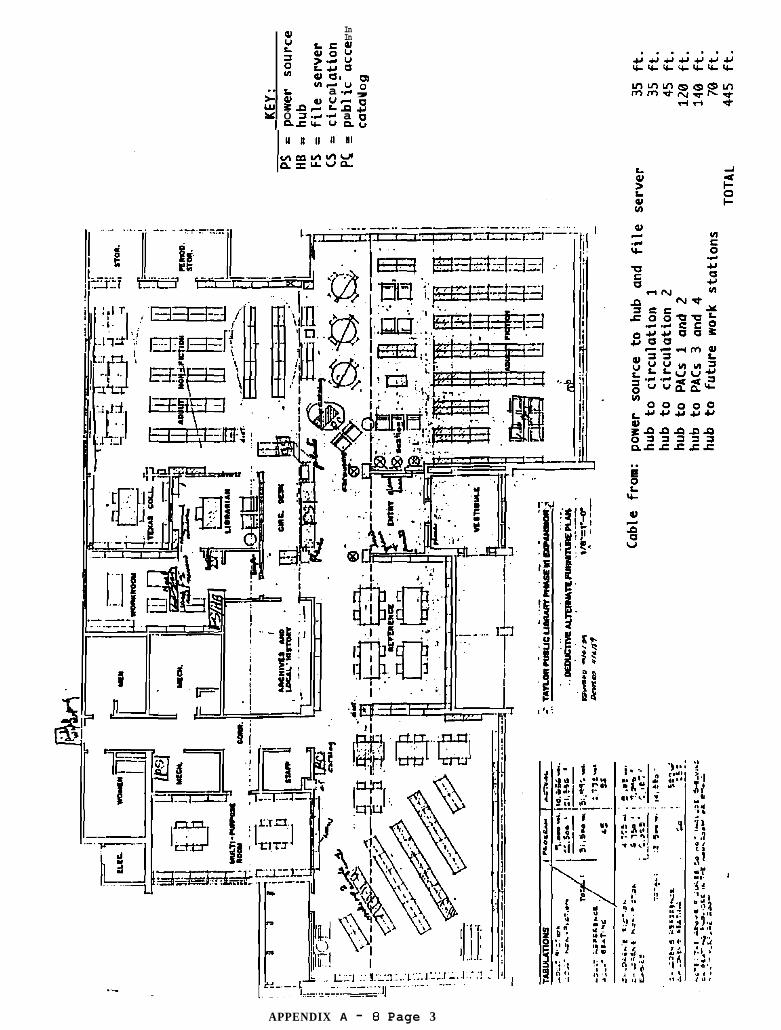
Q) In
u In
k g ; > .* L U a a04 a In, U 0 - - L a .C ,
*Q) o u c a LY In, L P U Y 0 3.4.4 a a In'& u n u
APPENDIX A - 8 Page 3