Embed Size (px)
Citation preview

University of Central Florida University of Central Florida
STARS STARS
Electronic Theses and Dissertations, 2004-2019
2005
A Consumer-based Assessment Of Alliance Performance: An A Consumer-based Assessment Of Alliance Performance: An
Examination Of Consumer Value, Satisfaction And Post-purchase Examination Of Consumer Value, Satisfaction And Post-purchase
Behavior Behavior
Nacef Mouri University of Central Florida
Part of the Marketing Commons
Find similar works at: https://stars.library.ucf.edu/etd
University of Central Florida Libraries http://library.ucf.edu
This Doctoral Dissertation (Open Access) is brought to you for free and open access by STARS. It has been accepted
for inclusion in Electronic Theses and Dissertations, 2004-2019 by an authorized administrator of STARS. For more
information, please contact [email protected].
STARS Citation STARS Citation Mouri, Nacef, "A Consumer-based Assessment Of Alliance Performance: An Examination Of Consumer Value, Satisfaction And Post-purchase Behavior" (2005). Electronic Theses and Dissertations, 2004-2019. 597. https://stars.library.ucf.edu/etd/597

A CONSUMER-BASED ASSESSMENT OF ALLIANCE PERFORMANCE: AN EXAMINATION OF CONSUMER VALUE, SATISFACTION
AND POST-PURCHASE BEHAVIOR
by
NACEF MOURI B.S. Higher International Institute of Tourism Studies, Morocco, 1993
M.B.A. University of Central Florida, 1997
A dissertation submitted in partial fulfillment of the requirements for the degree of Doctor of Philosophy
in the Department of Marketing in the College of Business Administration
at the University of Central Florida Orlando, Florida
Fall Term 2005
Major Professors: Jaishankar Ganesh and Ronald E. Michaels

ii
© 2005 Nacef Mouri

iii
ABSTRACT
Strategic alliances have become a recognized strategy used by firms in the pursuit of their
diverse organizational objectives. Consequently, the literature on alliances is replete with
research investigating the value strategic alliances generate for participating organizations.
Strategic alliances have been shown to contribute to firm value through numerous sources,
including scale economies, effective risk management, cost efficient market entries, and learning
from partners. Alliances also help firms minimize transaction costs, cope with uncertain
environments, and reduce their dependence on resources (Das and Teng 1996; Ireland et al.
2002; Spekman et al. 1998). Largely overlooked in the literature however, are issues
investigating the relationship between strategic alliances and one of the organization’s most
important constituents, the consumer. Questions such as how the consumer reacts to inter-firm
alliances, how strategic alliances impact consumer value, satisfaction, and customer post-
purchase behavior have yet to be answered. This lacuna has been recently highlighted by
prominent researchers in the discipline (Rindfleisch and Moorman 2003). Focusing on marketing
alliances, the present dissertation attempts to address this gap in the alliance literature by
advancing and testing a theoretical framework examining consumers’ cognitive, affective, and
behavioral reactions to organizational strategic alliances.
The dissertation also contributes to the satisfaction literature. Scholars in this area have
traditionally viewed satisfaction as a cognitive response to the comparison of actual consumption
experiences with some comparison standard (confirmation/disconfirmation paradigm). Recently
however, there have been increasing calls for satisfaction measures to capture not just how the
customer thinks the product performed relative to the comparison standard, but also the resulting

iv
customer emotion. The study provides additional support of an affective route to customer
satisfaction, particularly when customer hedonic value is enhanced.
Moreover, the association between customer satisfaction and behavioral outcomes is also
examined. While prior research shows that satisfaction is positively related to loyalty and word
of mouth and negatively related to intentions to switch, it was found that these relationships are
even stronger in the presence of alliances.
The results of this dissertation provide important theoretical and managerial insights. The
strategic alliance literature is enhanced insofar as this is the first effort aimed at investigating the
impact of strategic alliances on the consumer. The study examines the relationship between
marketing alliances and customer value, particularly utilitarian and hedonic value, as well as the
moderating role of alliance type (functional or symbolic) in this relationship. From a managerial
perspective, engaging in strategic alliances is strategically critical and costly. By providing
insight into how alliances enhance consumer value, and how in turn value enhancement is related
to customer satisfaction and behavioral outcomes, the present research will help managers make
more appropriate and better-informed alliance decisions.

v
To my wife Hala and my newborn Bashir
With all my love

vi
ACKNOWLEDGMENTS
Writing this dissertation has proved to be a long journey. I would not have completed it
without the help and guidance of many. I would like to take this opportunity to thank some of
them. First, I express my deepest gratitude to my co-chairs Jai Ganesh and Ron Michaels for
devoting many hours to my dissertation and for having such keen eyes. Their attention to detail
and insightful comments proved to be invaluable to the enhancement and completion of this
work. Jai was my professor in the MBA program. His excitement and appreciation of the
marketing discipline inspired me to join the doctoral program. Since then, Jai has been a
Professor, a dissertation Chair, and an Associate Dean, but mostly a friend. This work would not
have been possible without his outstanding advice, as well as his frequent well-timed
encouragements. To Ron, I express my gratitude for his guidance and support not only during the
writing of this dissertation, but throughout the whole doctoral program. I am highly thankful to
him for his helpful comments, far-ranging inspiration, and most of all, his patience.
I am deeply indebted to the members of my dissertation committee for their time and for
their invaluable contributions to my research and my overall development as an academic. My
sincere gratitude goes to Raj Echambadi for reading my chapter drafts when he had no time, for
his unparalleled statistical advice, and for his support during the entire doctoral program. Raj is
the academic scholar one could only aspire to become. I am particularly appreciative to Judy
Harris and Junyong Kim, whose able knowledge went a long way in helping overcome the
challenges frequently encountered all along the dissertation process. My thanks also go to Ram
Desiraju for his helpful suggestions and constant encouragements, and to Richard Hofler for

vii
being a great professor and an exemplary colleague. The technical assistance of Vishal Bindroo
is also gratefully acknowledged.
I wish to thank my confreres Inigo Arroniz and Michael McCardle for making the
doctoral program experience both valuable and enjoyable. Their support ranged from help with
specific issues to a remarkable camaraderie. Their sense of collegiality is truly inspirational. I
wish them the best in their professional careers and their personal lives.
I would like to thank my father Ahmed and my mother Amal for their loving guidance
and support over the years. I am indebted to them for infusing me with the desire to reach and for
instilling in me the principles and values that I live by. I am fortunate to have them as parents.
Thanks go to my sisters Misk and Ouissam and my brother Ouns, for being the perfect siblings.
Their encouragements throughout the years often provided needed and renewed impetus. I also
wish to thank my extended family, both blood-related and those of the heart, for providing me
with a strong support network, and for their understanding, especially during those times when
the research came first.
Last but not least, my wife Hala deserves an award for her endless patience and
unwavering support during the writing of this dissertation. The journey was a long one, but Hala
made it both bearable and pleasurable. Thank you Hala, I definitely could not have done it
without you. Thanks also to my newborn son Bashir, for giving me the inspiration and
motivation to finish this work.

viii
TABLE OF CONTENTS
LIST OF FIGURES ...................................................................................................................... x
LIST OF TABLES ....................................................................................................................... xi
CHAPTER ONE: INTRODUCTION......................................................................................... 1
CHAPTER TWO: AN OVERVIEW OF RELEVANT LITERATURE ................................. 6
Strategic Alliances: a Review ..................................................................................................... 6 Alliance Formation ................................................................................................................. 7 Alliance Maintenance and Relationships.............................................................................. 13 Assessment of Alliance Performance ................................................................................... 18
The Focus of this Study: Marketing Alliances .......................................................................... 25 Marketing Alliances and the Consumer................................................................................ 25 Branding Alliances................................................................................................................ 29
Consumer Value........................................................................................................................ 30 Value of the Customer for the Firm...................................................................................... 31 Value for the Consumer ........................................................................................................ 32
Customer Satisfaction ............................................................................................................... 34 Antecedents to Satisfaction................................................................................................... 34
Disconfirmation of Expectations ...................................................................................... 35 Equity................................................................................................................................ 36 Performance ...................................................................................................................... 36 Affect ................................................................................................................................ 37
Consequences of Satisfaction ............................................................................................... 39 Word of Mouth Behavior.................................................................................................. 39 Loyalty .............................................................................................................................. 41 Switching Behavior........................................................................................................... 42
Summary ................................................................................................................................... 43
CHAPTER THREE: CONCEPTUAL MODEL AND RESEARCH HYPOTHESES......... 44
Utilitarian and Hedonic Value.................................................................................................. 46 Marketing Alliances and Utilitarian Value ........................................................................... 47
Quality and Number of Alternatives................................................................................. 48 Perceived Product Quality and Lower Perceived Risk ..................................................... 48 Convenience...................................................................................................................... 49
Marketing Alliances and Hedonic Value.............................................................................. 50
Alliance Complementarity: Functional versus Symbolic.......................................................... 52
Consumer Value and Customer Satisfaction ............................................................................ 55

ix
The Route to Satisfaction: Cognitive or Affective..................................................................... 57 Utilitarian Value and Cognitive Response............................................................................ 58 Hedonic Value and Affective Response ............................................................................... 59
Behavioral Outcomes................................................................................................................ 60 Loyalty .................................................................................................................................. 60 Word of Mouth (WOM)........................................................................................................ 62 Switching Behavior............................................................................................................... 64
CHAPTER FOUR: RESEARCH DESIGN AND METHODOLOGY.................................. 67
Study 1: Survey ......................................................................................................................... 67 Pretests: Selection of Alliances............................................................................................. 68 Research Setting and Data Collection................................................................................... 71 Instrument Measures............................................................................................................. 73
Utilitarian and Hedonic Value .......................................................................................... 73 Satisfaction........................................................................................................................ 74 Behavioral Outcomes: Loyalty, Word of Mouth, and Intention to Switch....................... 75
Instruments Reliability.......................................................................................................... 76 Test of Hypotheses................................................................................................................ 77
Studies 2 and 3: Experiments.................................................................................................... 84 Pretests: Selection of Alliances............................................................................................. 85
Study 2: Experiment 1............................................................................................................... 86 Procedure .............................................................................................................................. 86 Measures ............................................................................................................................... 87 Analysis and Results ............................................................................................................. 87
Manipulation checks ......................................................................................................... 87 Instrument Reliabilities..................................................................................................... 89 Results............................................................................................................................... 89
Study 3: Experiment 2............................................................................................................... 93 Procedure .............................................................................................................................. 93 Analysis and Results ............................................................................................................. 94
CHAPTER FIVE: DISCUSSION, IMPLICATIONS AND CONCLUSIONS ..................... 99
Summary and Discussion.......................................................................................................... 99 Managerial Implications ..................................................................................................... 101 Limitations and Directions for Future Research................................................................. 103 Conclusions......................................................................................................................... 105
APPENDIX MEASUREMENT INSTRUMENTS .............................................................. 106
REFERENCES.......................................................................................................................... 124

x
LIST OF FIGURES
Figure 1: Impact on Customer Value, Satisfaction, and Behavioral Outcomes ........................... 45 Figure 2: Mean Utilitarian Value Generated by Functional and Symbolic Alliances .................. 79 Figure 3: Mean Hedonic Value Generated by Functional and Symbolic Alliances ..................... 80 Figure 4: Relationship between Satisfaction and Loyalty ............................................................ 82 Figure 5: Relationship between Satisfaction and WOM............................................................... 82 Figure 6: Relationship between Satisfaction and Intentions to Switch......................................... 82 Figure 7: 4 x 2 ANOVA (Experiment 1) ...................................................................................... 90 Figure 8: Affect scores (Experiment 1) ........................................................................................ 92 Figure 9: 2 x 2 ANOVA (Experiment 2) ...................................................................................... 96 Figure 10: Mean Satisfaction Scores when Performance is Lower than, Meets, and Exceeds
Expectations (Utilitarian Value) ................................................................................. 97 Figure 11: Mean Satisfaction Scores when Performance is Lower than, Meets, and Exceeds
Expectations (Hedonic Value) .................................................................................... 98

xi
LIST OF TABLES
Table 1: Selected Research on the Formation of Strategic Alliances........................................... 10 Table 2: Selected Research on the Dynamics of Strategic Alliances ........................................... 15 Table 3: Selected Research on the Relationship between Alliances and Firm Performance........ 20 Table 4: Selected Research on the Relationship between Consumer Value and Satisfaction ...... 56 Table 5: Pretests Conducted to Select Alliances for Data Collection........................................... 68 Table 6: Alliances Tested and Resulting Functional and Symbolic scores (Ordered
alphabetically)................................................................................................................ 70 Table 7: Intercorrelation Matrix and Summary Statistics............................................................. 76 Table 8: The Moderating Role of Alliance Type in the Relationship between Marketing
Alliances and Customer Value....................................................................................... 78 Table 9: The Mediating Effect of Customer Value in the Relationship ....................................... 81 Table 10: Alliance Scenarios Used for the Experiments and Corresponding Functional and
Symbolic Scores............................................................................................................. 85 Table 11: Utilitarian and Hedonic Values Generated ................................................................... 88 Table 12: 2 x 2 x 2 ANOVA (Experiment 1)................................................................................ 91 Table 13: Utilitarian and Hedonic Values Generated ................................................................... 95

1
CHAPTER ONE: INTRODUCTION In 1966, Adler predicted that “symbiotic marketing will become more and more
important to business.” The author was referring to strategic alliances, the process of pooling
resources to provide benefits to companies that would not be available to either one individually
(Adler 1966). Two decades later, Varadarajan and Rajaratnam (1986) revisited the concept of
symbiotic marketing and reemphasized the importance of strategic alliances. With increasing
costs associated with technology and product development combined with changing consumer
preferences and government regulatory policy, symbiotic relationships offer an “alternative to
internal development, mergers, and acquisitions in regard to various growth opportunities”
(Varadarajan and Rajaratnam 1986).
Today, despite the numerous challenges they present, strategic alliances are increasingly
being used by business organizations in the pursuit of their diverse strategic objectives. The last
two decades have seen an upsurge in alliance formation and the trend is set to continue. A study
by Booz-Allen & Hamilton reports that the use of alliances has grown by 25 percent a year since
1987 (Harbison and Pekar 1997) and a study by Anderson Consulting put the value of the
world’s strategic alliances in 2004 at 40 trillion dollars.
It is no surprise then that academic research on strategic alliances has burgeoned in the
last decade. Scholars have addressed issues as diverse as alliance formation (Beamish and
Killing 1997; Faulkner 1995; Inkpen 2000; Jarillo 1988; Kogut 1988; Oviatt and McDougall
1994), partner selection (Doz and Hamel 1998; Geringer and Frayne 1990; Killing 1983; Stuart
2000; Stuart 1998), alliance form selection (Child and Faulkner 1998; Faulkner 1995; Garrette
and Dussauge 1995; Hennart 1991; Lambe et al. 2002; Parkhe 1993; Varadarajan and

2
Jayachandran 1999), partner relationships and maintenance (Day 1995; Geringer and Hebert
1989; Hunt and Morgan 1997; Morgan and Hunt 1994; Park and Russo 1996; Park and Ungson
1997; Varadarajan and Cunningham 1995), network particularities (Atler and Hage 1993;
Chisholm 1998; Dimaggio and Powell 1983; Goes and Park 1997; Miles and Snow 1986; Powell
1990; Uzzi 1996), as well as issues related to the assessment of alliance performance (Gomes-
Casseres 1989; Hamel 1991; Kogut 1989; Park and Russo 1996; Steensma and Lyles 2000;
Woodcock et al. 1994). Several theoretical perspectives have also been advanced to explain
organizational motives and benefits of strategic alliances. In general, the alliance literature
highlights the positive relationship between alliances and firm performance. Effective alliances
are found to create firm value (Doz and Hamel 1998; Eisenhardt and Schoonhoven 1996), as
reflected in the rents that partners gain which exceed rents generated through alternative
organizational configurations (Ireland et al. 2002; Spekman et al. 1998).
At the time when advances were being made in the theoretical and managerial aspects of
strategic alliances, significant efforts in furthering our understanding of customer behavior was
taking place among consumer researchers (Oliver 1980; Oliver et al. 1997; Tse and Wilton 1988;
Westbrook 1981). Consumer value and customer satisfaction research streams in particular, have
witnessed significant developments in the last decade. Creating consumer value is increasingly
seen as the next source of competitive advantage (Woodruff 1997) and it is of major and
increasing concern to consumers and marketers alike (Patterson and Spreng 1997). On the other
hand, customer satisfaction is a central concept in marketing as it is assumed to be a significant
determinant of repeat sales, word of mouth, and customer loyalty. Its importance has led to a
proliferation of research on the subject over the last two decades.

3
As these three research streams progressed however, parallels between the three areas
have not been investigated. While the literature focuses on how strategic alliances might be of
value to participating firms (by reducing costs or entering new markets for example), it largely
overlooks the questions of whether and how alliances might be of value to consumers. Research
inquiry that explores if and how strategic alliances impact consumer value and customer
satisfaction is virtually non-existent. As Rindfleisch and Moorman (2003) note, “Little is known
about the effect of [interfirm] relations on the broader marketing environment, including their
impact on a firm’s customers, and…research on the impact of [organizational] collaborative
activities on customers is scant at best.” The authors underscore the importance of this issue by
noting that “although cooperative interfirm relations may be beneficial to participating firms,
they may be harmful to their customers” (Rindfleisch and Moorman 2001).
The objective of this research is to fill this gap and extend knowledge of the relationship
between strategic alliances and consumer behavior. We do so by merging the strategic facet of
the literature on interorganizational relationships with the two complementary research traditions
in consumer behavior; consumer value and customer satisfaction (Babin et al. 1994; Day 1983;
Hirschman and Holbrook 1982; Johnson et al. 1995; Mano and Oliver 1993; Oliver and DeSarbo
1988; Woodruff and Gardial 1996). The three perspectives are used to develop a conceptual
framework that explains the process by which strategic alliances impact consumer value,
customer satisfaction, as well as post-purchase behavioral outcomes.
The present research has the potential to make insightful theoretical and managerial
contributions. Theoretically, the research significantly contributes to two major literature
streams. First, the strategic alliance literature is enhanced insofar as this is the first effort aimed
at investigating the impact of strategic alliances on consumer value, satisfaction, and behavior.

4
Pan (2004) recently pointed out this gap in the literature after conducting a meta-analysis of
research on strategic alliances. His results show that only 0.72% of the articles on strategic
alliances in the period between 1999-2003 mention the customer. Most of these studies did not
directly focus on the relationship between strategic alliances and the customer. These findings
echo Brief and Bazerman’s (2003) call to “bring in” consumers into strategic alliance research.
Second, the present research also contributes to the satisfaction literature. Scholars in this
area have traditionally viewed satisfaction as a cognitive response to the comparison of actual
consumption experiences with some comparison standard (confirmation/disconfirmation
paradigm). This paradigm firmly dominates the satisfaction literature1. Recently however, there
has been increasing calls for satisfaction measures to capture not just how the customer thinks
the product performed relative to the comparison standard, but also the resulting customer
emotion (Oliver 1993; Woodruff and Gardial 1996). The argument is that the higher the level of
emotions generated by products and services (both positive and negative), the more motivating
customer satisfaction is in terms of future behaviors such as repeat purchase or word of mouth
(Woodruff and Gardial 1996). The present paper adds to the satisfaction stream of research by
providing evidence of an affective route, in addition to the cognitive route, to customer
satisfaction.
From a managerial perspective, engaging in strategic alliances is strategically critical,
costly, and alternative-laden (Barringer and Harrison 2000; Varadarajan and Cunningham 1995).
While managers have benefited from research outlining the benefits that strategic alliances bring
to the firm, they are in the dark when it comes to understanding if and how strategic alliances
1 Satisfaction has also been modeled as an outcome of equity. We will revisit the equity paradigm later in chapter II when we review the satisfaction literature.
5
affect their customers’ value, and/or what type of value is generated through alliances. By
providing insight into how strategic alliances enhance consumer value, and how in turn value
enhancement is related to customer satisfaction, the present research will help managers make
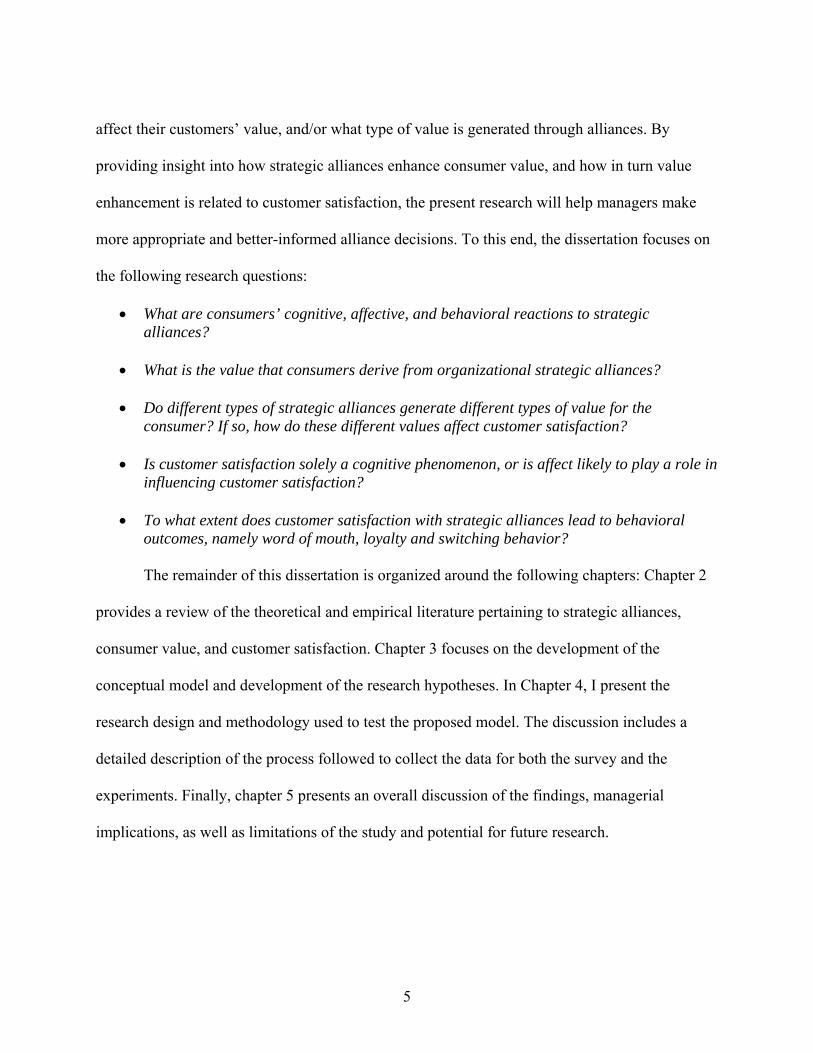
more appropriate and better-informed alliance decisions. To this end, the dissertation focuses on
the following research questions:
• What are consumers’ cognitive, affective, and behavioral reactions to strategic alliances?
• What is the value that consumers derive from organizational strategic alliances? • Do different types of strategic alliances generate different types of value for the
consumer? If so, how do these different values affect customer satisfaction? • Is customer satisfaction solely a cognitive phenomenon, or is affect likely to play a role in
influencing customer satisfaction? • To what extent does customer satisfaction with strategic alliances lead to behavioral
outcomes, namely word of mouth, loyalty and switching behavior?
The remainder of this dissertation is organized around the following chapters: Chapter 2
provides a review of the theoretical and empirical literature pertaining to strategic alliances,
consumer value, and customer satisfaction. Chapter 3 focuses on the development of the
conceptual model and development of the research hypotheses. In Chapter 4, I present the
research design and methodology used to test the proposed model. The discussion includes a
detailed description of the process followed to collect the data for both the survey and the
experiments. Finally, chapter 5 presents an overall discussion of the findings, managerial
implications, as well as limitations of the study and potential for future research.

6
CHAPTER TWO: AN OVERVIEW OF RELEVANT LITERATURE
Strategic Alliances: a Review
The basic premise of strategic alliances research is that interorganizational relationships
help firms by allowing them to share knowledge, gain access to markets, increase speed to
markets, combine resources, and reduce costs (Doz and Hamel 1998). Firms are cognizant of
these potential benefits and are more and more willing to engage in strategic alliances rather than
pursue these benefits on their own (Swaminathan and Moorman 2002). In 1998, America’s
fastest growing companies engaged in 48% more strategic alliances than during the prior three
years. The number of strategic alliance “exploded” to more than 10,200 in 2000 (Ireland et al.
2002), and in 2002, revenues generated from strategic alliances of the 1,000 largest US firms
were assumed to account for 35 percent of their total revenue. This growth in interorganizational
relationships has led alliances to be viewed as an “ubiquitous” phenomenon (Gulati and Singh
1998) and has led to much academic attention devoted to the topic.
The purpose of this section is to review the literature on strategic alliances. A common
theme across the literature is whether interorganizational relationships make sense, and whether
the benefits to the firms outweigh the disadvantages (Barringer and Harrison 2000). Reuer
(2000) suggests that fully benefiting from alliances “requires companies to select the right
partners, adapt to the relationship as needed, and manage the end game appropriately.” I follow
this logical order in the review and organize this section around three major research topics:
alliance formation, alliance maintenance and relationships, and alliance performance. Tables 1,

7
2, and 3 provide an integrative view of the extant literature on alliance formation (table 1),
dynamics (table 2), and performance (table 3).
Alliance Formation
Alliance formation has been generally identified as the phase during which the future
partners conceive an interest in the possibility of forming an alliance, select potential partners,
and negotiate an alliance agreement. Several theoretical lenses have been used to explain alliance
formation. These include transaction cost theory, which views alliances as an intermediate form
of governance between markets and hierarchies (Jarillo 1988; Kogut 1988), resource dependence
theory, which argues that one way to increase power and reduce dependency relative to other
organizations is to engage in interorganizational relationships, thereby accessing critical
resources (Barringer and Harrison 2000). This view sees alliances as a means for stabilizing the
flow of resources and reducing the uncertainties confronted by the company. Another theoretical
perspective used to explain alliance formation is the Resource-Based View (RBV), which
contends that the need for resources or resource utilization leading to sustainable competitive
advantage drives firms to adopt strategic alliances (Lambe et al. 2002). According to RBV,
alliances provide the best alternative in turbulent environments through exchanging or
combining dispersed resources. Institutional theory has also been used to explain alliance
formation and states that firms operating in an industry might have to engage in
interorganizational relationships just to conform to industry norms if participation in these
relationships increases legitimacy and/or is viewed as the "norm" in the industry (Atler and Hage
1993; Baum et al. 2000; Inkpen 2000). Finally, the organizational learning perspective suggests
that organizations can improve their competitive positions through superior knowledge (Simonin

8
1997), and just like interpersonal social ties permit the exchange and access to information
through an individual’s contacts (Burt 1992), strategic alliances can convey access to the know-
how possessed by an organization’s partners (Stuart 2000). This paradigm argues that
interorganizational relationships can be an effective means of transferring knowledge across
organizations since it is difficult for a firm in need of a particular skill to openly buy it in the
marketplace (Mowery et al. 1996). It should be noted that all these theories - and their potentially
derived hypotheses - fare differently depending on the contextual factors surrounding the alliance
and the types of research questions being studied (Kogut 1988).
The literature on alliance formation also addresses the issues of alliance forms (Hennart
1991; Lambe et al. 2002; Parkhe 1993). Firms can engage in horizontal alliances (relationships
between firms carrying out the same activity in the value chain) or vertical alliances
(relationships between partners carrying out different activities in the value chain). Horizontal
alliances are formed between potential competitors who join forces to achieve economies of
scale and are considered to be less stable than vertical alliances. The risk that one partner defects
from the relationship is omnipresent. In vertical alliances (e.g., alliances between buyers and
suppliers), there is no such risk as the partners specialize and operate in different value-chain
activities. Garrette and Dussauge (1995) refer to this distinction as scale versus link alliances.
Finally, research suggests that the choice of a particular partner is an important factor
influencing alliance performance since it has a direct impact on the mix of capabilities and
resources available to the alliance and thus the alliance’s ability to achieve its objectives (Awadzi
1987; Doz and Hamel 1998; Geringer and Hebert 1989; Stuart 2000; Stuart 1998). Stuart (2000)
even argues that the advantage of an organization’s portfolio of alliances might be determined

9
not so much by the portfolio’s size (number of alliances), but by the characteristics of the firms
that the focal organization is connected to.
Select research on strategic alliance formation is presented in table 1. The table focuses
on the different antecedents of alliance formation. As Varadarajan and Cunningham (1995) note,
antecedents can be classified into three major categories, 1) Firm-specific antecedents including
firm size, resource position, prior involvement in strategic alliances, top management attitude
towards strategic alliances, and corporate culture, 2) Industry-specific antecedents such as the
importance of speed of entry into markets where the firm operates, threat of new entrants, threat
of competition from substitutes, cost structure, as well as costs of product development, and 3)
Environment-specific antecedents including changes in buying patterns, degree of market
uncertainty, and rate of technological change. The table highlights the diversity of antecedents
investigated in the literature as well as the major findings of each study.

10
Table 1: Selected Research on the Formation of Strategic Alliances
Study Antecedents Investigated Major Findings Ahuja (2000) - Firm's technical capital
- Firm's commercial capital - Firm's social capital - Number of important inventions
The higher a firm's technical or commercial capital, the greater the number of linkages formed by the firm. The higher a firm's technical and commercial capital, the fewer the number of linkages formed by the firm. The number of new linkages established by a firm is curvilinearly related to its level of social capital. The higher the number of important innovations created by firms lacking technical, commercial and social capital, the higher the number of linkages formed by these firms in subsequent years.
Chung et al. (2000)
- Resource complementarity - Status similarity
Firms with complementary resources and status similarities are more likely to become alliance partners and chances of alliances between two potential partners increase with reciprocal exchanges of alliance opportunities.
Dickson and Weaver (1997)
- Four dimensions of environmental uncertainty: high demand uncertainty, high technological volatility and demand, low predictability of customer demands and competitor actions, demands for internationalization.
Paper studies the relationship between managers' perception of different dimensions of uncertainty and alliance formation. Results support a multidimensional view of perceived uncertainty and the existence of significant variation in the link between environmental uncertainty and alliance use. Manager’s orientation (individualism/collectivism) plays a moderating role.
11
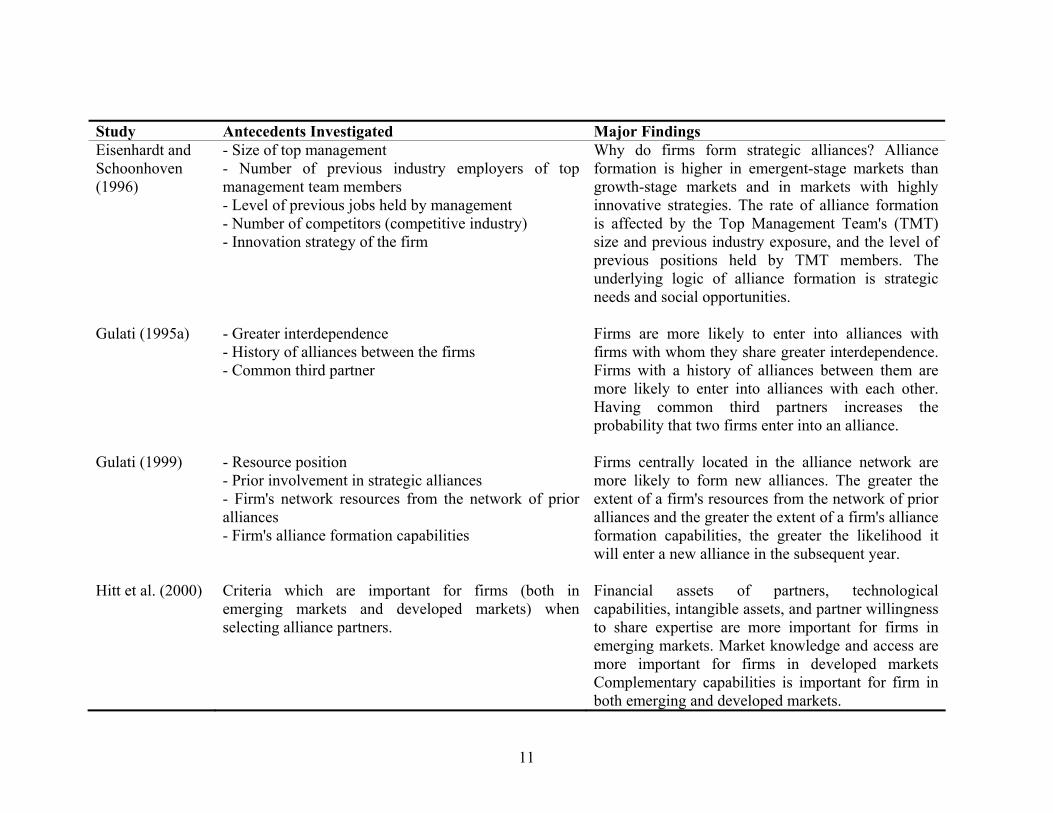
Study Antecedents Investigated Major Findings Eisenhardt and Schoonhoven (1996)
- Size of top management - Number of previous industry employers of top management team members - Level of previous jobs held by management - Number of competitors (competitive industry) - Innovation strategy of the firm
Why do firms form strategic alliances? Alliance formation is higher in emergent-stage markets than growth-stage markets and in markets with highly innovative strategies. The rate of alliance formation is affected by the Top Management Team's (TMT) size and previous industry exposure, and the level of previous positions held by TMT members. The underlying logic of alliance formation is strategic needs and social opportunities.
Gulati (1995a) - Greater interdependence - History of alliances between the firms - Common third partner
Firms are more likely to enter into alliances with firms with whom they share greater interdependence. Firms with a history of alliances between them are more likely to enter into alliances with each other. Having common third partners increases the probability that two firms enter into an alliance.
Gulati (1999) - Resource position - Prior involvement in strategic alliances - Firm's network resources from the network of prior alliances - Firm's alliance formation capabilities
Firms centrally located in the alliance network are more likely to form new alliances. The greater the extent of a firm's resources from the network of prior alliances and the greater the extent of a firm's alliance formation capabilities, the greater the likelihood it will enter a new alliance in the subsequent year.
Hitt et al. (2000) Criteria which are important for firms (both in emerging markets and developed markets) when selecting alliance partners.
Financial assets of partners, technological capabilities, intangible assets, and partner willingness to share expertise are more important for firms in emerging markets. Market knowledge and access are more important for firms in developed markets Complementary capabilities is important for firm in both emerging and developed markets.

12
Study Antecedents Investigated Major Findings Park et al. (2002)
- Market changes - Firm resource
Results indicate that in volatile markets, resource-rich firms access external resources through alliances while resource-poor firms are less likely to do so. However, in stable markets, this relationship reverses and resource-poor firms become more active in alliance formation.
Stuart (1998) - Technological position in the market - Technological prestige
Firms in crowded positions (firm-specific measure of competitor density) and those with high prestige form alliances at the highest rates.
Tsai (2000) - Network centrality - Trustworthiness - Strategic relatedness
This article deals with linkages between units of a single organization. Results show that the interaction between social capital and strategic relatedness significantly affects the formation of intraorganizational linkages. Uses theory of social capital and strategic relatedness.
Varadarajan and Cunningham (1995)
- Firm-specific antecedents include: product-market diversity of firm, firm’s size, resource position, prior involvement in strategic alliances, top management attitude towards SA’s and corporate culture. - Industry-specific antecedents include: importance of speed of entry into market, threat of new entrants, threat of competition from substitutes, cost structure, and costs of product development. - Environmental-specific antecedents include: changes in buying patterns, degree of market uncertainty, rate of technological change, political, legal, and regulatory environment.
Theoretical paper. Provides important insights on the motives, and theory behind the formation of alliances.

13
Alliance Maintenance and Relationships
The form and frequency of partner interaction is heavily influenced by multiple issues
such as the development and maintenance of trust and commitment to the relationship, as well as
the possible occasional disagreements stemming from cultural and governance issues (Day
1995; Hunt and Morgan 1997; Morgan and Hunt 1994; Varadarajan and Cunningham 1995).
Several studies have investigated these issues and their impact on alliance dynamics. Research
investigating trust in alliances found that alliance knowledge becomes more accessible as trust
increases and mutual partner understanding develops (Dussauge and Garrette 1999; Inkpen and
Dinur 1998). However, trust may also deteriorate over the life of the alliance. The drivers to a
potential deterioration in trust include: divergent and/or unrealistic expectations of the alliance
by the partners; a win-lose attitude on the part of personnel involved in the alliance; false
motives on the part of one or both partners; and general corporate morale (Callahan and
MacKenzie 1999).
Another factor that has been shown to be one of the primary determinants of partnership
success is commitment to the alliance (Mohr and Spekman 1994; Moore 1998; Morgan and Hunt
1994). It is defined as the implicit or explicit pledge of relational continuity between exchange
partners (Gundlach et al. 1995). Commitment allows partners to view potentially high-risk
actions as being viable because of the belief that their partners will not act opportunistically.
Because more committed partners will exert more effort and balance short-term problems with
long-term goal achievement, higher levels of commitment are expected to be associated with
alliance success (Mohr and Spekman 1994).
Culture is also a significant factor in alliance relationships. The cultural knowledge
embodied in different corporate cultures can provide a valuable resource for alliances, yet at the

14
same time, it can create obstacles to collaboration between organizations. It has been suggested
that similar corporate cultural values reduce misunderstanding between alliance partners. The
more culturally distant two firms are, the greater the differences in their organizational and
administrative practices, employee expectations, and interpretation of and response to strategic
issues (Park and Ungson 1997). Communications between such partners can be difficult, which
intensifies the already existing coordination problems characteristic to any partnership.
Finally, alliance governance issues have also been addressed. Governance refers to the
process by which partnering firms influence an alliance entity and induce the alliance managers
to behave in a manner that achieves partner objectives (Barringer and Harrison 2000; Inkpen and
Beamish 1997). The relationship between governance and performance is controversial in the
alliance literature. Killing (1982) found that an alliance structured so that one parent is dominant
is more stable and is more likely to be successful than a venture in which management is shared
by partners. Other studies however, found results contradicting Killing’s findings (Blodgett
1992; Child and Stewart 1997). Douma et al. (2000) argue that even if numerous alliance
negotiations frequently struggle because of power issues, it is not important whether one of the
partners has full control or not. Rather, they suggest that the alliance design should enable
effective control management for both partners. The literature presented in table 2 shows that a
variety of theoretical concepts have been used to explain alliance relationships and evolution.
Overall, research shows that while alliances and networks can be beneficial to the firm, a certain
degree of adaptation and adjustment is required for alliance success. Firms must be cognizant of
these constraints and select the most appropriate alliance strategies fitting their needs.

15
Table 2: Selected Research on the Dynamics of Strategic Alliances
Study Topics Investigated Theory (ies) Used Major Findings Afuah (2000)
The relationship between technological change and a firm's relationship with its alliance partners
Resource-Based View
Alliance outcomes and performance of buyer firms are affected by technology obsolescence of supplier firms.
Arino and De la Torre (1998)
Emergence, evolution and dissolution of alliances
Evolutionary Perspective At times, alliance partners have to engage in a renegotiation process. During this process, minor deviations appear to be easily tolerated (or subject to negotiation). Renegotiations of major changes require high levels of trust and goodwill between the alliance partners.
Barkema et al. (1996)
The impact of cultural distance on alliance evolution
Organizational Learning The longevity of an alliance (foreign) is negatively correlated with the cultural distance of the alliance partners and positively correlated with partner’s foreign expansion experience.
Boddy et al. (2000) Case studies focusing on the management of supply chain alliances (Sun Microsystems and Birkbys Plastics)
Structurational model Partners have to be highly adaptive as they often act within contradictory contexts.

16
Study Topics Investigated Theory (ies) Used Major Findings Dyer and Nobeoka (2000)
How are learning networks created and implemented?
Social Network Theory, Knowledge-Based View
A network is more effective than the firm at the generation and transfer of knowledge because of greater diversity. A highly interconnected strong-tie network is better suited for the diffusion of existing knowledge than exploration of new knowledge. The latter is a strength of weak-tie networks. The typical progress of a network is from a number of dyadic-weak ties to a strong ties network.
Gulati (1995b) How social structure (cumulation of prior alliances) affects interfirm alliance formation patterns.
Transaction Cost Economics, Sociological Theory
A shared R&D component increases the likelihood of alliances being equity-based. Firms being from different nations increases the likelihood of alliances being equity based. A higher number of equity alliances between the partners decreases the likelihood of alliances being equity based.
Gulati and Singh (1998)
Governance structures across alliances. Factors that explain the choice of alliance types.
Greater hierarchical governance is associated with alliances in which higher interdependence is expected, where there is a technology component, and in industries with “weak appropriability regimes.”

17
Study Topics Investigated Theory (ies) Used Major Findings Inkpen and Dinur (1998)
International joint ventures and knowledge creation.
Knowledge-Based Perspective
Knowledge management and transfer strategies differ in effectiveness. Some strategies are more effective than others. Firms must be cognizant of these differences and select the most appropriate strategies fitting their needs.
Kale et al. (2000) How can a firm learn skills or capabilities from its partner, while protecting its core proprietary assets or capabilities?
Organizational Learning Theory and Knowledge-Based Perspective
Relational capital between partners enhances learning as well as the ability to protect core proprietary assets.
Kraatz (1998) Relationship between interorganizational networks and adaptive processes.
Social Network Theory Firms in smaller, older, and/or more homogeneous networks are more likely to adapt to changes in the environment.
Kumar and Seth (1998)
Joint venture relationships and adaptation to change
Resource Dependence Theory, Agency Theory
Firms respond to environmental change by using the response used by their network contacts, and by imitating the most successful and similar responses of the network contacts.

18
Assessment of Alliance Performance
Issues related to the impact of alliances on firm performance have been one of the richest
areas of investigation in research dealing with strategic alliances. Table 3 provides an overview
of select works in the area of alliance performance and their findings.
Several approaches have been advanced to evaluate alliance performance. One approach
views performance as a mutual organizational outcome and argues that alliance performance
should take into account the perspectives of the multiple partners involved in the alliance
(Beamish and Killing 1997; Hamel et al. 1989). A different approach suggests that since each
partner has distinct cooperative objectives and unique abilities to acquire alliance benefits, the
focus should be on the individual financial and competitive gains to each partner (Singh and
Mitchell 1996), and therefore alliance performance should be evaluated in terms of the value it
creates to each individual alliance partner (Hamel 1991). Yet another approach argues that since
alliances can be considered as stand-alone entities seeking to maximize their own benefits, their
performance should be evaluated separately, apart from those of the partners (Woodcock et al.
1994). In this vein, the alliance’s longevity and survival have been used as indicators of alliance
performance (Gomes-Casseres 1989; Kogut 1989; Park and Russo 1996; Steensma and Lyles
2000).
Other approaches used to evaluate alliance performance include the use of traditional
accounting figures, such as profitability measures. This line of research has consistently shown
that alliances have positive effects on a number of different measures of corporate performance.
However, accounting measures have been recently criticized for their shortcomings in measuring
the organization’s true economic return (Bharadwaj et al. 1999) mainly because they assess only
one facet of performance. A number of factors, many of them qualitative, are not taken into

19
consideration when using this approach. Rather than relying on accounting measures, some
scholars have measured alliance performance using the Tobin's q ratio, which is the ratio of the
firm's market value to the replacement value of its tangible assets. Tobin’s q is considered to be
superior to simple accounting measures because it incorporates the stock market valuation of the
organization (Montgomery and Wernerfelt 1988). It is considered to be forward-looking, risk-
adjusted, and less susceptible to changes in accounting practices than traditional accounting
measures (Morck et al. 1988). Since strategic alliances represent an intangible asset to the firm,
Tobin's q has been suggested to be a more appropriate measure of performance to capture the
alliance’s true expected benefits.
As shown in table 3, a number of performance measures have been used in the alliance
literature. Two major points emerge from the table. First, the findings overall have been
consistent. There is a positive relationship between alliances and firm performance. Second,
none of the measures used in the literature takes the customer into consideration. The table
shows that all performance measures in previous research are from a firm’s perspective rather
than from a customer’s perspective (stock returns, profit rate, failure rate, reorganization, take-
over, firm’s underwriting activity, mortality, and others.) While critical to a firm’s success,
customer-related measures have not been addressed. A major objective of this dissertation is to
fill this gap in the literature by investigating the relationship and the impact of strategic alliances
on customer-centric performance measures, namely customer satisfaction, word of mouth,
loyalty, and intentions to switch.

Table 3: Selected Research on the Relationship between Alliances and Firm Performance
Study Main Research question Theory (ies)
used Major Findings
Ahuja (2000) How do a firm’s direct ties, indirect ties, and structural holes affect innovation?
Social Network Theory
Direct and indirect ties have positive effects on innovation, while increasing structural holes has a negative effect on innovation
Anand and Khanna (2000)
How do organizations learn to create value from strategic alliances?
Resource -Based View
Learning from a firm's alliances depends on the type of alliance. Effects are stronger for JVs (than for licensing agreements) and for R&D alliances (than other types of alliances like marketing or production).
Barkema and Vermeulen (1997)
How do organizations learn to engage in international joint ventures?
Evolution Theory
The longevity of a foreign joint venture is negatively related to the cultural distance of the partners involved and positively related to the firms’ previous experience in foreign expansion.
Baum and Oliver (1991)
What is the relationship between the institutional linkages of a firm and its mortality rate?
Institutional Theory
Alliances raised organizational survival rates. This effect is more significant for younger, smaller, more specialized organizations, and for those linkages viewed as legitimate. Measure of performance used: Mortality
Baum et al. (2000) Does a startup’s network at founding affect its early performance?
Social Network Theory
Startup biotech firms, who, at the time of their founding, form upstream and downstream alliances and configure them to provide access to more diverse information and less redundancy and conflict exhibit stronger initial performance. This supports the idea that liabilities of newness and smallness result from a lack of resources and stable exchange relationships. Measures of performance used: Year-over-year revenue – R&D spending growth –number of non-R&D employees and dedicated R&D employees – patents.
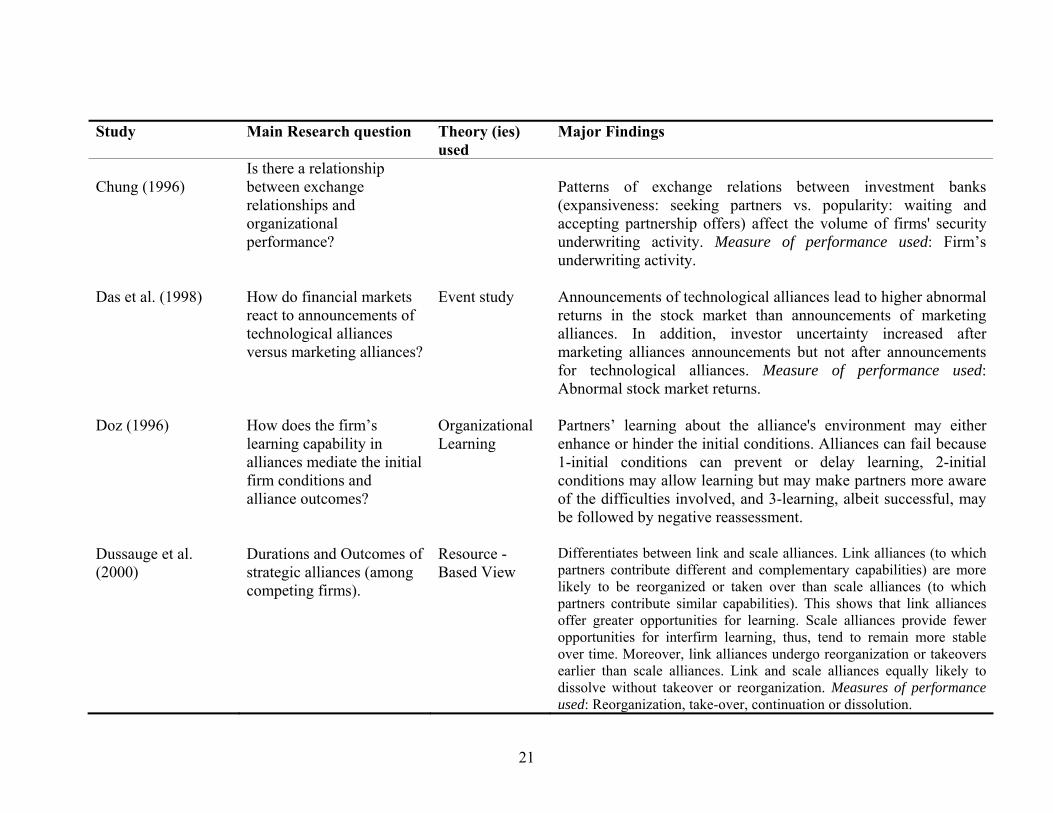
21
Study Main Research question Theory (ies) used
Major Findings
Chung (1996)
Is there a relationship between exchange relationships and organizational performance?
Patterns of exchange relations between investment banks (expansiveness: seeking partners vs. popularity: waiting and accepting partnership offers) affect the volume of firms' security underwriting activity. Measure of performance used: Firm’s underwriting activity.
Das et al. (1998) How do financial markets react to announcements of technological alliances versus marketing alliances?
Event study Announcements of technological alliances lead to higher abnormal returns in the stock market than announcements of marketing alliances. In addition, investor uncertainty increased after marketing alliances announcements but not after announcements for technological alliances. Measure of performance used: Abnormal stock market returns.
Doz (1996) How does the firm’s learning capability in alliances mediate the initial firm conditions and alliance outcomes?
Organizational Learning
Partners’ learning about the alliance's environment may either enhance or hinder the initial conditions. Alliances can fail because 1-initial conditions can prevent or delay learning, 2-initial conditions may allow learning but may make partners more aware of the difficulties involved, and 3-learning, albeit successful, may be followed by negative reassessment.
Dussauge et al. (2000)
Durations and Outcomes of strategic alliances (among competing firms).
Resource -Based View
Differentiates between link and scale alliances. Link alliances (to which partners contribute different and complementary capabilities) are more likely to be reorganized or taken over than scale alliances (to which partners contribute similar capabilities). This shows that link alliances offer greater opportunities for learning. Scale alliances provide fewer opportunities for interfirm learning, thus, tend to remain more stable over time. Moreover, link alliances undergo reorganization or takeovers earlier than scale alliances. Link and scale alliances equally likely to dissolve without takeover or reorganization. Measures of performance used: Reorganization, take-over, continuation or dissolution.

22
Study Main Research question Theory (ies) used
Major Findings
Hagedoorn and Schakenraad (1994)
What is the effect of technology alliances on firm performance, namely profitability?
Patent intensive, i.e. innovative corporations are heavily involved in strategic partnering. Information technology firms have higher cooperation intensity, while process industries have lower inclination to cooperate. Measure of performance used: Economic performance of the firm as measured by Profit rate (or income to sales ratio)
Hamel (1991) How do alliances affect the redistribution of skills among the partners?
Grounded theory development
Not all partners can equally learn from alliances. Differences in learning capability affect the relative bargaining power of partners. Stability and longevity of alliance might be inappropriate measures of success. Partners might have other competitive and collaborative objectives.
Kale et al. (2000) Factors that help an organization learn critical skills from its alliance partners and protect its core assets.
Organizational Learning and Knowledge-Based View
The greater the relational capital between the alliance partners, the greater the degree of learning achieved, and the greater the ability to protect core proprietary assets from the partner.
Lorenzoni and Lipparini (1999)
How does the ability to interact and share knowledge with other firms help the company?
Resource-Based View, Transaction cost Perspective, Knowledge Based View
Relationships with key suppliers provide firms access to complementary capabilities and specialized knowledge with positive effects on the network they are involved in.
Lyles and Salk (1996)
What organizational, structural, and contextual factors affect knowledge acquisition?
Knowledge -Based View
Adaptation mechanisms (capacity to learn, articulated goals) and structural mechanisms (the provision of training, technology, and managerial assistance by foreign partners) are positively related to the amount of knowledge obtained from the foreign IJV partner.

23
Study Main Research question Theory (ies) used
Major Findings
McConnell and Nantell (1985)
How do financial markets react to the announcements of joint ventures?
Event study Equity markets reward parent companies' share prices when they announce joint ventures - the smaller partner earns a larger excess rate. Measure of performance used: stock returns
Mitchell and Singh (1996)
What determines the survival of businesses that use collaborations with other firms in the commercialization of complex goods?
Different Collaborative approaches
Mortality rates of a focal firm increased when its strategic partner ceased operations or established a new alliance with a different firm. Firms using alliances for activities central to an environmental shock are less likely to survive after the shock. Firms using independent approaches to commercialize complex goods are more likely to survive after the shock
Parkhe (1993) Examination of the formation, maintenance, and dissolution of interorganizational strategic alliances.
Transaction cost perspective and game theory
The performance of a strategic alliance is positively related to the length of the "shadow of the future" that is cast and is negatively related to the extent to which the parties perceive each other as behaving opportunistically. The commitment of nonrecoverable investments in a strategic alliance is positively related to performance. Problems encountered by partners after engaging in the alliance can be mitigated by doing things differently at the “front end.” Ex ante attention to structure can improve cooperative performance. Measures of performance used: Fulfillment of major strategic needs. Indirect performance indicators (spillover effects on parent firms, relative profitability, and overall performance assessment).
Powell et al. (1996) How do networks evolve? Social network theory
The greater a firm’s centrality in a network of relationships and experience at managing ties at a given time, the quicker its subsequent growth. The greater a firm’s centrality in a network of relationships, the greater its number of subsequent R&D collaborations.
24
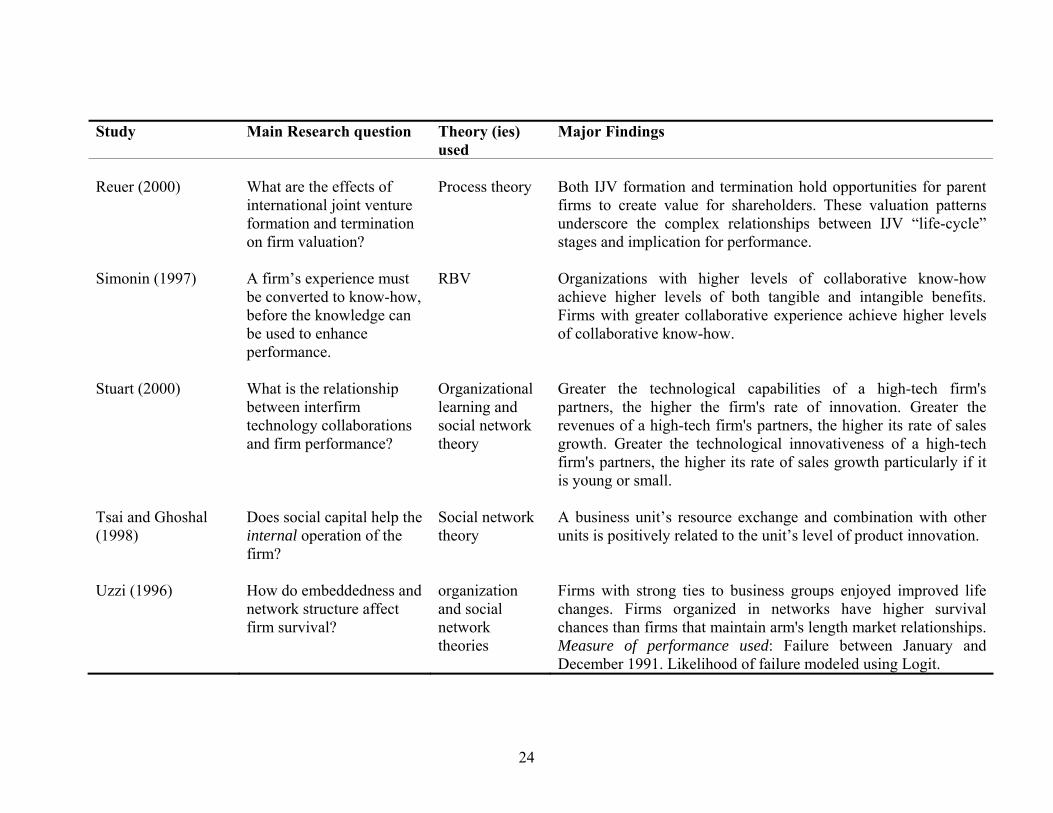
Study Main Research question Theory (ies) used
Major Findings
Reuer (2000)
What are the effects of international joint venture formation and termination on firm valuation?
Process theory
Both IJV formation and termination hold opportunities for parent firms to create value for shareholders. These valuation patterns underscore the complex relationships between IJV “life-cycle” stages and implication for performance.
Simonin (1997) A firm’s experience must be converted to know-how, before the knowledge can be used to enhance performance.
RBV Organizations with higher levels of collaborative know-how achieve higher levels of both tangible and intangible benefits. Firms with greater collaborative experience achieve higher levels of collaborative know-how.
Stuart (2000) What is the relationship between interfirm technology collaborations and firm performance?
Organizational learning and social network theory
Greater the technological capabilities of a high-tech firm's partners, the higher the firm's rate of innovation. Greater the revenues of a high-tech firm's partners, the higher its rate of sales growth. Greater the technological innovativeness of a high-tech firm's partners, the higher its rate of sales growth particularly if it is young or small.
Tsai and Ghoshal (1998)
Does social capital help the internal operation of the firm?
Social network theory
A business unit’s resource exchange and combination with other units is positively related to the unit’s level of product innovation.
Uzzi (1996) How do embeddedness and network structure affect firm survival?
organization and social network theories
Firms with strong ties to business groups enjoyed improved life changes. Firms organized in networks have higher survival chances than firms that maintain arm's length market relationships. Measure of performance used: Failure between January and December 1991. Likelihood of failure modeled using Logit.
25
The Focus of this Study: Marketing Alliances
While the previous section presents an overall literature review on strategic alliances, the
focus of this study is on marketing alliances. Marketing alliances have been defined in a variety
of ways. These definitions can be classified as firm-perspective definitions or consumer-
perspective definitions. From the firm’ perspective, Das et al. (1998) identify marketing alliances
as ones in which the major source of benefit is stimulation of demand. Examples of such
alliances include cross-selling, advertising, and promotion. Such alliances can give
manufacturers entry into new geographical markets or customer segments, thereby increasing
product demand. On the other hand, Bucklin and Sengupta (1993) define marketing alliances as
lateral relationships among firms intended to build user - or consumer - awareness of the benefits
they offer. An important characteristic of the consumer perspective definition is that the
motivation to form these alliances often arises out of demand-side considerations such as
favorable consumer preferences for the products that come out of these alliances, in contrast to
partner-side factors such as mutual liking among alliance partners or cost minimization
(Venkatesh et al. 2000). Ingredient branding, dual branding, and sharing of distribution channels
are examples of such marketing alliances (Das et al. 1998). Alliance products span such diverse
industries as technology (Compaq computers with Intel microprocessors), food products (Diet
Coke with NutraSweet), and financial services (Shell Chase Bank MasterCard).
Marketing Alliances and the Consumer
Hurry (1993) notes that marketing alliances are not only linkages that offer an
opportunity to create value for firms, they also serve as a vehicle to generate value for
consumers. The creation of consumer value through marketing alliances might even be a
26
prerequisite to the creation of firm value (Simonin and Ruth 1996). Surprisingly however, and
despite the fact that customer relationships have been identified as an essential component of
market-based assets (Srivastava et al. 1998; Srivastava et al. 1999) and have long been viewed as
pivotal to any business decisions, the ability of strategic alliances, and particularly marketing
alliances, to create consumer value has rarely been addressed. Although the literature on strategic
alliances has produced a considerable amount of knowledge about the precursors, facilitators,
and outcomes of cooperative interfirm relations, it is clear from the literature review that the
knowledge is largely centered on outcomes tied directly to either the relationship itself or the
firms within it. The effects of interfirm alliances on customers is a largely underexplored issue in
the academic literature (Rindfleisch and Moorman 2003). From a managerial perspective,
McEnally and de Chernatony (1999) note that often, firms lack the insight into consumers that
will allow them to engage in successful alliances. They suggest that firms should make sure they
consider the advantages of engaging in alliances from a consumer’s perspective and only engage
in alliances “that will enable them to create value for the consumer where and when, and under
what conditions, the consumer desires that value.”
Why is it important to assess the impact of marketing alliances on the consumer? There
are two main reasons, one managerial, the other theoretical. From a managerial perspective, no
matter how attractive an alliance might be in terms of cost reduction or access to resources, if the
consumer is not taken into account when committing to an alliance strategy, the alliance might
fail. Simonin and Ruth (1996) highlight the importance of customers in interorganizational
collaborations and note that for an alliance to be successful, customers “should be given respect
and attention” when deciding to engage in a strategic alliance.” A case in point is the alliance
between AT&T and British Telecom. Launched in 1998, it was backed by $10 billion and two of

27
the world's most respected telecommunication companies. The alliance failed in less than two
years. The reason often cited for this failure is that the alliance did not provide any type of value
for customers. Both companies failed to assess the impact of their alliance on their customers
before engaging in the alliance. Another example is Apple’s Newton MessagePad, launched in
1993 as a result of an alliance between Apple and ARM. Despite promising sales in the
introduction stage, sales figures were well below anticipated. The reasons for the alliance’s
worse than expected sales have been summarized as “the failure of the product to provide the
consumer with any value” (Minshall 1999). Not only does the alliance run the risk of failure if
the customer is not taken into account, but the alliance might turn out to be detrimental to the
firm. A relatively unknown weak brand (brand A) might be doing very well targeting a limited
niche market. If the brand decides to partner with a stronger better-known brand (brand B),
customer expectations of brand A might rise to match their expectations of the stronger brand B
because of the new brands association. If brand A can not deliver its products or perform its
services in accordance with the new and higher expectations of consumers, this might lead to
lower satisfaction levels for brand A’s products and services. Therefore, strategists and
executives should thoroughly investigate the relevance and foresee the meaning and implications
of strategic alliance decisions on the ultimate downstream link of the firm’s value chain:
customers (Simonin and Ruth 1996).
From a theoretical perspective, although interfirm cooperation has been shown to be
beneficial for organizations, their effect on consumers is not as clear. Two divergent schools of
thought present different views on this debate. Under the assumption that competition among
firms is beneficial for consumers, the first view argues that collaborations among firms are
largely procompetitive because alliances help firms reduce risk and lower costs. In this vein,
28
Teece (1992) argues that because interorganizational relationships allow firms to gain access to
critical industry information, they support rather than impede innovation and competition, and
therefore enhance consumer welfare (Clarke 1983; Teece 1992). On the other hand, opponents of
interorganizational relationships argue that although strategic alliances benefit participating
firms, some types of alliances might do so to the detriment of customers. That is because firms
tend to reduce their in-house research and development activities, which in turn reduces
incentives for independent innovative activity. This has a negative impact on competition, and
ultimately on the consumer.
Rindfleisch and Moorman (2003) note that although both viewpoints have theoretical
merit, neither side has much empirical evidence: “The scant research conducted in this area only
indirectly tackles the issue of how interfirm cooperation affects customers, because it is largely
derived from econometric models that are based on macromarket indicants, such as industry
price movements…The effects of interfirm cooperation on customers is thin in terms of
empirical verification.”
Moreover, investigating marketing alliances’ relationship with consumers will help
further explain how alliances create value. According to Anand and Khanna (2000), alliances
create [firm] value. They note however that “there is (still) widespread recognition of the
difficulty inherent in this process of value creation, as evidenced by the large fraction of firms
that fail to do so and by the numerous academic publications highlighting the failure of
alliances.” The authors raise a major question: “what then drives [firm] value creation in
alliances?” A possible answer (that this study investigates) is that the enhancement of consumer
value generated by strategic alliances contributes to the enhancement of firm value.

29
Branding Alliances A stream of research that somewhat addresses the link between firm alliances and the
consumer is the literature on branding alliances (Park et al. 1996; Simonin and Ruth 1998).
Largely based on Heider’s (1945; 1958) balance theory, this literature stream holds that
consumers seek to maintain consistency or internal harmony among their attitudes, values and
opinions (Tellis 1988) and suggests that if an unknown or less preferred brand is paired with a
well known brand, consumers’ evaluation of the unknown brand may be enhanced (Levin et al.
1996; Rao and Ruekert 1994; Vaidyanathan and Aggarwal 2000). Simonin and Ruth (1998) for
example, reported research that focused on spillover effects of brand alliance evaluations on the
later evaluations of partner brands. Their findings show that consumers’ attitudes toward the
individual brands influence their subsequent attitudes toward the brands comprising the alliance.
Rao and Ruekert (1994) suggest that brands in an alliance provide the buyer with a signal of
product quality, thereby enhancing consumer product perceptions. In a taste-test study examining
the effects of a branded ingredient on evaluations of a host brand, Levin et al. (1996) found that
adding a well-known branded ingredient improved product evaluations of both unknown and
well-known host brands more than when an unknown branded ingredient was added. Similarly,
Vaidyanathan and Aggarwal (2000) found that adding a well-known brand of raisins to a
fictitious private-label brand of raisin bran improved product attitudes towards the private-label
brand compared to a “non-aligned” strategy. Rao et al. (1999) examined if a brand alliance
would signal unobservable product quality when the host brand name could not do so by itself.
Their findings indicate that brand alliances were effective signals of unobservable product
quality. Finally, Park et al. (1996) used the concept specialization model (from concept
combination theory) to understand brand alliances. Based on this theory, they suggest that a

30
positive transfer of affect will occur from a primary brand to a secondary brand engaged in a
branding alliance.
Although research on branding alliances focuses on buyer behavior, none of these studies
examines if and how alliances “generate” value for the consumer, and what type of value is
generated. The main focus is to investigate how a brand is affected when partnering with another
brand and if and how affect is transferred from one brand to another. Moreover, the relationship
between consumer value enhanced through alliances and customer satisfaction has not been
addressed in this literature.
In sum, extant research reported in both the strategic alliance and the branding alliance
literatures suggests that scholars have tended to ignore the relationship between strategic
alliances and consumer behavior. A closer look at how alliances contribute to the enhancement
of consumer value and customer satisfaction is warranted. The next two sections review
literature pertaining to these two research streams. Focusing on marketing alliances, we then
introduce our conceptual model describing how alliances enhance consumer value and customer
satisfaction, and how the type of alliance plays a moderating role in enhancing consumer value.
Consumer Value
Both academics and the business community have acknowledged the growing importance
of consumer value (Day 2000; Goodwin and Ball 1999; Parasuraman 1997; Sweeney et al.
1999). This concept has even been referred to as the new “marketing mania” (Sinha and DeSarbo
1998) mainly due to the belief that consumer value is the foundation for “true” customer loyalty
(Reichheld 1996). In the marketing literature, this notion is sometimes referred to solely by the
word “value” and is given a consumer orientation within the context it is used. For example,
31
Bolton et al. (2000) state that “customers make repatronage decisions on the basis of their
predictions concerning the value of a future product/service” and Hallowell (1996) suggests that
“satisfaction is the customer’s perception of the value received in a transaction or relationship.”
Consumer value however, has been used in numerous contexts and with different
meanings. Grönroos (2000) notes that in the marketing literature, value has been used mainly to
address two notions: (1) the “value of customers for the firm” or what the customer can deliver
(to the firm). This notion later has been conventionally referred to as the “customer lifetime
value” (Grant and Schlesinger 1995), and (2) the “value for the customer”, or the value the
customer derives from the firm’s offerings. Both concepts are important to our study and
therefore, we next elaborate on each one.
Value of the Customer for the Firm
This stream of research looks at the value of the customer to the firm. As such, it focuses
not on the creation of value for the customer but on the value outcome that the firm can derive
from providing and delivering products and services to the customer. Perspectives under this
research stream include the customer lifetime value (CLV) and work on customer retention
(Payne and Holt 2001).
Early work in the CLV area was undertaken by Reichheld and Sasser (1990), who looked
at the net-present-value profit improvement of keeping customers. They undertook empirical
research, which identified that in a number of service and business-to-business organizations, a
five-percentage-point increase in retention could yield up to 125% improvement in net present
value profits. This was calculated using the concept of CLV, defined as the net present value of
the future profit flow over a customer's lifetime. This work later led to a stream of publications in

32
this area (Dawkins and Reichheld 1990; Kenny and Reichheld 1990; Reichheld 1996; Reichheld
1993).
Other researchers looked at the value the firm derives from retaining customers. Rust and
Zahorik (1993) and Rust et al. (1995) outline procedures for assessing the impact of customer
satisfaction and quality improvement efforts on customer retention and market share. Payne and
Frow (1997) empirically examine the impact of marketing programs aimed at retaining existing
customers and acquiring new customers. Other work on customer retention has been undertaken
by Ennew and Binks (1999), who examined the links between customer retention/defection and
service quality; and Page et al. (1996) who used an empirical approach to analyzing defections’
impact. The general conclusion of this research is that the cost of retaining customers is generally
much less than the cost of acquiring new customers.
Value for the Consumer
As opposed to the value that customers bring to the firm, this stream of research focuses
on the value that the customer derives from the firm’s offerings (demand-side). Several different
names were used in the literature to describe similar demand-side notions of value. Some authors
even used different names to refer to the same idea within the same paper. Examples of names
used to describe value for the customer include “customer value” (Holbrook 1996; Woodruff
1997), “consumption value” (Sheth et al. 1991), “net customer value” (Butz and Goodstein
1996), “perceived service value” (LeBlanc and Nguyen 1999), “expected value” (Huber et al.
1997), and “buyer value” (Slater and Narver 1994). Consumer value here is conceptualized as
the benefits derived from the consumption-related experience (Woodall 2003).

33
The area of superior customer value creation has been the focus of much research interest
in the 1990s (Day 1990; Gale and Wood 1994; Naumann 1995; Scott 1998). This body of work’s
main premise is that a company's success depends on the extent to which it delivers to customers
what is of value to them. In an effort to better understand how consumers derive value from firm
offerings, several typologies of consumer value have been developed. Sheth et al. (1991) identify
five types of value: functional, social, emotional, epistemic, and conditional. Gassenheimer et al.
(1998) distinguish between economic value and social value in a business-to-business setting.
Woodruff and Gardial (1996) identify value in-use and possession value. Richins (1994) lists
different types of value that the consumer can derive from possessions. These include utilitarian
value, enjoyment, representations of interpersonal ties, and identity and self-expression. Burns
(1993) describes how four types of value, i.e., product value, value in use, possession value, and
overall value, interact together in a consumer’s evaluation process. Adopting a customer
perspective on value, Woodruff (1997) draws on several of these value concepts to define
consumer value as a “customer’s perceived preference for and evaluation of those product
attributes, attribute performances, and consequences arising from use that facilitate achieving the
customer’s goals and purposes in use situations.”
While several value typologies have been suggested, there is agreement that two value
dimensions maintain a basic underlying presence across consumption experiences: utilitarian
value and hedonic value (Babin et al. 1994; Batra and Ahtola 1990; Voss et al. 2003; Woodruff
and Gardial 1996). Utilitarian value is derived from functional needs and typically involves
products that are considered practical or necessary rather than pleasurable or fun. Hedonic value
designates those facets of consumer behavior that relate to the multi-sensory, fantasy and
emotive aspects of one’s experience with the product. Consumer emotive response is a key

34
criterion in hedonic consumption (Hirschman and Holbrook 1982). This two-dimensional
approach can be typified as one of thinking versus feeling (Mano and Oliver 1993). I will
elaborate more on these two value dimensions in chapter 3 when the conceptual model is
introduced.
I turn now to a review of the literature on the third research stream making up the
conceptual framework, namely customer satisfaction.
Customer Satisfaction
Customer satisfaction has come to represent an important cornerstone for customer-
oriented organizations (Szymanski and Henard 2001). The concept emphasizes delivering
satisfaction to consumers and obtaining profits in return (Yi 1990). Customer satisfaction is
important to marketers because it is generally assumed to be a significant determinant of repeat
sales, positive word-of-mouth, and customer loyalty. It is important to consumers because it
reflects a positive outcome following the outlay of scarce resources and/or the positive
fulfillment of prior needs. Thus, maximizing satisfaction is seen as an important objective for
both the firm and the consumer.
Antecedents to Satisfaction
Many studies have investigated the antecedents of customer satisfaction. One line of
research has looked at demographic and socio-psychological factors as possible determinants of
customer satisfaction (Mason and Himes 1973; Westbrook et al. 1978). Customer satisfaction
has been found to increase with personal competence (Westbrook et al. 1978) and age (Pickle
and Bruce 1972) and to decrease with family income and education (Mason and Himes 1973;

35
Pickle and Bruce 1972). Race and marital status have also been found to be correlated with
satisfaction (Pfaff 1972). Overall however, support for the relationship between satisfaction and
these variables appears to be weak (Yi 1990).
Disconfirmation of Expectations
Another line of research focuses on post-purchase evaluation of product performance by
relating it to cognitive processes such as confirmation or disconfirmation of expectations.
Customer satisfaction here is viewed as essentially a response to an evaluation of product
performance compared to expectations. The confirmation/disconfirmation paradigm firmly
dominates this line of research (Bitner 1990; Woodruff and Gardial 1996). The paradigm states
that customers arrive at satisfaction feelings as a result of the comparison between the perceived
performance of the product or service and some preceding standard, such as pre-exposure
expectations of performance. If the brand's performance is seen as equal to (confirming) what
was expected, the customer is satisfied. If the brand's performance exceeds (positively
disconfirming) expectations, the customer is very satisfied. If the brand's performance falls short
of (negatively disconfirming) expectations, the customer is dissatisfied. Theoretical support for
the paradigm stems from adaptation level theory (Helson 1964), which posits that individuals
perceive stimuli only in relation to an adapted standard. The confirmation/disconfirmation
paradigm has been widely accepted as the process by which consumers are satisfied or
dissatisfied (Wirtz et al. 2000)2.
2 Consumer expectations have also been suggested as antecedents to satisfaction. Their role has been controversial. Some studies have argued that expectations and disconfirmation are unrelated and have additive effects on satisfaction (Oliver, 1980; Oliver and Linda 1981; Westbrook and Reilly 1983). The prevailing view however is that expectations affect satisfaction indirectly through disconfirmation (Anderson and Sullivan 1993).

36
Equity Equity theory argues that individuals compare their outcome/input ratio with the ratio of
other constituents in the relationship. In the context of customer satisfaction, consumers will
compare the marketer’s net gain to theirs. Consumers will be satisfied when they perceive that
the outcome-to-input ratio is fair. Fisk and Young (1985) tested equity theory in a customer
satisfaction context. Their results supported the hypothesis that inequity leads to dissatisfaction
and reduces repurchase intent of the product. Swan and Oliver (1985) found that both
disconfirmation and inequity were antecedents to satisfaction. Both variables had independent
and additive effects on satisfaction. An interesting result of this study showed that only negative
inequity led to dissatisfaction. Contrary to the theory’s predictions, positive inequity (where
consumers receive disproportionately greater outcomes) did not produce dissatisfaction, and was
perceived as fair and satisfactory by consumers.
Performance
Performance has also been modeled as directly affecting satisfaction (Halstead et al.
1994; Oliver and DeSarbo 1988). This stems from the notion that customers are likely to be more
satisfied with the offering as the ability of the offering to provide consumers what they need,
want, or desire increases relative to the costs incurred (Szymanski and Henard 2001). Therefore,
several studies included performance as a predictor of satisfaction, along with expectations and
disconfirmation (Oliver and DeSarbo 1988; Tse and Wilton 1988). Churchill and Surprenant
(1982) even found that satisfaction was only determined by the performance level; neither
expectations nor disconfirmation had an effect. While a few studies find a direct effect of
performance on satisfaction, there seems to be agreement that performance indirectly affects

37
satisfaction through disconfirmation. In agreement with the confirmation/disconfirmation model,
Tse and Wilton (1988) for example, found that perceived performance had indirect effects on
satisfaction through its effect on disconfirmation.
Affect
The importance of emotions in the area of consumer behavior has been firmly established
(Richins 1997). The role of affective processes in areas such as product use (Mehrabian and
Wixen 1986), possessions (Schultz et al. 1989), or more generally in different consumption
situations (Havlena and Holbrook 1986; Richins and Dawson 1992) have all been examined.
Emotions have been found to be an important component of consumer response. Research
findings from the areas of psychology and marketing have shown that affective states influence
many aspects of consumer behavior (Dube et al. 1991; Gardner 1985). For example, Abelson et
al. (1982) found that affect patterns significantly predicted political preferences, and that their
predictive ability was independent of - and even exceeded - that of the respondent’s cognitive
evaluations of candidates. Based on Izard’s (1977) Differential Emotions Scale (DES),
Westbrook (1987) posited that consumers form two summary affect states, one based on the
positive affects in consumption and the other on the negative affects. Using two different product
categories (cars and cable TV), he showed that the positive and negative affect categories
contributed independently and significantly to satisfaction judgments. Moreover, these
relationships held up to the introduction of disconfirmation (cognition) in the satisfaction
equations (Laroche et al. 1996; Westbrook 1987). This was an important step in satisfaction
research as it opened the possibility that satisfaction is neither purely cognitive nor purely
affective in content (Oliver 1997). And while most research has been devoted to the cognitive
38
process of expectancy-disconfirmation, more recent literature suggests that affective processes
may also substantially contribute to the explanation and prediction of customer satisfaction
(Fornell and Wernerfelt 1987; Oliver et al. 1997; Westbrook 1987; Westbrook and Oliver 1991).
Oliver (1993) presents a framework where satisfaction evaluations are affected by both cognitive
and affective variables. Cognitive antecedents include expectations, performance,
disconfirmation, attribution, and equity. Positive/negative affect is presented as augmenting the
effect of these variables on satisfaction.
Mano and Oliver (1993) examined a full circumplex of emotions along with measures of
utilitarian and hedonic value. The affect circumplex was fully supported in the context of
consumption satisfaction and results suggested that the nature of the product features (utilitarian
versus hedonic) provides some of the structure of the satisfaction response. When put in a causal
framework, satisfaction proved to be a significant function of positive affect, negative affect, and
utilitarian influence, while hedonic affect operated through positive affect. This provided further
evidence for the joint operation of product influences and emotion on satisfaction (Mano and
Oliver 1993; Oliver 1997). The separate influences of positive and negative affect on satisfaction
were also corroborated in other studies. Evrard and Aurier (1996) found parallel effects of
positive and negative affect on satisfaction measures of moviegoers, while Price et al. (1995)
found that emotions fully mediated the relationship between service performance and satisfaction
in the case of recreational white-water rafters.
As a result, a few researchers have advocated the use of emotion-based measures in
customer satisfaction (Westbrook and Oliver 1991), arguing that satisfaction is likely to
comprise an element of affect or feeling, and that satisfaction measures should also capture the
resulting customer emotion (Woodruff and Gardial 1996). There is increasing recognition among

39
satisfaction researchers that a purely cognitive approach may be inadequate in modeling
satisfaction evaluations, and that consumers’ evaluative judgments are based partly on cognition
and partly on affective responses to a product stimulus (Oliver et al. 1997). This increasing
importance is in part due to the relationship between affect and consumer future behaviors.
Typically the more customer emotion is generated by products and services, the more motivating
customer satisfaction will be in terms of satisfaction outcomes, such as repeat purchase and word
of mouth.
Customer satisfaction therefore appears to be not solely a cognitive phenomenon. It
might be influenced by other general states of affect concurrently experienced by the individual.
The emerging body of theory and evidence discussed suggests that the two dimensions, positive
and negative affect, would be useful in understanding the affective basis for the satisfaction
response (van Dolen et al. 2002). The conceptual model presented in this study (chapter III)
accounts for the unique affective content of the consumer satisfaction response.
Consequences of Satisfaction
Relative to the antecedents of satisfaction, fewer studies investigate the consequences of
satisfaction. Anderson and Sullivan (1993) underline the need for developing a deeper
understanding of the consequences of satisfaction. The focus in this study is on the behavioral
responses that dominate the customer satisfaction literature, namely word of mouth, loyalty, and
switching behavior (Zeelenberg and Pieters 2004; Zeithaml et al. 1996).
Word of Mouth Behavior
Researchers have examined word-of-mouth as one of the consequences of customer
satisfaction or dissatisfaction. Word of mouth behavior includes negative and positive word of

40
mouth (NWOM and PWOM respectively). NWOM is expected to increase in the face of a
dissatisfying experience, particularly if the product or service failure is severe, attributions for
the failure are external, or the seller’s responsiveness to complaints is perceived negatively by
the customer (Richins 1983; Szymanski and Henard 2001). Nyer (1999) lists the reasons that
might lead consumers to engage in NWOM. These include getting back at the organization by
informing others of disappointing offerings, releasing tension, gaining sympathy from others,
regaining control over a distressing situation, and conveying to others one’s high standards (Nyer
1999). Curren and Folkes (1987) examined whether attributions for product performance
influenced NWOM and PWOM about products. Their findings suggest that controllability
(whether or not the seller had control over product failure), temporal stability (whether causes
are perceived to fluctuate or remain constant over time), and locus (seller-related versus buyer-
related) dimensions of consumer attributions influence consumers' desires to communicate about
products (both positive and negative communications).
In sum, the degree of (dis)satisfaction with a consumption experience has been shown to
be a key antecedent of WOM (Bitner 1990; Swan and Oliver 1989). I will revisit the relationship
between satisfaction and WOM later when discussing the conceptual framework.

41
Loyalty Oliver (1997) defines customer loyalty as a "deeply held commitment to rebuy or
repatronize a preferred product or service consistently in the future, despite situational influences
and marketing efforts having the potential to cause switching behavior." Customer loyalty has
been subject to a number of investigations in the last decade (Anderson and Sullivan 1993;
Fornell et al. 1996). The rationale behind this stream of research is that firms that achieve higher
loyalty levels should be more successful in the marketplace due to retained customers' higher
price tolerance (Reichheld and Sasser 1990). Therefore, much research has been directed at
identifying the drivers of customer loyalty (Keaveney 1995; Mittal and Kamakura 2001).
Social exchange theory posits that exit or maintenance of exchange relationships depends
on future expectations regarding costs and benefits of the relationship, weighted against the
expected benefits of alternative relationships (Thibaut and Kelley 1959). In short, in the event
that an individual has multiple options, s/he will choose the most beneficial relationship, and s/he
will remain in that relationship as long as expectations regarding costs and benefits from the
relationship are higher than a threshold, called the comparison level of alternatives.
Expectations regarding costs and benefits of the relationship mainly depend on past
experience, and satisfying experiences increase the motivation and the likelihood that an
individual remains in the relationship. Therefore, a positive relationship between customer
satisfaction and customer loyalty is in accordance with social exchange theory. Thus, there is
wide agreement that customer satisfaction is one of the key factors in determining customers’
loyalty levels3 (Anderson and Mittal 2000; Bloemer and Kasper 1995; Mittal et al. 1998).
3 A few researchers have pointed out that the link between satisfaction and loyalty is subject to moderating variables (Homburg et al. 2001). This issue is beyond the scope of this study.

42
Switching Behavior
Switching refers to customer’s termination of a relationship with a provider. Zeelenberg
and Pieters (2004) note that this termination may either be followed by initiating a relationship
with another provider, refraining from purchasing the product/service altogether, or in the case of
services, by the consumer performing the service him/herself. Several researchers have shown
that dissatisfied customers are more likely to switch than satisfied ones (Ganesh et al. 2000;
Oliver 1997; Rust and Zahorik 1993; Szymanski and Henard 2001; Zeelenberg and Pieters
2004). Causes leading to customer switching behavior include perceptions of poor quality (Rust
and Zahorik 1993), overall dissatisfaction (Crosby and Stephens 1987), and service encounter
failures (Kelley et al. 1993). Zeithaml et al. (1996) also conclude that dissatisfaction with service
quality is positively associated with unfavorable behavioral intentions (intent to switch).
It is noteworthy that some researchers argue that although low satisfaction may be one
factor leading to switching behavior, it is not the only one. Keaveney (1995) for example,
proposed eight factors that might lead to switching behaviors including price, inconvenience, and
ethical problems. Bitner (1990) cites time, money constraints, access to information, and habit
among the factors that might lead to switching behavior. Still, some of these factors might
actually work through satisfaction. As suggested by Cronin and Taylor (1992), convenience (or
lack thereof), value for money, or availability might affect customer satisfaction and
subsequently behavioral intentions.

43
Summary
This chapter presented a review of extant research on strategic alliances, consumer value,
and customer satisfaction. Issues related to alliance formation, alliance relationships, and alliance
performance were addressed. The review of the satisfaction literature addressed issues related to
antecedents and consequences of satisfaction, as well as the processes by which satisfaction is
formed. Finally, the review of the literature on consumer value shows that the term has been used
in numerous contexts. Therefore, a distinction was made between value of the customer for the
firm and value for the customer. The different typologies of consumer value were reviewed, and
it is concluded that while several value typologies have been suggested in the literature,
utilitarian value and hedonic value maintain a basic underlying presence across all consumption
experiences. The review highlighted both the managerial and theoretical need for more research
investigating the impact of strategic alliances on what is considered the most important
constituent of the firm: the consumer. The review also shows that while the cognitive route to
customer satisfaction is widely agreed upon, calls for investigation of the affective route to
satisfaction have been sparsely answered.
The model introduced in the next chapter addresses these issues. The framework draws
insight from all three literature streams to describe how alliances generate value for the customer
and how in turn, value leads to satisfaction. The framework also explicates the different
processes that lead to satisfaction, namely the cognitive and the affective processes.

44
CHAPTER THREE: CONCEPTUAL MODEL AND RESEARCH HYPOTHESES
The previous chapter presented a review of the strategic alliances, consumer value, and
customer satisfaction literatures. The chapter highlighted two major points: (1) the paucity of
research investigating the relationship between marketing alliances, consumer value, and
customer satisfaction, and (2) the need for more research investigating the affective route to
customer satisfaction. The conceptual framework introduced in this chapter (figure 1) attempts to
address these points. The framework describes how alliances generate and enhance consumer
value, and examines consumers’ cognitive, affective, and behavioral reactions to marketing
alliances. The framework seeks to integrate literature from the fields of strategic alliances,
consumer value, and customer satisfaction. The following sections provide the rationale for
including the selected variables and conclude with research hypotheses about the different
relationships in the model.
The fundamental premise of this study is that to be successful in the long run, a
marketing alliance needs to enhance consumer value. Figure 1 illustrates how marketing
alliances fulfill that objective. The model depicts marketing alliances as potentially enhancing
two types of consumer value: utilitarian and hedonic. The type of consumer value enhanced
depends on the type of alliance under consideration - either functional or symbolic. Consumer
value enhancement in turn, results in enhanced customer satisfaction through two separate
routes, cognitive for utilitarian value, and affective for hedonic value. Finally, customer
satisfaction leads to consumer behavioral responses including loyalty, word of mouth, and
decreased likelihood of switching behavior.

45
Figure 1: Impact of Marketing Alliances on Customer Value, Satisfaction, and Behavioral Outcomes
Affective Route
Marketing Alliance
Customer Value
Type of Marketing Alliance
Satisfaction/ Dissatisfaction
Behavioral Outcomes
Loyalty WOM Intentions to switch
Positive affect Negative affect
Cognitive Route
Utilitarian
Hedonic
Expectations
Performance
Disconfirmation

46
As previously mentioned, marketing alliances are lateral relationships among firms
intended to amplify or build user awareness of the benefits that they offer. Marketing alliances
enable firms to provide connectivity across complementary products of importance to consumers
without requiring firms to move beyond their core competencies (Bucklin and Sengupta 1993).
From a firm’s perspective, marketing alliances can generate higher sales from existing markets
as well as open additional opportunities with new consumers and channels, reduce the cost of
product introduction, as well as accelerate potential adoption (Keller 2003). From a consumer’s
perspective, marketing alliances enable firms to offer their customers greatly enhanced benefits
and value, often at little cost to their mainstream operations (Bucklin and Sengupta 1993; Das et
al. 1998; Rindfleisch and Moorman 2003). Marketing alliances can enhance either utilitarian or
hedonic value.
In the following sections, I first describe the meaning of utilitarian value and hedonic
value, and then depict their relationship to marketing alliances. Next, the moderating role of
complementarity (functional versus symbolic) in the relationship between marketing alliances
and value is introduced.
Utilitarian and Hedonic Value
It is now well recognized that some types of consumption experiences are more likely to
evoke pleasure than others. Based in part on this assessment, a distinction has recently been
drawn between hedonic and utilitarian consumption (Dhar and Wertenbroch 2000; Hirschman
and Holbrook 1982; Holbrook and Hirschman 1982). Batra and Ahtola (1990) note that
“consumers purchase goods and services and perform consumption behaviors for two basic
reasons: (1) consummatory or affective (hedonic) gratification, and (2) instrumental, utilitarian

47
reasons.” Although the consumption of many goods involves both dimensions to varying degrees
(Batra and Ahtola 1990), consumers do characterize some product experiences as primarily
hedonic and others as primarily utilitarian (Dhar and Wertenbroch 2000). Hedonic goods are
ones whose consumption is primarily characterized by an affective and sensory experience of
aesthetic or sensual pleasure, fantasy, and fun - the word “hedonism” is defined as the “doctrine
that pleasure is the highest good; the pursuit of pleasure; a life-style devoted to pleasure-seeking
(Hopkinson and Pujari 1999). Utilitarian goods are ones whose consumption is more cognitively
driven, instrumental and goal oriented, and accomplishes a functional or practical task (Dhar and
Wertenbroch 2000; Hirschman and Holbrook 1982; Strahilevitz and Myers 1998). This
dichotomy has been represented in the retail context by shopping as a necessity or work (Fischer
and Arnold 1990) versus the festive more enjoyable view of shopping as fun (Babin et al. 1994;
Sherry 1990). While many motivations can exist as shopping goals (Childers et al. 2001), most
typologies consider utilitarian and hedonic motivations as fundamental to understanding
consumer behavior because “they maintain a basic underlying presence across consumption
phenomena” (Babin et al. 1994; Childers et al. 2001). This study therefore adopts this two-
dimensional conceptualization of consumer value in the context of marketing alliances.
Marketing Alliances and Utilitarian Value
Utilitarian value generally relates to such attributes as performance, reliability, and
convenience. Thus, a consumer basing her buying decision on utilitarian value would consider
whether the functional or physical attributes inherent in the product are needed, if the product
possesses desired functional attributes, and/or how convenient it is to acquire the product.
Marketing alliances enhance consumer utilitarian value by contributing to the improvement of

48
product quality, increasing the number of alternatives offered to the consumer, enhancing
consumers’ perceived quality, lowering consumers’ perceived risk, and making consumers’
access to the product more convenient.
Quality and Number of Alternatives
The quality of products introduced in the marketplace can be significantly enhanced
through marketing alliances. IBM and Apple Computer entered into a product development
alliance in 1991, the result of which offered consumers a system that significantly improved
linkages across different computer networks (Bertrand 1992; Bucklin and Sengupta 1993).
Without a similar alliance between Apple Computer and Adobe systems in 1984, it is uncertain
that consumers would have benefited from the now renowned and powerful tools of desktop
publishing. Marketing alliances also increase the number of alternatives the consumer can
choose from. The ingredient alliance between Coca-Cola and NutraSweet offers yet another
drink selection for customers and allows sugar-conscious consumers to enjoy a sweet soft drink.
Another example is the stretching polymer invented in DuPont labs in 1959, Lycra. Generally
known as spandex, Lycra first started as an ingredient for girdles. Since then, consumers have
benefited from Dupont’s alliances, which introduced Lycra in bathing suits, bicyclists’ pants,
aerobic outfits, bike shorts, and exercise wear.
Perceived Product Quality and Lower Perceived Risk
Marketing alliances also increase perceived product quality and lower consumers’
perceived risk. Carpenter et al. (1994) found that the inclusion of a branded attribute in an
ingredient alliance significantly affected consumer choices even when consumers were explicitly
told that the attribute was not relevant to their choice. The presence of a branded ingredient in the

49
product lowered consumers’ perceived risk by “reassuring them of the quality of the product.”
The alliance between Compaq and Intel serves a similar purpose; the consumer is reminded of
the dependability and reliability of the computer through the presence of the Intel microprocessor
inside the Compaq computer. A recent study by the American Marketing Association produced
interesting results. In a consumer survey on branding alliances, 80% of the sample said that they
would be likely to buy a digital imaging product co-branded by Sony and Eastman Kodak.
However, of people told that the product was from Kodak alone, only 20% said that they would
buy it; similarly, only 20% said they would buy such a product from Sony alone (Blackett and
Boad 1999). This indicates the increased consumers’ perceived quality of the product derived
from the alliance between the two brands.
Convenience
Marketing alliances can make products available and more easily accessible to
consumers. Distribution alliances for example, are joint marketing agreement where
complementary product lines of two firms are sold together through existing or new distribution
channels, thus broadening the market coverage of the partner firms. Distribution alliances make
it more convenient for the consumer to acquire the product and decrease consumer acquisition
costs. For example, RadioShack has established alliances with Sprint, Compaq, RCA, Microsoft,
and others that let the manufacturers set up kiosks within many of RadioShack’s 7,100 outlets in
the United States. These kiosks prove to be a convenient outlet for consumers who need to
perform transactions with these manufacturers. Similarly, when Espresso Education and the
London Grid for Learning (LGfL) signed a distribution agreement, 2700 schools in London were
given the capability to connect to LGfL’s broadband network and instantly use Espresso's

50
educational resources. The distribution deal with Espresso eliminated the need for London
schools to physically acquire and maintain Espresso’s educational material. Another example is
the distribution agreement in 1999 between Stamps.com and Avery Dennison. The alliance
enabled Stamps.com’s users to print postage directly onto Avery-brand labels, envelopes, and
business documents, using nothing more than a laser or inkjet printer. Users now had the ability
to generate professional-looking first class, priority, and express mail postage anytime from the
convenience of their homes or offices.
In sum, marketing alliances contribute to the enhancement of consumers’ utilitarian value
by facilitating the improvement of actual product quality, increasing the number of alternatives
available to the consumer, lowering consumers’ perceived risk, enhancing consumers perceived
quality, and facilitating consumers’ access to products and services.
Marketing Alliances and Hedonic Value
Marketing alliances also enhance consumers’ hedonic value by enhancing the pleasurable
aspects associated with the consumer’s overall consumption experience (Holbrook et al. 1984;
Richins 1994). Recall that hedonic experience is associated with pleasure, arousal, feelings, and
fun (Hirschman and Holbrook 1982; Hopkinson and Pujari 1999). Consider the following
Singapore Airlines magazine ad. This ad stresses the enhanced pleasurable flight experience
provided through the airline’s multiple alliances. The main purpose of Singapore Airline’s
alliances is to make the flight experience more pleasurable, thus enhancing flyers’ hedonic value.
“Singapore Airlines has searched the world to bring you the finest business class in the sky. Top
French design house Givenchy, has created a cabin of contemporary elegance. And, for the
ultimate in comfort, our new Ultimo seats from Italy are electrically controlled, offering luxurious
legroom…those who prefer to relax can enjoy KrisWorld, your in-flight entertainment

51
system…and for the first time in the sky, you can enjoy blockbuster movies with Dolby
Headphone surround sound.”
Another example of pleasure/enjoyment-enhancing alliances is the one between the
leading bookstore company in the nation Barnes and Noble and Starbucks Coffee Company,
whereby shoppers can consume gourmet coffees while perusing available readings, thereby
enhancing the pleasurable aspect of visiting Barnes and Noble bookstores.
Marketing alliances also serve to enhance the fun aspect of the consumption experience.
Examples include such alliances as the one between McDonalds restaurants and the Walt Disney
Company whereby Disney character toys are offered as part of children (or happy) meals, and
the alliance between Openwave Systems Inc. (a developer of Internet infrastructure software and
applications) and Hutchison Telecommunications Limited (a developer of platform download
solutions). The alliance delivers a service whereby consumers have the ability to download and
personalize their cellular phones with personalized ringing tones and characters such as Hello
Kitty and Garfield. The alliance is rightfully called The Openwave Download Fun.
The previous discussion suggests that when two partners engage in a marketing alliance,
they add value to the customer above and beyond the value generated by each partner alone. This
added value can be either utilitarian or hedonic. This leads to this research’s first hypotheses:
H1a: The mean utilitarian value for customers who had a consumption experience at an alliance entity will be higher than the mean utilitarian value for customers who had a consumption experience at a standalone entity.
H1b: The mean hedonic value for customers who had a consumption experience at an
alliance entity will be higher than the mean hedonic value for customers who had a consumption experience at a standalone entity.
Naturally, alliances are not restricted to enhancing either utilitarian or hedonic value but
can very well enhance both values. In fact, just like most consumption experiences comprise

52
both utilitarian and hedonic values to varying degrees, it could be argued that organizational
alliances also enhance both values to varying degrees. In other words, mainly hedonic-value-
enhancing alliances will also enhance utilitarian value, albeit to a lesser degree. Similarly,
utilitarian value-enhancing alliances might also comprise a small component of hedonic value.
Therefore, the focus in this study is on the degree to which an alliance enhances either utilitarian
or hedonic value (rather than enhancing either one alone).
While marketing alliances can enhance both consumers’ hedonic and utilitarian values,
the degree to which each of these values is enhanced depends on the type of alliance under
consideration. In the next section, we suggest that the type of alliance (functional versus
symbolic) plays a moderating role in the relationship between marketing alliances and consumer
value enhanced.
Alliance Complementarity: Functional versus Symbolic
Marketing alliances have been defined as a form of "working partnership" that involves
"contractual relationship undertaken by firms whose respective products are complements in the
marketplace" (Bucklin and Sengupta 1993) [emphasis added]. One of the objectives of these
alliances is to amplify and/or build user awareness of benefits derived from product
complementarities (Jarratt 1998). Thus, marketing alliances attempt to capitalize on the potential
complementarity of the partner firms’ products or services. The literature defines product
complementarity as the consumer’s perception of how much the consumption or use of a product
aids or enhances the use or consumption of another product (Dhar and Simonson 1999; Dhebar
1995; Samu et al. 1999). Several authors have distinguished between different types of
complementarities (Samu et al. 1999; Solomon and Buchanan 1991). The bundling literature has

53
examined the effect of offering complementary products on the way consumers evaluate product
bundles. The literature distinguishes between two main types of complementarities: functional
and symbolic. Functional complementarity refers to products jointly used or consumed with one
another to facilitate proper operation. With symbolic complementarity, a set of two or more
consumption items together transmit some message that each product, singly, does not.
Consistent results show that the type of complementarity between the products offered in the
bundle has an impact on the way consumers evaluate the bundles. For example, in their
examination of the effect of functional complementarity on the valuation of product bundles,
Gaeth et al. (1990) found that consumers’ willingness to pay for functionally complementary
product bundles was significantly affected by the perceived quality of the less valuable item in
the bundle. This effect however, was not observed when the less valuable item in the bundle was
functionally unrelated to the main product. Later work showed that bundling functionally related
goods leads to a higher willingness to pay than bundling functionally unrelated goods
(Strahilevitz and Myers 1998). These results suggest that the presence or non-presence of
functional complementarity between associated products can influence the value the consumer
attaches to that association. The fact that functional complementarity appears to affect the
valuation of bundles led Strahilevitz and Myers (1998) to raise the question of whether there are
other dimensions, beyond the fact that two items are generally consumed together, that might
make them complement one another. Besides functional complementarity, they propose the
existence of emotion-based complementarity and suggest that “if the different sets of emotions
generated by two distinct positive outcomes somehow complement each other, it is possible that
the value created by bundling these two outcomes together might be greater than the value
created by offering them separately” (Strahilevitz and Myers 1998; p. 435). They call this type of

54
complementarity affect-based complementarity. Other researchers have also differentiated
between functional complementarity and non-functional complementarity. Solomon and Englis
(1994) and Caldwell (2001) suggest (in addition to functional complementarity) the existence of
aesthetic complementarity, where “the consumption or ownership of a product elicits the desire
to acquire another so as to create an aesthetically pleasing relationship.”
A related stream of research suggests the existence of consumption constellations. The
consumption constellation has been developed to describe symbolic interdependencies among
products. It is defined as a cluster of complementary products, specific brands, and/or
consumption activities used to construct, signify, and/or perform a social role (Solomon 1988;
Solomon and Buchanan 1991). Elements inside the constellation display symbolic rather than
functional complementarity (Lowrey et al. 2001). For example, consumers are more likely to
view a pair of Tony Lama cowboy boots and a Ford pickup as being part of the same
constellation, while Gucci loafers and a BMW would probably be part of a different constellation
(Solomon and Englis 1994).
The previous discussion highlights the fact that consumers perceive different types of
complementarities differently. Specifically, consumers evaluate product associations in a
different manner depending on whether the associated products are functionally or symbolically
complimentary. In other words, the value the consumer derives from alliances of functionally-
related products (henceforth functional alliances) will be different from the value derived from
alliances combining symbolically-related products (henceforth symbolic alliances). Since
functional alliances bring together organizations whose products are offered or consumed with
one another to facilitate proper operation of the products, they are more likely to enhance
utilitarian value than hedonic value. Symbolic alliances on the other hand, bring together firms

55
whose products are used together by the consumer to send a particular message (status…) or to
create an aesthetically pleasing relationship. These alliances are therefore more likely to enhance
consumers’ hedonic value.
In sum, it is suggested that different types of alliances will generate different types of
value for the consumer. More specifically, alliances of a functional nature should be expected to
generate more utilitarian value while alliances of a symbolic nature should be expected to
generate more hedonic value. Therefore:
H2: Alliance type moderates the relationship between marketing alliances and consumer value such that functional alliances enhance utilitarian value and symbolic alliances enhance hedonic value.
Consumer Value and Customer Satisfaction
As previously discussed, satisfaction measures the relationship between a product’s
actual performance and a performance standard. As such, satisfaction captures the consumer’s
response to an organizational offering (Szymanski and Henard 2001). The concept of consumer
value suggests a strong relationship to customer satisfaction (Woodruff 1997), but while both
value and satisfaction have been separately investigated (Gale and Wood 1994; Woodruff 1997;
Zeithaml 1988), the role that consumer value plays in enhancing satisfaction has received limited
attention (Day 2002). Woodruff (1997) notes that investigation of the link between the two
concepts is lacking despite a potentially strong relationship. In their review of the value and
satisfaction literatures, Cronin et al. (2000) note that value-satisfaction research is still in its
embryonic stage, and not until recently did Oliver (1999) raise questions about the relationship
between the two concepts, asking questions such as “what is the relationship between satisfaction
and value?” and “is satisfaction an antecedent or a consequence of value?”.

56
The evidence that exists suggests a positive relationship between the two concepts (Table
4). For example, in developing the American Customer Satisfaction Index, Fornell et al. (1996)
seem to assume that perceived value is an antecedent to customer satisfaction. Similarly, Licata
et al. (2001) find a positive relationship between the two constructs in a service encounter. More
direct assessments of the value-satisfaction link can be found in Day and Crask’s (2000)
research, which posits that “consumer dis/satisfaction is largely based on a value analysis during
purchase and consumption.” Table 4 identifies how consumer value is currently perceived to be
related to satisfaction. The table shows that there is initial consensus on the relationship between
the two concepts: enhanced consumer value leading to satisfaction4. From an analysis of the
literature, Woodall (2003) summarizes the pattern of relationships between different properties
as being: perceived quality consumer value satisfaction behavioral intentions, and
suggests that there is “one clear conclusion; that consumer value…is a precursor to satisfaction.”
(Woodall 2003; p. 22).
Table 4: Selected Research on the Relationship between Consumer Value and Satisfaction
Study
Major Finding
Fornell et al. (1996) Bolton and Drew (1991) De Ruyter et al. (1997)
Consumer value is an antecedent to customer satisfaction.
Rust and Oliver (1994)
Consumer value is an input to satisfaction.
Anderson (1995) Satisfaction increases as consumer value increases.
Ravald and Grönroos (1996) Customer satisfaction depends on customers’ perceptions of value.
Slater (1997) Walters and Lancaster (1999)
Satisfaction is achieved when a company delivers consumer value.
4 Butz and Goodstein (1996) are the only ones to question this relationship noting that while value is about “behavior,” satisfaction is about “attitudes.”

57
Fornell et al. (1996) point out that “the first determinant of overall customer satisfaction
is perceived quality…[and] the second determinant of overall customer satisfaction is perceived
value” (Fornell et al. 1996). Cronin et al. (2000) indicate that “positive value directly influences
satisfaction”, and Woodruff and Gardial (1996) note that satisfaction and value are related such
that “satisfaction is a customer’s positive or negative feeling about the value that was received as
a result of using a particular organization’s offering in specific use situations.” Thus, the
emerging literature on the relationship between the concepts of consumer value and customer
satisfaction indicates that the two concepts are highly associated (Athanassopoulos 2000) and
that the relationship is such that consumer value is an antecedent to customer satisfaction (Cronin
et al. 2000). This suggests that an enhancement in consumer value will result in an enhancement
in satisfaction. Thus:
H3: Customer value mediates the relationship between marketing alliances and customer satisfaction.
The Route to Satisfaction: Cognitive or Affective
As previously mentioned, past research on satisfaction has proposed various theoretical
structures examining the antecedents of satisfaction. Of these, the cognitive process of
confirmation/disconfirmation had emerged as the most widely accepted paradigm. Recently
however, recognizing that a purely cognitive approach may be inadequate in modeling
satisfaction evaluations, researchers have called for more investigation into the affective route to
satisfaction (Wirtz et al. 2000). A few researchers have provided evidence showing that indeed,
customer satisfaction is based partly on cognition and partly on affective responses to a product
stimulus (Oliver 1997; Westbrook and Oliver 1991). Yi (1990) argues that satisfaction results

58
from processing the affect in a consumption experience, and Mano and Oliver (1993) state that
“affect is clearly antecedent to, and necessary for, satisfaction.” The cognitive/affect routes to
satisfaction were referred to as the “two-appraisal model” by Oliver (1993). The question at this
point then becomes: “when should we expect the satisfaction process to take the cognitive route
and when should we expect it to take the affective route?” The following discussion provides for
the argument that the route to satisfaction will most likely be cognitive when utilitarian value is
enhanced, and most likely affective when hedonic value is enhanced.
Utilitarian Value and Cognitive Response
As discussed earlier, utilitarian consumer behavior is described as task-related and
rational (Babin et al. 1994; Batra and Ahtola 1990). Utilitarian goods are ones whose
consumption is instrumental, goal-oriented, and accomplishes a practical task (Dhar and
Wertenbroch 2000; Hirschman and Holbrook 1982; Strahilevitz and Myers 1998). In a shopping
scenario, perceived utilitarian shopping value depends on whether the particular consumption
need that triggered the shopping trip was accomplished and whether the product was purchased
in an efficient manner (Babin et al. 1994).
Utilitarian evaluation is “purely judgmental and absent of any explicit hedonic overtones”
(Mano and Oliver 1993). Utilitarian experiences therefore are more likely to be cognitively
driven. In their investigation of the relationships between utilitarian scales, hedonic scales, and
affect, Mano and Oliver (1993) found that utilitarian scales exhibited very modest relations with
affect while the hedonic scales were more strongly correlated with affect. In their discussion of
the results, the authors posit that “utilitarian evaluation is more closely aligned with cognitive
functioning in consumption” (p. 464). The authors conclude that the fact that utilitarian scales
59
and affect were found to be unrelated confirms the contention that utilitarian evaluation is more
cognitive in nature, as it deals primarily with the fulfillment of instrumental expectations
consumers may have for the product.
Therefore, in situations where post-purchase performance meets expectations, it should
be expected that consumers who engage in cognitive processing about the utilitarian value they
generated from the consumption experience will be more satisfied than those who do not engage
in cognitive processing.
H4: Cognitive processing moderates the relationship between utilitarian value and satisfaction such that consumers who engage in cognitive processing will have higher satisfaction levels than those who do not engage in cognitive processing.
Hedonic Value and Affective Response
Compared to utilitarian consumption, hedonic value is more subjective and results more
from fun than from task completion (Babin et al. 1994; Hirschman and Holbrook 1982). Some of
the characteristics that might indicate a hedonically fulfilling experience are increased arousal,
perceived freedom, fantasy fulfillment and escapism (Hirschman 1983). Again, in a shopping
scenario, and in contrast to utilitarian-oriented shoppers, hedonic-oriented shoppers “enjoy
shopping when it helps [them] forget [their] problems” and like shopping for toys “because of
the little kid in [them]” (Babin et al. 1994). Therefore, “the seeking of the hedonic experience is
often far more significant than the mere acquisition of products” (Sherry 1990). Hedonic
consumers view product acquisition as unimportant compared to the “emotional lift” provided by
the consumption experience. Hedonic value appeals more to consumers’ emotional reactions.
Mano and Oliver (1993) found that hedonic scales had strong relationships with affect scales and
that hedonic evaluation was “closer to the consumer’s affective experience” (p. 460). We should

60
therefore expect a more pronounced affective response to enhanced hedonic value. Thus, it
should be expected that the relationship between enhanced hedonic value and satisfaction will
take the affective route. Thus:
H5: Affective response mediates the relationship between hedonic value and customer satisfaction
Behavioral Outcomes
From a managerial perspective, customer satisfaction is only important to the extent that
it has an impact on consumer behavioral responses (Oliver et al. 1997; Zeithaml et al. 1996).
Consequently, several studies have focused on the relationship between satisfaction and
behavioral responses. These studies generally find a robust satisfaction-intention linkage
(Bearden and Oliver 1985; Bearden and Teel 1983; Oliver 1993; Oliver and Swan 1989). We
focus on the behavioral responses that dominate the customer satisfaction literature, namely
loyalty, word of mouth, and switching behavior (Ganesh et al. 2000; Zeelenberg and Pieters
2004; Zeithaml et al. 1996).
Loyalty
Academics and practitioners alike consider customer loyalty to be important because of
its numerous benefits to the firm. Such benefits include a continuous stream of profit, reduction
of marketing costs, growth of per-customer revenue, decrease in operating costs, increase in
referral, increase in price premium, and switching barriers among loyal customers who will not
easily surrender to competitors’ promotion efforts (Reichheld 1996; Yi and La 2004).
Considering these benefits, it is not surprising that much research has pondered over the different

61
antecedents of loyalty. Customer satisfaction has been regularly found to be a major antecedent
to satisfaction.
Although loyalty has been defined in various ways, there are two main approaches:
behavioral and attitudinal (Dekimpe et al. 1997; Dick and Basu 1994). Previously, most research
focused on the behavioral aspect of loyalty. Newman and Werbel (1973) for example, defined
loyal customers as “those who rebought a brand, considered only that brand, and did no brand-
related information seeking.” Similarly, Tellis (1988) measured loyalty as “repeat purchase
frequency” or “relative volume of same brand purchasing.” More recently, loyalty has been
looked at from an attitudinal perspective as well. For example, Oliver (1997) discusses loyalty as
an outcome of satisfaction and proposes three phases of satisfaction - cognitive, affective, and
conative - that all culminate in loyalty. He later proposed four phases for a customer to become
loyal (Oliver 1999). First, loyalty in the cognitive phase is based on either prior knowledge or
experience-based information about a brand. Second, loyalty in the affective phase is a liking or
attitude toward a brand. Based on cumulatively satisfying usage occasions, it implies feelings
toward a brand. Nevertheless, this form of loyalty remains subject to switching. Third, conative
loyalty is defined as a customer’s behavioral intention to keep on purchasing a product in the
future, and therefore it is harder to dislodge than affective loyalty (Oliver 1999; Pedersen and
Nysveen 2001). Finally, action loyalty is the stage in which motivated intention is transformed
into readiness to act. Since this final stage is related to the behavioral approach, Oliver’s phases
shed light on the development of loyalty from attitude to behavior.
As previously mentioned, Customer satisfaction has been found to be a major antecedent
to satisfaction. For example, Bitner (1990) shows that satisfaction has an indirect effect
(mediated by perceived quality) as well as a direct effect on loyalty. Using data from a retail

62
bank market and a hotel chain, Rust and Zahorik (1993) and Rust et al. (1995) find a positive
link between customer satisfaction and loyalty. Additionally, The hypothesis of a positive effect
of customer satisfaction on customer loyalty has been verified in numerous empirical studies
(Anderson and Sullivan 1993; Cronin et al. 2000; Cronin and Taylor 1992; Fornell et al. 1996;
McDougall and Levesque 2000).
Additionally, customers satisfied with their consumption experience with an alliance
entity should be expected to have even stronger loyalty levels because of the cumulative effect of
their satisfaction with the brands involved in the alliance. Existing research shows that in an
alliance situation, consumers do transfer their brand evaluations to the partner brand (Levin et al.
1996; Park et al. 1996; Rao and Ruekert 1994; Vaidyanathan and Aggarwal 2000). Satisfied
customers are thus more likely to transfer their positive evaluations to the partner brand and
exhibit higher loyalty to the alliance product. Therefore:
H6a: The positive relationship between satisfaction and loyalty will be stronger for the group comprised of alliance customers as compared to the group comprised of customers of standalone entities.
Word of Mouth (WOM)
Word-of-mouth is defined as the extent to which a customer informs friends, relatives
and colleagues about an event that has created a certain level of satisfaction. Research has
documented the pervasive influence and importance of WOM on consumer behavior. In
particular, customers pay more attention to WOM because it is thought to be credible and
custom-tailored, and generated by people who are perceived as having no self-interest in pushing
a product (Silverman 1997). The degree of (dis)satisfaction with a consumption experience has

63
generally been regarded as a key antecedent of product-related WOM (Bitner 1990; Bloch 1986;
Engel et al. 1969; Reichheld and Sasser 1990).
Richins (1983) examined negative word-of-mouth by dissatisfied customers and
identified variables that distinguish their response from other responses (such as making a
complaint). Her results indicate that negative WOM occurred when the problem was severe, and
when the retailer’s responsiveness to complaints was negatively perceived. It was also affected
by attributions of the dissatisfaction; more negative WOM was made when blame for the
dissatisfaction was attributed to the retailer. Curren and Folkes (1987) expanded on Richin’s
work by examining whether attributions for product performance influenced consumers’ positive
as well as negative communications about products. The results showed that similar attributions
influence consumer communications regardless of the valence of the communication or the target
of the communication. Specifically, the desire to communicate was greater for seller-controlled
causes. In sum, controllability, stability, and locus dimensions of consumer attributions
influenced both positive and negative communications.
Some studies found a negative relationship between satisfaction and WOM, with
dissatisfied customers engaging in more WOM than satisfied ones5 (Bearden and Teel 1983;
Richins 1983; Westbrook 1987). These opposite findings suggest a U-shape relationship between
customer satisfaction and WOM, where WOM is higher for extremely satisfied and extremely
dissatisfied consumers than for those with more moderate levels of (dis) satisfaction (Anderson
1998). Despite this U-shaped relationship, research supports the notion that once WOM is
generated, its valence is largely driven by satisfaction. That is, WOM becomes more positive
5 WOM serves the function of venting one’s discontent, gaining sympathy from others, and warning others about bad service providers.

64
(negative) as satisfaction increases (decreases) (Holmes and Lett 1977; Schelesinger and Heskett
1991).
Similar to loyalty, customers satisfied with their consumption experience with an alliance
entity should exhibit higher levels of word of mouth than satisfied customers with a standalone
entity. Again, the cumulative effect of customer satisfaction with the alliance brands will
generate a higher level of customers’ word of mouth. Therefore:
H6b: The positive relationship between satisfaction and word of mouth will be stronger for the group comprised of alliance customers as compared to the group comprised of customers of standalone entities.
Switching Behavior
Customer switching can prove to be detrimental for the company. Rust and Zahorick
(1993) emphasized the negative effects of customer switching on firm market share and
profitability. Losing customers not only leads to opportunity costs because of lack of sales
revenue, but also to the cost of attracting new customers, which includes promotion, discounts,
effort to know customer needs, and time to build sustainable relationships. In 1970, Hirschman
suggested that individuals in institutional or commercial exchange relationships have essentially
two response options to deteriorating service: communicate their displeasure, or exit the
relationship (switch).
Reasons behind customer switching behavior have been related to perceptions of low
quality in the banking industry (Rust and Zahorick, 1993), overall dissatisfaction in the insurance
industry (Crosby and Stephens, 1987), and service encounter failures in retail industries (Kelley
et al. 1993). Service quality failures and dissatisfaction are two of the reasons that motivate
customers to switch services. Bitner (1990) adds time, money constraints, access to information,

65
lack of credible alternatives, switching costs, and habit as factors that might affect switching
behavior. Along similar lines, Cronin and Taylor (1992) suggest that convenience, the right
price, and availability might enhance customer satisfaction and subsequent behavior. Keaveney
(1995) developed a grounded model of customer switching behavior. Eight main causal variables
were proposed: price, inconvenience, core service failures, service encounter failures,
competitive issues, ethical problems, and involuntary factors. While a few researchers are now
suggesting that the role of satisfaction in preventing switching behavior is more complex than
initially thought6 (Mittal and Kamakura 2001), there is ample evidence supporting the hypothesis
that satisfied customers are less likely to engage in switching behavior than are dissatisfied
customers (Burnham et al. 2003; Szymanski and Henard 2001).
In the case of alliances, the negative relationship between satisfaction and intentions to
switch should be expected to be even stronger when customers are dissatisfied. This would
happen for two reasons: first, customers who are dissatisfied with one of the alliance partners
will transfer their dissatisfaction feelings to the second partner, leading to a desire to switch from
both partners. Second, since two organizations are involved in providing the product or service,
customers might feel that chances of product failure should be minimized. When product failure
occurs, customers will attribute the failure to both organizations involved in the alliance and thus
decide to discontinue their patronage of both organizations. Therefore:
H6c: The negative relationship between satisfaction and intention to switch will be stronger for the group comprised of alliance customers as compared to the group comprised of customers of standalone entities.
6 Mittal and Kamakura (2001) have found that consumer characteristics might play a moderating role in the relationship between satisfaction and repurchase behavior.

66
In the next chapter, I present the research design and methodology used to test the
proposed model and hypotheses. Survey and experiment procedures are presented including
pretests, data collection, measures used, manipulation checks, and statistical analyses.

67
CHAPTER FOUR: RESEARCH DESIGN AND METHODOLOGY
This chapter outlines the research design and methodology used to test the proposed
model. Both survey and experiments data were collected and used in testing the hypotheses. In
the following sections, I first start by describing the survey study. This includes a description of
the pretests conducted to select alliances, the research setting and data collection procedures, the
measures used to collect the data, and the statistical analyses conducted. Next, I describe the two
experimental studies and the related data collection procedures, including the experimental
designs and samples, the pretesting procedures, the measurement instruments used, the
manipulation checks, and the statistical procedures.
Study 1: Survey
Following Srivastava and Lurie (2004), the objective of study 1 was to test the
relationship between marketing alliances, customer value, satisfaction, and behavioral outcomes.
Specifically, study 1 tests the hypotheses on the relationship between marketing alliances and
customer value (H1a and H1b), the moderating role of alliance type in the relationship between
marketing alliances and customer value (H2), the mediating role of customer value in the
relationship between marketing alliances and customer satisfaction (H3), and the relationships
between customer satisfaction and behavioral outcomes, namely word of mouth, loyalty and
switching behavior (H6a, H6b, and H6c).
I start by describing the pretests conducted to select the alliances used to collect the data,
then I explain the research setting and data collection procedures. Next, I describe the measures

68
used in the instruments, and finally present the statistical analyses used to test the hypotheses and
the results of the study.
Pretests: Selection of Alliances
To select the appropriate alliance settings for the survey study, I conducted a series of
pretests. Table 5 summarizes the pretesting procedures.
Table 5:
Pretests Conducted to Select Alliances for Data Collection
Stage activity Outcome
1. Generation of alliances Students were given a week-long assignment to provide examples of alliances
140 alliances generated. 46 remaining after screening
2. Assessment of familiarity levels
A different group of students rated their familiarity levels with the brands involved in the 46 alliances
18 alliances selected for the next stage
3. Identification of functional and symbolic alliances
Students were presented with the definitions of a functional and a symbolic alliance and were asked to rate each of the 18 alliances on a “functional” and “symbolic” 7-point scale
Each alliance had a functional and a symbolic score. The alliance between Barnes and Noble and Starbucks rated highest on the symbolic scale, while the alliance between Marriott and Hertz rated highest on the functional scale.
The first step was to generate a list of strategic alliances. Undergraduate students (N =
120) were given a week-long assignment to provide at least one example of a strategic alliance.
The assignment was given after a detailed discussion in class about strategic alliances. This
69
exercise produced a total of 140 alliances. After removing duplicates and non-relevant alliances,
46 alliances remained. The next step was to assess familiarity levels with alliances. Ueltschy et
al. (2004) note that brands and situations used in experiments (discussed in the next section)
based on scenarios must be familiar to the subject population to avoid potential threats to both
internal and external validity. Therefore, a different group of students (31) was asked to rate their
familiarity on a scale of 1 to 7 with the brands associated with the remaining 46 alliances. Based
on the results of this test, 18 alliances were selected for the next stage of the pretests.
The next step was to identify functional and symbolic alliances out of the 18 alliances. A
total of 60 subjects were presented with definitions of a strategic alliance, a functional alliance,
and a symbolic alliance. They were then asked to rate each of the 18 alliances on two 7-point
scales - functional and symbolic. A “functional” score and a “symbolic” score were then
computed for each of the 18 alliances.
Table 6 shows the functional and symbolic scores of the 18 alliances tested. The alliances
selected need to be high on the functional scale or the symbolic scale but not on both scales.
Alliances 2, 3, and 12 fulfill this criterion (see table 6).

70
Table 6: Alliances Tested and Resulting Functional and Symbolic scores
(Ordered alphabetically)
Functional
score Symbolic
score 1 American Express and American Airlines 4.58 4.82 2 Barnes & Noble and Starbucks 4.45 6.15 3 Blockbuster and Dominoes 4.52 6.15 4 Dell and Intel 6.27 4.92 5 Dell and Microsoft 6.04 5.59 6 Delta and Coke 3.93 5.07 7 eBay and eLoan 5.41 4.48 8 Ebay and Microsoft 4.82 4.62 9 FedEx and Kinko's 5.92 5.46 10 Ford and Sirius Satellite radio 5.67 5.59 11 Lexus and Coach 4.26 5.59 12 Marriott and Hertz 6.02 4.88 13 Motorola and Oakley 4.82 4.52 14 Radio Shack and Compaq 5.04 4.81 15 Soho and Anheuser-Busch 3.73 3.96 16 Starbucks and Pepsi 4.93 3.74 17 Wal-Mart and McDonalds 3.52 4.04 18 5 Loaves Café and Millennium music 4.63 5.07
The alliance between Barnes and Noble and Starbucks whereby shoppers can consume
drinks and snacks while shopping in the bookstore was viewed as highly symbolic (functional
score: 4.45, symbolic score: 6.15, t = 6.69, p = .00). This alliance was therefore selected as the
symbolic alliance for the survey study. The alliance between Marriott and Hertz whereby Hertz
offers car rental services to hotel guests in the hotel’s premises was deemed to be highly
functional (functional score: 6.02, symbolic score: 4.85, t = 5.09, p = .00). Since there was no
such alliance in the city where this study was conducted, I conducted another pretest to check
whether an alliance between Days Inn and a car rental agency (with no specific name) would be
evaluated as being functional or symbolic. Respondents rated such an alliance 6.16 on the

71
functional scale and 4.64 on the symbolic scale (t = 6.69, p = .00). This alliance was therefore
selected as the functional alliance for the survey study.
A final test was conducted with 36 subjects to confirm that the alliances selected were
indeed viewed as being either functional or symbolic. This test confirmed the results of the
previous tests.
Research Setting and Data Collection
Based on the pretest results, data were collected from three different locations: a Barnes
and Noble bookstore with a Starbucks cafeteria (symbolic alliance), a standalone Starbucks café,
and a Days Inn hotel. Therefore, 3 different instruments were developed. The length of the
instruments was adjusted and the scripts were refined based on the results of pretests on
relatively small samples (n = 11). Appendix 1 shows the three questionnaires used to collect
data.
Data were gathered in face-to-face intercept interviews from customers exiting the 3
different locations. The author and two trained interviewers conducted interviews that averaged
13 minutes in duration. Customers were intercepted leaving the establishment using systematic
sampling. A skip interval of 10 was deemed to be appropriate and was used. Data were collected
at different times of the day (morning and afternoon) and during different days of the week
(Tuesday through Saturday) to ensure a representative sample. When I was not interviewing, I
made regular visits to the sites to ensure that the correct procedures were being followed by the
interviewers.

72
Barnes and Noble with Starbucks
As can be seen in the appendix, in addition to screener questions, there were 3 main
sections in the instrument used for Barnes and Noble and Starbucks. The first section asked
questions in regards to the customer’s experience with the alliance between the two companies.
The second section addressed the customer’s experience with a standalone Barnes and Noble (if
applicable), and the third section asked questions about the customer’s experience with a
standalone Starbucks (if applicable.) Also included were questions asking the respondent to rate
the alliance on functional and symbolic scales as well as questions on demographic
characteristics.
In each of the first three main sections, respondents were asked to provide information on
utilitarian value, hedonic value, satisfaction, loyalty, word of mouth and switching intentions.
Therefore, respondents provided this information for the alliance, the standalone Barnes and
Noble, and the standalone Starbucks.
Standalone Starbucks
At the standalone Starbucks, data were collected on (1) utilitarian value and hedonic
value generated from Starbucks, (2) overall satisfaction with Starbucks, (3) loyalty, word of
mouth and switching intentions toward Starbucks, and (4) demographic characteristics.
Respondents were also asked if they had visited a Starbucks and a Barnes and Noble alliance.
Those who answered affirmatively were asked questions on value, satisfaction, loyalty, word of
mouth, and switching intentions toward the alliance between Starbucks and Barnes and Noble.

73
Standalone Days Inn A similar procedure was used at Days Inn; respondents were asked questions on value,
satisfaction, loyalty, word of mouth, and switching intentions toward Days Inn. Then they were
asked if they had ever used the services of a car rental booth located in a hotel they had stayed in.
Those who answered affirmatively were again asked the questions on value, satisfaction, loyalty,
word of mouth, and switching intentions toward the alliance between the hotel and the car rental
company.
A total of 262 respondents were intercepted, 20 of which refused to complete the survey.
This resulted in 242 completed surveys. Seven of the completed questionnaires were later
removed because of missing values, which resulted in a total of 235 usable questionnaires, 79 for
Barnes and Noble and Starbucks, 81 for Starbucks, and 75 for Days Inn.
Instrument Measures Utilitarian and Hedonic Value
In 1990, Batra and Ahtola developed a scale to measure utilitarian and hedonic value.
This scale has proved problematic in nearly all published reports of its use (Chaudhuri and
Holbrook 2001; Crowley et al. 1992). Voss et al. (2003) point out to several deficiencies of Batra
and Ahtola’s scale. Among these is the scale’s inability to account for relevant theoretical
concepts within a nomological framework. For example, the instrument does not accommodate
involvement, as Hirschman and Holbrook (1982) propose. Predictably, Batra and Ahtola's items
cross-load with items from Zaichkowsky's (1985) measure of product category involvement,
suggesting inadequate discriminant validity (Mano and Oliver 1993). Moreover, in developing
multiple item measures, theory suggests that researchers should sample from the (hypothetical)

74
set of all items representing the construct of interest (Churchill 1979). However, Batra and
Ahtola conduct two independent development efforts with different sets of initial items that
apparently represent the same construct(s) and subsequently combine items from the two efforts
to arrive at a final scale. Batra and Ahtola do not report a test of unidimensionality for their
measure; thus, the possibility exists that the items actually represent different but correlated
domains. Babin et al. (1994) developed a two-dimensional scale of perceived personal shopping
value (PSV scale). The scale recognizes that consumer value is indicated in both utilitarian and
hedonic terms, thus portraying a realistic representation of consumer experiences. However, the
PSV scale is specific to shopping situations and is not appropriate for the present study.
The scale used in this study was developed by Voss et al. (2003). The scale measures the
hedonic and utilitarian dimension of consumer attitudes (the HED/UT scale). The scale is
composed of 10 items: 5 utilitarian and 5 hedonic. This scale has been shown to be highly
reliable (Coefficient α = .95) and its discriminant, predictive, and nomological validities have
been demonstrated (Voss et al. 2003). The semantic differential scale’s seven-point items are
“ineffective/effective,” unhelpful/helpful,” “not functional/functional,” “not
necessary/necessary,” and “impractical/practical” for utilitarian value, and “not fun/fun,” “dull/
exciting,” “not delightful/delightful,” “not thrilling/thrilling,” and “not enjoyable/enjoyable” for
hedonic value.
Satisfaction
Several scales are available for measuring customer satisfaction. (Dawson et al. 1990;
Eroglu and Machleit 1990; Mano and Oliver 1993; Oliver 1980). The scale deemed most
appropriate to measure satisfaction in this study was adapted from Oliver and Swan (1989) and

75
Spreng et al. (1996). The scale shows high levels of validity and reliability (α = .88). High scores
on the scale suggest that respondents are very satisfied with the target object. Low scores imply
dissatisfaction. The four items comprising the seven-point semantic differential scale are “very
dissatisfied/very satisfied,” “very displeased/very pleased,” “frustrated/contented,” and
“terrible/delighted.”
Behavioral Outcomes: Loyalty, Word of Mouth, and Intention to Switch
Word of mouth and intention to switch were each measured with three Likert scale,
seven-point items, and loyalty was measured using two seven-point items, all ranging from
strongly disagree to strongly agree. The loyalty and word of mouth scales were adapted from
Zeithaml et al. (1996) and Zeelenberg and Pieters (2004). Intention to switch was measured
using the scale developed by Athanassopoulos et al. (2001) in their empirical investigation of
behavioral responses to customer satisfaction (α = .87). Overall, an eight-item battery grouped
into three a priori categories was used to assess consumers’ behavioral responses to customer
satisfaction. Respondents were not aware of these groupings. The eight items are:
• Word of mouth o “I am likely to say positive things to other people about my overall experience,” o “I will recommend the overall experience to someone who seeks my advice,” o “I will encourage others to engage in the same overall experience”
• Loyalty o “I will engage in the same overall experience if the need arises in the future,” o “I will use the same providers of the overall experience in the future”
• Intentions to switch o “I intend to intensify my efforts to find better providers of the overall experience,” o “I have decided to do less business with the providers of the overall experience,” o “I have decided to switch to different providers of the overall experience”

76
Instruments Reliability Reliability levels of all scales are adequate. Table 7 provides a summary of scale
statisctics including reliability coefficients for all surveys. The table shows that coefficients are
all above the recommended cutoff of .70 {Nunnally, 1978 #293}.
Table 7: Intercorrelation Matrix and Summary Statistics
Mean SD # of
items α 1 2 3 4 5
Survey 1: Barnes and Noble with Starbucks
1 Utilitarian value 4.62 .79 5 .84 2 Hedonic value 5.65 .61 5 .80 .680** 3 Satisfaction 6.11 1.14 4 .96 .218 .291* 4 Loyalty 4.54 .65 2 .83 .006 .153 .731** 5 Word of mouth 4.46 .66 3 .85 .204 .197 .735** .778** 6 Switching intentions 2.13 .75 3 .83 .050 -.091 -.530** -.300* -.376**
Survey 2: Standalone Starbucks
1 Utilitarian value 4.64 .75 5 .90 2 Hedonic value 4.67 .98 5 .84 .838** 3 Satisfaction 5.06 .68 4 .86 .217 .243* 4 Loyalty 3.90 .58 2 .72 .021 .146 .480** 5 Word of mouth 4.07 .51 3 .73 .005 .130 .567** .484** 6 Switching intentions 2.11 .80 3 .92 -.177 -.294** -.142 .153 -.338**
Survey 3: Days Inn
1 Utilitarian value 4.64 .94 5 .86 2 Hedonic value 4.66 .95 5 .83 .05 3 Satisfaction 5.77 .71 4 .90 .109 .09 4 Loyalty 4.40 .48 2 .77 .042 .128 .061 5 Word of mouth 4.26 .54 3 .86 .084 .049 .047 .008 6 Switching intentions 2.20 .77 3 .91 .116 .025 -.132 -.048 -.115
*p < 0.05; **p < 0.01

77
Test of Hypotheses
Hypothesis 1a posits that the mean utilitarian value consumers derive from a marketing
alliance will be higher than the mean utilitarian value consumers derive from a standalone entity.
Similarly, hypothesis 1b posits that the mean hedonic value consumers derive from a marketing
alliance is higher than the mean hedonic value consumers derive from a standalone entity.
To test these hypotheses, I compared the utilitarian and hedonic value means of the
alliance groups to the means of their corresponding standalone groups. I performed independent
sample t-tests on the groups comprising the standalone entities and the corresponding alliances.
Results show that customers’ ratings of utilitarian value were significantly higher for the alliance
group (5.03) than for the standalone group (4.57, p = .002). Similarly, customers’ perceptions of
hedonic value were significantly higher for the alliance group (5.45) than for the standalone
group (4.39, p = .00). These results lend support to hypotheses 1a and 1b.
Hypothesis 2 posits that alliance type moderates the relationship between marketing
alliances and consumer value such that functional alliances enhance utilitarian value and
symbolic alliances enhance hedonic value. To test this hypothesis, I conducted two regression
analyses. In the first one (equation 1), I regressed utilitarian value on marketing alliances
(dummy variable), alliance type (dummy variable), and the interaction of the two variables. The
second regression (equation 2) regressed hedonic value on marketing alliances, alliance type, and
the interaction of the two variables. Results of both regressions are shown in table 8.
Equation 1: Util. value = β0 + β1(mkg allnces) + β2(allnce type) + β3(mkg allnces* allnce type) + e
Equation 2:
Hed. value = β0 + β1(mkg allnces) + β2(allnce type) + β3(mkg allnces* allnce type) + e

78
Table 8: The Moderating Role of Alliance Type in the Relationship between Marketing Alliances
and Customer Value
Variables β t-value p value
Dependent Variable: Utilitarian Value
Marketing Alliances .263 1.827 .035
Type of Alliance .247 1.615 .107
Marketing Alliances * Type of Alliance .225 1.804 .036
Dependent Variable: Hedonic Value
Marketing Alliances .380 2.928 .004
Type of Alliance .528 3.778 .000
Marketing Alliances * Type of Alliance .303 2.667 .008
The interaction terms between marketing alliances and alliance type are significant (p
<.05) in both regressions, confirming the moderating role of alliance type in the relationship
between marketing alliances and utilitarian and hedonic value, and lending support to H2.
Further testing the hypothesis, a means comparison analysis (see figure 2) shows that
functional alliances do generate more utilitarian value as compared to no alliances (5.03 vs. 4.62,
F = 13.75, p = .00). This resulting utilitarian value added by functional alliances (5.03) is
significantly higher than the utilitarian value added by symbolic alliances (4.75, F = 12.18, p =
.00). In addition, the utilitarian value added by symbolic alliances (4.75) is not significantly
different from the utilitarian value in the no-alliance condition (4.62, F = 2.198, p = .140).

79
4.62
5.03
4.62
4.75
4.4
4.5
4.6
4.7
4.8
4.9
5
5.1
No Alliance Alliance
Util
itaria
n va
lue Functional Alliance
Symbolic Alliance
Figure 2: Mean Utilitarian Value Generated by Functional and Symbolic Alliances
As Compared to Standalone Entities
Figure 3 shows the same analysis for hedonic value. Symbolic alliances result in more
hedonic value (5.45) as compared to the no-alliance condition (4.55, F =106.22, p = .00). This
hedonic value added by symbolic alliances (5.45) is significantly higher than the one added by
functional alliances (4.93, F = 20.18, p = .00).
This lends further support to the moderating role of alliance type hypothesis (H2), that is,
consumers derive more utilitarian value from functional alliances than from symbolic alliances,
and derive more hedonic value from symbolic alliances than from functional alliances.

80
4.93
5.45
4.554.55
4
4.4
4.8
5.2
5.6
No Alliance Alliance
Hed
onic
Val
ue
Functional AllianceSymbolic Alliance
Figure 3: Mean Hedonic Value Generated by Functional and Symbolic Alliances
As Compared to Standalone Entities
Hypothesis 3 posits that customer value mediates the relationship between marketing
alliances and customer satisfaction. To test this hypothesis, I followed the procedure proposed by
Baron and Kenny (1986; MB et al. 2001) to test for mediation. Four conditions must be satisfied
to confirm the mediation effect of customer value: (1) marketing alliances must be significantly
related to customer value, (2) marketing alliances must be significantly related to customer
satisfaction in the absence of customer value (the mediator), (3) customer value must be
significantly related to the dependent variable, customer satisfaction, and (4) the effect of
marketing alliances on customer satisfaction decreases when customer value (the mediator) is
added to the model. Results presented in table 9 show that all these conditions are satisfied. This
shows that while marketing alliances have a direct effect on customer satisfaction, customer

81
value partially mediates the relationship between alliances and satisfaction. In addition, I ran a
Sobel test to further examine the mediation effect. The Sobel test confirmed the mediation effect
of customer value in the relationship between marketing alliances and customer satisfaction, z =
4.45, p < 0.01, lending support to H3.
Table 9: The Mediating Effect of Customer Value in the Relationship
between Marketing Alliances and Customer Satisfaction
Constructs Model 1 Customer value
Model 2 Satisfaction
Model 3 Satisfaction
Model 4 Satisfaction
Constant
4.58b (0.05)
5.02b
(0.06)
2.65
(0.59)
3.47
(0.31)
Marketing Alliances
0.60b (0.08)
0.98b (0.09)
0.84b (0.09)
Customer Value
0.59b (0.07)
0.34b (0.07)
Adjusted R2 0.18 0.26
0.21 0.38
a Standard errors in parentheses b p < 0.01
Hypotheses 6a and 6b posit that while satisfaction is positively related to loyalty and word
of mouth, the relationship between satisfaction and loyalty and the relationship between
satisfaction and word of mouth will be even stronger in the presence of marketing alliances.
Hypothesis 6c stipulates that the negative relationship between satisfaction and intention to
switch will be stronger in the presence of marketing alliances. To test these hypotheses, I
recoded the continuous variable satisfaction into a dichotomous variable using a mean-split
transformation. Then, I conducted an ANOVA with loyalty as the dependent variable and
satisfaction (the new dichotomous variable) and alliance as the independent variables. I also ran
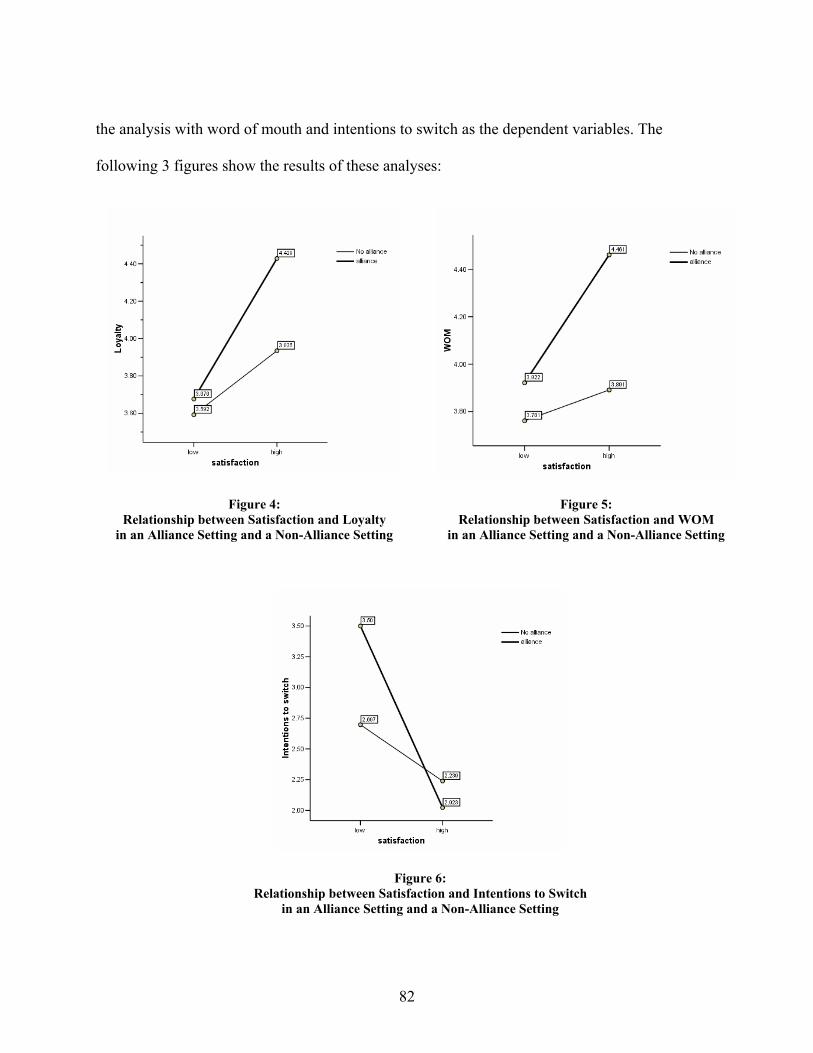
82
the analysis with word of mouth and intentions to switch as the dependent variables. The
following 3 figures show the results of these analyses:
Figure 4: Relationship between Satisfaction and Loyalty
in an Alliance Setting and a Non-Alliance Setting
Figure 5: Relationship between Satisfaction and WOM
in an Alliance Setting and a Non-Alliance Setting
Figure 6: Relationship between Satisfaction and Intentions to Switch
in an Alliance Setting and a Non-Alliance Setting

83
Results lend support to hypotheses 6a and 6b (see figures 4 and 5). As satisfaction
increases, loyalty of consumers in the alliances group (4.43) is significantly stronger than loyalty
of consumers in the no alliance group (3.94, p < .05). Similarly, consumers in the alliances group
engage in significantly more positive word of mouth behavior (4.46) than consumers in the no
alliance group (3.89, p = .00). This lends support to H6a and H6b, that is, the relationship between
satisfaction and loyalty/word of mouth is stronger in the presence of marketing alliances.
Finally, hypothesis 6c is also supported (see figure 6). As satisfaction decreases,
intentions to switch in the alliances group (3.50) is significantly stronger than intentions to
switch of the no alliance group (2.70, p < .05). This finding implies that consumers who are
unsatisfied with an alliance are more likely to discontinue their relationship with the alliance
partners and switch providers than unsatisfied consumers in a no-alliance situation. This is an
important finding from a managerial perspective and will be discussed in more detail in chapter
five.
Study 1 tested and confirmed the positive relationship between marketing alliances and
customer value and the moderating role of alliance type in this relationship. It also showed that
customer value mediates the relationship between marketing alliances and customer satisfaction,
and that relationship between satisfaction and loyalty/word of mouth is even stronger in the
presence of alliances. In the next section, I discuss the two experimental studies conducted,
including the pretesting procedures, the measurement instruments used, the procedures followed,
the manipulation checks, and the experiment results.

84
Studies 2 and 3: Experiments
Two experiment studies were conducted. There were two objectives for experiment 1: 1)
to further test the results of the survey, that is to confirm that marketing alliances do generate
utilitarian and hedonic value, that alliance type is a moderator in this relationship, and that
customer value mediates the relationship between customer value and satisfaction, and 2) to
investigate the process by which different types of value lead to satisfaction. Specifically,
experiment 1 tests H4, which posits that cognitive processing moderates the relationship between
utilitarian value and satisfaction such that consumers who engage in cognitive processing have
higher satisfaction than those who do not engage in cognitive processing, and H5, which posits
that affective response mediates the relationship between hedonic value and customer
satisfaction. Experiment 2 replicates the first experiment, and further investigates the impact of
marketing alliances and customer value on customer satisfaction at different satisfaction levels.
The scenario method was used for the experiments. There are a number of important
benefits of scenario experiments. This method allows expensive or difficult manipulations to be
more easily operationalized, provides the researcher with control over otherwise unmanageable
variables, and facilitates the compression of time by summarizing events that might otherwise
unfold over days or weeks (Bitner 1990; Hess et al. 2003). In contrast, having customers think of
their experiences with actual alliance settings using a retrospective-type method increases
response bias due to memory lapses and extraneous influences (Smith et al. 1999). These issues
are especially important for the present study, which tries to tease out the effects of customer
value generated from alliances on satisfaction. Therefore, the scenario approach proves to be a
desirable and valid method for this study.

85
In the following sections, I first describe the pretest procedures used to select the alliance
scenarios used in the experiments, then discuss the details of each experiment including the
procedure followed, the measures used, manipulation checks, instrument reliabilities, data
analysis, and experiment results.
Pretests: Selection of Alliances
Four value combinations were used in experiment 1: high utilitarian/high hedonic, high
utilitarian/low hedonic, low utilitarian/high hedonic, and low utilitarian/low hedonic. To select
the alliance settings that would generate these value combinations, pretests similar to the ones
used for the survey study were conducted. In conducting the tests, brand names were removed
from the description of the alliances to avoid respondent bias. Table 10 shows the results of the
pretests and the alliance scenarios selected for the experiments and their corresponding
functional and symbolic scores.
Table 10: Alliance Scenarios Used for the Experiments
and Corresponding Functional and Symbolic Scores. (Mean Score on a 7-point Scale)
Functional Score
Symbolic Score
High utilitarian/High hedonic: Videostore and pizzeria with pizzeria located in videostore.
6.15 6.48
High utilitarian/Low hedonic: Hotel and rental car booth with car rental booth located in hotel.
6.52 3.24
Low utilitarian/High hedonic: Videostore and pizzeria with pizzeria not located inside videostore.
3.88 6.16
Low utilitarian/Low hedonic: Hotel and rental car coupon with car rental booth not located in hotel.
3.81 3.92

86
Study 2: Experiment 1
In addition to validating the results of the survey, the purpose of experiment 1 was to test
the process by which utilitarian and hedonic value affect satisfaction. Specifically, experiment 1
tests H4, which posits that cognitive processing moderates the relationship between utilitarian
value and satisfaction such that consumers who engage in cognitive processing have higher
satisfaction levels than those who do not engage in cognitive processing, and H5, which posits
that affect mediates the relationship between hedonic value and customer satisfaction.
Procedure
The hypotheses were tested using a 4 x 2 between-subjects completely randomized
design with four levels of value combinations (High utilitarian/high hedonic, high utilitarian/low
hedonic, low utilitarian/high hedonic, and low utilitarian/low hedonic), and two levels of
processing (cognitive processing and no-cognitive processing). Levels of value combinations
were manipulated using the four different alliance scenarios shown in table 10 (one for each
value combination). Each alliance scenario had two versions, one that stimulated and one that
limited cognitive processing.
Subjects from an introductory course in marketing (N = 213) were randomly assigned to
one of the eight experimental treatments and received extra credit for their participation. The
experiment was administered using a computerized program and subjects answered the questions
directly on the computer. Subjects first read an initial set of instructions before moving to the
scenario page. After reading the alliance scenario, subjects in the cognitive processing condition
were asked to elaborate on their expectations by answering the following open-ended question:
“Take a few moments and think about what you expect your experience to be like. Use the space

87
below to describe how you are likely to feel during the experience and when using the products.”
The purpose of this question was to stimulate subjects’ cognitive processing. They were then told
that performance met their expectations and asked to answer questions about satisfaction, word
of mouth, loyalty, switching behavior, affect, utilitarian and hedonic value (manipulation
checks), and finally demographics. In order to limit their cognitive processing, subjects in the no-
cognitive processing condition were not given the opportunity to elaborate on their expectations
and moved directly to the satisfaction question after reading the alliance scenario.
Measures
The measures used to collect data on value, satisfaction, loyalty, word of mouth, and
switching intentions were the same as the ones used in study 1 (see page 73). The scale used to
measure affect was based on Izard’s Differential Emotions Scale or DES (1977; Izard 1991). The
DES is often used in satisfaction research. Following Van Dolen et al. (2004), I omitted the
disgust emotion because of its ill-fit in the present context. Emotions which have a substantial
cognitive content (contempt, shame and guilt) were also ignored (Oliver 1997). Respondents
indicated to what extent they experienced a certain emotion on a 7-point scale anchored by not at
all and very much. The reliability and validity of the DES have been shown in several studies
(Westbrook 1987; Oliver 1997; Van Dolen et al. 2004). The items comprising the scales are
joyful, happy, attentive, alert, concentrated, sad, downhearted, discouraged, and angry.
Analysis and Results Manipulation checks Manipulation check of Utilitarian/Hedonic value. It was expected that subjects would generate
1) high levels of both utilitarian and hedonic value from the alliance between the videostore and

88
the pizzeria with the pizzeria located in the videostore, 2) higher utilitarian than hedonic value
from the alliance between the hotel and the car rental booth located in the hotel, 3) higher
hedonic than utilitarian value from the alliance between the videostore and the pizzeria with the
pizzeria not located in the videostore, and 4) low levels of utilitarian and hedonic value from the
alliance between the hotel and the car rental booth, with the car rental booth not located in the
hotel. Subjects rated their perceptions towards the value generated by the alliance in the
scenarios using the HED/UT scale used in the pretests and study 1. All alliances generated the
level of utilitarian and hedonic value expected (see table 11).
Table 11: Utilitarian and Hedonic Values Generated
by the Alliance Settings Used for Experiment 1
Utilitarian Value
Hedonic Value
Videostore and pizzeria with pizzeria located in videostore (High utilitarian/High hedonic)
5.65 5.54
Hotel and rental car booth with car rental booth located in hotel (High utilitarian/Low hedonic)
5.72 4.32
Videostore and pizzeria with pizzeria not located inside videostore (Low utilitarian/High hedonic)
4.12 5.94
Hotel and rental car coupon with car rental booth not located in hotel (Low utilitarian/Low hedonic)
3.24 3.42
Manipulation check of Cognitive/no-cognitive processing. Subjects who engage in cognitive
processing should be expected to spend more time elaborating on their expectations than those
who do not. Since the experiment was computerized, the length of time it took each respondent
to answer the questions was captured in the program used to run the experiment. Thus, response
latency (in seconds) to the open-ended question used to stimulate cognitive processing was

89
measured. As expected, subjects in the cognitive processing condition had longer response time
(56.47 seconds) as opposed to the no-cognitive processing one (11.83 seconds, t = 20.87, p=.00).
In addition, answers to the open-ended question were coded and analyzed. This process verified
that all subjects in the cognitive processing group did elaborate on their expectations before
moving to the satisfaction question.
Instrument Reliabilities
Cronbach α reliabilities were estimated on the instruments for satisfaction, word of
mouth, loyalty, switching intentions, affect, utilitarian, and hedonic value. The α’s were .93, .86,
.87, .78, .92, .94, and .85 respectively. This shows that the instruments used were reliable, which
is not surprising since they are well established and validated scales.
Results
H4 and H5, tested in this experiment, pertain to the process by which customer value leads
to satisfaction. Specifically, H4 stipulates that cognitive processing moderates the relationship
between utilitarian value and satisfaction such that consumers who engage in cognitive
processing have higher satisfaction levels than those who do not engage in cognitive processing.
To test this hypothesis, I first ran a 4 (high utilitarian/high hedonic, high utilitarian/low hedonic,
low utilitarian/high hedonic, and low utilitarian/low hedonic) x 2 (cognitive processing/no
cognitive processing) ANOVA with satisfaction as the dependent variable. The resulting mean
plot of this analysis is shown in figure 7.

90
Figure 7: 4 x 2 ANOVA (Experiment 1)
The plot shows that when the value generated by the alliance is high utilitarian/low
hedonic, the group who engaged in cognitive processing achieved higher satisfaction levels
(5.38) than the group who did not engage in cognitive processing (4.26, t = 3.14, p < .01).
However, when the value generated is low utilitarian/high hedonic, there is no significant
difference in satisfaction between the group who engaged in cognitive processing (5.58) and the
group who did not (5.24, t = 1.23, p = .11). This shows the important role of cognitive processing
in increasing satisfaction when utilitarian value is enhanced. When hedonic value is enhanced,
cognitive processing does not really play any role.

91
The plot also shows that the mean satisfaction for the no-processing/high hedonic group
(5.58) is significantly higher than the mean satisfaction for the no-processing/high utilitarian
group (4.26, t = 5.13, p = .00). This means that subjects in the high hedonic group were satisfied
even if subjects did not engage in cognitive processing. This lends support to our prediction that
the link between hedonic value and satisfaction is not through the cognitive processing route.
Next, I ran a 2 (cognitive processing/no cognitive processing) x 2 (high utilitarian/low
utilitarian) x 2 (high hedonic/low hedonic) ANOVA with satisfaction as the dependent variable.
The results of this analysis are shown in Table 12. As predicted, the interaction between
processing/no processing and utilitarian value is significant (F = 4.579, p = .004), meaning that
the relationship between utilitarian value and satisfaction is strengthened when consumers
engage in cognitive processing, lending support to H4.
Table 12: 2 x 2 x 2 ANOVA (Experiment 1)
Effect F-Statistic p (F) Processing/no processing
7.68 .006
Utilitarian
22.14 .000
Hedonic
77.86 .000
Processing/no processing * Utilitarian
10.67 .001
Processing/no processing * Hedonic 3.33 .70
H5 posits that affect mediates the relationship between hedonic value and customer
satisfaction. For this hypothesis to be supported, the mean affect score for the high hedonic/no-
processing group needs to be significantly higher than the mean affect score for the high
utilitarian/no-processing group and the high utilitarian/processing group. Figure 8 shows the

92
affect score for each of the eight cells in the experiment. As can be seen, the affect score for the
high hedonic/no-processing group (5.79) is significantly higher than the affect score of the high
utilitarian/no-processing group (5.09, t = 3.27, p < .01) as well as the high utilitarian/processing
group (5.12, t = 3.40, p < .01). Therefore, affect levels were higher in the high hedonic alliance
situation than in the high utilitarian situation. This shows that affect indeed was the route to
satisfaction, lending support to H5.
Figure 8: Affect scores (Experiment 1)

93
Study 3: Experiment 2
The results of experiment 1 showed that when marketing alliances enhance utilitarian
value, consumers who engage in cognitive processing have higher satisfaction levels than those
who do not engage in cognitive processing. Experiment 1 however, only tests for relatively
moderate levels of satisfaction and does not investigate the issue of whether the findings still
hold - and whether cognitive processing is still helpful - at high and low levels of satisfaction.
The objective of experiment 2 is to further explore the role of cognitive processing at varying
levels of satisfaction.
Procedure
Experiment 2 was a 2 x 2 x 3 between-subjects completely randomized design with two
levels of value combinations (high utilitarian/low hedonic and low utilitarian/high hedonic, two
levels of processing (cognitive processing and no-cognitive processing), and three levels of
satisfaction (no satisfaction, moderate satisfaction, high satisfaction). In a manner similar to
experiment 1, levels of value combinations were manipulated using two different alliance
scenarios (one for each value combination). The same alliance settings in experiment 1 were
used, that is a hotel with a car rental (for high utilitarian-low hedonic) and videostore with pizza
(for low utilitarian-high hedonic). Again, each alliance scenario had two versions, one that
stimulated and one that limited cognitive processing. Satisfaction levels were manipulated
through expectations and performance. Subjects in the “high satisfaction” group were told that
performance exceeded their expectations, those in the “satisfaction” group were told that
performance met their expectations, and subjects in the “no satisfaction” group were told that
performance was lower than their expectations.

94
The structure of the experiment was similar to experiment 1; 299 subjects from an
introductory course in marketing were randomly assigned to one of twelve experimental
treatments and received extra credit for their participation. The experiment was again
computerized and subjects answered the questions directly on the computer. Subjects first read
an initial set of instructions before moving to the scenario page. After reading the alliance
scenario, subjects in the cognitive processing condition were asked to elaborate on their
expectations by answering the open-ended question, “Take a few moments and think about what
you expect your experience to be like. Use the space below to describe how you are likely to feel
during the experience and when using the products.” Subjects were then told that performance
exceeded their expectations (high satisfaction group), met their expectations (satisfaction group),
or was lower than their expectations (no satisfaction group). Subjects were then asked to answer
questions about satisfaction, word of mouth, loyalty, switching behavior, affect, utilitarian and
hedonic value (manipulation checks), and demographics. Subjects in the no-cognitive processing
condition were not given the opportunity to elaborate on their expectations and directly answered
the satisfaction question after reading the alliance scenario.
Analysis and Results Manipulation check for Utilitarian/Hedonic value. Subjects generated more utilitarian value
from the functional alliance between the hotel and the car rental booth, and more hedonic value
from the symbolic alliance between the videostore and the pizzeria.
A t-test revealed significant differences between utilitarian value and hedonic value generated by
the alliances, with all differences in the expected direction (see table 13).

95
Table 13: Utilitarian and Hedonic Values Generated
by the Alliance Settings Used for Experiment 2
Utilitarian value
hedonic value
Hotel and rental car booth with car rental booth located in hotel (High utilitarian/Low hedonic)
5.94 4.44
Videostore and pizzeria with pizzeria not located inside videostore (Low utilitarian/High hedonic)
4.21 6.02
Manipulation check for Cognitive/no-cognitive processing. Response latency was again
used to check for cognitive/no cognitive processing manipulation. The length of time it took each
respondent to answer the questions was captured by the computer. As predicted, subjects in the
cognitive processing condition had longer response time (71.23 seconds) as opposed to the no-
cognitive processing one (13.52 seconds, t = 26.32, p=.00). Answers to the open-ended question
were also coded and analyzed, and results showed that subjects in the cognitive processing group
elaborated on their expectations when answering the question while subjects in the no-cognitive
processing group did not.
Level of Satisfaction. To check the manipulation of satisfaction level, the means of the
three satisfaction level groups were compared. Subjects who were told that performance
exceeded their expectations had higher satisfaction levels (6.54) than those who were told that
performance met their expectations (4.88). Subjects who were told that performance was worse
than what they expected had the lowest satisfaction level (2.36). The manipulation of satisfaction
levels was thus successful.
Instrument Reliabilities. Cronbach α reliabilities were estimated for each of the
instrument’s scales. These are .96 for satisfaction, .94 for word of mouth, .92 for loyalty, .88 for

96
switching intentions, .86 for affect, .92 for utilitarian value, and .87 for hedonic value. The
measures used were therefore reliable.
Experiment 2 is both a replication and an extension of experiment 1. To replicate and
confirm the results of experiment, I first analyzed the data in a fashion similar to experiment 1.
More specifically, I ran a 2 (high utilitarian/low hedonic, low utilitarian/high hedonic) x 2
(cognitive processing/no cognitive processing) ANOVA using only the group for which
expectations were met. The results of this analysis are portrayed in figure 9.
Figure 9: 2 x 2 ANOVA (Experiment 2)
Consistent with the results of experiment 1, we can see from the plot that in the high
utilitarian/low hedonic situation, there is a significant difference between the group that engaged
in cognitive processing and the one that did not (5.95 vs. 5.19, t = 3.77, p = .00). Cognitive

97
processing however, does not help in increasing satisfaction levels for the low utilitarian/high
hedonic situation (5.64 vs. 5.78, t = .53, p = .29). This again shows that cognitive processing
moderates the relationship between utilitarian value and satisfaction such that consumers who
engage in cognitive processing have higher satisfaction than those who do not engage in
cognitive processing.
The question that arises at this point is: does cognitive processing help at all levels of
satisfaction when utilitarian value is enhanced? In other words, if performance is lower than
expectations (low satisfaction) or if performance exceeds expectations (high satisfaction), is
cognitive processing still helpful in improving satisfaction levels? To answer these questions, I
plotted the means for each of the 6 groups for utilitarian value (figure 10). As can be seen in the
figure, while cognitive processing is helpful when expectations are met (satisfaction goes up
from 5.19 to 5.95, t = 3.77, p = .00), the slope is even steeper when performance does not meet
expectations (satisfaction goes up from 2.47 to 3.67, t = 3.50, p = .001), meaning that cognitive
processing plays an even more important role in improving satisfaction at low levels.
6.425.95
3.67
6.34
5.19
2.47
2
4
6
8
no processing processing
exceeded expectationsmet expectationslower than expectations
Figure 10: Mean Satisfaction Scores when Performance is Lower than, Meets, and Exceeds
Expectations (Utilitarian Value)

98
The same analysis for hedonic value is shown in figure 11. As expected, cognitive
processing does not really play any role when performance meets expectations (5.64 vs. 5.78, t =
.53, p = .29). However, when performance is lower than expectations, it appears that cognitive
processing actually leads to lower satisfaction (4.52 vs. 3.80, t = 3.65, p = .001). Important
managerial implications to this finding are discussed in chapter 5.
6.22
5.78
3.8
6.05
5.64
4.52
3
5
7
no processing processing
exceeded expectationsmet expectationslower than expectations
Figure 11: Mean Satisfaction Scores when Performance is Lower than, Meets, and Exceeds
Expectations (Hedonic Value)
Chapter 4 outlined the methodology used to collect and analyze the data to test the model
and hypotheses proposed. In the next chapter, I discuss the findings of this research along with
managerial implications, limitations of the study, and suggestions for future research.
99
CHAPTER FIVE: DISCUSSION, IMPLICATIONS AND CONCLUSIONS
The findings of this research offer a number of important insights into both the alliance
and the satisfaction streams of literature. In the next sections, I present a summary and discussion
of the results pertaining to these two areas, as well as managerial implications, limits of the
study, and suggestions for future research.
Summary and Discussion
The objective of this study was to propose and empirically test a model examining
consumers’ cognitive, affective and behavioral reactions to marketing alliances using both
survey and experimental data. The empirical findings support the conceptual model. As
hypothesized, results show that marketing alliances generate both utilitarian and hedonic value
for customers. This relationship is moderated by the type of alliance under consideration such
that functional alliances generate more utilitarian value and symbolic alliances generate more
hedonic value. Customer value in turn is positively related to customer satisfaction, and plays a
mediating role in the relationship between marketing alliances and customer satisfaction.
Experimental data showed that cognitive processing moderates the relationship between
utilitarian value and satisfaction such that consumers who engage in cognitive processing have
higher satisfaction levels than those who do not engage in cognitive processing. The results also
show that the process to satisfaction is affective when hedonic value is enhanced. Furthermore,
the positive relationship between customer satisfaction and loyalty and that of satisfaction and
word of mouth were found to be stronger for alliance customers as compared to customers of

100
standalone entities. As well, the negative relationship between customer satisfaction and
intentions to switch was stronger for alliance customers than for standalone entities’ customers.
This dissertation is an attempt at filling an important gap in the alliance literature. While
much has been written about the firm side benefits of strategic alliances, research on the
relationship between alliances and the consumer is virtually non-existent. This is a serious gap as
some scholars have started to put into question the benefits of alliances to the consumer, arguing
that while cooperative inter-firm relations may be beneficial to participating firms, they may be
harmful to their customers (Sakakibara 1997). By examining how marketing alliances affect
consumers and their behavioral outcomes, and showing that consumers do derive both utilitarian
and hedonic value from organizational marketing alliances, this study should partly mitigate the
fears of those who have doubts on the benefits inter-firm cooperation generates for consumers.
The dissertation further contributes to understanding the link between value and
satisfaction. Cronin et al. (2000) note that research on the relationship between value and
satisfaction is still in its “embryonic stage,” and while both value and satisfaction have been
separately examined (Gale and Wood 1994; Woodruff 1997; Zeithaml 1988), the association
between the two concepts has received limited attention (Day 2002). Recently, Oliver (1999)
questioned whether satisfaction was an antecedent to or a consequence of value. The results of
this study help answer this question and seem to corroborate recent findings showing that value
is an important antecedent to satisfaction. In this study, value proved to be the mediator in the
relationship between marketing alliances and satisfaction.
The findings support recent literature suggesting that affective processes contribute to the
explanation and prediction of customer satisfaction, and confirm the increasing recognition
among satisfaction researchers that a solely cognitive approach is not appropriate in modeling
101
satisfaction evaluations, meaning that consumers’ evaluative judgments are based partly on
cognition and partly on affective responses (Oliver et al. 1997). The question remains however,
when would the process to satisfaction be cognitive and when would it be affective? This study
provides a preliminary answer. Results show that satisfaction is mainly a cognitive process when
utilitarian value is enhanced, and mainly an affective process when hedonic value is enhanced.
Another important facet of strategy that this dissertation examines is the relationship
between satisfaction and consumers’ behavioral outcomes. While previous research has shown a
positive relationship between satisfaction and loyalty/word of mouth, this study shows that firm
actions can significantly alter the strength of this relationship. In this case, results show that the
relationship was even stronger in the presence of marketing alliances. Therefore, the relationship
between satisfaction and loyalty/word of mouth is not static and can be manipulated by firm
actions to the benefit of both the firm, through more loyalty and word of mouth, and the
consumer through higher satisfaction.
Managerial Implications
Engaging in alliances is a time-consuming and costly process for companies, and the
associated risks are numerous. These range from leakage of proprietary information, to brand
dilution, to inadvertent and gradual dependence on alliance partners. Many factors can lead to the
failure of the alliance. Rarely a secret, this can lead to loss of confidence in management's vision
and judgment in addition to financial losses. While there are countless factors to take into
consideration when forming an alliance, this study offers managers insights from a consumer’s
perspective that can help them make better informed alliance decisions, thereby increasing the
chances of alliance success.

102
First and foremost, and in addition to all the firm side benefits shown in previous
research, the right alliances do generate value for the customer as opposed to no alliances. This
goes against the reservations recently raised by some academics portraying alliances as
beneficial to the firm but detrimental to the customer. The manager’s role therefore is to make
sure the alliance generates some sort of value for the consumer, either utilitarian or hedonic.
Findings show that the value generated is the mediating variable between alliances and customer
satisfaction as well as behavioral outcomes such as loyalty and word of mouth. Therefore, during
the alliance formation process, when looking for a partner, managers should keep the consumer
in mind and have a clear idea of what type of value the potential alliance will generate for their
customers, and how the potential partner will contribute to the creation of this value.
Second, the study shows that when utilitarian value is enhanced, consumers who engage
in cognitive processing have higher levels of satisfaction. This has a direct implication of how
managers must promote utilitarian value-enhancing alliances. Managers should stimulate
cognitive processing when they engage in alliances of a functional nature. One way managers
can attain this objective is by clearly highlighting in the promotional materials the added
utilitarian value consumers can generate from the alliance. On the other hand, knowing that the
satisfaction process is affective when hedonic value is enhanced, managers must emphasize the
hedonic-enhancing aspects of symbolic alliances.
While monitoring and ensuring customer satisfaction is important in all cases, it becomes
of paramount importance in the presence of alliances. Findings show that the positive
relationship between satisfaction and loyalty/word of mouth, and the negative relationship
between satisfaction and intentions to switch are strengthened in the presence of alliances. The

103
higher stakes involved make it that managers should pay closer attention to customer satisfaction
levels when they engage in alliances.
Limitations and Directions for Future Research
This research represents an initial attempt at investigating the impact of marketing
alliances on the customer. As such, the study has a few limitations. First, the specific alliances
used as stimuli in this project present a potential limitation. Although the alliances were selected
based on representativeness and familiarity pretests, the number and the type of alliances used
might have been too restrictive. Future research could examine the impact of different alliances
using different product categories.
Second, while pretests showed that an alliance between Days Inn and a car rental agency
would be considered to be more of a functional than symbolic nature, this is not a real alliance.
Responses might have been biased since they were not based on actual respondent experiences
with an alliance between Days Inn and a car rental agency. Furthermore, the questionnaire did
not ask about a specific brand of car rental agency, thus brand effects might have been
introduced. Future research could collect data from an alliance between Marriott and Hertz,
which was shown to be of a functional nature, or from any other real alliance deemed to be
functional when brand names would be clearly identified.
An interesting offshoot of the present research relates to co-branding alliances. A
common belief in the co-branding literature stipulates that weak brands benefit from partnering
with stronger brands. Research has shown that in a co-branding alliance between a weak and a
strong brand, the weak brand tends to benefit from the alliance because there is a positive
transfer of affect from the stronger brand to the weaker brand. However, this might not always be

104
true, especially in a dual branding situation when the consumer can consume the alliance
products separately. That is because an important characteristic of dual branding, i.e., the fact
that consumers can experience the brands independently of each other, requires the analysis of an
additional stage in consumer processing, namely the stage between the time the consumer is
exposed to the brands and the time the consumer experiences the products. When paring with a
strong brand in a dual branding arrangement, a weak brand is sending the signal that it is on a par
with the strong brand in terms of product quality. This signal in turn serves as a cue that triggers
the consumer’s expectation updating process, and in the absence of quality information about the
weak brand, consumers will use the information they already have about the strong brand to
shape their expectations of the weak brand’s performance. Consumer expectations of the weak
brand therefore will rise to match the level of those of the strong brand. If the weak brand does
not perform according to the new updated customer expectations, satisfaction with the weak
brand might turn out to be lower than if the weak brand had not partnered with the strong brand.
Future research could investigate in which situations partnering with a strong brand can actually
be favorable or unfavorable for a weak brand.
An important finding of this study is that the relationship between satisfaction and
loyalty/word of mouth was strengthened in the presence of marketing alliances. It appears then
that firms can manipulate this relationship through their strategic decisions and actions. Future
research could explore the array of strategies that play this role. Which strategies contribute to
the strengthening of the relationship between satisfaction and behavioral outcomes and which do
not? Companies would be well served to use their limited resources in the pursuit of strategies
most conducive to the strengthening of this relationship, and thus most beneficial to their
performance.

105
Conclusions
Previous work in the area of strategic alliances produced a significant amount of research
on the antecedents, dynamics, and outcomes of cooperative inter-firm relations. However, as
noted by Rindfleich and Moorman (2003), very little is known about the effect of inter-firm
relations on the marketing environment, including their impact on a firm’s customers. Existing
knowledge is limited to issues “tied directly to either the relationship itself or the firms within
it.” This dissertation attempted to fill this gap by developing a framework linking alliances to
customer value, customer satisfaction, and customers’ behavioral outcomes. The model, tested
using both survey and experimental data, showed that marketing alliances play a significant role
in generating consumers’ utilitarian and hedonic value, enhancing satisfaction, and strengthening
the positive relationships between satisfaction and word of mouth, as well as the negative
relationship between satisfaction and switching intentions.
The dissertation also contributes to the satisfaction literature and advances the stream of
research arguing that a purely cognitive approach may be inadequate in modeling satisfaction
evaluations and that it is likely to comprise an element of affect. Results of this study confirm
that affect is an important contributor to satisfaction, particularly when hedonic value is
enhanced.
Over the past two decades, inter-firm cooperation has emerged as an important research
stream from both a managerial and an academic perspective. Investigating the impact of this
cooperation on customers’ attitudes and behaviors seems to be an area ripe for further research.
Using the current study as groundwork, such a model would add much “value” to extending
theory in the area of strategic alliances.

106
APPENDIX
MEASUREMENT INSTRUMENTS

107
Instrument Used to Collect Data from Barnes and Noble/Starbucks Alliance
Dear respondent:
We are interested in developing a research framework to examine how consumers perceive the services offered by various service providers. This research study is part of a course in the Marketing Department at the College of Charleston. As such, the information sought in this questionnaire will be treated as confidential and will be used only at the aggregate level for the purpose of academic research. Your cooperation is critical to the successful completion of this research project. Thank you very much for your time and assistance.
Q1. Did you purchase any product from Barnes & Noble?
Yes (please go to Q3) No Q2. Did you browse through the Barnes and Noble bookstore?
Yes No (please go to section 2 on page 3)
Q3. Did you purchase or consume any product from the Starbucks cafeteria located inside the Barnes and
Noble bookstore?
Yes (please go to Q5) No Q4. Did you spend some time in the Starbucks cafeteria?
Yes No (please go to section 2 on page 3)
Q5. Please check the number on a scale of 1 to 7 that best represents your opinion towards Barnes and
Noble having a Starbucks cafeteria located in the store.
To me, a Starbucks cafeteria located in the Barnes and Noble bookstore is:
Ineffective 1 2 3 4 5 6 7 Effective
Unhelpful 1 2 3 4 5 6 7 Helpful
Not functional 1 2 3 4 5 6 7 Functional
Unnecessary 1 2 3 4 5 6 7 Necessary
Impractical 1 2 3 4 5 6 7 Practical
Not fun 1 2 3 4 5 6 7 Fun
Dull 1 2 3 4 5 6 7 Exciting
Not delightful 1 2 3 4 5 6 7 Delightful
Not thrilling 1 2 3 4 5 6 7 Thrilling
Not enjoyable 1 2 3 4 5 6 7 Enjoyable
Date: Time:

108
Q6. This question refers to your overall experience - your experience with both Barnes and Noble and Starbucks. Please check the number on a scale from 1 to 7 that best represents your satisfaction level with your overall experience.
Very dissatisfied 1 2 3 4 5 6 7 Very satisfied
Very displeased 1 2 3 4 5 6 7 Very pleased
Frustrated 1 2 3 4 5 6 7 Contented
Terrible 1 2 3 4 5 6 7 delighted
Q7. Please circle the number that most closely indicates how much you agree or disagree with the following statements. Again, in the questions below, your “overall experience” refers to your experience with both Barnes and Noble and Starbucks.
Strongly agree
Agree Neither Agree nor Disagree
Disagree Strongly Disagree
I am likely to say positive things to other people about my overall experience
5 4 3 2 1
I will recommend the overall experience to someone who seeks my advice
5 4 3 2 1
I will encourage others to engage in the same overall experience
5 4 3 2 1
I will engage in the same overall experience if the need arises in the future
5 4 3 2 1
I will use the same providers of the overall experience if the need arises in the future
5 4 3 2 1
I intend to intensify my efforts to find better providers of the overall experience
5 4 3 2 1
I have decided to do less business with the providers of the overall experience
5 4 3 2 1
I have decided to switch to different providers of the overall experience
5 4 3 2 1

109
Section 2 Q1. Have you ever in the past, visited a Barnes and Noble bookstore that did not have a Starbucks
inside the store?
Yes No (please go to section 3 on page 5)
Q2. When did you visit the Barnes and Noble bookstore without a Starbucks inside the store?
One week to one month ago One month to six months ago
Six months to 12 months ago More than a year ago
Q3. Please check the number on a scale of 1 to 7 that best represents your opinion towards the Barnes and Noble bookstore without a Starbucks inside the store.
Ineffective 1 2 3 4 5 6 7 Effective
Unhelpful 1 2 3 4 5 6 7 Helpful
Not functional 1 2 3 4 5 6 7 Functional
Unnecessary 1 2 3 4 5 6 7 Necessary
Impractical 1 2 3 4 5 6 7 Practical
Not fun 1 2 3 4 5 6 7 Fun
Dull 1 2 3 4 5 6 7 Exciting
Not delightful 1 2 3 4 5 6 7 Delightful
Not thrilling 1 2 3 4 5 6 7 Thrilling
Not enjoyable 1 2 3 4 5 6 7 Enjoyable
Q4. Please check the number on a scale from 1 to 7 that best represents your satisfaction level with your experience at the Barnes and Noble without a Starbucks in the store.
Very dissatisfied 1 2 3 4 5 6 7 Very satisfied
Very displeased 1 2 3 4 5 6 7 Very pleased
Frustrated 1 2 3 4 5 6 7 Contented
Terrible 1 2 3 4 5 6 7 delighted

110
Q5. Please circle the number that most closely indicates how much you agree or disagree with the following statements about your experience with the Barnes and Noble without a Starbucks in the store.
Strongly agree
Agree Neither Agree nor Disagree
Disagree Strongly Disagree
I am likely to say positive things to other people about my experience
5 4 3 2 1
I will recommend the experience to someone who seeks my advice
5 4 3 2 1
I will encourage others to engage in the same experience
5 4 3 2 1
I will engage in the same experience if the need arises in the future
5 4 3 2 1
I will use the same providers of the experience if the need arises in the future
5 4 3 2 1
I intend to intensify my efforts to find better providers of the experience
5 4 3 2 1
I have decided to do less business with the providers of the experience
5 4 3 2 1
I have decided to switch to different providers of the experience
5 4 3 2 1
Please go to section 4 on page 6

111
Section 3 Q1. Have you ever in the past, visited a Starbucks cafeteria not located in a Barnes and Noble bookstore?
Yes No (please go to section 4 on page 6) Q2. When did you visit the Starbucks cafeteria not located in a Barnes and Noble bookstore? One week to one month ago One month to six months ago
Six months to 12 months ago More than a year ago
Q3. Please check the number on a scale of 1 to 7 that best represents your opinion towards the Starbucks cafeteria not located in a Barnes and Noble bookstore.
Ineffective 1 2 3 4 5 6 7 Effective
Unhelpful 1 2 3 4 5 6 7 Helpful
Not functional 1 2 3 4 5 6 7 Functional
Unnecessary 1 2 3 4 5 6 7 Necessary
Impractical 1 2 3 4 5 6 7 Practical
Not fun 1 2 3 4 5 6 7 Fun
Dull 1 2 3 4 5 6 7 Exciting
Not delightful 1 2 3 4 5 6 7 Delightful
Not thrilling 1 2 3 4 5 6 7 Thrilling
Not enjoyable 1 2 3 4 5 6 7 Enjoyable
Q4. Please check the number on a scale from 1 to 7 that best represents your satisfaction level with your
experience at the Starbucks cafeteria not located in a Barnes and Noble bookstore.
Very dissatisfied 1 2 3 4 5 6 7 Very satisfied
Very displeased 1 2 3 4 5 6 7 Very pleased
Frustrated 1 2 3 4 5 6 7 Contented
Terrible 1 2 3 4 5 6 7 delighted

112
Q5. Please circle the number that most closely indicates how much you agree or disagree with the following statements about your experience with the Starbucks cafeteria not located in a Barnes and Noble bookstore. Strongly
agree Agree Neither
Agree nor Disagree
Disagree Strongly Disagree
I am likely to say positive things to other people about my experience
5 4 3 2 1
I will recommend the experience to someone who seeks my advice
5 4 3 2 1
I will encourage others to engage in the same experience
5 4 3 2 1
I will engage in the same experience if the need arises in the future
5 4 3 2 1
I will use the same providers of the experience if the need arises in the future
5 4 3 2 1
I intend to intensify my efforts to find better providers of the experience
5 4 3 2 1
I have decided to do less business with the providers of the experience
5 4 3 2 1
I have decided to switch to different providers of the experience
5 4 3 2 1
Section 4
Q1. Please rate your perception of the Barnes and Noble brand:
Not market leader 1 2 3 4 5 6 7 Market leader Not at all popular 1 2 3 4 5 6 7 Very popular
Weak brand 1 2 3 4 5 6 7 Strong brand Low quality 1 2 3 4 5 6 7 High quality
Would not be my first choice
1 2 3 4 5 6 7 Would be my first choice
Q2. Please rate your perception of the Starbucks brand:
Not market leader 1 2 3 4 5 6 7 Market leader Not at all popular 1 2 3 4 5 6 7 Very popular
Weak brand 1 2 3 4 5 6 7 Strong brand Low quality 1 2 3 4 5 6 7 High quality
Would not be my first choice
1 2 3 4 5 6 7 Would be my first choice

113
Section 5 Please read the following two definitions: Definition of a “functional alliance” A strategic alliance between two companies is called a functional alliance when the companies’ products are used together or consumed with one another to facilitate proper operation of each other. Definition of a “symbolic alliance” A strategic alliance between two companies is called a symbolic alliance when the consumer might find it more appealing to consume or use the products jointly even though the products could be consumed or used separately. Q1. On a scale of 1 to 7, how functional would you say the alliance between Barnes and Noble and Starbucks is?
Not functional at all
1 2 3 4 5 6 7 Very functional
Q2. On a scale of 1 to 7, how symbolic would you say the alliance between Barnes and Noble and Starbucks is?
Not symbolic at all
1 2 3 4 5 6 7 Very symbolic
These last questions are for classification purposes only: Q3. How many times on average do you visit Barnes and Noble every month? _____________ Q4. How many times on average do you visit Starbucks every month? _____________ Q5. Gender : Male Female Q6. Marital status: Single Married Divorced Separated Q7. Age:
< 20 21- 26 27- 34 35- 44 45- 54
55- 64 > 64
Q8. Occupation: ____________________________

114
Instrument Used to Collect Data from Starbucks
Dear respondent:
We are interested in developing a research framework to examine how consumers perceive the services offered by various service providers. This research study is part of a course in the Marketing Department at the College of Charleston. As such, the information sought in this questionnaire will be treated as confidential and will be used only at the aggregate level for the purpose of academic research. Your cooperation is critical to the successful completion of this research project. Thank you very much for your time and assistance.
Q1. Did you purchase or consume any product from the Starbucks cafeteria?
Yes No (Please go to section 2 on page 3)
Q2. Please check the number on a scale of 1 to 7 that best represents your opinion towards
Starbucks.
Ineffective 1 2 3 4 5 6 7 Effective
Unhelpful 1 2 3 4 5 6 7 Helpful
Not functional 1 2 3 4 5 6 7 Functional
Unnecessary 1 2 3 4 5 6 7 Necessary
Impractical 1 2 3 4 5 6 7 Practical
Not fun 1 2 3 4 5 6 7 Fun
Dull 1 2 3 4 5 6 7 Exciting
Not delightful 1 2 3 4 5 6 7 Delightful
Not thrilling 1 2 3 4 5 6 7 Thrilling
Not enjoyable 1 2 3 4 5 6 7 Enjoyable
Q3. Please check the number on a scale from 1 to 7 that best represents your satisfaction level
with your experience at Starbucks.
Very dissatisfied 1 2 3 4 5 6 7 Very satisfied
Very displeased 1 2 3 4 5 6 7 Very pleased
Frustrated 1 2 3 4 5 6 7 Contented
Terrible 1 2 3 4 5 6 7 delighted
Starbucks Date: Time:

115
Q4. Please circle the number that most closely indicates how much you agree or disagree with the following statements about your experience at Starbucks.
Strongly agree
Agree Neither Agree
nor Disagree
Disagree Strongly Disagree
I am likely to say positive things to other people about my experience at Starbucks
5 4 3 2 1
I will recommend the experience at Starbucks to someone who seeks my advice
5 4 3 2 1
I will encourage others to engage in the same experience at Starbucks
5 4 3 2 1
I will engage in the same experience at Starbucks if the need arises in the future
5 4 3 2 1
I will use Starbucks again if the need arises in the future
5 4 3 2 1
I intend to intensify my efforts to find better providers of the experience than Starbucks
5 4 3 2 1
I have decided to do less business with Starbucks
5 4 3 2 1
I have decided to switch to a different provider of the experience
5 4 3 2 1

116
Section 2
Q1. Have you ever in the past, purchased a product from a Starbucks cafeteria located inside a Barnes and Noble bookstore?
Yes No (please go to section 3 on page 5)
Q2. When did you visit the Starbucks cafeteria located inside a Barnes and Noble bookstore? One week to one month ago One month to six months ago
Six months to 12 months ago More than a year ago
Q3. Please check the number on a scale of 1 to 7 that best represents your opinion towards Barnes
and Noble having a Starbucks cafeteria located in the store.
To me, a Starbucks cafeteria located in the Barnes and Noble bookstore is:
Ineffective 1 2 3 4 5 6 7 Effective
Unhelpful 1 2 3 4 5 6 7 Helpful
Not functional 1 2 3 4 5 6 7 Functional
Unnecessary 1 2 3 4 5 6 7 Necessary
Impractical 1 2 3 4 5 6 7 Practical
Not fun 1 2 3 4 5 6 7 Fun
Dull 1 2 3 4 5 6 7 Exciting
Not delightful 1 2 3 4 5 6 7 Delightful
Not thrilling 1 2 3 4 5 6 7 Thrilling
Not enjoyable 1 2 3 4 5 6 7 Enjoyable
Q4. This question refers to your overall experience - your experience with both Barnes and Noble
and Starbucks. Please check the number on a scale from 1 to 7 that best represents your satisfaction level with your overall experience.
Very dissatisfied 1 2 3 4 5 6 7 Very satisfied
Very displeased 1 2 3 4 5 6 7 Very pleased
Frustrated 1 2 3 4 5 6 7 Contented
Terrible 1 2 3 4 5 6 7 delighted

117
Q5. Please circle the number that most closely indicates how much you agree or disagree with the following statements. Again, in the questions below, your “overall experience” refers to your experience with both Barnes and Noble and Starbucks.
Strongly agree
Agree Neither Agree
nor Disagree
Disagree Strongly Disagree
I am likely to say positive things to other people about my overall experience
5 4 3 2 1
I will recommend the overall experience to someone who seeks my advice
5 4 3 2 1
I will encourage others to engage in the same overall experience
5 4 3 2 1
I will engage in the same overall experience if the need arises in the future
5 4 3 2 1
I will use the same providers of the overall experience if the need arises in the future
5 4 3 2 1
I intend to intensify my efforts to find better providers of the overall experience
5 4 3 2 1
I have decided to do less business with the providers of the overall experience
5 4 3 2 1
I have decided to switch to different providers of the overall experience
5 4 3 2 1

118
Section 3 Q1. Please rate your perception of the Starbucks brand:
Not market leader 1 2 3 4 5 6 7 Market leader Not at all popular 1 2 3 4 5 6 7 Very popular
Weak brand 1 2 3 4 5 6 7 Strong brand Low quality 1 2 3 4 5 6 7 High quality
Would not be my first choice
1 2 3 4 5 6 7 Would be my first choice
Q2. Please rate your perception of the Barnes and Noble brand: If you do not know the Barnes and Noble brand, please check this box and skip to Q3.
Not market leader 1 2 3 4 5 6 7 Market leader Not at all popular 1 2 3 4 5 6 7 Very popular
Weak brand 1 2 3 4 5 6 7 Strong brand Low quality 1 2 3 4 5 6 7 High quality
Would not be my first choice
1 2 3 4 5 6 7 Would be my first choice
These last questions are for classification purposes only: Q3. How many times on average do you visit Starbucks every month? _____________ Q4. Gender : Male Female Q5. Marital status: Single Married Divorced Separated Q6. Age:
< 20 21- 26 27- 34 35- 44 45- 54
55- 64 > 64
Q7. Occupation: ____________________________
Thank you for your participation.

119
Instrument Used to Collect Data from Days Inn
Dear respondent:
We are interested in developing a research framework to examine how consumers perceive the services offered by various service providers. This research study is part of a course in the Marketing Department at the College of Charleston. As such, the information sought in this questionnaire will be treated as confidential and will be used only at the aggregate level for the purpose of academic research. Your cooperation is critical to the successful completion of this research project. Thank you very much for your time and assistance.
Q1. Did you spend at least one night at the Days Inn during this trip to Charleston?
Yes No (Please go to section 2 on page 3) Q2. Please check the number on a scale of 1 to 7 that best represents your opinion towards Days Inn.
Ineffective 1 2 3 4 5 6 7 Effective
Unhelpful 1 2 3 4 5 6 7 Helpful
Not functional 1 2 3 4 5 6 7 Functional
Unnecessary 1 2 3 4 5 6 7 Necessary
Impractical 1 2 3 4 5 6 7 Practical
Not fun 1 2 3 4 5 6 7 Fun
Dull 1 2 3 4 5 6 7 Exciting
Not delightful 1 2 3 4 5 6 7 Delightful
Not thrilling 1 2 3 4 5 6 7 Thrilling
Not enjoyable 1 2 3 4 5 6 7 Enjoyable
Q3. Please check the number on a scale from 1 to 7 that best represents your satisfaction level with your
experience at Days Inn.
Very dissatisfied 1 2 3 4 5 6 7 Very satisfied
Very displeased 1 2 3 4 5 6 7 Very pleased
Frustrated 1 2 3 4 5 6 7 Contented
Terrible 1 2 3 4 5 6 7 delighted

120
Q4. Please circle the number that most closely indicates how much you agree or disagree with the following statements about your experience at Days Inn.
Strongly agree
Agree Neither Agree nor Disagree
Disagree Strongly Disagree
I am likely to say positive things to other people about my experience at Days Inn
5 4 3 2 1
I will recommend my experience at Days Inn to someone who seeks my advice
5 4 3 2 1
I will encourage others to engage in the same experience at Days Inn
5 4 3 2 1
I will engage in the same experience at Days Inn if the need arises in the future
5 4 3 2 1
I will use Days Inn again if the need arises in the future
5 4 3 2 1
I intend to intensify my efforts to find better providers of the experience than Days Inn
5 4 3 2 1
I have decided to do less business with Days Inn
5 4 3 2 1
I have decided to switch to a different provider of the experience
5 4 3 2 1

121
Section 2
Q1. Have you in the past, when you were traveling for business or leisure, rented a car from a rental car booth or counter located inside a hotel? Yes No (please go to section 3 on page 5)
Q2. When did you rent a car from the rental car booth or counter located inside a hotel? One week to one month ago One month to six months ago
Six months to 12 months ago More than a year ago
Q3. Were you traveling at the time or was it in your city of residence? I was traveling It was in my city of residence I can’t remember
Q4. Which company was it that you rented the car from?
Avis Hertz Enterprise
Avis Hertz Alamo
Budget Dollar National
Don’t know Other: _____________________
Q5. Please check the number on a scale of 1 to 7 that best represents your opinion towards the hotel having
a car rental booth or counter located in its lobby.
To me, a car rental booth or counter located in the hotel’s lobby is:
Ineffective 1 2 3 4 5 6 7 Effective
Unhelpful 1 2 3 4 5 6 7 Helpful
Not functional 1 2 3 4 5 6 7 Functional
Unnecessary 1 2 3 4 5 6 7 Necessary
Impractical 1 2 3 4 5 6 7 Practical
Not fun 1 2 3 4 5 6 7 Fun
Dull 1 2 3 4 5 6 7 Exciting
Not delightful 1 2 3 4 5 6 7 Delightful
Not thrilling 1 2 3 4 5 6 7 Thrilling
Not enjoyable 1 2 3 4 5 6 7 Enjoyable
Q6. This question refers to your overall experience - your experience with both the hotel and the car rental.
Please check the number on a scale from 1 to 7 that best represents your satisfaction level with your overall experience.
Very dissatisfied 1 2 3 4 5 6 7 Very satisfied
Very displeased 1 2 3 4 5 6 7 Very pleased
Frustrated 1 2 3 4 5 6 7 Contented
Terrible 1 2 3 4 5 6 7 delighted

122
Q7. Please circle the number that most closely indicates how much you agree or disagree with the following statements. Again, in the questions below, your “overall experience” refers to your experience with both the hotel and the car rental.
Strongly agree
Agree Neither Agree nor Disagree
Disagree Strongly Disagree
I am likely to say positive things to other people about my overall experience
5 4 3 2 1
I will recommend the overall experience to someone who seeks my advice
5 4 3 2 1
I will encourage others to engage in the same overall experience
5 4 3 2 1
I will engage in the same overall experience if the need arises in the future
5 4 3 2 1
I will use the same providers of the overall experience if the need arises in the future
5 4 3 2 1
I intend to intensify my efforts to find better providers of the overall experience
5 4 3 2 1
I have decided to do less business with the providers of the overall experience
5 4 3 2 1
I have decided to switch to different providers of the overall experience
5 4 3 2 1

123
Section 3 Q1. Please rate your perception of the Days Inn brand:
Not market leader 1 2 3 4 5 6 7 Market leader Not at all popular 1 2 3 4 5 6 7 Very popular
Weak brand 1 2 3 4 5 6 7 Strong brand Low quality 1 2 3 4 5 6 7 High quality
Would not be my first choice
1 2 3 4 5 6 7 Would be my first choice
Q2. Please rate your perception of the car rental brand you mentioned in section 2: If you skipped section 2, please check this box and skip to Q3.
Not market leader 1 2 3 4 5 6 7 Market leader Not at all popular 1 2 3 4 5 6 7 Very popular
Weak brand 1 2 3 4 5 6 7 Strong brand Low quality 1 2 3 4 5 6 7 High quality
Would not be my first choice
1 2 3 4 5 6 7 Would be my first choice
These last questions are for classification purposes only: Q3. How many times on average do you rent a car every year? _____________ Q4. How many times on average do you stay in a hotel every year? _____________ Q5. How many nights on this visit are you staying at the Days Inn?
1 - 3 nights 4 - 7 nights 8 nights or more I am not staying at the Days Inn I don’t know
Q6. What is your 5-digit ZIP code? ____________ Q7. If you are from a different country, please state your country of origin: _________________ Q8. Gender : Male Female Q9. Marital status: Single Married Divorced Separated Q10. Age: < 20 21- 26 27- 34 35- 44 45- 54 55- 64 > 64
Q11. Occupation: ____________________________
Thank you for your participation.

124
REFERENCES Abelson, Robert P., Donald R. Kinder, Mark D. Peters, and Susan T. Fiske (1982), "Affective and semantic components in political person perception," Journal of Personality & Social Psychology, 42 (4), p 619-30. Adler, Lee (1966), "Symbiotic Marketing," Harvard Business Review, 44 (November-December), 59-71. Afuah, Allan (2000), "How much do your co-opetitors' capabilities matter in the face of technological change?" Strategic Management Journal, 21 (3), 387. Ahuja, Gautam (2000), "Collaboration networks, structural holes, and innovation: A longitudinal study," Administrative Science Quarterly, 45 (3), 425. Anand, Bharat N and Tarun Khanna (2000), "Do firms learn to create value? The case of alliances," Strategic Management Journal, 21 (3), 295. Anderson, E. W. (1995), "An Economic Approach to Understanding How Customer Satisfaction Affects Buyer Perceptions of Value," in Proceedings of the AMA Winter Educators Conference. Anderson, Eugene A. (1998), "Customer Satisfaction and Word-ofMouth," Journal of Service Research, 1, 1-14. Anderson, Eugene W and Vikas Mittal (2000), "Strengthening the satisfaction-profit chain," Journal of Service Research: JSR, 3 (2), 107. Anderson, Eugene W and Mary W Sullivan (1993), "The antecedents and consequences of customer satisfaction for firms," Marketing Science, 12 (2), 125. Arino, Africa and Jose de la Torre (1998), "Learning from failure: Towards an evolutionary model of collaborative ventures," Organization Science, 9 (3), p 306-25. Athanassopoulos, Antreas D. (2000), "Customer satisfaction cues to support market segmentation and explain switching behavior," Journal of Business Research, 47 (3), p 191-207. Athanassopoulos, Antreas, Spiros Gounaris, and Vlassis Stathakopoulos (2001), "Behavioural responses to customer satisfaction: An empirical study," European Journal of Marketing, 35 (5-6), p 687-707. Atler, C and J Hage (1993), Organizations Working Together. Newbury Park: SAGE Publications. Awadzi, Winston K (1987), "Determinants of Joint Venture Performance: A Study of International Joint Ventures in the United States," Louisiana State University.

125
Babin, Barry J., William R. Darden, and Mitch Griffin (1994), "Work and/or fun: Measuring hedonic and utilitarian shopping value," Journal of Consumer Research, 20 (4), p 644-56. Barkema, Harry G, John H J Bell, and Johannes M Pennings (1996), "Foreign entry, cultural barriers, and learning," Strategic Management Journal, 17 (2), 151. Barkema, Harry G and Freek Vermeulen (1997), "What differences in the cultural backgrounds of partners are detrimental for international joint ventures?" Journal of International Business Studies (4th quarter), 845-61. Baron, Reuben M. and David A. Kenny (1986), "The Moderator-Mediator Variable Distinction in Social Psychological Research: Conceptual, Strategic, and Statistical Considerations," Journal of Personality and Social Psychology, 51 (6), 1173. Barringer, Bruce R. and Jeffrey S. Harrison (2000), "Walking a tightrope: Creating value through interorganizational relationships," Journal of Management, 26 (3), p 367-403. Batra, R. and 0. T. Ahtola (1990), "Measuring the Hedonic and Utilitarian Sources of Consumer Attitudes," Marketing Letters, 2 (April), 159-70. Baum, Joel A C, Tony Calabrese, and Brian S Silverman (2000), "Don't go it alone: Alliance network composition and startups' performance in Canadian biotechnology," Strategic Management Journal, 21 (3), 267-94. Baum, Joel A C and C. Oliver (1991), "Institutional Linkages and Organizational Mortality," Administrative Science Quarterly, 36, 187-218. Beamish, Paul W and J. Peter Killing (1997), Cooperative Strategies: North American Perspectives. San Francisco, California: The New Lexington Press. Bearden, William O. and Richard L. Oliver (1985), "The Role of Public and Private Compalining in Satisfaction with Problem Resolution," Journal of Consumer Affairs, 19 (Winter), 222-40. Bearden, William O. and Jesse E. Teel (1983), "Selected determinants of consumer satisfaction and complaint reports," Journal of Marketing Research, 20 (1), p 21-28. Bertrand, Kate (1992), "MacIBM: Will Marketing Bonds Grow as New Product Marriage Matures?" Business Marketing, 77 (3), 32. Bharadwaj, Anandhi S, Sundar G Bharadwaj, and Benn R Konsynski (1999), "Information technology effects on firm performance as measured by Tobin's q," Management Science, 45 (7), 1008-24.

126
Bitner, Mary J. (1990), "Evaluating service encounters: The effects of physical surroundings and employee responses," Journal of Marketing, 54 (2), p 69-82. Blackett, Tom and Bob Boad (1999), Cobranding: The Science of Alliance: Macmillan Press. Bloch, P.H. (1986), "The product enthusiast: implications for marketing strategy," Journal of Consumer Marketing (Summer), 51-62. Blodgett, Linda Longfellow (1992), "Factors in the Instability of International Joint Ventures: An event history analysis," Strategic Management Journal, 13 (6), 475-82. Bloemer, Jose M. M. and Hans D. P. Kasper (1995), "The complex relationship between consumer satisfaction and brand loyalty," Journal of Economic Psychology, 16 (2), p 311-29. Boddy, David, Douglas Macbeth, and Beverly Wagner (2000), "Implementing collaboration between organizations: An empirical study of supply chain partnering," The Journal of Management Studies, 37 (7), 1003. Bolton, Ruth N. and James H. Drew (1991), "A longitudinal analysis of the impact of service changes on customer attitudes," Journal of Marketing, 55 (1), p 1-9. Bolton, Ruth N., P. K. Kannan, and Matthew D. Bramlett (2000), "Implications of loyalty program membership and service experiences for customer retention and value," Journal of the Academy of Marketing Science, 28 (1), p 95-108. Brief, Arthur P and Max Bazerman (2003), "Editor's comments: Bringing in consumers," Academy of Management. The Academy of Management Review, 28 (2), 187. Bucklin, Louis P and Sanjit Sengupta (1993), "Organizing successful co-marketing alliances," Journal of Marketing, 57 (2), 32-47. Burnham, Thomas A, Judy K Frels, and Vijay Mahajan (2003), "Consumer switching costs: A typology, antecedents, and consequences," Academy of Marketing Science. Journal, 31 (2), 109. Burns, Mary Jane (1993), Value in Exchange: The Consumer Perspective. knoxville: The University of Tennessee. Burt, RS (1992), Structural Holes: The Social Structure of Competition. Cambridge: Harvard University Press. Butz, Howard E. and Leonard D. Goodstein (1996), "Measuring customer value: Gaining the strategic advantage," Organizational Dynamics, 24 (3), p 63-77. Caldwell, Marylouise (2001), "Applying general living systems theory to learn consumers' sense making in attending performing arts," Psychology & Marketing, 18 (5), 497.

127
Callahan, John and Scott MacKenzie (1999), "Metrics for strategic alliance control," R & D Management, 29 (4), 365-77. Carpenter, Gregory S, Rashi Glazer, and Kent Nakamoto (1994), "Meaningful brands from meaningless differentiation: The dependence on irrelevant attributes," JMR, Journal of Marketing Research, 31 (3), 339. Chaudhuri, Arju and Morris Holbrook, B. (2001), "The chain of effects from brand trust and brand affect to brand performance: The role of brand loyalty," Journal of Marketing, 65 (2), 81. Child, John and David Faulkner (1998), Strategies of cooperation: managing alliances, networks, and joint ventures. Oxford New York: Oxford University Press. Child, John and Sally Stewart (1997), "Regional differences in China and their implications for Sino-foreign joint ventures," Journal of General Management, v23 (n2). Childers, Terry L, Christopher L Carr, Joann Peck, and Stephen Carson (2001), "Hedonic and utilitarian motivations for online retail shopping behavior," Journal of Retailing, 77 (4), 511. Chisholm, Rupert F (1998), Developing network organizations: learning from practice and theory. Reading, Massachusetts: Addison-Wesley. Chung, S. (1996), "Performance Effects of Cooperative Strategies among Investment Banking Firms: A Loglinear Analysis of Organizational Exchange Networks," Social Networks, 18, 121-48. Chung, Seungwha, Harbir Singh, and Kyungmook Lee (2000), "Complementarity, status similarity and social capital as drivers of alliance formation," Strategic Management Journal, 21 (1), 1. Churchill, Gilbert, A. (1979), "A paradigm for developing better measures of marketing constructs," JMR, Journal of Marketing Research (pre-1986), 16 (000001), 64. Churchill, Gilbert A. and Carol Surprenant (1982), "An investigation into the determinants of customer satisfaction," Journal of Marketing Research, 19 (4), p 491-504. Clarke, Richard N. (1983), "Collusion and the incentives for information sharing.," Bell Journal of Economics, 14 (2), 383-95. Cronin, J. Joseph, Michael K. Brady, and G. Tomas M. Hult (2000), "Assessing the effects of quality, value, and customer satisfaction on consumer behavioral intentions in service environments," Journal of Retailing, 76 (2), p 193-218.
128
Cronin, J. Joseph and Steven A. Taylor (1992), "Measuring service quality: A reexamination and extension," Journal of Marketing, 56 (3), p 55-68. Crosby, Lawrence A. and Nancy Stephens (1987), "Effects of relationship marketing on satisfaction, retention, and prices in the life insurance industry," JMR, Journal of Marketing Research, 24, 404. Crowley, Ayn E., Eric R. Spangenberg, and Kevin R. Hughes (1992), "Measuring the Hedonic and Utilitarian Dimensions of Attitudes Toward Product Categories," Marketing Letters, 3 (3), 239-49. Curren, Mary T. and Valerie S. Folkes (1987), "Attributional Influences on Consumers' Desires to Communicate about Products," Psychology & Marketing, 4 (1), 31. Das, Somnath, Pradyot K Sen, and Sanjit Sengupta (1998), "Impact of strategic alliances on firm valuation," Academy of Management Journal, 41 (1), 27-41. Das, T K and Bing-Sheng Teng (1996), "Risk types and inter-firm alliance structures," The Journal of Management Studies, 33 (6), 827. Dawkins, Peter M. and Frederick F. Reichheld (1990), "Customer Retention as a Competitive Weapon," Directors and Boards, 14 (4), 42. Dawson, Scott, Peter H. Bloch, and Nancy M. Ridgway (1990), "Shopping Motives, Emotional States, and Retail Outcomes," Journal of Retailing, 66 (4), 408. Day, Ellen (2002), "The role of value in consumer satisfaction," Journal of Consumer Satisfaction, Dissatisfaction and Complaining Behavior, 15, 22. Day, Ellen and Melvin R. Crask (2000), "Value Assessment: The Antecedent of Customer Satisfaction," Journal of Consumer Satisfaction, Dissatisfaction and Complaining Behavior, 13, 52-60. Day, George S (1995), "Advantageous alliances," Journal of the Academy of Marketing Science, 23 (4), 297-301. Day, George S. (2000), "Managing market relationships," Journal of the Academy of Marketing Science, 28 (1), p 24-30. ---- (1990), Market driven strategy: processes for creating value. New York: Free Press. ---- (1983), "Marketing Theory with a Strategic Orientation," Journal of Marketing (pre-1986), 47 (000004), 79.

129
De Ruyter, Ko, Martin Wetzels, Jos Lemmink, and Jan Mattsson (1997), "The dynamics of the service delivery process: A value-based approach," International Journal of Research in Marketing, 14 (3), 231. Dekimpe, Marnik G., Jan-Benedict E. M. Steenkamp, Martin Mellens, and Piet Vanden Abeele (1997), "Decline and variability in brand loyalty," International Journal of Research in Marketing, 14 (5), 405. Dhar, Ravi and Itamar Simonson (1999), "Making complementary choices in consumption episodes: Highlighting versus balancing," JMR, Journal of Marketing Research, 36 (1), 29. Dhar, Ravi and Klaus Wertenbroch (2000), "Consumer choice between hedonic and utilitarian goods," JMR, Journal of Marketing Research, 37 (1), 60. Dhebar, Anirudh (1995), "Complementarity, compatibility, and product change: Breaking with the past?" The Journal of Product Innovation Management, 12 (2), 136. Dick, Alan S. and Kunal Basu (1994), "Customer loyalty: Toward an integrated conceptual framework," Academy of Marketing Science. Journal, 22 (2), 99. Dickson, Pat H and K Mark Weaver (1997), "Environmental determinants and individual-level moderators of alliance use," Academy of Management Journal, 40 (2), 404. Dimaggio, P and W Powell (1983), "The Iron Cage Revisited: Institutional Isomorphism and Collective Rationality in Organizational Fields," American Sociological Review, 48, 147-60. Douma, Marc U., Jan Bilderbeek, Peter J. Idenburg, and Jan Kees Looise (2000), "Strategic alliances: managing the dynamics of fit," Long Range Planning, 33 (4), 579(20). Doz, Yves L. (1996), "The evolution of cooperation in strategic alliances: initial conditions or learning processes?(Evolutionary Perspectives on Strategy)," Strategic Management Journal, v17 (nSPEISS). Doz, Yves L. and Gary Hamel (1998), Alliance advantage: the art of creating value through partnering. Boston: Harvard Business School Press. Dube, Laurette, Bernd H. Schmitt, and France Leclerc (1991), "Consumers' affective response to delays at different phases of a service delivery," Journal of Applied Social Psychology, 21 (10), p 810-20. Dussauge, Pierre and Bernard Garrette (1999), Cooperative strategy: competing successfully through strategic alliances. New York: John Wiley.

130
Dussauge, Pierre, Bernard Garrette, and Will Mitchell (2000), "Learning from competing partners: outcomes and durations of scale and link alliances in Europe, North America and Asia," Strategic Management Journal, 21 (2), 99(28). Dyer, Jeffrey H and Kentaro Nobeoka (2000), "Creating and managing a high-performance knowledge-sharing network: The Toyota case," Strategic Management Journal, 21 (3), 345. Eisenhardt, Kathleen M and Claudia Bird Schoonhoven (1996), "Resource-based view of strategic alliance formation: Strategic and social effects in entrepreneurial firms," Organization Science, 7 (2), 136. Engel, JR, RJ. Kegerreis, and R.D. Blackwell (1969), "Word-of-mouth communication by the innovator," Journal of Marketing, 33, 15-19. Ennew, Christine T. and Martin R. Binks (1999), "Impact of participative service relationships on quality, satisfaction and retention: An exploratory study," Journal of Business Research, 46 (2), p 121-32. Eroglu, Sevgin A. and Karen A. Machleit (1990), "An empirical study of retail crowding: Antecedents and consequences," Journal of Retailing, 66 (2), p 201-21. Evrard, Yves and Philippe Aurier (1996), "Identification and validation of the components of the person-object relationship," Journal of Business Research, 37 (2), p 127-34. Faulkner, David (1995), International strategic alliances: co-operating to compete. London; New York: McGraw-Hill. Fischer, Eileen and Stephen J. Arnold (1990), "More than a Labor of Love: Gender Roles and Christmas Gift Shopping," Journal of Consumer Research, 17 (3), 333. Fisk, Raymond P. and Clifford E. Young (1985), "Disconfirmation of Equity Expectations: Effects on Consumer Satisfaction with Services," in Advances in Consumer Research, E. Hirschman and H. Holbrook, Ed. Provo, UT: Association for Consumer Research. Fornell, Claes, Michael D. Johnson, Eugene W. Anderson, and Jaesung Cha (1996), "The American Customer Satisfaction Index: Nature, purpose, and findings," Journal of Marketing, 60 (4), p 7-18. Fornell, Claes and Birger Wernerfelt (1987), "Defensive Marketing Strategy by Customer Complaint Management: A Theoretical Analysis," JMR, Journal of Marketing Research, 24 (4), 337. Gaeth, Gary J., Irwin Levin, Goutam Chakraborty, and Aron M. Levin (1990), "Consumer Evaluations of Multi-Product Bundles: An Information Integration Analysis," Marketing Letters, 2 (1), 47-57.

131
Gale, Bradley T. and Robert Chapman Wood (1994), Managing customer value: creating quality and service that customers can see. New York: Free Press. Ganesh, Jaishankar, Mark J. Arnold, and Kristy E. Reynolds (2000), "Understanding the customer base of service providers: An examination of the differences between switchers and stayers," Journal of Marketing, 64 (3), p 65-87. Gardner, M. P. (1985), "Mood States and Consumer Behavior: A Critical Review," Journal of Consumer Research, 12 (December), 281-300. Garrette, Bernard and Pierre Dussauge (1995), "Determinants of success in international strategic alliances: Evidence from the global aerospace industry," Journal of International Business Studies, 26 (3), 505-31. Gassenheimer, Jule B, Franklin S Houston, and J Charlene Davis (1998), "The role of economic value, social value, and perceptions of fairness in interorganizational relationship retention decisions," Journal of the Academy of Marketing Science, 26 (4), 322. Geringer, J. Michael and Colette A. Frayne (1990), "Human Resource Management and International Joint Venture Control: A Parent Company Perspective," Management International Review, 30, 103. Geringer, Michael and Louis Hebert (1989), "Control And Performance Of International Joint Ventures," Journal of International Business Studies, 20 (2), 235-35. Goes, James and Seung Ho Park (1997), "Interorganizational links and innovation: The case of hospital services," Academy of Management Journal, 40 (3), 373-696. Gomes-Casseres, Benjamin (1989), "Joint Ventures In The Face Of Global Competition," Sloan Management Review, 30 (3), 17-27. Goodwin, Ross and Brad Ball (1999), "Closing the loop on loyalty," Marketing Management, 8 (1), 24. Grant, Alan W. and Leonard A. Schlesinger (1995), "Realize Your Customer's Full Profit Potential," Harvard Business Review, 73 (September-October), 59-72. Gronroos, Christian (2000), "Relationship Marketing: The Nordic School Perspective," in Handbook of Relationship Marketing, Sheth J.N. and Parvatiyar A., Ed. Thousand Oaks, CA: Sage Publications. Gulati, Ranjay (1995a), "Does familiarity breed trust? The implications of repeated ties for contractual choice in alliances," Academy of Management Journal, 38 (1), p 85-112.

132
---- (1999), "Network location and learning: The influence of network resources and firm capabilities on alliance formation," Strategic Management Journal, 20 (5), 397. ---- (1995b), "Social structure and alliance formation patterns: A longitudinal analysis," Administrative Science Quarterly, 40 (4), p 619-52. Gulati, Ranjay and Harbir Singh (1998), "The architecture of cooperation: Managing coordination costs and appropriation concerns in strategic alliances," Administrative Science Quarterly, 43 (4), p 781-814. Gundlach, Gregory T., Ravi S. Achrol, and John T. Mentzer (1995), "The structure of commitment in exchange," Journal of Marketing, 59 (1), 78-92. Hagedoorn, John and Jos Schakenraad (1994), "The effect of strategic technology alliances on company performance," Strategic Management Journal, 15, 291-309. Hallowell, Roger (1996), "The relationships of customer satisfaction, customer loyalty, and profitability: an empirical study," International Journal of Service Industry Management, 7 (4), 27. Halstead, Diane, David Hartman, and Sandra L. Schmidt (1994), "Multiscore effects on the satisfaction formation process," Journal of the Academy of Marketing Science, 22 (2), p 114-29. Hamel, Gary (1991), "Competition for Competence and Inter-Partner Learning Within International Strategic Alliances," Strategic Management Journal, 12, 83-102. Hamel, Gary, Yves L. Doz, and C. K. Prahalad (1989), "Collaborate with Your Competitors -- and Win," Harvard Business Review, 67 (1), 133-40. Harbison, John R and Peter Jr Pekar (1997), "Strategic togetherness," Across the Board, 34 (2), 56. Havlena, William J. and Morris B. Holbrook (1986), "The varieties of consumption experience: Comparing two typologies of emotion in consumer behavior," Journal of Consumer Research, 13 (3), p 394-404. Heider, Fritz (1945), "Attitude and Cognitive Organization," Journal of Psychology, 21, 107-12. ---- (1958), The Psychology of Interpersonal Relations. New York: John Wiley and Sons. Helson, Harry (1964), Adaptation-level theory. New York: Harper & Row. Hennart, Jean-Francois (1991), "The Transaction Costs Theory of Joint Ventures: An Empirical Study of Japanese Subsidiaries in the United States," Management Science, 37 (4), 483.

133
Hess, Ronald L., Shankar Ganesan, and Noreen M. Klein (2003), "Service failure and recovery: The impact of relationship factors on customer satisfaction," Academy of Marketing Science. Journal, 31 (2), 127. Hirschman, Elizabeth C. (1983), "Predictors of self-projection, fantasy fulfillment, and escapism," Journal of Social Psychology, 120 (1), p 63-76. Hirschman, Elizabeth C. and Morris B. Holbrook (1982), "Hedonic Consumption: Emerging Concepts, Methods and Propositions," Journal of Marketing, 46 (3), 92. Hitt, Michael A., M. Tina Dacin, Edward Levitas, Jean-Luc Arregle, and Anca Borza (2000), "Partner selection in emerging and developed market contexts: Resource-based and organizational learning perspectives," Academy of Management Journal, 43 (3), p 449-67. Holbrook, Morris B, Robert W Chestnut, Terence A Oliva, and Eric A Greenleaf (1984), "Play as a Consumption Experience: The Roles of Emotions, Performance, and Personality in the Enjoyment of Games," Journal of Consumer Research, 11 (2), 728. Holbrook, Morris B. (1996), "Customer value--a framework for analysis and research," Advances in Consumer Research, 23 (1), 138-43. Holbrook, Morris B. and Elizabeth C. Hirschman (1982), "The Experiential Aspects of Consumption: Consumer Fantasies, Feelings, and Fun," Journal of Consumer Research, 9 (2), 132. Holmes, John H. and John D. Lett (1977), "Product sampling and word of mouth," Journal of Advertising Research, 17 (5), p 35-40. Hopkinson, Gillian C. and Davashish Pujari (1999), "A factor analytic study of the sources of meaning in hedonic consumption," European Journal of Marketing, 33 (3/4), 273. Huber, Joel, John Lynch, Kim Corfman, Jack Feldman, Morris Holbrook, Donald Lehmann, Bertrand Munier, David Schkade, and Itamar Simonson (1997), "Thinking About Values in Prospect and Retrospect: Maximizing Experienced Utility," Marketing Letters, 8 (3), 323-34. Hunt, Shelby D. and Robert M. Morgan (1997), "Resource-advantage theory: a snake swallowing its tail or a general theory of competition?" Journal of Marketing, v61 (n4). Hurry, Dileep (1993), "Restructuring in the global economy: The consequences of strategic linkages between Japanese and U.S. firms," Strategic Management Journal, 14, 69. Inkpen, Andrew C (2000), "A note on the dynamics of learning alliances: Competition, cooperation, and relative scope," Strategic Management Journal, 21 (7), 775.

134
Inkpen, Andrew C and Paul W Beamish (1997), "Knowledge, bargaining power, and the instability of international joint," The Academy of Management Review, 22 (1), 177-202. Inkpen, Andrew C. and Adva Dinur (1998), "Knowledge management processes and international joint ventures," Organization Science, 9 (4), p 454-68. Ireland, R Duane, Michael A Hitt, and Deepa Vaidyanath (2002), "Alliance management as a source of competitive advantage," Journal of Management, 28 (3), 413. Izard, Carroll E. (1977), Human Emotions. New York: Plenum Press. ---- (1991), The Psychology of Emotions. New York: Plenum Press. Jarillo, Carlos J (1988), "On Strategic Networks," Strategic Management Journal, 9 (1), 31-42. Jarratt, Denise G. (1998), "A strategic classification of business alliances: a qualitative perspective built from a study of small and medium-sized enterprises," Qualitative Market Research, 1 (1), 39. Johnson, Michael D., Eugene W. Anderson, and Claes Fornell (1995), "Rational and adaptive performance expectations in a customer satisfaction framework," Journal of Consumer Research, 21 (4), p 695-707. Kale, Prashant, Harbir Singh, and Howard Perlmutter (2000), "Learning and protection of proprietary assets in strategic alliances: Building relational capital," Strategic Management Journal, 21 (3), 217. Keaveney, Susan M (1995), "Customer switching behavior in service industries: An exploratory study," Journal of Marketing, 59 (2), 71. Keller, Kevin Lane (2003), Strategic brand management: building, measuring, and managing brand equity (2nd ed.). Upper Saddle River, N.J.: Prentice Hall. Kelley, Scott W., K. Douglas Hoffman, and Mark A. Davis (1993), "A typology of retail failures and recoveries," Journal of Retailing, 69 (4), p 429-52. Kenny, David W. and Frederick F. Reichheld (1990), "The hidden advantages of customer retention," Journal of Retail Banking, 12 (9), 12. Killing, J. Peter (1982), "How to Make a Global Joint Venture Work," Harvard Business Review, 60 (3), 120-8. ---- (1983), Strategies for joint venture success. New York: Praeger.

135
Kogut, Bruce (1988), "Joint Ventures: Theoretical and Empirical Perspectives," Strategic Management Journal (1986-1998), 9 (4), 319. ---- (1989), "The Stability Of Joint Ventures Reciprocity And Competitive," The Journal of Industrial Economics, 38 (2), 183-99. Kraatz, Matthew S (1998), "Learning by association? Interorganizational networks and adaptation to environmental change," Academy of Management Journal, 41 (6), 621. Kumar, Sanjiv and Anju Seth (1998), "The design of coordination and control mechanisms for managing joint venture-parent relationships," Strategic Management Journal, 19 (6), 579. Lambe, C. Jay, Robert E. Spekman, and Shelby D. Hunt (2002), "Alliance competence, resources, and alliance success: Conceptualization, measurement and initial test," Journal of the Academy of Marketing Science, 30 (2), p 141-58. Laroche, Michel, Chankon Kim, and Lianxi Zhou (1996), "Brand familiarity and confidence as determinants of purchase intention: An empirical test in a multiple brand context," Journal of Business Research, 37 (2), 115. LeBlanc, Gaston and Nha Nguyen (1999), "Listening to the customer's voice: examining perceived service value among business college students," The International Journal of Educational Management, 13 (4), 187. Levin, Aron M., Charlene J. Davis, and Irwin Levin (1996), "Theoretical and Empirical Linkages between consumers' responses to different branding strategies," Advances in Consumer Research, 23, 296-300. Levin, Meryl A. (1996), "Mother-daughter relationships in divorced vs. intact families: Conflictual independence, attachment and college adjustment," Dissertation Abstracts International Section A: Humanities & Social Sciences, 57 (6-A), p 2691. Licata, Jane W, Gregory Noah Mills, and Violaine Suran (2001), "Value and satisfaction evaluations during a service relationship," Services Marketing Quarterly, 22 (3), 19. Lorenzoni, Gianni and Andrea Lipparini (1999), "The leveraging of interfirm relationships as a distinctive organizational capability: A longitudinal study," Strategic Management Journal, 20 (4), 317. Lowrey, Tina M, Basil G Englis, Sharon Shavitt, and Michael R Solomon (2001), "Response latency verificaiton of consumption constellations: Implications for advertising strategy," Journal of Advertising, 30 (1), 29.

136
Lyles, Marjorie A. and Jane E. Salk (1996), "Knowledge acquisition from foreign parents in international joint ventures: An empirical examination in the Hungarian context," Journal of International Business Studies, 27 (5), 877-903. Mano, Haim and Richard L. Oliver (1993), "Assessing the dimensionality and structure of the consumption experience: Evaluation, feeling, and satisfaction," Journal of Consumer Research, 20 (3), p 451-66. Mason, Joseph Barry and Samuel Jr. Himes (1973), "An Exploratory Behavioral And Socio-Economic Profile Of Consumer Action About Dissatisfaction With Selected Household Appliances," The Journal of Consumer Affairs (pre-1986), 7 (2), 121. MB, Sarkar, Raj Echambadi, S. Tamer Cavusgil, and Preet S. Aulakh (2001), "The influence of complementarity, compatibility, and relationship capital on alliance performance," Academy of Marketing Science. Journal, 29 (4), 358. McConnell, J.J. and T.J. Nantell (1985), "Corporate Combinations and Common Stock Returns: The Case of Joint Ventures," Journal of Finance, XL (2), 519-36. McDougall, Gordon H.G. and Terrence Levesque (2000), "Customer satisfaction with services: putting perceived value into the equation," The Journal of Services Marketing, 14 (5), 392. McEnally, Martha R. and L. de Chernatony. (1999), "The Evolving Nature of Branding: Consumer and Managerial Considerations," Academy of Marketing Science Review, 1999, 1. Mehrabian, Albert and Warren J. Wixen (1986), "Preferences for individual video games as a function of their emotional effects on players," Journal of Applied Social Psychology, 16 (1), p 3-15. Miles, Raymond E and Charles C Snow (1986), "Organizations: New Concepts for New Forms," California Management Review, 28 (3), 62-74. Minshall, T.H.W. (1999), "A Resource-Based View of Alliances: The Case of the Handheld Computer Industry," International Journal of Innovation Management, 3 (2). Mitchell, W. and K. Singh (1996), "Survival of Businesses Using Collaborative Relationships to Commercialize Complex Goods," Strategic Management Journal, 17 (3), 169-96. Mittal, Vikas and Wagner A. Kamakura (2001), "Satisfaction, repurchase intent, and repurchase behavior: Investigating the moderating effect of customer characteristics," Journal of Marketing Research, 37 (8), p 131-42. Mittal, Vikas, William T. Ross, and Patrick M. Baldasare (1998), "The asymmetric impact of negative and positive attribute-level performance on overall satisfaction and repurchase intentions," Journal of Marketing, 62 (1), p 33-47.

137
Mohr, Jakki and Robert E. Spekman (1994), "Characteristics of partnership success: partnership attributes, communication behavior, and conflict resolution techniques," Strategic Management Journal, 15, 135-52. Montgomery, Cynthia A. and Birger Wernerfelt (1988), "Diversification, Ricardian Rents, and Tobin's q," The Rand Journal of Economics, 19 (4), 623-33. Moore, Kevin R (1998), "Trust and relationship commitment in logistics alliances: A buyer perspective," International Journal of Purchasing and Materials Management, 34 (1), 24-37. Morck, Randall, Andrei Shleifer, and Robert W. Vishny (1988), "Management Ownership and Market Valuation: An Empirical Analysis," Journal of Financial Economics, 20. Morgan, Robert M and Shelby D Hunt (1994), "The commitment-trust theory of relationship marketing," Journal of Marketing, 58 (3), 20. Mowery, David C, Joanne E Oxley, and Brian S Silverman (1996), "Strategic Alliances and interfirm knowledge transfer," Strategic Management Journal, 17 (Winter Special Issue), 77-91. Naumann, Earl (1995), Creating customer value: the path to sustainable competitve advantage. Cincinnati, Ohio: Thomson Executive Press. Newman, Joseph W. and Richard A. Werbel (1973), "Multivariate analysis of brand loyalty for major household appliances," JMR, Journal of Marketing Research (pre-1986), 10 (000004), 404. Nyer, Prashanth U. (1999), "Cathartic Complaining as a Means of Reducing Consumer Dissatisfaction," Journal of Consumer Satisfaction, Dissatisfaction, and Compalining Behavior, 12, 15-25. Oliver, Richard L. (1980), "A cognitive model of the antecedents and consequences of satisfaction decisions," Journal of Marketing Research, 17 (4), p 460-69. ---- (1993), "Cognitive, Affective, and Attribute Bases of the Satisfaction Response," Journal of Consumer Research, 20 (3), p 418-30. ---- (1997), Satisfaction: A Behavioral Perspective on the Consumer. New York: McGraw Hill. ---- (1999), "Value as Excellence in the Consumption Experience," in Consumer value: a framework for analysis and research, Morris B. Holbrook, Ed. New York: Routledge. Oliver, Richard L. and Wayne S. DeSarbo (1988), "Response determinants in satisfaction judgments," Journal of Consumer Research, 14 (4), p 495-507.

138
Oliver, Richard L., Roland T. Rust, and Sajeev Varki (1997), "Customer delight: Foundations, findings and managerial insight," Journal of Retailing, 73 (3), p 311-36. Oliver, Richard L. and John E. Swan (1989), "Consumer perceptions of interpersonal equity and satisfaction in transactions: A field survey approach," Journal of Marketing, 53 (2), p 21-35. Oviatt, Benjamin M and Patricia Phillips McDougall (1994), "Toward a theory of international new ventures," Journal of International Business Studies, 25 (1), 45. Page, Mike, Leyland Pitt, and Pierre Berthon (1996), "Analyzing and reducing customer defections," Long Range Planning, 29 (6), 821. Pan, Feng-Chuan (2004), "Ally Strategic Alliance with Consumers?" Journal of American Academy of Business, Cambridge, 4 (1/2), 323. Parasuraman, A (1997), "Reflections on gaining competitive advantage through customer value," Academy of Marketing Science. Journal, 25 (2), 154. Park, C. Whan, Sung Youl Jun, and Allan D. Shocker (1996), "Composite branding alliances: An investigation of extension and feedback effects," Journal of Marketing Research, 33 (4), p 453-66. Park, Seung Ho, Roger Chen, and Scott Gallagher (2002), "Firm resources as moderators of the relationship between market growth and strategic alliances in semiconductor start-ups," Academy of Management Journal, 45 (3), 527. Park, Seung Ho and Michael V Russo (1996), "When competition eclipses cooperation: An event history analysis of joint venture failure," Management Science, 42 (6), 875-90. Park, Seung Ho and Gerardo R Ungson (1997), "The effect of national culture, organizational complementarity, and economic motivation on joint venture dissolution," Academy of Management Journal, 40 (2), 279-307. Parkhe, Arvind (1993), "Strategic alliance structuring: A game theoretic and transaction cost examination of interfirm cooperation," Academy of Management Journal, 36 (4), p 794-829. Patterson, Paul G. and Richard A. Spreng (1997), "Modelling the relationship between perceived value, satisfaction and repurchase intentions in a business-to-business, services context: an empirical examination," International Journal of Service Industry Management, 8 (5), 414. Payne, A.F. and P.E. Frow (1997), "Relationship marketing: key issues for the utility sector," Journal of Marketing Management, 13, 463-77. Payne, Adrian and Sue Holt (2001), "Diagnosing customer value: Integrating the value process and relationship marketing," British Journal of Management, 12 (2), p 159-82.
139
Pedersen, Per E. and Herbjorn Nysveen (2001), "Shopbot banking: An exploratory study of customer loyalty effects," The International Journal of Bank Marketing, 19 (4/5), 146. Pfaff, Anita B. (1972), "An Index of Consumer Satisfaction," M. Venkatesan (Ed.). Iowa City: Association for Consumer Research. Pickle, Hal B. and Robert Bruce (1972), "Consumerism, Product Satisfaction/Dissatisfaction: An Empirical Investigation," Southern Journal of Business, 7 (September), 87-100. Powell, W. W. (1990), "Neither Market nor Hierarchy: Network Forms of Organization," in Research in Organizational Behavior, Barry M. Staw and L. L. Cummings, Eds. Vol. 12: JAI Press Inc. Powell, Walter W., Kenneth W. Koput, and Laurel Smith-Doerr (1996), "Interorganizational collaboration and the locus of innovation: Networks of learning in biotechnology," Administrative Science Quarterly, 41 (1), p 116-45. Price, Linda L., Eric J. Arnould, and Patrick Tierney (1995), "Going to extremes: Managing service encounters and assessing provider performance," Journal of Marketing, 59 (2), p 83-97. Rao, Akshay R and Robert Ruekert (1994), "Brand alliances as signals of product quality," Sloan Management Review, 36 (1), 87. Rao, Akshay R., Lu Qu, and Robert W. Ruekert (1999), "Signaling unobservable product quality through a brand ally," Journal of Marketing Research, 36 (2), p 258-68. Ravald, Annika and Christian Gronroos (1996), "The value concept and relationship marketing," European Journal of Marketing, 30 (2), 19. Reichheld, Frederick F (1996), "Learning from customer defections," Harvard Business Review, 74 (2), 56. ---- (1993), "Loyalty-based management," Harvard Business Review, 71 (2), 64. Reichheld, Frederick F. and W. Earl Sasser, Jr. (1990), "Zero Defections: Quality Comes to Services," Harvard Business Review, 68 (5), 105. Reuer, Jeffrey J (2000), "Parent firm performance across international joint venture life-cycle stages," Journal of International Business Studies, 31 (1), 1. Richins, Marsha L (1997), "Measuring emotions in the consumption experience," Journal of Consumer Research, 24 (2), 127.

140
---- (1994), "Valuing things: The public and private meanings of possessions," Journal of Consumer Research, 21 (3), 504. Richins, Marsha L. (1983), "Negative word-of-mouth by dissatisfied consumers: A pilot study," Journal of Marketing, 47 (1), p 68-78. Richins, Marsha L. and Scott Dawson (1992), "A Consumer Values Orientation for Materialism and Its Measurement: Scale Development and Validation," Journal of Consumer Research, 19 (3), 303. Rindfleisch, Aric and Christine Moorman (2001), "The acquisition and utilization of information in new product alliances: A strength-of-ties perspective," Journal of Marketing, 65 (2), p 1-18. ---- (2003), "Interfirm cooperation and customer orientation," JMR, Journal of Marketing Research, 40 (4), 421. Rust, Roland T, Anthony J Zahorik, and Timothy L Keiningham (1995), "Return on quality (ROQ): Making service quality financially accountable," Journal of Marketing, 59 (2), 58. Rust, Roland T. and Richard L. Oliver (1994), Service quality: new directions in theory and practice. Thousand Oaks, Calif.: Sage Publications. Rust, Roland T. and Anthony J. Zahorik (1993), "Customer satisfaction, customer retention, and market share," Journal of Retailing, 69 (2), p 193-215. Sakakibara, Mariko (1997), "Heterogeneity of firm capabilities and cooperative research and development: An empirical examination of motives," Strategic Management Journal, 18, 143. Samu, Sridhar, H. Shanker Krishnan, and Robert E. Smith (1999), "Using advertising alliances for new product introduction: Interactions between product complementarity and promotional strategies," Journal of Marketing, 63 (1), p 57-74. Schelesinger, L. and J. Heskett (1991), "Breaking the cycle of failures in services," Sloan Management Review, 32 (3), 17-28. Schultz, Susan E., Robert E. Kleine, and Jerome B. Kernan (1989), "These Are a Few of My Favorite Things: Toward an Explication of Attachment as a Consumer Behavior Construct," in Advances to Consumer Research, Thomas Srull, Ed. Vol. 16. Provo, UT: Association for Consumer Research. Scott, Mark C. (1998), Value drivers: the manager's framework for identifying the drivers of corporate value creation. Chichester New York: Wiley. Sherry, John F. (1990), "A sociocultural analysis of a midwestern American flea market," Journal of Consumer Research, 17 (1), p 13-30.

141
Sheth, Jagdish N., Bruce I. Newman, and Barbara L. Gross (1991), Consumption values and market choices: theory and applications. Cincinnati: South-Western Pub. Silverman, G. (1997), "How to harness the awesome power of word of mouth," Direct Marketing (November), 32-37. Simonin, Bernard L (1997), "The importance of collaborative know-how: An empirical test of the learning organization," Academy of Management Journal, 40 (5), 1150-74. Simonin, Bernard L and Julie A Ruth (1996), "Restructuring Japanese business through Kyosei: Capitalizing on international strategic alliances at the consumer level," International Executive, 38 (1), 53. Simonin, Bernard L. and Julie A. Ruth (1998), "Is a company known by the company it keeps? Assessing the spillover effects of brand alliances on consumer brand attitudes," Journal of Marketing Research, 35 (1), p 30-42. Singh, Kulwant and Will Mitchell (1996), "Precarious collaboration: Business survival after partners shut down or form new partnerships," Strategic Management Journal, 17, 99-106. Sinha, Indrajit and Wayne S. DeSarbo (1998), "An integrated approach toward the spatial modeling of perceived customer value," Journal of Marketing Research, 35 (2), p 236-49. Slater, Stanley F (1997), "Developing a customer value-based theory of the firm," Academy of Marketing Science. Journal, 25 (2), 162. Slater, Stanley F and John C Narver (1994), "Does competitive environment moderate the market orientation-performance relationship?" Journal of Marketing, 58 (1), 46. Smith, Amy, K., Ruth Bolton, N., and Janet Wagner (1999), "A model of customer satisfaction with service encounters involving failure and recovery," JMR, Journal of Marketing Research, 36 (3), 356. Solomon, Michael R and Basil G Englis (1994), "Observations: The big picture - Product complementarity and," Journal of Advertising Research, 34 (1), 57. Solomon, Michael R. (1988), "Mapping Product Constellations: A Sicial Categorization Approach To Consumption Symbolism," Psychology & Marketing, 5 (3), 233. Solomon, Michael R. and Bruce Buchanan (1991), "A Role-Theoretic Approach to Product Symbolism: Mapping a Consumption Constellation," Journal of Business Research, 22 (2), 95.

142
Spekman, Robert E, Theodore M Forbes III, Lynn A Isabella, and Thomas C MacAvoy (1998), "Alliance management: A view from the past and a look to the future," The Journal of Management Studies, 35 (6), 747. Spreng, Richard A., Scott B. MacKenzie, and Richard W. Olshavsky (1996), "A Reexamination of The Determinants of Consumer Satisfaction," Journal of Marketing, 60 (3), 15. Srivastava, Joydeep and Nicholas H. Lurie (2004), "Price-matching guarantees as signals of low store prices: survey and experimental evidence," Journal of Retailing, 80 (2), 117. Srivastava, Rajendra K, Tasadduq A Shervani, and Liam Fahey (1998), "Market-based assets and shareholder value: A framework for analysis," Journal of Marketing, 62 (1), 2. ---- (1999), "Marketing, business processes, and shareholder value: An organizationally embedded view of marketing activities and the discipline of marketing," Journal of Marketing, 63, 168. Steensma, H Kevin and Marjorie A Lyles (2000), "Explaining IJV survival in a transitional economy through social exchange and knowledge-based perspectives," Strategic Management Journal, 21 (8), 831-51. Strahilevitz, Michal and John G Myers (1998), "Donations to charity as purchase incentives: How well they work may depend on what you are trying to sell," Journal of Consumer Research, 24 (4), 434. Stuart, Toby E. (2000), "Interorganizational alliances and the performance of firms: A study of growth and innovation rates in a high-technology industry," Strategic Management Journal, 21, 791-811. ---- (1998), "Network positions and propensities to collaborate: An investigation of strategic alliance formation in a high-technology industry," Administrative Science Quarterly, 43 (3), p 668-98. Swaminathan, Vanitha and Christine Moorman (2002), "Marketing Networks and Firm Performance," Working Paper. Swan, John E. and Richard Oliver (1985), "Automobile Buyer Satisfaction with the Salesperson Related to Equity and Disconfirmation," in Consumer Satisfaction, Dissatisfaction and Complaining Behavior, H. Keith Hunt and Ralph L. Day, Ed. Bloomington, IN: Indiana University Press. Swan, John E. and Richard L. Oliver (1989), "Postpurchase communications by consumers," Journal of Retailing, 65 (4), p 516-33.

143
Sweeney, Jillian C, Geoffrey N Soutar, and Lester W Johnson (1999), "The role of perceived risk in the quality-value relationship: A study in a retail environment," Journal of Retailing, 75 (1), 77. Szymanski, David M. and David H. Henard (2001), "Customer satisfaction: A meta-analysis of the empirical evidence," Journal of the Academy of Marketing Science, 29 (1), p 16-35. Teece, David (1992), "Competition, Cooperation, and Innovation: Organizational Arrangements for Regimes of Rapid Technological Progress," Journal of Economic Behavior & Organization, 18 (1), 1-26. Tellis, Gerard J. (1988), "Advertising exposure, loyalty, and brand purchase: A two-stage model of choice," Journal of Marketing Research, 25 (2), p 134-44. Thibaut, John W. and Harold H. Kelley (1959), "The social psychology of groups." Tsai, Wenpin (2000), "Social capital, strategic relatedness and the formation of intraorganizational linkages," Strategic Management Journal, 21 (9), 925. Tsai, Wenpin and Sumantra Ghoshal (1998), "Social capital and value creation: The role of intrafirm networks," Academy of Management Journal, 41 (4), p 464-76. Tse, David K. and Peter C. Wilton (1988), "Models of consumer satisfaction formation: An extension," Journal of Marketing Research, 25 (2), p 204-12. Ueltschy, Linda C., Michel Laroche, Robert D. Tamilia, and Peter Yannopoulos (2004), "Cross-cultural invariance of measures of satisfaction and service quality," Journal of Business Research, 57 (8), 901. Uzzi, B. (1996), "The Sources and Consequences of Embeddedness for the Economic Performance of Organizations: The Network Effect.," American Sociological Review, 61, 674-98. Vaidyanathan, Rajiv and Praveen Aggarwal (2000), "Strategic brand alliances: implications of ingredient branding for national and private label brands," The Journal of Product and Brand Management, 9 (4), 214. van Dolen, Willemijn, Jos Lemmink, Ko de Ruyter, and Ad de Jong (2002), "Customer-sales employee encounters: A dyadic perspective," Journal of Retailing, 78 (4), p 265-79. Van Dolen, Willemijn, Ko de Ruyter, and Jos Lemmink (2004), "An empirical assessment of the influence of customer emotions and contact employee performance on encounter and relationship satisfaction," Journal of Business Research, 57 (4), 437.

144
Varadarajan, P Rajan and Margaret H Cunningham (1995), "Strategic alliances: A synthesis of conceptual foundations," Journal of the Academy of Marketing Science, 23 (4), 297. Varadarajan, P Rajan and Daniel Rajaratnam (1986), "Symbiotic Marketing Revisited," Journal of Marketing, 50 (1), 7. Varadarajan, Rajan and Satish Jayachandran (1999), "Marketing strategy: An assessment of the state of the field and outlook," Journal of The Academy of Marketing Science, 27 (2), 120-43. Venkatesh, R., Mahajan Vijay, and Muller Eitan (2000), "Dynamic co-marketing alliances: When and why do they succeed or fail?" International Journal of Research in Marketing, 17 (1), 3. Voss, Kevin E, Eric R Spangenberg, and Bianca Grohmann (2003), "Measuring the hedonic and utilitarian dimensions of consumer attitude," JMR, Journal of Marketing Research, 40 (3), 310. Walters, David and Geoff Lancaster (1999), "Value and information - concepts and issues for management," Management Decision, 37 (8), 643. Westbrook, Robert A. (1987), "Product/consumption-based affective responses and postpurchase processes," Journal of Marketing Research, 24 (3), p 258-70. ---- (1981), "Sources of consumer satisfaction with retail outlets," Journal of Retailing, 57 (3), p 68-85. Westbrook, Robert A., Joseph W. Newman, and James R. Taylor (1978), "Satisfaction/dissatisfaction in the purchase decision process," Journal of Marketing, 42 (4), p 54-60. Westbrook, Robert A. and Richard L. Oliver (1991), "The dimensionality of consumption emotion patterns and consumer satisfaction," Journal of Consumer Research, 18 (1), p 84-91. Wirtz, Jochen, Anna S. Mattila, and Rachel L. P. Tan (2000), "The moderating role of target-arousal on the impact of affect on satisfaction--An examination in the context of service experiences," Journal of Retailing, 76 (3), p 347-65. Woodall, Tony (2003), "Conceptualising 'Value for the Customer': An Attributional, Structural and Dispositional Analysis," Academy of Marketing Science Review (12). Woodcock, C Patrick, Paul W Beamish, and Shige Makino (1994), "Ownership-based entry mode strategies and international performance," Journal of International Business Studies, 25 (2), 253-72. Woodruff, Robert B (1997), "Customer value: The next source for competitive advantage," Academy of Marketing Science. Journal, 25 (2), 139.

145
Woodruff, Robert B. and Sarah Gardial (1996), Know your customer: new approaches to customer value and satisfaction. Cambridge, Mass.: Blackwell Business. Yi, Youjae (1990), "A Critical Review of Consumer Satisfaction," in Review of Marketing 1990. Valarie A. Zeithaml ed. Chicago, IL: American Marketing Association. Yi, Youjae and Suna La (2004), "What Influences the Relationship Between Customer Satisfaction and Repurchase Intention? Investigating the Effects of Adjusted Expectations and Customer Loyalty," Psychology & Marketing, 21 (5), 351. Zaichkowsky, Judith Lynne (1985), "Measuring the Involvement Construct," Journal of Consumer Research, 12 (3), 341. Zeelenberg, Marcel and Rik Pieters (2004), "Beyond Valence in Customer Satisfaction: A Review and New Findings on Behavioral Responses to Regret and Disappointment in Failed Services," Journal of Business Research, 57, 445-55. Zeithaml, Valarie A. (1988), "Consumer perceptions of price, quality, and value: a means-end model and synthesis of evidence," Journal of Marketing, 52 (3), 2. Zeithaml, Valarie A., Leonard L. Berry, and A. Parasuraman (1996), "The behavioral consequences of service quality," Journal of Marketing, 60 (2), p 31-46.