Embed Size (px)
Citation preview
2010 Dietary
Guidelines Alliance
Consumer Research
Motivating Families to Lead
a Healthier Lifestyle in
2011 and Beyond
2010 Dietary Guidelines Alliance
Page 2 © 2010
Dietary Guidelines Alliance
Page 2 © 2010
Dietary Guidelines Alliance
TABLE OF CONTENTS
• Mission, Objectives &
Research Design
• Detailed Findings
– Phase 1: In-home Ethnographies
– Phase 2: Focus Groups
– Phase 3: Web Survey
• Conclusions and Implications

Page 3 © 2010
Dietary Guidelines Alliance
Page 3 © 2010
Dietary Guidelines Alliance
Mission, Objectives
& Research Design
Page 4 © 2010
Dietary Guidelines Alliance
Page 4 © 2010
Dietary Guidelines Alliance
The goal of this research is to aid
the Dietary Guidelines Alliance (DGA) in their effort to
understand parents’ knowledge of, and attitudes
toward, crucial food- and health-related topics.
This research will serve to inform future Alliance
efforts consistent with its mission to provide positive
and simple messages to help American consumers
achieve healthy, active lifestyles, consistent with
The Dietary Guidelines for Americans.
GOAL OF THE 2010 DIETARY GUIDELINES ALLIANCE RESEARCH
AND DGA MISSION

Members of the 2010 Dietary Guidelines Alliance
In Liaison with: United Stated Departments of Agriculture and Health and Human Services

Page 6 © 2010
Dietary Guidelines Alliance
Page 6 © 2010
Dietary Guidelines Alliance
• Gather consumer familiarity with and gaps in knowledge regarding the
core concepts of:
• Identify the behaviors, motivators and mindsets that lead to successful
action when it comes to the core concepts, as well as the barriers that
prevent consumers from being successful.
• Determine what role situation and context have in decision-making around
core concepts (e.g., in a restaurant, following exercise).
• Craft communications that inspire action among consumers overall and
among specific subpopulations (i.e., race/ethnicity, education, income).
Achieving energy balance
(contribution of calories in and out, including physical activity)
Core:
#1 Core:
#2 Core:
#3 Core:
#4
Recognizing the impact of portion size /amount
of food and drink consumed
Enjoying higher-calorie foods within the context of
individual calorie needs
Making nutrient-rich choices within the
context of individual calorie needs
RESEARCH OBJECTIVES

Page 7 © 2010
Dietary Guidelines Alliance
Page 7 © 2010
Dietary Guidelines Alliance
RESEARCH DESIGN
Methodology
WEB SURVEY FOR QUANTITATIVE
EVALUATION Quantitative web survey to validate hypotheses
regarding behavior and receptivity to messages
among subpopulations.
FOCUS GROUPS FOR A BROADER
ASSESSMENT OF BEHAVIOR AND
MESSAGES Focus groups to further explore behaviors and gather initial
reaction to draft messages.
ETHNOGRAPHIES FOR A DEEP UNDERSTANDING
OF CURRENT BEHAVIOR In-home ethnographic research to capture and understand consumer behavior
as it relates to dietary choices and physical activity.
IDEATION FOR IDEA GENERATION Ideation session led by Cogent Research in order to determine the goals of the research and
generate initial thoughts on key areas of inquiry and messages to be tested throughout the research process.
Page 8 © 2010
Dietary Guidelines Alliance
Page 8 © 2010
Dietary Guidelines Alliance
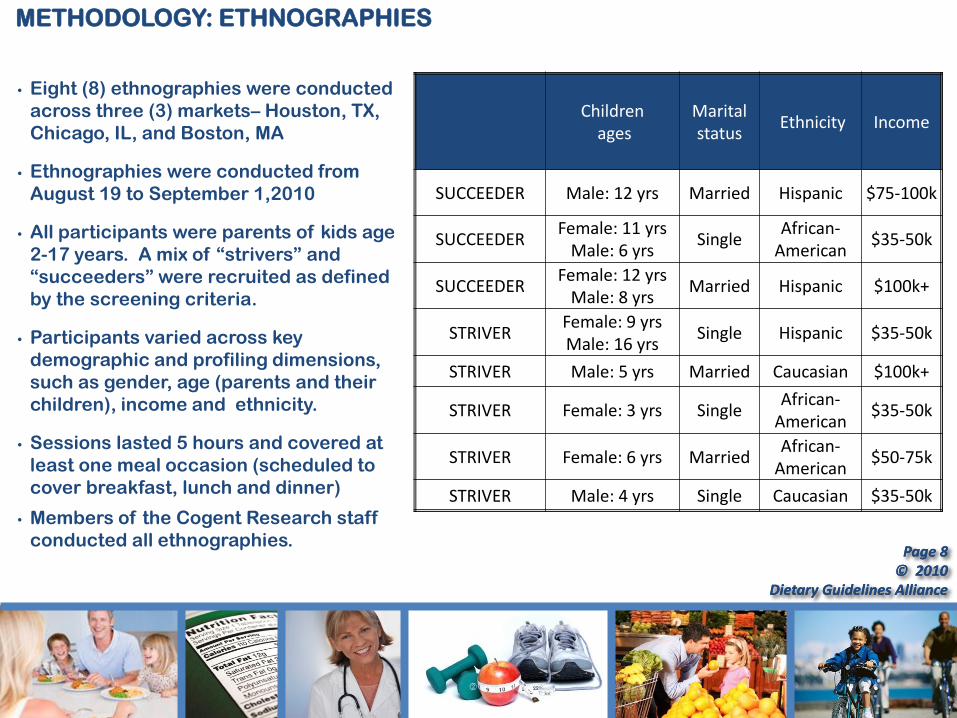
METHODOLOGY: ETHNOGRAPHIES
• Eight (8) ethnographies were conducted
across three (3) markets– Houston, TX,
Chicago, IL, and Boston, MA
• Ethnographies were conducted from
August 19 to September 1,2010
• All participants were parents of kids age
2-17 years. A mix of “strivers” and
“succeeders” were recruited as defined
by the screening criteria.
• Participants varied across key
demographic and profiling dimensions,
such as gender, age (parents and their
children), income and ethnicity.
• Sessions lasted 5 hours and covered at
least one meal occasion (scheduled to
cover breakfast, lunch and dinner)
• Members of the Cogent Research staff
conducted all ethnographies.
Children ages
Marital status
Ethnicity Income
SUCCEEDER Male: 12 yrs Married Hispanic $75-100k
SUCCEEDER Female: 11 yrs
Male: 6 yrs Single
African-American
$35-50k
SUCCEEDER Female: 12 yrs
Male: 8 yrs Married Hispanic $100k+
STRIVER Female: 9 yrs Male: 16 yrs
Single Hispanic $35-50k
STRIVER Male: 5 yrs Married Caucasian $100k+
STRIVER Female: 3 yrs Single African-
American $35-50k
STRIVER Female: 6 yrs Married African-
American $50-75k
STRIVER Male: 4 yrs Single Caucasian $35-50k

Page 9 © 2010
Dietary Guidelines Alliance
Page 9 © 2010
Dietary Guidelines Alliance
DEFINITION OF STRIVERS AND SUCCEEDERS
Question asked Striver Succeeder
Perception of success of family’s food-related choices and actions Not successful Successful
Perception of success of family’s physical activity choices and actions
Not successful
Successful
Doing Activity :
• Manage our weight by balancing the calories consumed with the calories burned
• Select foods from all food groups that are rich in nutrients and lower in calories
• Include indulgent foods without compromising our weight or the overall healthfulness of our diet
• Make conscious decisions to manage our weight by controlling portions at meals and snacks
• Think ahead about nutritional needs when planning or preparing meals or snacks
Trying 3, but doing no more than 1
consistently (4+ days/week)
Doing 3 or more consistently (At least
4+ days/week)
How many days per week members of family are physically active for at least 30 minutes or more (either 30 minutes at once or spread throughout the day)
No more than 3 days/week
At least 3 days/week and doing some form
of energy balance

© 2010 Dietary Guidelines Alliance
METHODOLOGY: FOCUS GROUPS
• Six (6) focus groups were conducted across three (3) markets– Birmingham, AL,
Baltimore, MD, and Oakland, CA.
• Groups were conducted from September 7-16, 2010
• All participants were parents of children age 2-17 years. All were “strivers” as defined by
the screening criteria.
• Participants varied across key demographic and profiling dimensions, such as gender, age
(parents and their children) and ethnicity.
• Groups were divided by income as a measurement of socioeconomic status. “Low-
moderate income” was defined as HHI $50,000 or less, “Moderate to high income” was
defined as HHI $50,000 or more.
• Moderated by Christy White, Principal, Cogent Research, Cambridge Massachusetts
Group Description Birmingham, AL Baltimore, MD
Oakland, CA
Low to Mod SES Group 1 Group 2 Group 1
Mod to High SES Group 2 Group 1 Group 2
Page 11 © 2010
Dietary Guidelines Alliance
Page 11 © 2010
Dietary Guidelines Alliance
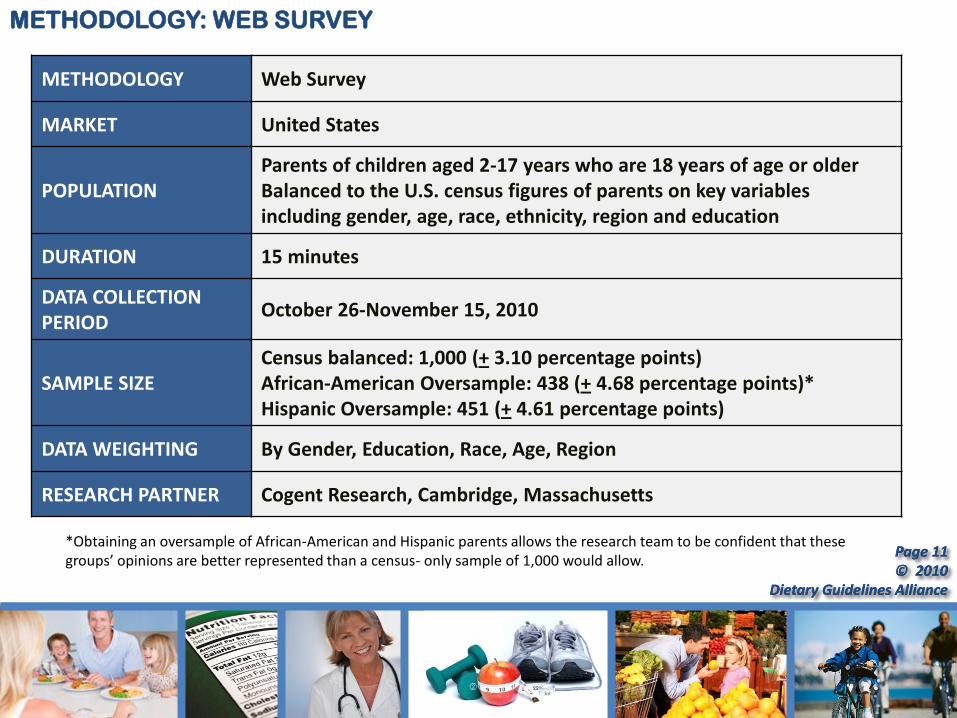
METHODOLOGY Web Survey
MARKET United States
POPULATION Parents of children aged 2-17 years who are 18 years of age or older Balanced to the U.S. census figures of parents on key variables including gender, age, race, ethnicity, region and education
DURATION 15 minutes
DATA COLLECTION PERIOD
October 26-November 15, 2010
SAMPLE SIZE Census balanced: 1,000 (+ 3.10 percentage points) African-American Oversample: 438 (+ 4.68 percentage points)* Hispanic Oversample: 451 (+ 4.61 percentage points)
DATA WEIGHTING By Gender, Education, Race, Age, Region
RESEARCH PARTNER Cogent Research, Cambridge, Massachusetts
METHODOLOGY: WEB SURVEY
*Obtaining an oversample of African-American and Hispanic parents allows the research team to be confident that these groups’ opinions are better represented than a census- only sample of 1,000 would allow.

Page 12 © 2010
Dietary Guidelines Alliance
Page 12 © 2010
Dietary Guidelines Alliance
Detailed Findings
Phase 1: In-home Ethnographies
To observe and understand consumer behavior as it
relates to dietary choices and physical activity among
“striver” and “succeeder” families

Page 13 © 2010
Dietary Guidelines Alliance
Page 13 © 2010
Dietary Guidelines Alliance
Common Characteristics of “Strivers”
Activities Health Attitudes
• Use more technology as entertainment, video games, TV, computer
• Kids not as involved in sports
• Some playing outside, riding bikes etc.
• Parents are making an effort to be physically active but are not satisfied and call themselves “lazy.” Some belong to a gym or have exercise equipment, but fewer have an activity they enjoy
• Less family time spent being physically active
• Have a strong desire for their families to be healthy
• Planning seems daunting, often busy and don’t have time to plan ahead or cook from scratch
• Believe food and nutrition is important, but may not seek out information, might have been inspired by TV shows to make more effort
• Less inclined to monitor portions, including consuming more higher calorie options
• Fewer rules about snacks and more likely to give in to kids’ requests
• Pay less attention to nutritional content, not interested in counting calories
“If I wanted to sit down and do math all day, I’d be a mathematician. I just want to aim for healthy ingredients
and I feel like that will get to the same place.” Striver Mom
“Riley ate 15 mini corndogs in one day and I asked the doctor if it was okay,
and she said it was fine because it was a protein and a carb.” Striver Mom
Page 14 © 2010
Dietary Guidelines Alliance
Page 14 © 2010
Dietary Guidelines Alliance
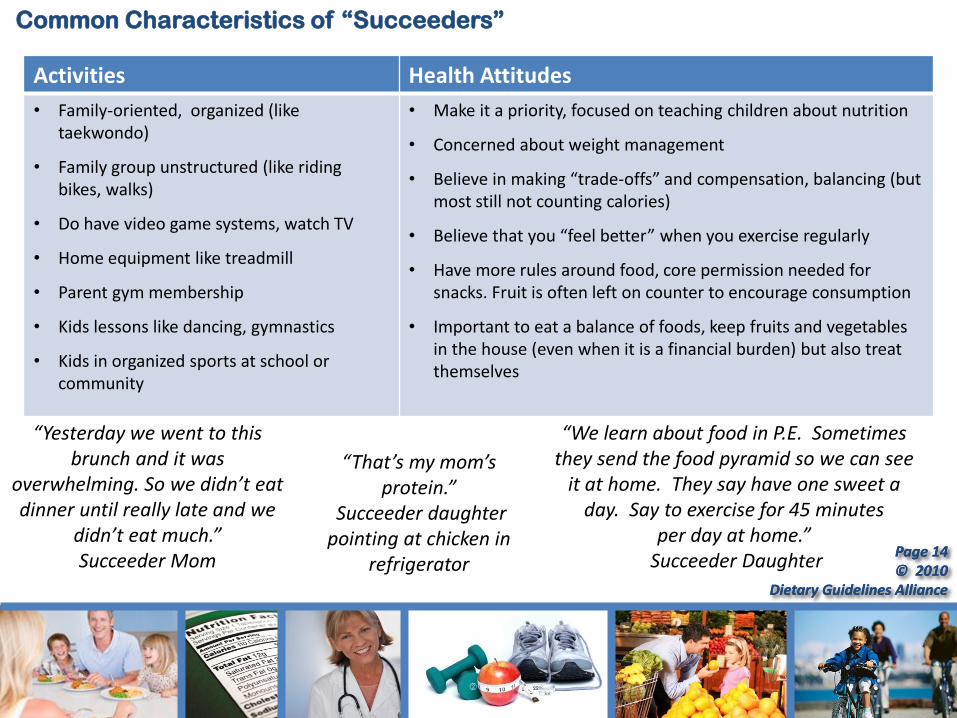
Common Characteristics of “Succeeders”
Activities Health Attitudes
• Family-oriented, organized (like taekwondo)
• Family group unstructured (like riding bikes, walks)
• Do have video game systems, watch TV
• Home equipment like treadmill
• Parent gym membership
• Kids lessons like dancing, gymnastics
• Kids in organized sports at school or community
• Make it a priority, focused on teaching children about nutrition
• Concerned about weight management
• Believe in making “trade-offs” and compensation, balancing (but most still not counting calories)
• Believe that you “feel better” when you exercise regularly
• Have more rules around food, core permission needed for snacks. Fruit is often left on counter to encourage consumption
• Important to eat a balance of foods, keep fruits and vegetables in the house (even when it is a financial burden) but also treat themselves
“Yesterday we went to this brunch and it was
overwhelming. So we didn’t eat dinner until really late and we
didn’t eat much.” Succeeder Mom
“We learn about food in P.E. Sometimes they send the food pyramid so we can see
it at home. They say have one sweet a day. Say to exercise for 45 minutes
per day at home.” Succeeder Daughter
“That’s my mom’s protein.”
Succeeder daughter pointing at chicken in
refrigerator
Page 15 © 2010
Dietary Guidelines Alliance
Page 15 © 2010
Dietary Guidelines Alliance
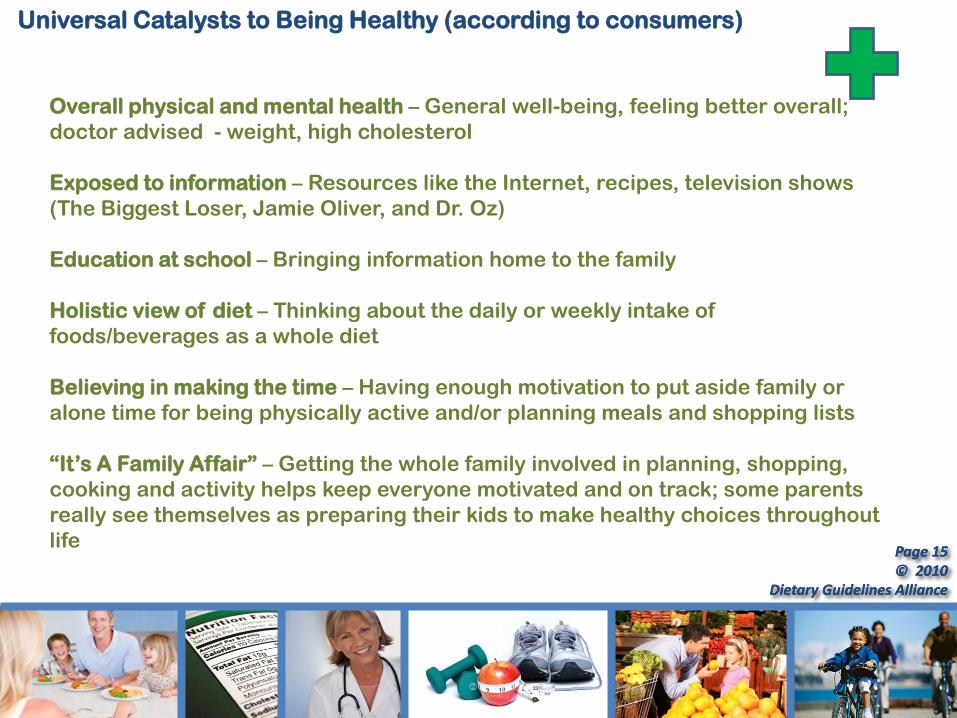
Overall physical and mental health – General well-being, feeling better overall;
doctor advised - weight, high cholesterol
Exposed to information – Resources like the Internet, recipes, television shows
(The Biggest Loser, Jamie Oliver, and Dr. Oz)
Education at school – Bringing information home to the family
Holistic view of diet – Thinking about the daily or weekly intake of
foods/beverages as a whole diet
Believing in making the time – Having enough motivation to put aside family or
alone time for being physically active and/or planning meals and shopping lists
“It’s A Family Affair” – Getting the whole family involved in planning, shopping,
cooking and activity helps keep everyone motivated and on track; some parents
really see themselves as preparing their kids to make healthy choices throughout
life
Universal Catalysts to Being Healthy (according to consumers)
Page 16 © 2010
Dietary Guidelines Alliance
Page 16 © 2010
Dietary Guidelines Alliance
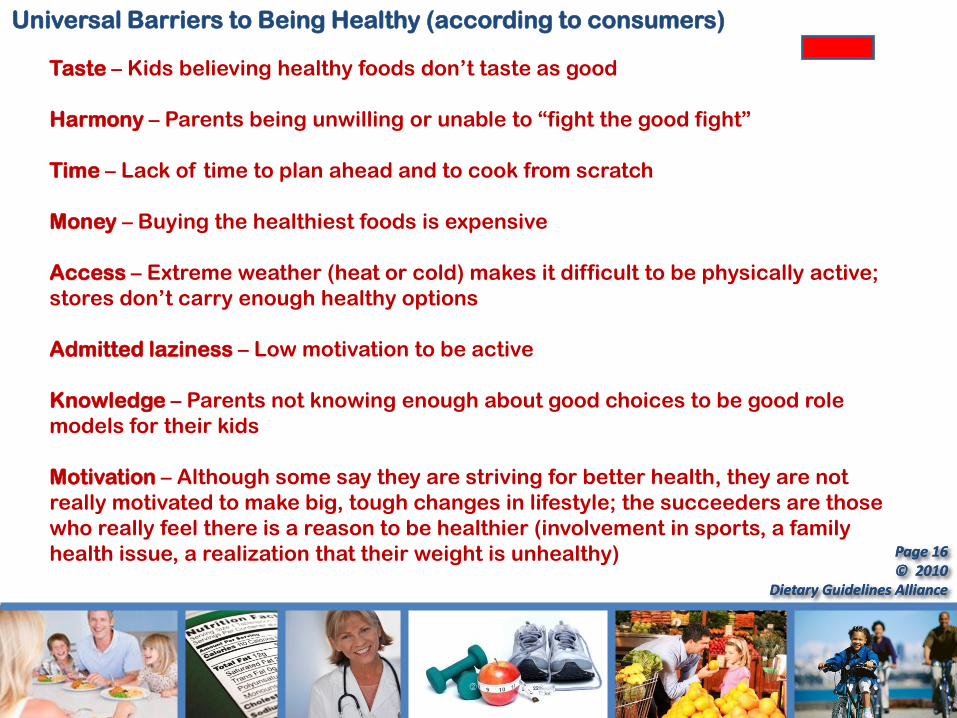
Universal Barriers to Being Healthy (according to consumers)
Taste – Kids believing healthy foods don’t taste as good
Harmony – Parents being unwilling or unable to “fight the good fight”
Time – Lack of time to plan ahead and to cook from scratch
Money – Buying the healthiest foods is expensive
Access – Extreme weather (heat or cold) makes it difficult to be physically active;
stores don’t carry enough healthy options
Admitted laziness – Low motivation to be active
Knowledge – Parents not knowing enough about good choices to be good role
models for their kids
Motivation – Although some say they are striving for better health, they are not
really motivated to make big, tough changes in lifestyle; the succeeders are those
who really feel there is a reason to be healthier (involvement in sports, a family
health issue, a realization that their weight is unhealthy)

Page 17 © 2010
Dietary Guidelines Alliance
Page 17 © 2010
Dietary Guidelines Alliance
Photos from the “Striver” Families
Page 18 © 2010
Dietary Guidelines Alliance
Page 18 © 2010
Dietary Guidelines Alliance
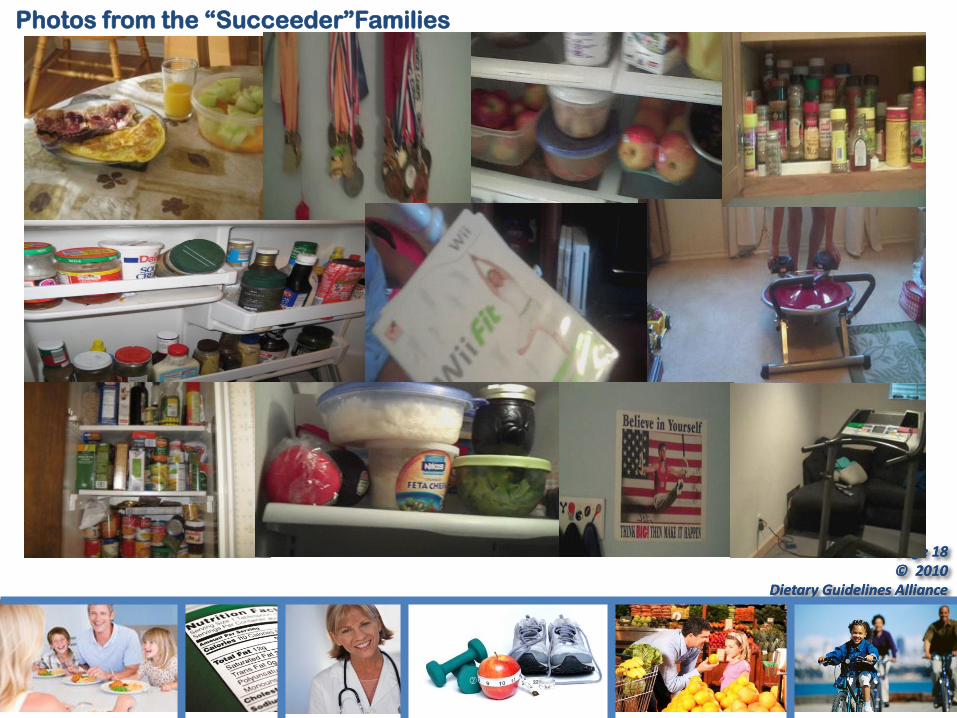
Photos from the “Succeeder”Families
Page 19 © 2010
Dietary Guidelines Alliance
Page 19 © 2010
Dietary Guidelines Alliance
Detailed Findings
Phase II: Focus Groups
Focus groups among parents in “striver” families to further
explore behaviors, barriers and catalysts and gather initial
reaction to draft messages on core concepts
Page 20 © 2010
Dietary Guidelines Alliance
Page 20 © 2010
Dietary Guidelines Alliance
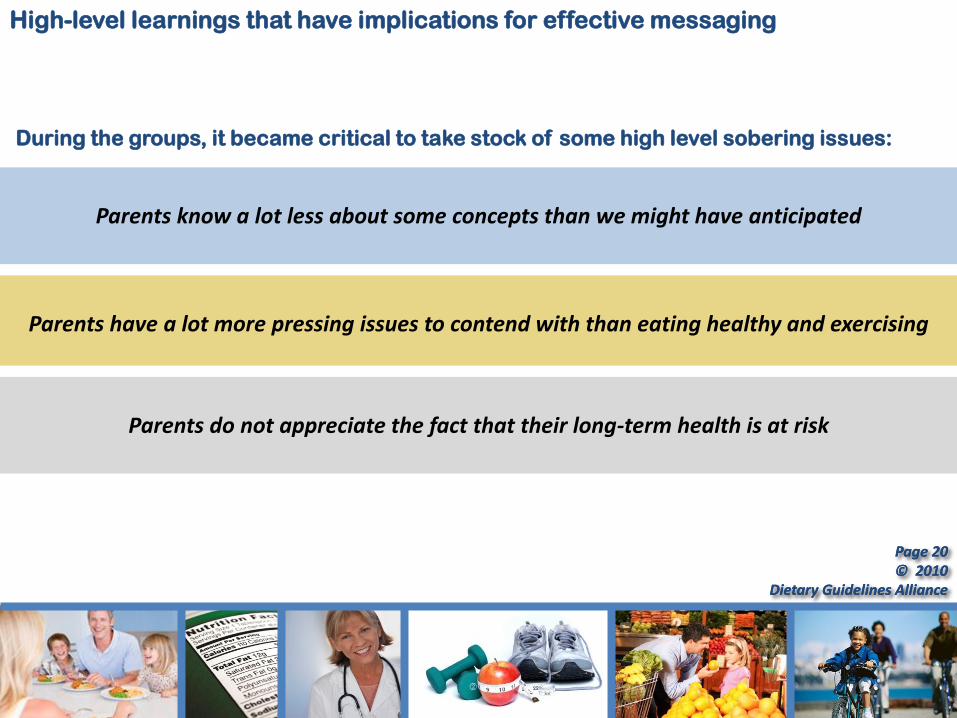
High-level learnings that have implications for effective messaging
During the groups, it became critical to take stock of some high level sobering issues:
Parents know a lot less about some concepts than we might have anticipated
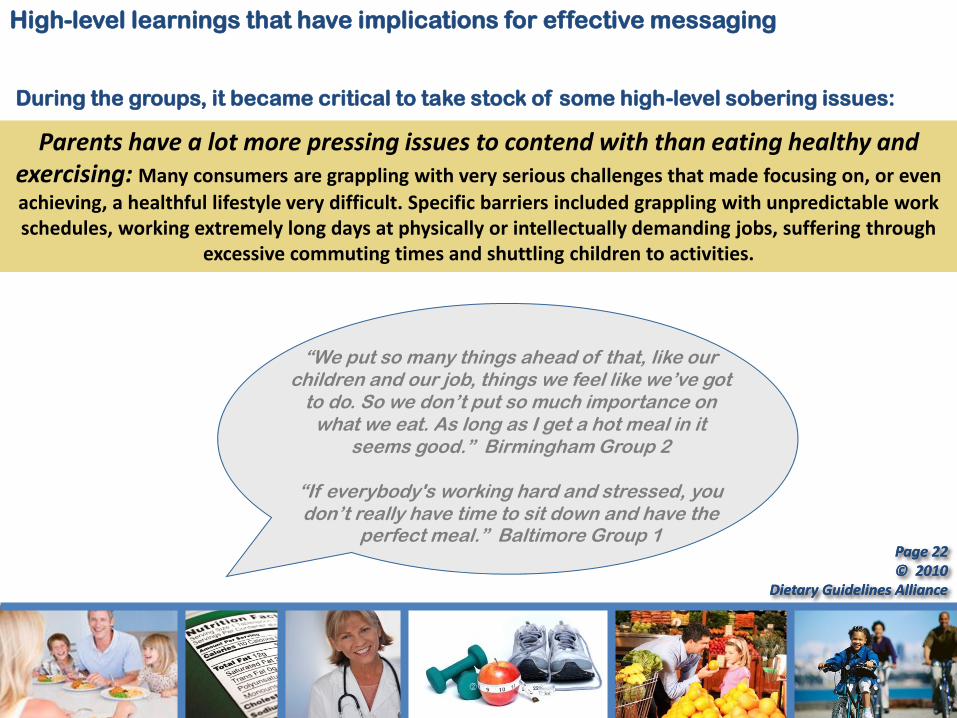
Parents have a lot more pressing issues to contend with than eating healthy and exercising
Parents do not appreciate the fact that their long-term health is at risk

Page 21 © 2010
Dietary Guidelines Alliance
Page 21 © 2010
Dietary Guidelines Alliance
Parents know a lot less about some concepts than we might have anticipated: Many consumers lack a basic understanding of the fundamentals of constructing a healthful diet, never
mind some of the more sophisticated concepts, such as calories in and out. The few people that seemed to have a good grasp on the basics had received structured education (e.g., WIC, Weight Watchers), or
were avid fans of TV programming focused on dietary/weight-related topics (e.g., Rachel Ray, The Biggest Loser). For some, conflicting information leads to confusion.
During the groups, it became critical to take stock of some high-level sobering issues:
“The biggest problem is
how to actually do it, like how much [activity] do I need and how do I actually make it happen?” Birmingham Group 1
“Do all foods have calories?” Birmingham Group 1
“I have been bombarded by so many schools of thought, that I take
everything with a grain of salt. I see that [group member] has his numbers, Dr. Phil [has] numbers, they don’t all jive.” Oakland Group 1
High-level learnings that have implications for effective messaging
Page 22 © 2010
Dietary Guidelines Alliance
Page 22 © 2010
Dietary Guidelines Alliance
Parents have a lot more pressing issues to contend with than eating healthy and exercising: Many consumers are grappling with very serious challenges that made focusing on, or even
achieving, a healthful lifestyle very difficult. Specific barriers included grappling with unpredictable work schedules, working extremely long days at physically or intellectually demanding jobs, suffering through
excessive commuting times and shuttling children to activities.
During the groups, it became critical to take stock of some high-level sobering issues:
“We put so many things ahead of that, like our children and our job, things we feel like we’ve got
to do. So we don’t put so much importance on what we eat. As long as I get a hot meal in it
seems good.” Birmingham Group 2
“If everybody's working hard and stressed, you don’t really have time to sit down and have the
perfect meal.” Baltimore Group 1
High-level learnings that have implications for effective messaging
Page 23 © 2010
Dietary Guidelines Alliance
Page 23 © 2010
Dietary Guidelines Alliance
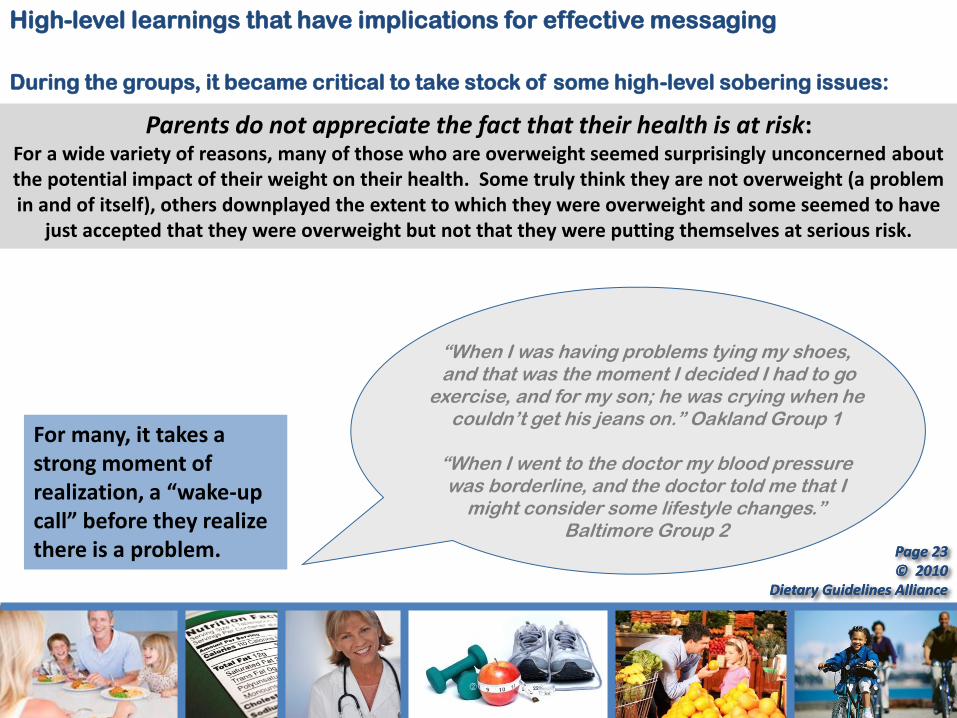
Parents do not appreciate the fact that their health is at risk: For a wide variety of reasons, many of those who are overweight seemed surprisingly unconcerned about the potential impact of their weight on their health. Some truly think they are not overweight (a problem in and of itself), others downplayed the extent to which they were overweight and some seemed to have
just accepted that they were overweight but not that they were putting themselves at serious risk.
During the groups, it became critical to take stock of some high-level sobering issues:
“When I was having problems tying my shoes, and that was the moment I decided I had to go
exercise, and for my son; he was crying when he couldn’t get his jeans on.” Oakland Group 1
“When I went to the doctor my blood pressure was borderline, and the doctor told me that I
might consider some lifestyle changes.” Baltimore Group 2
For many, it takes a strong moment of realization, a “wake-up call” before they realize there is a problem.
High-level learnings that have implications for effective messaging
Page 24 © 2010
Dietary Guidelines Alliance
Page 24 © 2010
Dietary Guidelines Alliance
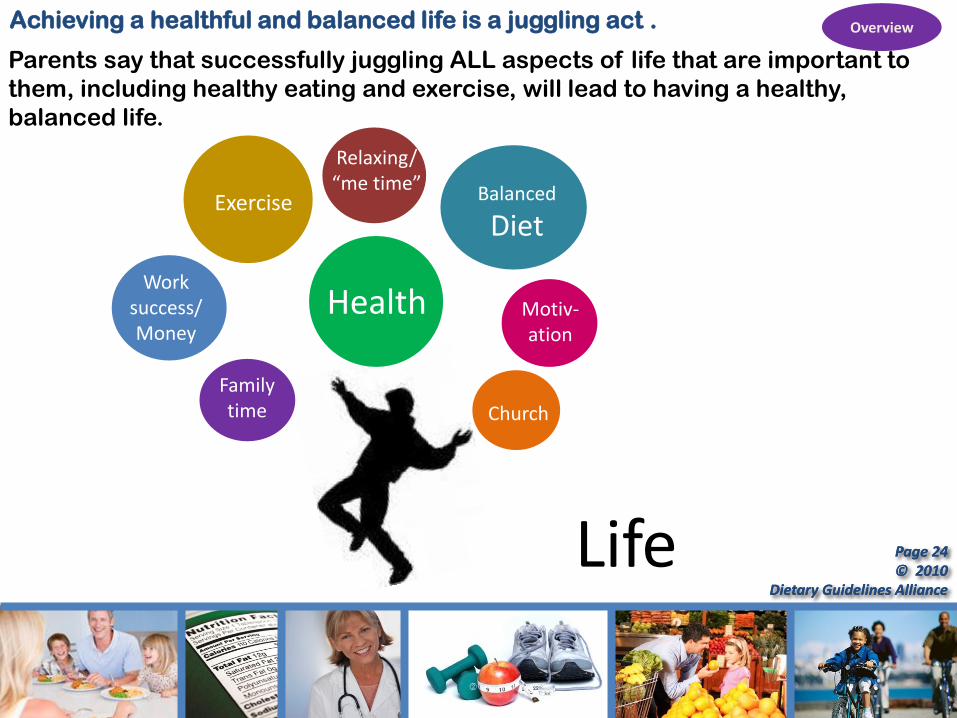
Achieving a healthful and balanced life is a juggling act .
Family time
Relaxing/ “me time” Balanced
Diet Exercise
Church
Life
Health Work
success/ Money
Overview
Parents say that successfully juggling ALL aspects of life that are important to
them, including healthy eating and exercise, will lead to having a healthy,
balanced life.
Motiv- ation
Page 25 © 2010
Dietary Guidelines Alliance
Page 25 © 2010
Dietary Guidelines Alliance
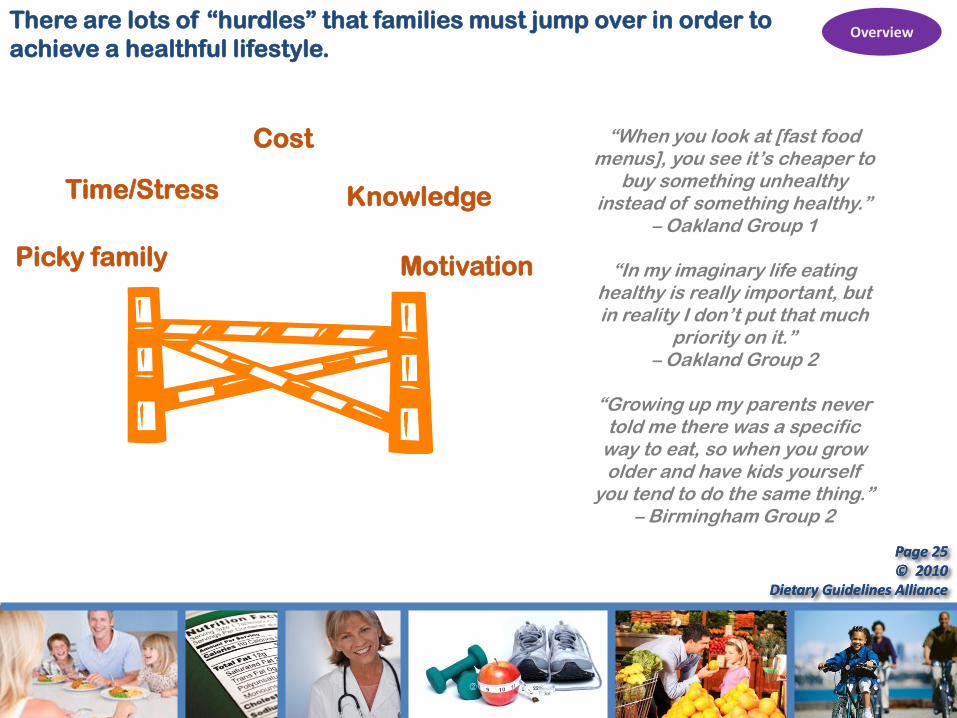
There are lots of “hurdles” that families must jump over in order to
achieve a healthful lifestyle.
“When you look at [fast food menus], you see it’s cheaper to
buy something unhealthy instead of something healthy.”
– Oakland Group 1
“In my imaginary life eating healthy is really important, but in reality I don’t put that much
priority on it.” – Oakland Group 2
“Growing up my parents never
told me there was a specific way to eat, so when you grow older and have kids yourself
you tend to do the same thing.” – Birmingham Group 2
Motivation Picky family
Knowledge Time/Stress
Cost
Overview

Page 26 © 2010
Dietary Guidelines Alliance
Page 26 © 2010
Dietary Guidelines Alliance
When asked to bring in pictures of “food that makes their family’s life
better,” participants’ collages contained a wide variety of foods and
beverages, representing a broad spectrum of nutritional content.
What was included? Fruits and Vegetables Desserts , like ice cream and cake Beverages like juice and soda Snacks like pretzels and popcorn Side dishes, like macaroni and cheese Fast food items
Overview
“Well sometimes it just makes my life better to go through the drive-through and get the kids those cheeseburgers and the chicken nuggets.” Baltimore Group 1 “In most cultures food is vested in what people do, sitting together and creating a meal together, so cooking a meal is a way of being together with my daughters.” Oakland Group 1
Page 27 © 2010
Dietary Guidelines Alliance
Page 27 © 2010
Dietary Guidelines Alliance
Parents are reluctant to be the bad guys with their children.
Across all discussions, it is clear that family dynamics play a large role in the decisions
parents make about food and physical activity. Leading by example and being a role
model are important goals for parents, but they have a hard time doing this and
enforcing rules around food and beverages.
While parents want their children to eat healthfully, they also don’t want to be the bad
guy making them do so.
They don’t want to be like their parents. In some cases there seems to be a
backlash against the idea of making the child “clean their plate” or eat things they
don’t want to.
They don’t want to listen to their children complain. Children are picky, they refuse
to try new things and parents are often making several meals based on what the
child will/will not eat. In addition, choices made at the grocery store were often
based on what the kids would eat.
They don’t see their children enough. Parents are working long hours, sharing
custody with their child’s other parent or raising a child on their own. When they do
see their children, they want their children to be happy. Children today have hectic
schedules, so food/beverage preparation and meal times are often rushed.
Overview

Page 28 © 2010
Dietary Guidelines Alliance
Page 28 © 2010
Dietary Guidelines Alliance
Planning ahead can help parents stay on track.
One important point that was observed in both the ethnographies and mentioned in the
focus groups is the notion of planning ahead as a catalyst to overall balance, because
planning leads to an increased awareness of what is being consumed.
Planning Ahead
Paying Attention
Overall Balance
Successful families are also
flexible, realizing that a busy
day may come up unexpectedly.
“My daughter helps me with the menu, and if it gets crazy I will skip to one of the easier meals.” Birmingham Group 1 “I’d like to make a better plan [for] the meals and exercise routine in the week and shop accordingly.” Baltimore Group 1
Overview
Page 29 © 2010
Dietary Guidelines Alliance
Page 29 © 2010
Dietary Guidelines Alliance
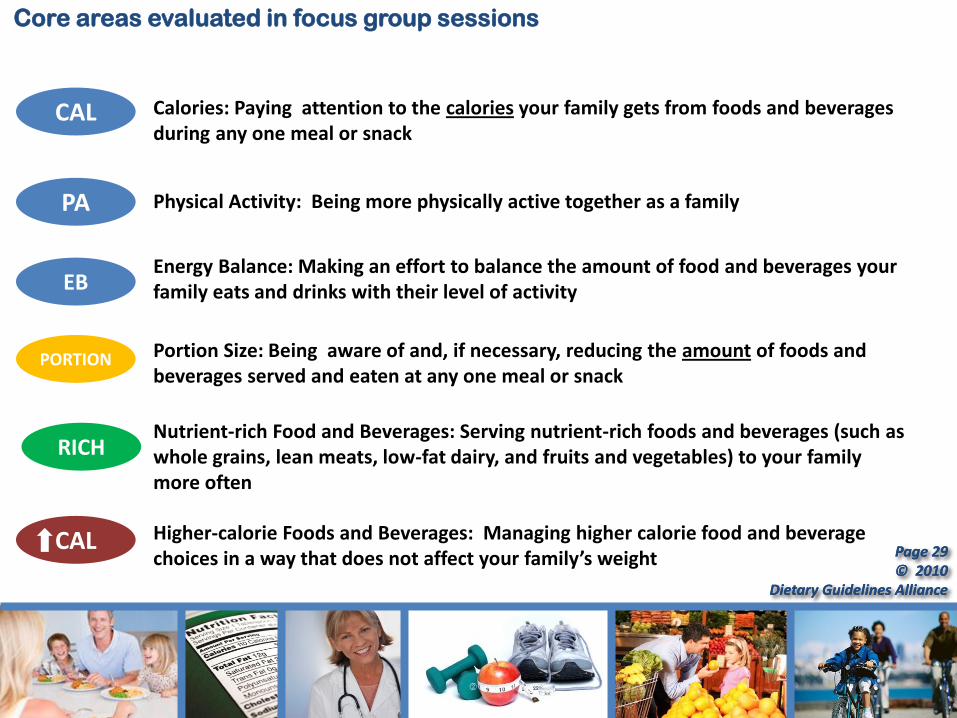
Core areas evaluated in focus group sessions
CAL Calories: Paying attention to the calories your family gets from foods and beverages during any one meal or snack
Physical Activity: Being more physically active together as a family
Energy Balance: Making an effort to balance the amount of food and beverages your family eats and drinks with their level of activity
Portion Size: Being aware of and, if necessary, reducing the amount of foods and beverages served and eaten at any one meal or snack
Nutrient-rich Food and Beverages: Serving nutrient-rich foods and beverages (such as whole grains, lean meats, low-fat dairy, and fruits and vegetables) to your family more often
Higher-calorie Foods and Beverages: Managing higher calorie food and beverage choices in a way that does not affect your family’s weight
PA
EB
PORTION
RICH
CAL

Page 30 © 2010
Dietary Guidelines Alliance
Page 30 © 2010
Dietary Guidelines Alliance
Calorie knowledge is weak.
When attempting to jump into a discussion about energy balance, it becomes apparent
that consumers lack a basic understanding of calories.
In contrast, some have a fairly good grasp of what they are, but don’t believe they are
important to track, with some being more focused on other components such as
carbohydrates or fats.
“I just don’t know what the calorie is and what it does to you.” Oakland Group 1
“It’s hard since you also need carbohydrates and proteins, it's hard to determine what you
exactly need.” Birmingham Group 1
CAL
Page 31 © 2010
Dietary Guidelines Alliance
Page 31 © 2010
Dietary Guidelines Alliance
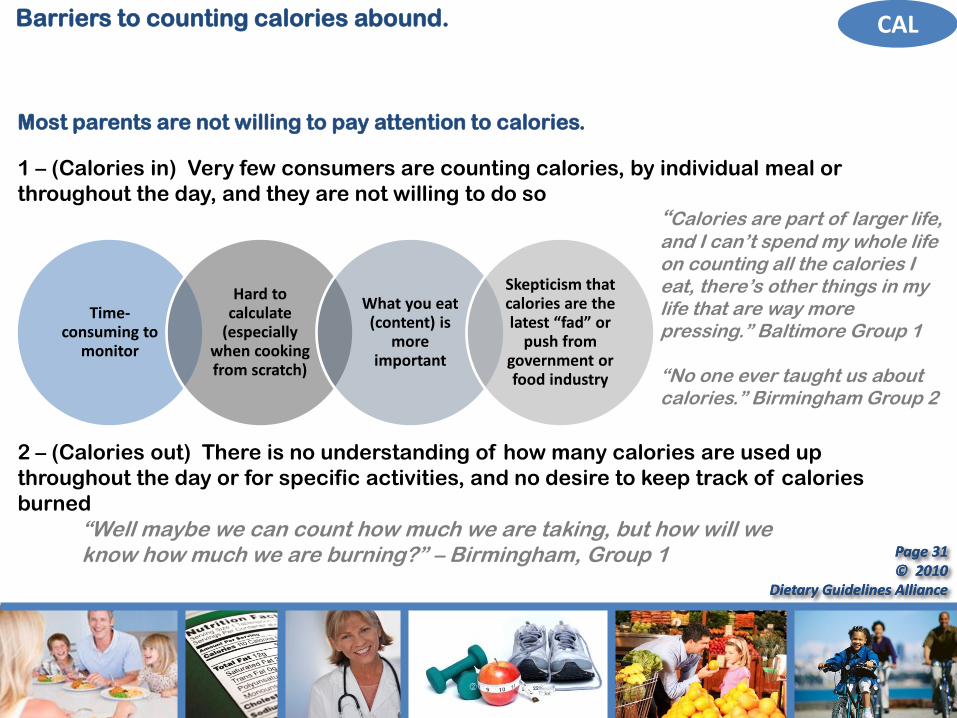
Time-consuming to
monitor
Hard to calculate
(especially when cooking from scratch)
What you eat (content) is
more important
Skepticism that calories are the latest “fad” or
push from government or food industry
Most parents are not willing to pay attention to calories.
1 – (Calories in) Very few consumers are counting calories, by individual meal or
throughout the day, and they are not willing to do so
2 – (Calories out) There is no understanding of how many calories are used up
throughout the day or for specific activities, and no desire to keep track of calories
burned
Barriers to counting calories abound.
“Calories are part of larger life, and I can’t spend my whole life on counting all the calories I eat, there’s other things in my life that are way more pressing.” Baltimore Group 1 “No one ever taught us about calories.” Birmingham Group 2
“Well maybe we can count how much we are taking, but how will we know how much we are burning?” – Birmingham, Group 1
CAL

Page 32 © 2010
Dietary Guidelines Alliance
Page 32 © 2010
Dietary Guidelines Alliance
Parents are not as physically active as they know they should be.
Most understand and acknowledge the benefits of being physically active; they just
can’t seem to fit it into their day.
Making physical activity a part of their routine is key.
Barriers Catalysts
“It keeps your weight down.” Birmingham Group 1 “It makes you feel better, you feel like you’ve done something for yourself.” Birmingham Group 2 “It helps your mood, releases serotonin.” Oakland Group 2 “I have friends that I go with so then I will have to go.” Baltimore Group 1 “When I was dating I could get myself to do it.” Oakland Group 1
“My kids prevent me from exercising, me and my wife both like to exercise but someone has to stay with the kids, I can’t exercise until the kids go to bed.” Baltimore Group 1 “When I come home from work, make dinner, clean the kitchen, I just don’t feel like exercising anymore.” Birmingham Group 1 “I get up at 4:30 in the morning, and get off just in time to get my son from school, so at that time I’m just sleepy and hungry, so I don’t have the energy to exercise.” Oakland Group 1
PA
Page 33 © 2010
Dietary Guidelines Alliance
Page 33 © 2010
Dietary Guidelines Alliance
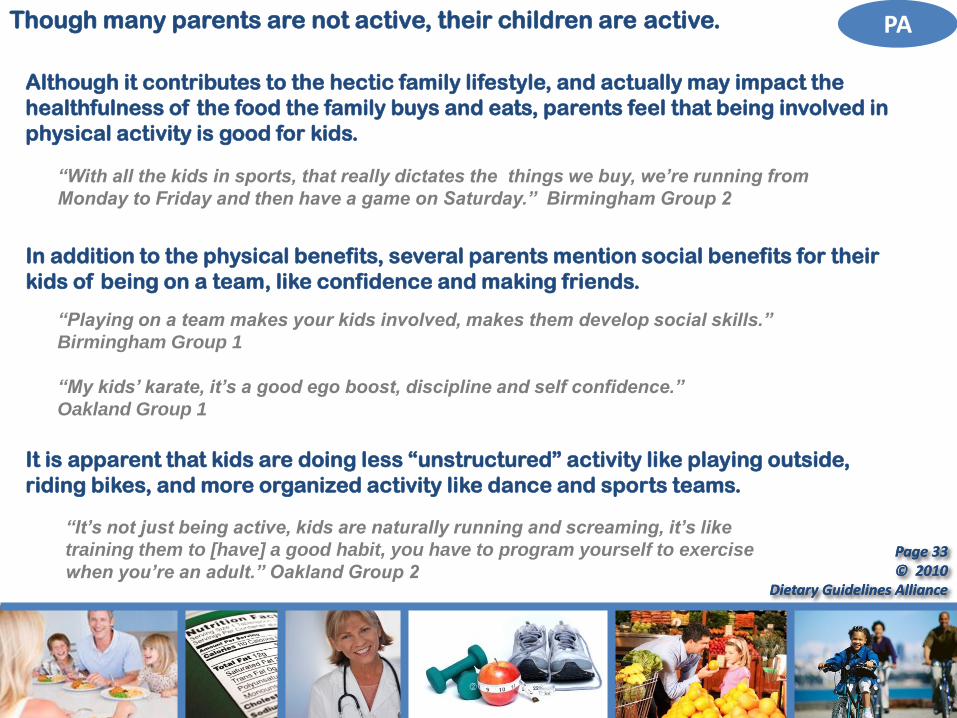
Though many parents are not active, their children are active.
Although it contributes to the hectic family lifestyle, and actually may impact the
healthfulness of the food the family buys and eats, parents feel that being involved in
physical activity is good for kids.
In addition to the physical benefits, several parents mention social benefits for their
kids of being on a team, like confidence and making friends.
It is apparent that kids are doing less “unstructured” activity like playing outside,
riding bikes, and more organized activity like dance and sports teams.
“Playing on a team makes your kids involved, makes them develop social skills.”
Birmingham Group 1
“My kids‟ karate, it‟s a good ego boost, discipline and self confidence.”
Oakland Group 1
“With all the kids in sports, that really dictates the things we buy, we‟re running from
Monday to Friday and then have a game on Saturday.” Birmingham Group 2
“It‟s not just being active, kids are naturally running and screaming, it‟s like
training them to [have] a good habit, you have to program yourself to exercise
when you‟re an adult.” Oakland Group 2
PA

Page 34 © 2010
Dietary Guidelines Alliance
Page 34 © 2010
Dietary Guidelines Alliance
Parents are open to making – and sometimes do make– trade-offs.
Although parents are not willing to count calories (and therefore not willing to truly
practice energy balance), they do understand the basic concept of calories in and out
and are willing to make some trade-offs related to calories to keep them in balance.
Some will have a smaller dinner if they eat a big lunch.
Others will make a lower-calorie choice at a fast-food restaurant if selecting
between two options.
Many relate positively to the idea of a budget or allowance of calories to “spend” in
a day, as long as the concept can be kept simple.
“In the last few years I haven’t been as physically active as I used to be, so now I
did start watching my diet and exercising because I gained some weight and had less energy at the end of the day. Though I’m going to be honest, I’m not
going to give up [fast food], not going to give up my beer, I just hope to find a balance to have a more
healthy life.” Baltimore Group 1
EB
Page 35 © 2010
Dietary Guidelines Alliance
Page 35 © 2010
Dietary Guidelines Alliance
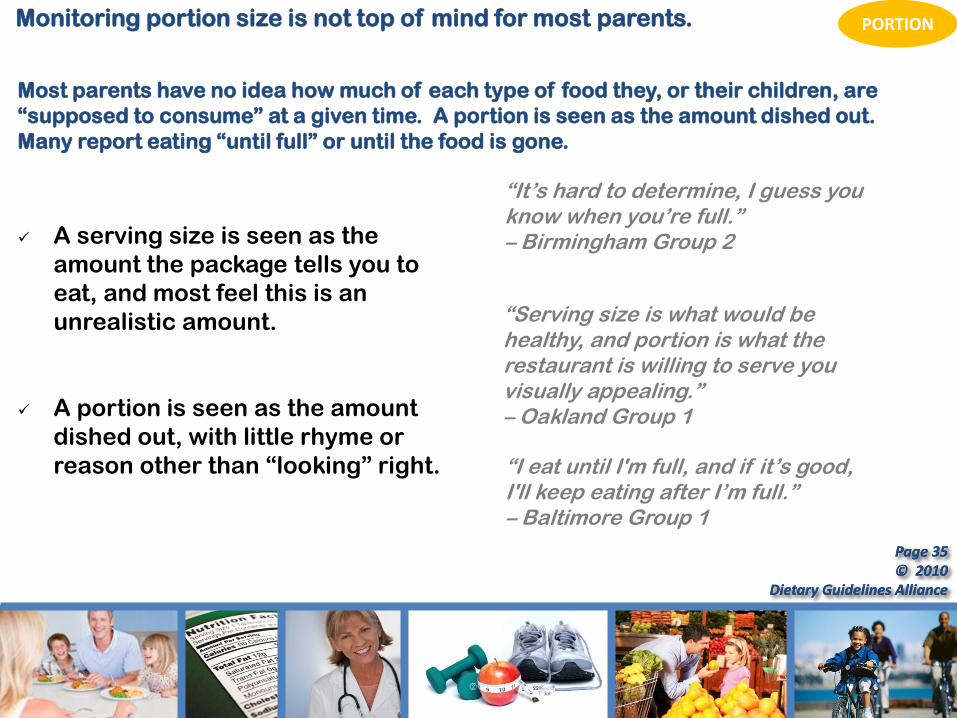
Monitoring portion size is not top of mind for most parents.
Most parents have no idea how much of each type of food they, or their children, are
“supposed to consume” at a given time. A portion is seen as the amount dished out.
Many report eating “until full” or until the food is gone.
A serving size is seen as the
amount the package tells you to
eat, and most feel this is an
unrealistic amount.
A portion is seen as the amount
dished out, with little rhyme or
reason other than “looking” right.
“It’s hard to determine, I guess you know when you’re full.” – Birmingham Group 2
“Serving size is what would be healthy, and portion is what the restaurant is willing to serve you visually appealing.” – Oakland Group 1
“I eat until I'm full, and if it’s good, I'll keep eating after I’m full.” – Baltimore Group 1
PORTION
Page 36 © 2010
Dietary Guidelines Alliance
Page 36 © 2010
Dietary Guidelines Alliance
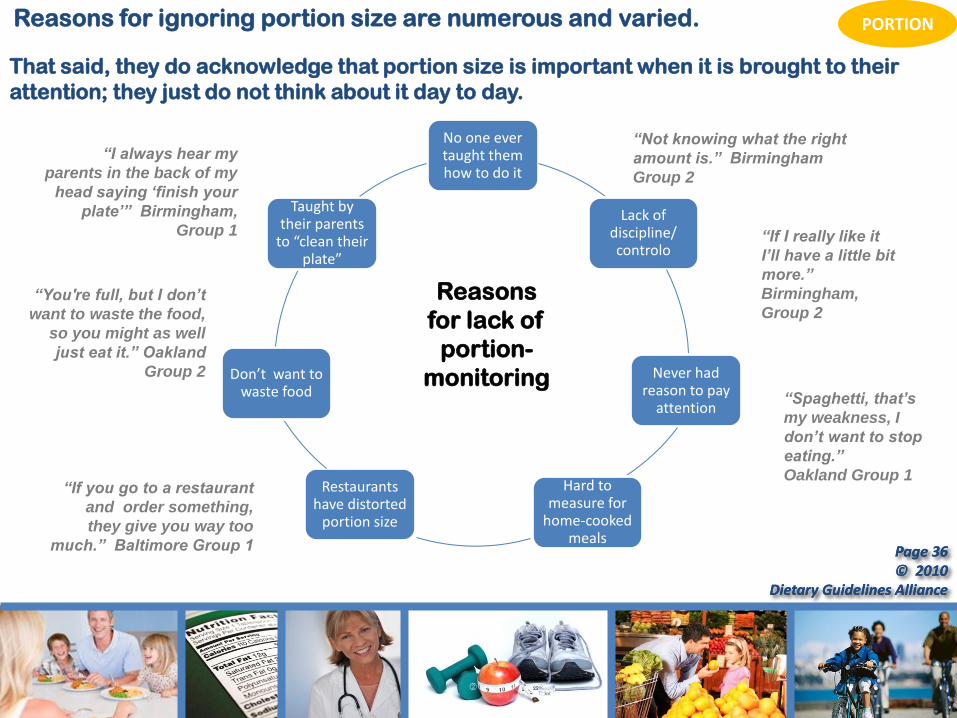
Reasons for ignoring portion size are numerous and varied.
That said, they do acknowledge that portion size is important when it is brought to their
attention; they just do not think about it day to day.
No one ever taught them how to do it
Lack of discipline/ controlo
Never had reason to pay
attention
Hard to measure for
home-cooked meals
Restaurants have distorted
portion size
Don’t want to waste food
Taught by their parents
to “clean their plate”
Reasons
for lack of
portion-
monitoring
“You're full, but I don‟t
want to waste the food,
so you might as well
just eat it.” Oakland
Group 2
“If you go to a restaurant
and order something,
they give you way too
much.” Baltimore Group 1
“If I really like it
I‟ll have a little bit
more.”
Birmingham,
Group 2
“Not knowing what the right
amount is.” Birmingham
Group 2
“Spaghetti, that‟s
my weakness, I
don‟t want to stop
eating.”
Oakland Group 1
“I always hear my
parents in the back of my
head saying „finish your
plate‟” Birmingham,
Group 1
PORTION

Page 37 © 2010
Dietary Guidelines Alliance
Page 37 © 2010
Dietary Guidelines Alliance
Tools and tricks for controlling portion size
There are a number of things that people are doing, or have heard about, for
controlling portion size. None of them involve paying attention to all that you consume
in a day or over the course of a few days; most are focused on one specific meal or
food/beverage.
[A portion] should be the size of your hand
Kids should only be given a small amount so they must ask for seconds
Eat the vegetables before the carbs
Drink a glass of water before eating
Look at the food label/measure
Eat until satisfied, not stuffed
PORTION
Page 38 © 2010
Dietary Guidelines Alliance
Page 38 © 2010
Dietary Guidelines Alliance
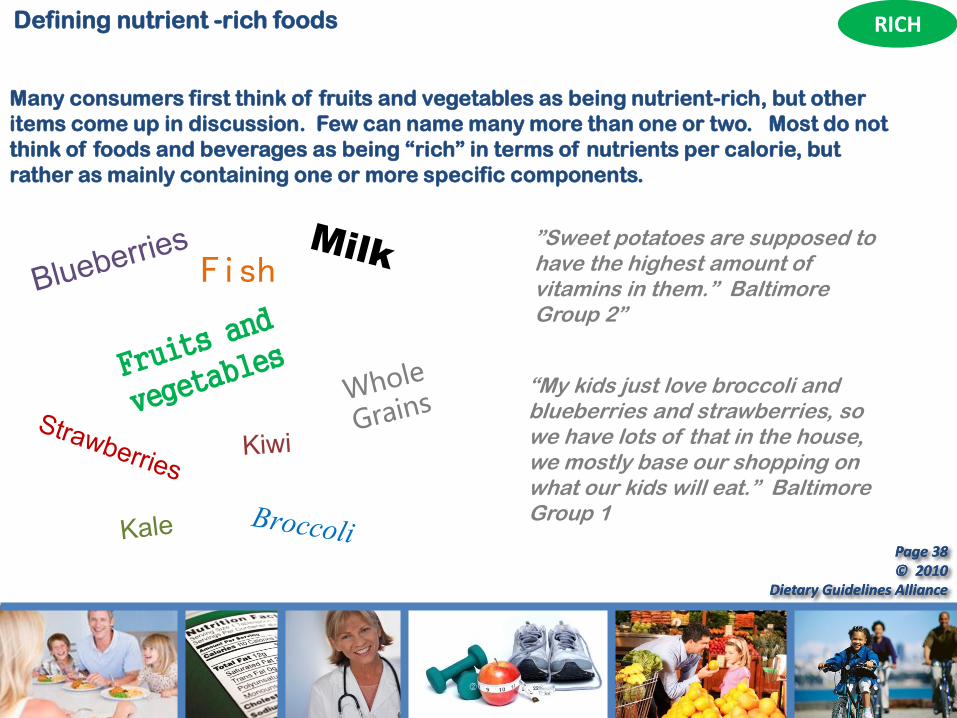
Defining nutrient -rich foods
Many consumers first think of fruits and vegetables as being nutrient-rich, but other
items come up in discussion. Few can name many more than one or two. Most do not
think of foods and beverages as being “rich” in terms of nutrients per calorie, but
rather as mainly containing one or more specific components.
Fish ”Sweet potatoes are supposed to have the highest amount of vitamins in them.” Baltimore Group 2”
“My kids just love broccoli and blueberries and strawberries, so we have lots of that in the house, we mostly base our shopping on what our kids will eat.” Baltimore Group 1
RICH
Page 39 © 2010
Dietary Guidelines Alliance
Page 39 © 2010
Dietary Guidelines Alliance
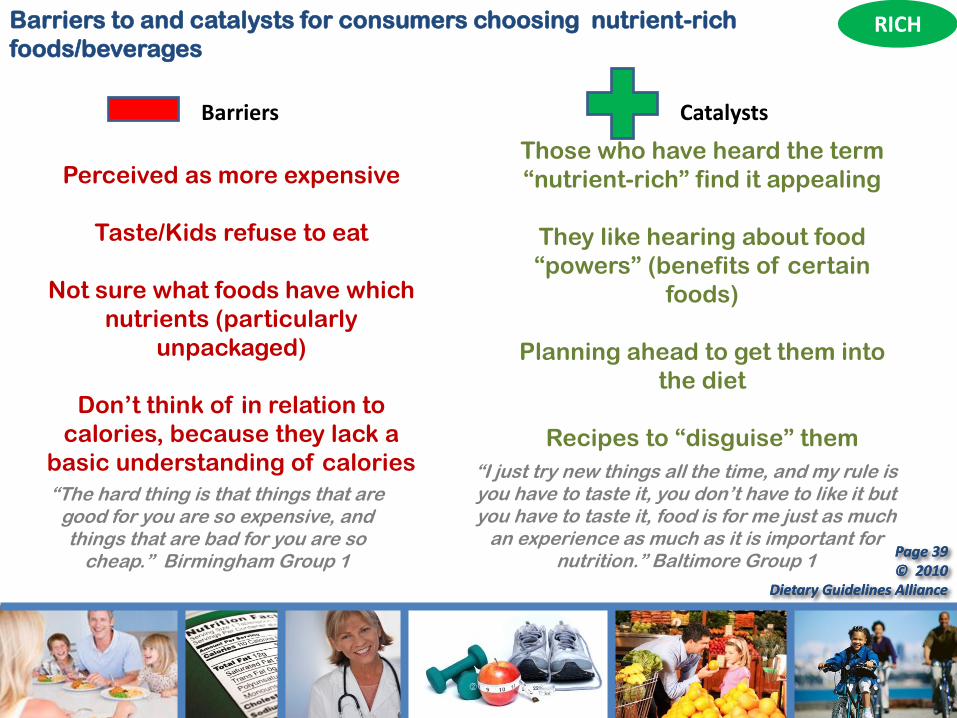
Barriers to and catalysts for consumers choosing nutrient-rich
foods/beverages
Perceived as more expensive
Taste/Kids refuse to eat
Not sure what foods have which
nutrients (particularly
unpackaged)
Don’t think of in relation to
calories, because they lack a
basic understanding of calories
Those who have heard the term
“nutrient-rich” find it appealing
They like hearing about food
“powers” (benefits of certain
foods)
Planning ahead to get them into
the diet
Recipes to “disguise” them
Barriers Catalysts
“The hard thing is that things that are good for you are so expensive, and things that are bad for you are so
cheap.” Birmingham Group 1
“I just try new things all the time, and my rule is you have to taste it, you don’t have to like it but you have to taste it, food is for me just as much
an experience as much as it is important for nutrition.” Baltimore Group 1
RICH
Page 40 © 2010
Dietary Guidelines Alliance
Page 40 © 2010
Dietary Guidelines Alliance
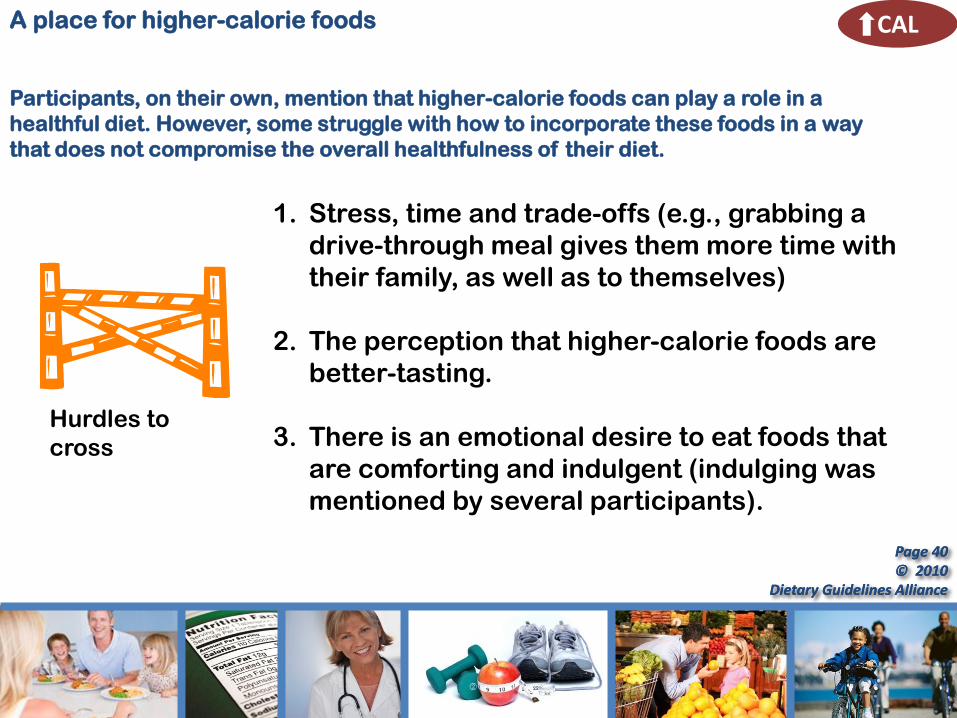
A place for higher-calorie foods
Participants, on their own, mention that higher-calorie foods can play a role in a
healthful diet. However, some struggle with how to incorporate these foods in a way
that does not compromise the overall healthfulness of their diet.
Hurdles to
cross
1. Stress, time and trade-offs (e.g., grabbing a
drive-through meal gives them more time with
their family, as well as to themselves)
2. The perception that higher-calorie foods are
better-tasting.
3. There is an emotional desire to eat foods that
are comforting and indulgent (indulging was
mentioned by several participants).
CAL

Page 41 © 2010
Dietary Guidelines Alliance
Page 41 © 2010
Dietary Guidelines Alliance
Successful incorporation of higher-calorie foods and beverages
“We want our kids to know what cake and [fast food] is, but we want them to understand what healthy food is, and that it sometimes is okay to have the treat for lunch, but that you have to balance it with the healthy stuff.” Baltimore Group 1 “I think you can eat anything if you balance it out.” Birmingham Group 2 “I think you might find that you aren’t obsessed with being deprived as you go through some education on portion control.” Oakland Group 2 “Especially if you have an active lifestyle, the foods will give you extra energy.” Birmingham Group 2
HOW DO THEY DO IT?
“MODERATION” is the key
to success, many use this
word
Planning ahead is also
critical
Deprivation doesn’t work –
and it also isn’t any fun
CAL

Page 42 © 2010
Dietary Guidelines Alliance
Page 42 © 2010
Dietary Guidelines Alliance
PHASE 2: KEY TAKEAWAYS
Parents – particularly mid-economic downturn – have a lot on their
minds; food and nutrition often take a back seat to more pressing
concerns.
Parents do not, nor are they willing to, count calories, and many
lack a basic understanding of or appreciation for the role of
calories in weight management.
Parents understand the benefits of physical activity. In fact, most
have been active at some point in their lives and have experienced
the benefits firsthand. The problem is staying committed.

Page 43 © 2010
Dietary Guidelines Alliance
Page 43 © 2010
Dietary Guidelines Alliance
If achieving energy balance is the goal, getting parents to believe
that calories are important is a crucial step that cannot be skipped.
• They need to understand what calories are (to a basic extent).
Calories are not “good” or “bad,” but paying attention to them
can positively impact weight.
• It has to become easy to pay attention to calories. Still, they
need to be presented with food and beverage choices in the
context of calories. Applying calorie information to the
total diet will remain a challenge for many consumers.
PHASE 2: KEY TAKEAWAYS Continued

Page 44 © 2010
Dietary Guidelines Alliance
Page 44 © 2010
Dietary Guidelines Alliance
Portion size is not top of mind for parents. While some don’t
believe it matters, most are just not focused on it.
Although they can name at least one example, most parents need
more practical education on which foods are nutrient-rich and
how to get more into their diets.
Most believe that higher-calorie foods can be incorporated
successfully in moderation and when planned in context – but
many struggle to maintain the healthfulness of their overall diet.
PHASE 2: KEY TAKEAWAYS Continued

Page 45 © 2010
Dietary Guidelines Alliance
Page 45 © 2010
Dietary Guidelines Alliance
PHASE 2: KEY TAKEAWAYS Message Development
Although Phase 2 was not quantitative, we can gather some important
feedback from the focus groups regarding more successful messages.
Messages about taking small steps resonated with consumers as they
seem more “doable”. However, several mention struggling to take and
maintain even the first steps toward a healthier lifestyle.
“[Small steps] just shows that you don’t have to make one big improvement.” – Birmingham Group 2
Messages that draw analogies to constructs that they are very familiar
with, such as budgeting for calories, or engines and shut-off valves, were
very appealing.
“Occasional splurge, don’t we all do that with our financial budget as well?” – Oakland Group 1
Page 46 © 2010
Dietary Guidelines Alliance
Page 46 © 2010
Dietary Guidelines Alliance
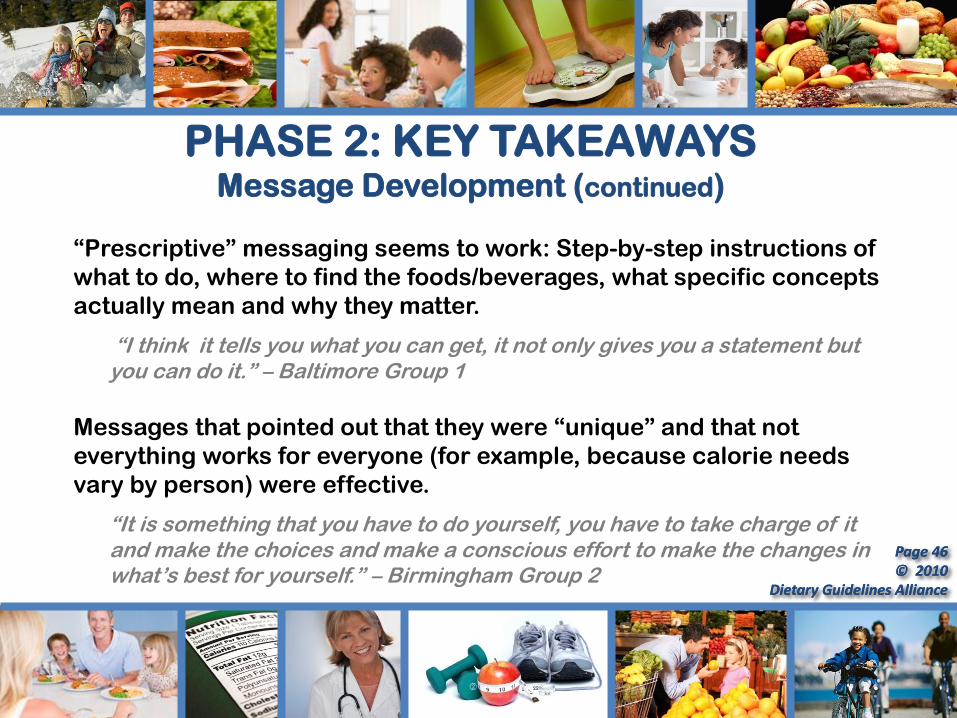
PHASE 2: KEY TAKEAWAYS Message Development (continued)
“Prescriptive” messaging seems to work: Step-by-step instructions of
what to do, where to find the foods/beverages, what specific concepts
actually mean and why they matter.
“I think it tells you what you can get, it not only gives you a statement but you can do it.” – Baltimore Group 1
Messages that pointed out that they were “unique” and that not
everything works for everyone (for example, because calorie needs
vary by person) were effective.
“It is something that you have to do yourself, you have to take charge of it and make the choices and make a conscious effort to make the changes in what’s best for yourself.” – Birmingham Group 2
Page 47 © 2010
Dietary Guidelines Alliance
Page 47 © 2010
Dietary Guidelines Alliance
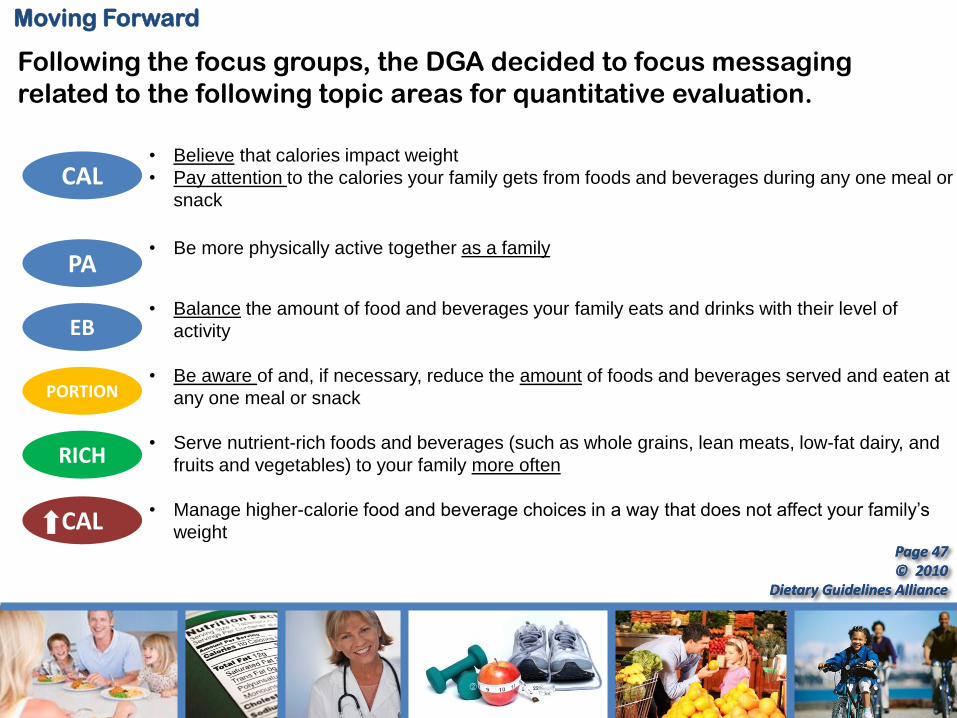
Moving Forward
Following the focus groups, the DGA decided to focus messaging
related to the following topic areas for quantitative evaluation.
• Believe that calories impact weight
• Pay attention to the calories your family gets from foods and beverages during any one meal or
snack
• Be more physically active together as a family
• Balance the amount of food and beverages your family eats and drinks with their level of
activity
• Be aware of and, if necessary, reduce the amount of foods and beverages served and eaten at
any one meal or snack
• Serve nutrient-rich foods and beverages (such as whole grains, lean meats, low-fat dairy, and
fruits and vegetables) to your family more often
• Manage higher-calorie food and beverage choices in a way that does not affect your family’s
weight
CAL
PA
EB
PORTION
RICH
CAL

Page 48 © 2010
Dietary Guidelines Alliance
Page 48 © 2010
Dietary Guidelines Alliance
Detailed Findings
Phase 3: Web Survey
Quantitative study among parents of children ages
2-17 years to validate qualitative insights and quantify
receptivity to specific messages among parents
(in general) and key subpopulations.

Page 49 © 2010
Dietary Guidelines Alliance
Page 49 © 2010
Dietary Guidelines Alliance
PHASE 3: AREAS OF INQUIRY
• Diet: Perceptions and Behaviors
• Physical Activity: Perceptions and Behaviors
• Message Evaluation
– Calories, Physical Activity and Energy Balance
– Portion Size
– Nutrient-Rich
– Higher-Calorie Foods and Beverages
• Information Sources
• Demographic Profile

Page 50 © 2010
Dietary Guidelines Alliance
Page 50 © 2010
Dietary Guidelines Alliance
Diet:
Perceptions and Behaviors
Page 51 © 2010
Dietary Guidelines Alliance
Page 51 © 2010
Dietary Guidelines Alliance
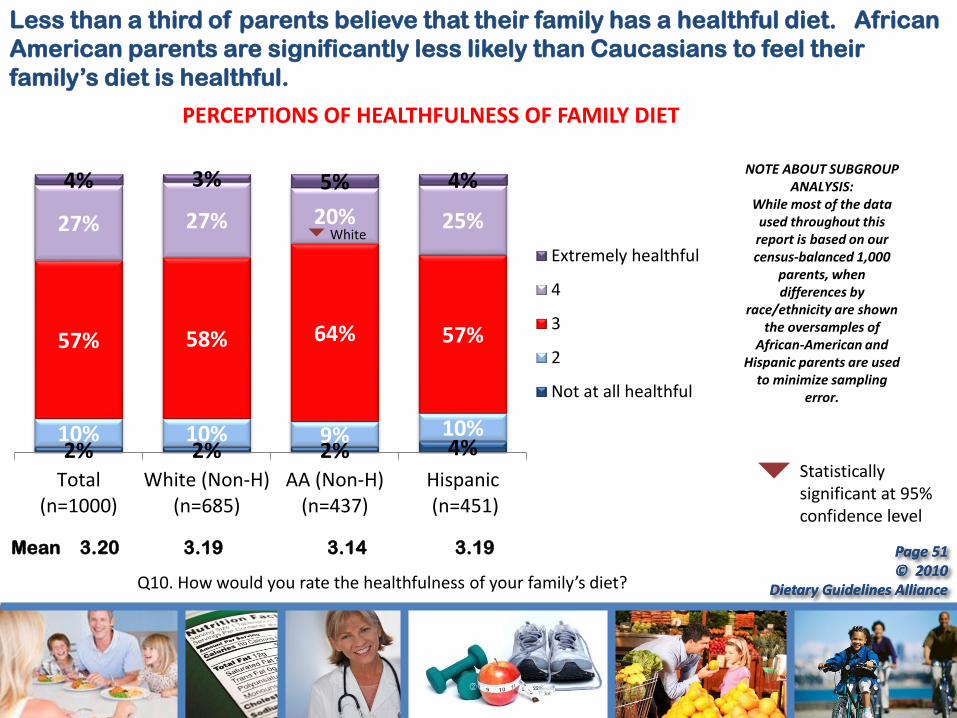
Less than a third of parents believe that their family has a healthful diet. African
American parents are significantly less likely than Caucasians to feel their
family’s diet is healthful.
2% 2% 2% 4% 10% 10% 9% 10%
57% 58% 64% 57%
27% 27% 20% 25%
4% 3% 5% 4%
Total(n=1000)
White (Non-H)(n=685)
AA (Non-H)(n=437)
Hispanic (n=451)
Extremely healthful
4
3
2
Not at all healthful
White
Mean 3.20 3.19 3.14 3.19
Q10. How would you rate the healthfulness of your family’s diet?
PERCEPTIONS OF HEALTHFULNESS OF FAMILY DIET
Statistically significant at 95% confidence level
NOTE ABOUT SUBGROUP ANALYSIS:
While most of the data used throughout this report is based on our census-balanced 1,000
parents, when differences by
race/ethnicity are shown the oversamples of
African-American and Hispanic parents are used
to minimize sampling error.

Page 52 © 2010
Dietary Guidelines Alliance
Page 52 © 2010
Dietary Guidelines Alliance
More likely to view diet as healthful:*
Gender No differences
Race/ Ethnicity
No differences
Age No differences
Educa-tion
Some college+ over high school or less
Income $100K+ over less than $50K
Region Northeast, South, West over Midwest
Parents’ weight
Families with lower parental BMI over higher
As has been shown in other studies, parents with a higher socioeconomic status
perceive their diets to be more healthful, as do those in households with more
healthful BMIs.
1% 2% 3% 8% 10% 11%
45% 57%
63%
37% 27%
21% 8% 3% 1%
No BMIoverweight+
(n=201)
1 BMIoverweight+
(n=461)
2 BMIoverweight+
(n=338)
Extremelyhealthful
4
3
2
Not at allhealthful
PERCEPTIONS OF HEALTHFULNESS OF FAMILY DIET BY PARENTS’ BMI STATUS
Q10. How would you rate the healthfulness of your family’s diet?
*Subgroup analysis refers to statistically significant differences at the 95% confidence level

Page 53 © 2010
Dietary Guidelines Alliance
Page 53 © 2010
Dietary Guidelines Alliance
Q11-15. In general, how important, if at all, do you think each of the following things could be to the overall healthfulness of your family’s diet?
5 point scale: 1=Not at all; 5=Extremely Mean
Top 2 box (4 or 5)
Serving foods and beverages that are nutrient-rich (such as whole grains, lean meats, low-fat dairy and fruits and vegetables) more often.
4.32 82%
Making an effort to balance the amount of food and beverages your family eats and drinks with their level of activity.
4.06 74%
Paying attention to the amount of foods and beverages served and eaten during any one meal or snack.
3.93 69%
Managing higher calorie food and beverage choices in a way that does not affect your family’s weight.
3.93 67%
Paying attention to the total calories your family gets from foods and beverages during any one meal or snack.
3.55 52%
Parents’ views of the importance of the five core areas covered in the survey
show a lack of understanding of the importance of calories and a near universal
understanding of the importance of serving nutrient-rich foods.
IMPORTANCE OF CORE AREAS (“BELIEF STATEMENTS”) (n=1000)

Page 54 © 2010
Dietary Guidelines Alliance
Page 54 © 2010
Dietary Guidelines Alliance
Nutrient Rich
Energy Balance Portion Higher Calorie
Pay attention to calories
Gender Female Female
Race/ Ethnicity
Caucasian (over African-American)
African-American
(over Caucasian)
Age 35+ 35+ 35+ 55+
Education College grad + Some college + Some college +
Income Higher income Higher income
BMI 2 overweight+
parents 2 overweight+
parents
Other Dual Household 1-2 kids
Have teenagers
Looking at the importance of each core area by subgroup*, households
where both parents are overweight or obese have a greater appreciation for
calories – both the importance of paying attention to them, as well as the
need to manage higher-calorie foods.
Q11-15. In general, how important, if at all, do you think each of the following things could be to the overall healthfulness of your family’s diet?
*Subgroup analysis refers to statistically significant differences at the 95% confidence level

Page 55 © 2010
Dietary Guidelines Alliance
Page 55 © 2010
Dietary Guidelines Alliance
Paying attention to total calories in any one meal or snack seems a daunting task
for most parents, while incorporating nutrient-rich foods and portion control are
seen to be easier things to do on a regular basis.
Q16. Please rank the following things in terms of how easy they are (or would be) for your family to do on a regular basis. Please rank these from 1 to 5, where 1 is the easiest.
Ranked #1 to 5 where 1 is the easiest: Ranked #1
Ranked #1 or 2
Serving foods and beverages that are nutrient-rich (such as whole grains, lean meats, low-fat dairy and fruits and vegetables) more often.
40% 62%
Paying attention to the amount of foods and beverages served and eaten during any one meal or snack.
29% 54%
Making an effort to balance the amount of food and beverages your family eats and drinks with their level of activity.
13% 37%
Managing higher calorie food and beverage choices in a way that does not affect your family’s weight.
9% 25%
Paying attention to the total calories your family gets from foods and beverages during any one meal or snack.
9% 23%
EASE OF APPLYING CORE AREAS (n=1000)
Page 56 © 2010
Dietary Guidelines Alliance
Page 56 © 2010
Dietary Guidelines Alliance
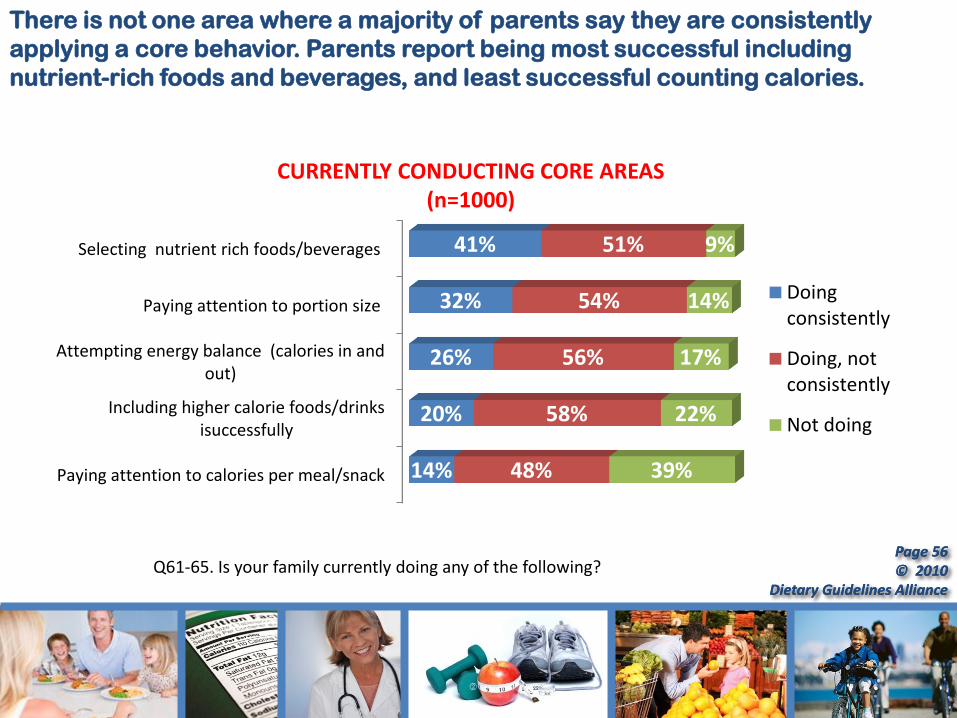
Selecting nutrient rich foods/beverages
Paying attention to portion size
Attempting energy balance (calories in andout)
Including higher calorie foods/drinksisuccessfully
Paying attention to calories per meal/snack
41%
32%
26%
20%
14%
51%
54%
56%
58%
48%
9%
14%
17%
22%
39%
Doingconsistently
Doing, notconsistently
Not doing
There is not one area where a majority of parents say they are consistently
applying a core behavior. Parents report being most successful including
nutrient-rich foods and beverages, and least successful counting calories.
Q61-65. Is your family currently doing any of the following?
CURRENTLY CONDUCTING CORE AREAS (n=1000)

Page 57 © 2010
Dietary Guidelines Alliance
Page 57 © 2010
Dietary Guidelines Alliance
There are some interesting differences by subgroup* when it comes to doing
each of these activities.
Q61-65. Is your family currently doing any of the following?
(n=1000) More likely to be doing each consistently
Selecting nutrient-rich foods/ beverages
White (42%) compared to Black (30%) and Hispanic (35%) Grad school (61%) compared to some college (47%) Some college compared to high school or less (30%) Higher income groups (42%, 44% and 50%) compared to lowest income group (32%) Dual parents (43%) compared to single (35%) No overweight+ parent*(54%) compared to 1 (39%) or 2 (35%) No overweight+ child (47%) compared to overweight+ child (33%) Healthy diet (72%) compared to unhealthy (10%)
Paying attention to portion size
No overweight+ parent (48%) vs. 1 overweight+(31%) and 2 (28%) Consider family diet healthily (53%) compared to not healthy (11%) Younger parents 18-24 (55%) compared to all older groups (25%-35%)
*Subgroup analysis refers to statistically significant differences at the 95% confidence level ** Three categories were created for subgroup analysis based on a calculation of parents’ BMI. These are “No overweight parent” in household, “One overweight parent in household”, and “two overweight parents in household”
Page 58 © 2010
Dietary Guidelines Alliance
Page 58 © 2010
Dietary Guidelines Alliance
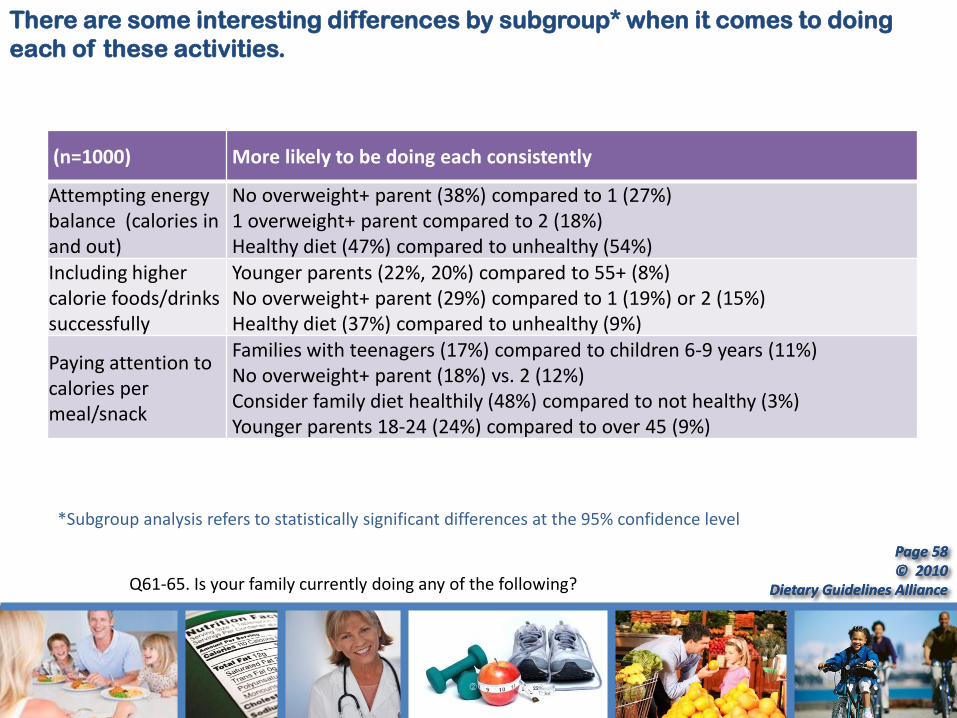
There are some interesting differences by subgroup* when it comes to doing
each of these activities.
Q61-65. Is your family currently doing any of the following?
(n=1000) More likely to be doing each consistently
Attempting energy balance (calories in and out)
No overweight+ parent (38%) compared to 1 (27%) 1 overweight+ parent compared to 2 (18%) Healthy diet (47%) compared to unhealthy (54%)
Including higher calorie foods/drinks successfully
Younger parents (22%, 20%) compared to 55+ (8%) No overweight+ parent (29%) compared to 1 (19%) or 2 (15%) Healthy diet (37%) compared to unhealthy (9%)
Paying attention to calories per meal/snack
Families with teenagers (17%) compared to children 6-9 years (11%) No overweight+ parent (18%) vs. 2 (12%) Consider family diet healthily (48%) compared to not healthy (3%) Younger parents 18-24 (24%) compared to over 45 (9%)
*Subgroup analysis refers to statistically significant differences at the 95% confidence level
Page 59 © 2010
Dietary Guidelines Alliance
Page 59 © 2010
Dietary Guidelines Alliance
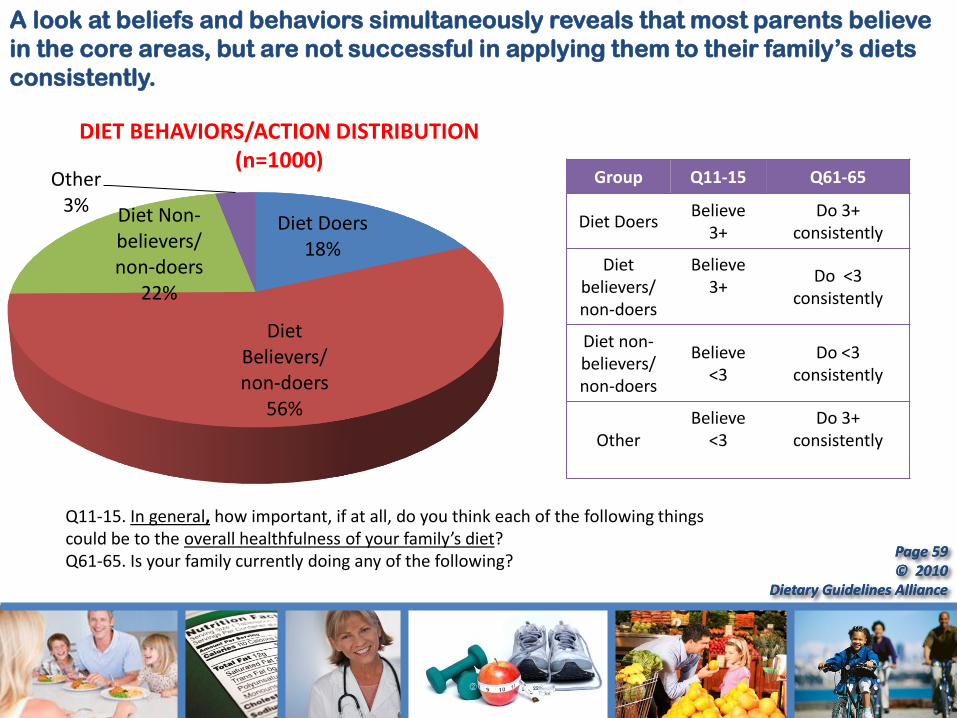
A look at beliefs and behaviors simultaneously reveals that most parents believe
in the core areas, but are not successful in applying them to their family’s diets
consistently.
Diet Doers 18%
Diet Believers/non-doers
56%
Diet Non-believers/non-doers
22%
Other 3%
Group Q11-15 Q61-65
Diet Doers Believe
3+ Do 3+
consistently
Diet believers/non-doers
Believe 3+
Do <3 consistently
Diet non- believers/non-doers
Believe <3
Do <3 consistently
Other Believe
<3
Do 3+ consistently
Q11-15. In general, how important, if at all, do you think each of the following things could be to the overall healthfulness of your family’s diet? Q61-65. Is your family currently doing any of the following?
DIET BEHAVIORS/ACTION DISTRIBUTION (n=1000)
Page 60 © 2010
Dietary Guidelines Alliance
Page 60 © 2010
Dietary Guidelines Alliance
Physical Activity: Perceptions and Behaviors
Page 61 © 2010
Dietary Guidelines Alliance
Page 61 © 2010
Dietary Guidelines Alliance
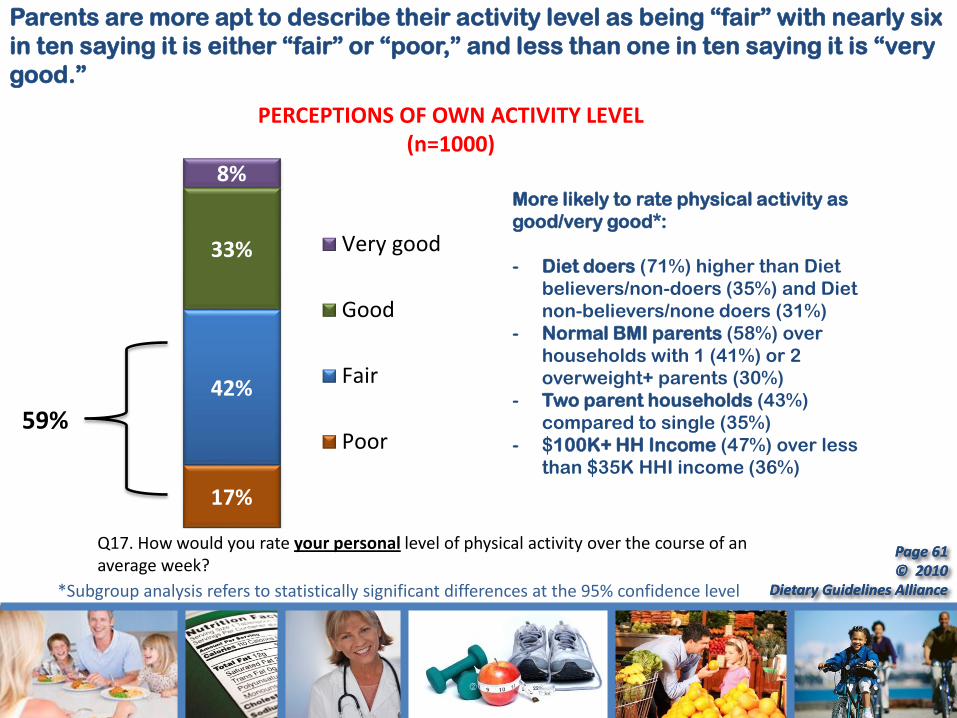
17%
42%
33%
8%
Very good
Good
Fair
Poor
Q17. How would you rate your personal level of physical activity over the course of an average week?
More likely to rate physical activity as
good/very good*:
- Diet doers (71%) higher than Diet
believers/non-doers (35%) and Diet
non-believers/none doers (31%)
- Normal BMI parents (58%) over
households with 1 (41%) or 2
overweight+ parents (30%)
- Two parent households (43%)
compared to single (35%)
- $100K+ HH Income (47%) over less
than $35K HHI income (36%)
59%
Parents are more apt to describe their activity level as being “fair” with nearly six
in ten saying it is either “fair” or “poor,” and less than one in ten saying it is “very
good.”
PERCEPTIONS OF OWN ACTIVITY LEVEL (n=1000)
*Subgroup analysis refers to statistically significant differences at the 95% confidence level
Page 62 © 2010
Dietary Guidelines Alliance
Page 62 © 2010
Dietary Guidelines Alliance
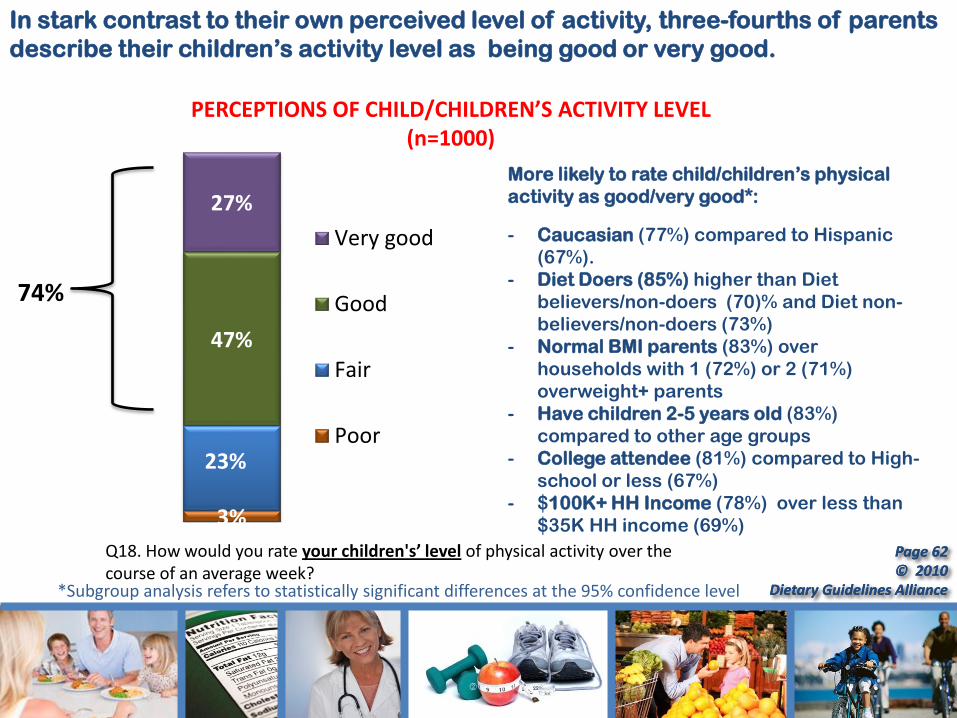
3%
23%
47%
27%
Very good
Good
Fair
Poor
Q18. How would you rate your children's’ level of physical activity over the course of an average week?
More likely to rate child/children’s physical
activity as good/very good*:
- Caucasian (77%) compared to Hispanic
(67%).
- Diet Doers (85%) higher than Diet
believers/non-doers (70)% and Diet non-
believers/non-doers (73%)
- Normal BMI parents (83%) over
households with 1 (72%) or 2 (71%)
overweight+ parents
- Have children 2-5 years old (83%)
compared to other age groups
- College attendee (81%) compared to High-
school or less (67%)
- $100K+ HH Income (78%) over less than
$35K HH income (69%)
74%
In stark contrast to their own perceived level of activity, three-fourths of parents
describe their children’s activity level as being good or very good.
PERCEPTIONS OF CHILD/CHILDREN’S ACTIVITY LEVEL (n=1000)
*Subgroup analysis refers to statistically significant differences at the 95% confidence level
Page 63 © 2010
Dietary Guidelines Alliance
Page 63 © 2010
Dietary Guidelines Alliance
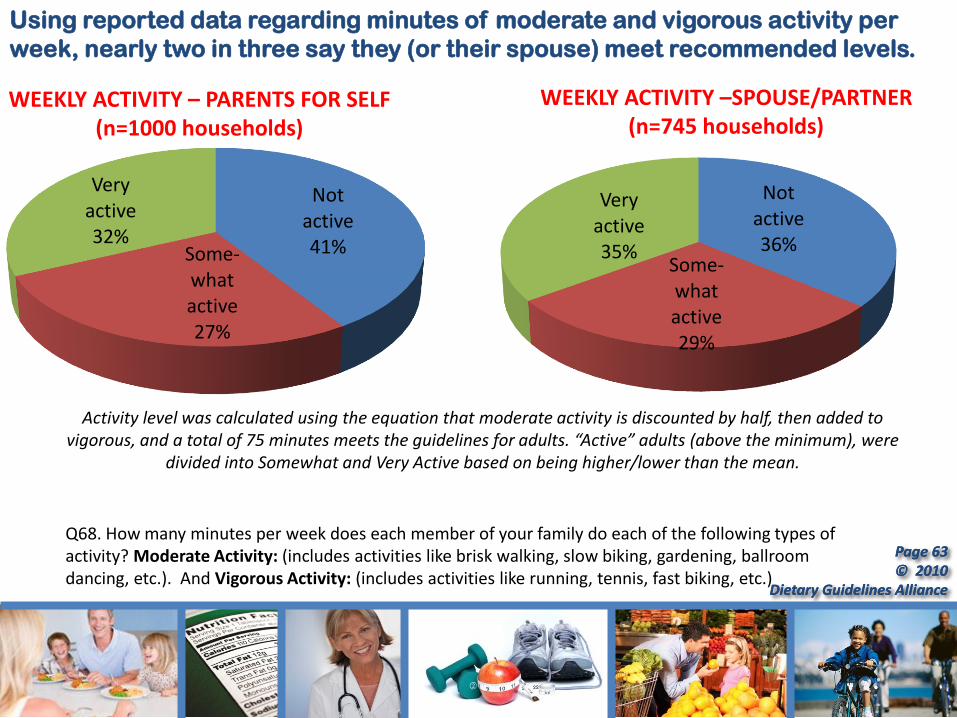
Using reported data regarding minutes of moderate and vigorous activity per
week, nearly two in three say they (or their spouse) meet recommended levels.
Q68. How many minutes per week does each member of your family do each of the following types of activity? Moderate Activity: (includes activities like brisk walking, slow biking, gardening, ballroom dancing, etc.). And Vigorous Activity: (includes activities like running, tennis, fast biking, etc.)
WEEKLY ACTIVITY – PARENTS FOR SELF (n=1000 households)
Not active 41% Some-
what active 27%
Very active 32%
Activity level was calculated using the equation that moderate activity is discounted by half, then added to vigorous, and a total of 75 minutes meets the guidelines for adults. “Active” adults (above the minimum), were
divided into Somewhat and Very Active based on being higher/lower than the mean.
Not active 36%
Some-what active 29%
Very active 35%
WEEKLY ACTIVITY –SPOUSE/PARTNER (n=745 households)
Page 64 © 2010
Dietary Guidelines Alliance
Page 64 © 2010
Dietary Guidelines Alliance
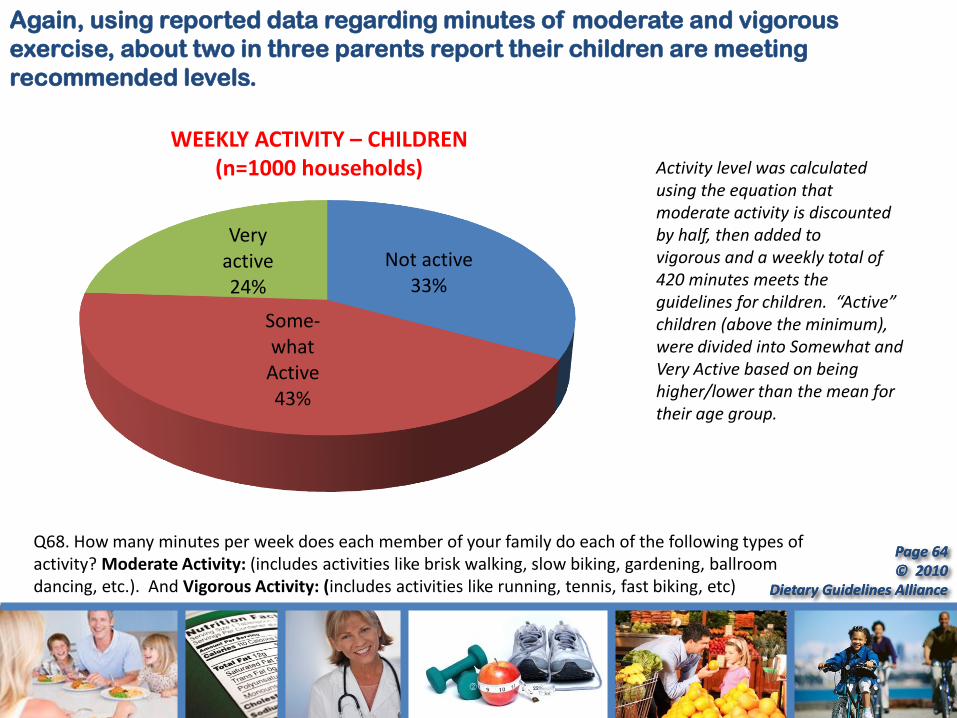
Again, using reported data regarding minutes of moderate and vigorous
exercise, about two in three parents report their children are meeting
recommended levels.
Q68. How many minutes per week does each member of your family do each of the following types of activity? Moderate Activity: (includes activities like brisk walking, slow biking, gardening, ballroom dancing, etc.). And Vigorous Activity: (includes activities like running, tennis, fast biking, etc)
WEEKLY ACTIVITY – CHILDREN (n=1000 households)
Not active 33%
Some-what Active 43%
Very active 24%
Activity level was calculated using the equation that moderate activity is discounted by half, then added to vigorous and a weekly total of 420 minutes meets the guidelines for children. “Active” children (above the minimum), were divided into Somewhat and Very Active based on being higher/lower than the mean for their age group.
Page 65 © 2010
Dietary Guidelines Alliance
Page 65 © 2010
Dietary Guidelines Alliance
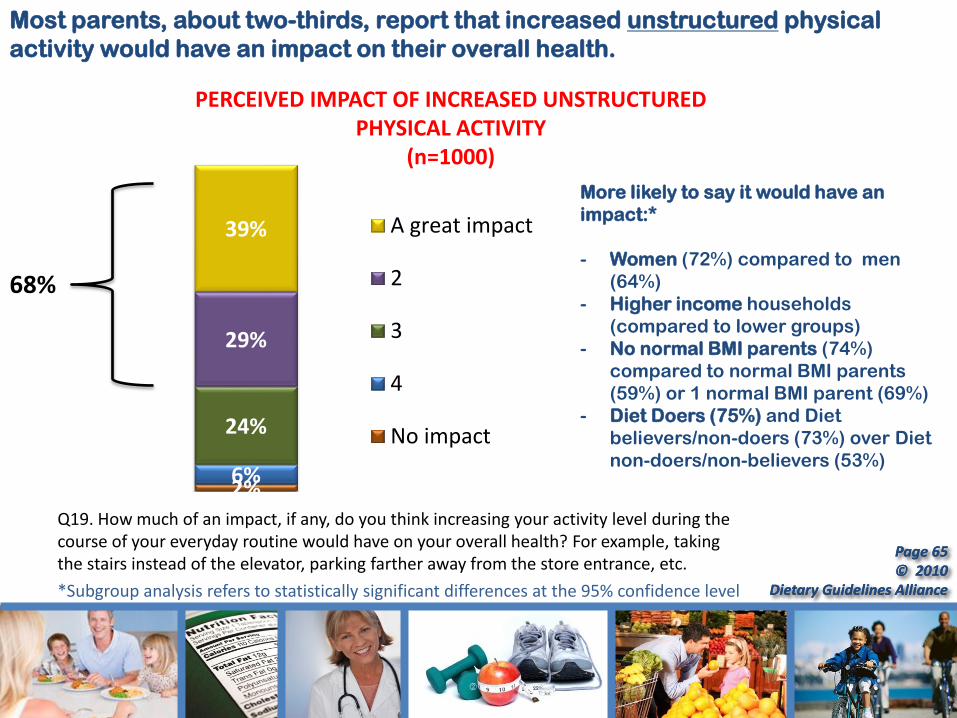
2% 6%
24%
29%
39% A great impact
2
3
4
No impact
Q19. How much of an impact, if any, do you think increasing your activity level during the course of your everyday routine would have on your overall health? For example, taking the stairs instead of the elevator, parking farther away from the store entrance, etc.
More likely to say it would have an
impact:*
- Women (72%) compared to men
(64%)
- Higher income households
(compared to lower groups)
- No normal BMI parents (74%)
compared to normal BMI parents
(59%) or 1 normal BMI parent (69%)
- Diet Doers (75%) and Diet
believers/non-doers (73%) over Diet
non-doers/non-believers (53%)
Most parents, about two-thirds, report that increased unstructured physical
activity would have an impact on their overall health.
68%
PERCEIVED IMPACT OF INCREASED UNSTRUCTURED PHYSICAL ACTIVITY
(n=1000)
*Subgroup analysis refers to statistically significant differences at the 95% confidence level

Page 66 © 2010
Dietary Guidelines Alliance
Page 66 © 2010
Dietary Guidelines Alliance
Message Evaluation

Page 67 © 2010
Dietary Guidelines Alliance
Page 67 © 2010
Dietary Guidelines Alliance
For each of the six core areas, parents went through the following three-step
process to assess messaging.
Believability Motivation
Ranking
Actual Impact of
Top Message
Please rank the following messages in terms of how likely they would be to motivate you to…
How would you rate each of the following messages in terms of being believable?
FOR TOP RATED MESSAGE ONLY: Thinking about your daily routine, how likely is it that this message would actually get you to…
© 2010 Dietary Guidelines Alliance
CAL
PA
EB
PORTION
RICH
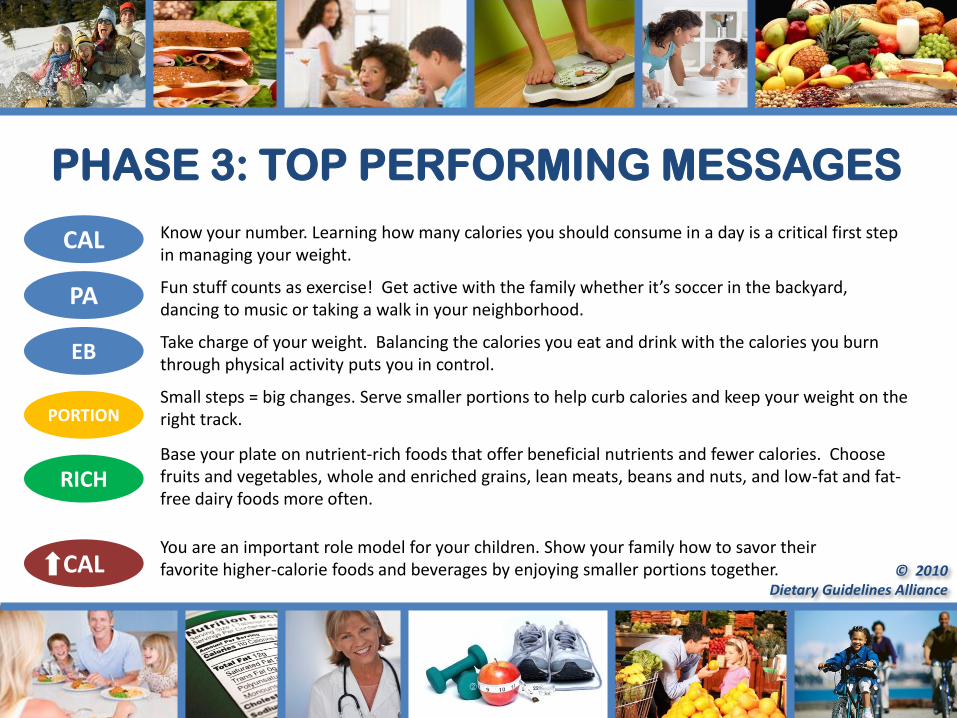
CAL
Know your number. Learning how many calories you should consume in a day is a critical first step in managing your weight.
Fun stuff counts as exercise! Get active with the family whether it’s soccer in the backyard, dancing to music or taking a walk in your neighborhood.
Take charge of your weight. Balancing the calories you eat and drink with the calories you burn through physical activity puts you in control.
Small steps = big changes. Serve smaller portions to help curb calories and keep your weight on the right track.
Base your plate on nutrient-rich foods that offer beneficial nutrients and fewer calories. Choose fruits and vegetables, whole and enriched grains, lean meats, beans and nuts, and low-fat and fat-free dairy foods more often.
You are an important role model for your children. Show your family how to savor their favorite higher-calorie foods and beverages by enjoying smaller portions together.
PHASE 3: TOP PERFORMING MESSAGES

Page 69 © 2010
Dietary Guidelines Alliance
Page 69 © 2010
Dietary Guidelines Alliance
Message Evaluation:
Calories

Page 70 © 2010
Dietary Guidelines Alliance
Page 70 © 2010
Dietary Guidelines Alliance
(n=1000) Scale: 1= “Not at all believable”, 5=“Extremely believable”
Mean Top 2 Box
Know your number. Learning how many calories you should consume in a day is a critical first step in managing your weight.
3.80 62%
Calories count. Calories are like a budget – you can only eat so many in a day. Spend wisely by choosing lower-calorie, nutrient-rich foods most of the time to help manage your weight.
3.73 60%
Get curious about calories. Calories are simply a way to measure how much fuel or energy we get from foods or beverages, and how much energy we burn or use up through physical activity.
3.63 55%
Keep calories in check. Calories are the key to achieving a healthy weight and improving health.
3.59 54%
Calories matter most. They are in almost everything you eat and drink and make all the difference in gaining, losing or maintaining weight. 3.44 47%
Not surprisingly, given that parents are least likely to believe paying attention to
calories is important, the believability scores given to the calories messages are
lower than those given to the other core areas.
Q20-24. How would you rate each of the following messages in terms of being believable?
MESSAGE BELIEVABILITY CAL

Page 71 © 2010
Dietary Guidelines Alliance
Page 71 © 2010
Dietary Guidelines Alliance
Q25. Please rank the following messages in terms of how likely they would be to get you to believe that calories impact weight?
(n=1000) Ranked where 1 is the most believable message
Ranked #1
Ranked #1 or 2
Know your number. Learning how many calories you should consume in a day is a critical first step in managing your weight.
31% 54%
Calories count. Calories are like a budget – you can only eat so many in a day. Spend wisely by choosing lower-calorie, nutrient-rich foods most of the time to help manage your weight.
23% 46%
Keep calories in check. Calories are the key to achieving a healthy weight and improving health.
13% 31%
Calories matter most. They are in almost everything you eat and drink and make all the difference in gaining, losing or maintaining weight. 15% 35%
Get curious about calories. Calories are simply a way to measure how much fuel or energy we get from foods or beverages, and how much energy we burn or use up through physical activity.
18% 33%
The message most apt to get parents to believe calories impact weight is
“Know your number.”
MESSAGE RANKING: BELIEVE CALORIES IMPACT WEIGHT CAL
Page 72 © 2010
Dietary Guidelines Alliance
Page 72 © 2010
Dietary Guidelines Alliance
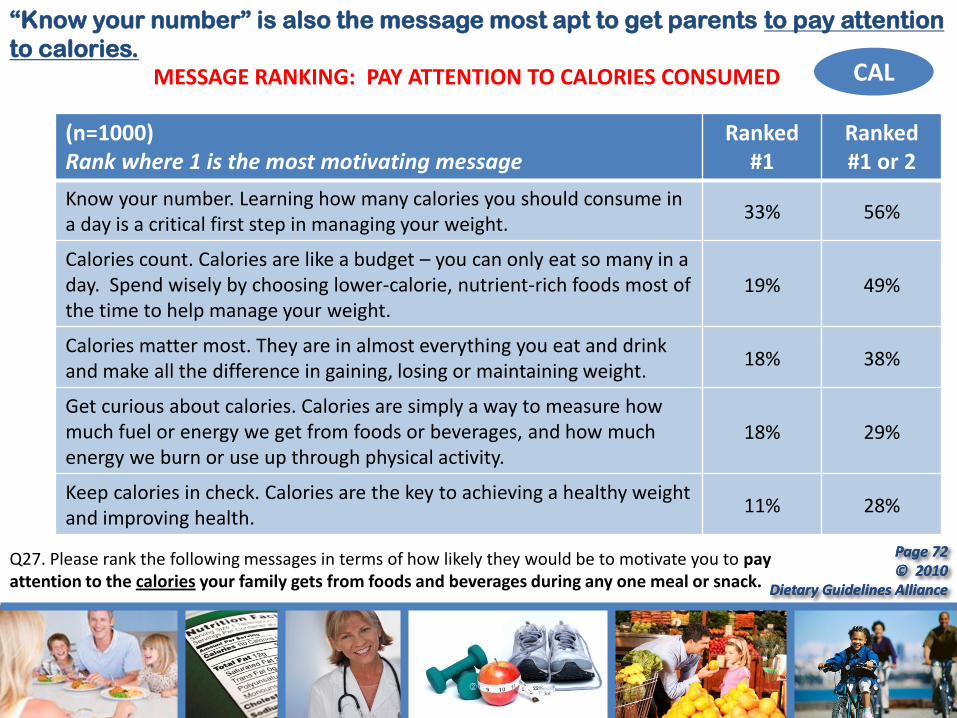
“Know your number” is also the message most apt to get parents to pay attention
to calories.
Q27. Please rank the following messages in terms of how likely they would be to motivate you to pay attention to the calories your family gets from foods and beverages during any one meal or snack.
(n=1000) Rank where 1 is the most motivating message
Ranked #1
Ranked #1 or 2
Know your number. Learning how many calories you should consume in a day is a critical first step in managing your weight.
33% 56%
Calories count. Calories are like a budget – you can only eat so many in a day. Spend wisely by choosing lower-calorie, nutrient-rich foods most of the time to help manage your weight.
19% 49%
Calories matter most. They are in almost everything you eat and drink and make all the difference in gaining, losing or maintaining weight.
18% 38%
Get curious about calories. Calories are simply a way to measure how much fuel or energy we get from foods or beverages, and how much energy we burn or use up through physical activity.
18% 29%
Keep calories in check. Calories are the key to achieving a healthy weight and improving health.
11% 28%
CAL MESSAGE RANKING: PAY ATTENTION TO CALORIES CONSUMED

Page 73 © 2010
Dietary Guidelines Alliance
Page 73 © 2010
Dietary Guidelines Alliance
About half of parents say the message they ranked #1 would actually motivate
them to change their behavior – in this case, to pay attention to calories
consumed.
Q28. FOR TOP RATED MESSAGE ONLY: Thinking about your daily routine, how likely is it that this message would actually get you to pay attention to the calories your family gets from foods and beverages during any one meal or snack?
(n=1000)
% ranking message
#1
% saying message would impact
(of ranked #1) Scale: 1=Not at all likely;
5=Extremely likely
Know your number 33% 61%
Calories count 19% 67%
Calories matter most 18% 55%
Get curious 18% 56%
Keep calories in check 11% 47%
CAL MESSAGE IMPACT: ACTUALLY GET YOU TO PAY ATTENTION TO CALORIES CONSUMED
Page 74 © 2010
Dietary Guidelines Alliance
Page 74 © 2010
Dietary Guidelines Alliance
Message Evaluation:
Physical Activity
Page 75 © 2010
Dietary Guidelines Alliance
Page 75 © 2010
Dietary Guidelines Alliance
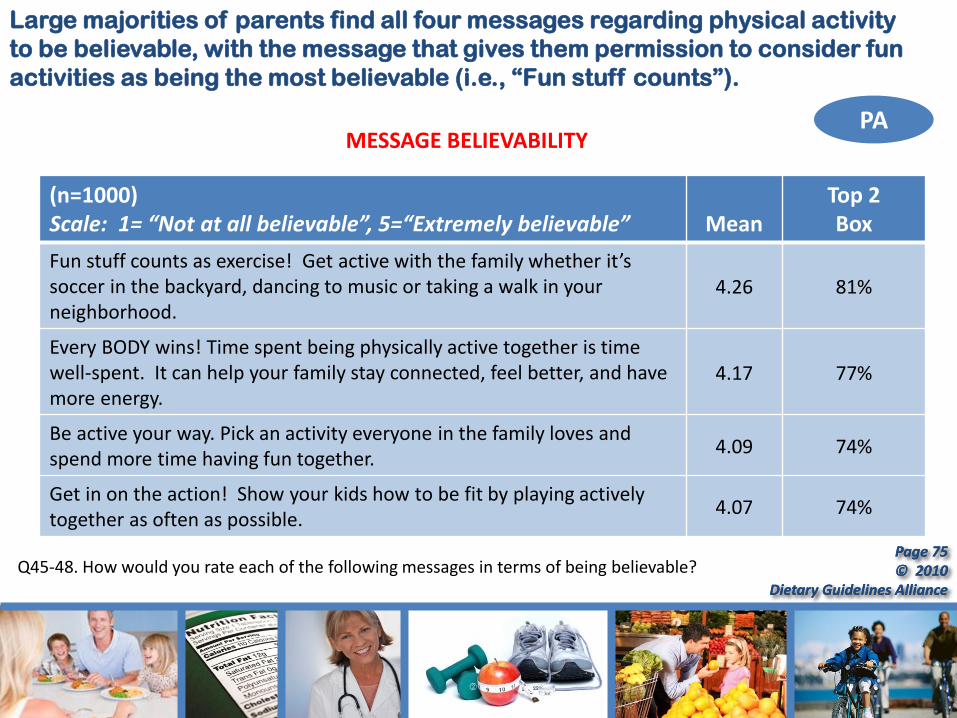
Large majorities of parents find all four messages regarding physical activity
to be believable, with the message that gives them permission to consider fun
activities as being the most believable (i.e., “Fun stuff counts”).
Q45-48. How would you rate each of the following messages in terms of being believable?
(n=1000) Scale: 1= “Not at all believable”, 5=“Extremely believable”
Mean
Top 2 Box
Fun stuff counts as exercise! Get active with the family whether it’s soccer in the backyard, dancing to music or taking a walk in your neighborhood.
4.26 81%
Every BODY wins! Time spent being physically active together is time well-spent. It can help your family stay connected, feel better, and have more energy.
4.17 77%
Be active your way. Pick an activity everyone in the family loves and spend more time having fun together.
4.09 74%
Get in on the action! Show your kids how to be fit by playing actively together as often as possible.
4.07 74%
PA MESSAGE BELIEVABILITY
Page 76 © 2010
Dietary Guidelines Alliance
Page 76 © 2010
Dietary Guidelines Alliance
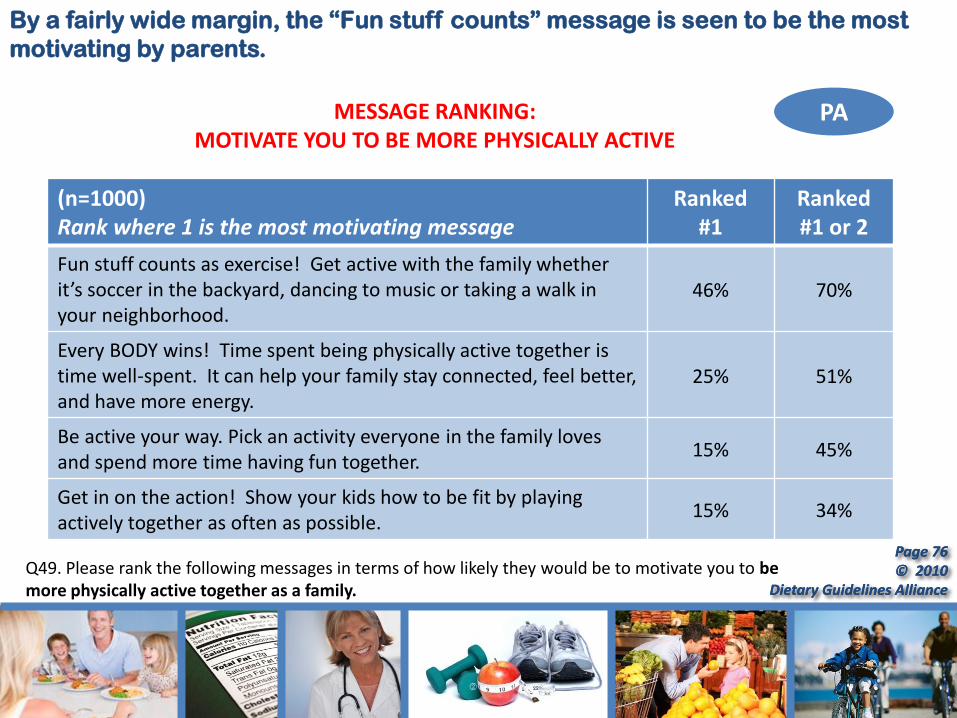
By a fairly wide margin, the “Fun stuff counts” message is seen to be the most
motivating by parents.
Q49. Please rank the following messages in terms of how likely they would be to motivate you to be more physically active together as a family.
(n=1000) Rank where 1 is the most motivating message
Ranked #1
Ranked #1 or 2
Fun stuff counts as exercise! Get active with the family whether it’s soccer in the backyard, dancing to music or taking a walk in your neighborhood.
46% 70%
Every BODY wins! Time spent being physically active together is time well-spent. It can help your family stay connected, feel better, and have more energy.
25% 51%
Be active your way. Pick an activity everyone in the family loves and spend more time having fun together.
15% 45%
Get in on the action! Show your kids how to be fit by playing actively together as often as possible.
15% 34%
PA MESSAGE RANKING: MOTIVATE YOU TO BE MORE PHYSICALLY ACTIVE
Page 77 © 2010
Dietary Guidelines Alliance
Page 77 © 2010
Dietary Guidelines Alliance
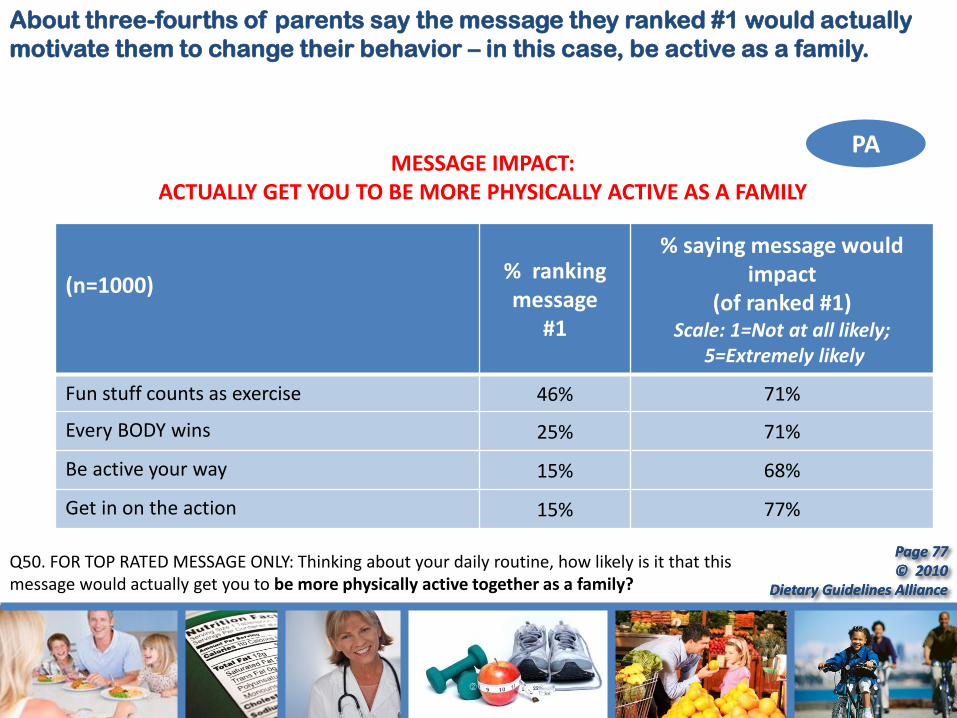
About three-fourths of parents say the message they ranked #1 would actually
motivate them to change their behavior – in this case, be active as a family.
Q50. FOR TOP RATED MESSAGE ONLY: Thinking about your daily routine, how likely is it that this message would actually get you to be more physically active together as a family?
(n=1000)
% ranking message
#1
% saying message would impact
(of ranked #1) Scale: 1=Not at all likely;
5=Extremely likely
Fun stuff counts as exercise 46% 71%
Every BODY wins 25% 71%
Be active your way 15% 68%
Get in on the action 15% 77%
PA MESSAGE IMPACT:
ACTUALLY GET YOU TO BE MORE PHYSICALLY ACTIVE AS A FAMILY
Page 78 © 2010
Dietary Guidelines Alliance
Page 78 © 2010
Dietary Guidelines Alliance
Message Evaluation:
Energy Balance
Page 79 © 2010
Dietary Guidelines Alliance
Page 79 © 2010
Dietary Guidelines Alliance
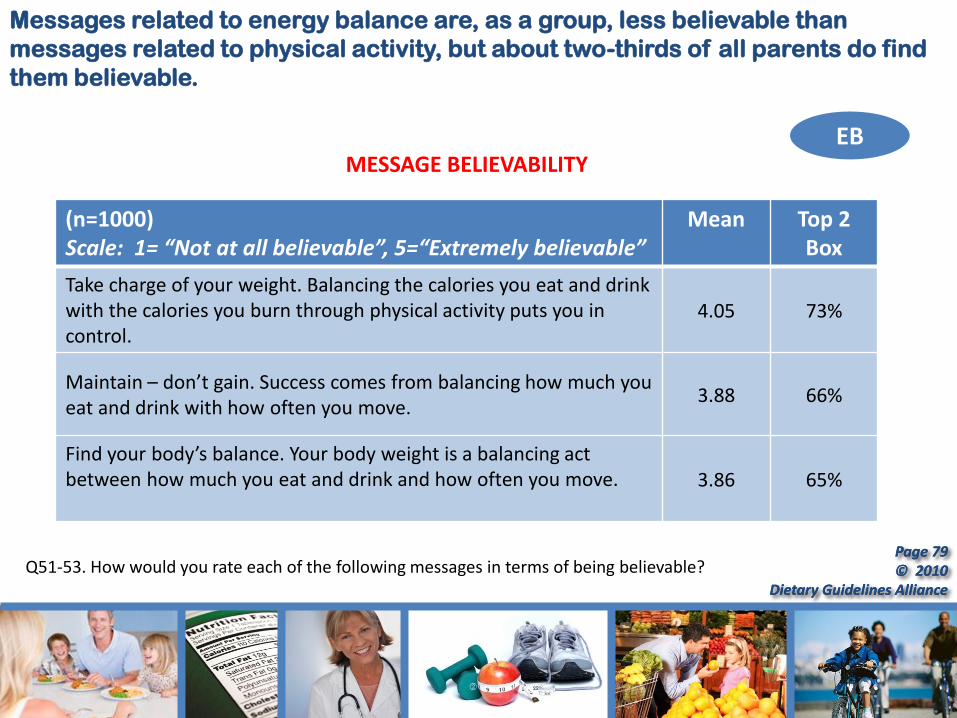
Messages related to energy balance are, as a group, less believable than
messages related to physical activity, but about two-thirds of all parents do find
them believable.
Q51-53. How would you rate each of the following messages in terms of being believable?
(n=1000) Scale: 1= “Not at all believable”, 5=“Extremely believable”
Mean Top 2 Box
Take charge of your weight. Balancing the calories you eat and drink with the calories you burn through physical activity puts you in control.
4.05 73%
Maintain – don’t gain. Success comes from balancing how much you eat and drink with how often you move.
3.88 66%
Find your body’s balance. Your body weight is a balancing act between how much you eat and drink and how often you move.
3.86 65%
EB MESSAGE BELIEVABILITY

Page 80 © 2010
Dietary Guidelines Alliance
Page 80 © 2010
Dietary Guidelines Alliance
“Take charge” ranks highest in terms of motivating parents to balance food and
beverage consumption with physical activity.
Q54. Please rank the following messages in terms of how likely they would be to motivate you to make an effort to balance the amount of food and beverages your family eats and drinks with their level of activity?
(n=1000) Rank where 1 is the most motivating message
Ranked #1
Ranked #1 or 2
Take charge of your weight. Balancing the calories you eat and drink with the calories you burn through physical activity puts you in control.
49% 77%
Find your body’s balance. Your body weight is a balancing act between how much you eat and drink and how often you move.
27% 67%
Maintain – don’t gain. Success comes from balancing how much you eat and drink with how often you move.
24% 56%
EB MESSAGE RANKING: MOTIVATE YOU TO BALANCE ENERGY IN/OUT
Page 81 © 2010
Dietary Guidelines Alliance
Page 81 © 2010
Dietary Guidelines Alliance
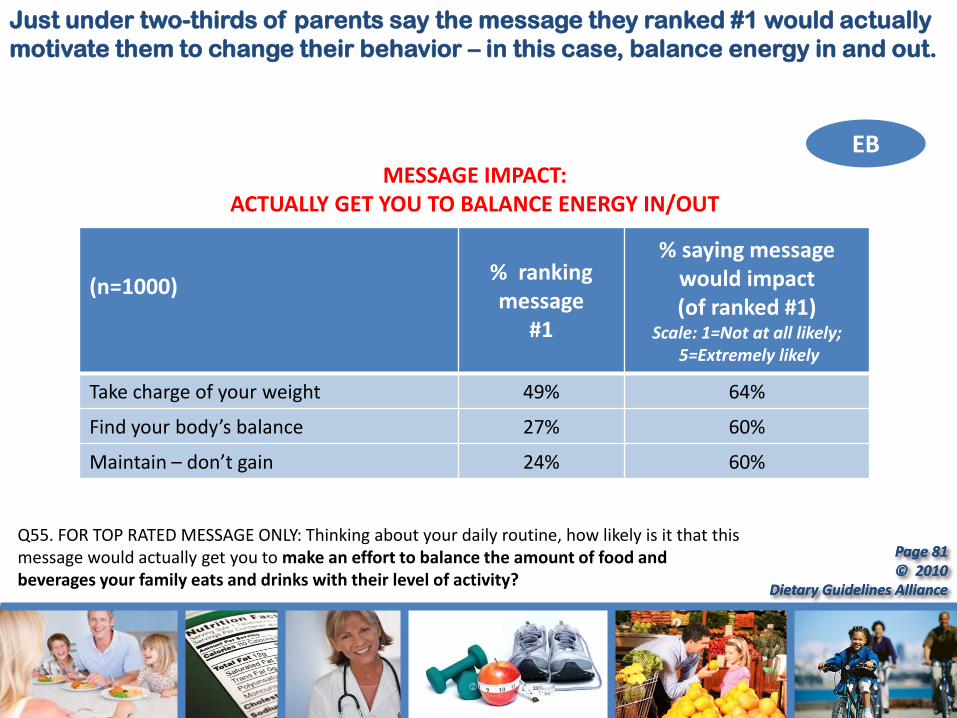
Just under two-thirds of parents say the message they ranked #1 would actually
motivate them to change their behavior – in this case, balance energy in and out.
Q55. FOR TOP RATED MESSAGE ONLY: Thinking about your daily routine, how likely is it that this message would actually get you to make an effort to balance the amount of food and beverages your family eats and drinks with their level of activity?
(n=1000)
% ranking message
#1
% saying message would impact (of ranked #1)
Scale: 1=Not at all likely; 5=Extremely likely
Take charge of your weight 49% 64%
Find your body’s balance 27% 60%
Maintain – don’t gain 24% 60%
EB MESSAGE IMPACT:
ACTUALLY GET YOU TO BALANCE ENERGY IN/OUT
Page 82 © 2010
Dietary Guidelines Alliance
Page 82 © 2010
Dietary Guidelines Alliance
Message Evaluation:
Portion size
Page 83 © 2010
Dietary Guidelines Alliance
Page 83 © 2010
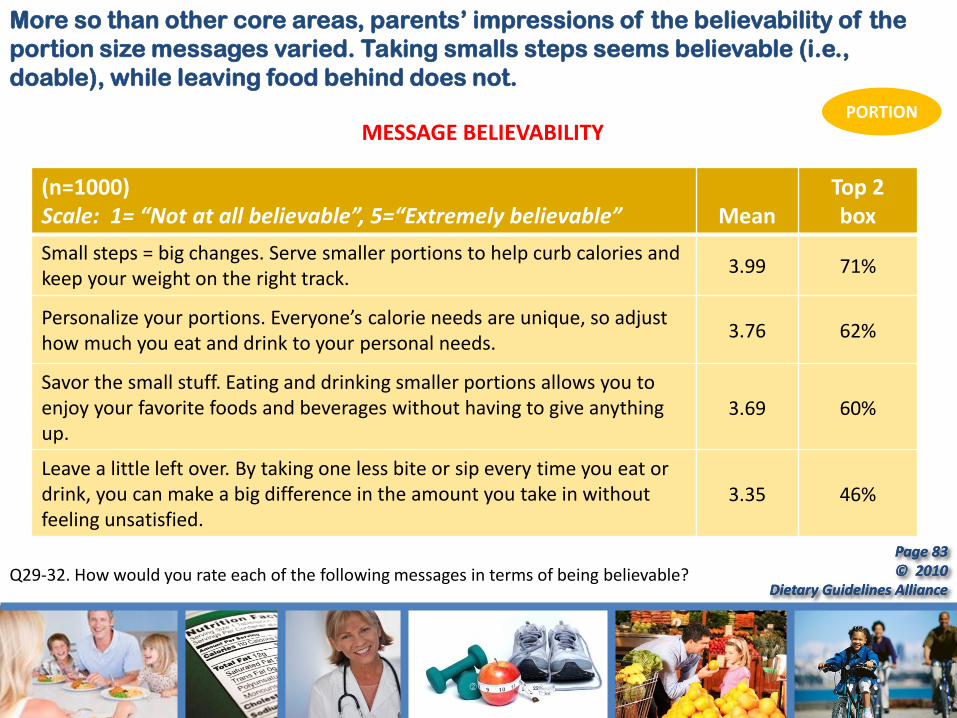
Dietary Guidelines Alliance Q29-32. How would you rate each of the following messages in terms of being believable?
(n=1000) Scale: 1= “Not at all believable”, 5=“Extremely believable”
Mean
Top 2 box
Small steps = big changes. Serve smaller portions to help curb calories and keep your weight on the right track.
3.99 71%
Personalize your portions. Everyone’s calorie needs are unique, so adjust how much you eat and drink to your personal needs.
3.76 62%
Savor the small stuff. Eating and drinking smaller portions allows you to enjoy your favorite foods and beverages without having to give anything up.
3.69 60%
Leave a little left over. By taking one less bite or sip every time you eat or drink, you can make a big difference in the amount you take in without feeling unsatisfied.
3.35 46%
More so than other core areas, parents’ impressions of the believability of the
portion size messages varied. Taking smalls steps seems believable (i.e.,
doable), while leaving food behind does not.
PORTION MESSAGE BELIEVABILITY
Page 84 © 2010
Dietary Guidelines Alliance
Page 84 © 2010
Dietary Guidelines Alliance
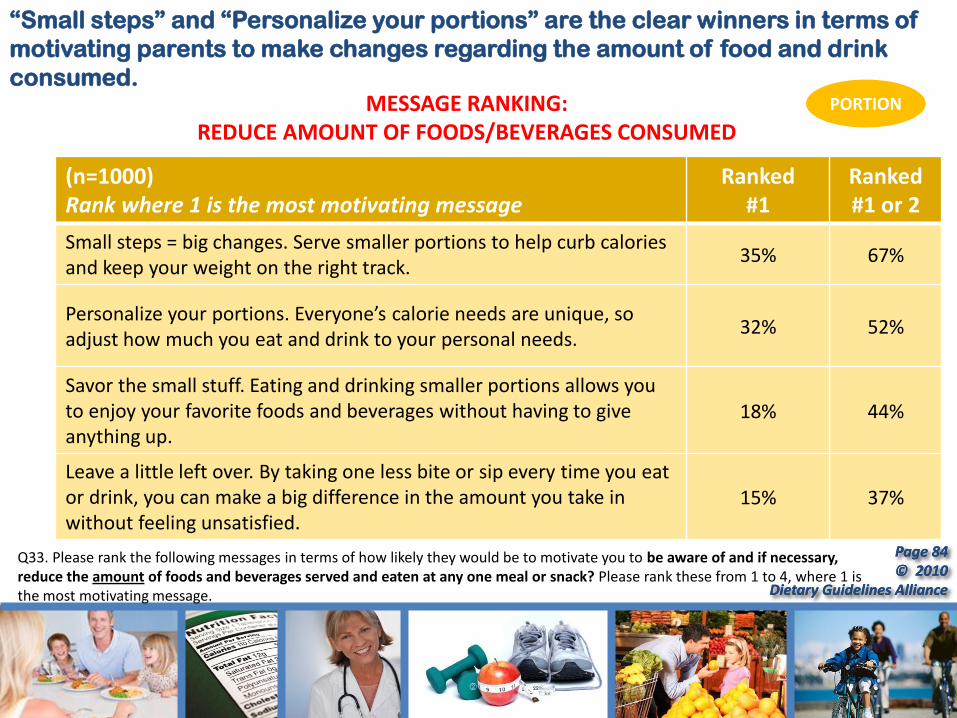
Q33. Please rank the following messages in terms of how likely they would be to motivate you to be aware of and if necessary, reduce the amount of foods and beverages served and eaten at any one meal or snack? Please rank these from 1 to 4, where 1 is the most motivating message.
(n=1000) Rank where 1 is the most motivating message
Ranked #1
Ranked #1 or 2
Small steps = big changes. Serve smaller portions to help curb calories and keep your weight on the right track.
35% 67%
Personalize your portions. Everyone’s calorie needs are unique, so adjust how much you eat and drink to your personal needs.
32% 52%
Savor the small stuff. Eating and drinking smaller portions allows you to enjoy your favorite foods and beverages without having to give anything up.
18% 44%
Leave a little left over. By taking one less bite or sip every time you eat or drink, you can make a big difference in the amount you take in without feeling unsatisfied.
15% 37%
“Small steps” and “Personalize your portions” are the clear winners in terms of
motivating parents to make changes regarding the amount of food and drink
consumed. PORTION MESSAGE RANKING:
REDUCE AMOUNT OF FOODS/BEVERAGES CONSUMED

Page 85 © 2010
Dietary Guidelines Alliance
Page 85 © 2010
Dietary Guidelines Alliance
Upwards of two-thirds of parents say the message they ranked #1 would actually
motivate them to change their behavior – in this case, to reduce consumption.
Q34. FOR TOP RATED MESSAGE ONLY: Thinking about your daily routine, how likely is it that this message would actually get you to be aware of and, if necessary, reduce the amount of foods and beverages served and eaten at any one meal or snack?
(n=1000)
% ranking
message #1
% saying message would impact (of ranked #1)
Scale: 1=Not at all likely; 5=Extremely likely
Small steps = big changes 35% 70%
Personalize your portions 32% 67%
Savor the small stuff. 18% 74%
Leave a little left over 15% 70%
PORTION MESSAGE IMPACT:
ACTUALLY GET YOU TO REDUCE AMOUNT OF FOODS/BEVERAGES CONSUMED
Page 86 © 2010
Dietary Guidelines Alliance
Page 86 © 2010
Dietary Guidelines Alliance
Message Evaluation:
Nutrient-rich Foods and Beverages

Page 87 © 2010
Dietary Guidelines Alliance
Page 87 © 2010
Dietary Guidelines Alliance
Close to three-quarters of parents believe the “Base your plate” message, which
gives specific example of nutrient-rich foods, is believable.
Q40-42. How would you rate each of the following messages in terms of being believable?
(n=1000) Scale: 1= “Not at all believable”, 5=“Extremely believable”
Mean Top 2 Box
Base your plate on nutrient-rich foods that offer beneficial nutrients and fewer calories. Choose fruits and vegetables, whole and enriched grains, lean meats, beans and nuts, and low-fat and fat-free dairy foods more often.
4.04 72%
Make the most of your calories by choosing nutrient-rich foods and beverages first to maximize the nutrients your body needs.
3.86 64%
All foods can fit into a nutrient-rich eating plan, but balance is important. Choose lower-calorie, nutrient-rich foods first from each of the basic food groups, then add in higher-calorie splurges as your calorie needs allow.
3.47 50%
MESSAGE BELIEVABILITY RICH
Page 88 © 2010
Dietary Guidelines Alliance
Page 88 © 2010
Dietary Guidelines Alliance
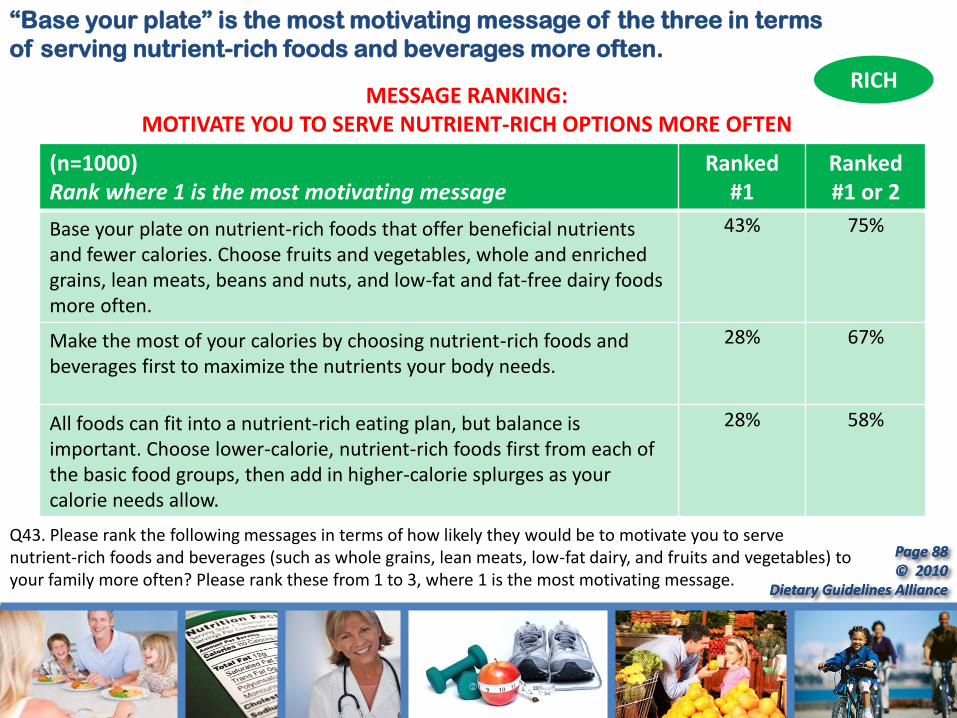
“Base your plate” is the most motivating message of the three in terms
of serving nutrient-rich foods and beverages more often.
Q43. Please rank the following messages in terms of how likely they would be to motivate you to serve nutrient-rich foods and beverages (such as whole grains, lean meats, low-fat dairy, and fruits and vegetables) to your family more often? Please rank these from 1 to 3, where 1 is the most motivating message.
(n=1000) Rank where 1 is the most motivating message
Ranked #1
Ranked #1 or 2
Base your plate on nutrient-rich foods that offer beneficial nutrients and fewer calories. Choose fruits and vegetables, whole and enriched grains, lean meats, beans and nuts, and low-fat and fat-free dairy foods more often.
43% 75%
Make the most of your calories by choosing nutrient-rich foods and beverages first to maximize the nutrients your body needs.
28% 67%
All foods can fit into a nutrient-rich eating plan, but balance is important. Choose lower-calorie, nutrient-rich foods first from each of the basic food groups, then add in higher-calorie splurges as your calorie needs allow.
28% 58%
MESSAGE RANKING: MOTIVATE YOU TO SERVE NUTRIENT-RICH OPTIONS MORE OFTEN
RICH

Page 89 © 2010
Dietary Guidelines Alliance
Page 89 © 2010
Dietary Guidelines Alliance
About two-thirds of parents say the message they ranked #1 would actually
motivate them to change their behavior – in this case, serve nutrient-rich
foods/beverages more often.
Q44. FOR TOP RATED MESSAGE ONLY: Thinking about your daily routine, how likely is it that this message would actually get you to serve nutrient-rich foods and beverages (such as whole grains, lean meats, low-fat dairy, and fruits and vegetables) to your family more often?
(n=1000)
% ranking message
#1
% saying message would impact
(of ranked #1) Scale: 1=Not at all likely;
5=Extremely likely
Base your plate 43% 66%
All foods can fit into a nutrient-rich eating plan 28% 58%
Make the most of your calories 28% 62%
MESSAGE IMPACT: ACTUALLY GET YOU TO SERVE NUTRIENT-RICH OPTIONS MORE OFTEN
RICH
Page 90 © 2010
Dietary Guidelines Alliance
Page 90 © 2010
Dietary Guidelines Alliance
Message Evaluation:
Higher-calorie Foods and Beverages
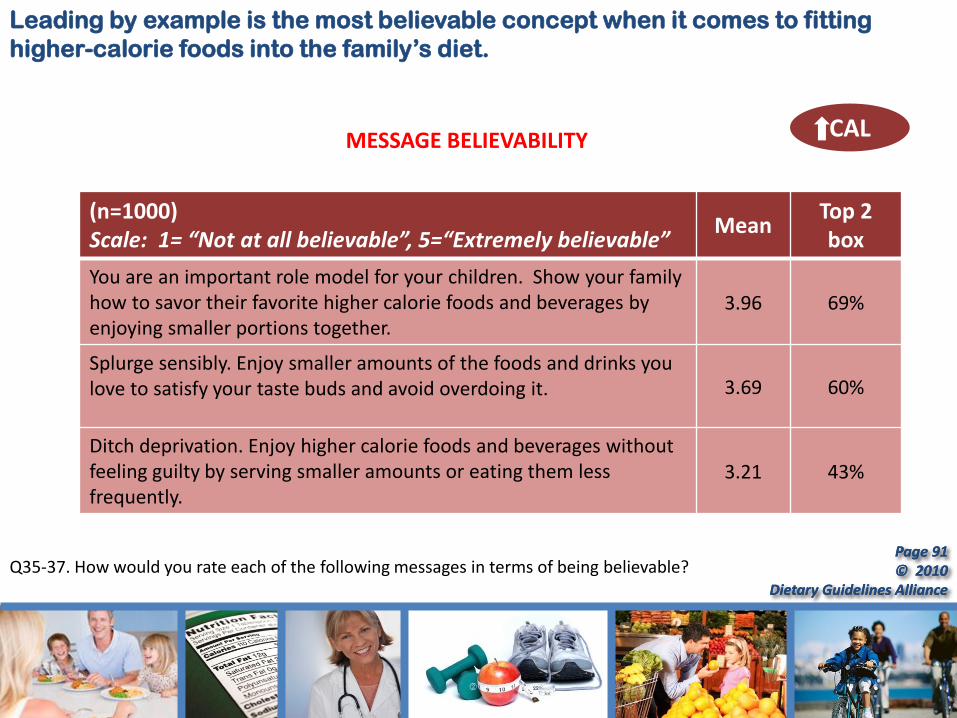
Page 91 © 2010
Dietary Guidelines Alliance
Page 91 © 2010
Dietary Guidelines Alliance
Leading by example is the most believable concept when it comes to fitting
higher-calorie foods into the family’s diet.
Q35-37. How would you rate each of the following messages in terms of being believable?
(n=1000) Scale: 1= “Not at all believable”, 5=“Extremely believable”
Mean Top 2 box
You are an important role model for your children. Show your family how to savor their favorite higher calorie foods and beverages by enjoying smaller portions together.
3.96 69%
Splurge sensibly. Enjoy smaller amounts of the foods and drinks you love to satisfy your taste buds and avoid overdoing it. 3.69 60%
Ditch deprivation. Enjoy higher calorie foods and beverages without feeling guilty by serving smaller amounts or eating them less frequently.
3.21 43%
MESSAGE BELIEVABILITY CAL

Page 92 © 2010
Dietary Guidelines Alliance
Page 92 © 2010
Dietary Guidelines Alliance
The “role model” message is the most motivating by far, with more than half
ranking it #1. “Splurge sensibly” beats out “ditch deprivation” (i.e., being
satisfied beats avoiding guilt).
Q38. Please rank the following messages in terms of how likely they would be to motivate you to manage higher calorie food and beverage choices in a way that does not affect your family’s weight?
(n=1000) Rank where 1 is the most motivating message
Ranked #1
Ranked #1 or 2
You are an important role model for your children. Show your family how to savor their favorite higher calorie foods and beverages by enjoying smaller portions together.
57% 80%
Splurge sensibly. Enjoy smaller amounts of the foods and drinks you love to satisfy your taste buds and avoid overdoing it.
27% 80%
Ditch deprivation. Enjoy higher calorie foods and beverages without feeling guilty by serving smaller amounts or eating them less frequently.
15% 40%
MESSAGE RANKING: MOTIVATE YOU TO MANAGE HIGHER CALORIE FOODS/BEVERAGES
(n=1000)
CAL

Page 93 © 2010
Dietary Guidelines Alliance
Page 93 © 2010
Dietary Guidelines Alliance
The vast majority of those that chose “Role model” as the message they ranked
#1 say it would actually motivate them to change their behavior – in this case, to
manage higher calorie foods/beverages without affecting diet.
Q39. FOR TOP RATED MESSAGE ONLY: Thinking about your daily routine, how likely is it that this message would actually get you to to manage higher calorie food and beverage choices in a way that does not affect your family’s weight?
(n=1,000)
% ranking message
#1
% saying message would impact (of ranked #1)
Scale: 1=Not at all likely; 5=Extremely likely
You are an important role model for your children
57%
79%
Splurge sensibly 27% 56%
Ditch deprivation 15% 57%
MESSAGE IMPACT: ACTUALLY GET YOU TO MANAGE HIGHER CALORIE FOODS/BEVERAGES
CAL

© 2010 Dietary Guidelines Alliance
CAL
PA
EB
PORTION
RICH
CAL
Know your number. Learning how many calories you should consume in a day is a critical first step in managing your weight.
Fun stuff counts as exercise! Get active with the family whether it’s soccer in the backyard, dancing to music or taking a walk in your neighborhood.
Take charge of your weight. Balancing the calories you eat and drink with the calories you burn through physical activity puts you in control.
Small steps = big changes. Serve smaller portions to help curb calories and keep your weight on the right track.
Base your plate on nutrient-rich foods that offer beneficial nutrients and fewer calories. Choose fruits and vegetables, whole and enriched grains, lean meats, beans and nuts, and low-fat and fat-free dairy foods more often.
You are an important role model for your children. Show your family how to savor their favorite higher-calorie foods and beverages by enjoying smaller portions together.
PHASE 3: TOP PERFORMING MESSAGES
Page 95 © 2010
Dietary Guidelines Alliance
Page 95 © 2010
Dietary Guidelines Alliance
Information Sources
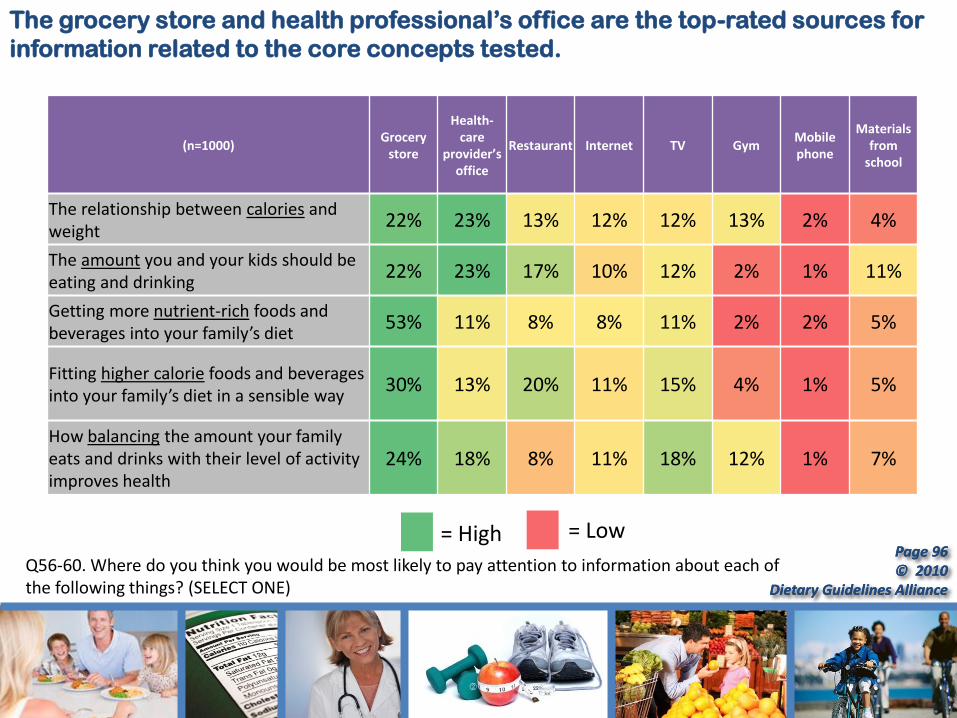
Page 96 © 2010
Dietary Guidelines Alliance
Page 96 © 2010
Dietary Guidelines Alliance
The grocery store and health professional’s office are the top-rated sources for
information related to the core concepts tested.
Q56-60. Where do you think you would be most likely to pay attention to information about each of the following things? (SELECT ONE)
(n=1000) Grocery
store
Health-care
provider’s office
Restaurant Internet TV Gym Mobile phone
Materials from
school
The relationship between calories and weight
22% 23% 13% 12% 12% 13% 2% 4%
The amount you and your kids should be eating and drinking
22% 23% 17% 10% 12% 2% 1% 11%
Getting more nutrient-rich foods and beverages into your family’s diet
53% 11% 8% 8% 11% 2% 2% 5%
Fitting higher calorie foods and beverages into your family’s diet in a sensible way
30% 13% 20% 11% 15% 4% 1% 5%
How balancing the amount your family eats and drinks with their level of activity improves health
24% 18% 8% 11% 18% 12% 1% 7%
= High = Low
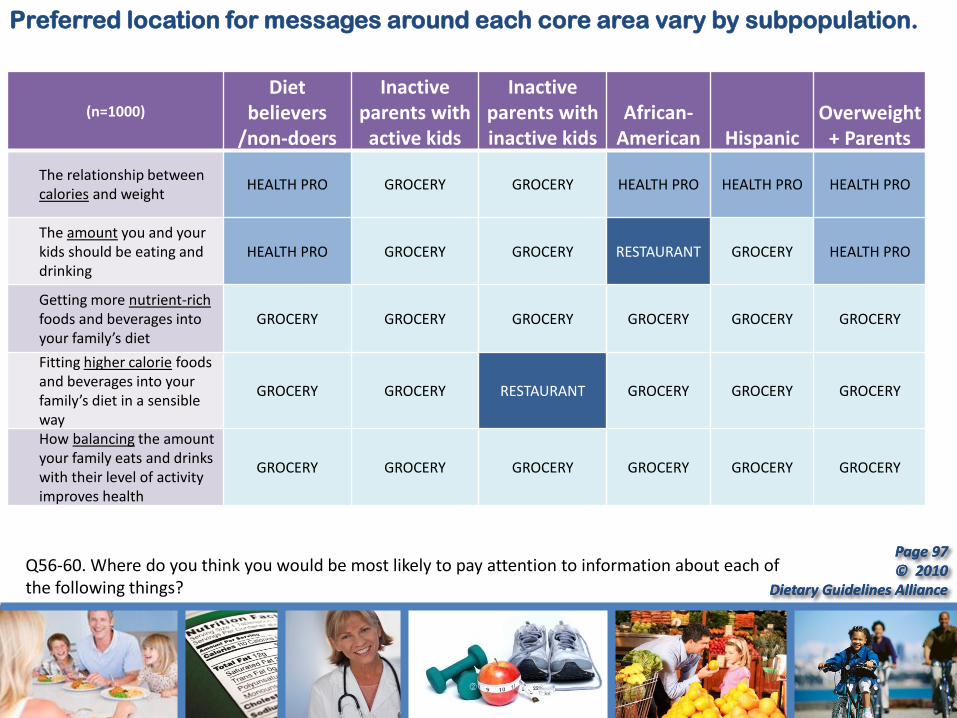
Page 97 © 2010
Dietary Guidelines Alliance
Page 97 © 2010
Dietary Guidelines Alliance
Preferred location for messages around each core area vary by subpopulation.
Q56-60. Where do you think you would be most likely to pay attention to information about each of the following things?
(n=1000)
Diet believers
/non-doers
Inactive parents with active kids
Inactive parents with inactive kids
African-American Hispanic
Overweight + Parents
The relationship between calories and weight
HEALTH PRO GROCERY GROCERY HEALTH PRO HEALTH PRO HEALTH PRO
The amount you and your kids should be eating and drinking
HEALTH PRO GROCERY GROCERY RESTAURANT GROCERY HEALTH PRO
Getting more nutrient-rich foods and beverages into your family’s diet
GROCERY GROCERY GROCERY GROCERY GROCERY GROCERY
Fitting higher calorie foods and beverages into your family’s diet in a sensible way
GROCERY GROCERY RESTAURANT GROCERY GROCERY GROCERY
How balancing the amount your family eats and drinks with their level of activity improves health
GROCERY GROCERY GROCERY GROCERY GROCERY GROCERY

Page 98 © 2010
Dietary Guidelines Alliance
Page 98 © 2010
Dietary Guidelines Alliance
Demographic Profile
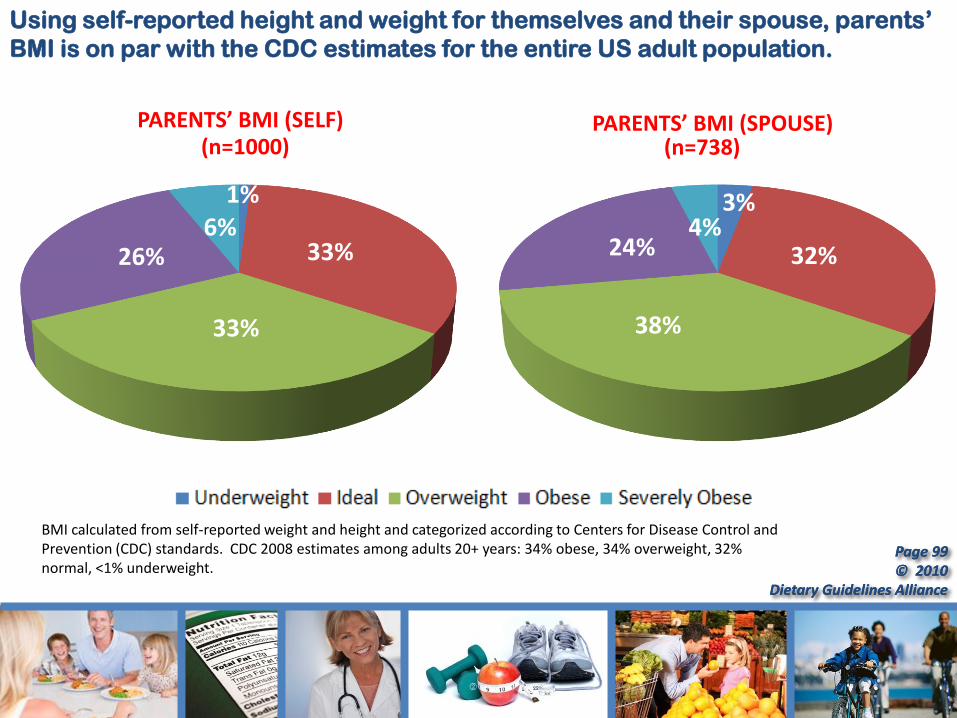
Page 99 © 2010
Dietary Guidelines Alliance
Page 99 © 2010
Dietary Guidelines Alliance
3%
32%
38%
24% 4%
Using self-reported height and weight for themselves and their spouse, parents’
BMI is on par with the CDC estimates for the entire US adult population.
1%
33%
33%
26% 6%
PARENTS’ BMI (SELF)
BMI calculated from self-reported weight and height and categorized according to Centers for Disease Control and Prevention (CDC) standards. CDC 2008 estimates among adults 20+ years: 34% obese, 34% overweight, 32% normal, <1% underweight.
PARENTS’ BMI (SPOUSE) (n=1000) (n=738)
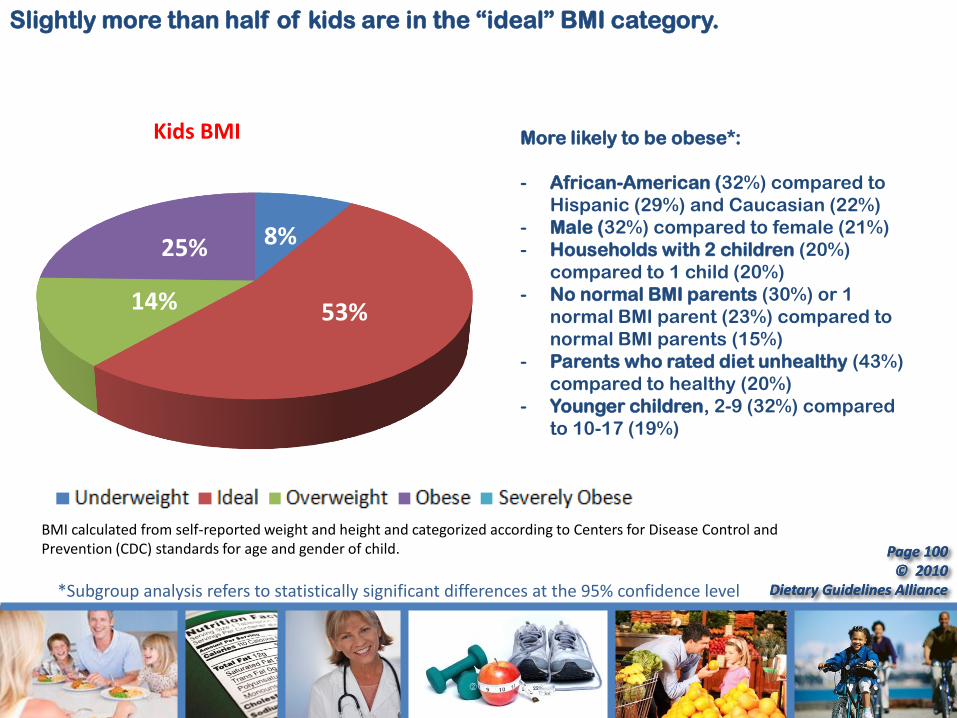
Page 100 © 2010
Dietary Guidelines Alliance
Page 100 © 2010
Dietary Guidelines Alliance
Slightly more than half of kids are in the “ideal” BMI category.
Kids BMI
BMI calculated from self-reported weight and height and categorized according to Centers for Disease Control and Prevention (CDC) standards for age and gender of child.
*Subgroup analysis refers to statistically significant differences at the 95% confidence level
8%
53% 14%
25%
More likely to be obese*:
- African-American (32%) compared to
Hispanic (29%) and Caucasian (22%)
- Male (32%) compared to female (21%)
- Households with 2 children (20%)
compared to 1 child (20%)
- No normal BMI parents (30%) or 1
normal BMI parent (23%) compared to
normal BMI parents (15%)
- Parents who rated diet unhealthy (43%)
compared to healthy (20%)
- Younger children, 2-9 (32%) compared
to 10-17 (19%)
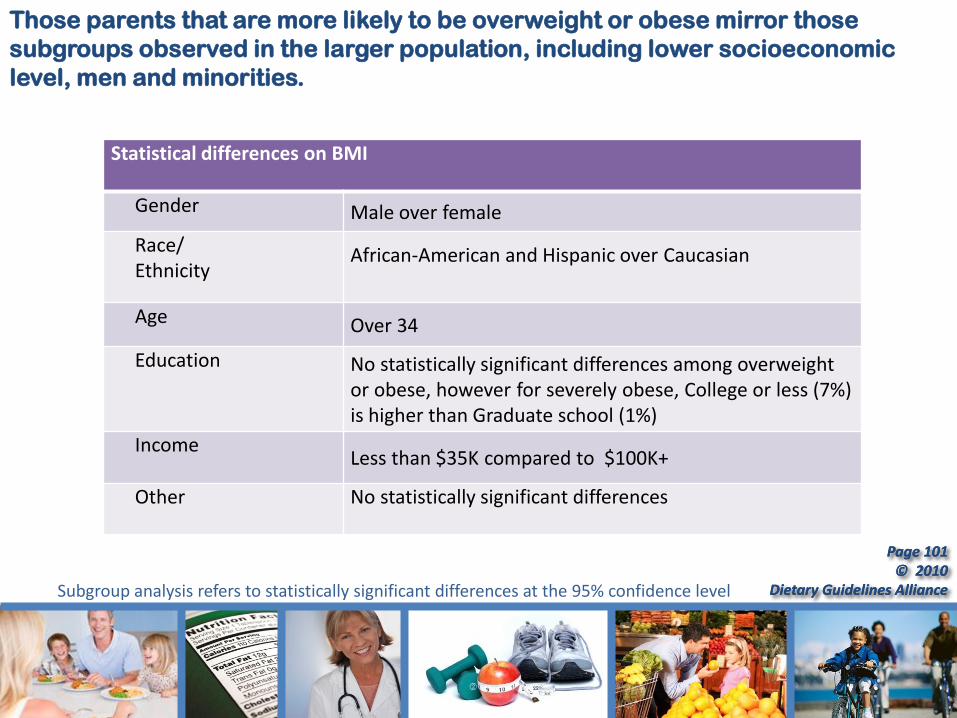
Page 101 © 2010
Dietary Guidelines Alliance
Page 101 © 2010
Dietary Guidelines Alliance
Statistical differences on BMI
Gender Male over female
Race/ Ethnicity
African-American and Hispanic over Caucasian
Age Over 34
Education No statistically significant differences among overweight or obese, however for severely obese, College or less (7%) is higher than Graduate school (1%)
Income Less than $35K compared to $100K+
Other No statistically significant differences
Those parents that are more likely to be overweight or obese mirror those
subgroups observed in the larger population, including lower socioeconomic
level, men and minorities.
Subgroup analysis refers to statistically significant differences at the 95% confidence level
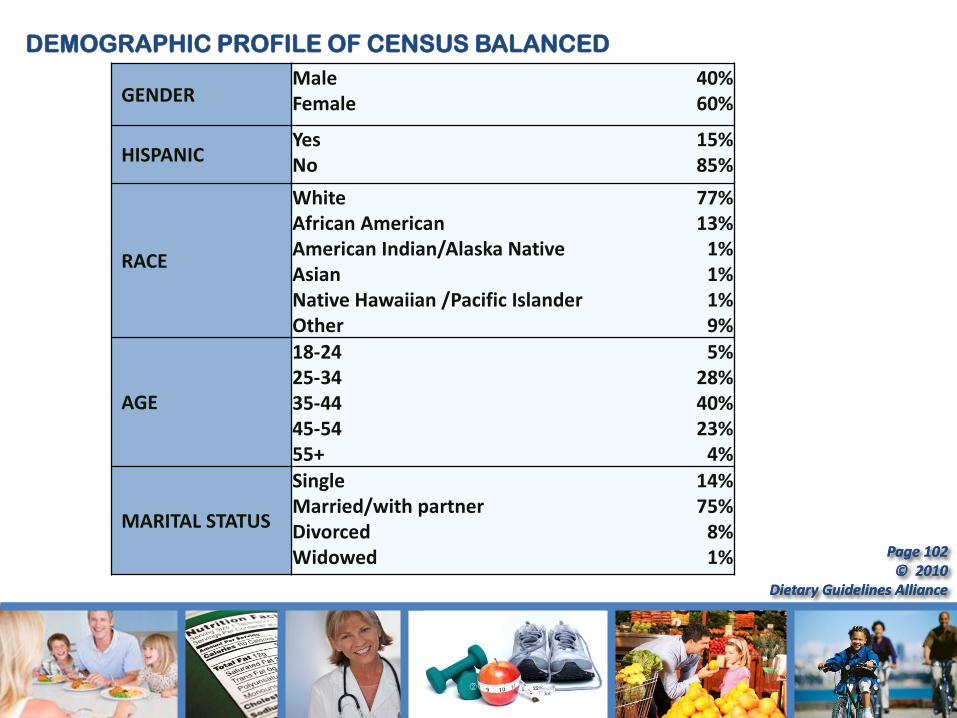
Page 102 © 2010
Dietary Guidelines Alliance
Page 102 © 2010
Dietary Guidelines Alliance
GENDER Male 40% Female 60%
HISPANIC Yes 15% No 85%
RACE
White 77% African American 13% American Indian/Alaska Native 1% Asian 1% Native Hawaiian /Pacific Islander 1% Other 9%
AGE
18-24 5% 25-34 28% 35-44 40% 45-54 23% 55+ 4%
MARITAL STATUS
Single 14% Married/with partner 75% Divorced 8% Widowed 1%
DEMOGRAPHIC PROFILE OF CENSUS BALANCED

Page 103 © 2010
Dietary Guidelines Alliance
Page 103 © 2010
Dietary Guidelines Alliance
EMPLOYMENT
Employed full-time 57% Employed part-time 12% Are not currently employed outside the home 24%
EDUCATION
High school or less 46% Some college (no degree) 17% Associate degree 11% Bachelor degree 17% Graduate/professional school 9%
HOUSEHOLD INCOME
Less than $50,000 42% $50,000 to $99,999 40% $100,000+ 18%
REGION
Northeast 18% Midwest 22% South 37% West 23%
NUMBER OF CHILDREN
1 44% 2 37% 3 13% 4+ 6%
DEMOGRAPHIC PROFILE OF CENSUS BALANCED

Page 104 © 2010
Dietary Guidelines Alliance
Page 104 © 2010
Dietary Guidelines Alliance
Conclusions and Implications

© 2010 Dietary Guidelines Alliance
PHASE 3: KEY TAKEAWAYS
• Prior to creating any communication around energy balance, education
on its two components (calories and physical activity) is needed.
• American parents currently see no reason to monitor calories. Some
lack a clear understanding of what a calorie is. Even those who do
understand what they are, and may see them as important, are not
willing to monitor them, nor do they find it feasible to do so in a
comprehensive manner.
• Messaging should help American parents become committed to
consistent physical activity for themselves. A parent’s physical activity
does not need to take them away from family time. Physical activity can be
a fun thing for the family to do together. Parents may be encouraged to
stay with a commitment if the benefit to their kids’ future is clear, as they
do want to be good role models, setting a positive example for their kids
and nurturing positive habits.
© 2010 Dietary Guidelines Alliance
PHASE 3: KEY TAKEAWAYS (continued)
When educating about energy balance, messages about counting or
monitoring calories will not likely be effective today. This may change as
Americans become better educated on the importance of calories and
are exposed to more calorie information on menus and food labels. Saying
that energy balance means keeping track of calories may be off-putting
for today’s consumers.
Using the highest-ranked messages in each core area will help
Americans:
Learn more about the importance of nutrition and physical activity;
Be more successful at weight management; and
Spend more time together, being active and having fun, as a family.
© 2010 Dietary Guidelines Alliance
PHASE 3: KEY TAKEAWAYS (continued)
For the most part, American parents are interested in finding this information
in a place that is convenient for them - the grocery store. Placing basic
information there, perhaps along with a call to action to visit a website for
more information, would be most effective.
In addition, health professionals’ office is also ranked quite high. Physicians
and RDs cannot assume families know even the basics about things like
including nutrient-rich items and portion size. If health professionals can be
motivated to provide this information to families who do not yet have a serious
weight issue, they can help them get themselves and their kids on a healthy
track for weight management.

© 2010 Dietary Guidelines Alliance
CREATING SUCCESSFUL MESSAGES
Keep the following insights in mind when shaping messages around the core areas.
• Messages that are short, to-the-point and action-oriented are more likely to be
believed and absorbed.
• Messages that indicate the uniqueness of each person or family’s needs connect
with parents more than generalized statements.
• Messages that imply the consumer has control over their family’s situation, and it
is within their power to make a change, are also impactful.
• Parents want to know the benefit of doing something, particularly if the task
seems time-consuming or difficult, like counting calories and monitoring portions.
• American parents are looking for “how to” education on the topic, particularly in
the case of serving nutrient-rich foods and beverages more often. Messages and
information should not just provide a goal to strive for, but should be instructional.
© 2010 Dietary Guidelines Alliance
CREATING SUCCESSFUL MESSAGES (continued)
Keep the following insights in mind when shaping messages around the core areas.
• Messages that encourage planning ahead and making a family effort may
convince parents how important it is to take the time to set goals together and
work toward them, whether they be around physical activity, portion size or
successfully incorporating higher-calorie foods.
• While the concept of being a role model is helpful, messages should not imply
that parents are doing anything “wrong” today. This will be a turn-off as parents
do feel they are doing the best they can, often in difficult situations. Messages
should focus more on how they could do something better tomorrow.
• Messages that draw analogies to constructs that they are very familiar with,
such as budgeting for calories, are very appealing.

© 2010 Dietary Guidelines Alliance
110
© 2010 Dietary Guidelines Alliance
For more information,
please contact:
International Food Information Council
(A founding member of the Dietary
Guidelines Alliance)
1100 Connecticut Avenue NW
Suite 430
Washington, DC 20036
202.296.6540
www.foodinsight.org
2010 Dietary Guidelines Alliance