Embed Size (px)
Citation preview

No 2004 – 22 December
(updated September 2005)
A consistent, ad-valorem equivalent measure of applied protection across the world:
The MAcMap-HS6 database _____________
Antoine Bouët, Yvan Decreux, Lionel Fontagné, Sébastien Jean & David Laborde

A consistent, ad-valorem equivalent measure of applied protection across the world:
The MAcMap-HS6 database _____________
Antoine Bouët, Yvan Decreux, Lionel Fontagné, Sébastien Jean & David Laborde
No 2004 – 22 December
(updated September 2005)
Support from the CIREM is gratefully acknowledged
A consistent, ad-valorem equivalent measure of applied protection across the world
3
TABLE OF CONTENTS
SUMMARY ..............................................................................................................................4
ABSTRACT..............................................................................................................................5
RESUME .................................................................................................................................6
RESUME COURT .....................................................................................................................8
1 INTRODUCTION ................................................................................................................9
2 COMPUTING A CONSISTENT AND EXHAUSTIVE EQUIVALENT MEASURE OF
APPLIED PROTECTION: METHODOLOGICAL CHOICES IN MACMAPHS6 .....................13
2.1 Collecting and harmonizing information...............................................................14 2.2 Calculating AVEs..................................................................................................14
2.2.1 Specific tariffs .............................................................................................15
2.2.2 Mixed and compound tariffs .......................................................................17
2.2.3 Tariff rate quotas .........................................................................................17
2.2.4 Prohibitive duties and “water in the tariff”..................................................20
2.3 Aggregation methodology .....................................................................................20
3 AN OVERVIEW OF PROTECTION PATTERNS ACROSS THE WORLD.................................23
3.1 General features of worldwide applied protection.................................................23 3.2 Applied versus MFN tariffs and decomposition by instrument.............................27 3.3 MAcMap vs. other databases.................................................................................28 3.4 Cumulative distribution of tariffs ..........................................................................30
4 CONCLUSION..................................................................................................................32
5 REFERENCES ..................................................................................................................34
6 APPENDICES ...................................................................................................................36
LIST OF WORKING PAPERS RELEASED BY CEPII ...............................................................43
CEPII, Working Paper No. 2004-22
4
A CONSISTENT, AD-VALOREM EQUIVALENT MEASURE OF APPLIED PROTECTION
ACROSS THE WORLD: THE MACMAP-HS6 DATABASE
SUMMARY
At the time of "globalization", simple questions such as the comparison of the level of protection across countries and industries are still hardly satisfactorily answered at the worldwide level. Although a lot of information exists, no well-suited, comprehensive assessment of AVE applied protection across the world is available. This results, in particular, in most assessments of the impact of multilateral trade liberalization being carried out without taking into account specific tariffs, nor trade preferences. The growing complexity of trade policies has thus left negotiators, but also economists and the public debate, without well-suited information about the present state of trade policies, not to speak about their possible impact. This working paper endeavors to contribute filling this gap. Based on a joint effort devoted by the International Trade Centre –ITC– (United Nations Conference on Trade And Development –UNCTAD– & World Trade Organization –WTO–, Geneva) and the Centre d’Etudes Prospectives et d’Informations Internationales –CEPII– (Paris) to systematically collect detailed and exhaustive information on the level of applied trade barriers in the MAcMap database, it proposes and uses a method to compute an exhaustive and consistent ad-valorem equivalent (AVE) measure of applied protection across the world, at the detailed product level. The purpose is not only to provide a measure of border protection, but also to pave the way for well-suited economic analysis of the consequences of trade liberalization, in particular through CGE analysis. This results in the construction of MAcMap-HS6 (version 1), a database providing at the six-digit level of the Harmonized System (HS-6 level, 5,111 products), a set of consistent and exhaustive AVEs of applied border protection across the world in 2001, suitable to analytical purposes. 166 reporting countries are covered, with 208 partners.
In so doing, the main original contributions of MAcMap-HS6 are: (i) the exhaustive coverage of preferential trade arrangements (PTAs) across the world; (ii) the calculation of the AVE of specific duties, acknowledging the differentiated impact of such duties across exporters, depending on their export unit values; (iii) the incorporation of tariff-rate quotas (TRQs) both through the AVE of the resulting protection at the margin, and through the calculation of involved rents; (iv) an original aggregation methodology, using a weighting scheme based on reference groups of countries, and limiting the extent of the endogeneity bias inherent to the standard, import-weighted average protection.
This acknowledgement of the differentiated impact of specific duties, together with the bilateral allocation of TRQs, and most of all the emphasis put on trade preferences, entails a considerable increase in the complexity of the measurement of protection: it means that, even at the most detailed level (HS-6), protection is partner-specific. As opposed to the traditional approach in which protection used to be measured by importing country (reporter) and by product, this requires adding an additional dimension to the analysis, namely the exporting country (partner). For a worldwide database such as MAcMap, this changes radically the complexity of the exercise.
A consistent, ad-valorem equivalent measure of applied protection across the world
5
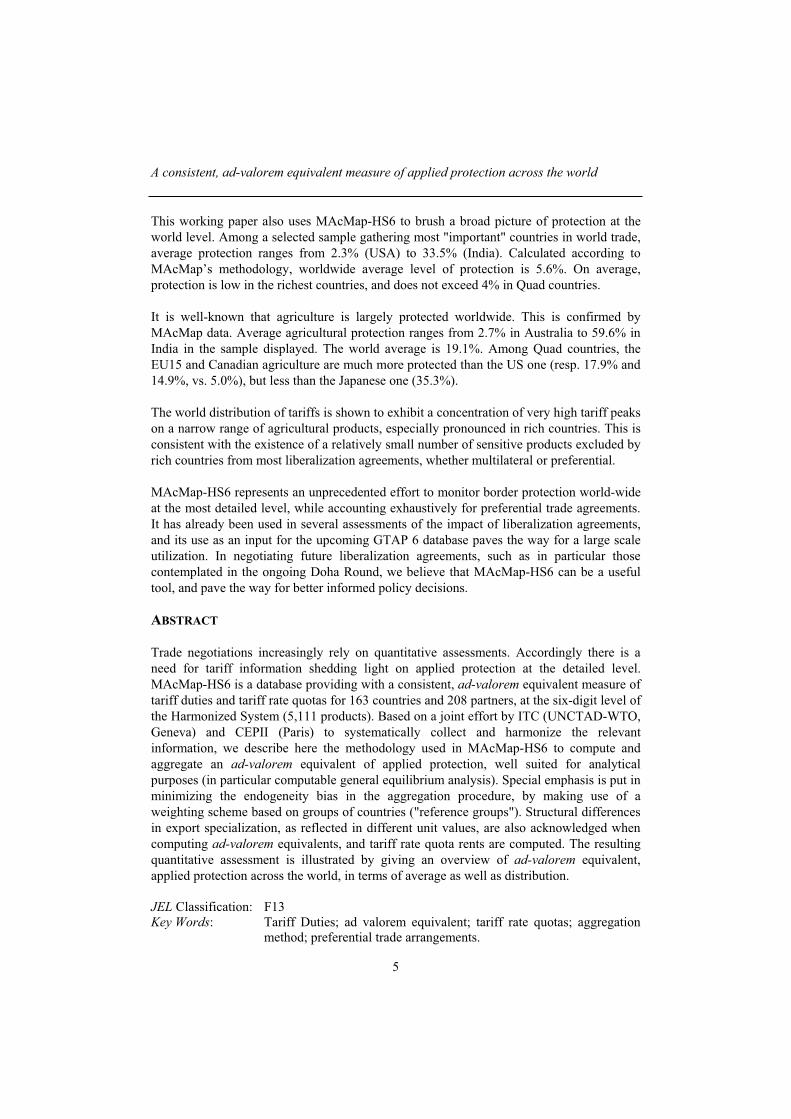
This working paper also uses MAcMap-HS6 to brush a broad picture of protection at the world level. Among a selected sample gathering most "important" countries in world trade, average protection ranges from 2.3% (USA) to 33.5% (India). Calculated according to MAcMap’s methodology, worldwide average level of protection is 5.6%. On average, protection is low in the richest countries, and does not exceed 4% in Quad countries.
It is well-known that agriculture is largely protected worldwide. This is confirmed by MAcMap data. Average agricultural protection ranges from 2.7% in Australia to 59.6% in India in the sample displayed. The world average is 19.1%. Among Quad countries, the EU15 and Canadian agriculture are much more protected than the US one (resp. 17.9% and 14.9%, vs. 5.0%), but less than the Japanese one (35.3%).
The world distribution of tariffs is shown to exhibit a concentration of very high tariff peaks on a narrow range of agricultural products, especially pronounced in rich countries. This is consistent with the existence of a relatively small number of sensitive products excluded by rich countries from most liberalization agreements, whether multilateral or preferential.
MAcMap-HS6 represents an unprecedented effort to monitor border protection world-wide at the most detailed level, while accounting exhaustively for preferential trade agreements. It has already been used in several assessments of the impact of liberalization agreements, and its use as an input for the upcoming GTAP 6 database paves the way for a large scale utilization. In negotiating future liberalization agreements, such as in particular those contemplated in the ongoing Doha Round, we believe that MAcMap-HS6 can be a useful tool, and pave the way for better informed policy decisions.
ABSTRACT
Trade negotiations increasingly rely on quantitative assessments. Accordingly there is a need for tariff information shedding light on applied protection at the detailed level. MAcMap-HS6 is a database providing with a consistent, ad-valorem equivalent measure of tariff duties and tariff rate quotas for 163 countries and 208 partners, at the six-digit level of the Harmonized System (5,111 products). Based on a joint effort by ITC (UNCTAD-WTO, Geneva) and CEPII (Paris) to systematically collect and harmonize the relevant information, we describe here the methodology used in MAcMap-HS6 to compute and aggregate an ad-valorem equivalent of applied protection, well suited for analytical purposes (in particular computable general equilibrium analysis). Special emphasis is put in minimizing the endogeneity bias in the aggregation procedure, by making use of a weighting scheme based on groups of countries ("reference groups"). Structural differences in export specialization, as reflected in different unit values, are also acknowledged when computing ad-valorem equivalents, and tariff rate quota rents are computed. The resulting quantitative assessment is illustrated by giving an overview of ad-valorem equivalent, applied protection across the world, in terms of average as well as distribution.
JEL Classification: F13 Key Words: Tariff Duties; ad valorem equivalent; tariff rate quotas; aggregation
method; preferential trade arrangements.
CEPII, Working Paper No. 2004-22
6
UNE EVALUATION COHERENTE A L'ECHELLE MONDIALE DE L'EQUIVALENT AD
VALOREM DE LA PROTECTION TARIFAIRE APPLIQUEE :
LA BASE MACMAP-HS6
RESUME
A l’heure de la « globalisation », des sujets simples comme la comparaison des niveaux de protection commerciale entre pays et industries sont toujours assez mal traités à un niveau mondial. Bien qu’une grande quantité d’information existe, aucune estimation convenable et complète des équivalents ad valorem de la protection appliquée dans le monde n’est disponible. Cela signifie, en particulier, que la plupart des estimations de l’impact d’une libéralisation multilatérale sont réalisées sans tenir compte des tarifs spécifiques ni des préférences commerciales. Les négociateurs, mais aussi les économistes et le débat public n’ont ainsi pas accès à une information satisfaisante sur la politique commerciale actuelle et sur ses effets, en raison de sa complexité croissante. Ce document de travail s’efforce de contribuer à combler cette lacune. Grâce à l’effort conjoint du Centre du Commerce International – CCI – (Conférence des Nations Unies sur le Commerce Et le Développement – CNUCED – & Organisation Mondiale du Commerce – OMC –, Genève) et du Centre d’Etudes Prospectives et d’Informations Internationales – CEPII – (Paris) pour collecter systématiquement au sein de la base MAcMap l’information détaillée et exhaustive sur le niveau des barrières commerciales appliquées, il propose et utilise une méthode pour calculer une mesure exhaustive et cohérente de l’équivalent ad valorem (EAV) de la protection appliquée à travers le monde, à un niveau détaillé de produits. L’objectif n’est pas seulement de fournir une mesure de la protection à la frontière, mais aussi de tracer la voie vers une analyse économique satisfaisante des conséquences d’une libéralisation commerciale, en particulier au moyen d’une analyse en équilibre général calculable. Cela conduit à la construction de MAcMap-HS6 (version 1), une base fournissant au niveau à six chiffres du Système Harmonisé (niveau SH-6, 5 111 produits), un ensemble d’EAV cohérent et exhaustif de la protection aux frontières dans le monde en 2001, adapté à un objectif analytique. 166 pays déclarant sont couverts, qui commercent avec 208 partenaires.
En procédant de la sorte, les principales contributions originales de MAcMap-HS6 sont : (i) la couverture exhaustive des accords commerciaux préférentiels (ACP) à travers le monde ; (ii) le calcul de l’EAV des droits spécifiques, par une méthode qui reconnaît que l’impact de ces droits est différent par exportateurs, selon la valeur unitaire de leurs exportations ; (iii) l’incorporation des contingents tarifaires (CT) à la fois à travers l’EAV de la protection marginale qui en résulte, et à travers le calcul des rentes induites ; (iv) une méthode d’agrégation originale, utilisant un système de pondération basés sur un groupe de référence pour chaque pays, et limitant l’étendue du biais d’endogénéité que présentent les moyennes pondérées par le commerce effectif.

A consistent, ad-valorem equivalent measure of applied protection across the world
7
Cette reconnaissance de l’impact différentié des droits spécifiques, ainsi que l’allocation bilatérale des contingents tarifaires, et surtout l’accent mis sur les préférences commerciales, occasionne une augmentation considérable de la complexité de la mesure de la protection : cela signifie que, même au niveau le plus détaillé (SH-6), la protection est spécifique au partenaire. Contrairement à l’approche traditionnelle dans laquelle la protection était mesurée par pays importateur (déclarant) et par produit, cela nécessite d’ajouter une dimension supplémentaire à l’analyse, sous la forme du pays exportateur (partenaire). Pour une base mondiale comme MAcMap, cela change complètement la complexité de l’exercice.
Le document de travail utilise aussi MAcMap-HS6 pour brosser un tableau général de la protection au niveau mondial. Au sein d’un échantillon sélectionné regroupant les pays les plus « important » dans le commerce mondial, la protection varie de 2,3 % (Etats-Unis) à 33,5 % (Inde). La protection mondiale moyenne calculée selon la méthodologie MAcMap est de 5,6 %. En moyenne, la protection est faible dans les pays les plus riches, et ne dépasse pas 4 % dans les pays de la Quad.
L’agriculture est connue pour être fortement protégée à travers le monde. Ceci est confirmé par les données de MAcMap. La protection moyenne dans l’agriculture varie de 2,7 % en Australie à 59,6 % en Inde au sein de l’échantillon présenté. La moyenne mondiale est de 19,1 %. Parmi les pays de la Quad, les agricultures de l’UE15 et du Canada sont beaucoup plus protégées que celle des Etats-Unis (resp. 17,9 % et 14,9 %, vs. 5,0 %), mais moins que celle du Japon (35,3 %).
On montre que la distribution mondiale des droits de douane présente une concentration de pics tarifaires très élevés sur un éventail réduit de produits agricoles, un phénomène particulièrement prononcé dans les pays riches. Cela concorde avec l’existence d’un nombre relativement petit de produits sensibles exclus par les pays riches de la plupart des accords de libéralisation, qu’ils soient multilatéraux ou préférentiels.
MAcMap-HS6 représente un effort sans précédent pour examiner la protection à la frontière au niveau mondial et au niveau le plus fin, en tenant compte de tous les accords commerciaux préférentiels. La base a déjà été utilisée dans plusieurs évaluations de l’impact d’accords de libéralisation, et son utilisation comme source pour la base GTAP 6 prépare le terrain pour une utilisation à grande échelle. Dans la négociation d’accords de libéralisation futurs, comme en particulier ceux envisagés dans le cadre du cycle de Doha en cours, nous sommes convaincus que MAcMap-HS6 pourra être un outil utile et permettra de prendre des décisions de politique économique mieux informées.

CEPII, Working Paper No. 2004-22
8
RESUME COURT
MAcMap-HS6 est une base qui fournit une mesure cohérente de l’équivalent ad valorem des droits de douane et des contingents tarifaires pour 163 pays et 208 partenaires, au niveau à six chiffres du Système Harmonisé (5,111 produits). Grâce à l’effort conjoint du CCI (CNUCED-OMC, Genève) et du CEPII (Paris) pour collecter systématiquement et harmoniser l’information pertinente, nous décrivons ici la méthodologie utilisée dans MAcMap-HS6 pour calculer et agréger un équivalent ad valorem de la protection appliquée, bien adapté à des objectifs analytiques (en particulier l’analyse en équilibre général calculable). Un accent particulier a été apporté à la minimisation du biais d’endogénéité au cours de la procédure d’agrégation, par l’utilisation d’un système de pondération basé sur des groupes de pays (« groupes de références »). Les différences structurelles de spécialisation à l’exportation, reflétées par des valeurs unitaires différentes, sont aussi prises en compte au moment de calculer les équivalents ad valorem, et les rentes induites par les contingents tarifaires sont calculées. L’estimation qui en résulte est illustrée par une vue d’ensemble des équivalents ad valorem dans le monde, en termes de moyenne et de distribution.
Classification JEL : F13 Mots-clefs : Droits de douane ; équivalent ad valorem ; contingent tarifaire ;
méthode d'agrégation ; accords préférentiels de commerce.
A consistent, ad-valorem equivalent measure of applied protection across the world
9
A CONSISTENT, AD-VALOREM EQUIVALENT MEASURE OF APPLIED PROTECTION
ACROSS THE WORLD: THE MACMAP-HS6 DATABASE
Antoine Bouët, Yvan Decreux, Lionel Fontagné, Sébastien Jean &David Laborde1
1 INTRODUCTION
Negotiating on something that you do not know with precision, and even more modeling the outcome of this negotiation, are difficult tasks. Surprising as it is, though, this is what is happening in the ongoing Doha Round: at the time of "globalization", it is utterly difficult to measure accurately the magnitude of border protection around the world and consequently to give an accurate estimate of the economic impact of any trade liberalization. The Marrakech agreement admittedly brought some simplifications, in particular by abolishing quantitative trade restrictions. But it let specific tariffs (monetary amounts by physical quantities) still widespread in some sectors (agriculture) and some countries (Switzerland, Japan, Malaysia, Cyprus, European Union…). Worse, it gave birth to new protection instruments, known as tariff rate quotas (TRQs), through which a given amount of imports (allocated according to various possible modes of administration, and frequently on a bilateral basis) can benefit from a lowered tariff rate. At the same time, far from reducing the dispersion of tariff rate, dirty tariffication led to a very strong disparity of tariff levels, and to widespread tariff peaks. As it is well known, the distribution of tariffs matters a lot, both in terms of induced welfare and trade. Lastly, the number of preferential
trade arrangements (PTAs) dramatically increased during the nineties.2 And beside
permanent regional agreements (free trade areas, customs unions…), non-reciprocal trade preferences were often granted by rich countries to developing ones, often for a limited
period of time only.3
Against this background, simple questions such as the comparison of the level of protection across countries and industries are hardly satisfactorily answered at the worldwide level. The growing complexity of trade policies has left negotiators, but also economists and the
1 This article is part of the effort jointly devoted by ITC (UNCTAD-WTO) and CEPII (Paris) to build the
MAcMap database. The authors acknowledge helpful comments and suggestions made by Jaime de Melo on a previous version. They are also grateful to Mondher Mimouni and Xavier Pichot for contributing to MAcMap at the ITC, as well as to Friedrich von Kirchbach, for his fruitful collaboration. They also like to thank Paul Gibson for providing them with the AMAD database on tariff rate quotas. They also benefited from valuable comments and suggestions from many researchers, in particular in the context of the GTAP consortium. Correspondence: [email protected] . The present version of this paper is from September 2005, the first version of this working paper was released in December 2004.
2 216 enforced agreements had been notified to the WTO by January 2006.
3 Another difficulty is the stringency of rules attached to the latter agreements in order to be eligible to these
preferences.
CEPII, Working Paper No. 2004-22
10
public debate, without well-suited information about the present state of trade policies. This article endeavors to contribute filling this gap. Based on a joint effort devoted by the International Trade Centre –ITC– (United Nations Conference on Trade And Development –UNCTAD– & World Trade Organization –WTO–, Geneva) and the Centre d’Etudes Prospectives et d’Informations Internationales –CEPII– (Paris) to systematically collect detailed and exhaustive information on the level of applied trade barriers in the MAcMap database, it proposes and uses a method to compute an exhaustive and consistent ad-
valorem equivalent (AVE) measure of applied protection across the world. The purpose is not only to provide a measure of border protection, but also to pave the way for well-suited economic analysis of the consequences of trade liberalization, in particular through CGE analysis.
The source information on border protection emanates from national customs. It is defined at the tariff line level. The definition of tariff lines varies widely across countries, but it is always based on the six-digit level of the Harmonized System classification (hereafter, HS-6 level). This non-harmonized information is hardly a well-suited basis for a wide-ranging analysis of border protection across the world. In trying to gather the relevant information, UNCTAD's TRade Analysis and INformation System (TRAINS) has played a leading role. As a result from the collection by UNCTAD of information from national custom schedules, it provides with data at the tariff line level about applied tariffs (ad-valorem and specific) and TRQs, as well as import flows by origin for more than 140 countries. However, at least until recently, TRAINS suffered from an incomplete coverage of
preferential agreements4, and did not propose ad-valorem equivalent (AVE) calculations.
5
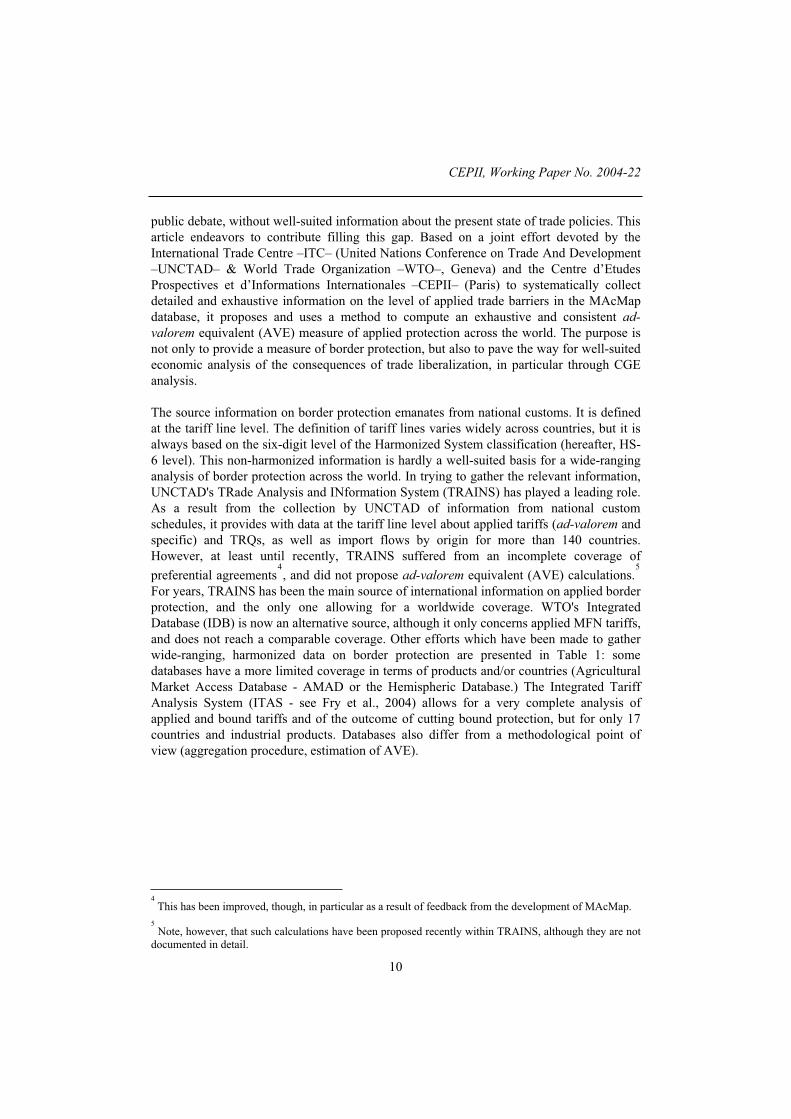
For years, TRAINS has been the main source of international information on applied border protection, and the only one allowing for a worldwide coverage. WTO's Integrated Database (IDB) is now an alternative source, although it only concerns applied MFN tariffs, and does not reach a comparable coverage. Other efforts which have been made to gather wide-ranging, harmonized data on border protection are presented in Table 1: some databases have a more limited coverage in terms of products and/or countries (Agricultural Market Access Database - AMAD or the Hemispheric Database.) The Integrated Tariff Analysis System (ITAS - see Fry et al., 2004) allows for a very complete analysis of applied and bound tariffs and of the outcome of cutting bound protection, but for only 17 countries and industrial products. Databases also differ from a methodological point of view (aggregation procedure, estimation of AVE).
4 This has been improved, though, in particular as a result of feedback from the development of MAcMap.
5 Note, however, that such calculations have been proposed recently within TRAINS, although they are not
documented in detail.
A consistent, ad-valorem equivalent measure of applied protection across the world
11
Table 1: Databases on market access
AMAD Hemispheric database
IDB ITAS MAcMap OECD Trains
Source Agr. and AgriFood Canada, EU
Commission, FAO, OECD, The World Bank, UNCTAD,
USDA - ERS
Inter American Development
Bank
World Trade Organization
Australian Government Productivity Commission
Centre d’Etudes Prospectives et d’Informations Internationales
OECD & UNCTAD
United Nations Conference on
Trade And Development
Time coverage From 1995 to 2001 From 1997 to 2001
From 2000 to 2004
1999 2001 1988, 1993 and 1996
From 1994 to 2001
untry coverage 50 countries American hemisphere
countries (33)
122 reporting countries
17 reporting countries
163 reporting countries/208
partners
14 OECD countries
163 reporting countries in 2001
roduct coverage Agricultural products
(tariff lines level)
Tariff line or HS10, HS8 (HS6
for Canada)
Tariff line level Industrial products 5,111 products (HS6)
5,111 products (HS6)
5,111 products (HS6)
valorem duties Yes Yes Yes Yes Yes yes yes
ecific duties Yes Yes Yes Only 10% of specific duties
included
Yes yes yes
ariff quotas Yes No Yes No Yes Only for three countries (Canada,
Iceland, USA)
yes
nti-dumping No Yes No No Yes No No
nd vs. applied MFN rates
Bound and applied MFN duties
Bound and applied MFN
duties
Bound and applied MFN
duties
Bound and applied MFN duties
Applied duties Bound and applied MFN
duties
Applied duties
Tariff regimes Multilateral (MFN) MFN + all regional
agreements + all preferences
Multilateral (MFN) partial
inform. on trade
preferences
MFN + all regional agreements + all
preferences
MFN + all regional
agreements + all preferences
Multilateral (MFN)
MFN + some regional
agreements + some preferences
Method of aggregation
No average calculated
No average calculated
No average calculated
Simple average, trade-weighted
average
Imports of the reporter’s
reference group from the partner
Simple mean No average calculated
Ad-valorem Equivalent
VE) of specific duties
No AVE calculated, but world prices and
exchange rates included in the
database
When provided by countries
When provided by WTO members
Use of IDB’s AVE when available (10%
of cases)
Specific duties divided by
median unit value of trade flow
originating from exporter’s
Reference Group
By price differentials, for some products
only
No AVE calculated
AVE of tariff quotas
No AVE calculated - When provided by WTO members
- OQTR, IQTR or weighted mean of IQTR and OQTR
according to imports level
OQTR No AVE calculated
Possible simulation of tariff-cutting
formula
No No Yes (under WITS
application)
Yes No No Yes (under WITSapplication)
Thus, although a lot of information existed, no well-suited, comprehensive assessment of AVE applied protection across the world was available. This resulted, in particular, in most assessment of the impact of multilateral trade liberalization being carried out without taking into account specific tariffs, nor trade preferences, even if the GTAP network has done
CEPII, Working Paper No. 2004-22
12
considerable efforts in order to offering a consistent database.6 Gathering such information in a consistent and tractable way has been the first motivation of the MAcMap database. Beyond proper collection and harmonization of information, however, the development of MAcMap also aimed at dealing with the main methodological hurdles encountered when trying to produce tariff data well-suited for large-scale analysis.
A first set of problems has to do with the calculation of the AVEs of specific duties. This requires harmonizing correctly trade and tariff data, and measuring in a robust way the corresponding unit values, both of which are difficult tasks. But the definition of the method itself is also controversial. AVEs based on a worldwide import average, as computed for instance by Gibson et al. (2001), has the advantage of robustness, but it is a strong simplification. Indeed, specific tariffs have a more restrictive impact on unprocessed or low quality goods (see e.g. Feenstra & Boorstein, 1991). This is not a secondary issue, given that vertical specialization of countries along the quality ladder has been shown to be widespread. In addition, poorer countries tend to specialize in lower quality goods (Fontagné & Freudenberg, 1997), so that the corresponding bias is likely to be systematically detrimental to developing countries. While no perfect solution is available, taking into account this peculiarity of specific tariffs is important if one is to gain an accurate understanding of their restrictive impact on trade flows.
It is worth emphasizing that this acknowledgement of the differentiated impact of specific duties, together with the bilateral allocation of TRQs, and most of all the emphasis put on trade preferences, entails a considerable increase in the complexity of the measurement of protection: it means that, even at the most detailed level (HS-6), protection is partner-specific. As opposed to the traditional approach in which protection used to be measured by importing country (reporter) and by product, this requires to add an additional dimension to the analysis, namely the exporting country (partner). For a worldwide database such as MAcMap, this changes radically the complexity of the exercise.
The aggregation procedure is another source of difficulties. While the corresponding questions have been already widely discussed (see e.g. Balassa, 1965; Laird, 1996), there is still no consensus about how to acknowledge the respective importance of products (as well as exporters and importers), without introducing too large biases. The widely used trade-weighted average, in particular, suffers from a well-known endogeneity bias, leading to an understatement of the restrictive impact of tariff duties. While appealing theoretical work has been produced during the last decade on this topic (in particular following Anderson & Bannister, 1992 and Anderson, Bannister & Neary, 1995), including some empirical applications (see e.g. Anderson & Neary, 1999 or Bureau and Salvaticci, 2004), they did not prove tractable for large-scale database. Hence, there is a need to propose a different aggregation procedure, likely to minimize this bias in an easily tractable way. An attempt is proposed here based on simple theoretical underpinnings.
6 None of these two aspects were accounted for in the tariff data included in the GTAP 5 database (see
Dimaranan and McDougall, 2002), which has been the workhorse for founding empirically the assessments of the impact of multilateral liberalisation.
A consistent, ad-valorem equivalent measure of applied protection across the world
13
Basically, MAcMap is a set of files at the tariff line level7 that can be mobilized for several
purposes, noticeably single client studies and interactive web databases for business community realized at ITC. This article deals with one specific application of MAcMap, MAcMapHS6v1, namely the construction of a database at the HS-6 level, intended to provide a set of consistent and exhaustive AVEs of applied border protection across the world (163 reporting countries are covered, for 5,111 products, with 208 partners) in 2001, suitable to analytical purposes. This specific database, is in particular the source for
protection data in the 6th release of the GTAP database.8 This article intends to provide a
complete description of the associated methodology and to use it to brush a broad picture of protection at the world level.
Section 2 proposes a detailed presentation of the methodology utilized in the last release, MAcMapHS6 version 1. Some major improvements have been introduced since the first presentation of MAcMap; this is why these changes are detailed throughout this section. Illustrative results about the worldwide structure of protection are provided in Section 3.
2 COMPUTING A CONSISTENT AND EXHAUSTIVE EQUIVALENT MEASURE OF
APPLIED PROTECTION: METHODOLOGICAL CHOICES IN MACMAPHS6
As outlined above, the data about applied protection is scattered and heterogeneous. The first step when tackling protection measurement is thus to collect and harmonize information. In itself, this is a huge task, when one aims at characterizing protection for all reporting countries available, at the HS-6 level. It is even more so, as soon as protection is understood to be partner-specific, as already emphasized above. Noteworthily, even this early stage requires a number of choices, since there is no unique or obvious way to handle the data. Once this is done, the construction of the database mainly involves computing
AVEs, and defining an appropriate aggregation procedure.9
7 Mondher Mimouni is in charge of co-ordinating the compilation of this primary data on behalf of ITC,
UNCTAD and WTO.
8 The documentation of GTAP 6 is forthcoming. See Dimaranan and McDougall (2002) for the
documentation of version 5.The GTAP version of the database is freely available on the CEPII website ( http://www.cepii.fr/francgraph/bdd/macmap.htm ) as well as alternative aggregations. More information is available on the website about the various versions of the database distribution and their updates.
9 For the sake of simplicity, we will refer in the following to MAcMap instead of MAcMapHS6v1.
CEPII, Working Paper No. 2004-22
14
2.1 Collecting and harmonizing information
For each importing country, information on the various instruments of protection at the border (ad-valorem tariffs, special tariffs, quotas, etc.) is maintained in the MAcMap database at the most disaggregated level possible: the tariff line level. In order to stick to the bilateral option, unilateral preferences and regional agreements are exhaustively documented. This is a rare feature among worldwide databases on border protection (see table 1).
Protection data in the MAcMap database originates from the source files of TRAINS, from countries notifications to the WTO, from AMAD, and from national custom information (reported to UNCTAD, or directly to ITC). Occasionally, this information is completed by other relevant sources: administrations, statistical institutes, international organisations, websites of regional agreements… Concerning antidumping duties, the information is drawn from notifications of member countries to the WTO. This combined information characterizes the trade policy applied by 165 countries to 208 exporting partners. It concerns tariffs (ad-valorem, specific, mixed, compound and antidumping duties), and
tariff quotas.10
This protection data is generally available at the tariff line level, but no international harmonization of classifications exists beyond the HS6 level. Since HS6 is also, for most countries, the most detailed classification for which foreign trade statistics are available, this classification (more specifically, its revision 1, of 1996) has been adopted to put together all data into a database tractable for analytical purposes.
Trade data are sourced from BACI.11
Based on COMTRADE, BACI includes a harmonization of classifications, a reconciliation of mirror declarations, and a treatment of unit values, in order to make them comparable and check their consistency. This results in a harmonized trade database at the HS6 level.
2.2 Calculating AVEs
The source information put together concerns various instruments, which cannot be directly compared or summed, and which are not all readily usable in large-scale modeling exercises. The natural solution to overcome these problems and to make the database fully operative for analytical purposes is to compute AVEs of each instrument.
10Ad valorem equivalents of prohibitions were also taken into account in previous releases. Given their very
limited number, however, this did not make significant changes.
11 BACI is the French acronym for Base de données pour l’Analyse du Commerce International. For further
details, see: http://www.cepii.fr/anglaisgraph/bdd/baci/baci.pdf
A consistent, ad-valorem equivalent measure of applied protection across the world
15
2.2.1 Specific tariffs
Specific tariffs were converted in AVE terms by dividing the duty by a unit value (UV).12
The whole problem lies in the choice of the UV, and this raises important issues, both from a statistical and from a theoretical point of view.
Theoretically, specific tariffs have a more restrictive impact on unprocessed or low quality goods (see e.g. Feenstra and Boorstein, 1991). Arguably, the HS6 level already offers a significant product breakdown, allowing product heterogeneity to be relatively limited within each classification item. Still, large quality differences remain. As a matter of fact, following Abd-El-Rahman (1991), several empirical works have shown that, even at a far more detailed level of classification (Combined Nomenclature, 10 digits, including more than 10,000 products), unit values differences are able to reveal quality differences. Large-scale, systematic analyses have even shown that the corresponding vertical specialization is among the most salient features of trade between European countries (Fontagné, Freudenberg & Péridy, 1997; Greenaway and Torstensson, 2001). Also based on a very detailed analysis of US imports, Schott (2004) emphasizes the importance of "within-product" specialization, i.e. vertical differentiation along the quality ladder, as revealed by UV differences. Schott shows that "UVs within products vary systematically with exporter relative factor endowments and exporter production techniques" (ibid., p. 647.)
This is not a secondary issue, given that vertical specialization of countries along the quality ladder has been shown to be widespread, and that poorer countries tend to specialise in lower quality goods. It means that the restrictive impact of specific tariffs may vary substantially across trade partners, depending on their quality specialization, and that their impact is likely to be systematically stronger on imports from developing countries.
From a statistical point of view, using bilateral UVs might seem appealing because it is fully consistent with the amount of tariff receipts collected, and because it allows the quality specialization of the corresponding trade flow to be taken into account. However, it is flawed with lack of robustness, thus introducing significant variance across AVE
protection faced by different partners in the same market, often to a surprising extent.13
It is due in many instances to measurement errors, or even reporting errors (errors in the physical units reported, for instance). It also stems from the fact that small bilateral flows are not always representative, and are more prone to exhibit out-of-range UVs. In addition,
it can only be implemented as such when imports did take place.14
12 Alternative methods include an estimation based on price wedges, that is hardly tractable at the level of
detail and coverage of this database. The "revenue" method, consisting in dividing tariff revenues by the value of imports, in addition to being difficult to implement, is clearly unfitted in the presence of preferential agreements (see e.g. WTO, 2003, for a discussion).
13 This method has been used in previous releases of MAcMap, and its use for analytical purposes proved to
suffer from insufficient robustness.
14 Although this does not prevent from choosing an alternative rule when no imports took place.
CEPII, Working Paper No. 2004-22
16
Computing AVEs based on a worldwide import average, as for instance Gibson et al. (2001), is appealing in terms of robustness, but it completely disregards the question of quality differences.
Hence the choice of UVs must fulfil two purposes: reflecting the different restrictive impact of specific tariff according to the vertical specialization of the trade partners, exhibiting not excessive volatility. This need for an intermediate approach has led to base AVE calculations in MAcMap, on the median unit value of world-wide exports originating from a reference group the exporter belongs to. Each reporting country is affected to a reference group of similar countries. Reference groups are not only mobilized for the calculation of AVE of specific tariffs, but also for the purpose of aggregating tariffs (see section 2.3). These groups are defined on the basis of a hierarchical clustering analysis based on GDP
per capita (in terms of PPP) and trade openness15
. The five groups constituted as a result of this procedure can be loosely labeled as follows: (1) richest countries; (2) high openness, middle income countries; (3) low openness, middle income countries; (4) high openness, low income countries; (5) low openness, low income countries. The full set of countries and reference groups is provided in Appendix A1.
More specifically, this ERGUV (Exporter's Reference Group Unit Value) is calculated using "weighted" medians, obtained by assuming that each UV is repeated as many times as
the underlying trade flow contains dollars.16
For the sake of robustness, UVs are computed based on three-year-average trade flows (across the 2000-2002 period). In addition, a filter rule is used. Any ratio of ERGUVs to the world median unit value outside the bracket [1/3 ;
3] is truncated to the top or bottom limit.17
Moreover, a sequential procedure is used to fill missing values for reference groups: any blank is substituted by the value of the closer reference group.
Using this ERGUV offers four advantages:
(i) the differences in unit values across countries, linked in particular to different products quality, is accounted for;
(ii) the endogeneity bias (there is an incentive to alter product quality in response to a specific tariff) is lessened compared to a bilateral unit value, since the value is calculated based on worldwide exports;
15 It is a major change from the first release of MAcMap, in which reference groups were based on an
arbitrary classification (GDP PPP per capita).
16 Using traded quantities as weights instead of trade flows could appear more consistent, but from a
statistical point of view, the distribution of trade flows is more robust and less sensitive to measurement errors.
17 This is different from the method of filtering UVs used in previous releases, in which the unit value of
the reference group was used instead.
A consistent, ad-valorem equivalent measure of applied protection across the world
17
(iii) more importantly, ERGUVs are more robust to measurement errors than BUVs: due to the use of median, outliers do not influence strongly the result, in contrast to a calculation based on the average.
On the one hand, one drawback with the use of ERGUV is that some information is lost relative to differences in product quality at the bilateral level. On the other hand, this quality information is only useful insofar as it is structural in nature, in which case we would expect it to remain relatively constant across reference groups (if not, it is likely that these differences are endogenous to protection). In particular, if unit values differ because of an exporter’s cost-competitiveness, and not because of quality-related factors, then there is no point in computing a different AVE.
2.2.2 Mixed and compound tariffs
Mixed tariffs, i.e. tariffs involving a choice (a maximum or a minimum operator) between various terms raise the question of the term to be chosen. This choice is made without any calculation, using the following rules:
(a) when the tariff is defined as an ad-valorem base tariff, with in addition a cap and a floor (which are defined in specific terms), the base tariff is retained. If the base tariff is in specific terms and the cap and the floor are ad-valorem, a simple average of the two bounds is retained. This prevents from adding any additional noise through AVE calculation;
(b) when the tariff involves choosing between two terms, priority is given to ad-valorem
tariffs18
for the same reason as previously;
(c) when the tariff is a choice between two compound tariffs, the second one is ignored. Additional elements are ignored.
2.2.3 Tariff rate quotas
When trying to summarize and harmonize the information about border protection, TRQs originate a number of problems. Due to their intrinsic nature, they cannot be perfectly summarized through an AVE, hence the question about the right way to handle them in multi-country, multi-product databases and models (see e.g. IATRC, 2001, Liapis and Blitz, 2001). Since TRQs are defined at very different levels of aggregation (from HS-4 to tariff line), their treatment must include a consistent (dis-)aggregation procedure. Keeping the basic information about IQTR, OQTR and quota as such, for instance, is not consistent with aggregation: the average IQTR and OQTR, combined with the sum of quotas, do not describe consistently the aggregate impact of various TRQs. Finally, another requirement is that the information produced could be conveniently combined with the tariff data, both for descriptive and statistical matters, as well as for incorporation in CGE analyses.
18 This means that if the tariff is the maximum between a compound tariff (the sum of a specific and an ad
valorem tariff) and an ad valorem tariff, only the second term, i.e. the ad valorem tariff, is taken into account.
CEPII, Working Paper No. 2004-22
18
The methodology has been radically changed in MAcMap-HS6v1, based on the idea that the calculation should reflect the marginal level of protection, as well as the rents involved,
on a bilateral basis.19
Data on tariff quotas mainly comes from the AMAD database20
. The available information is: reporter, quota identification, product coverage, quota, imports, allocation of quotas,
inside tariff, outside tariff21
.
A fill rate is first computed for each TRQ, as the ratio of imports to the size of the quota
itself.22
As soon as a quota involves a specified bilateral allocation, this fill rate is computed separately for each (group of) partner(s) which is allocated a separate quota. The shadow tariff is then defined as the ad-valorem tariff that would lead to the same level of imports as is observed under the tariff rate quota. Three market regimes are considered, depending on the level of the fill rate:
0 – If the fill rate is less than 90% (quota not binding), the inside quota tariff rate is chosen as the shadow rate.
1 – In the (90%,99%) range (quota assumed to be binding23
, OQTR prohibitive), a simple arithmetic average is used (except in a few cases where external information allows a better guess to be made).
2 – If it is higher than 99% (quota binding, OQTR not prohibitive), the shadow rate is equal
to the outside quota tariff rate (OQTR).24
19 In previous releases of MAcMap, the AVE of tariff rate quotas (TRQs) was calculated as a trade-
weighted average of inside- and outside-quota tariff rates. This method proved to understate significantly the real level of protection implied by TRQs. When out-of-quota imports are limited, in particular, it results in an AVE close to the inside-quota tariff rate (IQTR), while in fact this reflects the very high protection resulting from a high outside-quota tariff rate (OQTR).
20 Thanks to Paul Gibson, for giving us these data.
21 Ad valorem equivalents of specific tariffs and of mixed tariffs (inside or outside the quotas) are calculated
according to the same methodology as tariff barriers.
22 This fill rate is thus not restricted to being inferior or equal to one.
23 The quota is assumed to be binding as soon as the fill rate exceeds 90%, since administration methods or
other reasons might well prevent a small share of the quota from being used, even though the quota is actually binding.
24 An apparently more logical approach would lead to chose the minimum of the outside rate and the
applied rate. Nevertheless, due to the occurrence of tariff rate quotas on lines with tariff peaks within the HS6 position for which the applied tariff is defined, the difference between the inside rate and the minimum of the applied rate (at HS6 level) and the outside rate will poorly reflect the tariff gap that generates the rents. As outside rates and inside ones are defined at the same level, the chosen solution appears to be better.
A consistent, ad-valorem equivalent measure of applied protection across the world
19
In the case of missing data about the quota level and its fill rate, regime 2 is assumed but
the rent is set to zero25
.
In the AMAD database, tariff quotas are sometimes defined at the HS4 level (about 30% of cases). In this situation, the applied rate, as defined by MAcMap, is used at the HS6 level.
Finally the tariff quota database contains ten variables: 1) HS6 2) Reporter 3) Partner 4) IQTR (ad-valorem and specific components) 5) OQTR (ad-valorem and specific components) 6) Quantity allocated to the trading partner by the reporter (actual or estimated if the
quota is defined at the HS4 level or if the quota is not country specific) 7) Market regime (0,1,2) 8) Unit value 9) Trade flows
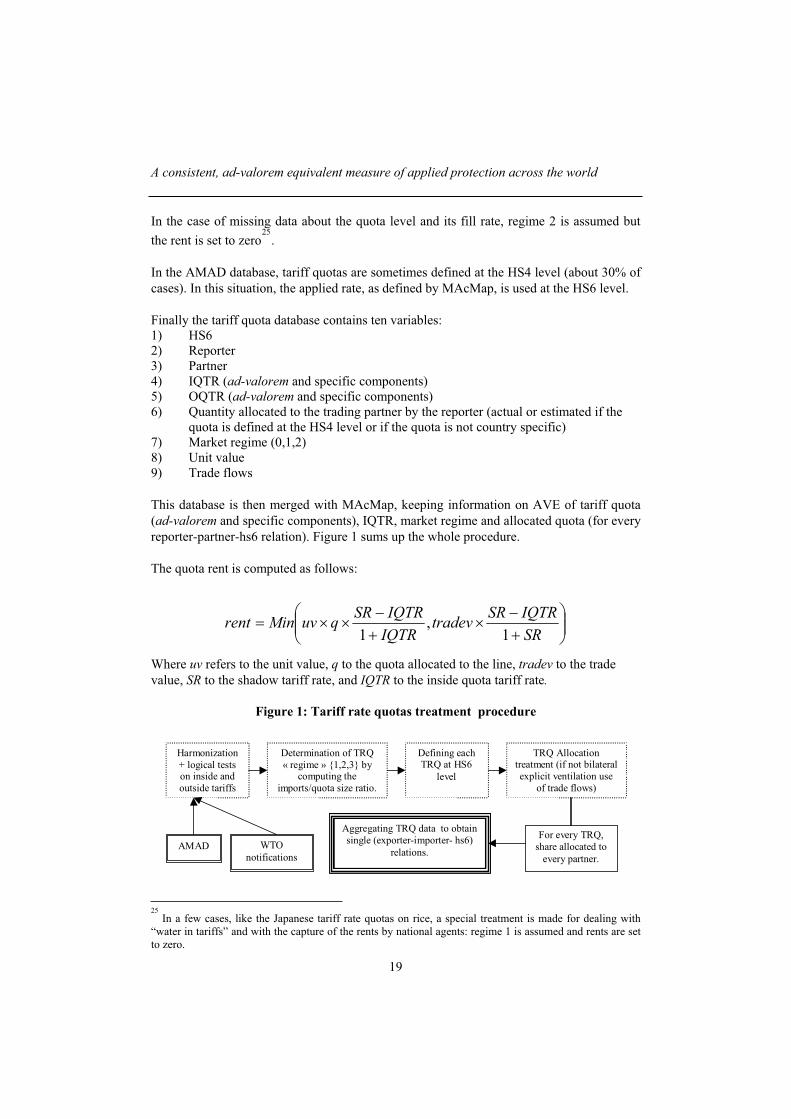
This database is then merged with MAcMap, keeping information on AVE of tariff quota (ad-valorem and specific components), IQTR, market regime and allocated quota (for every reporter-partner-hs6 relation). Figure 1 sums up the whole procedure.
The quota rent is computed as follows:
SR
IQTRSRtradev
IQTR
IQTRSRquvMinrent
1,
1
Where uv refers to the unit value, q to the quota allocated to the line, tradev to the trade value, SR to the shadow tariff rate, and IQTR to the inside quota tariff rate.
Figure 1: Tariff rate quotas treatment procedure
AMAD WTOnotifications
Harmonization+ logical testson inside andoutside tariffs
Defining eachTRQ at HS6
level
TRQ Allocationtreatment (if not bilateralexplicit ventilation use
of trade flows)
Aggregating TRQ data to obtainsingle (exporter-importer- hs6)
relations.
For every TRQ,share allocated to
every partner.
Determination of TRQ« regime » {1,2,3} by
computing theimports/quota size ratio.
25
In a few cases, like the Japanese tariff rate quotas on rice, a special treatment is made for dealing with “water in tariffs” and with the capture of the rents by national agents: regime 1 is assumed and rents are set to zero.
CEPII, Working Paper No. 2004-22
20
2.2.4 Prohibitive duties and “water in the tariff”
The presence of prohibitive tariffs is problematic when calculating AVEs with a view of using them for a CGE analysis. Indeed, prohibitive tariffs are seldom exactly equal to the lowest tariff that would drive import demand down to zero. Generally, there is “water in
the tariff”, meaning that actual tariffs exceed this lowest level. This implies that a small tariff cut would not lead to any change in the corresponding trade flow. This is misleading for analytical purposes, since the study of the consequences of trade liberalization generally relies on the assumption that cutting tariffs systematically increases import demand. When the tariff is really prohibitive (i.e., initial imports are zero), the problem is of a specific nature, in the sense that a standard CGE model cannot give any insight about the impact of liberalization: it needs to use initial imports as a basis for calibrating the import demand function (or the share coefficient of imports in the utility function.)
But initial demand is generally not zero in such analysis, for two reasons. Firstly, while in theory, by definition, there is no import for a product protected by a prohibitive tariff, in practice, non-zero trade flows are frequently recorded, even in presence of a tariff set at a prohibitive level. It results from the existence of very specific niches (within a given tariff line), or of the behavior of very specific consumers. However, these imports are generally very limited, they are not representative of the whole demand for the product, and their price responsiveness is almost zero (otherwise, this demand would not exist, given the initial level of the tariff.)
Secondly, CGE analysis does not use to be carried out at a very detailed level. Every sector aggregates a number of products. If one product is protected by a prohibitive tariff, then it will probably be aggregated with other products, with lower protection and significant initial imports. The AVE tariff duty calculated for the prohibitive tariff will then enter the average tariff computed for the sector if, as it is the case in MAcMap, this average is not import-weighted.
In both cases, this means that the presence of “water in the tariff” would lead to overstate the impact of a tariff cut. Correcting properly this bias would require removing the water in the tariff, i.e. replacing any prohibitive tariff by the lowest prohibitive tariff duty for the product concerned. This is far beyond the scope of this database. Therefore, we take the approach of establishing an upper limit to the AVE in the model starting at the HS6 level. This upper limit is set to 1,000% for the sum of all instruments. Practically, this upper bound is not applied in the source database, but it is used as a preliminary stage for any aggregation intended to feed a CGE model. In particular, it is applied when building the MAcMap for GTAP database.
2.3 Aggregation methodology
The most widespread methodology to aggregate tariffs is the import-weighted average. While easily calculated, this method suffers from well-known flaws, in particular because, everything being equal, the higher the tariff, the lower the import flow (in a proportion depending on the price-elasticity of import demand).
A consistent, ad-valorem equivalent measure of applied protection across the world
21
There is no obvious solution to address this issue. Simple averages are attractive in terms of ease of computation, but do not rest on any convincing foundation.. Using instead world imports as a weighting scheme, as proposed by Leamer (1974), avoids this endogeneity bias, but this measure fails to account for each economy's specificity. Other weighting schemes, like production or consumption shares, are not applicable at a detailed level, due to lack of data.
To sum up, existing aggregation methods include on the one hand atheoretical measures, largely recognized as significantly flawed and potentially misleading. On the other hand, theoretically based measures exist, but they are not applicable for a large-scale database such as MAcMap. Feenstra's approximation is an exception, but it relies on a hardly satisfactory assumption about import demand function. In addition, it is contingent on estimated Hicksian elasticities, which raises question as to the robustness of the aggregate measure computed. Finally, Feenstra's approximation concerns the TRI, a welfare-equivalent measure, while Anderson and Neary (2001) convincingly argue that an import-equivalent measure fits more closely the concerns of trade policy makers.
Against this background, our approach in choosing the aggregation methodology to be used as a tool for a systematic and large-scale analysis of protection is pragmatic. The methodology should avoid or minimize the endogeneity bias, while taking into account each economy's specificity and relying on available data at the detailed level of the nomenclature. For the sake of robustness, we would also like to avoid using estimated parameters in the aggregation. Finally, the methodology should be applicable on a large scale basis.
Based on these pre-requirements, the premise of our methodology is that an average weighted by free-trade imports is a suitable proxy for the Mercantilist Trade Restrictiveness Index (MTRI) proposed by Anderson and Neary (2001): see a simple theoretical justification in appendix 1.
However there is no possibility to infer the true free-trade imports from actual imports. Hypothesis could be made, like a constant elasticity of imports, but it is questionable that such assumptions allow to compute free-trade imports when protection is very high. Furthermore, the protection system is too complex to be summarized by a single measure. Some product may face a high marginal protection whereas a large quantity of goods is traded. It is therefore more cautious to base the weighting scheme on actual data. A compromise between the Leamer proposal to use world imports as a weighting scheme and using actual trade is to use imports from a reference group (RG) of similar countries. This is not a perfect solution since some products may be more protected than others in numerous countries. However it allows to account for prohibitive levels of protection.
A clustering based on PPP GDP per capita and trade openness allowed to identify 5 groups of similar countries (the list of countries is provided in appendix 2). Total imports by a group has to be normalized to account for the size of each country.
CEPII, Working Paper No. 2004-22
22
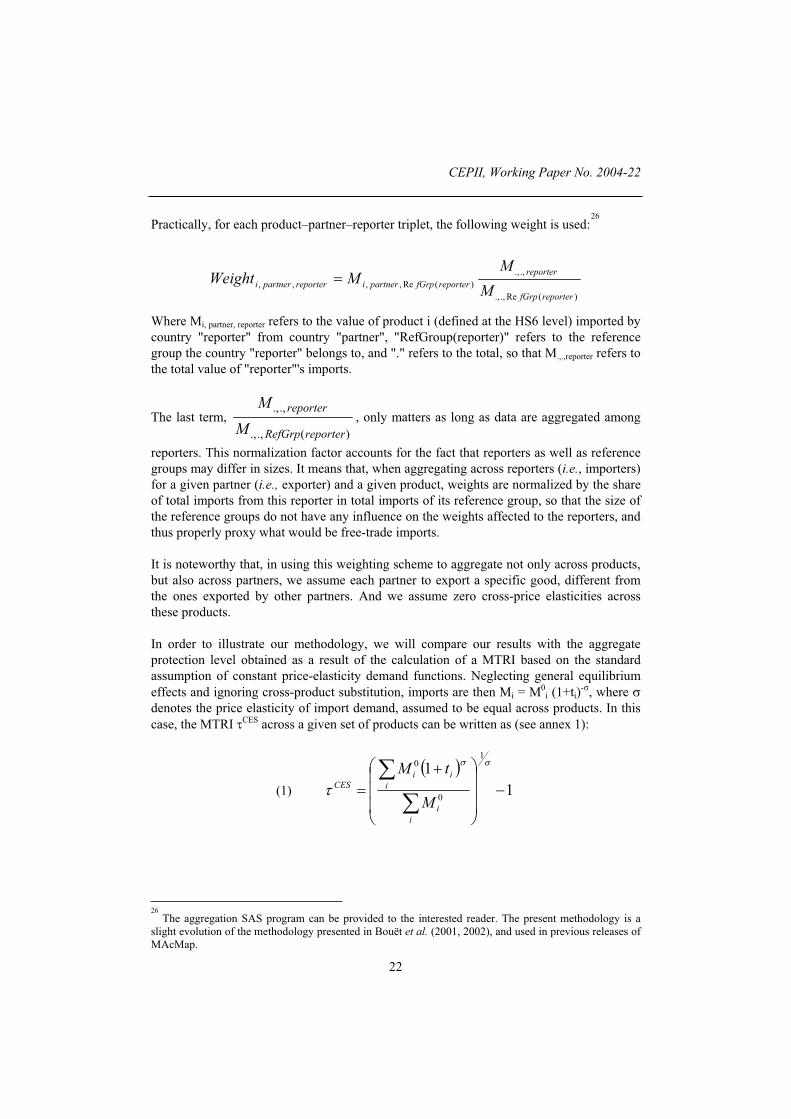
Practically, for each product–partner–reporter triplet, the following weight is used:26
)(Re.,.,
.,.,
)(Re,,,,
reporterfGrp
reporter
reporterfGrppartnerireporterpartneriM
MMWeight
Where Mi, partner, reporter refers to the value of product i (defined at the HS6 level) imported by country "reporter" from country "partner", "RefGroup(reporter)" refers to the reference group the country "reporter" belongs to, and "." refers to the total, so that M.,.,reporter refers to the total value of "reporter"'s imports.
The last term, )(.,.,
.,.,
reporterRefGrp
reporter
M
M, only matters as long as data are aggregated among
reporters. This normalization factor accounts for the fact that reporters as well as reference groups may differ in sizes. It means that, when aggregating across reporters (i.e., importers) for a given partner (i.e., exporter) and a given product, weights are normalized by the share of total imports from this reporter in total imports of its reference group, so that the size of the reference groups do not have any influence on the weights affected to the reporters, and thus properly proxy what would be free-trade imports.
It is noteworthy that, in using this weighting scheme to aggregate not only across products, but also across partners, we assume each partner to export a specific good, different from the ones exported by other partners. And we assume zero cross-price elasticities across these products.
In order to illustrate our methodology, we will compare our results with the aggregate protection level obtained as a result of the calculation of a MTRI based on the standard assumption of constant price-elasticity demand functions. Neglecting general equilibrium effects and ignoring cross-product substitution, imports are then Mi = M0
i (1+ti)- , where
denotes the price elasticity of import demand, assumed to be equal across products. In this case, the MTRI CES across a given set of products can be written as (see annex 1):
(1) 1
11
0
0
i
i
i
iiCES
M
tM
26
The aggregation SAS program can be provided to the interested reader. The present methodology is a slight evolution of the methodology presented in Bouët et al. (2001, 2002), and used in previous releases of MAcMap.
A consistent, ad-valorem equivalent measure of applied protection across the world
23
This calculation overlooks product differences in terms of price-elasticity of import demand, but this is necessary in order to keep large-scale calculations tractable. The value of to be used i calculations is debatable. For the sake of illustration, in addition to unity (in this case, CES is actually the import-weighted average), we will display the results of calculations for =3 and =6.
3 AN OVERVIEW OF PROTECTION PATTERNS ACROSS THE WORLD
The above-described database makes it possible to measure border protection across the world in consistent terms, accounting for ad-valorem and specific tariffs, as well as TRQs, and taking exhaustively into account preferential trade arrangements (PTAs). This section aims at brushing a broad picture of applied protection. General features of worldwide applied protection are first described. Differences between applied and MFN tariffs, and the importance of each type of instrument are then detailed. MAcMap figures are compared to the GTAP5 database on market access. Finally, informative figures on cumulative distribution of tariffs are exposed.
3.1 General features of worldwide applied protection
The first column of Table 2 reports the aggregate level of protection across all products, as calculated with our Reference Group (RG) methodology, for selected GTAP6 importing
regions.27
Among these selected countries, protection ranges from 2.3% (USA) to 33.5% (India). Calculated according to RG methodology, worldwide average level of protection is 5.6%. On average, protection is low in the richest countries, and does not exceed 4% in Quad countries.
It is well-known that agriculture is largely protected worldwide. This is confirmed by MAcMap data, as highlighted in the second column of Table 2. Average agricultural protection ranges from 2.7% in Australia to 59.6% in India in the sample displayed. The world average is 19.1%. Among Quad countries, the EU15 and Canadian agriculture are much more protected than the US one (resp. 17.9% and 14.9% vs 5.0%), but less than the Japanese one (35.3%).
Columns 3 and 4 indicate average protection for manufactures (except textile/apparel) and for textile/apparel. Manufacturing products outside textile and apparel are the less protected sector in average (4.2%). The contrast with agricultural products is especially striking in rich countries, in particular in Canada, the European Union, Japan, Korea and Switzerland. Trade in textile and clothing goods remains significantly restricted in most importing regions. Market access is severely restricted even in countries known for their comparative advantage in this activity (Bangladesh, China, India, Morocco, Tunisia). Protection in textile and apparel also remains large in Northern America, as compared to the EU (Canada:10.8%; USA: 9.4%; EU15: 5.7%)
27 Regions have been selected in order to have a representative and diversified set of situations. The
corresponding information is available for all countries included in MAcMap on http://www.cepii.fr/anglaisgraph/bdd/detailed_tables.xls

CEPII, Working Paper No. 2004-22
24
Table 2: Protection applied by country (2001)
Total Agric. Manuf. Tex-Wea LdC Dvping Co. Dvped Co.World 5.6% 19.1% 4.2% 10.5% 4.9% 5.3% 5.7%Argentina 12.6% 12.0% 12.4% 18.3% 7.7% 10.8% 13.1%Australia 5.1% 2.7% 4.9% 14.2% 7.9% 5.6% 4.9%Bangladesh 16.9% 20.9% 15.2% 29.7% 16.7% 20.2% 14.8%Brazil 11.8% 11.0% 11.4% 18.1% 2.4% 9.4% 12.8%Canada 3.4% 14.9% 2.1% 10.8% 5.8% 3.1% 3.5%China 14.1% 25.0% 12.7% 20.4% 3.6% 12.9% 14.7%European Union (15) 3.1% 17.9% 2.0% 5.7% 0.8% 2.7% 3.5%India 33.5% 59.6% 29.9% 29.5% 28.3% 35.4% 32.5%Japan 3.9% 35.3% 0.9% 6.8% 1.6% 3.9% 3.9%Korea 9.2% 53.8% 5.5% 10.3% 10.1% 9.9% 8.9%Madagascar 4.4% 5.5% 4.1% 4.7% 2.2% 4.6% 4.4%Mexico 11.0% 28.2% 8.9% 14.5% 15.9% 17.9% 8.9%Morocco 20.9% 40.1% 17.9% 33.9% 17.4% 25.0% 19.3%Mozambique 9.9% 13.4% 8.3% 21.6% 10.0% 11.4% 9.1%South Africa 8.4% 19.2% 6.5% 22.5% 5.8% 10.7% 7.7%Switzerland 4.3% 43.3% 1.3% 4.0% 0.6% 4.0% 4.5%Thailand 12.6% 28.0% 10.7% 18.1% 4.4% 12.8% 12.6%Tunisia 20.3% 53.3% 16.5% 26.0% 9.4% 24.2% 18.9%Turkey 6.0% 38.0% 2.6% 8.9% 3.3% 9.1% 4.9%United States of America 2.3% 5.0% 1.7% 9.4% 5.1% 2.4% 2.3%Vietnam 14.4% 26.0% 11.1% 31.1% 15.0% 16.6% 13.0%
By sector By exporter
Source: MacMap.
Columns 5 to 7 of Table 2 point out aggregate levels of each zone’s protection, by exporters’ group (developed countries, intermediate countries, Least Developed Countries – LDCs.) Several countries are granting LDCs preferential regimes, and this is indeed reflected in freer market access for LDCs in the European Union, Japan, and Switzerland. On the contrary, LDCs face higher average duties than other exporters in the USA, in Canada and in Australia, despite the specific preferential schemes they offer to LDCs. This
is due to the product composition of LDCs exports,28
and/or to higher ad-valorem
equivalents of specific tariffs (since LDCs generally exhibit low export unit values). In the
case of USA, for 2001, AGOA is only conceded to a few LDCs29
.
The database can also be used in order to shed light on the average protection faced by a country’s exports. This is illustrated in Table 3 for the same sample of countries. The corresponding figures are the result of the specialization of countries and of the preferential regimes they benefit from, if any. Argentina (13.5%) and Brazil (11.0%), as a result of their large specialization on agricultural products, do face the highest level of protection among
28
Many LDCs are specialised in highly protected product worldwide, in particular in agriculture and in textile and clothing.
29 A decomposition of applied protection by sectors and partners groups is available on the CEPII website
(http://www.cepii.fr/anglaisgraph/bdd/detailed_tables.xls
A consistent, ad-valorem equivalent measure of applied protection across the world
25
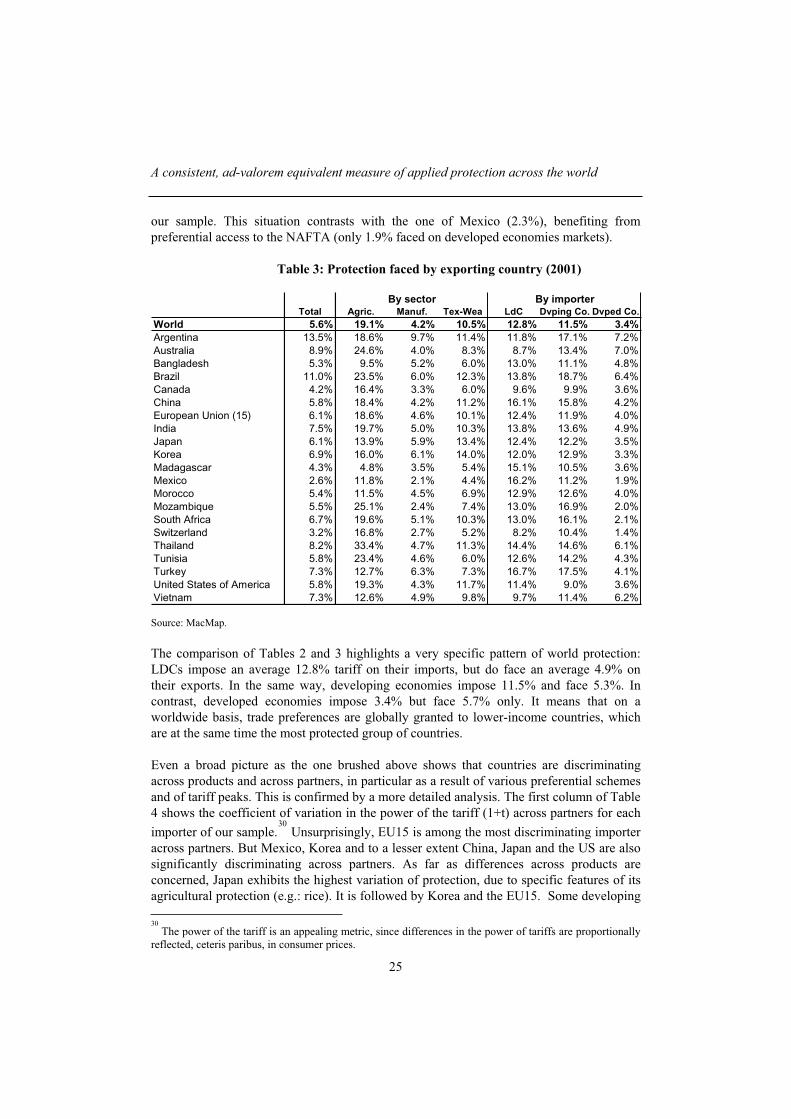
our sample. This situation contrasts with the one of Mexico (2.3%), benefiting from preferential access to the NAFTA (only 1.9% faced on developed economies markets).
Table 3: Protection faced by exporting country (2001)
Total Agric. Manuf. Tex-Wea LdC Dvping Co. Dvped Co.World 5.6% 19.1% 4.2% 10.5% 12.8% 11.5% 3.4%Argentina 13.5% 18.6% 9.7% 11.4% 11.8% 17.1% 7.2%Australia 8.9% 24.6% 4.0% 8.3% 8.7% 13.4% 7.0%Bangladesh 5.3% 9.5% 5.2% 6.0% 13.0% 11.1% 4.8%Brazil 11.0% 23.5% 6.0% 12.3% 13.8% 18.7% 6.4%Canada 4.2% 16.4% 3.3% 6.0% 9.6% 9.9% 3.6%China 5.8% 18.4% 4.2% 11.2% 16.1% 15.8% 4.2%European Union (15) 6.1% 18.6% 4.6% 10.1% 12.4% 11.9% 4.0%India 7.5% 19.7% 5.0% 10.3% 13.8% 13.6% 4.9%Japan 6.1% 13.9% 5.9% 13.4% 12.4% 12.2% 3.5%Korea 6.9% 16.0% 6.1% 14.0% 12.0% 12.9% 3.3%Madagascar 4.3% 4.8% 3.5% 5.4% 15.1% 10.5% 3.6%Mexico 2.6% 11.8% 2.1% 4.4% 16.2% 11.2% 1.9%Morocco 5.4% 11.5% 4.5% 6.9% 12.9% 12.6% 4.0%Mozambique 5.5% 25.1% 2.4% 7.4% 13.0% 16.9% 2.0%South Africa 6.7% 19.6% 5.1% 10.3% 13.0% 16.1% 2.1%Switzerland 3.2% 16.8% 2.7% 5.2% 8.2% 10.4% 1.4%Thailand 8.2% 33.4% 4.7% 11.3% 14.4% 14.6% 6.1%Tunisia 5.8% 23.4% 4.6% 6.0% 12.6% 14.2% 4.3%Turkey 7.3% 12.7% 6.3% 7.3% 16.7% 17.5% 4.1%United States of America 5.8% 19.3% 4.3% 11.7% 11.4% 9.0% 3.6%Vietnam 7.3% 12.6% 4.9% 9.8% 9.7% 11.4% 6.2%
By sector By importer
Source: MacMap.
The comparison of Tables 2 and 3 highlights a very specific pattern of world protection: LDCs impose an average 12.8% tariff on their imports, but do face an average 4.9% on their exports. In the same way, developing economies impose 11.5% and face 5.3%. In contrast, developed economies impose 3.4% but face 5.7% only. It means that on a worldwide basis, trade preferences are globally granted to lower-income countries, which are at the same time the most protected group of countries.
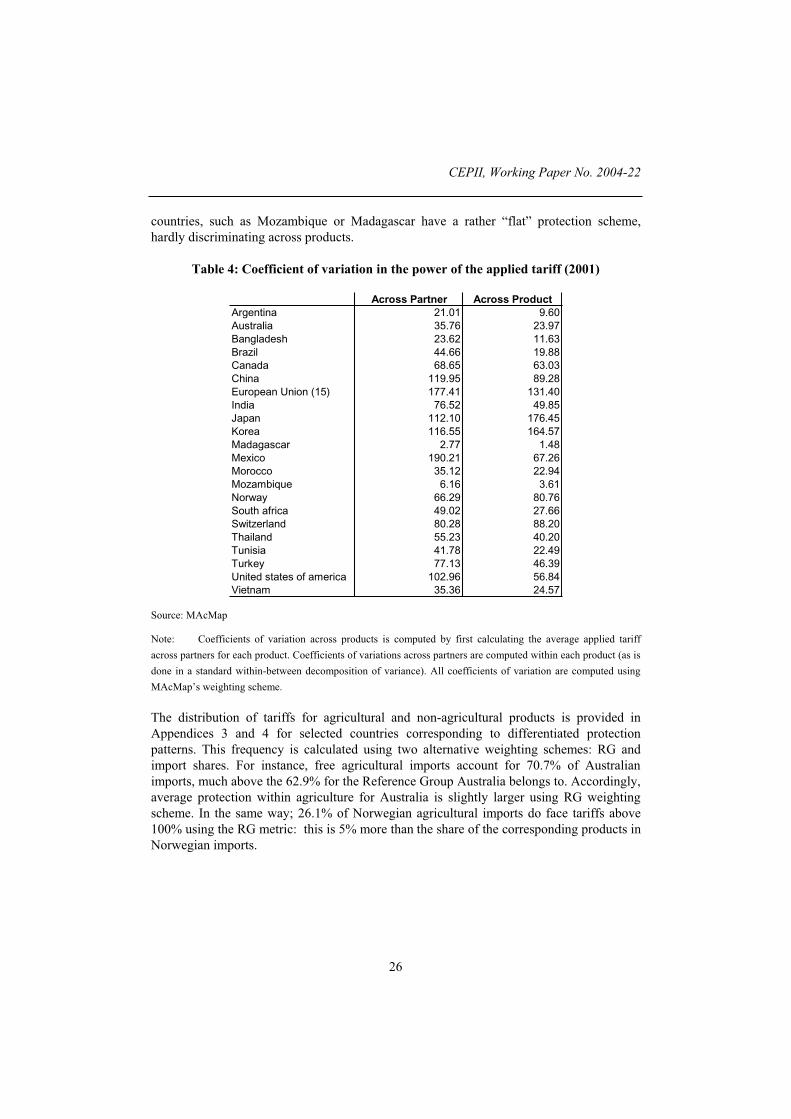
Even a broad picture as the one brushed above shows that countries are discriminating across products and across partners, in particular as a result of various preferential schemes and of tariff peaks. This is confirmed by a more detailed analysis. The first column of Table 4 shows the coefficient of variation in the power of the tariff (1+t) across partners for each
importer of our sample.30
Unsurprisingly, EU15 is among the most discriminating importer across partners. But Mexico, Korea and to a lesser extent China, Japan and the US are also significantly discriminating across partners. As far as differences across products are concerned, Japan exhibits the highest variation of protection, due to specific features of its agricultural protection (e.g.: rice). It is followed by Korea and the EU15. Some developing
30
The power of the tariff is an appealing metric, since differences in the power of tariffs are proportionally reflected, ceteris paribus, in consumer prices.
CEPII, Working Paper No. 2004-22
26
countries, such as Mozambique or Madagascar have a rather “flat” protection scheme, hardly discriminating across products.
Table 4: Coefficient of variation in the power of the applied tariff (2001)
Across Partner Across ProductArgentina 21.01 9.60Australia 35.76 23.97Bangladesh 23.62 11.63Brazil 44.66 19.88Canada 68.65 63.03China 119.95 89.28European Union (15) 177.41 131.40India 76.52 49.85Japan 112.10 176.45Korea 116.55 164.57Madagascar 2.77 1.48Mexico 190.21 67.26Morocco 35.12 22.94Mozambique 6.16 3.61Norway 66.29 80.76South africa 49.02 27.66Switzerland 80.28 88.20Thailand 55.23 40.20Tunisia 41.78 22.49Turkey 77.13 46.39United states of america 102.96 56.84Vietnam 35.36 24.57
Source: MAcMap
Note: Coefficients of variation across products is computed by first calculating the average applied tariff
across partners for each product. Coefficients of variations across partners are computed within each product (as is
done in a standard within-between decomposition of variance). All coefficients of variation are computed using
MAcMap’s weighting scheme.
The distribution of tariffs for agricultural and non-agricultural products is provided in Appendices 3 and 4 for selected countries corresponding to differentiated protection patterns. This frequency is calculated using two alternative weighting schemes: RG and import shares. For instance, free agricultural imports account for 70.7% of Australian imports, much above the 62.9% for the Reference Group Australia belongs to. Accordingly, average protection within agriculture for Australia is slightly larger using RG weighting scheme. In the same way; 26.1% of Norwegian agricultural imports do face tariffs above 100% using the RG metric: this is 5% more than the share of the corresponding products in Norwegian imports.

A consistent, ad-valorem equivalent measure of applied protection across the world
27
Graph 1: Comparison between the Trade Weighted and the Reference Group
Methodologies
Non-agricultural applied tariffs
ALB
ARG
AUS
BGD
BWA
BRA
CAN
CHL
CHN
COL
CZE
EST
EU25
HKG
HUN
IDN
JPN
KOR
LVALTU
MWIMYS
MLT
MEX
MAR
MOZ
NZL
XEF
PER
PHL
POL
ROMRUS
SGP
SVK
ZAFLKA
CHE
TWN
TZA
THA
TUR
UGA
USA
URY VEN
VNMZMB
ZWE
y = 0.9567xR2 = 0.8608
0.0
5.0
10.0
15.0
20.0
25.0
0.0 5.0 10.0 15.0 20.0 25.0
TW tariffs
Ref
Gro
up
Tar
iffs
Agricultural applied tariffs
CHE
ROM
XEF
CHN
ZWE
ZMB
VNM
VENURY
USAUGA
TUR
THA
TZATWN LKAZAFSVK
SGP
RUS
POL
PHLPER
NZL
MOZ
MARMEX
MLT
MYSMWI
LTULVA
JPN
IDN
IND
HUN
HKG
EU25
ESTCZECOL
CHL
CAN
BRA
BWABGD
AUS
ARGALB
y = 1.2522xR2 = 0.8086
05
1015202530354045505560657075808590
0 5 10 15 20 25 30 35 40 45 50 55 60 65 70 75 80 85 90
TW tariffs
Ref
Gro
up
tar
iffs
KOR
Source: MAcMap
Note : Grey line : x=y
Black line : regression y=a x ; R² and value of a is displayed on each plot
Following theses remarks on the distribution of tariffs, Graph 1 displays the consequences of using these two weighting schemes (RG and bilateral trade flows) on the average tariffs for agricultural and non-agricultural tariffs. Agricultural protection is the most interesting case. Broadly speaking, the reference group weighting scheme leads to a higher protection rate, as it could be expected, especially for the EFTA countries and for the European Union due to the presence of tariff peaks, but also for Mexico where the trade weighted average understates real protection by overweighing intra-NAFTA trade relationships. Nevertheless, for some countries such as Korea, the existence of large, unfilled TRQs (under regime 1) allows to have simultaneously strong trade flows (that take place under the inside rate) and a high marginal protection rate. In this case, the trade weighted average overstates protection, while the reference group approach is more robust.
3.2 Applied versus MFN tariffs and decomposition by instrument
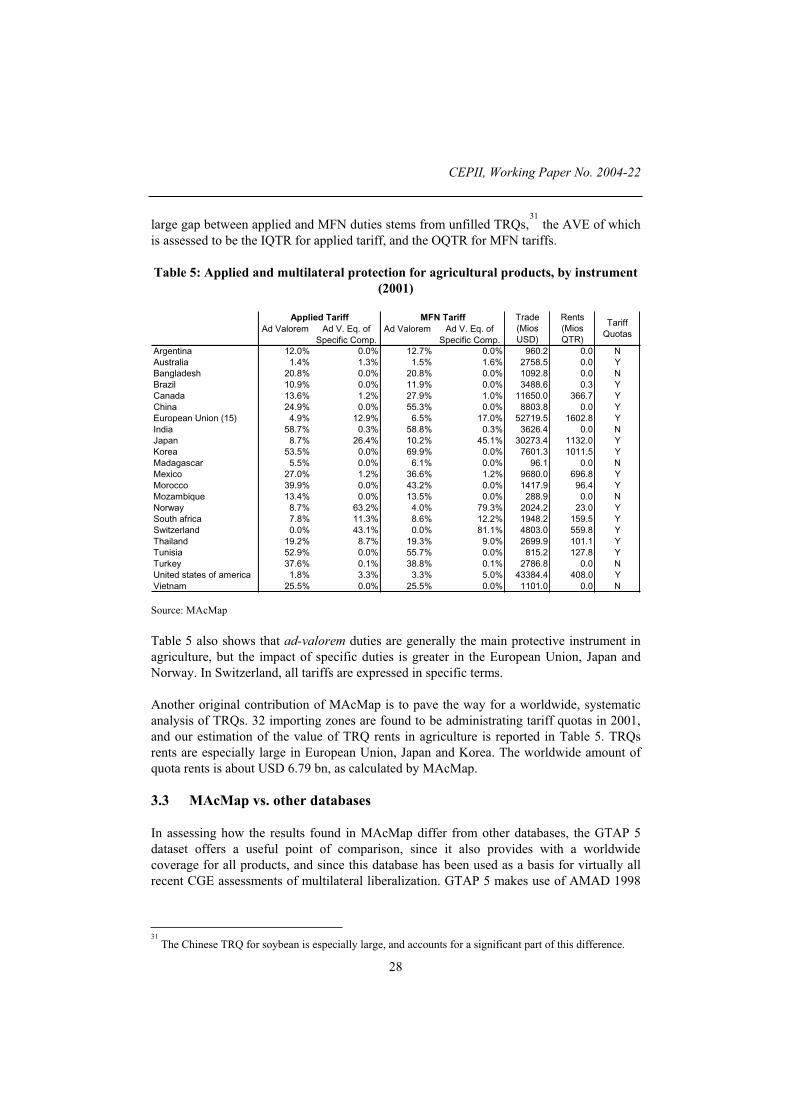
Up to recently, CGE simulation exercises tackling the impact of multilateral trade liberalization episodes have relied almost exclusively on MFN tariffs. MAcMap allows this approximation to be assessed, by making possible a systematic, worldwide analysis of the difference between applied and MFN tariffs to be carried out. This is done in Table 5 for agricultural products, while considering separately ad-valorem and specific tariffs (Appendix 5 reports similar results for non-agricultural products). MFN and applied duties often appear to be fairly similar, most of all in developing countries (see e.g. Bangladesh and Vietnam). But the difference turns out to be very large in several instances. In Switzerland, for instance, the average AVE MFN specific tariffs in agriculture is 81.1%, to be compared to an average AVE applied duty of 43.1%. Average AVE applied duties (summing ad-valorem and AVE specific duties) also amount to approximately half the MFN duties in the EU, Japan, and the US. The case of China is particular, since the rather
CEPII, Working Paper No. 2004-22
28
large gap between applied and MFN duties stems from unfilled TRQs,31
the AVE of which is assessed to be the IQTR for applied tariff, and the OQTR for MFN tariffs.
Table 5: Applied and multilateral protection for agricultural products, by instrument
(2001)
Ad Valorem Ad V. Eq. of Specific Comp.
Ad Valorem Ad V. Eq. of Specific Comp.
Argentina 12.0% 0.0% 12.7% 0.0% 960.2 0.0 NAustralia 1.4% 1.3% 1.5% 1.6% 2758.5 0.0 YBangladesh 20.8% 0.0% 20.8% 0.0% 1092.8 0.0 NBrazil 10.9% 0.0% 11.9% 0.0% 3488.6 0.3 YCanada 13.6% 1.2% 27.9% 1.0% 11650.0 366.7 YChina 24.9% 0.0% 55.3% 0.0% 8803.8 0.0 YEuropean Union (15) 4.9% 12.9% 6.5% 17.0% 52719.5 1602.8 YIndia 58.7% 0.3% 58.8% 0.3% 3626.4 0.0 NJapan 8.7% 26.4% 10.2% 45.1% 30273.4 1132.0 YKorea 53.5% 0.0% 69.9% 0.0% 7601.3 1011.5 YMadagascar 5.5% 0.0% 6.1% 0.0% 96.1 0.0 NMexico 27.0% 1.2% 36.6% 1.2% 9680.0 696.8 YMorocco 39.9% 0.0% 43.2% 0.0% 1417.9 96.4 YMozambique 13.4% 0.0% 13.5% 0.0% 288.9 0.0 NNorway 8.7% 63.2% 4.0% 79.3% 2024.2 23.0 YSouth africa 7.8% 11.3% 8.6% 12.2% 1948.2 159.5 YSwitzerland 0.0% 43.1% 0.0% 81.1% 4803.0 559.8 YThailand 19.2% 8.7% 19.3% 9.0% 2699.9 101.1 YTunisia 52.9% 0.0% 55.7% 0.0% 815.2 127.8 YTurkey 37.6% 0.1% 38.8% 0.1% 2786.8 0.0 NUnited states of america 1.8% 3.3% 3.3% 5.0% 43384.4 408.0 YVietnam 25.5% 0.0% 25.5% 0.0% 1101.0 0.0 N
Tariff Quotas
Applied Tariff MFN Tariff Trade (Mios USD)
Rents (Mios QTR)
Source: MAcMap
Table 5 also shows that ad-valorem duties are generally the main protective instrument in agriculture, but the impact of specific duties is greater in the European Union, Japan and Norway. In Switzerland, all tariffs are expressed in specific terms.
Another original contribution of MAcMap is to pave the way for a worldwide, systematic analysis of TRQs. 32 importing zones are found to be administrating tariff quotas in 2001, and our estimation of the value of TRQ rents in agriculture is reported in Table 5. TRQs rents are especially large in European Union, Japan and Korea. The worldwide amount of quota rents is about USD 6.79 bn, as calculated by MAcMap.
3.3 MAcMap vs. other databases
In assessing how the results found in MAcMap differ from other databases, the GTAP 5 dataset offers a useful point of comparison, since it also provides with a worldwide coverage for all products, and since this database has been used as a basis for virtually all recent CGE assessments of multilateral liberalization. GTAP 5 makes use of AMAD 1998
31
The Chinese TRQ for soybean is especially large, and accounts for a significant part of this difference.
A consistent, ad-valorem equivalent measure of applied protection across the world
29
data for agriculture, and of TRAINS32
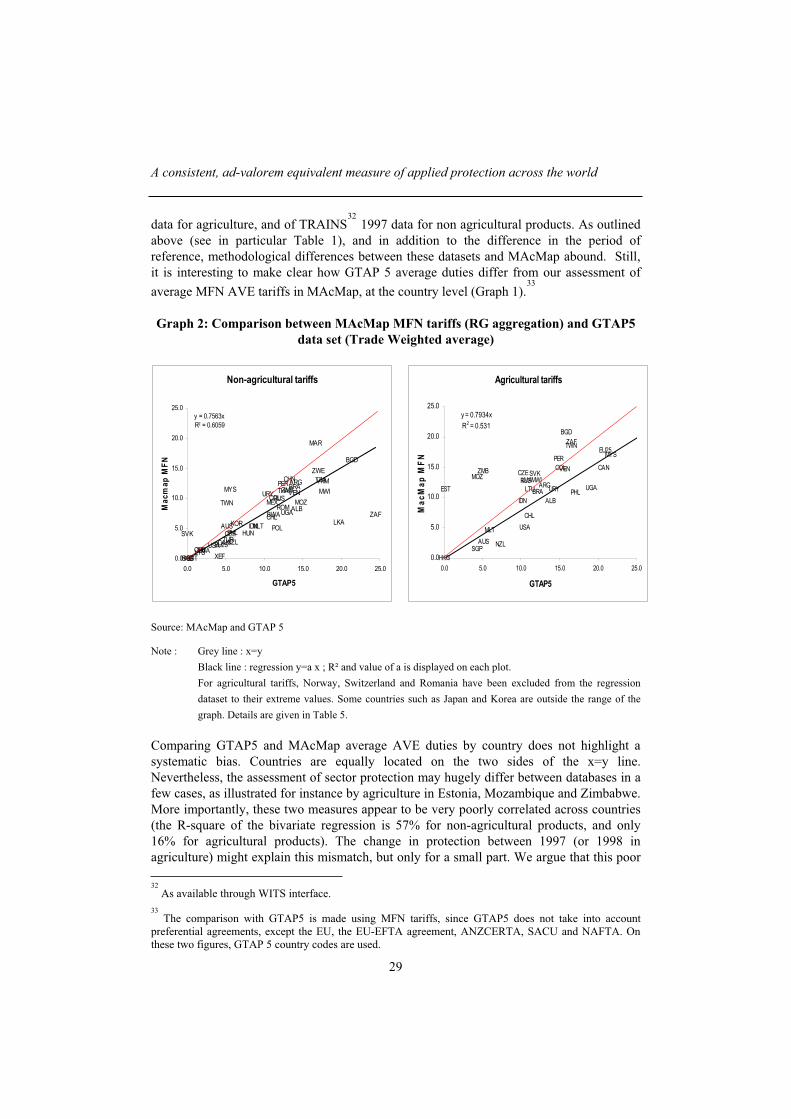
1997 data for non agricultural products. As outlined above (see in particular Table 1), and in addition to the difference in the period of reference, methodological differences between these datasets and MAcMap abound. Still, it is interesting to make clear how GTAP 5 average duties differ from our assessment of
average MFN AVE tariffs in MAcMap, at the country level (Graph 1).33
Graph 2: Comparison between MAcMap MFN tariffs (RG aggregation) and GTAP5
data set (Trade Weighted average)
Non-agricultural tariffs
ZWE
ZMBVNM
VENURY
USA
UGA
TUR
THA
TZA
TWN
CHE
LKAZAF
SVK
SGP
RUSROM
POLPHL
PER
XEF
NZL
MOZ
MAR
MEX
MLT
MYS MWI
LTULVA
KOR
JPN
IDNHUN
HKG
EU25
EST
CZE
COL
CHN
CHL
CAN
BRA
BWA
BGD
AUS
ARG
ALB
y = 0.7563xR2 = 0.6059
0.0
5.0
10.0
15.0
20.0
25.0
0.0 5.0 10.0 15.0 20.0 25.0
GTAP5
Mac
map
MF
N
Agricultural tariffs
ALB
ARG
AUS
BGD
BRA
CAN
CHL
COLCZE
EST
EU25
HKG
IDN
LVALTU
MWI
MYS
MLT
MOZ
NZL
PER
PHL
RUS
SGP
SVK
ZAFTWN
UGA
USA
URY
VENZMB
y = 0.7934xR2 = 0.531
0.0
5.0
10.0
15.0
20.0
25.0
0.0 5.0 10.0 15.0 20.0 25.0
GTAP5
Mac
Map
MF
N
Source: MAcMap and GTAP 5
Note : Grey line : x=y
Black line : regression y=a x ; R² and value of a is displayed on each plot.
For agricultural tariffs, Norway, Switzerland and Romania have been excluded from the regression
dataset to their extreme values. Some countries such as Japan and Korea are outside the range of the
graph. Details are given in Table 5.
Comparing GTAP5 and MAcMap average AVE duties by country does not highlight a systematic bias. Countries are equally located on the two sides of the x=y line. Nevertheless, the assessment of sector protection may hugely differ between databases in a few cases, as illustrated for instance by agriculture in Estonia, Mozambique and Zimbabwe. More importantly, these two measures appear to be very poorly correlated across countries (the R-square of the bivariate regression is 57% for non-agricultural products, and only 16% for agricultural products). The change in protection between 1997 (or 1998 in agriculture) might explain this mismatch, but only for a small part. We argue that this poor
32
As available through WITS interface.
33 The comparison with GTAP5 is made using MFN tariffs, since GTAP5 does not take into account
preferential agreements, except the EU, the EU-EFTA agreement, ANZCERTA, SACU and NAFTA. On these two figures, GTAP 5 country codes are used.
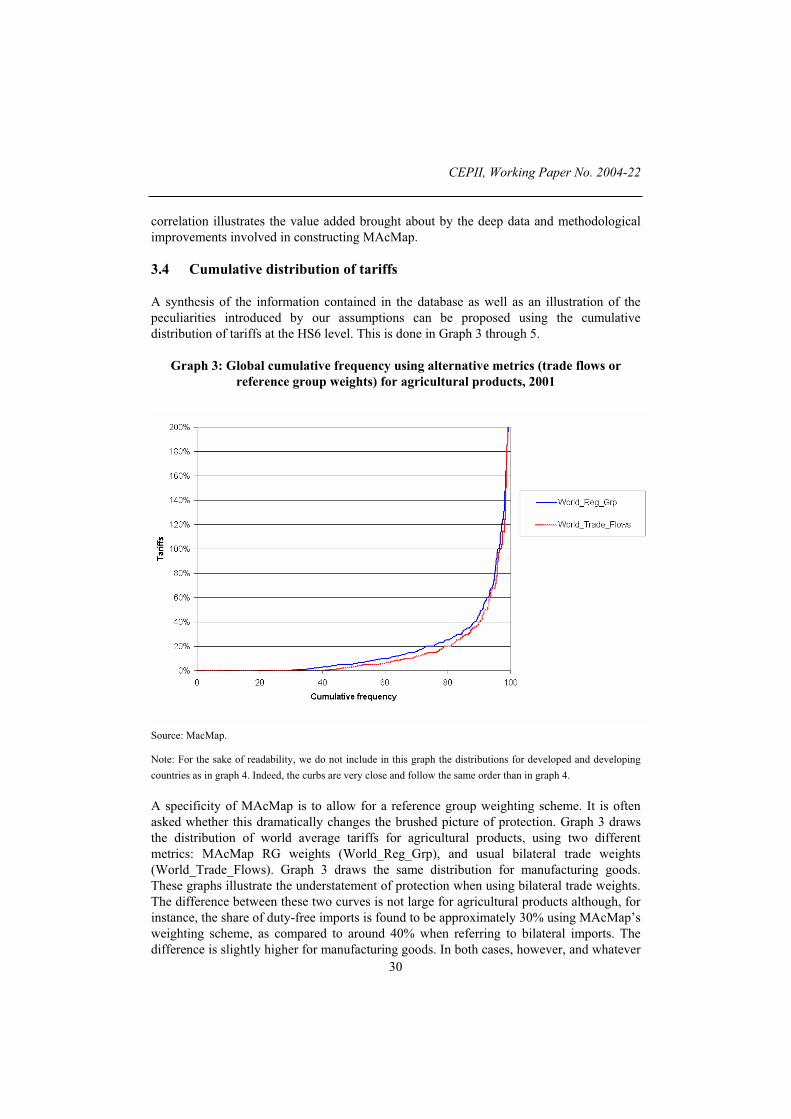
CEPII, Working Paper No. 2004-22
30
correlation illustrates the value added brought about by the deep data and methodological improvements involved in constructing MAcMap.
3.4 Cumulative distribution of tariffs
A synthesis of the information contained in the database as well as an illustration of the peculiarities introduced by our assumptions can be proposed using the cumulative distribution of tariffs at the HS6 level. This is done in Graph 3 through 5.
Graph 3: Global cumulative frequency using alternative metrics (trade flows or
reference group weights) for agricultural products, 2001
Source: MacMap.
Note: For the sake of readability, we do not include in this graph the distributions for developed and developing
countries as in graph 4. Indeed, the curbs are very close and follow the same order than in graph 4.
A specificity of MAcMap is to allow for a reference group weighting scheme. It is often asked whether this dramatically changes the brushed picture of protection. Graph 3 draws the distribution of world average tariffs for agricultural products, using two different metrics: MAcMap RG weights (World_Reg_Grp), and usual bilateral trade weights (World_Trade_Flows). Graph 3 draws the same distribution for manufacturing goods. These graphs illustrate the understatement of protection when using bilateral trade weights. The difference between these two curves is not large for agricultural products although, for instance, the share of duty-free imports is found to be approximately 30% using MAcMap’s weighting scheme, as compared to around 40% when referring to bilateral imports. The difference is slightly higher for manufacturing goods. In both cases, however, and whatever
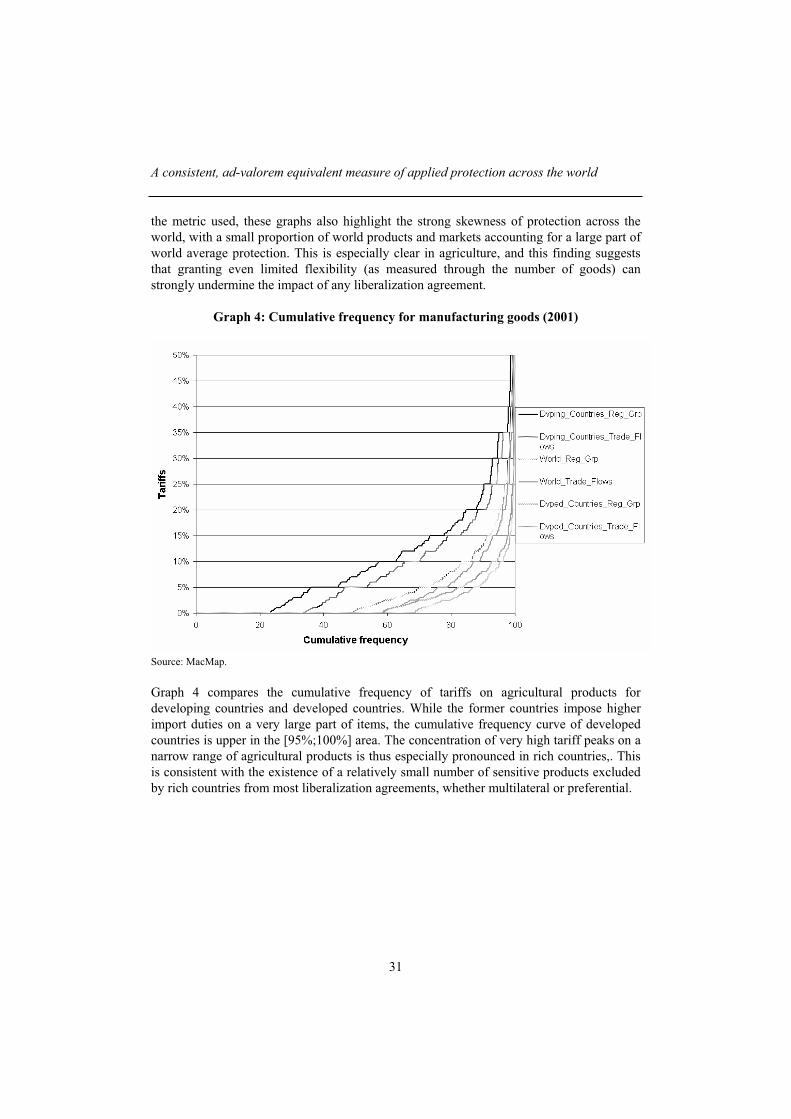
A consistent, ad-valorem equivalent measure of applied protection across the world
31
the metric used, these graphs also highlight the strong skewness of protection across the world, with a small proportion of world products and markets accounting for a large part of world average protection. This is especially clear in agriculture, and this finding suggests that granting even limited flexibility (as measured through the number of goods) can strongly undermine the impact of any liberalization agreement.
Graph 4: Cumulative frequency for manufacturing goods (2001)
Source: MacMap.
Graph 4 compares the cumulative frequency of tariffs on agricultural products for developing countries and developed countries. While the former countries impose higher import duties on a very large part of items, the cumulative frequency curve of developed countries is upper in the [95%;100%] area. The concentration of very high tariff peaks on a narrow range of agricultural products is thus especially pronounced in rich countries,. This is consistent with the existence of a relatively small number of sensitive products excluded by rich countries from most liberalization agreements, whether multilateral or preferential.
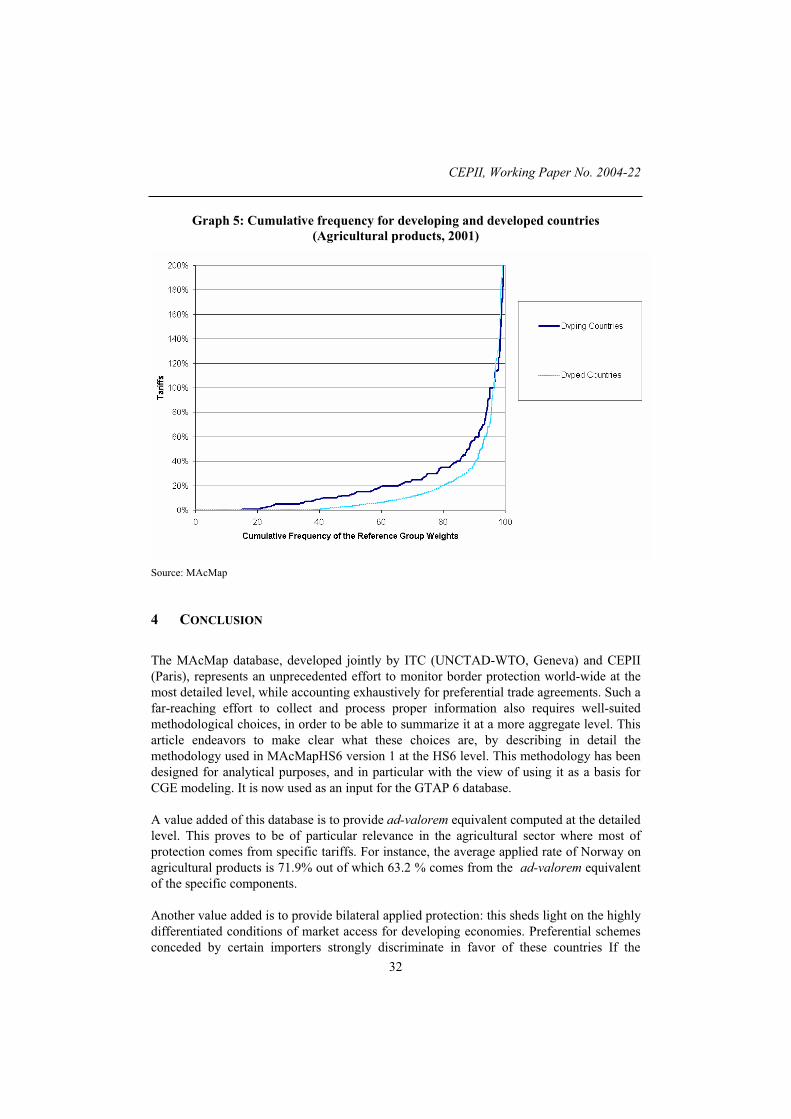
CEPII, Working Paper No. 2004-22
32
Graph 5: Cumulative frequency for developing and developed countries
(Agricultural products, 2001)
Source: MAcMap
4 CONCLUSION
The MAcMap database, developed jointly by ITC (UNCTAD-WTO, Geneva) and CEPII (Paris), represents an unprecedented effort to monitor border protection world-wide at the most detailed level, while accounting exhaustively for preferential trade agreements. Such a far-reaching effort to collect and process proper information also requires well-suited methodological choices, in order to be able to summarize it at a more aggregate level. This article endeavors to make clear what these choices are, by describing in detail the methodology used in MAcMapHS6 version 1 at the HS6 level. This methodology has been designed for analytical purposes, and in particular with the view of using it as a basis for CGE modeling. It is now used as an input for the GTAP 6 database.
A value added of this database is to provide ad-valorem equivalent computed at the detailed level. This proves to be of particular relevance in the agricultural sector where most of protection comes from specific tariffs. For instance, the average applied rate of Norway on agricultural products is 71.9% out of which 63.2 % comes from the ad-valorem equivalent of the specific components.
Another value added is to provide bilateral applied protection: this sheds light on the highly differentiated conditions of market access for developing economies. Preferential schemes conceded by certain importers strongly discriminate in favor of these countries If the
A consistent, ad-valorem equivalent measure of applied protection across the world
33
overall protection of European Union is 3.1 %, least developed countries face an average rate of 0.8%..
Incidentally, the combination of the two previous elements can lead to unexpected results for instance a country supposed to be preferred on a given market suffers from the low unit value of its exports in a sector characterized by the presence of specific tariffs. Mozambique, a LDC supposed to be preferred, faces an average tariff of 25.1% for agricultural products, 6 % above the world average.
In addition to presenting a new database, this paper has proposed a new strategy of tariff aggregation. In order to minimize endogeneity biases, while taking into account the economic specificities as well as the lack of data at the detailed level, we have relied on a weighting scheme using reference groups. This method leads to a higher average rate of protection than a weighting scheme using imports.
In negotiating future liberalization agreements, such as in particular those contemplated in the ongoing Doha Round, we believe that MAcMap can be a useful tool, and pave the way for better informed policy decisions.

CEPII, Working Paper No. 2004-22
34
5 REFERENCES
Abdel-Rahman K. (1991), Firms' Competitive and National Comparative Advantages as Joint Determinants of Trade Composition. Weltwirtschaftliches Archiv, vol. 127, pp. 83-97.
Anderson J.E. and G.J. Bannister (1992), The Trade Restrictiveness Index: an Application to Mexican Agriculture. World Bank Policy Research Working Papers in
International Trade, WPS874, The World Bank.
Anderson J.E., G.J. Bannister and J.P. Neary (1995), Domestic Distorsions and International Trade. International Economic Review, Vol. 36, No. 1, pp. 139-157.
Anderson J.E. and Neary J.P. (1996), "A new approach to evaluating trade policy", Review
of Economic Studies, 63:1, 107-125.
Anderson J.E. and J.P. Neary (1999), The Mercantilist Index of Trade Policy. NBER
Working Papers, No. 6870.
Balassa B. (1965), Tariff protection in industrial countries: an evaluation. Journal of
Political Economy, vol. LXXIII, 6: 573-594.
Bouët A., Fontagné L., Mimouni M. and Pichot X. (2001), MAcMaps : a bilateral and disaggregated measure of market access. CEPII Working Paper, 2001-18.
Bouët A., Fontagné L., Mimouni M., von Kirchbach F. (2002), MAcMaps for GTAP 5: A Bilateral and Disaggregated Measure of Trade Obstacles in GTAP. Paper presented at the 5th GEA Conference, Taipei, June.
Bureau J.-C., Salvatici L. (2004), WTO Negotiations on Market Access in Agriculture: A Comparison of Alternative Tariff Cut Proposals for the EU and the US, Topics in Economic Analysis and Policy, 4, (1): 1-33.
Dimaranan B.V., McDougall R.A. (2002), Global Trade, Assistance and Production: The GTAP 5 Data Base. Center for Global Trade Analysis, Purdue University.
Feenstra R.C., Boorstein R. (1991), Quality Upgrading and Its Welfare Cost in U.S. Steel Imports, 1969-74. International trade and trade policy: 167-86, MIT Press
Fontagné L., Freudenberg M. (1997), Intra-Industry Trade: Methodological Issues Reconsidered. CEPII Working Paper, 97-01.
Fontagné L., Freudenberg M., Péridy N. (1998), Intra-Industry Trade and the Single Market. CEPR Discussion paper, 1959.
A consistent, ad-valorem equivalent measure of applied protection across the world
35
Fry J.M., Jomini P.A., Strzelecki A. (2004), The Integrated Tariff Analysis System. Productivity Commission Research Memorandum Cat No: GA 513, June.
Gibson, P., Wainio J., Whitley D. M., Bohman M. (2001), Profiles of Tariffs in Global Agricultural Markets. Economic Research Service, USDA, Agricultural Economic Report Number 796, January.
Greenaway D., Torstensson J. (2001) Economic Geography, Comparative Advantage and Trade within Industries: Evidence from the OECD. Journal of Economic Integration,15 (2):260-80.
IATRC (2001), Agriculture in the WTO: issues in reforming Tariff-Rate Import quotas in the Agreement on Agriculture in the WTO. Commissioned Paper 13, International Agricultural Trade Research Consortium, Mimeo, University of Minnesota.
Liapis P., Blitz W. (2001), Modeling TRQs in multicommodity models. www.fal.de/gewisola/dokumente/volltexte/liapis_britz.pdf.
Schott P. K. (2004), Across-Product versus Within-Product Specialization in International Trade. Quarterly Journal of Economics 119(2): 647-678.
World Trade Organization (1998), Ad-valorem, Specific and other Tariffs: Background Paper by the Secretariat, WTO, AIE/S5, February.
World Trade Organization (2003). Incidence of Non-Ad-valorem Tariffs in Members' Tariff Schedules and Possible Approaches to the Estimation of Ad-valorem Equivalents. Note by the Secretariat, WTO, TN/MA/S/10, May.
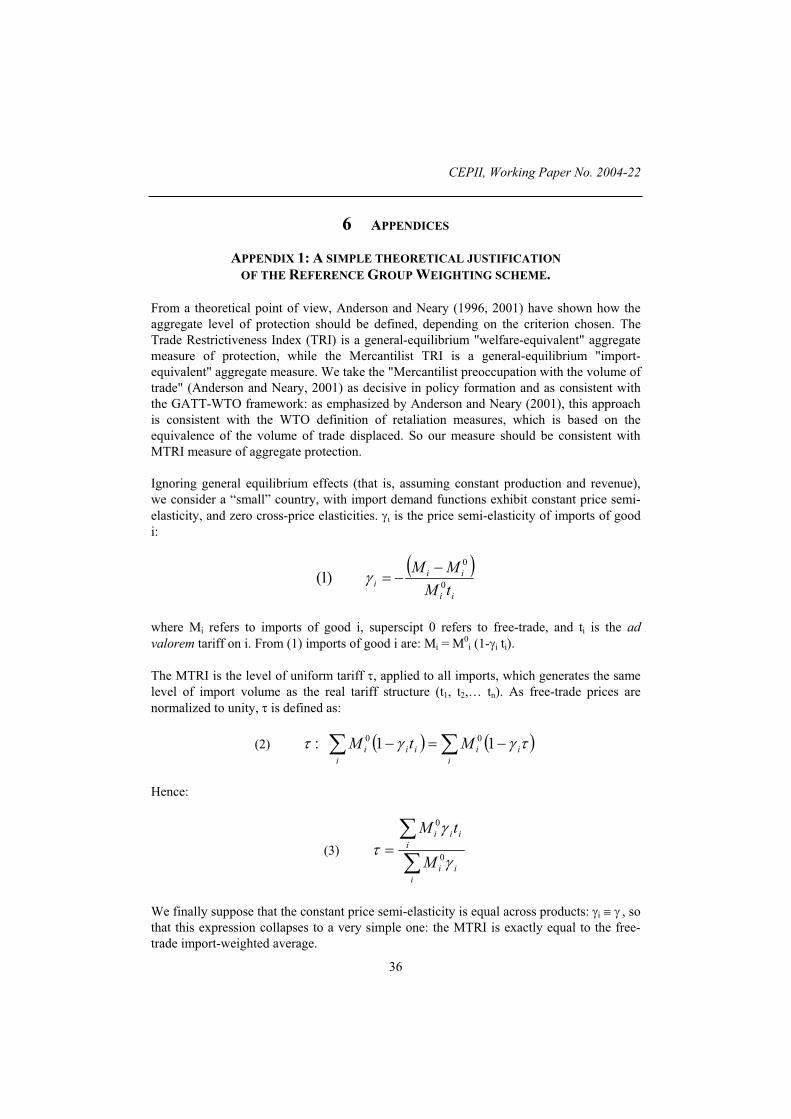
CEPII, Working Paper No. 2004-22
36
6 APPENDICES
APPENDIX 1: A SIMPLE THEORETICAL JUSTIFICATION
OF THE REFERENCE GROUP WEIGHTING SCHEME.
From a theoretical point of view, Anderson and Neary (1996, 2001) have shown how the aggregate level of protection should be defined, depending on the criterion chosen. The Trade Restrictiveness Index (TRI) is a general-equilibrium "welfare-equivalent" aggregate measure of protection, while the Mercantilist TRI is a general-equilibrium "import-equivalent" aggregate measure. We take the "Mercantilist preoccupation with the volume of trade" (Anderson and Neary, 2001) as decisive in policy formation and as consistent with the GATT-WTO framework: as emphasized by Anderson and Neary (2001), this approach is consistent with the WTO definition of retaliation measures, which is based on the equivalence of the volume of trade displaced. So our measure should be consistent with MTRI measure of aggregate protection.
Ignoring general equilibrium effects (that is, assuming constant production and revenue), we consider a “small” country, with import demand functions exhibit constant price semi-elasticity, and zero cross-price elasticities. is the price semi-elasticity of imports of good i:
ii
iii
tM
MM0
0
)1(
where Mi refers to imports of good i, superscipt 0 refers to free-trade, and ti is the ad
valorem tariff on i. From (1) imports of good i are: Mi = M0i (1- i ti).
The MTRI is the level of uniform tariff , applied to all imports, which generates the same level of import volume as the real tariff structure (t1, t2,… tn). As free-trade prices are normalized to unity, is defined as:
i
ii
i
iii MtM 11: 00
Hence:
(3)
i
ii
i
iii
M
tM
0
0
We finally suppose that the constant price semi-elasticity is equal across products: i , so that this expression collapses to a very simple one: the MTRI is exactly equal to the free-trade import-weighted average.
A consistent, ad-valorem equivalent measure of applied protection across the world
37
Our second important assumption is that the sector structure of imports of a group of "similar" countries is an appropriate proxy for the free-trade sector structure of imports of a given country. As soon as protection patterns are not systematically related across countries, there ought not to be any systematic bias in the sector structure of imports for a large group of countries. Still, free-trade imports might differ due to differences in demand patterns. This is why the proxy for free-trade imports shall not be computed on a worldwide basis, but only for similar countries: hence the approach based on reference groups, previously defined by a statistical clustering based on GDP per capita and trade openness. We choose to use five reference groups. Using a higher number of groups would allow countries specificities to be better taken into account. But a small number of large groups allows the protection pattern of each country being diluted in a large set of countries, thus limiting the extent of the endogeneity of weights to the tariffs of each individual country.

CEPII, Working Paper No. 2004-22
38
APPENDIX 2: COUNTRIES IN MACMAP AND REFERENCE GROUPS
Group A
American samoa Gibraltar Northern mariana islandsAndorra Greece NorwayAnguilla Greenland OmanAruba Guam PalauAustralia Hong kong PolandAustria Hungary PortugalBahamas Iceland Puerto ricoBahrain Ireland QatarBarbados Israel San marinoBelgium Italy SingaporeBermuda Japan Slovakia (slovak republic)Canada Korea SloveniaCayman islands Kuwait SpainCook islands Latvia St. pierre and miquelonCyprus Liechtenstein SwedenCzech republic Lithuania SwitzerlandDenmark Luxembourg TaiwanEstonia Macau Turks and caicos islandsFalkland islands Malta United arab emiratesFaroe islands Marshall islands United kingdomFinland Mayotte United states of americaFrance Micronesia Virgin islands (british)French guiana Netherlands Virgin islands (u.s.)French polynesia New caledonia Wallis and futuna islandGermany New zealand
Group B
Antigua and barbuda Croatia Saint kitts and nevisArgentina Grenada Saudi arabiaBelarus Malaysia SeychellesBotswana Mauritius South africaBrunei darussalam Mexico Trinidad and tobagoChile Netherland antilles UruguayCosta rica Russian federation
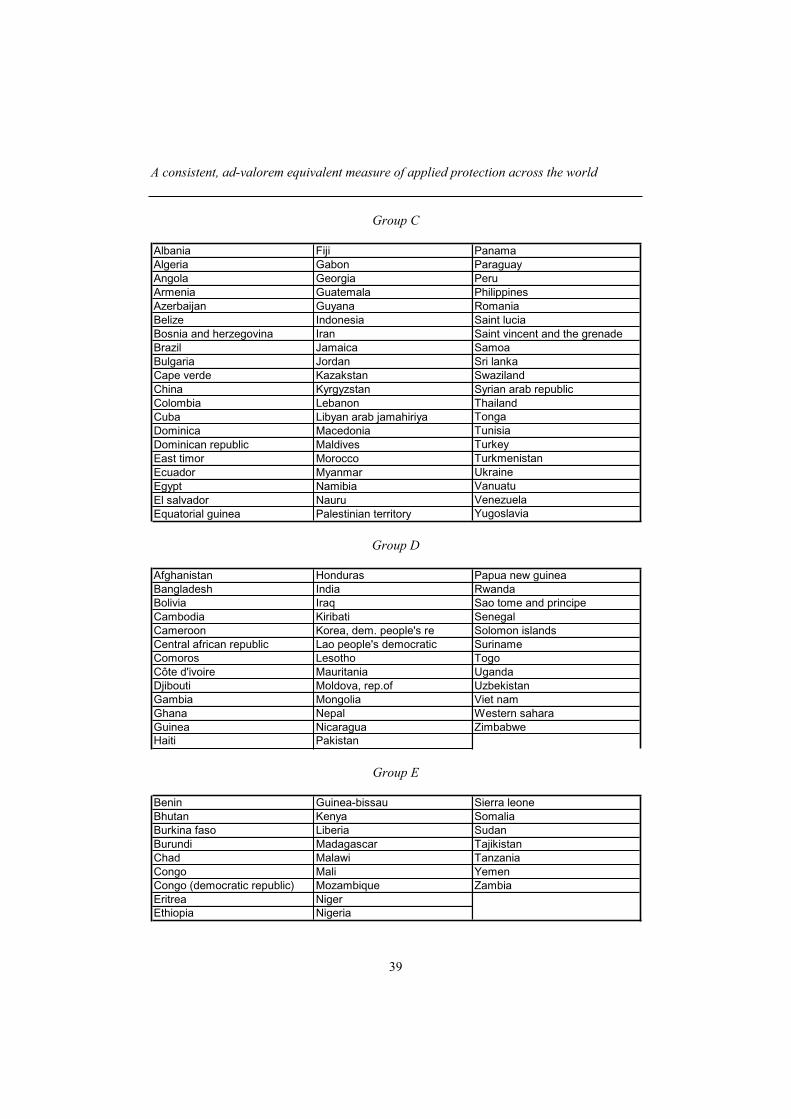
A consistent, ad-valorem equivalent measure of applied protection across the world
39
Group C
Albania Fiji PanamaAlgeria Gabon ParaguayAngola Georgia PeruArmenia Guatemala PhilippinesAzerbaijan Guyana RomaniaBelize Indonesia Saint luciaBosnia and herzegovina Iran Saint vincent and the grenadeBrazil Jamaica SamoaBulgaria Jordan Sri lankaCape verde Kazakstan SwazilandChina Kyrgyzstan Syrian arab republicColombia Lebanon ThailandCuba Libyan arab jamahiriya TongaDominica Macedonia TunisiaDominican republic Maldives TurkeyEast timor Morocco TurkmenistanEcuador Myanmar UkraineEgypt Namibia VanuatuEl salvador Nauru VenezuelaEquatorial guinea Palestinian territory Yugoslavia
Group D
Afghanistan Honduras Papua new guineaBangladesh India RwandaBolivia Iraq Sao tome and principeCambodia Kiribati SenegalCameroon Korea, dem. people's re Solomon islandsCentral african republic Lao people's democratic SurinameComoros Lesotho TogoCôte d'ivoire Mauritania UgandaDjibouti Moldova, rep.of UzbekistanGambia Mongolia Viet namGhana Nepal Western saharaGuinea Nicaragua ZimbabweHaiti Pakistan
Group E
Benin Guinea-bissau Sierra leoneBhutan Kenya SomaliaBurkina faso Liberia SudanBurundi Madagascar TajikistanChad Malawi TanzaniaCongo Mali YemenCongo (democratic republic) Mozambique ZambiaEritrea NigerEthiopia Nigeria
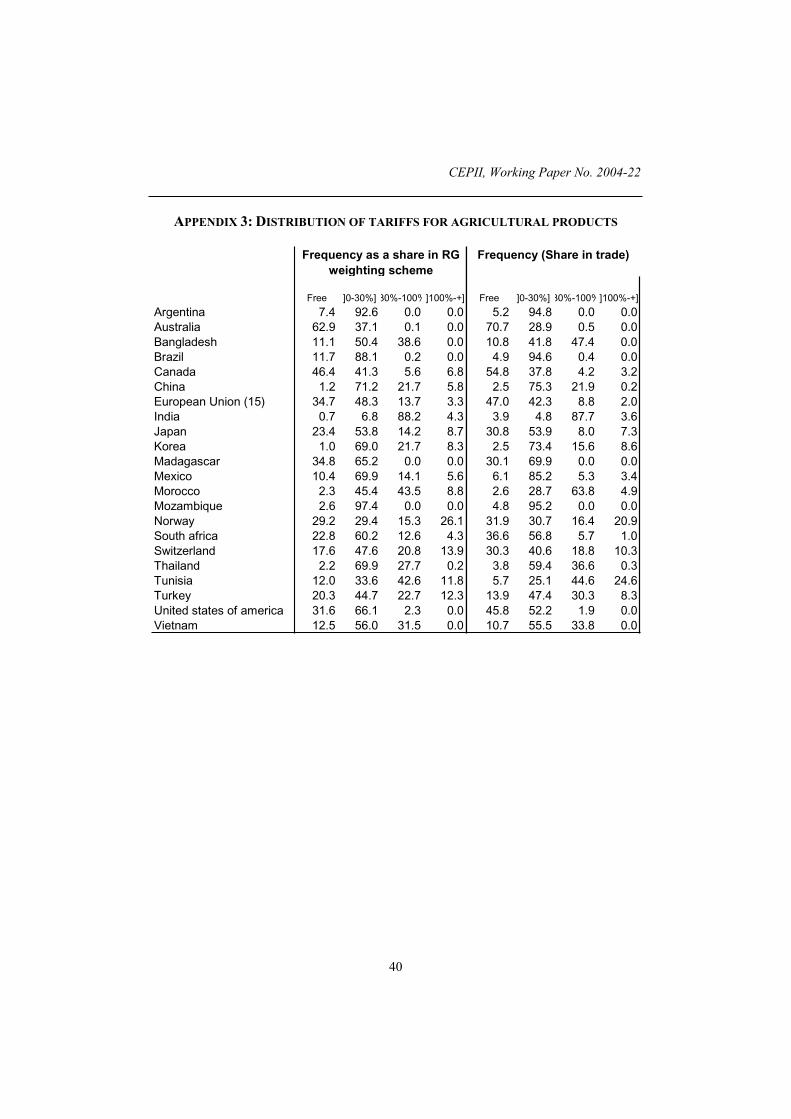
CEPII, Working Paper No. 2004-22
40
APPENDIX 3: DISTRIBUTION OF TARIFFS FOR AGRICULTURAL PRODUCTS
Free ]0-30%] 30%-100%]100%-+] Free ]0-30%] 30%-100%]100%-+]
Argentina 7.4 92.6 0.0 0.0 5.2 94.8 0.0 0.0Australia 62.9 37.1 0.1 0.0 70.7 28.9 0.5 0.0Bangladesh 11.1 50.4 38.6 0.0 10.8 41.8 47.4 0.0Brazil 11.7 88.1 0.2 0.0 4.9 94.6 0.4 0.0Canada 46.4 41.3 5.6 6.8 54.8 37.8 4.2 3.2China 1.2 71.2 21.7 5.8 2.5 75.3 21.9 0.2European Union (15) 34.7 48.3 13.7 3.3 47.0 42.3 8.8 2.0India 0.7 6.8 88.2 4.3 3.9 4.8 87.7 3.6Japan 23.4 53.8 14.2 8.7 30.8 53.9 8.0 7.3Korea 1.0 69.0 21.7 8.3 2.5 73.4 15.6 8.6Madagascar 34.8 65.2 0.0 0.0 30.1 69.9 0.0 0.0Mexico 10.4 69.9 14.1 5.6 6.1 85.2 5.3 3.4Morocco 2.3 45.4 43.5 8.8 2.6 28.7 63.8 4.9Mozambique 2.6 97.4 0.0 0.0 4.8 95.2 0.0 0.0Norway 29.2 29.4 15.3 26.1 31.9 30.7 16.4 20.9South africa 22.8 60.2 12.6 4.3 36.6 56.8 5.7 1.0Switzerland 17.6 47.6 20.8 13.9 30.3 40.6 18.8 10.3Thailand 2.2 69.9 27.7 0.2 3.8 59.4 36.6 0.3Tunisia 12.0 33.6 42.6 11.8 5.7 25.1 44.6 24.6Turkey 20.3 44.7 22.7 12.3 13.9 47.4 30.3 8.3United states of america 31.6 66.1 2.3 0.0 45.8 52.2 1.9 0.0Vietnam 12.5 56.0 31.5 0.0 10.7 55.5 33.8 0.0
Frequency as a share in RG weighting scheme
Frequency (Share in trade)
Agricultural products Agricultural products
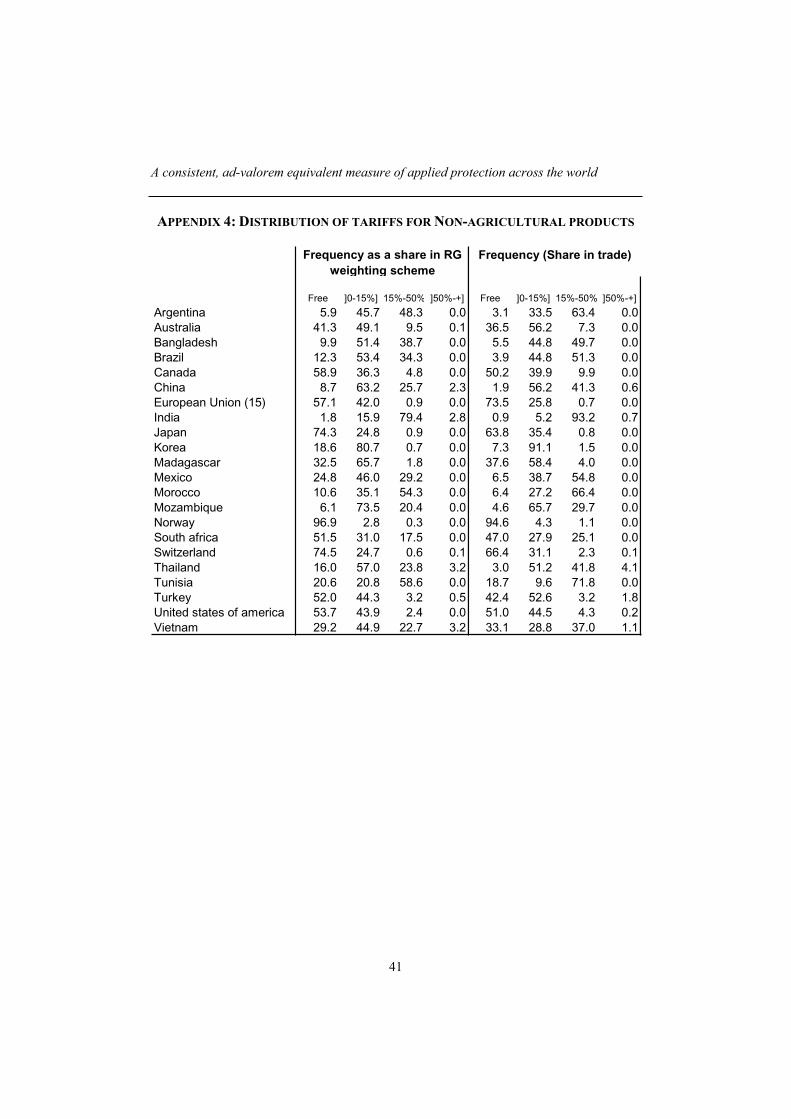
A consistent, ad-valorem equivalent measure of applied protection across the world
41
APPENDIX 4: DISTRIBUTION OF TARIFFS FOR NON-AGRICULTURAL PRODUCTS
Free ]0-15%] 15%-50% ]50%-+] Free ]0-15%] 15%-50% ]50%-+]
Argentina 5.9 45.7 48.3 0.0 3.1 33.5 63.4 0.0Australia 41.3 49.1 9.5 0.1 36.5 56.2 7.3 0.0Bangladesh 9.9 51.4 38.7 0.0 5.5 44.8 49.7 0.0Brazil 12.3 53.4 34.3 0.0 3.9 44.8 51.3 0.0Canada 58.9 36.3 4.8 0.0 50.2 39.9 9.9 0.0China 8.7 63.2 25.7 2.3 1.9 56.2 41.3 0.6European Union (15) 57.1 42.0 0.9 0.0 73.5 25.8 0.7 0.0India 1.8 15.9 79.4 2.8 0.9 5.2 93.2 0.7Japan 74.3 24.8 0.9 0.0 63.8 35.4 0.8 0.0Korea 18.6 80.7 0.7 0.0 7.3 91.1 1.5 0.0Madagascar 32.5 65.7 1.8 0.0 37.6 58.4 4.0 0.0Mexico 24.8 46.0 29.2 0.0 6.5 38.7 54.8 0.0Morocco 10.6 35.1 54.3 0.0 6.4 27.2 66.4 0.0Mozambique 6.1 73.5 20.4 0.0 4.6 65.7 29.7 0.0Norway 96.9 2.8 0.3 0.0 94.6 4.3 1.1 0.0South africa 51.5 31.0 17.5 0.0 47.0 27.9 25.1 0.0Switzerland 74.5 24.7 0.6 0.1 66.4 31.1 2.3 0.1Thailand 16.0 57.0 23.8 3.2 3.0 51.2 41.8 4.1Tunisia 20.6 20.8 58.6 0.0 18.7 9.6 71.8 0.0Turkey 52.0 44.3 3.2 0.5 42.4 52.6 3.2 1.8United states of america 53.7 43.9 2.4 0.0 51.0 44.5 4.3 0.2Vietnam 29.2 44.9 22.7 3.2 33.1 28.8 37.0 1.1
Frequency as a share in RG weighting scheme
Frequency (Share in trade)
Manufacturing goods Manufacturing goods
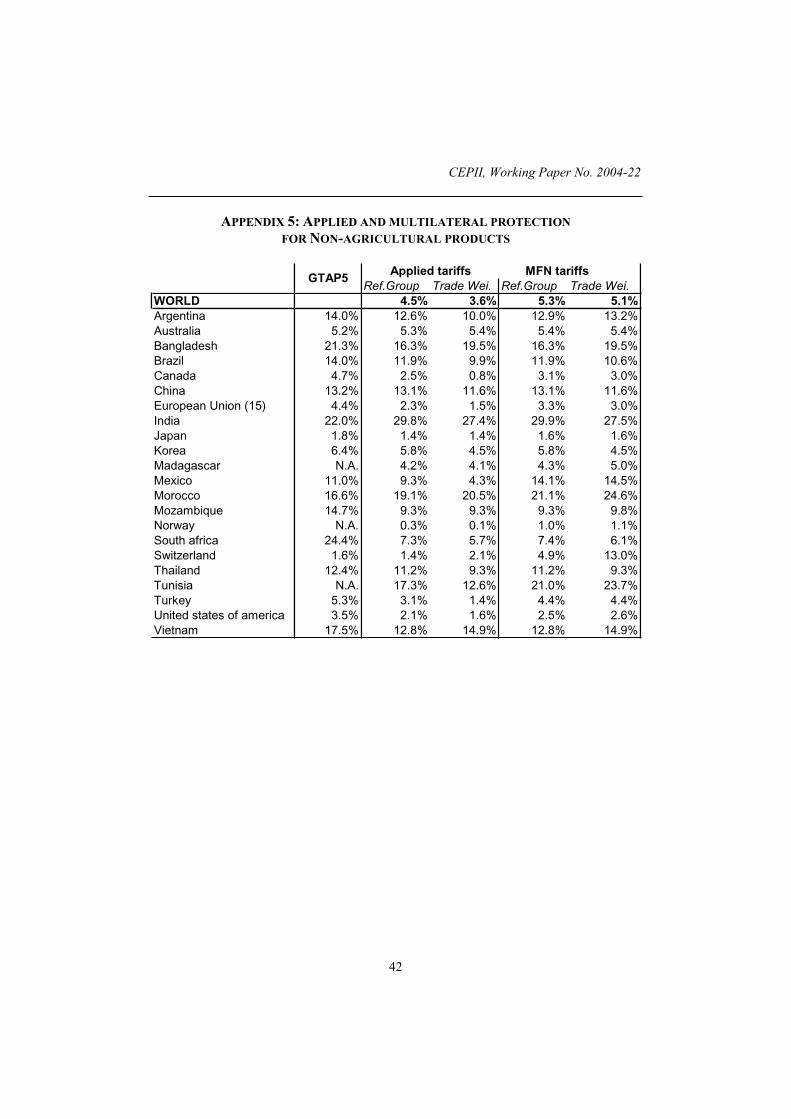
CEPII, Working Paper No. 2004-22
42
APPENDIX 5: APPLIED AND MULTILATERAL PROTECTION
FOR NON-AGRICULTURAL PRODUCTS
Applied tariffs MFN tariffsRef.Group Trade Wei. Ref.Group Trade Wei.
WORLD 4.5% 3.6% 5.3% 5.1%Argentina 14.0% 12.6% 10.0% 12.9% 13.2%Australia 5.2% 5.3% 5.4% 5.4% 5.4%Bangladesh 21.3% 16.3% 19.5% 16.3% 19.5%Brazil 14.0% 11.9% 9.9% 11.9% 10.6%Canada 4.7% 2.5% 0.8% 3.1% 3.0%China 13.2% 13.1% 11.6% 13.1% 11.6%European Union (15) 4.4% 2.3% 1.5% 3.3% 3.0%India 22.0% 29.8% 27.4% 29.9% 27.5%Japan 1.8% 1.4% 1.4% 1.6% 1.6%Korea 6.4% 5.8% 4.5% 5.8% 4.5%Madagascar N.A. 4.2% 4.1% 4.3% 5.0%Mexico 11.0% 9.3% 4.3% 14.1% 14.5%Morocco 16.6% 19.1% 20.5% 21.1% 24.6%Mozambique 14.7% 9.3% 9.3% 9.3% 9.8%Norway N.A. 0.3% 0.1% 1.0% 1.1%South africa 24.4% 7.3% 5.7% 7.4% 6.1%Switzerland 1.6% 1.4% 2.1% 4.9% 13.0%Thailand 12.4% 11.2% 9.3% 11.2% 9.3%Tunisia N.A. 17.3% 12.6% 21.0% 23.7%Turkey 5.3% 3.1% 1.4% 4.4% 4.4%United states of america 3.5% 2.1% 1.6% 2.5% 2.6%Vietnam 17.5% 12.8% 14.9% 12.8% 14.9%
GTAP5
A consistent, ad-valorem equivalent measure of applied protection across the world
43
LIST OF WORKING PAPERS RELEASED BY CEPII34
No Title Authors
2004-21 IMF in Theory: Sovereign Debts, Judicialisation and Multilateralism
J. Sgard
2004-20 The Impact of Multilateral Liberalisation on European Regions: a CGE Assessment
S. Jean & D. Laborde
2004-19 La compétitivité de l'agriculture et des industries agroalimentaires dans le Mercosur et l'Union européenne dans une perspective de libéralisation commerciale
N. Mulder, A. Vialou, B. David,
M. Rodriguez & M. Castilho
2004-18 Multilateral Agricultural Trade Liberalization: The Contrasting Fortunes of Developinc Countries in the Doha Round
A. Bouët, J.C. Bureau, Y. Decreux & S. Jean
2004-17 UK in or UK out? A Common Cycle Analysis between the UK and the Euro Zone
J. Garnier
2004-16 Regionalism and the Regionalisation of International Trade
G. Gaulier, S. Jean & D. Ünal-Kesenci
2004-15 The Stock-Flow Approach to the Real Exchange Rate of CEE Transition Economies
B. Egert, A. Lahrèche-Révil &
K. Lommatzsch
2004-14 Vieillissement démographique, épargne et retraite : une analyse à l’aide d’un modèle d’équilibre général à agents hétérogènes
C. Bac & J. Chateau
2004-13 Burden Sharing and Exchange-Rate Misalignments within the Group of Twenty
A. Bénassy-Quéré, P. Duran-Vigneron,
A. Lahrèche-Révil & V. Mignon
2004-12 Regulation and Wage Premia S. Jean & G. Nicoletti
34
Working papers are circulated free of charge as far as stocks are available; thank you to send your request to CEPII, Sylvie Hurion, 9, rue Georges-Pitard, 75015 Paris, or by fax : (33) 01 53 68 55 04 or by e-mail [email protected]. Also available on: \\www.cepii.fr. Working papers with * are out of print. They can nevertheless be consulted and downloaded from this website.
34 Les documents de travail sont diffusés gratuitement sur demande dans la mesure des stocks disponibles.
Merci d’adresser votre demande au CEPII, Sylvie Hurion, 9, rue Georges-Pitard, 75015 Paris, ou par fax : (33) 01 53 68 55 04 ou par e-mail [email protected]. Egalement disponibles sur : \\www.cepii.fr. Les documents de travail comportant * sont épuisés. Ils sont toutefois consultable sur le web CEPII.
CEPII, Working Paper No. 2004-22
44
2004-11 The Efficiency of Fiscal Policies: a Survey of the Literature
S. Capet
2004-10 La réforme du marché du travail en Allemagne : les enseignements d’une maquette
S. Capet
2004-09 Typologie et équivalence des systèmes de retraites P. Villa
2004-08 South – South Trade: Geography Matters S. Coulibaly & L. Fontagné
2004-07 Current Accounts Dynamics in New EU Members: Sustainability and Policy Issues
P. Zanghieri
2004-06 Incertitude radicale et choix du modèle P. Villa
2004-05 Does Exchange Rate Regime Explain Differences in Economic Results for Asian Countries?
V. Coudert & M. Dubert
2004-04 Trade in the Triad: How Easy is the Access to Large Markets?
L. Fontagné, T. Mayer & S. Zignago
2004-03 Programme de travail du CEPII pour 2004
2004-02 Technology Differences, Institutions and Economic Growth: a Conditional Conditional Convergence
H. Boulhol
2004-01 Croissance et régimes d’investissement P. Villa
2003-22 A New Look at the Feldstein-Horioka Puzzle using a Integrated Panel
A. Banerjee P. Zanghieri
2003-21 Trade Linkages and Exchange Rates in Asia :The Role of China
A. Bénassy-Quéré & A. Lahrèche-Révil
2003-20 Economic Implications of Trade LiberalizationUnder the Doha Round
J. Francois, H. van Meijl &
F. van Tongeren
2003-19 Methodological Tools for SIA - Report of the CEPII Worshop held on 7-8 November 2002 in Brussels
2003-18 Order Flows, Delta Hedging and Exchange Rate Dynamics
B. Rzepkowski
2003-17 Tax Competition and Foreign Direct Investment A. Bénassy-Quéré, L. Fontagné &
A. Lahrèche-Révil
2003-16 Commerce et transfert de technologies : les cas comparés de la Turquie, de l’Inde et de la Chine
F. Lemoine & D. Ünal-Kesenci
CEPII
DOCUMENTS DE TRAVAIL / WORKING PAPERS
Si vous souhaitez recevoir des Documents de travail, merci de remplir le coupon-réponse ci-joint et de le retourner à :
Should you wish to receive copies of the CEPII’s Working papers,
just fill the reply card and return it to:
Sylvie HURION – Publications CEPII – 9, rue Georges-Pitard – 75740 Paris – Fax : (33) 1.53.68.55.04
M./Mme / Mr./Mrs ..................................................................................................................
Nom-Prénom / Name-First name .............................................................................................
Titre / Title ...............................................................................................................................
Service / Department................................................................................................................
Organisme / Organisation.........................................................................................................
Adresse / Address.....................................................................................................................
Ville & CP / City & post code..................................................................................................Pays / Country.............................................................. Tél......................................................
Désire recevoir les Document de travail du CEPII n° :
Wish to receive the CEPII’s Working Papers No:..................................................................
..................................................................................................................................................
..................................................................................................................................................
..................................................................................................................................................
..................................................................................................................................................
..................................................................................................................................................
..................................................................................................................................................
..................................................................................................................................................
..................................................................................................................................................
Souhaite être placé sur la liste de diffusion permanente (pour les bibliothèques)Wish to be placed on the standing mailing list (for Libraries).