Embed Size (px)
Citation preview

Acta metall, mater. Vol. 41, No. 9, pp. 2611-2624, 1993 0956-7151/93 $6.00 + 0.00 Printed in Great Britain. All rights reserved Copyright © 1993 Pergamon Press Ltd
A SELF-CONSISTENT ANISOTROPIC APPROACH FOR THE SIMULATION OF PLASTIC DEFORMATION AND TEXTURE
DEVELOPMENT OF POLYCRYSTALS: APPLICATION TO ZIRCONIUM ALLOYS
R. A. LEBENSOHN and C. N. TOMf~t Instituto de Fisica Rosario (CONICET-UNR) and Facultad de Ciencias Exactas,
Ingenieria y Agrimensura (UNR), 27 de Febrero 210 bis, 2000 Rosario, Argentina
(Received 28 September 1992; in revised form 1 March 1993)
Abstract--We present in this work a visco-plastic self-consistent (VPSC) anisotropic approach for modeling the plastic deformation of polycrystals, together with a thorough discussion of the assumptions involved and the range of application of such approach. We use the VPSC model for predicting texture development during rolling and axisymmetric deformation of Zirconium alloys, and to calculate the yield locus and the Lankford coefficient of rolled Zircaloy sheet. We compare our results with experimental data and find that they are in good agreement with the available experimental evidence. We also compare the VPSC predictions with the ones of a Full Constraints approach and observe that they differ both quantitatively and qualitatively: according with the predictions of the VPSC scheme, deformation is accommodated mostly by the soft systems, the twinning activity is much lower, and fewer systems are active, in average, per grain. These results are a consequence of having accounted for the grain interaction with its surroundings, which is a crucial aspect when modeling plastically anisotropic materials.
1. INTRODUCTION
Polycrystal plasticity and texture development of non-cubic materials are characterized by the variety of active deformation modes present in each grain, non-negligible twinning activity accompanied by a substantial fraction of grain reorientation, and highly directional grain interactions. Our approach to the modeling of such a problem has been, to the extent that it is possible, to analyze and model separately each of the previous elements, and to evaluate their relative contribution to the overall material behavior [1-41.
The variety of slip and twinning modes found in anisotropic materials makes it impractical to study the deformation textures associated with all possible combinations of their Critical Resolved Shear Stresses (CRSS). In an early paper [1] we propose a systematic procedure that permits to reduce substan- tially the combinations to be accounted for, by identifying domains of CRSS's leading to basically the same deformation textures. More recently, we propose a Volume Fraction Transfer Scheme (VFT) which accurately accounts for the contribution to texture development of the twinned grain fractions and greatly improves the prediction of textures in anisotropic materials [2, 3, 5]. Also in a recent paper [4], we analyze the stress state leading to twin acti- vation in materials of different crystallographic struc-
tPermanent address: Reactor Materials Research Branch, Whiteshell Laboratories, Atomic Energy of Canada, Pinawa, Manitoba, Canada ROE 1L0.
ture, and come to the conclusion that a CRSS on the twinning plane is a necessary condition for activating twinning.
In this work we address a more fundamental problem, which is at the basis of every polycrystal model, namely: the interaction of the grain with its surroundings. The strength of such interaction dic- tates how much of the plastic deformation will be accommodated by the grain and how much by the surroundings. It is evident that the relative anisotropy of grain and matrix will be directly responsible for such response and, as a consequence, both have to enter explicitly in the formulation. The classical Taylor-Bishop-Hill assumption [6, 7]---clenoted in what follows as the Full Constraints (FC) ap- p roach- imposes the same deformation to every grain, irrespectively of its anisotropy. While such assumption assures the fulfillment of compatibility, it disregards any possible departure of the grain defor- mation from the average, so implicitly stating that the surroundings dictate the grain deformation, indepen- dently of the relative anisotropies. The Relaxed Con- straints (RC) formulation [8], on the other hand, allows for some of the strain components in the grain to differ from the average ones, but such relaxation is based on grain shape and stress continuity con- siderations and not in the relative stiffness of grain and matrix.
The papers of Krrner [9] and Budiansky and Wu [10], are the first ones concerned with treating the grain interaction effects during plastic deformation. The approach chosen by these authors is based on a
2611

2612 LEBENSOHN and TOM]~: PLASTICITY AND TEXTURE DEVELOPMENT OF POLYCRYSTALS
fully elastic accommodation by the matrix of the plastic misfit, which in practice amounts to assuming a rigid matrix (and so a FC approach) when the plastic deformation is much larger than the elastic. An elasto-plastic model proposed by Hill [11], which allows for plastic accommodation in the matrix, was implemented by Hutchinson [12] to simulate the elasto-plastic transition in a random aggregate of f.c.c, grains. An elaborate large-strain elasto-visco- plastic scheme developed by Nemat-Nasser and Obata [13] has been recently implemented by Harren [14, 15] for calculating texture development during plastic deformation of f.c.c, materials. The predic- tions of this scheme, though, converge rapidly to the results of the FC model, indicating that the incremen- tal technique used for solving the elasto-visco-plastic equations does not describe correctly the grain- matrix interaction.
An alternative strategy for tackling the problem of large plastic deformations is to neglect the elastic effects and assume that stress equilibrium is governed by a visco-plastic (instead of an elasto-plastic) equation. This is the approach adopted by Hutchinson [16] for modeling steady creep of poly- crystals, and by Molinari et al. [17] for modeling the texture development associated with large defor- mations of cubic polycrystals. Although the tangent model of Molinari et al. seems to coincide with Hutchinson's incremental model in the so called 1-site approximation, both models lead to different results, as will be discussed in Section 3. For numerically implementing the l-site approach, Molinari et al. [17] assume that the visco-plastic response of the matrix is isotropic, so sacrificing part of the anisotropic charac- ter of the grain-matrix interaction. The l-site scheme has also been applied to materials with hexagonal [18], trigonal [19] and orthorhombic symmetry [20].
The approach that we use in this work is based on the assumption that each grain can be treated as an inhomogeneity embedded in the homogeneous effec- tive medium represented by the polycrystal. Such a formulation leads to an interaction equation that linearly relates the stress and strain rate in the grain with the overall stress and strain rate of the effective medium. The condition that the average of stress and strain rate over all the grains has to be consistent with the equivalent macroscopic magnitudes, makes for the self-consistent resolution of the problem. No attempt is made in this work to include hardening effects, which will be the subject of a future study [21]. In our formulation we adopt an integral instead of an incremental approach, we borrow the concept of tangent behaviour from reference [17], and we explic- itly account for the plastic anisotropy of grain and polycrystal, grain shape effects, and their evolution with deformation. In order to make a thorough discussion of the assumptions involved and their validity, and in order to compare with existing formu- lations, it seems appropriate to fully reproduce our formulation in what follows.
The plan of the paper is as follows: in Section 2 we present the constitutive equations for the grain and the polycrystai. In Section 3 we explain the relevant aspects of the visco-plastic inclusion formulation, derive the interaction equation and describe the iter- ative scheme for solving the polycrystal deformation self-consistently. In Section 4 we apply the VPSC scheme to the calculation of rolling and axisymmetric deformation textures in zirconium alloys, compare the predictions with experimental measurements and discuss the results. Also in Section 4 we predict Lankford coefficients and polycrystal yield loci of rolled sheet, and compare them with experimental data for Zircaloy-4. Finally, in Section 5 we draw some general conclusions concerning active defor- mation mechanisms and the validity of the VPSC anisotropic approach. A comprehensive derivation of the interaction equation for the visco-plastic in- clusion problem is presented in the Appendix.
2. CONSTITUTIVE EQUATIONS FOR GRAIN AND POLYCRYSTAL
We present in this Section the equations that relate stress and strain rate at the single crystal and at the polycrystal level. Stress and strain rate are second order symmetric tensors, with six independent com- ponents, and can be represented by means of a six dimensional vector. However, since plastic defor- mation takes place through shear and is independent of the hydrostatic stress component, plasticity can be formulated in terms of only the deviatoric stress and strain rate tensors. As a consequence, a five dimen- sional vector suffices to represent those magnitudes. Here we adopt the convention proposed by Lequeu et al. [22] (with the first two components inter- changed)
a ' = , / ~ ( ( ~ 3 3 - ~ . ) + (~33 - ~22) \ 2,/g
622 -- 61______~1 ) 2 ' a23' al3, a~2 (1)
/
\ 2,¢/~ e22- ell . . )
2 ,q3,E13,~12 (2) /
which has the advantage that stress and strain rate vector components have the same form. Although it is evident from their definition that the vector com- ponents are independent of the tensor's trace, we will keep the prime on deviatoric stresses in order to differentiate them from the Cauchy stress com- ponents. According to this convention, the plastic energy rate is given by the scalar product between both vectors 07~k=a;j(:ij). A sixth vector com- ponent, proportional to the tensor's trace, will be added later (see Appendix), but for the formulation that follows it is redundant and will not be con- sidered.

LEBENSOHN and TOMI~: PLASTICITY AND TEXTURE DEVELOPMENT OF POLYCRYSTALS 2613
Plastic deformation takes place when a slip or a twinning system becomes active. Each deformation system is characterized by a vector n (normal to the slip or the twinning plane) and a vector b (Burgers vector in the case of slip and twin shear direction in the case of twinning). The Schmid tensor of system
s __ 1 (s), defined as m~j- 5(n~bj+ njb~), is symmetric and traceless, and is represented here using the same vector convention defined by equations (1) and (2). In vector notation, the resolved shear stress on the system (s), z~, adopts the form
z~ = m~a(, (3)
where repeated lower indices imply summation. The plastic strain rate associated with the shear rate in the system (s), ~ , is given by
ek = m~'~'. (4)
The shear rate induced in (s) by a given applied stress is here described by a rate sensitive criterion, which formally amounts to assuming a non-linear viscous response
) (5)
where Y0 is a reference rate, z~ is a threshold stress (linked to Y0) and n is the inverse of the rate sensi- tivity. When n ~ 1 the activity of the system is negligible unless z~ is very close to z~, and the latter can be identified with the CRSS characteristic of the Schmid criterion. We will see later, though, that the formulation tends to a lower bound when n is too large, and that n should not be larger than approxi- mately 20. Replacing (5) in (4) gives a kinematic equation for each grain of the polycrystal
o' s m ~ fm]tr]'~" ek= 70 _271 k t--~--¢ ) (k = 1,5) (6)
where the sum is carried over all the systems in the grain. This non-linear system of 5 equations contains 10 unknowns: the 5 strain rate and the 5 deviatoric stress components. Within the FC or the RC ap- proaches, the system is solved for each grain separ- ately, imposing either the five strain rate components or a combination of five stress and strain rate com- ponents respectively. Since the underlying assump- tion is that the grain "follows the dictates" of the polycrystal, both schemes give good results when dealing with materials of low plastic anisotropy. The approach that we use in this work, instead, couples the strain-rate and the stress in each grain with the average strain rate and the average stress in the polycrystal, so providing another set of five equations. These equations have to be solved in combination with the system (6) using the self- consistent formulation that will be described in Section 3.
Following Hutchinson [16], equation (6) is rewrit- ten in a pseudo-linear form
. . . . .
~,= ~0~=, ~ \ ~ ] j , - M ~ j (~)oj (7)
where M~ ~¢) are the secant visco-plastic compliance moduli of the grain. Except for n = 1, M ~¢~¢¢~ depends on the stress and the validity of the linear relation between stress and strain rate is limited to the precise point a ' ~ that describes the grain state. A linear relation valid in the vicinity of the point 6"~g is obtained by doing a Taylor expansion of (7) around #', which defines the tangent modulus M c(tg) and the back extrapolated term ~0
• gg, I E i ~ - - 1 ~ / i i t # ~ j 1.=~,~;+~0= • ..... ',~'~,,'+~7. (8)
The relation between the grain's secant and tangent moduli is simply
M C ~ tg) ~ n A 4 c ( s e c ) _.._? . ( 9 )
At the macroscopic level, the overall polycrystal response is assumed to be described by constitutive equations similar to (7) and (8). If 1~ and Z' are the polycrystal strain rate and deviatoric stress respect- ively, the secant relation can be written as
£ = MIT~(~'IZ; (lO)
while the tangent relation, valid also in the vicinity of Z, adopts the form
with
(tg) ' , /~i M,: ( Z ) Z j + / ~ ° (111
M!tg) = g - ' [ (12)
Hutchinson [16] demonstrates that the polycrystal tangent and secant moduli fulfill the same relation derived earlier for the single crystal moduli
• - n M , . ( 1 3 )
A word is in order at this point concerning the previous constitutive equations. Equations (8) and (11) are exact only when they describe the strain rate associated with the stress used as a reference for the expansion, otherwise they are only approximate. This does not represent a limitation in the case of the grain, because the stress and the strain rate will be assumed to be uniform within it, and the actual value of stress can always be chosen as the reference for the linear expansion. This is also true for (11) when it is used to describe the response of a homogeneous medium, in which case it is equivalent to the secant form (10). The limitation appears, though, when (11) is used to describe the response of a homogeneous medium in the vicinity of an inclusion, where local variations in stress take place: in such a case, the stress variations have to be within the interval where
2614 LEBENSOHN and TOMt~: PLASTICITY AND TEXTURE DEVELOPMENT OF POLYCRYSTALS
the tangent approximation is assumed to be ade- quate. As for the secant form, it is not appropriate for describing such dependence.
in equation (16) gives the classical interaction equation.t
i ' = - l ( , l f f ' ( 1 8 )
3. THE INCLUSION FORMALISM where 1('I is the interaction matrix defined as
The tangent approximation of equation (11) amounts to regarding the aggregate as a homogeneous equivalent medium (HEM) having a visco-plastic com- pliance M (ts) plus a reference strain rate 1~ °, whose behavior is identical to the overall behaviour of the polycrystal. Each grain, characterized by the visco- plastic compliance M ~tg) plus a reference strain rate i °, is in turn regarded as an inhomogeneity embedded in the HEM, which disturbs the stress field locally when a uniform stress is applied to the HEM. The problem of an inhomogeneity embedded in a homogeneous matrix being acted upon by the uniform stress X' at infinity can be solved using the Eshelby formalism, which is reviewed in the Appendix. Within this approach, the inhomogeneity is replaced by an 'equivalent inclusion' having the same moduli (Mttg), ]~0) of the polycrystal but undergoing a ficti- tious transformation strain rate i* that induces the same stress in the inclusion and in the surroundings as the inhomogeneity does. The condition that i* has to fulfill within the domain of the inclusion is, after equations (8) and (11), that
dk = Mff)tr~ +/~0 + d* (14)
It is convenient, for what follows, to write this equation in terms of the stress and strain rate devi- ations in the inclusion with respect to the polycrystal averages. The deviations are defined by
e; = ~ ; - x ; . (15)
Replacing (15) in equation (14) and using (11) gives
~k - ~ ' = M~)#; • (16)
We show in the Appendix that (16) is formally equivalent to the equation that describes the elastic inclusion problem (once the hydrostatic pressure is accounted for), and that the strain rate deviation in the inclusion is uniform and given by
ek = S k / * (17)
where Ski is the matrix representation of the visco- plastic (instead of the elastic) Eshelby tensor, a function of the shape of the inclusion and the tangent visco-plastic moduli. As we discuss in the Appendix, the incompressibility associated with the plastic deformation requires taking special care when calcu- lating S. Replacing the inverse of equation (17)
tThe explicit index notation will be omited in what follows, and the tensorial contraction will be represented as the product of boldface tensors.
lq'I = (I - S)-ISM (tg). (19)
Observe that, since the absolute value of the com- ponents of the Eshelby tensor are always lower than unity, the interaction matrix is of the order of the tangent moduli of the polycrystal. From a physical point of view, it is meaningful that the tangent moduli enter in the interaction equation, instead of the secant moduli, because it is the former which describe the response of the HEM in the vicinity of the inclusion, where the stress departs from the average loading conditions. The relation between macroscopic secant and tangent moduli given by (13) permits to express the equations in terms of the secant moduli. In what concerns the Eshelby tensor, it is a function of the tangent moduli but, since it is a homogeneous func- tion of degree zero (see Appendix) and since M (tg) = n M (~), the same result is obtained when cal- culated using the secant moduli. As a consequence, the interaction tensor can be simply expressed as
1(-I = n (I - S)-ISM(~). (20)
Molinari et al. [17] use a general formalism which takes into account the interaction of each grain with the nearest neighbours, and assumes a HEM beyond such a cluster. They arrive at a more general form of the interaction equation, which reduces to ours in what they call the 1-site approximation, which con- sists in ignoring the neighbouring grains, leaving only the HEM. For the purpose of numerical implemen- tation of the 1-site approach, however, they assume that the visco-plastic response of the HEM is iso- tropic, in which case the compliance tensor of the HEM is described by only one independent modulus. The disadvantage of such an approach is that it only retains the anisotropy of the grain but does not account for the plastic anisotropy of the medium. Besides, in their calculations they actually assume the visco-plastic stiffness tensor to be isotropic, which is an approximation because it still depends explicitly upon the overall stress components [23].
So far, we have been able to relate the stress and the strain rate in each grain with the corresponding magnitudes in the HEM, assuming that the visco- plastic moduli of the grain and of the HEM are known in advance, which is not the case. The assump- tion that the HEM describes the average behaviour of the aggregate, though, leads to the condition that the weighted average of stress and strain rate over the grains has to coincide with the corresponding macro- scopic magnitudes. The latter condition provides an expression from which the overall tensor M (~) can be calculated in a self-consistent iterative way. Using
LEBENSOHN and TOMI~: PLASTICITY AND TEXTURE DEVELOPMENT OF POLYCRYSTALS 2615
equations (7) and (10), equation (18) may be written in the form
Wlf ' = a ' (21)
where
W = (M ~(~°~) + lq'I)-'(M ~ ) + 1('1) (22)
is called the a c c o m m o d a t i o n t e n s o r . The secant re- lation (7) for the grain adopts the form
M~)(B~Z ') = i (23)
The condition that ( i ) = I ~ , where ( ) indicates weighted average over all the grains, leads to
( M C t ~ ) B c > 2;' = M ¢ = ) X ' ( 24 )
Equation (24) is fulfilled when
M (~) = (M~tS~¢)B ¢) ( 25 )
but since n ~ ) depends implicitly upon ,Y', we cannot guarantee that this is an unique solution. Equation (25) indicates that the polycrystal compliance is given by an average of the single crystal compliances, weighted by the associated volume fraction and the accommodation tensor B c, defined by equation (22). Since B ~ is a function of M ~) , both explicitly and through the dependence of M upon n I=), the ex- pression (25) represents an implicit equation from which M ¢~) has to be obtained self-consistently.
An interesting limit of equation (25) is the rate insensitive case, when n--,oo, because it reveals a limitation of the linear response assumption in par- ticular, and of the model in general. Equation (25) may be rewritten explicitly in terms of the secant moduli using (20) and (22) as
/n~l=~ ) [nt~"~) + n(l - S) 1SM¢~)]\ M ~ = \ [M ¢¢~c~ + n (I - S) -~ SM~C)]/ (26)
Since M ̀ ts"°) and M ~s°~) are of the same order of magnitude and since the components of (I - S)- ~ S are of the order unity then, in the rate insensitive limit n ~oc , the predicted polycrystal compliance tensor reduces to the average of the grain compliances
M <~=) = ( M ¢~)) (27)
which is the result that would be obtained using the Reuss assumption of uniform stress in the medium. This implies that our formulation should reduce to the lower bound formulation in the rate insensitive limit and, as matter of fact, the results of our calculations confirm such conclusion. The polycrystal response starts to show a change in tendency for n > 20: the average number of active systems per grain and the stress deviations in the grains with respect to the average decrease as n increases beyond n = 20. The reason for such behaviour is to be found in the non-validity of the tangent approximation for describing the increasingly non-linear characteristics of the polycrystal.
The incremental formulation proposed by Hutchinson [16], on the contrary, converges to the
upper bound in the rate insensitive limit, as is evident from observing the results plotted in Fig. 1 of his paper. We were able to reproduce those results by using the secant (instead of the tangent) modulus in equation (19), to calculate the interaction tensor lfl. Since such empirical correction amounts to consider a matrix n times less compliant than what our formulation requires, and since the upper bound is characterized by a rigid matrix, it is logical that such procedure will lead to the upper bound in the limit n--, oo. The difference between Hutchinson's formu- lation and ours is in the interaction equation: Hutchinson assumes a relation between the stress and strain rate i n c r e m e n t s of the form:
( 6 i - 61~) = - l ~ ' l ( 6 a ' - 6 . r ' ) . (28 )
Our interaction equation (18), on the other hand, applies to the t o t a l stress and strain rate, and when differentiated it becomes
( 6 i - f i t ) = - I f l ( & r ' - 6 i f , ' ) - 6 I f l ( a ' - i f , ' ) . (29)
The extra term with respect to (28) arises because of the dependence of the compliance on the stress. As discussed above, the consequences of this modifi- cation are important when n is large, and further work will be required in the future in order to clarify this point.
The visco-plastic formulation described above is implemented in this work for the calculation of texture development as follows: the final polycrystal deformation is achieved through successive incremen- tal deformation steps, obtained by imposing a macro- scopic strain rate !~ during a time interval At. At each step, guess values for the strain rate i in each grain are proposed: for the first deformation step, a FC guess is used and the stress is calculated solving equation (6); for the following steps, the strain rate and the stress of the previous step are assumed as starting guess values for the grain. The self-consistent problem is solved by means of two nested iterative procedures. Within the innermost loop, the crystals secant moduli M ~ ) are calculated for given a ' using (7) and are kept fixed. The first estimate of the macroscopic secant modulus Mts=) is done using a Voigt average: M t~c)-' = ( M ct~) ' ) ; for consequent estimates the value derived in the previous step is used. M (S~ is in turn used to calculate the Eshelby tensor S, the interaction tensor lfl and the accommo- dation tensor B c. Next, equation (25) is solved itera- tively, as follows: the average ( M ¢ ~ B ~) is calculated and used as an improved guess for the overall tensor M (s~). The iteration is repeated until the average coincides with the input tensor within a certain tolerance, in which case the innermost procedure is terminated, and the M (s"°) so obtained is used to calculate the macroscopic stress:
r , = M c~ec) ~1~ (30)

2616 LEBENSOHN and TOM]~: PLASTICITY AND TEXTURE DEVELOPMENT OF POLYCRYSTALS
Replacing (6) and (30) into the interaction equation (18), yields a system of 5 non-linear equations for each grain:
• s o
y0 ~ mk ~- -~- - - ] - /~k =- - .~k t ( t r¢ - Z { ) ( 3 1 )
from which the 5 components of a ' can be calculated and replaced in (6) to derive the associated strain rate in the grain i. For self-consistency to be guaranteed, the recalculated o ' has to coincide with the values assumed at the beginning of the innermost loop for calculating the M ~(~). Consequently, two conver- gence conditions are tested at this point
I(o 'on)) - Z'I < error
(la '(n) - o '(n- 1)1) < error (32)
where the subindices (n - 1) and (n) refer to succes- sive iterations and the relative error is typically set equal to 1%. If the conditions (32) are not simul- taneously verified, the recalculate ~ and tr' are used as the new guess to recalculate M ¢~), and the innermost iteration loop is repeated.
Once convergence is achieved, the reorientation of each grain due to slip and twinning must be per- formed before attempting the next deformation step. Since the formulation allows the grains to deform by different amounts, the lattice rotation rate for each grain is given by
d)ij = Dij + I'IqklSklmnEmn-~ '" - ~ ½(b, nj -- b/n,) '9 ~ (33) s
where ~ is the antisymmetric component of the macroscopic distortion rate, the second term is the reorientation of the associated ellipsoid derived in the Appendix, and the last term is the antisymmetric component of the plastic distortion rate. The term associated with the reorientation of the ellipsoid is proportional to the difference between the strain rate in the grain and in the polycrystal, and increases with the ellipsoid distortion, as Tiem et al. show for the elastic inclusion case [24]. For the particular cases of rolling and axisymmetric tension which are presented later, this term contributes less than 1% at the beginning of deformation, but represents about 40 and 20%, respectively, of the total lattice rotation rate at 1.0 true strain.
As we have demonstrated recently [2, 3], modeling the grain reorientation in materials presenting sub- stantial twinning activity, makes it advisable to use the Volume Fraction Transfer (VFT) scheme for a proper treatment of the twinned fractions. Within the VFT scheme the polycrystal is represented by means
tZircaloy refers to the class of zirconium alloys containing primarily Sn, Fe and Cr. Zircaloy-2 and Zirealoy-4 are used in nuclear power reactors, and their composition in weight percent is: (1.5%Sn, 0.12%Fe, 0.10%Cr, 0.05%Ni, 0.01%O, Zr bal) and (l.5%Sn, 0.21%Fe, 0.10%Cr, 0.01%0, Zr bal), respectively.
of a discrete set of orientations which are kept fixed while the associated volume fractions are allowed to evolve during deformation. The Euler space (Bunge angles convention) is partitioned regularly in ap- proximately equiaxed cells of 10 ° by side. The orien- tations are made to coincide with the center of the cells and a certain volume fraction of material is assigned to each cell in correspondence with the initial texture. Plastic deformation is imposed to these representative grains and the resulting reorientation can be visualized as a displacement in Euler space of the representative point. We assume that the cell as a whole displaces rigidly by that amount and that the material is uniformly distributed within it. When displaced, the cell partially overlaps with the neigh- boring cells and the volume fraction of material contained in the overlapped portions is subtracted from it and transferred to the neighboring cells. This process of transference, repeated after every strain increment, leads to a gradual variation of the volume fraction in each cell and so to texture development. When twinning is active, a fraction of the grain adopts a new orientation and is transferred to the corresponding cell in Euler space and accumulated to the fraction already assigned to the cell. By doing this we manage to account exactly for every twinned fraction in every twin system of every grain after each strain increment.
4. RESULTS AND DISCUSSION
The self-consistent formulation described in the previous section permits to account for deviations in the grain behavior from the average behavior of the polycrystal. Such deviations can be significant for materials with marked plastic anisotropy and, as a consequence, important differences with respect to the predictions of classical formulations should be expected for hexagonal (and, in general, non-cubic) materials. On the contrary, no great improvements are obtained for cubic materials, as Molinari et al. have shown using the "isotropic HEM" self-consist- ent scheme [17]. However, one has to bear in mind that if the heterogeneity between the grain and the HEM properties is large, the stress deviation with respect to the average in the vicinity of the grain can be expected to be large too, and the tangent approxi- mation will be less accurate in such case.
In what follows, we present the comparison be- tween experimental and calculated textures obtained with the FC and the VPSC formulations for Zirco- nium alloys deforming in plane strain, axisymmetric tension and axisymmetric compression. The Poly- crystal Yield Surface (PCYS) and the Lankford co- efficients of Zircaloyt sheet are calculated using different schemes and are also compared with exper- imental results. Here, an exponent of n = 19 is used to describe the rate dependence of the slip and twinning systems in the calculations that follow. This exponent is meant to describe a fairly rate insensitive

LEBENSOHN and TOMI~: PLASTICITY AND TEXTURE DEVELOPMENT OF POLYCRYSTALS 2617
material, without exceeding the range of validity of the tangent approximation. The active deformation systems are assumed to be: {10T0}(I~I0) prism slip, {10T2}(10T1) tensile twins (ttw) and {21T2}(21-1-3) compressive twins (ctw). The relation between CRSS's used here is the one that gives the best agreement with experimental results namely, zPr: z ~tw :r c~ = 0.8:1:2. Although such relation differs from the ratio 1 : 2 : 2 that we use in our previous FC calculations [3], the FC formulation is insensitive to this difference in CRSS's, because both combinations fall within the same topological domain of the Single Crystal Yield Surface [3]. Except for small differences that arise from using a slightly different Euler space cell partition and from deforming up to 100% (in- stead of 50%) true strain, it is evident that the textures reported in this work coincide with the FC textures reported in reference [3]. The ratio of CRSS's is kept constant throughout the deformation process, which amounts to neglecting hardening effects. At the beginning of deformation the grains are assumed to be equiaxed (the representative ellipsoid is a sphere) and, as deformation proceeds, the grain shape is updated in average but not individually. The grain shape enters into the calculation of the Eshelby tensors S and II, which are a function of the ellipsoid axes,
In what follows, together with the calculated pole figures, we present grain statistics which provide further insight concerning the characteristics of the polycrystal deformation, The average relative devi- ation of each stress component is defined by
Ac b = x / ( ( a i - Zi)2) (34) IlZll
The same definition is used for the standard deviation of the strain rate components, which is zero in the FC approximation. The relative activity of each defor- mation mode is computed as the ratio of two weighted averages over the grains: the sum of the plastic shears contributed by a given mode (i.e. prismatic systems) divided by the sum of the shears contributed by all the deformation modes. Another statistic refers to the number of significantly active systems, defined as the weighted average of the active systems in each grain (nO), where n ¢ is computed as follows: after identifying the system where the plastic shear is maximum, all the systems in the grain where the shear is at least 5% of that maximum are counted as active.
4.1. Texture development
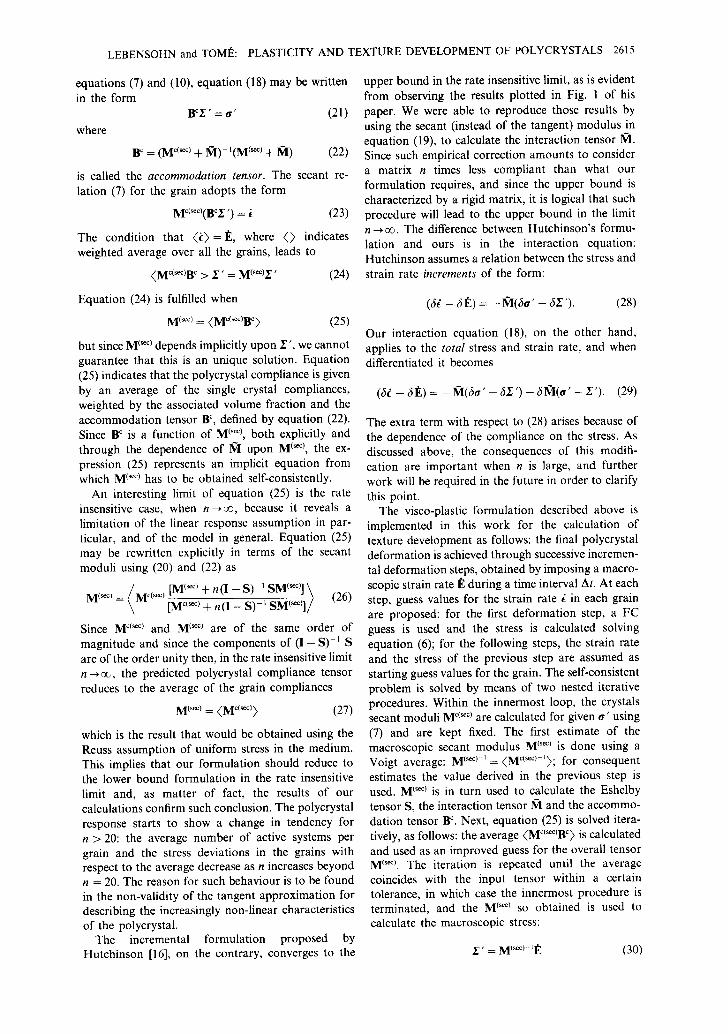
Figure 1 (a) shows a typical experimental (0002) pole figure of rolled Zircaloy-4 reported by Tom6 et al. [25]. Figure l(b) shows the (10T0) poles correspond- ing to the same experimental texture. The basal poles are preferentially oriented at an angle of 35 ° from the ND towards the TD, while the prism poles exhibit a weak maximum at the RD. Figure l(c) and (d) are the
basal and prism pole figures, respectively, predicted by the FC approach in combination with the VFT scheme. Figure l(e) and (f) correspond to the VPSC calculation, also implemented in combination with a VFT scheme. Both simulations, FC and VPSC, are carried up to 1.0 true strain, starting from a random distribution of orientations. In what concerns the basal pole distribution, we observe that the FC simulation predicts a maximum in the N D - T D plane, shifted by comparison with the experimentally ob- served one, and two unobserved texture components along the RD and the TD. The latter are a conse- quence of a relatively high activity of the compressive twins forced by the FC formulation, as will be discussed later. For the case of the VPSC calculation, the basal poles show a larger tilting towards the TD and a better agreement with the experiment, while the unrealistic components along the RD and the TD are not predicted. Concerning the prismatic poles, it can be seen that both FC and VPSC textures present the maximum along the RD, although the VPSC scheme prediction matches better the experiment.
L
(0002) (10]0) RD RD
T D
RD RD
TD T D
RD RD
T D T D
Fig. 1. (a) (0002) and (b) (10T0) measured pole figures of rolled Zrly-4 I25]; (c) (0002) and (d) (10T0) pole figures calculated with the FC formulation, deforming up to 1.0 true strain and using zPr=0.8, zttw= 1.0, re'w= 2.0; (e) (0002) and (f) (10"1"0) pole figures calculated with VPSC formulation for the same true strain and CRSS's. In all the figures, the lines correspond to multiples of random orien- tations and the dots indicate density values lower than 1.
Equal area and not stereographic projection is used.
2618 LEBENSOHN and TOM]~: PLASTICITY AND TEXTURE DEVELOPMENT OF POLYCRYSTALS
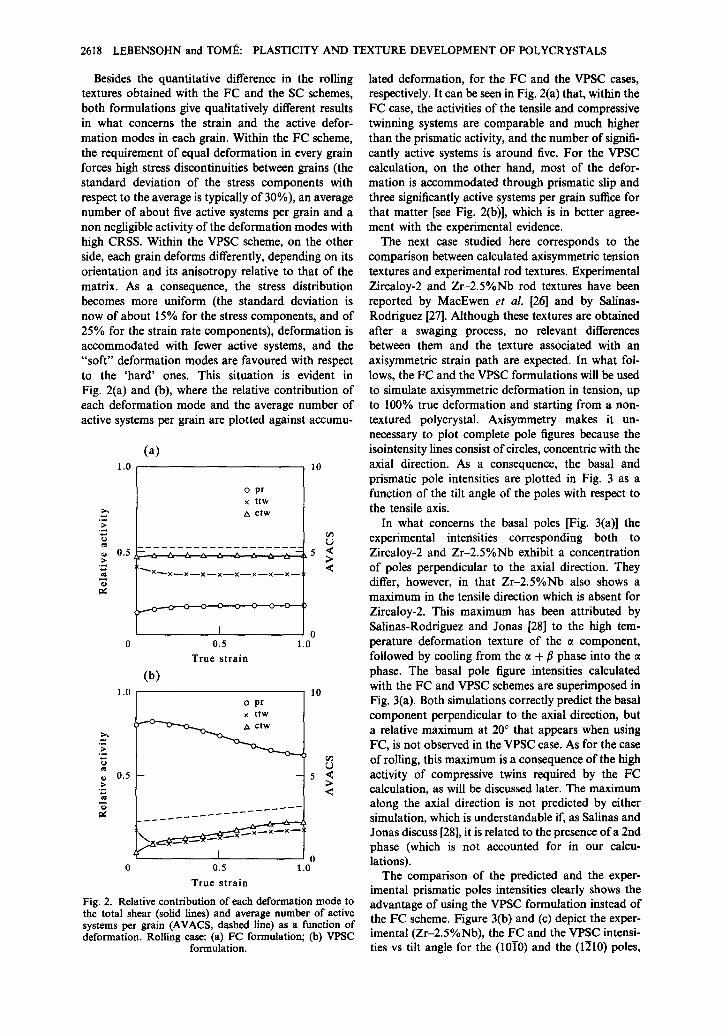
Besides the quantitative difference in the rolling textures obtained with the FC and the SC schemes, both formulations give qualitatively different results in what concerns the strain and the active defor- mation modes in each grain. Within the FC scheme, the requirement of equal deformation in every grain forces high stress discontinuities between grains (the standard deviation of the stress components with respect to the average is typically of 30%), an average number of about five active systems per grain and a non negligible activity of the deformation modes with high CRSS. Within the VPSC scheme, on the other side, each grain deforms differently, depending on its orientation and its anisotropy relative to that of the matrix. As a consequence, the stress distribution becomes more uniform (the standard deviation is now of about 15% for the stress components, and of 25% for the strain rate components), deformation is accommodated with fewer active systems, and the "soft" deformation modes are favoured with respect to the 'hard' ones. This situation is evident in Fig. 2(a) and (b), where the relative contribution of each deformation mode and the average number of active systems per grain are plotted against accumu-
( a )
1.0 10
o 0.5
1.0
o pr x ttw A ctw
~ X x x x x x x x x
I
0.5 True strain
(b)
0 1.0
r ~
<
10 o pr x ttw
.~.
o 0 . 5 - - 5 < ?- > "6 <
I o 0 0.5 1.0
True strain
Fig. 2. Relative contribution of each deformation mode to the total shear (solid lines) and average number of active systems per grain (AVACS, dashed line) as a function of deformation. Rolling case: (a) FC formulation; (b) VPSC
formulation.
lated deformation, for the FC and the VPSC cases, respectively. It can be seen in Fig. 2(a) that, within the FC case, the activities of the tensile and compressive twinning systems are comparable and much higher than the prismatic activity, and the number of signifi- cantly active systems is around five. For the VPSC calculation, on the other hand, most of the defor- mation is accommodated through prismatic slip and three significantly active systems per grain suffice for that matter [see Fig. 2(b)], which is in better agree- ment with the experimental evidence.
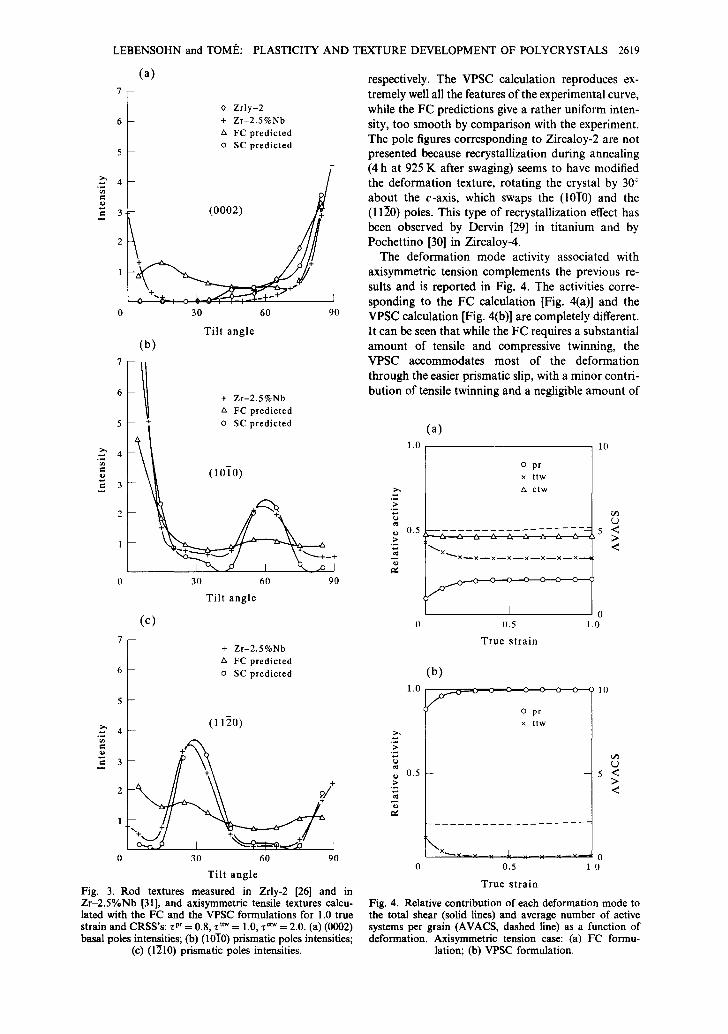
The next case studied here corresponds to the comparison between calculated axisymmetric tension textures and experimental rod textures. Experimental Zircaloy-2 and Zr-2.5%Nb rod textures have been reported by MacEwen et al. [26] and by Salinas- Rodrignez [27]. Although these textures are obtained after a swaging process, no relevant differences between them and the texture associated with an axisymmetric strain path are expected. In what fol- lows, the FC and the VPSC formulations will be used to simulate axisymmetric deformation in tension, up to 100% true deformation and starting from a non- textured polycrystal. Axisymmetry makes it un- necessary to plot complete pole figures because the isointensity lines consist of circles, concentric with the axial direction. As a consequence, the basal and prismatic pole intensities are plotted in Fig. 3 as a function of the tilt angle of the poles with respect to the tensile axis.
In what concerns the basal poles [Fig. 3(a)] the experimental intensities corresponding both to Zircaloy-2 and Zr-2.5%Nb exhibit a concentration of poles perpendicular to the axial direction. They differ, however, in that Zr-2.5%Nb also shows a maximum in the tensile direction which is absent for Zircaloy-2. This maximum has been attributed by Salinas-Rodriguez and Jonas [28] to the high tem- perature deformation texture of the ~ component, followed by cooling from the ~ + fl phase into the phase. The basal pole figure intensities calculated with the FC and VPSC schemes are superimposed in Fig. 3(a). Both simulations correctly predict the basal component perpendicular to the axial direction, but a relative maximum at 20 ° that appears when using FC, is not observed in the VPSC case. As for the case of rolling, this maximum is a consequence of the high activity of compressive twins required by the FC calculation, as will be discussed later. The maximum along the axial direction is not predicted by either simulation, which is understandable if, as Salinas and Jonas discuss [28], it is related to the presence o fa 2nd phase (which is not accounted for in our calcu- lations).
The comparison of the predicted and the exper- imental prismatic poles intensities clearly shows the advantage of using the VPSC formulation instead of the FC scheme. Figure 3(b) and (c) depict the exper- imental (Zr-2.5%Nb), the FC and the VPSC intensi- ties vs tilt angle for the (10T0) and the (l~10) poles,
LEBENSOHN and TOMI~:
(a)
7 -
6 -
5/
PLASTICITY AND TEXTURE DEVELOPMENT OF POLYCRYSTALS 2619
0 Zrly-2 + Zr-2.5%Nb " FC predicted o SC predicted
+
~:~ 4
o
"~ 3
2
1
. 0 . . . . . I
0 30 60 90
Tilt angle
4 e. o
= 3
( b )
6 + Zr-2.5%Nb " FC predicted
5 o SC predicted
~ 1 (10i0)
2 + ~ 1
I , - ~ o I '-'~ ..,o-/+ 0 30 60 90
(c)
Tilt angle
+ Zr-2.5%Nb zx FC predicted o SC predicted
(1120)
1
"÷,d
0 30 60 90
Tilt angle
3. Rod textures measured in Zrly-2 [26] and in
~' 4
¢o
," 3
Fig. Zr-2.5%Nb [31], and axisymmetric tensile textures calcu- lated with the FC and the VPSC formulations for 1.0 true strain and CRSS's: z pr = 0.8, .~ttw = 1.0, 17 ctw = 2.0. (a) (0002) basal poles intensities; (b) (10T0) prismatic poles intensities;
(c) (1~10) prismatic poles intensities.
respectively. The VPSC calculation reproduces ex- tremely well all the features of the experimental curve, while the FC predictions give a rather uniform inten- sity, too smooth by comparison with the experiment. The pole figures corresponding to Zircaloy-2 are not presented because recrystallization during annealing (4 h at 925 K after swaging) seems to have modified the deformation texture, rotating the crystal by 30 ° about the c-axis, which swaps the (1010) and the (11~0) poles. This type of recrystallization effect has been observed by Dervin [29] in t i tanium and by Pochettino [30] in Zircaloy-4.
The deformation mode activity associated with axisymmetric tension complements the previous re- sults and is reported in Fig. 4. The activities corre- sponding to the FC calculation [Fig. 4(a)] and the VPSC calculation [Fig. 4(b)] are completely different. It can be seen that while the FC requires a substantial amount of tensile and compressive twinning, the VPSC accommodates most of the deformation through the easier prismatic slip, with a minor contri- but ion of tensile twinning and a negligible amount of
>
o >
e~
( a )
1.0
0.5
o pr × ttw & c t w
: ~ X ~ ~ ~ X I X I X I X [ X [ X I X i
I
0.5
True strain
0 .0
10
o~
5 < > <
(b) 1.0 ~ 10
o pr x t t w
>
~ 0.5 - 5 < > > • -r < -d
. . . . . . . . . . . . . . . . . . . . .
0 0.5 1.0
True strain
Fig. 4. Relative contribution of each deformation mode to the total shear (solid lines) and average number of active systems per grain (AVACS, dashed line) as a function of deformation. Axisymmetric tension case: (a) FC formu-
lation; (b) VPSC formulation.

2620 PLASTICITY AND TEXTURE DEVELOPMENT OF POLYCRYSTALS
~D
t=
o
t~
t=
LEBENSOHN and TOM]~:
(a)
6 ~ 0 Zrly-2 initial
L + Zrly-2 final
5 A FC predicted
o SC predicted 4
2
0 30 60
(h) Tilt angle
0 Zrly-2 initial + Zrly-2 final ,x FC predicted o SC predicted
- ( 1 0 i 0 )
90
I 30 60 90
Tilt angle (c)
t ¢ Zrly-2 initial + Zrly-2 final lx FC predicted
I I I 30 60 90
Tilt angle
Fig. 5. Initial rod texture and final 0.2 true strain com- pression texture measured in Zrly-2 [26], and axisymmetric compressive textures, obtained starting from the same initial rod texture, calculated with the FC and the VPSC formu- lations for 0.2 true strain and CRSS's -c pr = 0 . 8 , ~.ttw = 1 . 0 ,
z on* = 2.0. (a) (0002) basal poles intensities; (b) (1010) pris- matic poles intensities; (c) (I~I0) prismatic poles intensities.
compressive twinning. The high reorientation rate associated with the twinning activity in the FC scheme, prevents the prism poles from achieving a stable orientation and is responsible for the smooth appearance of the FC intensity curve. On the other hand, the high prism activity predicted by the VPSC is a known experimental feature in Zirconium alloys. The average active systems are around five in the FC case, while only two systems per grain suffice to accommodate the deformation in the VPSC case (Fig. 4). This results emphasize another qualitative differ- ence between both schemes, namely, that within the self-consistent calculation the Single Crystal Yield Surface does not have to be closed, because the matrix accommodates deformation when the grain lacks five independent systems or when some of them are too "hard" for being activated.
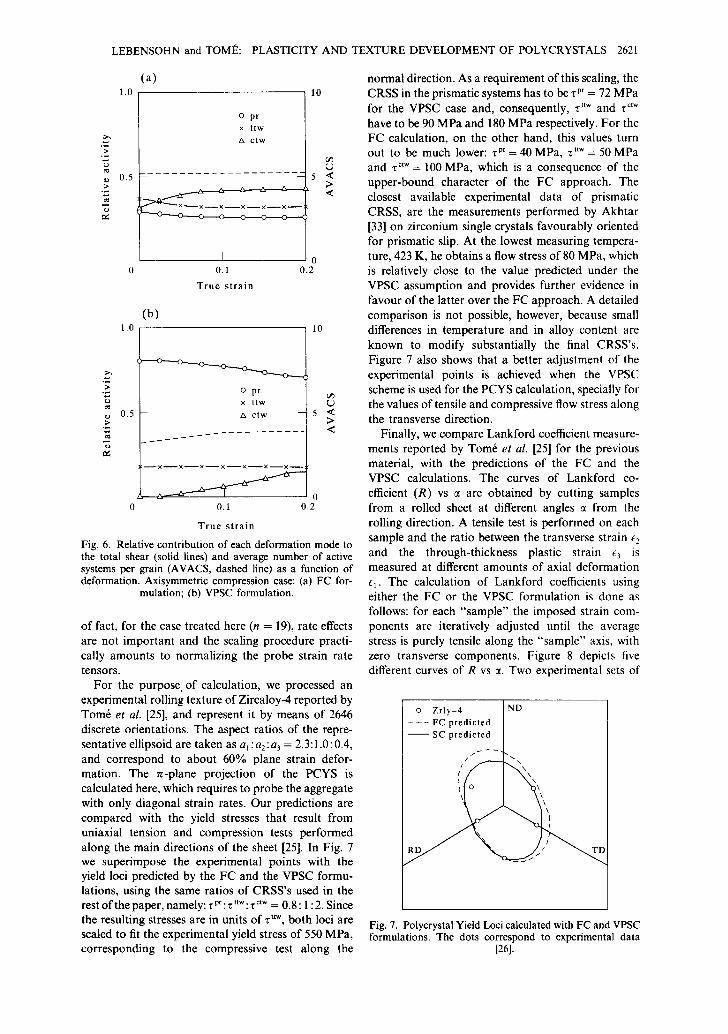
The following case is a compression experiment performed on the swaged Zircaloy-2 bar of the previous case [27, 31]. The initial rod texture used for the purpose of simulation is reported in Fig. 5, together with the experimental pole intensities after 20% compressive deformation and the corresponding predictions of the FC and the VPSC calculations. Figures 5(a, b, c) show the basal, the (10i0) prism and the (11E0) prism intensities, respectively. The strong reorientation of basal poles along the axial direction and the reorientation of the prismatic poles are accurately reproduced both, by the FC and the VPSC calculations. However, different activities are associ- ated with each calculation scheme, as can be seen in Fig. 6(a, b). Once again, the FC scheme predicts high tensile and compressive twinning activity, while the experimental evidence reported by Ballinger [32] indi- cates that compressive twins are not observed in Zircaloy-2. On the other hand, the VPSC calculation involves mainly prismatic slip, very low tensile and even lower compressive twin activity. The average active systems are five for FC and around three for VPSC (Fig. 6). The standard deviation in the stress components is of about 30% for FC and of about 15% for VPSC. In the latter case the average relative deviation of the strain rate components is of about 20% with respect to the average.
4.2. Polycrystal yield surface and Lankford coefficient
If the texture and the active deformation systems of a polycrystal are known, the VPSC formulation can be used for calculating the polycrystal yield surface (PCYS), defined as the locus (in the 5-dim stress space) of stress states that induce plastic yield of the material at constant dissipation rate. The method- ology used for obtaining the PCYS consists in prob- ing the polycrystal along different strain rate directions, and to calculate the yield stress as the weighted average of the resulting grain stresses. Each probe strain rate is scaled by a factor, in order to fulfill the condition of constant dissipation rate: (I~, s ~ ( m j a j ) ) = const., required for the yield surface to coincide with the plastic potential [16]. As a matter
LEBENSOHN and TOMI~: PLASTICITY AND TEXTURE DEVELOPMENT OF POLYCRYSTALS 2621
"6 0.5
(a) 1.o
o pr x t t w
A ctw
~ X ~ X - - X I X I X I X - -
I 0
0.1 0.2
True strain
(b)
10
1.0 ]0
L) 5 <
> <
.E~ o p r
× t t w L )
0.5 -- A ctw 5 • - <
( - - X - - X I X i X I X - - X I X -
0 0 0.1 0.2
True strain
Fig. 6. Relative contribution of each deformation mode to the total shear (solid lines) and average number of active systems per grain (AVACS, dashed line) as a function of deformation. Axisymmetric compression case: (a) FC for-
mulation; (b) VPSC formulation.
of fact, for the case treated here (n = 19), rate effects are not important and the scaling procedure practi- cally amounts to normalizing the probe strain rate tensors.
For the purpose, of calculation, we processed an experimental rolling texture of Zircaloy-4 reported by Tom6 et al. [25], and represent it by means of 2646 discrete orientations. The aspect ratios of the repre- sentative ellipsoid are taken as al : a2: a3 = 2.3:1.0: 0.4, and correspond to about 60% plane strain defor- mation. The n-plane projection of the PCYS is calculated here, which requires to probe the aggregate with only diagonal strain rates. Our predictions are compared with the yield stresses that result from uniaxial tension and compression tests performed along the main directions of the sheet [25]. In Fig. 7 we superimpose the experimental points with the yield loci predicted by the FC and the VPSC formu- lations, using the same ratios of CRSS's used in the rest of the paper, namely: 'r pr :'c ttw : r ctw = 0.8 : 1 : 2. Since the resulting stresses are in units of ' t "ttw, both loci are scaled to fit the experimental yield stress of 550 MPa, corresponding to the compressive test along the
normal direction. As a requirement of this scaling, the CRSS in the prismatic systems has to be z pr = 72 MPa for the VPSC case and, consequently, l ttw and r c'w have to be 90 MPa and 180 MPa respectively. For the FC calculation, on the other hand, this values turn out to be much lower: z~r= 40 MPa, z t '~= 50 MPa and zctw= 100 MPa, which is a consequence of the upper-bound character of the FC approach. The closest available experimental data of prismatic CRSS, are the measurements performed by Akhtar [33] on zirconium single crystals favourably oriented for prismatic slip. At the lowest measuring tempera- ture, 423 K, he obtains a flow stress of 80 MPa, which is relatively close to the value predicted under the VPSC assumption and provides further evidence in favour of the latter over the FC approach. A detailed comparison is not possible, however, because small differences in temperature and in alloy content are known to modify substantially the final CRSS's. Figure 7 also shows that a better adjustment of the experimental points is achieved when the VPSC scheme is used for the PCYS calculation, specially for the values of tensile and compressive flow stress along the transverse direction.
Finally, we compare Lankford coefficient measure- ments reported by Tom6 et aL [25] for the previous material, with the predictions of the FC and the VPSC calculations. The curves of Lankford co- efficient (R) vs ct are obtained by cutting samples from a rolled sheet at different angles ct from the rolling direction. A tensile test is performed on each sample and the ratio between the transverse strain ~2 and the through-thickness plastic strain ~3 is measured at different amounts of axial deformation El. The calculation of Lankford coefficients using either the FC or the VPSC formulation is done as follows: for each "sample" the imposed strain com- ponents are iteratively adjusted until the average stress is purely tensile along the "sample" axis, with zero transverse components. Figure 8 depicts five different curves of R vs ct. Two experimental sets of
o Zrly-4 ND - - - FC predicted - - SC predicted
Fig. 7. Polycrystal Yield Loci calculated with FC and VPSC formulations. The dots correspond to experimental data
[26].
2622 LEBENSOHN and TOMI~: PLASTICITY AND TEXTURE DEVELOPMENT OF POLYCRYSTALS
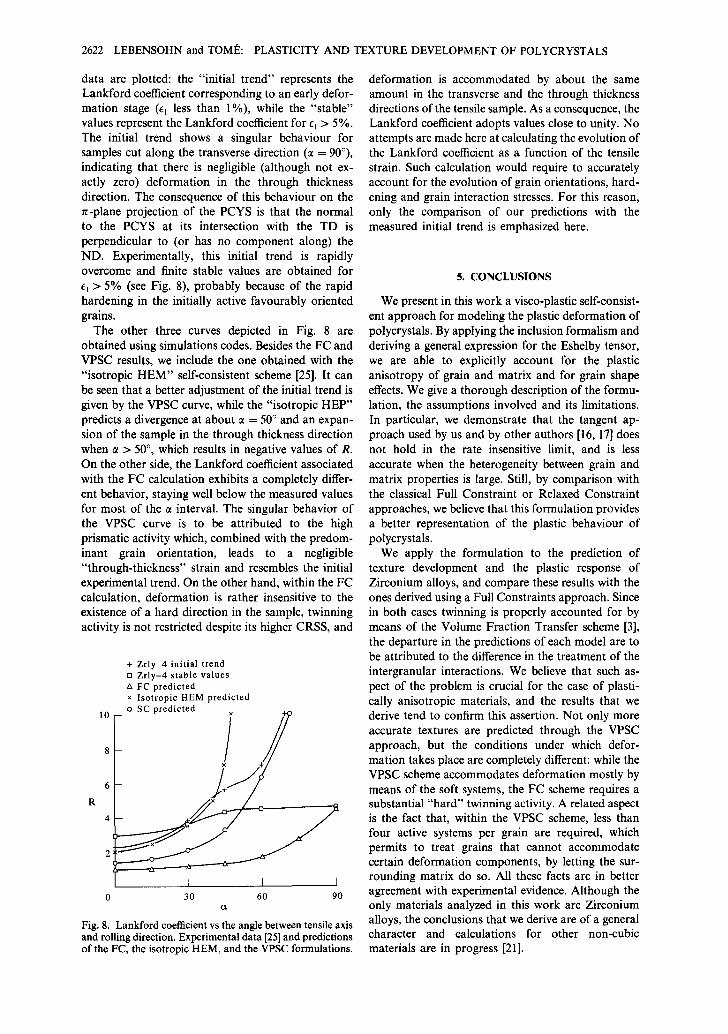
data are plotted: the "initial trend" represents the Lankford coefficient corresponding to an early defor- mation stage (Et less than 1%), while the "stable" values represent the Lankford coefficient for El > 5%. The initial trend shows a singular behaviour for samples cut along the transverse direction (~t = 90°), indicating that there is negligible (although not ex- actly zero) deformation in the through thickness direction. The consequence of this behaviour on the n-plane projection of the PCYS is that the normal to the PCYS at its intersection with the TD is perpendicular to (or has no component along) the ND. Experimentally, this initial trend is rapidly overcome and finite stable values are obtained for El > 5% (see Fig. 8), probably because of the rapid hardening in the initially active favourably oriented grains.
The other three curves depicted in Fig. 8 are obtained using simulations codes. Besides the FC and VPSC results, we include the one obtained with the "isotropic HEM" self-consistent scheme [25]. It can be seen that a better adjustment of the initial trend is given by the VPSC curve, while the "isotropic HEP" predicts a divergence at about ct = 50 ° and an expan- sion of the sample in the through thickness direction when ~ > 50 °, which results in negative values of R. On the other side, the Lankford coefficient associated with the FC calculation exhibits a completely differ- ent behavior, staying well below the measured values for most of the ct interval. The singular behavior of the VPSC curve is to be attributed to the high prismatic activity which, combined with the predom- inant grain orientation, leads to a negligible "through-thickness" strain and resembles the initial experimental trend. On the other hand, within the FC calculation, deformation is rather insensitive to the existence of a hard direction in the sample, twinning activity is not restricted despite its higher CRSS, and
+ Zr ly -4 in i t ia l trend D Zr ly -4 s table values ,x FC predic ted × Iso t ropic HEM predicted
10 -- o SC predic ted
8
6
R
4
2
I I 0 30 60 90
Gt
Fig. 8. L a n k f o r d coefficient vs the angle be tween tensi le axis and ro l l ing direct ion. Expe r imen ta l d a t a [25] and pred ic t ions of the FC, the isotropic HEM, and the VPSC formulations.
deformation is accommodated by about the same amount in the transverse and the through thickness directions of the tensile sample. As a consequence, the Lankford coefficient adopts values close to unity. No attempts are made here at calculating the evolution of the Lankford coefficient as a function of the tensile strain. Such calculation would require to accurately account for the evolution of grain orientations, hard- ening and grain interaction stresses. For this reason, only the comparison of our predictions with the measured initial trend is emphasized here.
5. CONCLUSIONS
We present in this work a visco-plastic self-consist- ent approach for modeling the plastic deformation of polycrystals. By applying the inclusion formalism and deriving a general expression for the Eshelby tensor, we are able to explicitly account for the plastic anisotropy of grain and matrix and for grain shape effects. We give a thorough description of the formu- lation, the assumptions involved and its limitations. In particular, we demonstrate that the tangent ap- proach used by us and by other authors [16, 17] does not hold in the rate insensitive limit, and is less accurate when the heterogeneity between grain and matrix properties is large. Still, by comparison with the classical Full Constraint or Relaxed Constraint approaches, we believe that this formulation provides a better representation of the plastic behaviour of polycrystals.
We apply the formulation to the prediction of texture development and the plastic response of Zirconium alloys, and compare these results with the ones derived using a Full Constraints approach. Since in both cases twinning is properly accounted for by means of the Volume Fraction Transfer scheme [3], the departure in the predictions of each model are to be attributed to the difference in the treatment of the intergranular interactions. We believe that such as- pect of the problem is crucial for the case of plasti- cally anisotropic materials, and the results that we derive tend to confirm this assertion. Not only more accurate textures are predicted through the VPSC approach, but the conditions under which defor- mation takes place are completely different: while the VPSC scheme accommodates deformation mostly by means of the soft systems, the FC scheme requires a substantial "hard" twinning activity. A related aspect is the fact that, within the VPSC scheme, less than four active systems per grain are required, which permits to treat grains that cannot accommodate certain deformation components, by letting the sur- rounding matrix do so. All these facts are in better agreement with experimental evidence. Although the only materials analyzed in this work are Zirconium alloys, the conclusions that we derive are of a general character and calculations for other non-cubic materials are in progress [21].
LEBENSOHN and TOMI~: PLASTICITY AND TEXTURE DEVELOPMENT OF POLYCRYSTALS 2623
Acknowledgements--The authors wish to acknowledge dis- cussions with Gilles Canova and Fred Kocks which, without doubt, have contributed to improve this manuscript and our knowledge of the subject.
REFERENCES
1. C. N. Tom6 and U. F. Kocks, Aeta metall. 33, 603 (1985).
2. R. A. Lebensohn and C. N. Tom6, Textures Micro- struct. 14--18, 959 (1991).
3. C. N. Tom6, R. A. Lebensohn and U. F. Kocks, Acta metall, mater. 39, 2667 (1991).
4. R. A. Lebensohn and C. N. Tom~, Phil. Mag. A6% 187 (1993).
5. A. D. Rollett, in Modeling the Deformation of Crys- talline Solids (edited by T. C. Lowe, A. D. Rollett, P. S. Follansbee and G. S. Daehn) p. 361. TMS, Warrendale, Pa (1991).
6. G. I. Taylor, J. Inst. Metals 62, 307 (1938) 7. J. F. W. Bishop and R. Hill, Phil. Mag. 42, 414
(1951). 8. H. Honneff and H. Mecking, Proc. Sixth Int. Conf.
on Texture of Materials (1COTOM-6), (edited by S. Nagashima), p. 347 (1981).
9. E. Kr6ner, Acta metall. 9, 155 (1961). 10. B. Budiansky and T. T. Wu, Proc. 4th Congr. Appl.
Mech., p. 1175 (1962). 11. R. Hill, J. Mech. Phys. Solids 13, 89 (1965). 12. J. W. Hutchinson, Proc. R. Soc. Lond. A319, 247
(1970). 13. S. Nemat-Nasser and M. Obata, Proc. R. Soc. A407,
343 (1986). 14. S. V. Harren, J. Mech. Phys. Solids 39, 345 (1991). 15. S. V. Harren, J. Mech. Phys. Solids 39, 361 (1991). 16. J. W. Hutchinson, Proc. R. Soc. A348, 101 (1976). 17. A. Molinari, G. R. Canova and S. Ahzi, Acta metall. 35,
2983 (1987). 18. C. N. Tom6, G. R. Canova, S. Ahzi and A. Molinari,
Proc. 8th. Int. Conf. on Texture o f Materials (ICOTOM- 8) (edited by J. S. Kallend and G. Gottstein), p. 395. TMS, Warrendale, Pa (1988).
19. C. N. Tom6, H-R. Wenk, G. R. Canova and U. F. Kocks, J. Geophys. Res. 96, B7, 11865 (1991).
20. H-R. Wenk, G. R. Canova, A. Molinari and U. F. Koeks, J. Geophys. Res. 94, B12, 11865 (1989).
21. R. A. Lebensohn and C. N. Tom6. To be published. 22. P. Lequeu, P. Gilormini, F. Montheillet, B. Bacroix and
J. J. Jonas, Acta metall. 35, 439 (1987). 23. G. R. Canova, private communication. 24. S. Tiem, M. Berveiller and G. R. Canova, Aeta metall.
24, 2139 (1986). 25. C. N. Tom& A. Pochettino and R. Penelle, Proc. Eighth
Int. Conf. on Texture of Materials (ICOTOM-g) (edited by J. S. Kallend and G. Gottstein), p. 985. TMS, Warrendale, Pa (1988).
26. S. R. MacEwen, N. Christodoulou, C. N. Tom6, J. Jackman, T. M. Holden, J. Faber Jr and R. L. Hitterman, Proc. Eighth Int. Conf. on Texture o f Materials (ICOTOM-8) (edited by J. S. Kallend and G. Gottstein), p. 825. Warrendale, Pa (1988).
27. A. Salinas-Rodriguez, private communication. 28. A. Salinas-Rodriguez and J. J. Jonas, Metall. Trans. A
23A, 271 (1992). 29. P. Dervin, Ph.D. thesis, Universit6 de Paris-Sud (1978). 30. A. Pochettino, private communication. 31. A. Salinas-Rodriguez and J. H. Root, Textures Micro-
struct. 14--18, 1239 (1991). 32. R.G. Ballinger, The Anisotropic Behaviour o f Zircaloy-2.
Garland (1979). 33. A. Akhtar, Metall. Trans. A 6A, 1217 (1975). 34. T. Mura, Micromechanics o f Defects in Solids.
Martinus-Nijhoff, The Hague (1987).
APPENDIX
(a) The Elastic Inclusion Problem
The assumption that the grains can be treated as inclusions embedded in a visco-plastic medium is a key element of our treatment, because it leads to the grain-matrix interaction described by equation (18). Since the visco-plastie problem is formally analogous to the elastic inclusion problem, in what follows we will review the main results of the elastic formulation.
The stress in an elastic medium of stiffness C~jk~, induced by a distribution of eigenstrains e * (x) is defined by Hooke's law and the equilibrium equations
aij - C,j~l(uk, t -- ekl) (AI)
o,j.j = 0 (A2)
where a,j is the Cauchy stress tensor and uk.z is the elastic distortion tensor referred to the untransformed medium. For the case in which e* is uniform within an ellipsoidal region and null outside, Ukj turns out to be uniform within the domain of the inclusion, and linearly related to e~ through [16, 341
Ui. ) = AikjiCklmnf.*mn, (A3)
Here Cklm. is the elastic stiffness tensor expressed in the principal axis of the ellipsoid and
Aikjl = 4~ sin 0 dO 2,~j/dq~ (A4) o
is a fourth order tensor, with
)'i~jl = K0 ' (~)~k ~/ (A5)
K,p (~) = Cop ! ~, ~! ( A 6 ) and
sin 0 cos ¢ . sin 0 sin ~ . cos 0 ~2 (A7) I
al a 2 a3
The angles 0 < q~ < 2n and 0 < 0 < n are spherical coordi- nates that define the direction of the vector ~ with respect to the principal axes of the ellipsoid, of length 2al, 2a2, 2a 3. The uniform elastic strain and the elastic rotation in the inclusion are given by the symmetric and anti-symmetric components of the distortion tensor defined by (A3)
~ij = ]2(Mi, j -{- Uj, i ) = ]2(dikfl ~- Ajkd)Cklmn~mn = S t jmn~n (A8)
ogij = ~ (u,j -- uj.i) = 2(Aikjt -- Aj~it)(-kt,,~ e~ --/7,jm~ e m~. (A9)
Here S is the classical Eshelby tensor, and II is the Eshelby rotation tensor. They can be calculated straightforwardly from the expressions (A4) to (A9) giving the tensor A. It is evident that both S and 1I, are homogeneous functions of degree zero of the elastic constants and only depend upon the aspect ratios of the ellipsoid.
(b) The Visco-plastic Inclusion Problem
The form of equation (16) in Section 3:
(~:k - - ~k ) = M~t~g)ffl (k , l = 1, 5) ( A 1 0 )
indicates that the tangent formulation leads to an equation resembling the elastic equation (AI), where the deviation in visco-plastic strain rate replaces the elastic strain, the inverse of the visco-plastic compliance M (tg) plays the role of the elastic constants, and the deviation in deviatoric stress replaces the Cauchy stress. While the macroscopic tangent moduli relate plastic strain rate with the five deviatoric stress components, the equilibrium equation that the stress devi- ation tensor fulfills
#,Jd = (a - E),j./= a,j.j = 0 (A11)
applies to the 6 independent Cauchy stress components of the visco-plastic problem. For obtaining a complete
AMM 41/9---H
2624 LEBENSOHN and TOMI~: PLASTICITY AND TEXTURE DEVELOPMENT OF POLYCRYSTALS
equivalence with the elastic case, it is necessary to account for the hydrostatic pressure in the visco-plastic formulation. Such extension is achieved by adding a sixth independent component to the vector representation of equations (1) and (2), defined by
fill "4- (722 "[- 0"33 and ~6 - - £11 "~- E22 q- ~33 (A12)
The new components are proportional to the pressure and the dilatation rate, and fulfill the condition that the energy rate is given by the scalar product of the extended 6-d vectors. From the definition of the vector components [equations (1, 2) and (AI2)], it is straightforward to derive the linear transformations e and/~ that permit to transform vector into tensor components and viceversa, such that
Uij = O~ijk t)k
Dk ~ ~knm 1)nm
and
Ctqk~t,m = 1Siam (i,j, n, m = 1, 3; k = 1, 6). (A13)
Here v 0 is a symmetric tensor and Vk is the associated vector representation. The 6th index is redundant when transform- ing deviatoric tensors because the 6th vector component is identically zero.
The definition of the 5 x 5 tangent compliance matrix M (tg) also has to be extended if it has to operate on 6-d vectors. Such extension is achieved here by adding to it a 6th row and column equal to zero, except for the diagonal clement M ~ ), which is arbitrarily set to a much lower value than the other diagonal components (0 < M ~ ) <~ IMl,tg)l for i = 1, 5). [For the sake of completeness the reference strain rate ~'6 ° is arbitrarily set to zero in (I1).] This "modus operandi", which has also been used by Hutchinson [16], amounts to introducing a small compressibility in an other- wise incompressible medium, and allows to invert the extended form of equation (A10)
~=[M('g)l i j l (~--~ *) (i,j = 1,6). (AI4)
For an adequately small compressibility the rate of volume change: trl~ = M E ) tr]~, can be considered to be negligible.
We have verified that for M~6 < 10 -5 trM, the results of this calculation become independent of the precise value of compressibility assumed. The matrix equation (A14) can be transformed, using (Al3), into a tensor equation
O~y=L,$t (~ , - i~ , ) ( i , j , k , l = l , 3 ) (A15)
where Let = ctijn[M(tg)]n~ flmkl (A16)
defines the tensorial form of the tangent stiffness. Stated in the form (A11) and (AI5) the problem of the visco-plastie inclusion becomes equivalent to the elastic problem and admits the same formal solution. The tensor form of the visco-plastic stiffness is needed to calculate the visco-plastic Eshelby tensor, replacing the elastic moduli Cijkt by Lr~ I in the expressions (A3) to (A9). The matrix representation of the Eshelby tensor S is, in turn, given by
Sij = fliklSklmn O~nmj. (A17)
By analogy with the result (A3) for the elastic case, the Eshclby tensor linearly relates ~1 and d~
= Sk,~ ~' (A18)
and leads to equation (19), which is the visco-plastic equiv- alent of the elastic interaction equation. Also by similitude with the elastic case, the local rotation rate of the ellipsoid is given by (A9) as
• _ - 1 -" ( A 1 9 ) coij -- I'[ijkt S kt,,m E,,~
where we have made explicit use of (A18) for expressing it in terms of the strain rate deviation, which is the magnitude relevant to our problem. It is possible to see that this rotation becomes important for distorted ellipsoid shapes [24].
An important remark has to be made at this point regarding the extension of the Eshelby formulation to the visco-plastic problem. While the elastic moduli are uniform throughout the medium, the visco-plastic compliances (and so their inverses), can be regarded as uniform only when the stresses induced by the inclusion in its neighborhood do not exceed the range where the tangent formulation is valid. As a consequence, the previous formulation is valid only when this condition is met.