Embed Size (px)
Citation preview

A CONCEPTUAL DESIGN OF AN ALTERNATIVE METHOD FOR CUTTING
OFF STANDBY POWER CONSUMPTION FOR OFFICE EQUIPMENT
TAN KHENG WEE
A project report submitted in partial
fulfillment of the requirement for the award of the
Degree of Master of Engineering
Faculty of Electrical & Electronic Engineering
Tun Hussein Onn University of Malaysia
JULY 2012

v
ABSTRACT
Ever since the completion of Politeknik Kuching Sarawak (PKS) first major
networking project in 2002, its energy consumption has been in the steady rise.
Although the increment was understandable, the increasing energy wastage in terms
of standby power consumption by ICT equipment and equipment not being switch
off was intolerable. With the aim of finding the solution to this issue, the project was
divided into three parts. The first part of the project surveyed the level of awareness
among the staff during a monthly assembly and found out despite the high level of
awareness among the academic staff, some 38% of them admitted they do not switch
off their computer and thus jeopardizing the management’s desire to put a stop to
energy wastage. Secondly, the field measurement of ten types of selected office
equipment has been carried out with minimum five samples of measurement taken
whenever possible to produce a good average value. The bottom-up estimation
method then put the annual standby power consumption of PKS at 64,653.11 kWh
and cost a staggering RM 21,982.06. Finally, unlike the conventional method of
using current level detection to detect appliances going into standby mode, the
project came out with an alternative standby power cut-off system that utilises light
source as a mean of controlling the system and is suitable for the usage in an office
environment.

vi
ABSTRAK
Semenjak selesainya pelaksanaan projek rangkaian Politeknik Kuching Sarawak
(PKS) yang pertama pada tahun 2002, keadaan penggunaan tenaganya telah
memperlihatkan suatu peningkatan yang mantap. Walaupun peningkatan ini dapat di
terima dengan baik, pembaziran tenaga dalam bentuk penggunaan standby power
oleh peralatan ICT dan peralatan yang terlupa dimatikan adalah sesuatu yang tidak
dapat di terima. Berbekalkan matlamat untuk mencari penyelesaian kepada isu ini
maka projek ini telah dibahagikan kepada tiga bahagian. Bahagian yang pertama
telah membuat kajian terhadap tahap kesedaran di kalangan staf semasa perhimpunan
bulanan dan mendapati bahawa walaupun staf mempunyai tahap kesedaran yang
tinggi tetapi masih terdapat 38% di antaranya yang mengaku tidak mematikan suis
komputer dan keadaan ini telah menjejaskan hasrat pihak pengurusan untuk
menghentikan pembaziran tenaga elektrik. Seterusnya, pengukuran terhadap sepuluh
jenis peralatan yang terpilih telah dilakukan dengan mengambil sekurang-kurangnya
lima sampel bacaan untuk menghasilkan nilai purata yang baik. Kaedah anggaran
bottom-up kemudiannya meletakkan anggaran punggunaan standby power tahunan
PKS pada 64,653.11 kWh dan bernilai RM 21,982.06. Akhir sekali, tidak seperti
kaedah konventional lain yang menggunakan pengesanan tahap arus pada peralatan
yang beralih kepada standby mode, projek ini telah menghasilkan satu sistem
alternatif untuk memutuskan standby power yang menggunakan tenaga cahaya
sebagai sumber yang mengawal pengoperasian sistem tersebut dan ianya sesuai
digunakan di dalam suasana pejabat.

vii
CONTENTS
TITLE i
DECLARATION ii
DEDICATION iii
ACKNOWLEDGEMENTS iv
ABSTRACT v
CONTENTS vii
LIST OF TABLE x
LIST OF FIGURE xii
LIST OF APPENDICES xiv
CHAPTER 1 INTRODUCTION 1
1.1 Preamble 1
1.2 Problem statement 2
1.3 Aim 3
1.4 Objectives 3
1.5 Scope 3
1.6 Structure of thesis 4
CHAPTER 2 LITERATURE REVIEW
2.1 Preamble 5
2.2 Introduction to standby power 5
2.2.1 Definition 6
2.2.2 Advantages and disadvantages 7

viii
2.2.3 Magnitude 8
2.2.4 Policy 9
2.2.5 Identifying devices 11
2.2.6 Standby power standards 11
2.2.7 Standby power testing requirements 12
2.2.8 Methods for measuring standby power use in
households
12
2.3 Review of standby power estimation method 13
2.4 Review on the standby power cut-off techniques 15
2.5 The livewire 1.11 Pro software 17
CHAPTER 3 METHODOLOGY
3.1 Preamble 23
3.2 Project planning 23
3.3 Project Part 1 - Surveying the level of awareness 24
3.4 Project Part 2 – PKS standby power estimation 25
3.4.1 List of equipment 26
3.4.2 Sampling method 28
3.4.3 Measurement technique 29
3.4.4 Measuring tool 30
3.4.5 Measurement setup 30
3.4.6 Data collection and analysis 31
3.5 Project Part 3 – Design standby power cut-off
device
31
CHAPTER 4 RESULTS AND DISCUSSION
4.1 Preamble 35

ix
4.2 Results from the study of level of awareness
among the PKS staffs
35
4.2.1 Survey data from individual department/unit 35
4.2.2 Conclusion 41
4.3 Results from the standby power consumption
measurement
42
4.3.1 Average standby power for each type of
equipment
43
4.3.2 Standby power estimation 44
4.3.3 Conclusion 44
4.4 Results for the standby power cut-off system
design
47
4.4.1 Simulation 1 – Circuit functional 48
4.4.2 Simulation 2 – Circuit power consumption (with
DC power supply)
49
4.4.3 Simulation 3 – Circuit power consumption (with
battery)
50
4.4.4 Conclusion 51
4.5 Discussion 51
CHAPTER 5 CONSLUSION AND FUTURE RECOMMENDATION
5.2 Conclusion 54
5.3 Suggestion 55
REFERENCES 56
APPENDIX A 58
APPENDIX B 59
APPENDIX C 60

x
LIST OF TABLES
2.1 The magnitude of standby power consumption of
11 countries
10
2.2 Standby power testing requirements of the IEC 12
2.3 List of estimates of residential standby power and
its methods employed
15
2.4 List of estimates of residential standby power and
its methods employed
16
3.1 Survey questions 25
3.2 List of office equipment according to
department/unit in PKS
27
3.3 List of equipment to be included in the standby
power measurement
28
4.1 Distribution of the survey respondents 36
4.2 Survey result for Mathematics, Science &
Computer Department
37
4.3 Survey result for Information & Communication
Technology Department
37
4.4 Survey result for General Studies Department 37
4.5 Survey result for Electrical Engineering
Department
38
4.6 Survey result for Civil Engineering Department 38
4.7 Survey result for Petrochemical Engineering
Department
38
4.8 Survey result for Mechanical Engineering
Department
39
4.9 Survey result for Commerce Department 39
4.10 Survey result for Administration Department 39

xi
4.11 Survey result for Examination Unit 40
4.12 Survey result for Staff Training Unit 40
4.13 Accumulated survey result for all the
departments/units
41
4.14 Summary of survey results 42
4.15 Average standby power for each type of
equipment
43
4.16 Total Annual standby power consumption for PKS 45

xii
LIST OF FIGURES
2.1 The visual display of vampire information 8
2.2 Appearance of livewire start-up page 17
2.3 Appearance when the create a circuits command
is selected
18
2.4 Appearance when the open electricity circuits
command is selected
18
2.5 Appearance when the open electronics circuits
command is selected
19
2.6 Appearance when the using livewire command is
selected
19
2.7 Appearance when the tutorial command is
selected
20
2.8 Simulation in normal mode 20
2.9 Simulation in voltage levels mode 21
2.10 Simulation in current flow mode 21
2.11 Simulation in logic levels mode 22
3.1 The project Gantt Chart 23
3.2 Flowchart of stages in project implementation 24
3.3 Flowchart of main stages in project part 1 24
3.4 Flowchart of main stages in project part 2 26
3.5 The standby power measuring process 29
3.6 Power plus multifunction power meter 30
3.7 Measurement setup for measuring standby power 30
3.8 Block diagram for the power cut-off system 32
3.9 LM741 light/dark sensor circuit (with relay) 33
3.10 Flowchart of one full cycle of the standby power
cut-off system
34

xiii
4.1 Total annual standby power for each type of
equipment measured (KWh)
46
4.2 Cost of total annual standby power for each type
of equipment measured (RM)
46
4.3 The circuit diagram of the standby power cut-off
system drawn with livewire Pro 1.11
47
4.4(a) Circuit function with light on 48
4.4(b) Circuit function with light off 48
4.5(a) Circuit power consumption with light on 49
4.5(b) Circuit power consumption with light off 49
4.6(a) Circuit power consumption with 12V battery and
light on
50
4.6(b) Circuit power consumption with 12V battery and
light off
50

xiv
LIST OF APPENDICES
A Survey instrument 58
B List of ICT equipment in PKS for 2011 59
C Multifunction power meter instructions 60

CHAPTER 1
INTRODUCTION
1.1 Preamble
Politeknik Kuching Sarawak (PKS) was the fifth polytechnic established in Malaysia
in the year 1988. Ever since the completion of its first major networking project in
2002, PKS has witnessed over the years, a steady climb in its total power
consumption. The increment was expected and handled well, until the August 10th,
2009, when the management of PKS can no longer tolerate the wastage of energy,
then a circular was issued that highlighted the enormous amount that PKS has spent
on the electricity bills each month. Two suggestions were outline in the circular:
(i) Switch OFF the lights/air conditioners during recess.
(ii) Switch OFF the computers when not in use/before leaving the office.
From the observation at several departments/units sometimes later, it is found
that these suggestions has been ignored. In addition, most of the office equipment,
especially the desktop computer, were just being shut down but never switch off.
This means, the appliances are simply put on standby mode, and constantly drawing
electricity instead of being switching off. As a consequent, the initiative proposed by
PKS to cut down on total power consumption and minimizing energy wastage will
never achieve its target.
The idea to implement this project thrived on the issue of energy wastage in
PKS. Initial investigation shows that some of the staffs are unaware of standby
power consumption. Further observation also suggested that staffs who have easy
access to the switches have the tendency to switch off their office equipment at the
end of the day.

2
Ideally, to overcome the standby power issue in PKS, the problems of lacking
awareness and those hard to reach switches, must be tackle simultaneously. Raising
the awareness can be achieved through talks or seminars. While relocation of the
switches or a device can be designed and implemented to assist the cutting-off of
standby power of office equipment.
1.2 Problem statement
Since PKS has to pay a huge electric bill every month, the management has come to
a conclusion that something must be done to reduce it. Realizing that some of the
energy used may be wasted is proven to be a good start for a great quest for
conserving energy and help save the earth.
Electrical appliances that stayed in the office, for example desktop computers,
printers, copiers, paper shredder, televisions, DVD player, Hi-Fi and etc., are known
to consumed a certain amount of energy if not properly switch off. Researchers
estimated a microcomputer can use up to 6W [1-3] of standby power if not being
switch off. Consequently, with estimated one thousand computers lying around in
PKS, and if all the microcomputer were not switch off, that sum up to a whopping
6000W of load.
To see the impact of these standby loads, the calculation of the total annual
standby power consumption using formula (3.1) and its carbon footprint is as shown
below:
From the calculation, we can conclude that only a single type of electrical
appliance already consumed 36,900 kWh of energy annually plus approximately 22
metric tons of Carbon Dioxide being released into the atmosphere.

3
1.3 Aim
The main aim of this master’s project is to come out with a conceptual design of an
alternative method of cutting off standby power consumption for office equipment
after office hours in order to prevent energy wastage. While doing so, a study on
level of awareness among the staffs regarding standby power consumption and
estimation of the annual standby power consumption in PKS was also conducted so
that this information can be provided to the PKS management for further action if
required.
1.4 Objectives
The objectives of this project are:
(i) To study the level of awareness among the staff.
(ii) To determine the standby power consumption.
(iii) To come out with a conceptual design of an alternative standby power cut-off
system for office equipment.
1.5 Scope
(i) To study the level of awareness, a survey will be carried out during the PKS’s
monthly assembly. In the survey, 150 questionnaires will be distributed
randomly among the staffs and a target of at least 100 respondents is set.
(ii) To estimate the total power consumption, a power meter will be used to do
the field measurement of selected office equipment in two department in
PKS, namely the Electrical Engineering Department and Mathematics,
Science & Computer Department. For a type of appliances, at least five
samples will be measured whenever possible to obtain a good average value
for the estimation. Finally, these average values will be multiplied with the
number of equipment available in PKS to make the estimation.
(iii) To come out with a system that is capable of cutting-off power to office
equipment when the office is dark. The system will utilize sensor to detect
lights being switch on (as indicator of when there are people present in the

4
office) and switch off (as indicator as people leaving the office). The system
must allow power supply to pass through when light is detected and must be
able to cut-off the power supply when it is dark.
1.6 Structure of report
The introduction in chapter 1 is followed by definition of standby power, review on
the method of measurement and the software used in the simulation process in
chapter 2. Chapter 3 describes the project planning and methods employed to
completes the three major parts of the project. These results are presented and
analyzed in chapter 4. This report will end with discussion, conclusions and
suggestion for project improvement in chapter 5.

5
CHAPTER 2
LITERATURE REVIEW
2.1 Preamble
In this chapter, the definition of standby power is being described first, and followed
by the review of the standby power estimation method and the standby power cut-off
techniques before proceed to the software being used to develop this project.
2.2 Introduction to standby power
The innovation of technology has never stop to impress people with its forever more
intelligent functions that enable people to live more comfortably and conveniently.
Eventually, standby power has becomes a necessity for almost every piece of
electrical appliances produced.
Since the 90s, peoples have started to realise these standby power, although
consider relatively small for a single piece of appliance, but gradually add up to a
whooping 1.39 TWh of annual consumption and with 811t CO2 emission just for a
small country like Taiwan [4].
Prior to 1993, the power losses due to standby mode were considered very
small and often ignored. Eje Sanberg became the pioneer when he collected data
from TVs, VCRs and audio equipment in the off mode in Swedish electronic stores
and called the phenomenon “leaking electricity”. Sanberg’s work was later cited by
Alan Meier from Lawrence Berkeley National Laboratory and published in the Home
Energy Magazine in 1993. Rainer et al. [5] were the first to do a comprehensive

6
study and came out with estimate average losses per home and national losses in
the U.S. in 1996.
Standby power consumption we also known as vampire power, vampire
draw, phantom load, or leaking electricity [6]. Standby power actually refers to
constant consumption of electrical power by electrical appliances when they are put
on standby mode. A common used and more precise definition for standby power
would be the energy consumption by electrical appliances when they are switch off
or are not performing its principal function. The mathematical formula to calculate
standby power consumption is as follows:
Standby power consumed in watt-hour per day or year
: Effective output power on standby mode, watts
: Period of standby mode, hours
2.2.1 Definition
Although there are so many definition available for standby power but it is still
inadequate in technical purposes. The most detailed description of standby power
according to Lu et al. [4] is from the Australian National Appliance & Equipment
Energy Efficiency Committee (NAEEEC). The definitions are:
(i) OFF mode:
When the electrical product is connected to power but not is not executing
any function, and if the device has a remote control function, that remote
control cannot activate the device directly from this mode.
(ii) Passive standby mode:
When the electrical product is not in execution of its primary function, but the
standby mode is enabled (usually for use by the remote control device), or in
execution of other functions (such as displays or clocks). When the electrical
product is not plugged in, the equipment is able to make use of battery power
under this mode.
(iii) Active standby mode:

7
Active standby mode refers to an electrical product in the enable mode, but
not in execution of its main functions (for example, a VCR in enable mode,
but not showing a video or recording).
(iv) Delay start mode:
In this mode, the user is able to schedule the electrical product, through a
computer program, to perform a certain function later, which can be delayed
for up to 24 h.
2.2.2 Advantages and disadvantages
As technology advances, the standby power usage becomes inevitable to make life
more comfortable and convenient. The advantages of standby power are listed as
follows:
(i) It cut short the delay time in switching on a device. For example, in office
equipment such as the CRT monitors this requires a small amount of current
to heat up before they are switch on.
(ii) It is used to keep providing power to remote control receiver so that when an
infrared or radio frequency signals is received it will respond instantaneously.
(iii) It is used to power a display function such as clock and will enable less power
being used.
(iv) It can be used to keep a device’s battery fully charged and ready to be used
like the mobile telephone.
The standby power consumption becomes the setback of the technology
advancement as energy is wasted without the device performing its primary function.
The disadvantages of standby power are listed as follows:
(i) It consumes a small amount of energy per device but is estimated to be of the
order of 10% of the energy used by a typical household.
(ii) It causes more carbon dioxide to be released into the atmosphere and
promoting global warming because more energy has to be produced resulting
in more oil, coal and gas combustion.
(iii) It will incur more running costs as more power generation, transmission and
distribution facilities to be set up.

8
(iv) It will create a risk from fire as there are reports of television catching fire on
standby mode [6].
2.2.3 Magnitude
According to the study by the US Department of Energy, and illustrated here by
Lloyd [7], a device can have an annual standby power consumption between
12.3kWh for a rechargeable toothbrush to a whopping 1452.4kWh for Plasma TV as
shown in figure 2.1 below. The study also estimated the total standby power
consumption in 2005 for US stood at 3 billion US dollars.
Figure 2.1 The visual display of vampire information

The International Energy Agency (IEA) launched the one watt initiative in 1999, in
the hope of getting international level of cooperation towards solving the issue. The
initiative outlined that by 2010 all new electrical appliances sold in the world would
only use one watt in standby mode. The outcome of this initiative includes reducing
the CO2 emissions by 50 million tons by 2010 in the Organization for Economic Co-
operation and Development (OECD) countries alone.
To accommodate the one watt initiative by IEA, the European Commission
(EC) regulation number 1275/2008 came into force in January 6, 2010. It is
mandatory under the regulation that all electrical and electronic household and office
equipment shall not have standby power that exceed 1W while standby plus power
(i.e. providing information or status display in addition to possible reactivation
function) shall not exceed 2W. The regulation also stated all equipment must have
the off mode and/or standby mode provided, plus these numbers of
2.2.4 Policy
To get a clearer picture of the magnitude of standby power consumption
around the world, Table 2.1 has listed figure found in research since 1995 for a total
of eleven countries. From the table shown, the average and annual standby power
consumption per household in these countries stood approximately at 50W and
400kWh. Apart from that, the fraction of total residential electricity used is about
10% on average and total carbon dioxide gas released is 0.2295 metric ton annually.
If this estimation were to be set as a standard for other country to estimate
their annual standby power consumption, then the country like Malaysia would have
the estimation as follows:
Malaysian annual standby power consumption,
Malaysian annual CO2 emission in metric ton
* Based on number of household in 2010 as retrieved from the website:
http://www.statistics.gov.my/portal/download_Population/files/BPD/populati
on_quarters_2010.pdf
9

10
Table 2.1 The magnitude of standby power consumption of 11 countries
No. Country Average Residential Standby
Power (Watt)
Annual Electricity Use
(kWh/yr)
Fraction of Total Residential
Electricity Use (%)
CO2 emission in metric ton
(t CO2 e)
1 Netherlands 37 330 10 0.1955
2 USA 50 400 5 0.2370
3 German 44 389 10 0.2305
4 Japan 60 530 12 0.3140
5 New Zealand 100 880 11 0.5214
6 France 38 235 7 0.1392
7 Australia 60 527 13 0.3122
8 Canada 49 427 N/A 0.2530
9 China 29 100 10 0.0593
10 Belgium 40 274 8 0.1623
11 Taiwan Off mode,
Passive standby,
Active standby, and
Delay Start mode
Class A: 104
Class B: 212
Class C: 186
Class D: 223
Ave=181.25
N/A 0.1074
Average 49.27 401.13 10.40 0.2295

11

12
standby power must be halved on January 6, 2013 [6].
2.2.5 Identifying devices
To further understand the issue regarding standby power, it is required to know what
type of devices that consume it. The following list shows types of devices that
consume standby power:
(i) Transformers for AC-DC voltage conversion in the power supply circuit.
(ii) Certain devices that feature instant-on functions.
(iii) Electrical and electronic appliances in standby mode and can be control from
a remote, i.e. the audio visual equipment.
(iv) Electrical and electronic appliances that continue to function even when
switched off, i.e. the electrically powered timer.
(v) Uninterruptible power supplies (UPS)
(vi) Cordless telephones and answering machines
(vii) Timers which operate devices
(viii) Security systems and fire alarms
(ix) Transformer-powered doorbells
(x) Programmable thermostats
(xi) Motion sensors, light sensors, built-in timers and automatic sprinklers
2.2.6 Standby power standards
According to Lu et al. [4], the Group for Energy Efficient Appliances (GEEA), the
Federal Energy Management Program (FEMP), the EU environmental (EU Eco-
label), the NAEEEC, the Energy Star, the Nordic Swan, German Blue Angel, and
other agencies have proposed standards for measuring standby power in electrical
products. These standards state that the power consumption of audio and video
products must be in the range of 0.3–15 W, IT products are in the range of 1–30 W,
and other products are in the range of 1–4 W.

13
2.2.7 Standby power testing requirements
The International Electrotechnical Commission (IEC) has setup test procedure 62301
to describe a method for testing standby power use in appliances. According to Lu et
al. [4], the standards set by IEC are more stringent with regard to harmonic content
and requirements for measurement equipment compare to the other agencies. The
following table shows the testing requirements of the IEC.
Table 2.2 Standby power testing requirements of the IEC
Test environment Indoor ambient temperature must be maintained at 23 ± 5 ◦C throughout the
test period, and wind speed must be lower than 0.5 m/s
Test conditions 1. Supply voltage harmonic content must not exceed 2%
2. Changes in voltage and frequency to be within ±1%
Testing requirements Accuracy of measuring equipment:
1. For power measurement below 10 W, equipment precision must be
within 0.01 W or better
2. For power measurement between 10 and 100 W:equipment precision
must be within 0.1 W or better
3. For power measurement more than 100 watts: equipment precision must
be within 1 W or better
2.2.8 Methods for measuring standby power use in households
The three commonly method used for measuring standby power use in household
are: (i) Entire house measurement, (ii) Bottom-up estimates and (iii) New product
measurement.
(i) Entire house measurement
To perform an entire house measurement, researcher must first identify the
volunteers before they actually visit the individual household to take standby
power measurement of each piece of appliances they find. Ideally, all the
appliances must be switched off before the measurement can begin and the
total standby power measured must equal the meter reading. Otherwise, it
may indicate that some of the appliances may be left out. The advantages of

14
this method is that reasonable projection of the standby power being
consumed by the household plus the average standby power consumed by any
appliances by averaging the measurement of various appliances. The major
drawback of this method would be finding the volunteers.
(ii) Bottom-up estimates
The bottom-up method requires researchers to first obtain the measurements
of specific appliances. These measurements are then averaged to obtain the
best estimate before being multiplied with the market penetration of that
specific appliance, with the standby duration and the number of household
being taken into account. The bottom-up method is commonly used to
estimate the average standby power consumption of each household and to
estimate the standby power consumption at the national level. The bottom-up
method of estimation can be very accurate provided the sample collected are
enough and the market penetration rate is known for a commonly used
appliances. If for appliances that are rarely used, the numbers produced may
be meaningless.
(iii) New product measurement
To perform the new product measurement method, researchers must obtain
the measurements of standby power from the retailers and factories. The
advantage of this method is the rapid measurement of the standby power
measurement for various appliances. However, foreseen shortcoming would
be the potential discrepancy between the actual measurements of the users.
2.3 Review of standby power estimation method
Studies on standby power consumption since the 90s provided us with prove that
almost every single piece of electrical appliances consumed a certain amount of
standby power. At present, the study on standby power consumption becomes crucial
importance to the world because of the information that it provides can lead to great
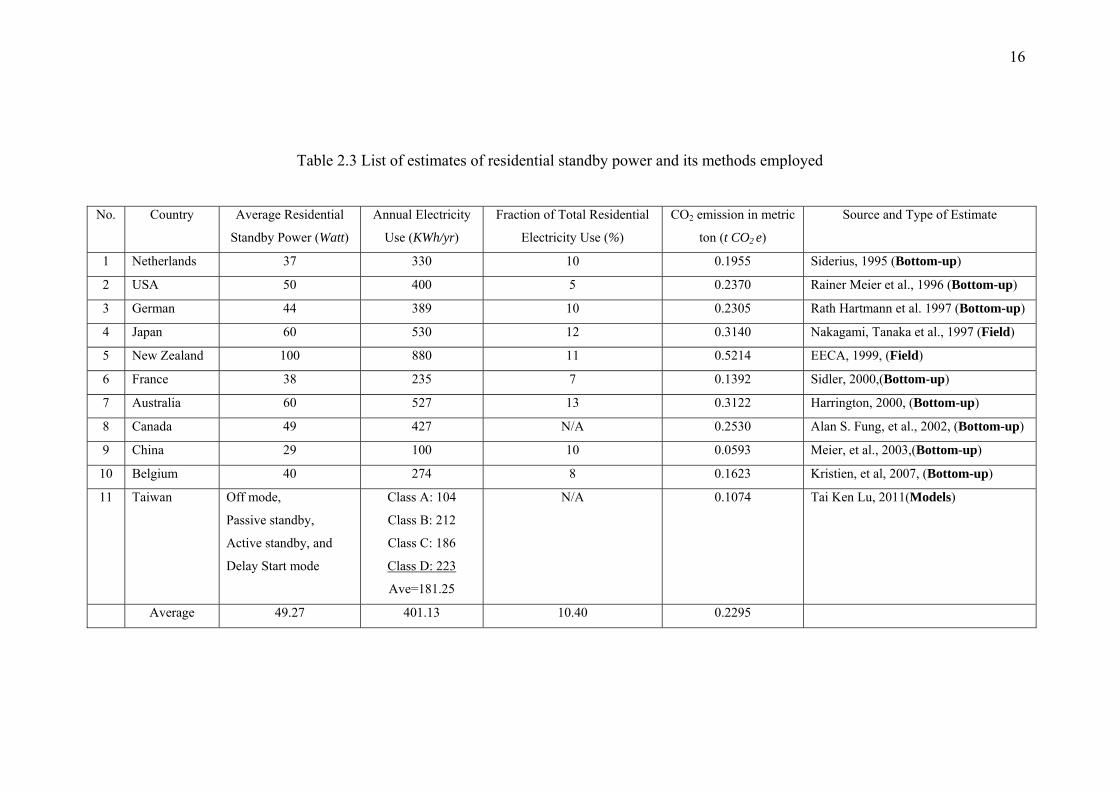
saving potential. Table 2.3 listed estimates of residential standby power and its
methods employed in eleven countries [4][8-12].
From these studies, it is observed that there are three types of estimation
technique that is based on: (1) Models, (2) Field measurement (also referred as

15
Whole House measurement), and (3) Bottom-up technique, where the later are the
most commonly technique used.
In this project, the objective is to determine the level of standby power
consumption by office equipment in PKS and that requires a slightly different
approach as all the estimation technique listed in table 2.3 are used by researchers to
estimate the standby power consumption in the household environment.
The first method which utilizes a model to estimate is by far more suitable for
the household environment where we can categories the household into certain
groups based on their power consumption and the groups are scattered over a wide
area like in this case for a country like Taiwan. This method is also unsuitable for
this project because the office equipment found in PKS are basically of the same type
compare to different household where appliances found may vary and is highly
associated to their financial capability.
The second method which requires comprehensive field measurement and
finding the volunteers to do the standby power measurements may not be the best
solution either. With more than 450 staffs and thousands of equipment scattered
around in more than 19 departments/units, this method could be hard to implement.
The last method which is the bottom-up estimate may be the best choice
because average standby power of specific types of equipment can be established
from the measurement in the departments/units. While for the market penetration
point of view, information for the list of all the office equipment available in PKS
and their location can be obtained from the Information & Communication
Technology Unit.
16
Table 2.3 List of estimates of residential standby power and its methods employed
No. Country Average Residential
Standby Power (Watt)
Annual Electricity
Use (KWh/yr)
Fraction of Total Residential
Electricity Use (%)
CO2 emission in metric
ton (t CO2 e)
Source and Type of Estimate
1 Netherlands 37 330 10 0.1955 Siderius, 1995 (Bottom-up)
2 USA 50 400 5 0.2370 Rainer Meier et al., 1996 (Bottom-up)
3 German 44 389 10 0.2305 Rath Hartmann et al. 1997 (Bottom-up)
4 Japan 60 530 12 0.3140 Nakagami, Tanaka et al., 1997 (Field)
5 New Zealand 100 880 11 0.5214 EECA, 1999, (Field)
6 France 38 235 7 0.1392 Sidler, 2000,(Bottom-up)
7 Australia 60 527 13 0.3122 Harrington, 2000, (Bottom-up)
8 Canada 49 427 N/A 0.2530 Alan S. Fung, et al., 2002, (Bottom-up)
9 China 29 100 10 0.0593 Meier, et al., 2003,(Bottom-up)
10 Belgium 40 274 8 0.1623 Kristien, et al, 2007, (Bottom-up)
11 Taiwan Off mode,
Passive standby,
Active standby, and
Delay Start mode
Class A: 104
Class B: 212
Class C: 186
Class D: 223
Ave=181.25
N/A 0.1074 Tai Ken Lu, 2011(Models)
Average 49.27 401.13 10.40 0.2295

17
2.4 Review on the standby power cut-off techniques
Table 2.4 listed three of the latest techniques developed to curb the standby power
consumption.
Table 2.4 List of estimates of residential standby power and its methods employed No. Researcher Technique Year
1. Cheng-Hung, T. et al. [13]
National Taiwan University of
Science and Technology, Taiwan.
Design and Implementation of a
socket with Zero Standby Power
using a Photovoltaic Array
2010
2. Jiin-Hwa, Y. et al. [14]
Nan Kai University of Technology,
China.
A low cost and effective
implementation of standby mode
power reduction
2010
3. Huang-Te, H. et al. [15]
Fu Jen Catholic University, Taiwan.
Reducing the standby power
consumption of personal computers
2011
The first technique involved the design of an external device that can cut-off
the standby power consumption by means of detecting the appliances going into
standby mode. The great thing about this circuit is that it utilises only 7mW of energy
in a dark room while zero power consumption if the room has sufficiently light.
The second technique involved the design of a standby power cut-off circuit
that is so small that it can be fit into any electrical appliances. The circuit also detect
current variation as in the case of the first technique in order to cut-off the standby
power. The circuit is considered low cost as compared to the first design and only
consume 240mW of energy.
The last design involved redesigning of the computer power sequence of the
system and cutting off power to the unnecessary chips in order to cut down on the
standby power consumption. The wonderful thing about this circuit is that it only
consumes 0.0196W of energy during operation. This design is more specific towards
the computers as compared to the first and second design which can be directly
applied to any electrical appliances.
Although the three designs was indefinitely great in terms of their
achievement but the first and second design requires the load connected to go into
standby mode in order to operate. While majority of office equipment do have

18
standby mode, i.e. the computers, printers, copiers and etc., there are some that does
not share the same features such as the paper shredder, air purifier, and water
dispenser and so on. Which means the first and second techniques cannot be
implemented in the case of office equipment that only has on-off function thus
cannot fully solve the standby power issue in PKS. As in the case of the third design
which requires alteration of the appliance’s power system are hard to be
implemented and surely cannot be done on office equipment that are still under
warranty.
In order to fully achieve the cutting off of standby power from all the office
equipment in PKS, the design must take into account the equipment that has and has
not the feature of standby mode plus the implement ability of the design.
2.5 The livewire 1.11 Pro software
The livewire 1.11 Pro is a sophisticated package of software that can be used to
design and simulate electronic circuits. In this software, switches, transistors, diodes,
integrated circuits and hundreds of other components can all be connected together to
Investigate the behaviour of a circuit. Upon start-up, the software will have six
commands to choose from as shown in the following.
(i) Start-up page
Figure 2.2 shows the appearance of the software upon start-up. The user will
have to choose between the six commands on the pop-up menu.

19
Figure 2.2 Appearance of livewire start-up page
(ii) Create a circuits command
If the user choose to create a circuit then the Figure 2.3 shows the appearance
when the create a circuits command is selected. The user can start drawing
by clicking and drag the component from the menu on the left and place it on
the drawing board.
Figure 2.3 Appearance when the create a circuits command is selected
(iii) Open electricity circuits command
Figure 2.4 shows the appearance when the open electricity circuits command
is selected.
Figure 2.4 Appearance when the open electricity circuits command is selected
20
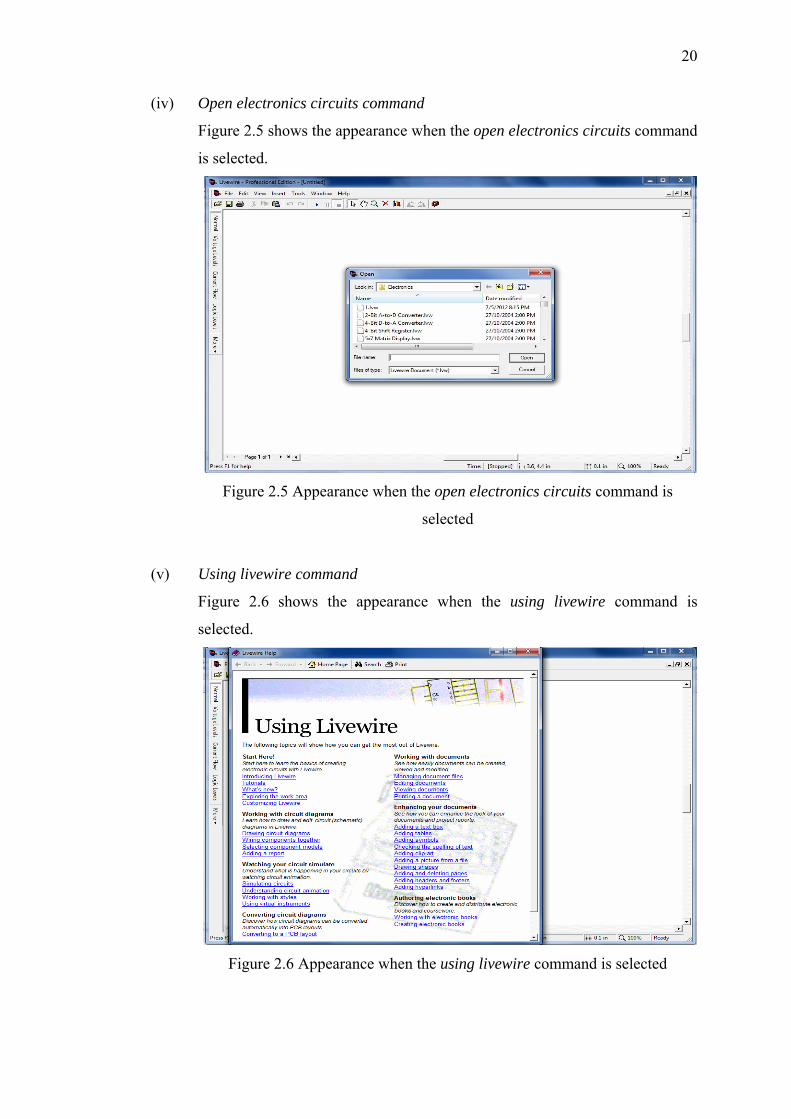
(iv) Open electronics circuits command
Figure 2.5 shows the appearance when the open electronics circuits command
is selected.
Figure 2.5 Appearance when the open electronics circuits command is
selected
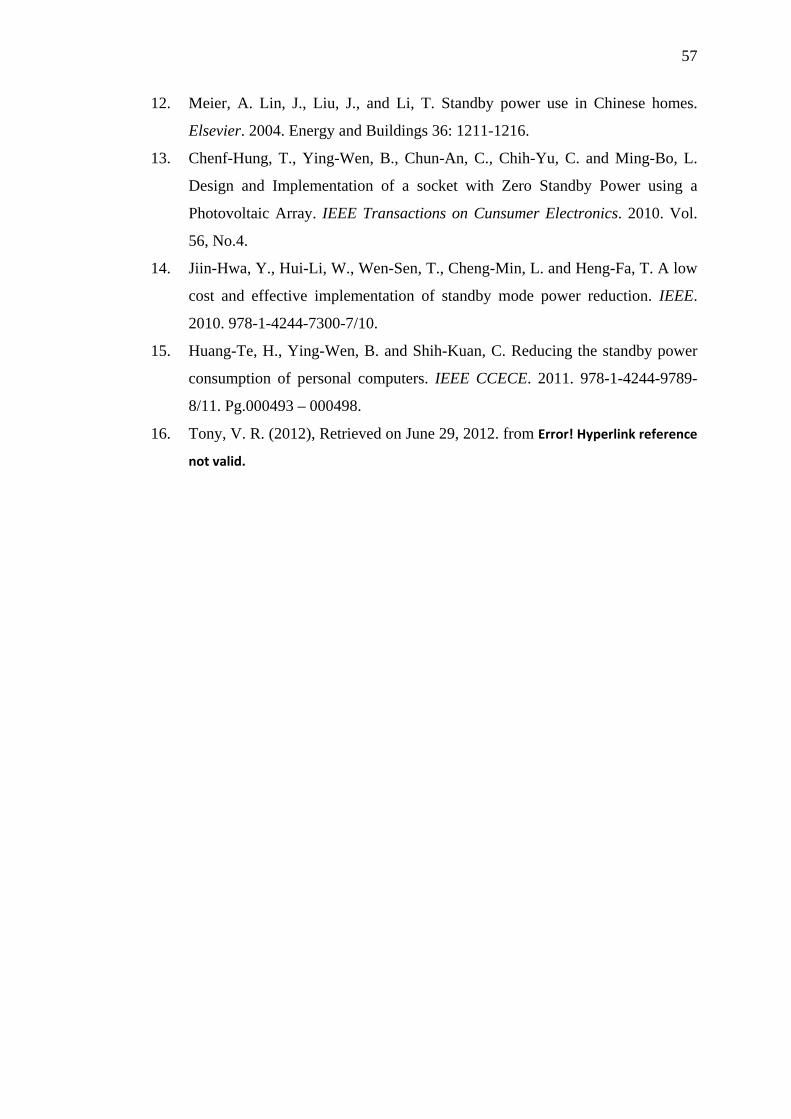
(v) Using livewire command
Figure 2.6 shows the appearance when the using livewire command is
selected.
Figure 2.6 Appearance when the using livewire command is selected

21
(vi) Tutorials command
Figure 2.7 shows the appearance when the tutorials command is selected.
Figure 2.7 Appearance when the tutorials command is selected
When the user has completed designing a circuit, they can simulate the circuit
and choose to view the simulation in different mode as follow:
(i) Normal
Simulation in the normal mode will enable the user to add measuring device
such as an oscilloscope and see the waveforms produced as shown in figure
2.8.
Figure 2.8 Simulation in normal mode

22
(ii) Voltage levels
Simulation in the voltage levels mode with enable the user to see the red
indicator rising and falling to indicate the voltage level at each nod as shown
in figure 2.9.
Figure 2.9 Simulation in voltage levels mode
(iii) Current flow
Simulation in the current flow mode will enable the user to see the current
movement in the circuit as indicated by the movement of the red and green
line that is going into or out from the circuit as shown in figure 2.10.
Figure 2.10 Simulation in current flow mode

23
(iv) Logic levels
Simulation in the logic levels mode will enable the user to see the logic level
of the circuits as indicated by the solid green and red line and the logic x or 0
indicator on each nod as shown in figure 2.11.
Figure 2.11 Simulation in logic levels mode
In conclusion, the livewire software is really helpful in terms of designing a
circuit as we can simulate and check the connections and functions of the circuit.
Overall, the software is fairly easy to learn and use.

CHAPTER 3
METHODOLOGY
3.1 Preamble
This chapter begins by discussing the project planning and its timeframe. This
is followed by description of each of the three parts of project implementation and
later the designing process of the alternative standby power cut-off system for the
office equipment is presented.
3.2 Project planning
The overall execution of the project will take up 11 months and is governed by the
following Gantt chart.
2011 2012
No. Activity
Sep
Oct
Nov
Dec
Jan
Feb
Mar
Apr
May
Jun
Jul
1 Determine Suitable Project 2 Literature Review & Project
Planning
3 Proposal Preparation 4 Part 1 - Survey & Data Analysis 5 Part 2 - Standby Power
Measurement and Analysis
6 Project Presentation I 7 Part 3 - Standby power cut-off
system design and simulation
8 Project Report Writing 9 Project Presentation II
Figure 3.1 The project Gantt Chart

56
REFERENCES
1. Hu, H., Han, L., Tian, X. and Wu1, G. Concerning with standby power
consumption and creating low carbon life – Trailing and studying the standby
power consumption of office equipment in Kunming, IEEE. 2011. 978-1-4244-
9439-2/11: 2049-2051.
2. Guan, L., Berrill, T. and Browna, R. J. Measurement of standby power for
selected electrical appliances in Australia. Elsevier. 2011. Energy and
Buildings 43: 485-490.
3. McGarry, L. The standby power challenge. International IEEE Conference on
Asian Green Electronics (AGEC). 2004. 0-7 803-8203-X/04: 56-62.
4. Lu, T. K., Yeh, C. T. and Chang, W. C. Measuring the use of residential
standby power in Taiwan. Elsevier. 2011. Energy and Buildings 43: 3539-
3547.
5. Rainer, L., Steve, G., and Meier, A. You Won’t Find These Leaks with a
Blower Door: The Latest in ‘Leaking Electricity’ in Homes. Proceedings of the
ACEEE 1996 Summer Study on Energy Efficiency in Buildings. Volume 1. pp.
1.187-1.191.
6. Wikipedia (2012), Retrived on June 25, 2012, from http://en.wikipedia.org/
wiki/Standby_power.
7. Lloyd, A. (2007), Retrived on June 25, 2012, from http://realneo.us/blog/ bill-
macdermott/the-visual-display-of-vampire-information.
8. Lebot, B., Meier, A. and Anglade, A. Global implications of standby power
use. escholarship. Lawrence Berkeley National Laboratory. 2000.
9. Ross, J. P. and Meier, A. Measurements of whole-house standby power
consumption in California homes. Pergamon, 2002. Energy 27: 861-868.
10. Fung, A. S., Aulenback, A., Ferguson, A. and Ugursal, V. I. Standby power
requirements of household appliances in Canada. Elsevier. 2003. Energy and
Buildings 35: 217-228.
11. Clement, K., Pardon, I. and Driesen, J. Standby power consumption in
Belgium. 9th International Conference - Electrical Power Quality and
Utilization, Barcelona. 9-11 October 2007.
57
12. Meier, A. Lin, J., Liu, J., and Li, T. Standby power use in Chinese homes.
Elsevier. 2004. Energy and Buildings 36: 1211-1216.
13. Chenf-Hung, T., Ying-Wen, B., Chun-An, C., Chih-Yu, C. and Ming-Bo, L.
Design and Implementation of a socket with Zero Standby Power using a
Photovoltaic Array. IEEE Transactions on Cunsumer Electronics. 2010. Vol.
56, No.4.
14. Jiin-Hwa, Y., Hui-Li, W., Wen-Sen, T., Cheng-Min, L. and Heng-Fa, T. A low
cost and effective implementation of standby mode power reduction. IEEE.
2010. 978-1-4244-7300-7/10.
15. Huang-Te, H., Ying-Wen, B. and Shih-Kuan, C. Reducing the standby power
consumption of personal computers. IEEE CCECE. 2011. 978-1-4244-9789-
8/11. Pg.000493 – 000498.
16. Tony, V. R. (2012), Retrieved on June 29, 2012. from Error! Hyperlink reference
not valid.