Embed Size (px)
Citation preview
Abstract— The automotive industry is continually aiming to
develop the aerodynamics of car bodies. This may be for a
variety of beneficial reasons such as to increase speed or fuel
efficiency by reducing drag. However, recently there has been a
greater amount of focus on wind noise produced while driving.
Designers in this industry seek a combination of both
simplicity of approach and overall effectiveness. This combined
with the growing availability of commercial CFD
(Computational Fluid Dynamics) packages is likely to lead to an
increase in the use of RANS (Reynolds Averaged Navier-
Stokes) based CFD methods. This is due to these methods often
being simpler than other CFD methods, having lower time and
computing requirements.
In this investigation the effectiveness of turbulent flow and
acoustic noise prediction using RANS based methods has been
assessed for different wing mirror geometries. Three different
RANS based models were used; standard k-ε, realizable k-ε and
k-ω SST. The merits and limitations of these methods are then
discussed, by comparing with both experimental and numerical
results found in literature. In general, flow prediction is fairly
comparable to more complex LES (Large Eddy Simulation)
based methods; in particular the k-ω SST model. However
acoustic noise prediction still leaves opportunities for more
improvement using RANS based methods.
Index Terms— Acoustics, aerodynamics, RANS models,
turbulent flow
I. INTRODUCTION
T is widely known that desirable traits such as handling,
customer comfort and car performance are affected by
vehicle aerodynamics. Furthermore a good aerodynamic
design will reduce overall drag which in turn will contribute
greatly to lower emissions. This is very desirable due to the
constant increase in fuel prices as well as the increasing
demand by governments to meet environmental standards
[1]. With the increase in popularity of electric cars in recent
years [2], wind noise reduction has become an issue of
greater importance; when engine noise is removed from a
car all other noise sources become much more prominent
factors [3]. This increase in exterior noise can have an effect
on customer satisfaction levels.
Although traditionally analysis of these factors have
always been done experimentally, usually by means of wind
tunnel testing, recently the use of CFD has become more
Manuscript received January 29, 2015; revised February 20, 2015.
A.J. Bowes was a BEng(H) student in the Dept. of Mechanical and
Construction Engineering, Northumbria University, Newcastle Upon Tyne,
NE1 8ST, UK
R. Hasan is with the Dept. of Mechanical and Construction
Engineering, Northumbria University, Newcastle Upon Tyne, NE1 8ST,
UK (e-mail: [email protected]).
widely accepted as it can be a very powerful tool for
analyzing these kinds of problems [4]. Flow around wing
mirrors and the generated acoustics has been subject to
investigation in numerous academic studies [5,6,7,8].
Moreover it is likely that there has also been further
aerodynamic study performed on wing mirrors in both
commercial car design as well as in vehicle design for
motorsport. However due to the competitive nature of
automotive development in these fields, most commonly
motorsport, the results of these studies are usually not
available for public access. This is due to the constant drive
to produce more competitive cars with a key focus on body
styling to reduce drag, which in turn leads to more radical
aerodynamic designs. Design teams attempt to keep the
performance of these designs secret for as long as possible in
order to gain a competitive edge.
Of the numerous academic studies performed on generic
wing mirror designs, the most popular numerical method
used is LES although some hybrid methods such as DES
(Detached Eddy Simulation) have been examined. This is
likely due to the high level of accuracy that can be achieved
from these types of analysis. However some of the most
popular techniques employed in commercial aerodynamic
analysis make use of RANS based methods as these involve
relatively low computing resources compared to other
methods. This can be an important factor to consider when
the use of a slightly less accurate method may lead to a small
decrease in the accuracy of the results obtained while
offering a significant saving in computing requirements and
consequently computing time and cost.
In this paper the commercial CFD program FLUENT 14.5
was used to predict transient flow behavior around two wing
mirror shapes, one simple and one complex. The objective
of this study was to assess the effectiveness of several
popular RANS based CFD methods in predicting the flow
around both a simple car wing mirror shape and also a more
complex, realistic car wing mirror shape. The different
solution methods as well as various setup parameters, e.g.
meshing technique were chosen based on factors such as
accessibility and computing restraints. This was done in
order to properly demonstrate the level of accuracy it is
possible to achieve when using the more accessible RANS
based methods as compared to the often more accurate yet
demanding LES based methods. Using accessible CFD
methods to achieve accurate predictions of flow around
complex shapes such as the wing mirror used in this study
should demonstrate the ability for CFD to become a more
accessible and widely used tool for a greater number of
engineers.
A Computational Analysis of Flow and
Acoustics around a Car Wing Mirror
Aidan J. Bowes, Reaz Hasan
I
Proceedings of the World Congress on Engineering and Computer Science 2015 Vol II WCECS 2015, October 21-23, 2015, San Francisco, USA
ISBN: 978-988-14047-2-5 ISSN: 2078-0958 (Print); ISSN: 2078-0966 (Online)
WCECS 2015
II. PROCEDURE
A. Domain and Boundary Specification
All calculations were carried out using the commercial CFD
package ANSYS FLUENT 14.5 software. The methodology
involves the iterative solution of the Navier-Stokes equations
with the finite volume method on an unstructured mesh
configuration. For more information see Versteeg et al [9].
Three different RANS based models were used in order to
provide a reasonable comparison of effectiveness; standard
k-ε, realizable k-ε and k-ω SST.
In order to validate the test procedure for the 3D wing mirror
cases it was first necessary to validate the accuracy of the
models that were to be used. This was done by performing
analysis on a 2D cylinder to find key flow features such as
drag coefficient, drag force and Strouhal number. Once the
2D method had been established as effective, analysis was
carried out on the 3D geometries.
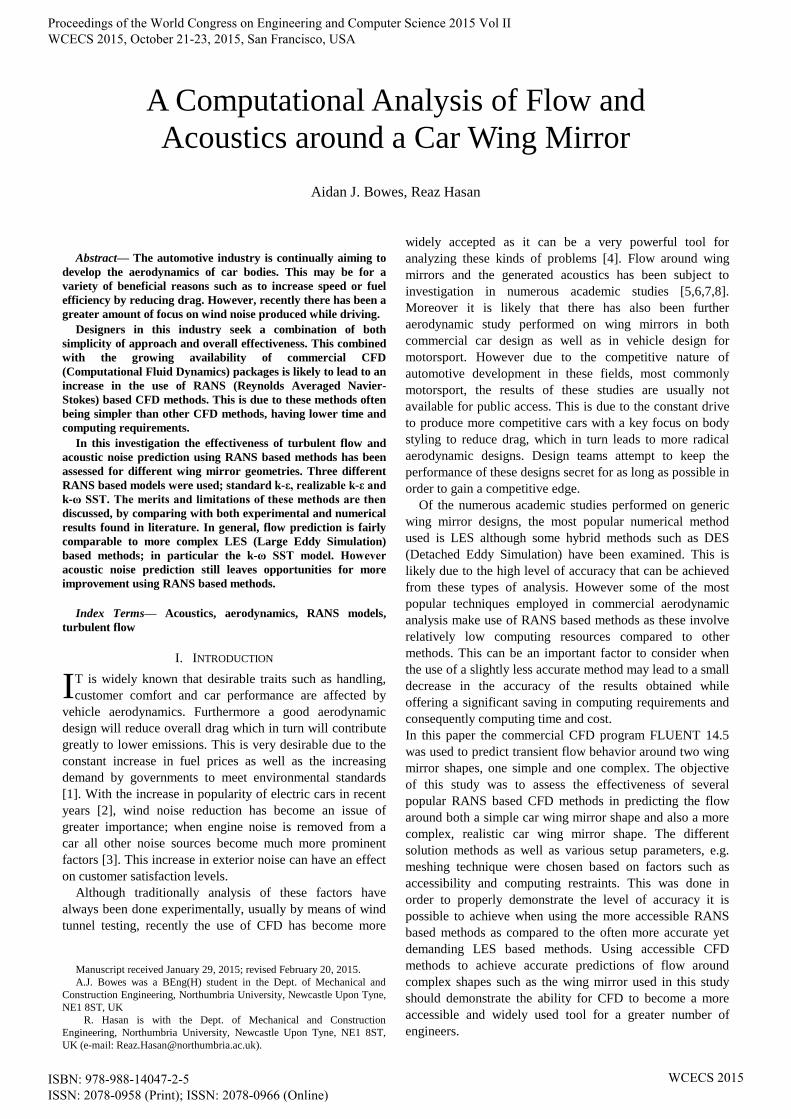
2D model dimensions were chosen based on a variety of
factors. Firstly it was necessary to relate the geometry to a
real wing mirror as closely as possible. Therefore a diameter
of 0.2m was chosen for the cylinder as this is a
representative dimension of a real wing mirror. Additionally,
a distance of 1.2m from the cylinder center to the top
boundary was chosen in order to represent the distance from
a wing mirror to the ground. Other dimensions were then
applied based on boundaries in similar tests from literature
[5]. A fluid velocity of 40m/s was used as this is an accurate
representative speed for a road vehicle. Fig.1 below shows
the 3D boundary for the simple geometry with dimensions
given in terms of the cylinder diameter D.
Fig.1: Simple geometry and boundary dimensions
B. Grid Generation and Time Step Selection
In order to capture certain oscillating flow features it was
necessary to select an adequate time step size. Here the
equation St=fl/v was used to find the approximated
frequency where St = Strouhal number, f = frequency, l =
characteristic length and v = velocity. This frequency could
then be used to find an approximate time period. It is
recommended that transient cases such as this should be
solved by at least 30 time steps per cycle [11]. Using these
values, a recommended time step of 6.67x10⁻⁴
was
calculated for the computation. A time step of 5x10⁻⁴
was
selected as this was considered to be a simpler number to
work with; as this is a smaller time step, accuracy would
only be improved by this change. After these parameters had
been established it was possible to run the 2D simulations
for each of the three models. The values found were then
compared to values found using an analytical method for
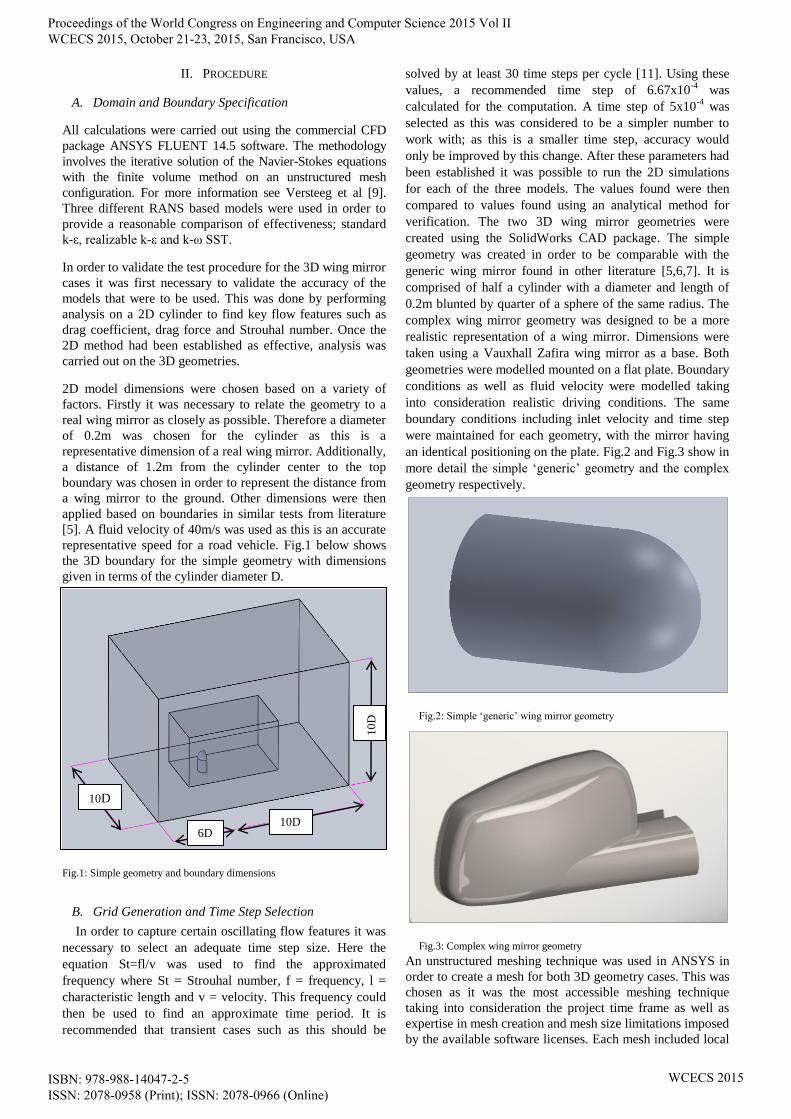
verification. The two 3D wing mirror geometries were
created using the SolidWorks CAD package. The simple
geometry was created in order to be comparable with the
generic wing mirror found in other literature [5,6,7]. It is
comprised of half a cylinder with a diameter and length of
0.2m blunted by quarter of a sphere of the same radius. The
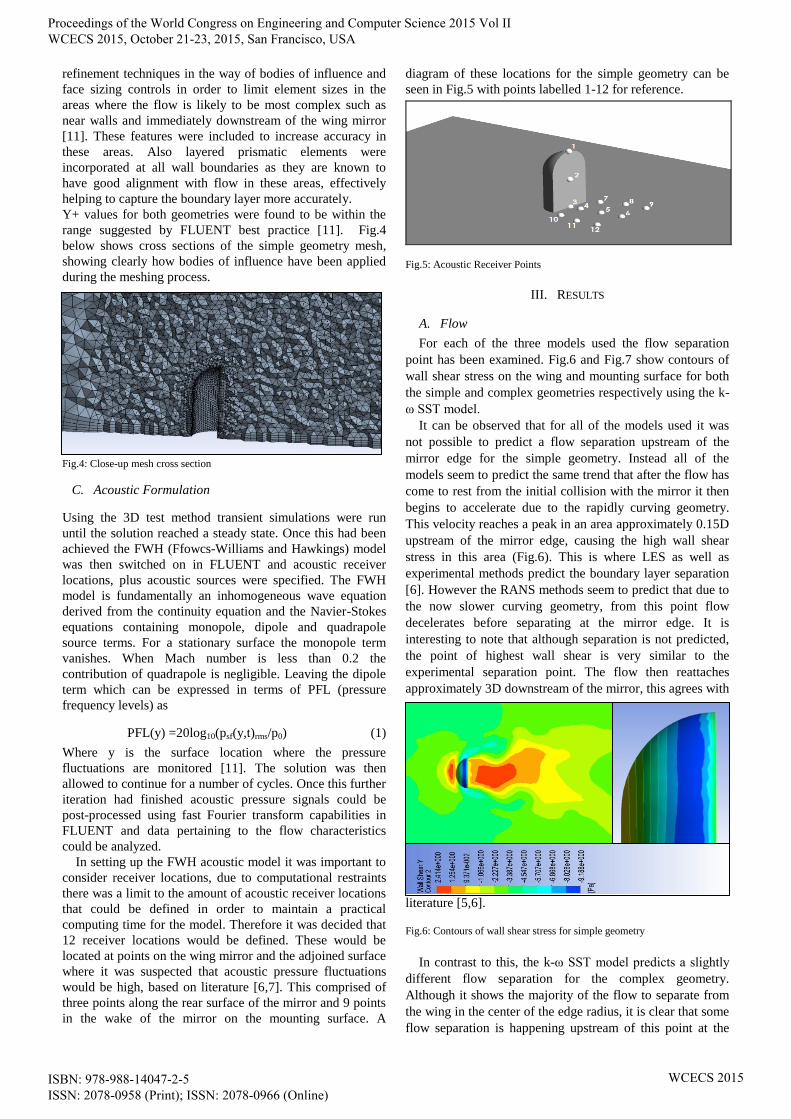
complex wing mirror geometry was designed to be a more
realistic representation of a wing mirror. Dimensions were
taken using a Vauxhall Zafira wing mirror as a base. Both
geometries were modelled mounted on a flat plate. Boundary
conditions as well as fluid velocity were modelled taking
into consideration realistic driving conditions. The same
boundary conditions including inlet velocity and time step
were maintained for each geometry, with the mirror having
an identical positioning on the plate. Fig.2 and Fig.3 show in
more detail the simple ‘generic’ geometry and the complex
geometry respectively.
Fig.2: Simple ‘generic’ wing mirror geometry
Fig.3: Complex wing mirror geometry
An unstructured meshing technique was used in ANSYS in
order to create a mesh for both 3D geometry cases. This was
chosen as it was the most accessible meshing technique
taking into consideration the project time frame as well as
expertise in mesh creation and mesh size limitations imposed
by the available software licenses. Each mesh included local
10
D
10D 6D
10D
Proceedings of the World Congress on Engineering and Computer Science 2015 Vol II WCECS 2015, October 21-23, 2015, San Francisco, USA
ISBN: 978-988-14047-2-5 ISSN: 2078-0958 (Print); ISSN: 2078-0966 (Online)
WCECS 2015
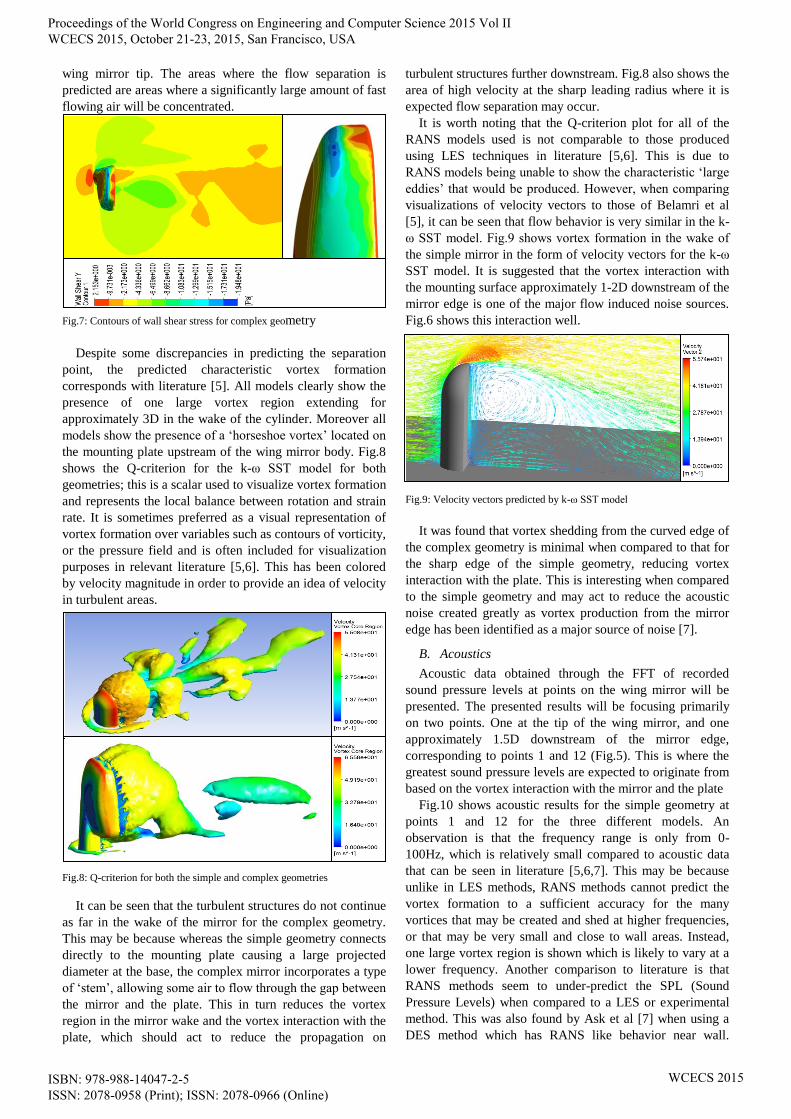
refinement techniques in the way of bodies of influence and
face sizing controls in order to limit element sizes in the
areas where the flow is likely to be most complex such as
near walls and immediately downstream of the wing mirror
[11]. These features were included to increase accuracy in
these areas. Also layered prismatic elements were
incorporated at all wall boundaries as they are known to
have good alignment with flow in these areas, effectively
helping to capture the boundary layer more accurately.
Y+ values for both geometries were found to be within the
range suggested by FLUENT best practice [11]. Fig.4
below shows cross sections of the simple geometry mesh,
showing clearly how bodies of influence have been applied
during the meshing process.
Fig.4: Close-up mesh cross section
C. Acoustic Formulation
Using the 3D test method transient simulations were run
until the solution reached a steady state. Once this had been
achieved the FWH (Ffowcs-Williams and Hawkings) model
was then switched on in FLUENT and acoustic receiver
locations, plus acoustic sources were specified. The FWH
model is fundamentally an inhomogeneous wave equation
derived from the continuity equation and the Navier-Stokes
equations containing monopole, dipole and quadrapole
source terms. For a stationary surface the monopole term
vanishes. When Mach number is less than 0.2 the
contribution of quadrapole is negligible. Leaving the dipole
term which can be expressed in terms of PFL (pressure
frequency levels) as
PFL(y) =20log10(psf(y,t)rms/p0) (1)
Where y is the surface location where the pressure
fluctuations are monitored [11]. The solution was then
allowed to continue for a number of cycles. Once this further
iteration had finished acoustic pressure signals could be
post-processed using fast Fourier transform capabilities in
FLUENT and data pertaining to the flow characteristics
could be analyzed.
In setting up the FWH acoustic model it was important to
consider receiver locations, due to computational restraints
there was a limit to the amount of acoustic receiver locations
that could be defined in order to maintain a practical
computing time for the model. Therefore it was decided that
12 receiver locations would be defined. These would be
located at points on the wing mirror and the adjoined surface
where it was suspected that acoustic pressure fluctuations
would be high, based on literature [6,7]. This comprised of
three points along the rear surface of the mirror and 9 points
in the wake of the mirror on the mounting surface. A
diagram of these locations for the simple geometry can be
seen in Fig.5 with points labelled 1-12 for reference.
Fig.5: Acoustic Receiver Points
III. RESULTS
A. Flow
For each of the three models used the flow separation
point has been examined. Fig.6 and Fig.7 show contours of
wall shear stress on the wing and mounting surface for both
the simple and complex geometries respectively using the k-
ω SST model.
It can be observed that for all of the models used it was
not possible to predict a flow separation upstream of the
mirror edge for the simple geometry. Instead all of the
models seem to predict the same trend that after the flow has
come to rest from the initial collision with the mirror it then
begins to accelerate due to the rapidly curving geometry.
This velocity reaches a peak in an area approximately 0.15D
upstream of the mirror edge, causing the high wall shear
stress in this area (Fig.6). This is where LES as well as
experimental methods predict the boundary layer separation
[6]. However the RANS methods seem to predict that due to
the now slower curving geometry, from this point flow
decelerates before separating at the mirror edge. It is
interesting to note that although separation is not predicted,
the point of highest wall shear is very similar to the
experimental separation point. The flow then reattaches
approximately 3D downstream of the mirror, this agrees with
literature [5,6].
Fig.6: Contours of wall shear stress for simple geometry
In contrast to this, the k-ω SST model predicts a slightly
different flow separation for the complex geometry.
Although it shows the majority of the flow to separate from
the wing in the center of the edge radius, it is clear that some
flow separation is happening upstream of this point at the
Proceedings of the World Congress on Engineering and Computer Science 2015 Vol II WCECS 2015, October 21-23, 2015, San Francisco, USA
ISBN: 978-988-14047-2-5 ISSN: 2078-0958 (Print); ISSN: 2078-0966 (Online)
WCECS 2015
wing mirror tip. The areas where the flow separation is
predicted are areas where a significantly large amount of fast
flowing air will be concentrated.
Fig.7: Contours of wall shear stress for complex geometry
Despite some discrepancies in predicting the separation
point, the predicted characteristic vortex formation
corresponds with literature [5]. All models clearly show the
presence of one large vortex region extending for
approximately 3D in the wake of the cylinder. Moreover all
models show the presence of a ‘horseshoe vortex’ located on
the mounting plate upstream of the wing mirror body. Fig.8
shows the Q-criterion for the k-ω SST model for both
geometries; this is a scalar used to visualize vortex formation
and represents the local balance between rotation and strain
rate. It is sometimes preferred as a visual representation of
vortex formation over variables such as contours of vorticity,
or the pressure field and is often included for visualization
purposes in relevant literature [5,6]. This has been colored
by velocity magnitude in order to provide an idea of velocity
in turbulent areas.
Fig.8: Q-criterion for both the simple and complex geometries
It can be seen that the turbulent structures do not continue
as far in the wake of the mirror for the complex geometry.
This may be because whereas the simple geometry connects
directly to the mounting plate causing a large projected
diameter at the base, the complex mirror incorporates a type
of ‘stem’, allowing some air to flow through the gap between
the mirror and the plate. This in turn reduces the vortex
region in the mirror wake and the vortex interaction with the
plate, which should act to reduce the propagation on
turbulent structures further downstream. Fig.8 also shows the
area of high velocity at the sharp leading radius where it is
expected flow separation may occur.
It is worth noting that the Q-criterion plot for all of the
RANS models used is not comparable to those produced
using LES techniques in literature [5,6]. This is due to
RANS models being unable to show the characteristic ‘large
eddies’ that would be produced. However, when comparing
visualizations of velocity vectors to those of Belamri et al
[5], it can be seen that flow behavior is very similar in the k-
ω SST model. Fig.9 shows vortex formation in the wake of
the simple mirror in the form of velocity vectors for the k-ω
SST model. It is suggested that the vortex interaction with
the mounting surface approximately 1-2D downstream of the
mirror edge is one of the major flow induced noise sources.
Fig.6 shows this interaction well.
Fig.9: Velocity vectors predicted by k-ω SST model
It was found that vortex shedding from the curved edge of
the complex geometry is minimal when compared to that for
the sharp edge of the simple geometry, reducing vortex
interaction with the plate. This is interesting when compared
to the simple geometry and may act to reduce the acoustic
noise created greatly as vortex production from the mirror
edge has been identified as a major source of noise [7].
B. Acoustics
Acoustic data obtained through the FFT of recorded
sound pressure levels at points on the wing mirror will be
presented. The presented results will be focusing primarily
on two points. One at the tip of the wing mirror, and one
approximately 1.5D downstream of the mirror edge,
corresponding to points 1 and 12 (Fig.5). This is where the
greatest sound pressure levels are expected to originate from
based on the vortex interaction with the mirror and the plate
Fig.10 shows acoustic results for the simple geometry at
points 1 and 12 for the three different models. An
observation is that the frequency range is only from 0-
100Hz, which is relatively small compared to acoustic data
that can be seen in literature [5,6,7]. This may be because
unlike in LES methods, RANS methods cannot predict the
vortex formation to a sufficient accuracy for the many
vortices that may be created and shed at higher frequencies,
or that may be very small and close to wall areas. Instead,
one large vortex region is shown which is likely to vary at a
lower frequency. Another comparison to literature is that
RANS methods seem to under-predict the SPL (Sound
Pressure Levels) when compared to a LES or experimental
method. This was also found by Ask et al [7] when using a
DES method which has RANS like behavior near wall.
Proceedings of the World Congress on Engineering and Computer Science 2015 Vol II WCECS 2015, October 21-23, 2015, San Francisco, USA
ISBN: 978-988-14047-2-5 ISSN: 2078-0958 (Print); ISSN: 2078-0966 (Online)
WCECS 2015
Therefore this inaccuracy may also be due to the RANS
method dampening turbulent pressure fluctuations due to a
disproportionate production of turbulent viscosity. This
would also explain the poor prediction in boundary layer
separation.
In comparing the three RANS methods it is clear for the
simple geometry the two k-ε based models seem to predict
the same trend showing only two significant peaks. Only one
of these peaks corresponds to a sound greater than
conversational level. However the k-ω SST model predicts
on average a much higher sound pressure level at lower
frequencies with multiple peaks at approximately 15Hz,
25Hz and 40Hz. The trend exhibited here is not unlike that
shown in literature for the DES model [7] albeit at a lower
SPL, which is to be expected. All of these peaks are above
an average conversational level and would present
themselves as very loud, low sounds to the observer which
may be a cause for noise complaints from observers and the
driver, with values approaching 100dB being produced from
the tip of the mirror.
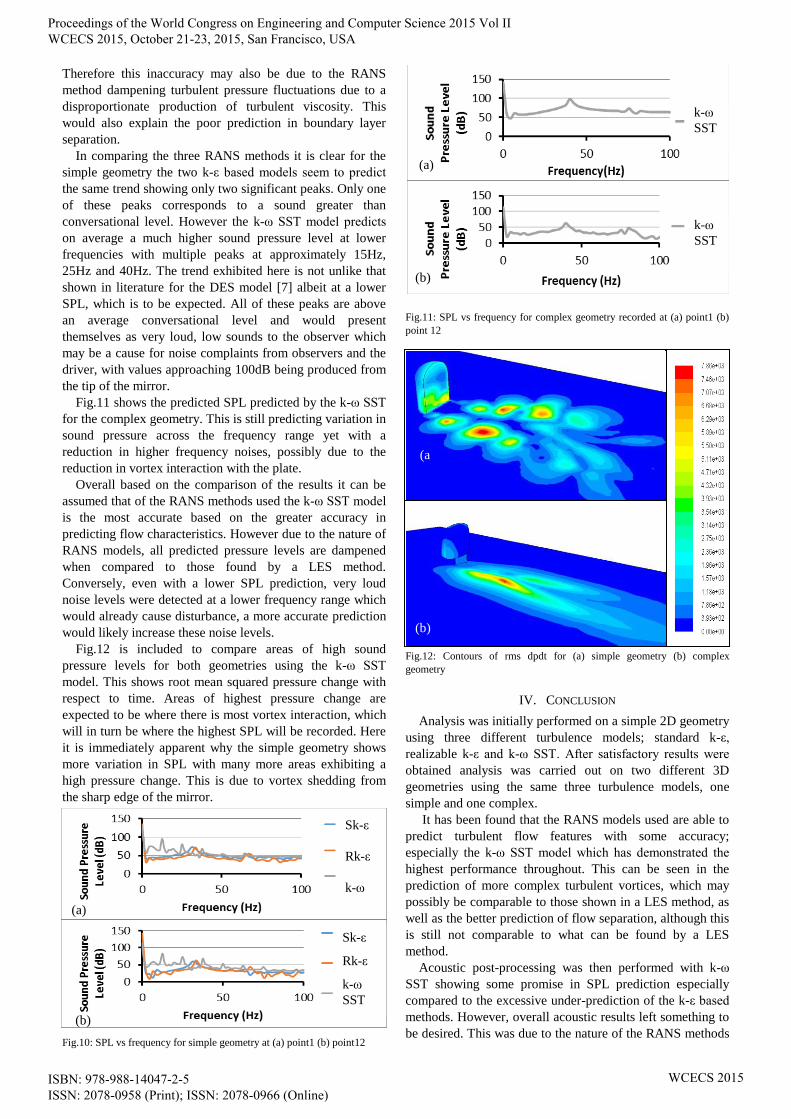
Fig.11 shows the predicted SPL predicted by the k-ω SST
for the complex geometry. This is still predicting variation in
sound pressure across the frequency range yet with a
reduction in higher frequency noises, possibly due to the
reduction in vortex interaction with the plate.
Overall based on the comparison of the results it can be
assumed that of the RANS methods used the k-ω SST model
is the most accurate based on the greater accuracy in
predicting flow characteristics. However due to the nature of
RANS models, all predicted pressure levels are dampened
when compared to those found by a LES method.
Conversely, even with a lower SPL prediction, very loud
noise levels were detected at a lower frequency range which
would already cause disturbance, a more accurate prediction
would likely increase these noise levels.
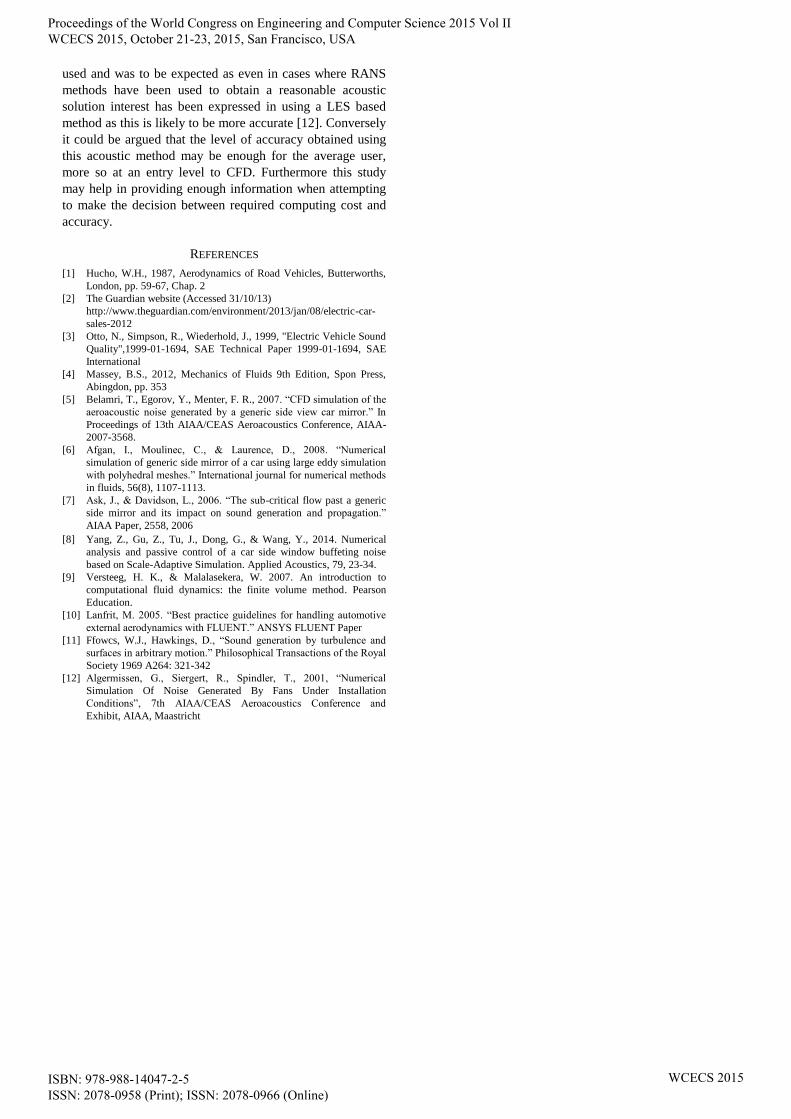
Fig.12 is included to compare areas of high sound
pressure levels for both geometries using the k-ω SST
model. This shows root mean squared pressure change with
respect to time. Areas of highest pressure change are
expected to be where there is most vortex interaction, which
will in turn be where the highest SPL will be recorded. Here
it is immediately apparent why the simple geometry shows
more variation in SPL with many more areas exhibiting a
high pressure change. This is due to vortex shedding from
the sharp edge of the mirror.
Fig.10: SPL vs frequency for simple geometry at (a) point1 (b) point12
Fig.11: SPL vs frequency for complex geometry recorded at (a) point1 (b)
point 12
Fig.12: Contours of rms dpdt for (a) simple geometry (b) complex
geometry
IV. CONCLUSION
Analysis was initially performed on a simple 2D geometry
using three different turbulence models; standard k-ε,
realizable k-ε and k-ω SST. After satisfactory results were
obtained analysis was carried out on two different 3D
geometries using the same three turbulence models, one
simple and one complex.
It has been found that the RANS models used are able to
predict turbulent flow features with some accuracy;
especially the k-ω SST model which has demonstrated the
highest performance throughout. This can be seen in the
prediction of more complex turbulent vortices, which may
possibly be comparable to those shown in a LES method, as
well as the better prediction of flow separation, although this
is still not comparable to what can be found by a LES
method.
Acoustic post-processing was then performed with k-ω
SST showing some promise in SPL prediction especially
compared to the excessive under-prediction of the k-ε based
methods. However, overall acoustic results left something to
be desired. This was due to the nature of the RANS methods
(a)
(b)
Sk-ε
Rk-ε
k-ω
SST
Sk-ε
Rk-ε
k-ω
SST
k-ω
SST
k-ω
SST
(a)
(b)
(a
)
(b)
Proceedings of the World Congress on Engineering and Computer Science 2015 Vol II WCECS 2015, October 21-23, 2015, San Francisco, USA
ISBN: 978-988-14047-2-5 ISSN: 2078-0958 (Print); ISSN: 2078-0966 (Online)
WCECS 2015
used and was to be expected as even in cases where RANS
methods have been used to obtain a reasonable acoustic
solution interest has been expressed in using a LES based
method as this is likely to be more accurate [12]. Conversely
it could be argued that the level of accuracy obtained using
this acoustic method may be enough for the average user,
more so at an entry level to CFD. Furthermore this study
may help in providing enough information when attempting
to make the decision between required computing cost and
accuracy.
REFERENCES
[1] Hucho, W.H., 1987, Aerodynamics of Road Vehicles, Butterworths,
London, pp. 59-67, Chap. 2
[2] The Guardian website (Accessed 31/10/13)
http://www.theguardian.com/environment/2013/jan/08/electric-car-
sales-2012
[3] Otto, N., Simpson, R., Wiederhold, J., 1999, "Electric Vehicle Sound
Quality",1999-01-1694, SAE Technical Paper 1999-01-1694, SAE
International
[4] Massey, B.S., 2012, Mechanics of Fluids 9th Edition, Spon Press,
Abingdon, pp. 353
[5] Belamri, T., Egorov, Y., Menter, F. R., 2007. “CFD simulation of the
aeroacoustic noise generated by a generic side view car mirror.” In
Proceedings of 13th AIAA/CEAS Aeroacoustics Conference, AIAA-
2007-3568.
[6] Afgan, I., Moulinec, C., & Laurence, D., 2008. “Numerical
simulation of generic side mirror of a car using large eddy simulation
with polyhedral meshes.” International journal for numerical methods
in fluids, 56(8), 1107-1113.
[7] Ask, J., & Davidson, L., 2006. “The sub-critical flow past a generic
side mirror and its impact on sound generation and propagation.”
AIAA Paper, 2558, 2006
[8] Yang, Z., Gu, Z., Tu, J., Dong, G., & Wang, Y., 2014. Numerical
analysis and passive control of a car side window buffeting noise
based on Scale-Adaptive Simulation. Applied Acoustics, 79, 23-34.
[9] Versteeg, H. K., & Malalasekera, W. 2007. An introduction to
computational fluid dynamics: the finite volume method. Pearson
Education.
[10] Lanfrit, M. 2005. “Best practice guidelines for handling automotive
external aerodynamics with FLUENT.” ANSYS FLUENT Paper
[11] Ffowcs, W.J., Hawkings, D., “Sound generation by turbulence and
surfaces in arbitrary motion.” Philosophical Transactions of the Royal
Society 1969 A264: 321-342
[12] Algermissen, G., Siergert, R., Spindler, T., 2001, “Numerical
Simulation Of Noise Generated By Fans Under Installation
Conditions”, 7th AIAA/CEAS Aeroacoustics Conference and
Exhibit, AIAA, Maastricht
Proceedings of the World Congress on Engineering and Computer Science 2015 Vol II WCECS 2015, October 21-23, 2015, San Francisco, USA
ISBN: 978-988-14047-2-5 ISSN: 2078-0958 (Print); ISSN: 2078-0966 (Online)
WCECS 2015