Embed Size (px)
Citation preview

A Comprehensive Review of Nursing Home Payment
with Recommendations for Reform
Report to the Illinois General Assembly
In Accordance with Requirement in 305 ILCS 5/5-2.10
Illinois Department of Healthcare and Family Services September 30, 2021
Theresa Eagleson, MBA, Director
Andy Allison, PhD, Deputy Director
Kelly Cunningham, MA, Medicaid Director

1 | P a g e
Executive Summary
“The moral test of a government is how it treats those who are in the dawn of life,
the children; those who are in the twilight of life, the elderly; those who are in the
shadows of life…”
Hubert Humphrey
The COVID-19 pandemic demonstrated the real risk for Medicaid customers in understaffed and over-
crowded nursing homes. Black and Brown customers were disproportionately impacted by disease and
death because they were more likely to reside in poorly staffed facilities and in “ward” rooms containing
three or four beds per room. In fact, the Department of Healthcare and Family Services (HFS) analysis
indicated that at least 40% more Black and Brown Medicaid customers in nursing facilities perished than
would be expected based on COVID-19 mortality rates among White nursing facility residents.
Each year, HFS spends billions of dollars on nursing facility care for approximately 45,000 Medicaid
customers. Medicaid pays for approximately 60% of all nursing facility days in Illinois and is the largest
payor of days in both the state and in the nation. Our role as payor notwithstanding, HFS has a moral
imperative to our customers to ensure that the services and care they receive in nursing facilities is
safe, high quality and equitable.
HFS engaged with representatives of the nursing facility sector and legislative staff over the past 18
months to reform the nursing facility rate methodology used by the Medicaid program to pay for these
services. Guiding principles were developed at the beginning of the process and restated at the
beginning of each meeting. These principles established that the advisory group’s transparent data-
driven approach and its sustained focus on completing the transition to PDPM, linking payment to
performance and staffing levels, the need to incorporate lessons from the COVID pandemic, and
streamlining the nursing home assessment. These principles can be found in Attachment 1.
While great progress was made in reaching consensus across many reform principles, some participants
argued that the industry itself was too unstable to withstand rate reform due to effects of the
pandemic. However, at this critical juncture for long term care in the state and in light of the pandemic,
these reforms actually represent the single most important thing that could be done to stabilize the
industry. Resolving the structure and level of payment by facilities’ most important payor will bring
additional financial support and strengthen resident, family and payor confidence in the care provided.
HFS feels strongly, as do many working in and affected by the nursing facility sector, that the new money
a new rate structure will generate must be used to improve the quality of care provided to customers.
On three occasions in recent years, the Illinois General Assembly increased funding ($160 million total)
to nursing facilities for the purpose of increasing staff; yet in 2019, Illinois still ranked last in staffing and
many facilities remained woefully understaffed. Now there is a push for federal pandemic-related
funding beyond what has already been distributed. We believe that the underlying reforms should

2 | P a g e
come with ANY additional funding and are necessary to turn around an industry that cares for some of
the most frail and vulnerable in our society.
Now that we know, we must do better. We propose a path forward. Our proposed
rate reform is centered around HFS’ response to key findings which are summarized
here and addressed in detail in the section that follows.
Rehab and coding creep. The case for adopting the Patient Driven Payment Model (PDPM).
HFS proposes to adopt the PDPM case mix classification as the basis for calculation of the direct care
rate, replacing use of the RUGS methodology currently in place. Adoption of this model will improve
payment accuracy and appropriateness by focusing on the resident, rather than the volume of services
provided as well as shift unnecessary Medicaid payment away for rehabilitation, which is already funded
separately by Medicare in most instances, towards residents with genuine Medicaid-financed needs.
Case mix inflation under Illinois’ RUGs-based payment system began with an essentially overnight
increase of nearly 10% that coincided with the payment system’s implementation. Since then facility
reports of resident care need have risen steadily, accumulating to another 24% rise.
Nearly one-third (30%) of Medicaid residents would need to be reclassified due solely to the absence of
rehab groups under PDPM, a strong indication of the over-use of rehab in Medicaid billing since:
• there are few truly rehabilitative services for which Medicare does not pay;
• nearly all Medicaid nursing home residents are also eligible for Medicare; and
• Therapy is reimbursed separately under Medicare Part B and not through either the current or
future Medicaid nursing rate methodologies. Only RN, LPN and CNA time associated with
residents who also receive therapy services are to be reimbursed through the nursing
component of the Medicaid Nursing Facility (NF) rate.
Historical and current staffing. Paying more for better staffed facilities.
Illinois consistently ranks last among states in staffing as measured using the national Staff Time and
Resource Intensity Verification (STRIVE) Project target staffing levels, including in the most recent data
from Q1 2021.1
Even more striking, Illinois accounts for 47 of the bottom 100 facilities in the country as measured by
nurse staffing performance v. the STRIVE target staffing level.
Medicaid days are concentrated in facilities with high levels of Medicaid-enrolled residents as well as
facilities with low staffing. Indeed, the higher the level of Medicaid utilization in a facility, the greater
the likelihood that the facility is staffed below 92% of the STRIVE target staffing level. 92% is HFS’
approximation of the level corresponding to Illinois’ minimum staffing requirement. This staffing
pattern is not attributable to Medicaid rates, but rather to facility business models.
1 STRIVE is further described in the “Nurse Staffing” sub-section of the Findings below.

3 | P a g e
Facilities coding more of their residents into a rehab CMI group are also more likely to be under-staffed,
and this relationship ties closely to Medicaid utilization. At each level of Medicaid utilization, rehab
coding falls as staffing rises-- especially at the highest level of Medicaid utilization. The tight and inverse
relationship between rehab coding on the one hand and both Medicaid utilization and STRIVE staffing
on the other could be explained by some combination of the following:
• Over-coding by facilities who report more rehab therapy services for Medicaid residents than are actually provided, which generates higher Medicaid payment but simultaneously raises the
expected number of staffing hours used in the calculation of STRIVE performance levels.
• Under-staffing v. observed resident care needs, independent of over-coding for rehab services.
Wages for Nursing Staff. Creating wage scales to stop losses and begin to turn this around.
Certified Nursing Assistant (CNA) shortages are the greatest factor in staffing shortages in Illinois nursing
homes and our last place ranking on staffing nationally. Reducing CNA turnover is key to turning around
staffing shortages, and this appears even more likely in high-Medicaid homes.
HFS is not only the largest payor for nursing home care, and is also cognizant of the disproportionate share of understaffing borne by Medicaid-funded NH residents and Medicaid’s leading role in the employment of CNAs across the state. This combination puts Medicaid in a unique and pivotal position to drive wages and employment of CNAs in the state’s nursing facilities. HFS estimates that nursing facilities employ half of the state’s practicing CNAs (50%). These front line staff caring for NH residents each day are the first and best place to begin linking increased funding to longevity in a job caring for these residents.
Illinois’ nursing home market and physical infrastructure. It should be about people, not profits.
Among the 689 Skilled Nursing Facilities (SNFs) for which HFS has staffing and utilization data:
• 79% are operated for-profit
• All of Illinois’ low-staffed SNFs are private, for-profit facilities.
• Nearly half of for-profit facilities (46%) are under-staffed
• High-Medicaid, for-profit facilities comprise 95% of all understaffed facilities in the state
Increases in Medicaid payments significantly exceeded growth in the costs of owning and operating a
SNF over the past 16 years, and through cost report year 2019 were sufficient to enable meaningful
profit even (and especially) among facilities with the highest rates of Medicaid utilization. And, between
one-third and one-half (40%) of under-staffed high-Medicaid SNFs, all of which are for-profit, have a
new licensed owner since the beginning of state fiscal year 2014. Better staffed facilities experience
licensee turnover less frequently.
The simplest way to describe ownership of the typical for-profit SNF in Illinois – economically and
empirically – is as a short-term investment, and the number of investors in each SNF suggests many are
passive investors not owner-operators. Illinois’ for-profit SNF owners tend to hold minority shares and
keep them for less than a decade. This ownership profile is affiliated with those SNFs most likely to

4 | P a g e
demonstrate the policy challenges previously discussed – rehab coding, under-staffing, and high profits
in the SNFs most likely to serve HFS’ Medicaid customers.
Physical space in Illinois nursing facilities is also unevenly distributed. Investment needs to drive real
changes in physical plant and space in order to address issues around infection control and to ensure
resident dignity. Currently, twice the proportion of non-Medicaid residents are in the least densely
concentrated facilities having less than 1.5 residents per 1000 square feet (30% v. 15% of Medicaid
residents). We are investigating the use of one-time funding sources such as ARPA to address inequities
in living space, although HFS does not recommend a universal bed buyback program
Unequal care and outcomes in Illinois nursing homes. Changing this paradigm is an equity issue – one
that Medicaid has a significant interest in changing.
Racial and ethnic minorities are not evenly distributed across Illinois’ SNFs. One-sixth of SNFs (16%,
n=110) have no Black or Brown residents at all, two-thirds (68%, n=462) have less than the statewide
average of 19% Black or Brown, and nearly one-sixth (14%, n=92) are at least 50% Black or Brown. Very
few nursing homes have a racial make-up mirroring the state as a whole.
Black and Brown residents are nearly twice as likely to reside in an under-staffed facility (69% v. 37%).
Black and Brown residents are also more than twice as likely to be in a facility that is heavily dependent
on room crowding, and the two forms of unequal risk-laden care often coincide. Not only do more than
half of Black and Brown residents (56%) reside in facilities that are both under-staffed and room-
crowded, they are nearly 3 times (2.87x) as likely as White residents to reside in such facilities.
Black or Brown residents make up nearly twice the proportion of Wave 1 COVID-19 deaths (45%) as their
share of Medicaid’s SNF population (26%) in the months just prior to the COVID-19 outbreak. We found
that at least 40% more Black and Brown Medicaid SNF residents – between 200 and 300 additional Black
and Brown Medicaid residents -- perished than would be expected based on COVID-19 mortality among
White Medicaid SNF residents. This tragic and inequitable difference in COVID-19’s Wave 1 impact
essentially disappears when also controlling for the disproportionate number of Black and Brown
residents living in zip codes with higher Wave 1 COVID-19 infection rates and room crowded nursing
facilities. In other words, the risk to Black and Brown nursing home residents is from the nursing homes
and the communities they are located in, not the residents themselves.
Quality and performance in Illinois SNFs. We must begin rewarding providers for quality care.
Of the federally-published COMPARE website’s 22 long- and short-stay quality measures, Illinois
currently ranks:
• in the bottom twenty states for nearly two-thirds (n=14) of these measures
• in the bottom ten states for 40% (n=9) of these measures
• last (51st) for 14% (n=3) of these measures
HFS proposes a multi-pronged plan to ensure that the services and care our customers receive in nursing
facilities is safe, high quality, and equitable.

5 | P a g e
Recommended Next Steps: • Immediately authorize a single, scaled (by volume) assessment on occupied beds to be effective
Jan 2022, and allow it to grow as case-mix grows.
• Authorize PDPM case-mix methodology and other rate changes below, effective Jan 2022.
• Authorize funded quality and staffing enhancements as part of the nursing home
reimbursement methodology. HFS proposes two-thirds of funding be dedicated to staffing
increases and workforce transformation. The remaining third would be used to reward
providers for achieving higher levels of care and plans to evolve and upgrade quality metrics
over time, in accordance with the Department’s Quality Pillars and in consultation with
stakeholders.
• Prohibit staffing agencies from having non-compete clauses that keep NFs from hiring agency staff that have been assigned to them.
• If additional amounts of ARPA State Fiscal Recovery Funds are dedicated to nursing facilities, HFS recommends targeting this funding for use in addressing urgent one-time needs, in
particular the protection of residents and frontline staff from the next variant or virus,
consistent with federal allowable purposes for these funds, including but not limited to:
o reducing room crowding
o improving air quality, filtering, and replacement
• Require additional transparency in nursing home ownership and revenues
• Require the Department to continue to study impact on equity for residents and pay for workers
The time is now! Further delay leaves federal funding on the table that could instead
be used to create better working environments for staff and healthier living
environments for customers / residents.
Acknowledgements
We’d like to acknowledge several additional contributors to this report who provided invaluable
expertise and insight and contributed both time and effort to the development of HFS’ proposal and the
making of this report including Kristiana Yao, Melissa Black, Mark McCurdy, Ben Winick, Jim Hunter,
Dawn Wells, Randy Hulskotter and Howard Peters. Also, we want to acknowledge similar contributions
from Dan Brendel and Jennifer Reinheimer of Myers and Stauffer.

6 | P a g e
Table of Contents
Executive Summary 1
Recommended Next Steps 5
Acknowledgements 5
Historical Context 7
Federal context and state history 7 Recent rate increases 8
Efforts to “stabilize” the nursing facility industry during the pandemic 8 HFS’ current reform effort 9
Findings 10
Medicaid’s nursing facility rate structure and the recommended shift to PDPM 11 Nurse staffing in Illinois nursing facilities 18 Illinois’ nursing facility market 29 Illinois’ nursing facility infrastructure 37 The unequal distribution of residents across Illinois nursing facilities 45 COVID-19’s impact in Illinois nursing facilities 50 The quality of nursing home care in Illinois 55
Recommendations 60
Summary and Fiscal Impact 61 I. Adopt PDPM 67
II. Increase and Streamline the Assessment on Nursing Facilities 68
III. Introduce Nurse Staffing Incentive Payments 70
IV. Transform the CNA Payscale and Fully Fund Training Subsidies 72
V. Quality Improvement Incentive Payments 76
Attachments
1 – Original Objectives and Principles for HFS’ Current Reform Effort 79 2 – Legal Authority for this Report 80 3 – Policy Position Grid for Reform Efforts 81 4 – HFS’ Rate Reform and Assessment Model Data Sources 82

7 | P a g e
Historical Context HFS’ position is that the rate mechanism, quality metrics, and staffing requirements can and should be
updated in conjunction with any new or additional appropriated funding, and federal funding should be
captured to improve these areas through an increase in the current nursing home bed tax. History has
shown us that until we attach funding to desired results, we will not see shifts by some to the desired
results.
Federal context and state history Almost all nursing homes in Illinois are dually certified to provide both Medicare and Medicaid services. In July 2018, Medicare finalized the Patient Driven Payment Model (PDPM), a new case-mix classification model to replace the former Resource Utilization Grouper (RUGS) in the Medicare payment model, effective October 1, 2019. There is a federal Centers for Medicare and Medicaid Services (CMS) website dedicated to rules, regulations, and FAQs around the PDPM. It can be found at: https://www.cms.gov/Medicare/Medicare-Fee-for-Service-Payment/SNFPPS/PDPM#fact Originally, CMS was going to stop supporting the RUGS case-mix classification system in 2019 and HFS had begun to discuss the switch with the industry in early 2019. Since most nursing homes have both books of business, this switch of “groupers” should have caused little consternation and would actually be expected for both payors to use the same grouper. This debate had also begun in the State Capitol and at least one association, Health Care Council of Illinois (HCCI), began the Spring legislative session asking for $500 million to go into payment rates. The Department expressed desire to have more accountability on staffing and quality and made extremely clear that they did not believe any additional GRF (general funds) should go to nursing homes until these issues were addressed (PDPM and quality / staffing). Then in May 2019, HFS became aware, in the waning days of the Spring session, that the industry was asking for significant portions of the new MCO tax revenues to be used to enhance rates. Of the $250 million that was eventually appropriated for the support component of the rate, only $70 million was allocated to staffing and it was in a manner that did not require action prior to payment. The Illinois General Assembly also passed SB 1696 (PA 101-0348), which became effective August 8, 2019. The Act states: “During the first quarter of State Fiscal Year 2020, the Department of Healthcare and Family Services must convene a technical advisory group consisting of members of all trade associations representing Illinois skilled nursing providers to discuss changes necessary with Medicare’s Patient Driven Payment Model” (PDPM). The advisory group was to “consider a revised reimbursement methodology that would take into account transparency, accountability, actual staffing as reported by the federally required Payment Based Journal System, changes to the minimum wage, adequacy in coverage of the cost of care, and a quality component that rewards quality improvements”. The Medicaid Administrator met several times with industry staff to advance PDPM, staffing related methodologies and also propose an increase in the assessment tax to fund. This is not a recent or new discussion. There have been discussions about payment reform and payment for staffing and quality for decades. As far back as 2005, HFS negotiated a variation of a RUGS-based payment model with the industry and in beginning in 2013 spent hours with industry nurses and

8 | P a g e
professionals negotiating a quality program that was adopted in rule in 2015. In the end, no funding was ever allocated for the things in that rule, such as bonus payment for consistent staffing assignment. There have been attempts at legislation to account for actual staffing and wages over the years as well. For example, in 2017, former Senators Heather Steans and Dale Righter teamed with Senator Jacqueline Collins and Senator Terry Link to introduce SB1559. Then Representative, now Speaker, Chris Welch teamed with Representatives Camille Lilly, Norine Hammond and others to carry a similar bill in the House (HB3391). Neither piece of legislation was advanced but both included consideration of actual wages paid and staffing levels in Medicaid reimbursement.
Recent rate increases Nursing facility quality programs were adopted by Illinois rule in 2015, but never funded. HFS asked to
raise the nursing facility assessment in 2019 to fund an additional $240M for nursing homes. Instead,
over half of the proceeds from MCO assessment were used. All told, since 2014, the state has increased
annual reimbursement for nursing homes by $330 million, including $170 million for the support rate in
2019 and a total of $160 million for staffing. Of the $160 million dedicated to staffing, $30 million was
added in 2014, in 2019 an additional $70 million was appropriated by the General Assembly and finally
$60 million was added in 2020. Unfortunately, during this time the care of Medicaid customers has not
improved to match the additional funding provided to nursing homes for improved resident care. Illinois
consistently ranks the bottom nationwide in nursing homes staffing, including in the first quarter of
2021 when HFS first proposed a comprehensive package of reforms to the legislature.
At the same time, nursing facilities were receiving significant rate increases for staffing, HFS supported,
and the General Assembly (Public Act 101-348) required, HFS to convene an advisory group to discuss
changes necessary with Medicare’s (PDPM). The Public Act required the advisory group to consider a
revised reimbursement methodology that would take into account transparency, accountability, actual
staffing as reported by the federally required Payment Based Journal system (PBJ), changes to the
minimum wage, adequacy in coverage of the cost of care, and a quality component that rewards quality
improvements.
Efforts to “stabilize” the nursing facility industry during the pandemic
This report and its recommendations come in the second full year of the COVID-19 pandemic, in
the midst of a shrinking labor pool of trained NF staffing, and in the wake of historic operating
subsidies provided to Illinois nursing facilities by the state and federal governments in the form
of one-time pandemic response funding. Though now increasing somewhat, occupancy fell
substantially – if unevenly across facilities -- due to the direct loss of human life associated with
the Coronavirus, reduced admissions associated with foregone inpatient procedures, and
reduced demand for nursing facility care in general. Substantial public funding has been
directed to Illinois nursing facilities to cover both lost revenue and increased pandemic-related
costs, including:

9 | P a g e
• At least $521.3 million in direct federal COVID-19 response funding was distributed to Illinois nursing homes,
o Provider Relief Fund Targeted Distributions - $265.4M o Provider Relief Fund SNF Payment allocations - $137.1M o Provider Relief Fund Quality Incentive Program - $118.8M
• Individual facilities may have received federal support through Paycheck Protection Program (PPP) funding
• HFS distributed a total of nearly $200 million in state CARES Act funding to nursing facilities through December 30, 2020.
o $61.6 million in State-directed CARES funding for NFs distributed in Fall 2020, which approximated three months (90 days) of Medicaid’s share of enhanced labor costs, or “hazard pay,” related to the pandemic. Payments were adjusted to both the level of COVID-19-related hazard (i.e., local community rates of COVID-19 infection) and to the facility’s level of staffing v. STRIVE targets
o An additional distribution of $133M for nursing facilities • ARPA funding
o $75 million appropriated by the legislature to bolster the frontline workforce in a tightening labor market
▪ In September 2021, HFS began distributing $75 million in State-directed ARPA funding for NFs to support long term care workers.
▪ This formulaic distribution provides $4.43 per estimated nurse staffing hour to Medicaid-participating nursing facilities for a three-month period.
▪ Facilities must pass at least 62.5% of this funding through to front line workers. o Significant amounts of ARPA funding remain unallocated, and HFS recommends using
any of this funding that is dedicated to nursing facilities for the urgent one-time need of protecting residents and frontline staff from the next variant or virus
▪ Reduce room crowding (3+ residents in a single room) ▪ Improve NF air quality, filtering, and replacement
HFS’ current reform effort HFS was meeting with the industry about rate reform prior to the pandemic and had begun a process in early 2020 in the hopes of getting to consensus. All participating groups at the table agreed to Objectives and Principles either actively or by silence (see p. 7 of the Oct. 1, 2020 stakeholder deck: PowerPoint Presentation (illinois.gov)) and in August 2020, HFS began regularly scheduled meetings with an advisory group as required by Public Act 101-348 (See Language in Attachment 2. This group of stakeholders (all three nursing home associations, as well as a few independent operators), department staff and staff from all four legislative caucuses have invested significant time discussing their visions for nursing home rate reform, and in some cases enhanced funding without reform.
“HFS believes the rate mechanism, funding model, assessment, quality metrics, and staffing
requirements can and should be updated in conjunction with any new or additional
appropriated funding. Further, additional federal funding should be captured to improve these
areas through an increase in the current nursing home bed tax.”
--Purpose statement presented at each advisory meeting

10 | P a g e
Throughout more than 25 meetings to date, this diverse group has met to complete a comprehensive review of case mix indices, staffing levels and payment options, physical infrastructure, the market for nursing facilities in Illinois, the quality and distributional inequity of nursing homes services and other relevant aspects of long term care policy. All participants have been encouraged to raise any suggestions, ideas, and concerns. Meeting agendas, notes, and supplemental material can be found at the HFS Nursing Home Payment Update | HFS (illinois.gov) website. In March of 2021, HFS gave a detailed proposal to the industry and began meeting with legislators on an individual basis to share the HFS vision for nursing home rate reform, and hear their concerns or ideas. All presentations from previous meetings can be found at the below link. https://www2.illinois.gov/hfs/Pages/default.aspx
Discussions and positions have been espoused and discussed for months. All stakeholders have actively
participated and at least one full model has been shared by Illinois Health Care Association (IHCA) and
Leading Age Illinois (LAI) with both the Department and the HCCI. In May 2021, it was clear that a
consensus would not be reached, but the positions of each group and HFS were recorded in a grid. In
the past month (September 2021), HFS updated a proposal to try to get closer to the positions of all
three associations in different areas. By way of example, HCCI wanted to make sure that homes that
were not at required staffing levels could still get payments to raise those levels. HFS lowered the scale
on which they would pay add-ons to the daily rate for staffing from 92% of STRIVE to 80% of STRIVE as a
result.
However, in the mid-September meeting industry positions diverged, with some movement towards the
Department’s (accommodating) recommendations and some retrenchment towards an opposing view.
The policy position grid developed with industry feedback after the last meeting is reprinted as
Attachment 3.
Findings HFS began compiling available data on nursing homes in January 2020 and initiated meetings with
legislative staff and industry stakeholders later that Spring. In the 25+ structured meetings that
followed, HFS systematically explored and reviewed a broad spectrum of policy issues and
considerations relevant to the potential reform of Illinois Medicaid’s payment for nursing facility
services. HFS developed a collaborative and transparent approach for this data-driven process,
presenting information in preliminary form, updating or correcting analysis as needed, reviewing key
results on a regular basis, and posting both initial and corrected versions online via HFS’ nursing home
reform webpage.2
In this effort, HFS has drawn on at least thirteen sources of data, nearly all of which are routinely
updated at least annually, and as often as daily.
2 https://www2.illinois.gov/hfs/nursinghomeupdate/Pages/default.aspx

11 | P a g e
Many of these sources are available to the general public and were obtained by HFS through unsecured
online downloads. Some, such as the Minimum Data Set (MDS), Medicaid Management information
System (MMIS), and individual-level IDPH COVID-19 records, contain personally identifiable and private
health information and are available only by satisfying appropriate data use requirements.
This collaborative exploration revealed what turned out to be an enormous and previously-untapped
reservoir of insight to guide HFS’ recommendations for reform. This section summarizes HFS’ findings,
most of which were first shared in the collaborative process described above. In addition, this report
fills in gaps identified in the compilation of those findings and refreshes many previously-shared findings
with more recent data.
Medicaid’s nursing facility rate structure and the recommended shift to PDPM Three components make up HFS’ Medicaid payments for nursing facility services, each expressed in a
daily rate for each Medicaid resident: direct care, support, and capital. HFS’ reforms and analysis over
the past eighteen months have focused on the direct care portion of Medicaid payments to nursing
homes. The direct care rate consists of a legislatively-set base payment that is then multiplied by both
the facility’s average level of patient need (or case mix index value) and a regional wage adjustment. To
that product a number of add-ons have been established through legislation, e.g., for staffing and for
residents with defined conditions like traumatic brain injuries (TBI), serious mental illness (SMI) or
Alzheimer’s.
Data sources used in this report (not exhaustive)
1 IDPH licensure records
2 IDPH tabulation of room-level licensed bed counts
3 IDPH mortality data (individual and facility records)
4 IDPH COVID records (individual, facility and community infections and deaths)
5 Illinois Health Facilities and Services Review Board annual LTC facility survey records
6 Quarterly nursing home assessment minimum data set (MDS)
7 HFS Cost reports
8 HFS eligibility, claims and encounters (MMIS)
9 CMS/Medicare Payroll Based Journal
10 CMS/Medicare LTC Facility Provider Information (ownership, certification, occupancy, staffing and quality)
11 CMS/Medicare LTC Facility State Averages
12 CMS/Medicare LTC Facility COVID Information (infections, deaths, vaccination)
13 US Bureau of Labor Statistics (employment and wages; prices)

12 | P a g e
HFS does not propose changes to the support and capital components of the rate at this time and
instead proposes to leave some room below the federal limit for health care provider taxation as an un-
tapped reserve to address those components.
Historic growth in HFS’ payment rates for skilled nursing facilities. HFS’ base rate of $85.25 hasn’t
changed since implementation of the RUGs acuity-based payment in January 2014. Adoption of acuity-
based payment was a milestone for Illinois Medicaid, allowing funding to be directed towards facilities in
proportion to the level of care needed by the Medicaid residents they served. Nevertheless, acuity-
based payments like RUGs are dependent on levels of need reported by facilities themselves, and thus
potentially subject to upcoding, i.e., the maximal (or even excessive) classification of residents’ care
needs in order to maximize acuity-based payment. Facilities report residents’ care needs in the
Minimum Data Set (MDS), which is based primarily on a comprehensive survey regularly administered to
all nursing home residents by facility staff.

13 | P a g e
Following the introduction of RUGs in January 2014, subsequent direct care rate add-ons and a ~35%
increase in facility-reported ‘case mix,’ or resident care need, have resulted in a 4.4% compound annual
growth rate (CAGR) in Medicaid’s direct care rate through July 20213. Most of that increase in payment
rates is due to increases in facility-reported levels of resident care needs in the MDS, which HFS uses to
classify patients under Illinois’ RUGs-based case mix index (CMI). More than one-quarter (about $450M)
of Medicaid’s $1.75B annual direct care payments to nursing homes are the result of increases in facility-
reported resident care needs in the seven years since the current rate methodology was first
implemented in 2014. But increases in reported resident care needs, and the resulting increase in
facilities’ CMI, began even before implementation.
CMI inflation under Illinois’ RUGs-based payment system began with an essentially overnight increase of
nearly 10% (from .91 to 1.00) that coincided with the payment system’s implementation. Though
Medicaid’s new methodology was modeled as budget-neutral, the rate model used in its adoption was
based on facility reports of patient need during the 1st quarter of 2013. Those facility-reported levels of
resident care need rose as soon as the new rate methodology was adopted, and prior to actual
implementation (see the transition from red v. green dots in the chart above). The very first rates paid
under the new RUGs methodology in January 2014 were based on nursing facility coding of resident care
needs during the 3rd quarter of 2013, and in that quarter nursing facilities reported a level of need 9.4%
higher than the levels used in the adoption of the methodology just a few months earlier. Since then
facility reports of resident care need have risen steadily, accumulating to another 24% rise in the
statewide CMI. All-told, Illinois Medicaid’s average CMI has risen 4% annually (CAGR) since it’s initial
(and budget neutral) level in mid-2013, explaining 90% of the 4.4% average annual increase in rates. At
3 Long-run growth varies with selection of timeframes (starting and ending years). For comparison, annual growth over the last 20 years, beginning in 2001, results in a slightly higher 4.5% CAGR.

14 | P a g e
current levels of Medicaid occupancy, a 4% increase in the direct care CMI represents additional state
and federal Medicaid costs of about $67M per year.
Potential sources of rate inflation. Some of this increase in Illinois’ CMI could be due to the ongoing shift
toward community-based care for those who meet the criteria for institutional care: Illinois Medicaid
has seen consistent improvement in the share of long term care spending attributable to non-
institutional care – a shift commonly referred to as rebalancing. It is likely that rebalancing has diverted
some percentage of lower-needs individuals to non-institutional care, leaving a somewhat higher-needs
population in nursing facilities that should receive more hours of nursing care per day and thus a higher
Medicaid payment. That would certainly be consistent with HFS’ policy objective. However, the limited
nature of data collected from LTC recipients served in the community prevents direct comparison with
NF residents, undermining any estimate of the effects of rebalancing on Illinois Medicaid’s nursing home
resident CMI over time.
Medicare designed PDPM to overcome the RUGs system’s vulnerability to over-
coding due -- in particular -- to facilities’ over-provision of rehabilitative therapy
services
While rebalancing may have led to genuine increases in the average level of resident care need in Illinois
nursing homes, analyses above nevertheless suggests Illinois’ CMI is over-stated and HFS’ current
payment methodology is vulnerable to continued facility-driven inflation. The federal government noted
nationwide over-coding of Medicaid (and Medicare) nursing home resident care need as a principle
motive behind its development of the Patient Driven Payment Model (PDPM), which it implemented in
October 2019. Two passages from the final rule implementing PDPM are representative4:
“…we believe that the primary reason that Medicaid programs may adopt PDPM is due to its
focus on patient characteristics and goals, rather than on service utilization. Given the
improvements in Medicare payment that this transition represents, we would expect a similar
improvement in Medicaid payments in states that make this transition.” P. 39187
“We stated in the proposed rule (83 FR 21035) that while it might be possible to attribute the increasing share of residents in the Ultra-High therapy category to increasing acuity within the SNF population, we believe the increase in “thresholding” (that is, of providing just enough therapy for residents to surpass the relevant therapy thresholds) is a strong indication of service provision predicated on financial considerations rather than resident need” p. 39184
Medicare’s switch to PDPM was intended to offset the RUGs system’s vulnerability to over-coding due --
in particular -- to facilities’ over-provision of rehabilitative therapy services. Why would facilities have a
financial incentive to over-provide rehab services? The RUGs-based payment system is akin to a fee-for-
service volume-driven payment in that a facility’s provision of rehabilitation services results in a
subsequent rise in the facility’s CMI, with a direct multiplicative effect on Medicaid’s daily payment rate.
4 Federal Register Vol. 83, No. 153, Wednesday August 8, 2018.

15 | P a g e
Consider the following chart introduced in HFS’ October 15, 2020 nursing facility payment reform
stakeholder meeting to compare the nursing components of RUGs and PDPM.
In data presented below HFS finds evidence of rehab’s outsized role in current payments to Illinois
nursing facilities, and this helps motivate HFS’ proposal to adopt the PDPM methodology for nursing
services and to push reimbursement for rehabilitative services back onto the Medicare program, which
now relies on a separate and more sophisticated PDPM add-on payment for rehab (in addition to
ongoing non-PDPM reimbursements through Medicare Part B).
Rehab’s outsized role in Medicaid payment. HFS’ recommendation to switch Illinois Medicaid’s basis for
NF payment to Medicare’s PDPM nursing CMI would reduce the number of resident care need
classifications (or “groups”) from 48 to 25, including elimination of RUGs’ 5 rehab payment groups.

16 | P a g e
Medicaid residents that would have been classified in one of the 5 rehab payment groups under RUGs
would instead be reclassified into one of the available 23 PDPM groups. The table below describes how
Medicaid residents would be reclassified in the shift from RUGs to PDPM.
Based on facilities’ determinations of resident care needs, a full 30% of Illinois
Medicaid-funded residents qualify their facilities for a higher “rehabilitation”
payment level under the RUGs system

17 | P a g e
It turns out that nearly one-third (30%) of Medicaid residents would need to be reclassified due solely to
the absence of rehab groups under PDPM, a strong indication of the over-use of rehab in Medicaid
billing since:
• there are few truly rehabilitative services that Medicare does not pay for;
• nearly all Medicaid nursing home residents are also eligible for Medicare; and
• neither in the current HFS payment methodology (RUGS) nor through the nursing component of
PDPM that HFS recommends are therapy services themselves meant to be reimbursed. Therapy
is to be reimbursed separately under Medicare Part B. Only RN, LPN and CNA time associated
with residents who also receive therapy services are to be reimbursed through the nursing
component of the Medicaid NF rate.
HFS proposes to adopt the PDPM nursing component as the basis for its direct care rate, in part, to shift
unnecessary Medicaid payment for rehabilitation towards residents with genuinely higher levels of
Medicaid-financed needs. The result would be payments that are better targeted to patient needs not
already reimbursed by Medicare.
PDPM would reduce variation in payments across facilities. By addressing the distortionary rate inflation
in the Medicaid’s current RUGs-based system, PDPM would reduce overall variation in payment rates
across facilities.
In particular, adopting PDPM would
• reduce rates for facilities coding high percentages of Medicaid residents into rehab groups when
those residents would otherwise be coded at a lower level of acuity (a lesser CMI)
• raise rates for facilities that code a lower percentage of Medicaid residents into rehab groups
and that have Medicaid resident populations with legitimately higher residual (non-rehab) levels
of need for Medicaid-financed care.

18 | P a g e
Nurse staffing in Illinois nursing facilities In the mid-2000s Medicare undertook an effort to recalibrate its payment to nursing facilities based on
staffing levels actually provided to residents with different levels of need. A nationwide observational
staffing survey called “STRIVE” was conducted and an analysis commissioned so that the intensity of
resident care needs could be based on hours of nurse staffing provided. That study, last updated in
2007, still underpins federal SNF payments as now reflected in the calibration of the PDPM case mix
index. STRIVE performance targets represent national averages at the time of the study for each type of
patient (RUGs group) which are interpreted as the expected number of staffing hours per resident day
for each. A facility’s performance against these STRIVE targets represents its actual level of staffing
hours per resident day compared to the expected level of staffing it would have if hours equaled the
STRIVE performance target. Calculating this ratio, or percentage, entails the application of a facility’s
mixture of residents as classified by their RUGs classification to the STRIVE hours targets for each RUGs
group. The resulting number of expected hours per resident day for that facility is the divisor in the
STRIVE performance ratio while the numerator is the actual hours of staffing provided.
Since the STRIVE study was conducted the national average number of hours of nurse staffing per
resident day has risen about 27%, so the National STRIVE ratio for the first three months of 2021 was
1.27. Illinois’ STRIVE ratio was 1.07 for that quarter, which means Illinois nursing facilities – on average
– provided only about 85% of the staffing provided by the typical nursing home nationally.
Under-staffing in Illinois v. other states. Illinois consistently ranks last among states in staffing as
measured using the STRIVE targets, including the most recent data from 1Q 2021.

19 | P a g e
Illinois shortfall v. other states appears to be driven by non-RN staffing since the state ranks above the
national average for RN staffing (195% v. 187% of the 2007 STRIVE target). As a result, HFS’ policy
initiatives focus on boosting employment of certified nursing assistants (CNAs), which both comprise a
majority of nurse staffing hours in Illinois SNFs and – given Illinois’ above-average RN staffing rank –
must explain the clear majority (if not totality) of Illinois’ nurse staffing deficit.
Illinois doesn’t just come in last in nurse staffing levels, it dominates the list of states
with the lowest-performing nursing homes.
Even more striking, Illinois accounts for 47 of the bottom 100 facilities in the country as measured by the
STRIVE target.

20 | P a g e
Variation in staffing levels in high- v. low-Medicaid facilities. How do staffing levels relate to the level of
Medicaid utilization in a nursing facility? There is a strong relationship. Low-staffed, low-Medicaid
homes are uncommon (see front left portion of chart below), but high-Medicaid, low-staffed homes are
very common. Indeed, the higher the level of Medicaid utilization in a facility, the greater the likelihood
that the facility is staffed below 92% of STRIVE, where 92% is HFS’ approximation of the level
corresponding to Illinois’ minimum staffing requirement.
In the chart above, focus on each color-coded group of homes representing different levels of Medicaid
utilization (i.e., all the dark blue bars, all the orange bars, etc.) and note how the distribution of homes
within each color shifts to the left (i.e., facilities with lower levels of staffing) for colors that are further
to the rear (i.e., for facilities with increasing levels of Medicaid utilization). In this chart facilities are
21 | P a g e
concentrated on and, to a lesser extent, above “the diagonal” that runs from the back-left to front-right,
indicating a strong and negative relationship between staffing and Medicaid utilization.
Medicaid residents are concentrated in under-staffed homes
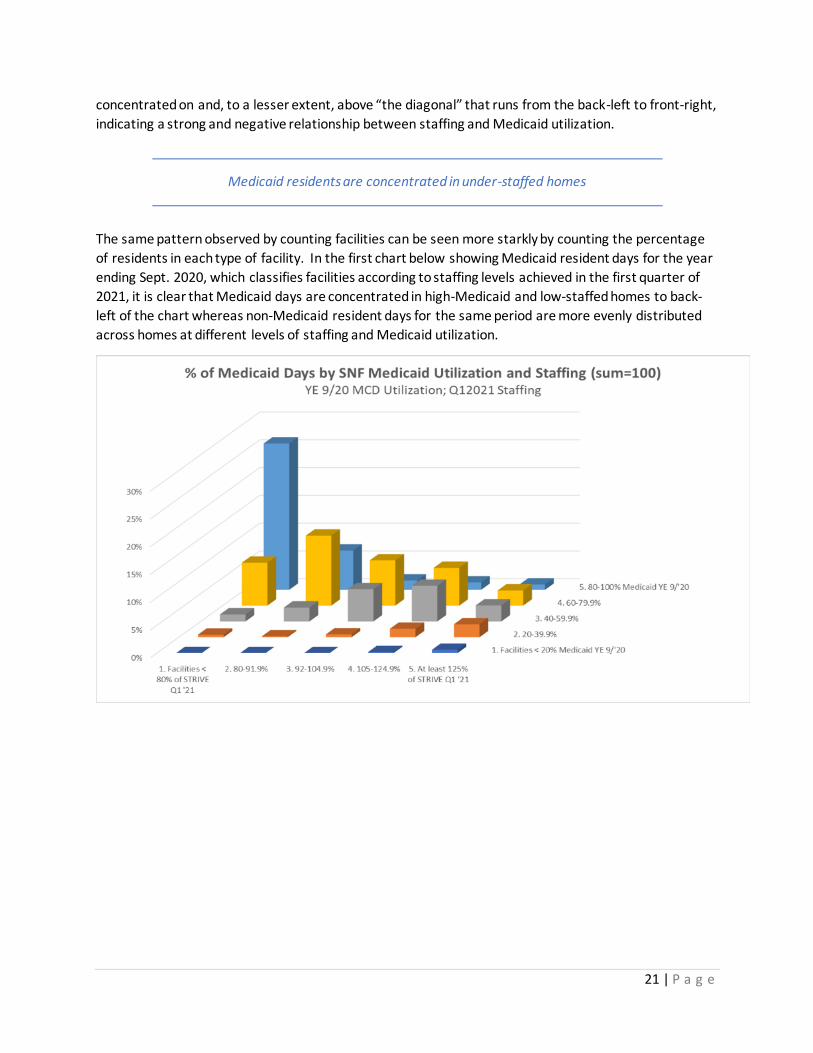
The same pattern observed by counting facilities can be seen more starkly by counting the percentage
of residents in each type of facility. In the first chart below showing Medicaid resident days for the year
ending Sept. 2020, which classifies facilities according to staffing levels achieved in the first quarter of
2021, it is clear that Medicaid days are concentrated in high-Medicaid and low-staffed homes to back-
left of the chart whereas non-Medicaid resident days for the same period are more evenly distributed
across homes at different levels of staffing and Medicaid utilization.
22 | P a g e
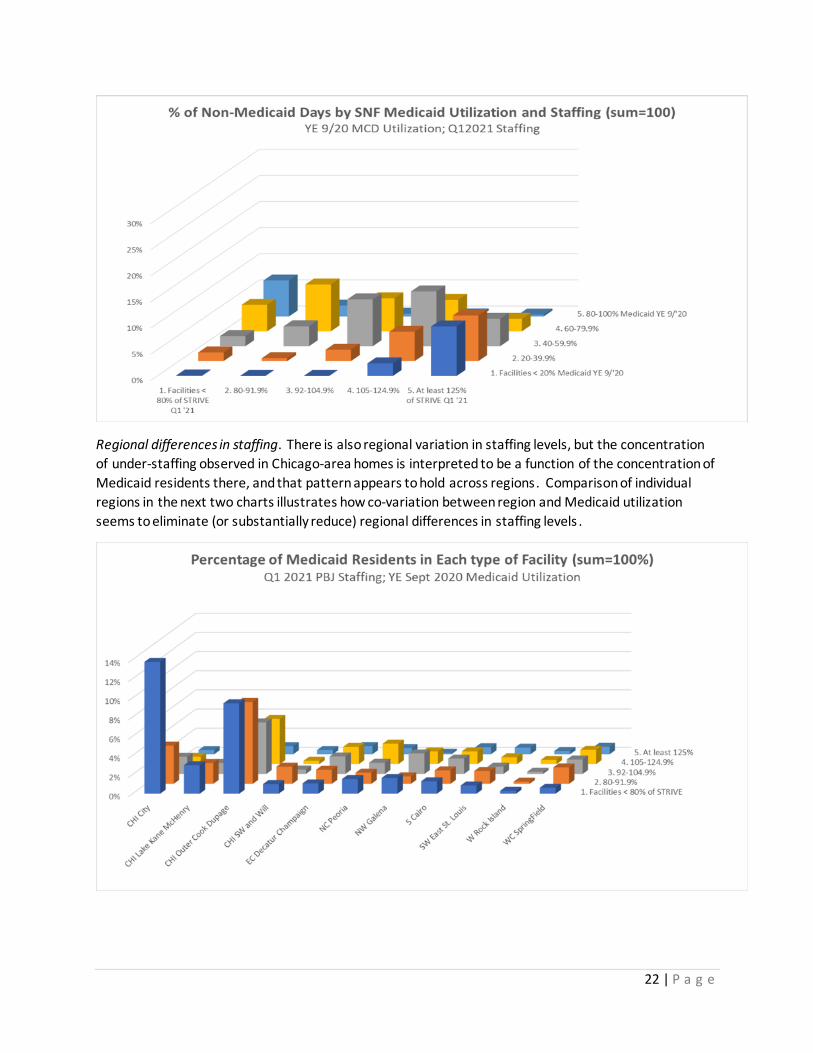
Regional differences in staffing. There is also regional variation in staffing levels, but the concentration
of under-staffing observed in Chicago-area homes is interpreted to be a function of the concentration of
Medicaid residents there, and that pattern appears to hold across regions. Comparison of individual
regions in the next two charts illustrates how co-variation between region and Medicaid utilization
seems to eliminate (or substantially reduce) regional differences in staffing levels .

23 | P a g e
In the first chart showing the distribution of Medicaid residents both geographically and across facilities
at different levels of staffing, the concentration is centered to the front (low-staffed homes) and to the
left (Chicago regions). In the second chart Non-Medicaid residents are found to be more evenly
distributed across regions (left to right) and more concentrated in higher-staffed homes (towards the
back). Put simply, Medicaid utilization appears to explain notable differences in staffing across regions.
Changes in staffing over time. Changes in staffing after full implementation of reimbursement increases
adopted by the 2019 legislature illustrate HFS’ concern with continued investment in funding intended
for but not tied directly to staffing levels. Following a $300 million increase in rates fully implemented
by the 3rd quarter of 2019, STRIVE staffing percentages rose inconsistently and quite modestly.

24 | P a g e
However, this latest increase in the Medicaid payment rate only just preceded the COVID-19 pandemic
that posed an immediate threat to the health, safety, and continued employment of nursing home staff.
The scale of the pandemic and its very focused impact on nursing facility residents and staff could easily
overwhelm a $300 million funding increase for staffing, an in any event clouds interpretation of the rate
increase’s impact.
Since the increase, staffing has increased 2.2% v. the STRIVE target for all nursing hours, although that
modest increase was not felt by all residents. For the highest-Medicaid homes, which account for 40%
of Medicaid resident days, staffing was flat from 3Q2019 through 1Q2021. A deeper dive into staffing
changes over the last year and a half suggests that homes with the lowest staffing levels in 2019
experienced the largest increase in staffing performance (i.e., the left-most bars in each category of
Medicaid utilization), but again this trend was weakest in the highest-Medicaid homes.
At best, then, nursing homes with the largest Medicaid footprint did no better than tread water in
staffing following the rate increase, and following the onset of the pandemic have consistently reported
great difficulty in recruiting and retaining staff. HFS’ proposal below is intended to both motivate and
financially underwrite substantial increases in staffing among Illinois’ lowest-staffed homes, and to scale
such support to the level of Medicaid utilization through the daily rate, thereby concentrating aid to
higher-Medicaid homes.
HFS’ proposals are intended to motivate and underwrite substantial increases in
staffing, and to concentrate such assistance in higher-Medicaid facilities
Variation and growth in wages. Nursing wages have grown in Illinois over the last 7 years, as measured
using US Bureau of Labor Statistics surveys across all employment settings (see chart below).
Percentage increases over that period range from 1.6% annually for RNs to about 3% for CNAs and LPNs.

25 | P a g e
CNAs made up a significant majority (59%) of nursing facility nurse staffing in Illinois in 2020 and account
for the bulk of the state’s understaffing (see above). The chart below shows meaningful variation in CNA
wages across regions for cost report year 2020 (blue bars; left axis). Nursing facilities report significant
wage pressure for CNAs, in particular, following the onset of the COVID-19 pandemic and data shown
below affirms that increase. Focusing on the 78% of SNFs submitting cost reports with a December 31st
year-end in order to capture the maximum number of months that followed COVID-19’s arrival in early
2020, we find significant increases in CNA wages (orange line; right axis) representing an average hourly
wage increase of $1.77 (for Dec. 31 FYE). Statewide for all submitted 2020 cost reports, that increase
might represent a total increase in wages for the 2020 CNA workforce of $75 million or more (applying
the Dec. 31 FYE trend to all SNFs submitting cost reports).
Federal and state wage data indicate both that increases were modest but steady for the state’s nurses
in the years leading up to the pandemic, but that COVID-19’s onset brought about rapid and meaningful
increases.

26 | P a g e
The relationship between low staffing and rehab coding. The previous section described the outsized
influence that rehab coding has on Medicaid payments and that the case mix index (CMI) for homes
reporting higher proportions of rehabilitation services is higher. This has implications for the
measurement of staffing performance because the same CMI is also used to determine the expected
level of staffing in the calculation of a nursing facility’s STRIVE staffing performance level. When
facilities report providing higher levels of rehab services to their residents—as facilities with higher
proportions of Medicaid residents tend to do -- the CMI goes up and, along with it, the expected number
of nurse staffing hours. We next explore the relationship between facility coding for rehab, STRIVE
staffing levels, and Medicaid utilization and find that staffing levels vary with a facility’s propensity to
code rehab:
Facilities coding more of their residents into a rehab CMI group are more likely to be under-staffed.
Among facilities where at least 60% of Medicaid residents are coded into a rehab group, 60% of all
residents are in under-staffed facilities (less than 92% of the STRIVE target number of hours per resident
day). In facilities with less than 20% rehab-coded Medicaid residents, only a third of residents are in
under-staffed facilities.

27 | P a g e
If rehab coding goes up with Medicaid utilization and staffing falls with Medicaid utilization we might
expect rehab coding and staffing to move in opposite directions (and they do), but what is the
relationship between these three key characteristics: Medicaid utilization, rehab coding AND staffing?
The chart below illustrates that within each band of Medicaid utilization (each multi-colored group of
bars), rehab coding falls as staffing rises (bars are shorter as you read from left to right), and this
relationship is strongest at the highest level of Medicaid utilization (80% and above).
Conversely, regional variation in rehab coding is inconsistent. The next chart shows that of the two
characteristics – Medicaid utilization and geographic region—Medicaid utilization levels are consistently
related to higher levels of rehab coding but geographic region is not.

28 | P a g e
Taken together, these findings imply a very tight relationship between Medicaid utilization, rehab
coding, and staffing levels. Facilities’ financial incentive to over-provide rehab services to Medicaid
residents is one logical explanation, but if those rehab (therapy) services also imply additional nurse
staffing time – the reason for RUGs high CMI value for rehab categories -- we wouldn’t necessarily
expect the very strong inverse (or negative) correlation we observe between rehab coding and coding-
adjusted staffing levels (i.e., STRIVE percentages). The tight and inverse relationship between rehab
coding on the one hand and both Medicaid utilization and STRIVE staffing on the other could be
explained by some combination of the following:
• Over-coding by facilities who report more rehab therapy services for Medicaid residents than are actually necessary, which generates higher Medicaid payment but simultaneously raises the
expected number of nurse staffing hours used in the calculation of STRIVE performance levels.
• Under-staffing v. observed resident care needs, independent of over-coding for rehab services.
Low nurse staffing performance could reflect genuinely low levels of staff in relationship to the
legitimate needs of residents, including both those residents coded rehab and those residents
NOT coded rehab.
• Both. Over-coding and true under-staffing are not necessarily mutually exclusive within SNFs.
HFS’ findings imply a close relationship between high Medicaid utilization, coding of residents for rehabilitation services, and low staffing levels.
How HFS’ proposes to address the staffing-rehab-coding nexus. Against the backdrop of anecdotal
eyewitness reports of under-staffing in Illinois homes, now reinforced with the exhaustive

29 | P a g e
documentation of under-staffing developed over the last year and a half and summarized above, HFS’
rate reform proposal attacks Illinois’ last-in-the-nation status with a three-pronged approach designed
to sustainably increase nurse staffing levels for Medicaid residents:
• adopt the PDPM case mix index, severing the tie between rehab coding and Medicaid payment
• introduce significant nurse staffing payments tied directly to a facility’s needs-adjusted staffing
level (i.e., STRIVE)
• pay Medicaid’s share of substantial wage increases for CNAs (see tenure and promotion pay-
scale initiative below)
Illinois’ nursing facility market HFS’ intensive study of SNFs over the past year and a half has focused on services for Medicaid residents. In the description of Illinois SNFs below we generally classify SNFs according to whether they are above or below 50% Medicaid utilization and, given the tight relationship between Medicaid utilization and staffing levels (and billing patterns) documented above, HFS also classifies the Illinois SNF market according to whether staffing is above or below 92% of the STRIVE target.
There are approximately 700 SNFs in Illinois, i.e., nursing facilities with beds licensed by IDPH for skilled care – what we are generally referring to as “skilled nursing facilities” or “SNFs .” As noted above, the Illinois SNF market is concentrated on or, in this two-by-two chart, below the ‘diagonal’ linking high Medicaid utilization and low staffing; there are only 13 under-staffed facilities in the state with low Medicaid utilization. Tax status of Illinois SNFs. Among the 689 facilities for which we have staffing and utilization data, nearly all (96%) SNFs are privately-owned and 79% are operated for profit.

30 | P a g e
For-profit and non-profit facilities differ substantially in their service of Medicaid residents. Among not-for-profit facilities in Illinois:
• Only 23 non-profit facilities (19% of non-profits) have at least 50% Medicaid utilization, and non-profits as a whole account for just 7% of Medicaid resident days for the year ending September 30, 2021.
• Non-profits make up about half (47%) of the SNFs with under 50% Medicaid utilization and 5% of SNFs with at least 50% Medicaid utilization.
31 | P a g e
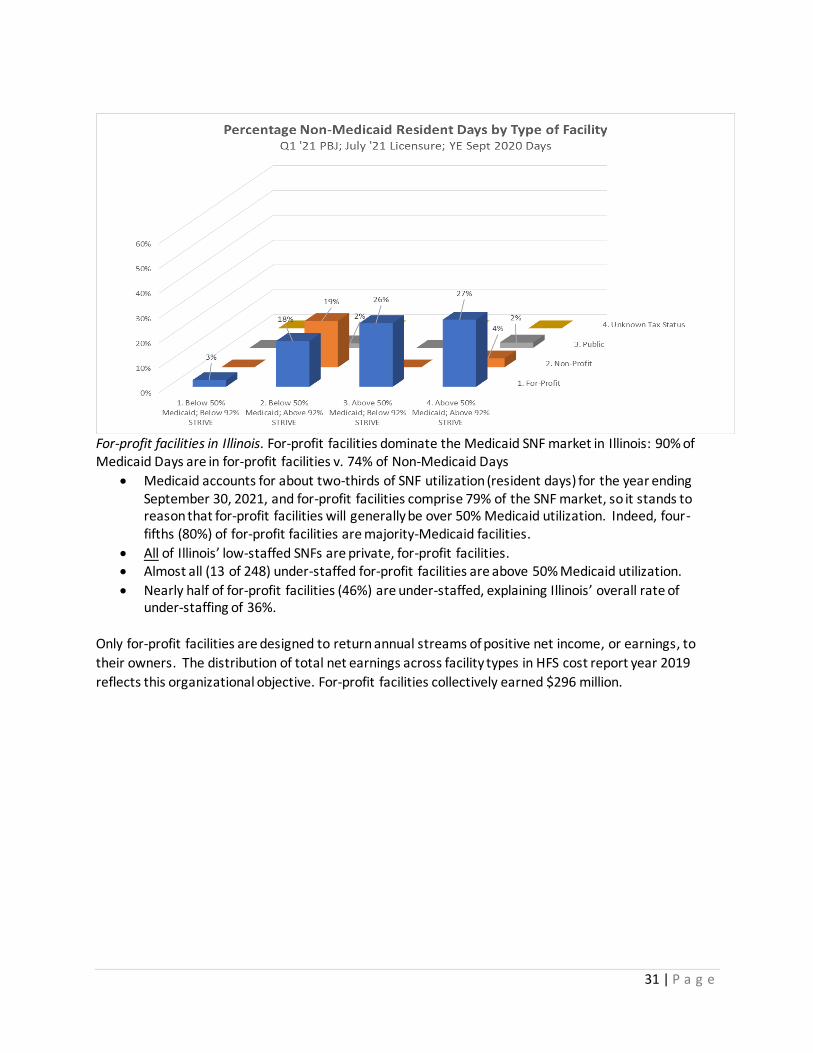
For-profit facilities in Illinois. For-profit facilities dominate the Medicaid SNF market in Illinois: 90% of Medicaid Days are in for-profit facilities v. 74% of Non-Medicaid Days
• Medicaid accounts for about two-thirds of SNF utilization (resident days) for the year ending September 30, 2021, and for-profit facilities comprise 79% of the SNF market, so it stands to reason that for-profit facilities will generally be over 50% Medicaid utilization. Indeed, four-fifths (80%) of for-profit facilities are majority-Medicaid facilities.
• All of Illinois’ low-staffed SNFs are private, for-profit facilities. • Almost all (13 of 248) under-staffed for-profit facilities are above 50% Medicaid utilization.
• Nearly half of for-profit facilities (46%) are under-staffed, explaining Illinois’ overall rate of under-staffing of 36%.
Only for-profit facilities are designed to return annual streams of positive net income, or earnings, to
their owners. The distribution of total net earnings across facility types in HFS cost report year 2019
reflects this organizational objective. For-profit facilities collectively earned $296 million.

32 | P a g e
SNFs currently classified as high-Medicaid and under-staffed accounted for $164M of net income in HFS
cost report year 2019 (see bottom left cell in table above). This subset of for-profit facilities represents
36% of all for-profit homes and 57% of all 2019 for-profit earnings.
Conversely, low-Medicaid SNFs comprise just 9% of total for-profit earnings in 2019, mostly from better
staffed homes, even though low-Medicaid SNFs account for 32% of all for-profit homes.
In plain language, high-Medicaid under-staffed homes drive earnings among Illinois SNFs. We explore
these earnings a bit more in the presentation of before-and-after analysis of HFS rate reform proposals
in the Recommendations section below.
Higher levels of Medicaid utilization and lower levels of staffing drive earnings among
Illinois’ nursing facilities
Total Net Income in For-Profit SNFs in HFS Cost Report Year 2019
n=542
Below 92% of
STRIVE target
1Q 2021
Above 92% of
STRIVE target
1Q 2021
Below 50% Medicaid utilization
YE 9.30.2021 4,476,946$ 22,483,331$
Above 50% Medicaid utilization
YE 9.30.2021 163,904,309$ 105,326,393$

33 | P a g e
Data on SNF ownership in Illinois. Given the prominence of private for-profit ownership in the Illinois
SNF market, and among facilities serving Medicaid-funded residents, it is important also to understand
the nature of private ownership. Are SNFs mainly operated by long-term owner-operators or is SNF
ownership characterized by passive short-term investors? Are SNFs owned by large corporations or
jointly-managed by large management companies with deep expertise? The extent to which HFS can
address these questions is limited by the nature and completeness of information reported by owners to
both the state and federal government. Multiple, overlapping ownership and joint management
through administrative companies is difficult to characterize with data currently available to HFS and
this is due to both inconsistent and incomplete reporting. Nevertheless, this report explores the
duration and multiplicity of ownership using available data from the federal Centers for Medicare and
Medicaid Services (CMS), HFS cost reports, and Illinois Department of Public Health licensure records.
For example, just 81% (n=538) of the privately-owned facilities for which we also have Medicaid
utilization and STRIVE staffing performance data also reported at least 50% of the ownership shares in
their facilities in CMS COMPARE ownership records published in July 2021. Only ownership shares of 5%
or more must be reported, so it is unclear whether the missing ownership information is attributable to
very small (likely passive) investors or are simply un-reported.
How many owners do SNFs have? For-profit facilities average 4.4 (reported) owners each, compared to
an average of 2.3 owners for non-profit facilities. Only about 14% of the 525 for-profit facilities in this
analysis – which excludes facilities reporting less than 50% of total ownership -- have just a single owner
listed in Medicare’s ownership records, and only about one-third (36%) list only one or two owners.
Two-thirds of these for-profit SNFs have at least 3 owners, and one-third have at least 5 owners. For-
profit SNFs in Illinois are dominated by multiple-owner facilities, and it is worth noting that these figures
may not include some ownership stakes of less than 5% since reporting of stakes that small is voluntary.
The simplest way to describe ownership of the typical for-profit SNF – economically and empirically – is
as an investment, and the number of investors in each home suggests many are passive investors, not
owner-operators.

34 | P a g e
How long do SNF owners remain invested? The duration of ownership may impart a number of
important characteristics of the Illinois SNF market, including the potential level of owner expertise as
well as long-term owner attachment to the facility and the industry. Illinois’ for-profit SNFs are
characterized by frequent turnover in ownership.
For-profit SNFs included in this analysis of Medicare COMPARE ownership records indicate an average
ownership duration (weighted by percentage of ownership) of 8.9 years v. 16.4 years for non-profit
facilities. Average ownership durations range from just 5 years for the small group of for-profit facilities
operating below 92% of STRIVE and below 50% Medicaid utilization to 11.8 years for low-Medicaid
better-staffed facilities. The typical investor in a high-Medicaid facility has been invested less than 9
years. This also means that the typical owner must have invested in a high-Medicaid facility in calendar
year 2013, the year Medicaid adopted its current RUGs payment methodology.
The number of owners of the typical for-profit nursing facility and the short duration
of many ownership interests conveys a pattern of passive financial investment
How long do leading owners remain licensed? Turnover among privately-owned facilities can also be
assessed by looking at licensure records, which HFS has obtained and paired with HFS cost-report data
since at least 1995. These include name changes, changes in “related parties,” facility replacements,
and changes in controlling (i.e., licensed) ownership. Focusing only on changes in ownership, the chart
below identifies – by looking further back in time as the data points extent from left to right– the
cumulative percentage of currently active privately-owned SNFs that have experienced a licensure
ownership change on or after the years listed. Highlighted is fiscal year 2014, which began just after
Medicaid adopted its RUGs payment system. Between one-third and one-half (40%) of under-staffed
high-Medicaid SNFs, all of which are for-profit, have a new licensed owner since the beginning of state

35 | P a g e
fiscal year 2014. Better staffed facilities (orange and green dots) experience licensee turnover less
frequently.
The costs of owning and operating a SNF. The table below compares several available price
indices to Illinois Medicaid’s payment history over the last 16 years. Since 2005, consumer
price inflation has averaged 1.7%, medical price inflation has averaged 3.1%, and producer
prices have grown 2.7% annually. A more targeted cost-of-production index for the nursing
home industry – costs of employment as measured by total compensation– grew at a rate of
2.3%. By comparison, HFS’ Medicaid payment rate for SNFs has grown at an annual rate of 4%
and over the last 16 years, and total growth in Medicaid rates exceeded total growth in
employment costs by 42 percentage points. Indeed, HFS’ Medicaid rate increases exceed even
medical price inflation by a cumulative 20+ percentage points since 2005 (86% v. 64%).

36 | P a g e
Nevertheless, operating costs are not the only consideration in NF reimbursement. The full
economic cost of owning an NF would also include the opportunity cost of devoting capital to
an NF v. moving it to another investment. For example, if a NF is located on land that is
increasing in value at an unusually fast rate, the opportunity cost of keeping that investment
might grow faster than the operating costs shown above. If so, the owner might be incented to
sell or repurpose the nursing home and its underlying property for an alternative use.
The table above includes two indices of commercial retail prices. Over the last 16 years those
two national indices appear to have grown a bit faster than the other cost indices shown in the
same table, but both real estate indices remain below the 4% annual increase in HFS’ Medicaid
NF rates, and each represents only the capital component of a nursing home’s costs. As their
name indicates, skilled nursing facilities as an industry are, like other industries, dominated by
labor and other operating costs. Cost reports submitted to HFS for 2019 indicate that
ownership (inclusive of capital) comprised about 11% of total annual costs, varying by region of
the state from 8% in Rock Island to 14% in the Chicago Area. This regional variation illustrates
the possibility that some areas may have experienced higher levels of growth in commercial
real estate prices over the last 16 years. Regardless, HFS is unaware of unusual rates of re-
purposing or closure of SNF facilities due to the rapidly increasing financial return on alternative
uses of the land. Moreover, net incomes were strong in 2019, including those SNFs located in
regions with the highest land values.
Medicaid payment levels and rates of growth over the last 16 years appear to have
exceeded growth in facilities’ costs and enabled significant profits (through 2019)
Costs of Operation and Ownership v. HFS Medicaid Rates for SNFs
Increases over the last 16 years
Producer prices for
nursing care
facilities (US) for
Aug 2005-Aug
20212
Employment cost
index for NFs (US;
total compensation)
2Q 2005 - 2Q 20213
Green Street
Commercial
Property Price
Index® (US) Aug
2005-Aug 20214
St. Louis Federal
Reserve
Commercial Real
Estate Index (US)
4Q 2004-4Q20205
CPI-U MCPI-U PPI-NFs ECI-NFs CPPI CPPI
Total 16 year increase 31% 64% 52% 44% 83% 56% 86%
Annual rate (CAGR) 1.7% 3.1% 2.7% 2.3% 3.9% 3.0% 4.0%
1Source: One-Screen Data Search (bls.gov)
Series (CPI-U) CUURS23ASA0,CUUSS23ASA0
Series (MCPI-U) CUURS23ASAM,CUUSS23ASAM2Source: One-Screen Data Search (bls.gov)
Series (PPI) PCU6231--6231--3Source: One-Screen Data Search (bls.gov)
Series (ECI) CIS1016230000000I4Source: CPPI | Commercial Property Price Index | Green Street
5Source: Commercial Real Estate Prices for United States | ALFRED | St. Louis Fed (stlouisfed.org)
Series (CPPI) COMREPUSQ159N_20210503
Consumer prices for all urban consumers
in the tri-state Chicago area for Aug 2005-
Aug20211
HFS Medicaid
SNF rates
(June 2005-July
2021)
37 | P a g e
Taken as a whole, available information indicates that increases in Medicaid payments
significantly exceeded growth in the costs of owning and operating a SNF over the past 16
years, and through cost report year 2019, were sufficient to enable meaningful profit even (and
especially) among facilities with the highest rates of Medicaid utilization.
Illinois’ nursing facility infrastructure This section describes the capacity, ownership, age, and physical layout of Illinois nursing facilities.
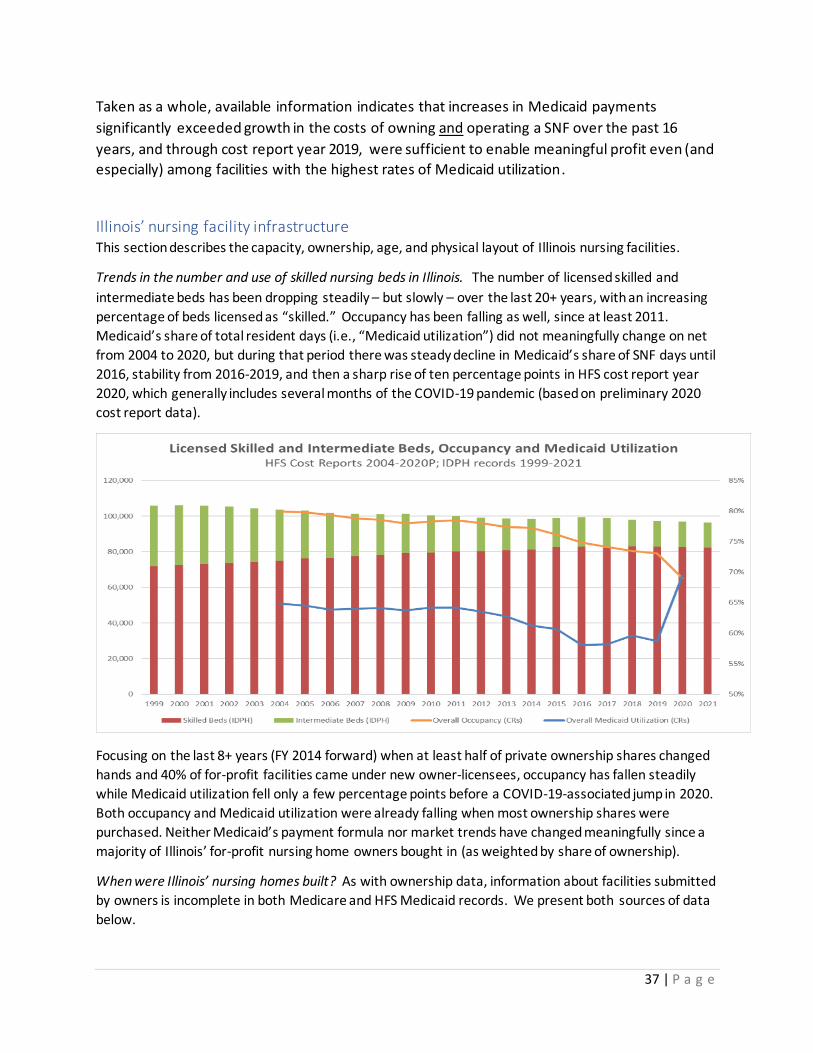
Trends in the number and use of skilled nursing beds in Illinois. The number of licensed skilled and
intermediate beds has been dropping steadily – but slowly – over the last 20+ years, with an increasing
percentage of beds licensed as “skilled.” Occupancy has been falling as well, since at least 2011.
Medicaid’s share of total resident days (i.e., “Medicaid utilization”) did not meaningfully change on net
from 2004 to 2020, but during that period there was steady decline in Medicaid’s share of SNF days until
2016, stability from 2016-2019, and then a sharp rise of ten percentage points in HFS cost report year
2020, which generally includes several months of the COVID-19 pandemic (based on preliminary 2020
cost report data).
Focusing on the last 8+ years (FY 2014 forward) when at least half of private ownership shares changed
hands and 40% of for-profit facilities came under new owner-licensees, occupancy has fallen steadily
while Medicaid utilization fell only a few percentage points before a COVID-19-associated jump in 2020.
Both occupancy and Medicaid utilization were already falling when most ownership shares were
purchased. Neither Medicaid’s payment formula nor market trends have changed meaningfully since a
majority of Illinois’ for-profit nursing home owners bought in (as weighted by share of ownership).
When were Illinois’ nursing homes built? As with ownership data, information about facilities submitted
by owners is incomplete in both Medicare and HFS Medicaid records. We present both sources of data
below.

38 | P a g e
HFS asks facilities to report the year of first construction for their facilities, but reporting rates for this
information is poor: just 481 SNFs submitted such data in 2019, the most recent completed set of HFS
cost reports. Of those 481, the majority (61%) were first constructed in the 1970s or earlier, and 87%
were first before the year 2000.
Medicare certification records are more complete, with 606 out of approximately 690 SNFs included in
this section’s analysis. They depict a more recently-certified but still aging infrastructure, with one-
quarter (25%) of SNFs certified in the 1960s or 1970s, and 80% certified by the year 2000.
The average age of Medicare certification is 28.7 years. Matching up the two data sources we find that
the average date of Medicare certification is 1980 whether or not facilities also submitted HFS Cost
Report information on the date of first construction, evidence that facilities submitting both types of

39 | P a g e
information are reasonably representative of all facilities. For facilities submitting both types of data the
chart below shows that Medicare certification dates carried in COMPARE records are around a decade
younger than the average date of first construction.
Looking at these two data sources together suggests that the typical SNF in Illinois’ current stock of
active SNFs was first built in the 1970s, i.e., as much as a decade before Medicare certification. The
average Illinois nursing facility is 30-40 years old, and for facilities operated on a for-profit basis, the
typical facility is at least three times as old as it’s current owners’ shares.
The average for-profit nursing facility in Illinois is 30-40 years old, which is at least
three times as old as the typical ownership interest in those facilities
What are Illinois SNFs like on the inside? Over the past year and a half, and especially with the onset of
the COVID-19 pandemic in March 2020, HFS has taken an intensive look at the physical space within
SNFs with a focus on the physical proximity of residents to each other (and by implication, the proximity
to staff as well). Information on physical characteristics of SNFs that might have an impact on
transmission of an airborne virus like COVID-19 was not generally available at the outset of HFS’ study.
In August 2020 IDPH collated and shared a digitized record of the number of licensed beds in each NF
room in the state, apparently the first time such information had been collated for analysis. Other
relevant information remains elusive, such as the detailed air transfer, capacity, design, and filtering
qualities of HVAC systems in SNFs around the state. As a result, this report focuses on the number of
certified beds as well as estimates of the number of residents in rooms to isolate the relationship
between room occupancy, or “room crowding,” and COVID-19’s devastating impact. This relationship is
explored in two parts. The remainder of this section describes SNFs using both resident density per
1000 square feet and a new, more targeted measure of room crowding. In the next section this new
40 | P a g e
measure of room crowding is combined with detailed information about resident characteristics and
COVID-19’s facility-specific impact to measure room crowding’s contribution to mortality.
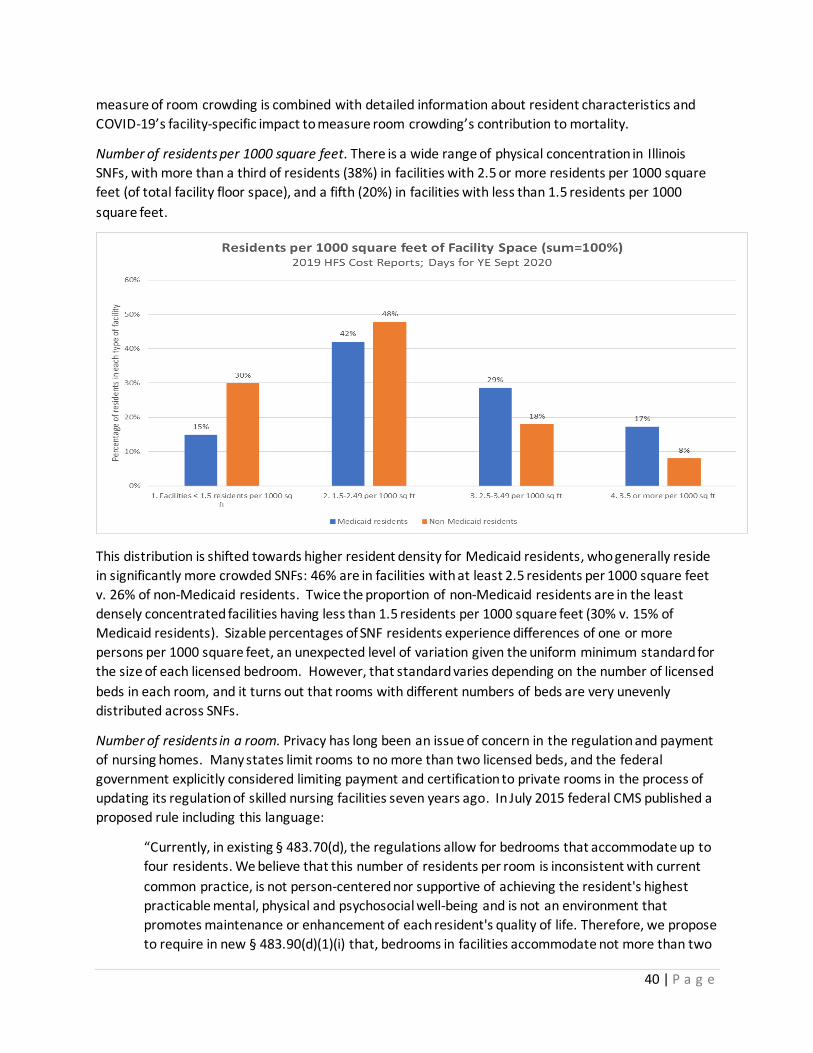
Number of residents per 1000 square feet. There is a wide range of physical concentration in Illinois
SNFs, with more than a third of residents (38%) in facilities with 2.5 or more residents per 1000 square
feet (of total facility floor space), and a fifth (20%) in facilities with less than 1.5 residents per 1000
square feet.
This distribution is shifted towards higher resident density for Medicaid residents, who generally reside
in significantly more crowded SNFs: 46% are in facilities with at least 2.5 residents per 1000 square feet
v. 26% of non-Medicaid residents. Twice the proportion of non-Medicaid residents are in the least
densely concentrated facilities having less than 1.5 residents per 1000 square feet (30% v. 15% of
Medicaid residents). Sizable percentages of SNF residents experience differences of one or more
persons per 1000 square feet, an unexpected level of variation given the uniform minimum standard for
the size of each licensed bedroom. However, that standard varies depending on the number of licensed
beds in each room, and it turns out that rooms with different numbers of beds are very unevenly
distributed across SNFs.
Number of residents in a room. Privacy has long been an issue of concern in the regulation and payment
of nursing homes. Many states limit rooms to no more than two licensed beds, and the federal
government explicitly considered limiting payment and certification to private rooms in the process of
updating its regulation of skilled nursing facilities seven years ago. In July 2015 federal CMS published a
proposed rule including this language:
“Currently, in existing § 483.70(d), the regulations allow for bedrooms that accommodate up to
four residents. We believe that this number of residents per room is inconsistent with current
common practice, is not person-centered nor supportive of achieving the resident's highest
practicable mental, physical and psychosocial well-being and is not an environment that
promotes maintenance or enhancement of each resident's quality of life. Therefore, we propose
to require in new § 483.90(d)(1)(i) that, bedrooms in facilities accommodate not more than two

41 | P a g e
residents unless the facility is currently certified to participate in Medicare and/or Medicaid or
has received approval of construction or reconstruction plans by state and local authorities prior
to the effective date of this regulation. …We believe that semi-private rooms are far more
supportive of privacy and dignity. While a facility is not a permanent home for all of its
residents, this provision is particularly critical for those residents whose only home is the nursing
facility. We considered, but did not propose to require private rooms. We note that many states
have physical environment requirements that exceed our requirements. These requirements
vary widely, but many include a requirement for no more than two beds per resident room or
establish a minimum percentage of rooms that must be private or semi-private. “
https://www.regulations.gov/document/CMS-2015-0083-0001
CMS finalized this rule in 2016, limiting Medicare and Medicaid participation to facilities with only two
persons per room unless larger-capacity rooms (of 4 or less) were licensed by the state before Nov. 26,
2016.
Two-thirds (66%) of Illinois’ 46,212 licensed rooms, and just over two-thirds (69%) of Illinois’ 81,314
licensed beds are in two-person rooms, while the remainder are split between single rooms and “ward”
style rooms that have three, four, or even more licensed beds in them.

42 | P a g e
The distribution of single, double, triple and quadruple+ bedrooms varies by type of facility. Using the
classifications developed above for Medicaid utilization and staffing and focusing on the “diagonal” that
links those two characteristics (see above), variation is substantial:
• A quarter (27%) of beds in low-Medicaid better-staffed facilities are private rooms, and just 4%
of beds are in “wards” with 3-4 licensed beds
• One-tenth (11%) of beds in high-Medicaid better-staffed facilities are in single rooms while 16%
are in wards
• One-twentieth (5%) of beds in high-Medicaid under-staffed facilities are in private rooms, while
31% of beds are in wards with 3-4 licensed beds
With occupancy declining to below 70% statewide, there are now thousands of empty beds on any given
day across the state. Reliable, consistent information identifying how many residents are in each room
on any given day is not available. To measure the level of resident room crowding – as opposed to bed
crowding — HFS calculated the minimum number of residents in each facility that MUST have been
located in a room with at least two other people, on average and over the course of a full year. To
model the use of added capacity in ward rooms (i.e., use of more than 2 beds) it was assumed that
facility use of single and double rooms in facilities that also have ward rooms is at least 85% (i.e., that
facilities would use ward rooms’ added capacity only if necessary). Facilities’ dependence on ward
rooms’ added capacity was distinguished by the following hierarchy:
• Facilities with no ward rooms or a level of occupancy suggesting at least 5% “slack” before they
would have to use ward rooms’ added capacity
• Facilities with ward rooms and a level of occupancy suggesting less than 5% “slack” before they
would have to use ward rooms’ added capacity
• Facilities with occupancy indicating they must have placed at least some of their residents in
rooms with a total of three or more residents
• Facilities with occupancy indicating they must have placed at least 10% of their residents in
rooms with a total of three or more residents

43 | P a g e
Using this room-crowding hierarchy HFS finds that Medicaid residents are substantially more likely to be
located in facilities crowding at least 10 percent or more of their (total) daily population 3 or more to a
room. For the year ending Sept 30, 2020, nearly half of Medicaid residents (46%) were in such facilities
as compared to 22% of non-Medicaid residents. As the Chart above illustrates, facilities are more or less
bifurcated in the room-crowding spectrum, with only about 10% of residents in facilities with small
negative or positive levels of modeled reliance on ward rooms. Some non-Medicaid residents are also
located in room-crowded facilities, although at less than half the rate of Medicaid residents. This raises
important questions about how nursing homes choose to place residents of different types in rooms of
different types: might Medicaid residents or racial and ethnic minorities be over-represented in any
given facility’s ward rooms? Existing data does not facilitate an answer to that question and HFS is
currently exploring new billing requirements meant to confirm placement by room size (i.e., number of
residents) on a daily basis. In the analysis below HFS looked for differences in the types of residents
located in facilities at different levels of room crowding.
Nearly half of Medicaid-funded SNF residents (46%) are in facilities that are heavily
dependent on the use of ward-style rooms with 3 or 4 licensed beds
Is room crowding concentrated in certain populations or regions? Given the national trend toward
private rooms in hospitals and nursing facilities, ward rooms in Illinois SNFs are likely to be associated
with older nursing facilities. However, most nursing homes in Illinois are decades old and were built
before Medicare – for example – indicated in 2015 that it would no longer recognize newly-constructed
rooms with more than two beds in them. The fact that such a large proportion of Illinois’ nursing facility
beds were built before policy and preference turned away from ward-style rooms limits the potential
variation in room crowding we might otherwise find across NFs serving different populations . The chart
below identifies some meaningful differences in the year of first construction by facility type according
to the level of room crowding. High-Medicaid, under-staffed facilities are generally older, but the
average year of first construction for the two dominant room crowding types (none & 10%+ shortfall)
does not appear to differ.

44 | P a g e
Room crowding might also be a function of property values and local population densities, as we would
expect for the concentration of multi-family housing. The charts below reveal that room-crowding is
highly concentrated in the Chicago, Outer Cook County and DuPage county, and that this is true for both
Medicaid and non-Medicaid residents. Outside of the Chicago area the largest concentration of room-
crowding is observed in East St. Louis, although current property values would not appear to explain
their presence there.

45 | P a g e
The unequal distribution of residents across Illinois nursing facilities Racial and ethnic minorities are not evenly distributed across Illinois’ SNFs. One-sixth of SNFs (16%,
n=110) have no Black or Brown residents at all, two-thirds (68%, n=462) have less than the statewide
average of 19% Black or Brown, and nearly one-sixth (14%, n=92) are at least 50% Black or Brown. Very
few nursing homes have a racial make-up mirroring the state as a whole.
The uneven distribution of Black and Brown residents in Illinois SNFs manifests across the facility
characteristics of greatest interest to HFS identified above. Black and Brown residents are far more
likely to reside in high-Medicaid, understaffed facilities. The two charts below compare the distribution

46 | P a g e
of Black and Brown v. White (only) residents using data from MDS surveys administered in the 4th
Quarter of 2020. In the first chart Black and Brown residents are concentrated in the highest categories
of Medicaid utilization and the lowest categories of nurse staffing (back left corner).
White non-Hispanic residents are more evenly distributed by staffing level and Medicaid utilization
(along the NW-SE diagonal linking Medicaid utilization to staffing). These differences are extreme. Just
less than a third of Black and Brown residents (31%) are in facilities with staffing of at least 92% of
STRIVE (approximately equal to Illinois’ minimum level), which is less than half the percentage of White
residents in minimum-staffed facilities (63%). Put differently, Black and Brown residents are nearly twice
as likely to reside in an under-staffed facility (69% v. 37%).

47 | P a g e
Black and Brown residents are also more likely to reside in room-crowded facilities. Two-thirds (67%) of
Black and Brown Residents in the fourth quarter of 2020 resided in facilities with some level of room
crowding (more than two people in at least one room), nearly all (62% of 67%) in facilities with at least
10% of residents crowded at least three to a room. Just under a quarter (24%) of White residents are in
facilities with at least 10% crowding. Black and Brown residents are more than twice as likely to be in a
facility that is heavily dependent on room crowding.
We have established above the close relationship between Medicaid utilization and room crowding.
Adding the degree of Medicaid utilization on the distribution of residents by level of room crowding
helps answer the question of whether Medicaid explains the disproportionate concentration of Black
and Brown residents in room-crowded facilities. Comparison of the two charts below reveals a large
residual level of concentration of Black and Brown residents in room crowded facilities.

48 | P a g e
See, for example, the relative heights of the blue bars at either end of the back row in each chart, the
row representing facilities with 80-100% Medicaid utilization. That comparison illustrates the much
higher proportion of Black and Brown residents of high-Medicaid facilities that are also in room crowded
facilities (as compared to White residents of high-Medicaid facilities).
• Among residents of facilities that have at least 80% Medicaid utilization
o 88% of Black or Brown residents are also in highly room-crowded facilities
o 56% of White residents are also in highly room-crowded facilities
• For residents in facilities at the next tier of Medicaid utilization (60-79%)
o 46% of Black or Brown residents are also in highly room crowded facilities
o 27% of White residents are also in highly room crowded facilities
The two characteristics emphasized here – staffing and room crowding – each represent added risks to
health and quality of life for residents. The added risks of under-staffing play out in the quality of care
Black and Brown residents receive on an ongoing basis. The added risk of room crowding manifest in
mortal consequence in the pandemic, a catastrophe documented in the section focusing on COVID-19
below.
More than half of Black and Brown residents (56%) reside in nursing facilities that are
both under-staffed and room-crowded, and they are nearly 3 times (2.87x) as likely
as White residents to reside in such facilities.
Before exploring the unequal impact that COVID-19’s first wave had on Black and Brown residents, in
part because their communities suffered higher levels of community infection in Wave 1, we present
here the two latent risks of staffing and room crowding that Black and Brown residents faced in 2019
and continue to face now. The two charts below contrast the distribution of Black and Brown residents
in lower-staffed AND more room-crowded facilities.

49 | P a g e
Focusing on the four bars in the front and right of each chart – under-staffed facilities with some level of
room observed crowding – we find 56% of Black or Brown residents in such facilities compared to 19%
of White residents. Not only do more than half of Black and Brown residents (56%) reside in facilities
that are both under-staffed and room-crowded, they are nearly 3 times (2.87x) as likely as White
residents to reside in such facilities.
HFS finds this level of absolute and relative risk to the health and safety of Black and Brown residents to
be unacceptable. The reforms proposed below are designed to infuse and/or redirect substantial
amounts of Medicaid funding to the types of facilities that put Black and Brown residents at such high
risk, but would condition that funding on elevated performance. HFS’ reforms would also raise funding

50 | P a g e
in other facilities to levels that makes Medicaid residents more financially sustainable. With respect to
HFS’ core value of improving equity, its recommendations for NF payment are intended to:
• drive improvement in the low-performing facilities that serve so many Black and Brown
residents and
• ensure that other facilities could afford to accept and sustainably care for those residents.
COVID-19’s impact in Illinois nursing facilities Results presented in the previous section establish Illinois SNFs’ reliance on multi-person rooms,
including substantial use of 3- and 4-person rooms. Multi-person rooms not only expose one resident to
another in a room, but also concentrate and extend the duration of visits by staff and, at least initially,
visitors in rooms designed to achieve half the air replacements per hour generally recommended for
airborne disease (3 v. 6 air changes per hour). In a pandemic defined by physical proximity, and amidst
nationwide public health interventions focused on “social distancing” – especially in the pandemic’s
initial wave5 -- nursing home residents had little protection. Residents crowded together in single
rooms would appear to be at unusual risk in the COVID-19 pandemic.
Community and facility-level COVID-19 risks. A growing research literature identifies the over-riding risk
of COVID-19 infections in the surrounding community to the residents and staff of nursing facilities.
Communities hit with high rates of COVID-19 infection in Wave 1 have consistently been found to be
home to nursing facilities with high rates of COVID-19 infection and mortality. The first two charts
below identify the twin risks faced by residents according to the level of room crowding and the
community rate of infection, here measured by the local community’s case rate v. its total population,
defining communities at the individual zip code level. Illinois’ zip codes were ordered by case rates of
infection using confirmed COVID-19 case counts from the Illinois Department of Health for the period
March 2020 through May 2020, or “Wave 1.” In a departure from resident counts used in analysis
presented above, the resident counts in this section represent SNF populations in the quarter preceding
the onset of the pandemic, the fourth quarter of 2019. At the onset of the pandemic, and in its first
wave, Black and Brown residents were concentrated disproportionately in room crowded facilities (as
we explored in the previous section) AND in communities with the state’s highest rates of COVID-19
infections. A comparable number of White (and not Hispanic) residents were located in these doubly
high-risk facilities, but that number represented a much lower percentage of all White residents.
• At the onset of the COVID-19 pandemic approximately 10,800 Black and Brown residents (using
a count of unique MDS surveys in the fourth quarter of 2019) resided in facilities with at least
some room crowding and in communities that would rank in the top 40% of (population-
weighted) ZIP codes in Wave 1 COVID-19 case rates.
• A similar number (9,000) of White residents faced the same level of double-risk at COVID-19’s
onset
• However, Black and Brown residents were more than three times as likely to reside in such
facilities and communities (52% of Black and Brown residents v. 15% of White residents).
5 This report follow’s the convention adopted by the Illinois Department of Public Health to associate Wave 1 with those contracting the Coronavirus by the end of May 2020.

51 | P a g e
This exposure to the double risks of physical proximity within facilities and community rates of infections
surrounding the facility manifest in differential rates of both COVID-19 infection and mortality. Because
of the uneven and imprecise detection and documentation of COVID-19 infections within facilities the
analysis below focuses solely on mortality, using IDPH COVID-19 case confirmations and COVID-19
designations as a cause of death and combining those records with individually-matched MDS and
Medicaid administrative records to measure the ratio of each facility’s Medicaid residents who died of
COVID-19 in Wave 1. Given the extreme variation across age groups in the rate of mortality given
infection, and substantial variation in the age distribution of Illinois SNFs, the mortality ratios presented
below have been adjusted for the age profile of each facility’s residents (and in the second and third
charts below, separately age-adjusted for Black and Brown v. White Medicaid residents) using age-

52 | P a g e
grouped case mortality ratios obtained from the Centers for Disease Control6: under 50 years, 50-64
years, 65-74 years, 75-84 years and 85+ years of age.
COVID-19 mortality in Wave 1. The risk to residents in room-crowded facilities was substantial: 44% of
Medicaid COVID-19-related deaths of nursing facility residents who contracted COVID-19 by May 31,
2020 occurred in facilities where at least 10% of residents were in rooms with 3 or more people.
The first chart below locates the 1,461 Medicaid-supported SNF residents lost to COVID-19 in Wave 1.
COVID-19 was identified as a cause of death using IDPH designations based on a COVID-19 diagnosis
prior to May 31, 2020. This non-age-adjusted tally reveals an overwhelming concentration of Wave 1
COVID-19 deaths in communities with high rates of community infection and in facilities with the
highest levels of room-crowding.
Adjusting for the age profile of each facility and dividing COVID-19 mortality totals by pre-COVID-19
resident counts yields a nearly monotonic (uniformly increasing) relationship between COVID-19
mortality ratios and both community rate of infection and degree of room crowding. In these two
characteristics, the risk of perishing in COVID-19’s first wave for Medicaid SNF residents varied more
than ten-fold across different communities and different types of facilities.
6 Ratios used in this analysis were obtained in April 2021. See Risk for COVID-19-19 Infection,
Hospitalization, and Death By Age Group | CDC for slightly updated case fatality ratios.

53 | P a g e
COVID-19’s Wave1 effect on Black and Brown residents. The results presented in the charts above
illustrate – with some minor variation -- COVID-19 mortality ratios that rise both with the community
rate of infection and the level of room crowding within a facility. Breaking these totals down by race
and ethnicity we find that more White Medicaid SNF residents perished in COVID-19’s first wave: 815 v.
646 Black or Brown residents. Nevertheless, Black or Brown residents make up nearly twice the
proportion of Wave 1 COVID-19 deaths (45%) as their share of Medicaid’s SNF population (26%) in the
months just prior to the COVID-19 outbreak.
Black and Brown Medicaid-funded SNF residents make up nearly twice the proportion
of Wave 1 COVID-19 deaths (45%) as their share of Medicaid’s pre-COVID population
Below we present the same analysis conducted separately for Black or Brown v. White Medicaid SNF
residents. Because age, race/ethnicity and facility of residence are correlated, the analysis is age-
adjusted separately for White and for Black or Brown residents. The results are a somewhat noisier
(statistically less precise; less uniform) version of the aggregate Medicaid results presented above.

54 | P a g e
COVID-19 mortality ratios increase substantially as both community infection rates and room crowding
within the facility increases – and the risks of mortality in Black or Brown v. White Medicaid residents
are very close to each other in absolute amount. Notice that the heights of the bars in each chart are
similar and increase from front left to back right in both. Within each type of facility, Black and Brown
residents faced a similar risk from Wave 1 of the COVID-19 pandemic.
While Black and Brown residents faced a similar risk as Whites in any given type of facility, the much
higher concentration of Black and Brown residents in the highest-risk facilities – compare the height of
the back right columns in the previous two similarly structured charts on p. 51 – led to a much higher
overall mortality ratio in COVID-19’s first wave. We found that at least 40% more Black and Brown
Medicaid SNF residents – between 200 and 300 additional Black and Brown Medicaid residents --
55 | P a g e
perished than would be expected based on COVID-19 mortality among White Medicaid SNF residents.
This tragic and inequitable difference in COVID-19’s Wave 1 impact essentially disappears when also
controlling for the disproportionate number of Black and Brown residents living in zip codes with higher
Wave 1 COVID-19 infection rates and room crowded nursing facilities.
The impact of room crowding on Wave 1 COVID-19 mortality. The novel coronavirus hit quickly and
spread in unexpected ways that took weeks or months to identify. Nursing facilities in the United States
quickly became COVID-19 hot spots. As the pandemic progressed SNFs had the chance to accumulate
the skills, habits and equipment necessary for best-practice infection control – tailored to COVID-19’s
unique threat. Wave 1, however, hit without warning and its toll may best represent the risk that SNF
residents face from new threats. Whether from COVID-19 variants or other infections, future infections
may hit as COVID-19 did.
The age and health profile of residents certainly helps explain the devastating number of COVID-19-
related deaths in nursing facilities since the pandemic began, but the analysis above (and independent
published research as well) demonstrates an additional human cost associated with the physical layout
of facilities – the one COVID-19 risk factor that hasn’t been systematically mitigated since the pandemic
began. COVID-19’s initial toll may have included between 500 and 1000 excess deaths among Medicaid
residents living in room crowded facilities at COVID-19’s outset. Uncertainty over that specific toll
reflects the high correlation between Wave 1 community outbreaks and the location of room crowded
facilities, which raises potentially unanswerable questions about how deadly Wave 1 would have been
for SNF residents in those communities had there been no more than two residents in each room.
Nevertheless, the evidence presented above indicates that room crowding played a substantial role in
the deaths of hundreds of additional Medicaid residents in just the first three months of the COVID-19
pandemic and that this toll was inequitably concentrated in Black and Brown communities.
The quality of nursing home care in Illinois Illinois nursing facilities generally rank below the national average in performance measures developed by the federal government for policy and consumer use, a set of ratings commonly referred to as STAR ratings because they are used to create a five-star rating for nursing facilities. We explore Illinois SNFs’ performance in this section and identify the components of the STAR ratings that HFS recommends for inclusion on a $135 million annual quality performance incentive program to be funded by a portion of increase nursing home assessment revenue. The STAR rating system. Federal CMS calculates a number of performance measures each quarter using data from the quarterly MDS survey and from Medicare claims data for all SNF residents. STAR ratings are the pre-eminent and most sophisticated example for aggregating SNF quality metrics into a performance indices. Although Medicare does not use STAR ratings in payment, the final step from index to payment would be computationally straightforward. For example, HFS recommends attaching an increasing per diem bonus to facilities that achieve a STAR rating of 2 or higher in the STAR rating for long stays.

56 | P a g e
Medicare’s STAR rating (whether for long stays, short stays, or its overall rating) is a multi-step process as illustrated in the diagram above, which was shared with HFS’ NF reform stakeholder group on October 29, 2020. CMS begins with raw data, tabulates the relevant metric (e.g., the percentage of long stay residents whose need for help with daily activities has increased), adjusts the value of that metric for each nursing home to ensure an apples-to-apples comparison (e.g., of a similar type of resident), assigns weights to each metric included in the STAR rating to reflect policy and value judgements about the relative importance of each, then aggregates the resulting values into a numeric index.
These numeric values could, for example, represent point totals of several hundred to more than a thousand points, and the last step is to apply selected thresholds demarcating lesser and greater STAR ratings (four cut points generate five groups representing homes from one to five STARs).

57 | P a g e
CMS adds and subtracts quality metrics periodically and currently maintains a list of 34 MDS-based and 5 claims-based metrics. STAR measures were selected from this list “based on their validity and reliability, the extent to which nursing home practice may affect the measures, statistical performance, and the importance of the measures.” (see Medicare’s Technical User’s Guide October 2019).
• 15 of the MDS-based metrics are available only to facilities on CMS’ QIES website • 24 remaining metrics are included in CMS’ Nursing Home Compare public reporting system
• Of these, 15 were selected for the Medicare Quality STAR Rating
Illinois SNFs’ performance v. other states. HFS recommends below that Illinois initiate a performance
incentive program based on the long stay STAR rating, which is based on 9 of the 16 measures CMS
reports each quarter on its COMPARE website (in the Long Stay table above the 9 included measures are
those with STAR points assigned). Over time Illinois would ideally tailor its performance incentives to
reflect state priorities and to accommodate progress towards improvement goals.
COMPARE Long Stay (LS) Quality Measures
US Average Illinois Illinois Rank (1= best)
Percentage of LS residents whose need for help with daily activities has increased 16.7% 16.1% 19
Percentage of LS residents who lose too much weight 7.8% 8.5% 37
Percentage of LS LS residents who lose control of their bowels or bladder 47.1% 45.0% 19
Percentage of LS residents with a catheter inserted and left in their bladder 1.6% 1.8% 32
Percentage of LS residents with a urinary tract infection 2.5% 2.9% 30
Percentage of LS residents who have depressive symptoms 7.3% 29.2% 51
Percentage of LS residents who were physically restrained 0.2% 0.2% 24
Percentage of LS residents experiencing one or more falls with major injury 3.4% 3.3% 19
Percentage of LS residents assessed and appropriately given the pneumococcal vaccine 93.8% 88.9% 51
Percentage of LS residents who received an antipsychotic medication 14.3% 18.5% 45
Percentage of LS residents who received an antianxiety or hypnotic medication 19.7% 19.6% 30
Percentage of LS residents assessed and appropriately given the seasonal influenza vaccine 96.1% 93.7% 50
Percentage of LS residents whose ability to move independently worsened 25.4% 25.4% 24
Percentage of high risk LS residents with pressure ulcers 8.3% 9.1% 36
Number of hospitalizations per 1000 LS resident days 1.65 1.76 37
Number of outpatient emergency department visits per 1000 LS resident days 0.75 0.83 35
Latest Performance (as of September 2021)

58 | P a g e
Overall, Illinois SNFs lag significantly behind the performance of SNFs in other states. As of September
2021 Illinois ranks in the bottom half of states in 11 out of 16 long stay quality measures (see long- and
short-stay tables above). Focusing on measures included in the long stay STAR rating that HFS proposes
for initial use in a performance incentive program, Illinois ranks in the bottom half of states for 6 out of 9
measures. Of note, Illinois ranks last in two long-stay and one short stay measure representing 14% of all
22 long- and short-stay measures, but Illinois’ low performance is pervasive. Of COMPARE’s 22 long- and
short-stay measures:
• nearly two-thirds (n=14) of Illinois’ performance rankings are in the bottom twenty states
• 40% (n=9) of Illinois’ performance rankings are in the bottom ten states
• Illinois ranks dead last (51st) in 3 of 22 measures (14%).
Illinois lags behind other states in the most recent comparisons of the 22 measures
underlying Medicare’s short- and long-stay STAR ratings
COMPARE Short Stay (SS) Quality Measures
US Average Illinois Illinois Rank (1= best)
Percentage of SS residents assessed and appropriately given the pneumococcal vaccine 81.3% 71.5% 49
Percentage of SS residents who newly received an antipsychotic medication 1.9% 2.2% 44
Percentage of SS residents who made improvements in function 71.0% 65.8% 45
Percentage of SS residents who were assessed and appropriately given the seasonal influenza vaccine 81.1% 71.5% 51
Percentage of SS residents who were rehospitalized after a nursing home admission 21.7% 23.1% 44
Percentage of SS residents who had an outpatient emergency department visit 9.4% 9.3% 18
Latest Performance (as of September 2021)
59 | P a g e
Coupled with Illinois’ ranking of 51st in case-mix-adjusted nurse staffing, data from the federal
government’s well-established STAR measures motivates HFS’ recommendation to:
• tie significant new and redirected payments directly to higher levels of nurse staffing, the single
most important input to quality care in Illinois, and
• tie significant new payments to higher quality outcomes, providing additional financial incentive
for SNFs to improve care in the best way they see fit.
Increasing use of quality-based payment for nursing facility services. Roughly half of states already tie
some form of incentive payment to performance for nursing facilities, although payment structure
varies widely. Examples from a 2019 report by the federal advisory group, the Medicaid and CHIP
Payment Advisory Commission (MACPAC), that HFS shared with its NF reform stakeholder group in
October 2020 include:
• California: payments of $2.37-$14.47 per Medicaid resident day (PMRD) for qualifying facilities o $84M in payments (FY19) were based on performance v. a statewide benchmark
($75.6M) and year-over-year facility improvement ($8.4M) o A mix of long- and short-stay metrics are included, as is staff retention
• Colorado: payments of $1-4 PMRD based on performance o Quality of life (enhanced dining and personal care, end of life program, connection and
meaning, person-directed care training, trauma-informed care, physical environment, consistent assignments, volunteer program, staff engagement, transitions of care)
o Quality of care (vaccination data, reducing avoidable hospitalizations, nationally reported quality measures scores, best practices, antibiotics stewardship/infection prevention & control, Medicaid occupancy average, staff retention rate, DON and NHA retention, nursing staff turnover rate, behavioral health care)
• Maryland: $6 M per year is distributed via pay for performance o 85% of funds distributed to the highest-scoring facilities (at a 2-1 ratio for highest v.
lowest-scoring facilities) o 15% distributed to facilities whose scores improved (also at 2-1 ratio for highest v.
lowest-improving) • Michigan: payments of up to $5.50 PMRD (2017) based on facilities ’ STAR Quality rating
o facilities with an average rating below 2.5 must file a corrective action plan to be eligible for payment
o initiative payments are decreased for facilities that do not submit resident satisfaction survey data
o payments increase proportionally with facilities’ Medicaid utilization
Medicare began awarding incentive payments to SNFs in 2018 through the SNF Value-Based Purchasing
(VBP) program based on facilities’ performance on just one measure, 30-Day All-Cause Readmission (to
an acute care hospital within 30 days of discharge). Medicare’s choice of this metric might reflect both
its role in SNF payment (i.e., for short-term stays of 100 days or less that often initiate with a transfer
from an acute hospital) and the readmission metric’s widespread use and maturity. To fund the VBP
payment, Medicare withholds 2% of SNF Medicare fee-for-service (FFS) payments. Facilities may
experience a net payment increase, payment reduction (effectively a penalty) or no change relative to
their full 2% withhold depending on their payment multiplier. All SNFs must participate and do not need
to submit additional information.

60 | P a g e
Recommendations
When the state Medicaid program tried to move to follow Medicare’s patient care needs index in 2005,
the industry responded with its preference for a home-grown payment system that rewarded coding
and historical payments -- not quality or staffing. Today, we find ourselves in a not so different place,
trying to update not only to the index of patient care needs now in use for Medicare for over two years,
but also to use the enormous purchasing power of Medicaid to drive better results for more than 45,000
individuals whose very lives depend on quality care in about 700 nursing homes across the state.
Illinois has long struggled with overcrowded nursing homes, low quality care, and low staffing levels
compared to other states. This is despite investments that have doubled the rate Medicaid pays nursing
homes since 2005. Unlike in many states, these investments have been made with state general funds
dollars and did not capitalize on the significant room to increase the nursing home assessment
tax. Now, HFS proposes both streamlining (two taxes to one) and an overall increase in the tax, as well
as spending the new funding on three things: 1) direct wage increases and building a career path for
CNA direct care staff which goes to all homes; 2) paying homes more as they staff more appropriately,
according to federal standards, and 3) paying more for quality.
Recommendations contained in this report are the culmination of two years of research, data
compilation, analysis, and discussions with the industry, as well as other affected stakeholders. These
recommendations outline a path to shift the future for Illinois’ Medicaid nursing home residents by
directly tying new funding to staffing and quality (and not just coding and old cost reports). The
recommendations outline how to devote $345 million in new funding to Illinois nursing homes and,
while not changing the underlying payment system beyond the updated “case mix”, to spend new
funding in ways that directly impact workforce shortages and quality of life for residents.
We are proposing to use $345M, or approximately a 13% rate increase on average, to begin incenting
these changes. We are not proposing changes to the $1.75 billion base payment to nursing
homes. Those remain the same, with the exception of $70 million already targeted for staffing in 2019.
With any proposed changes, there is always a discussion about “winners and losers”. We think that has
to be done through a lens of equity and outcomes. We have also considered net profits in the
discussion and analysis. Almost every home does better under our proposal; however, if a facility has
been making money for years but not adequately staffing to care for its residents, that facility will not
see funding continue to rise on par with other facilities who have more appropriate business models.
New funding for HFS’ recommendations would derive from an increase in the assessment charged for
each occupied nursing facility bed in the state. The performance- and staffing-dependent incentives HFS
proposes would serve as the principle means by which low-staffed / low-performing homes could
recover increased assessment payments to the state. In its modeling for these recommendations
(summarized below), HFS incorporated the costs associated with the lowest performers’ anticipated

61 | P a g e
staffing improvement. As a result, HFS’ analysis of the net impact of HFS’ proposal on both nursing
facilities and the state reflects each of the following:
• the increase in the assessment
• the likely response by low-performing SNFs (an increase in staffing)
• the resulting level of staffing incentive payments that would accrue to those SNFs.
HFS’ proposal is designed not only to motivate but to enable improvement among the state’s lowest -
staffed SNFs, and to use the agency’s buying power to stem losses to the critical pool of nurses and
CNAs that residents rely on.
Summary and Fiscal Impact
Each specific proposal is described in more detail later in this section (Adopting PDPM, Nurse Staffing
incentive payments, Transforming the CNA payscale, and Quality Incentive Payments). Of key interest
to nursing facilities is the net effect these proposals would have, including the costs of each of the above
HFS Nursing Facility Payment Reform Recommendations at a Glance ($ millions, all funds)
Policy Brief description
Sources of
Funds
Uses of
Funds
collect $186M and draw $194M in
federal match totalling $380M380$ -$
fund supportive living increase -$ 30$
quality incentives; rate-setting;
auditing-$ 5$
fund with future increses in bed
tax up to federal limits-$ -$
Adopt PDPM nursing componentbudget-neutral conversion from
RUGs at state level-$ -$
no change -- would remain $85.25 -$ -$
Escalating 5-tier per diem add-on +$6 per diem @ each tier -$ 224$
Dedicate $4.55 staffing add-on redirect to tiered per-diems 64$ -$
Tenure $1.50/hr @ 1 yr +$1 each addtl. yr -$ 75$
Promotion $3/hr -$ 5$
Training full training subsidy for NF CNAs -$ 5$
2-5 STARs; escalating reward -$ 100$
Totals 444$ 444$
Base Rate
Nurse Staffing Incentive
Direct support for CNA payscale
Quality incentives
Streamlined tax on occupied beds
Scrape/Pay for related impact
CMI inflation (rate creep)
Administrative Oversight

62 | P a g e
(included) reforms. Such estimates are difficult if not perilous due to their predictive nature. A number
of variables that are likely to change over time must be held fixed in order to calculate expected
payments (and tax collections) for each facility, including:
• staffing levels
• quality performance
• occupancy
• operating costs and capital (re-)investment by owners
• sale, purchase, and closure decisions by owners
In developing this proposal, as with HFS’ previous set of proposals put forward in March and April 2021,
HFS considered and now shares a comprehensive set of before-and-after comparisons to describe in
detail the impact that these proposals are expected to have. These estimates are based on a rate model
developed by HFS’ contractor Myers and Stauffer with substantial and ongoing guidance by the agency
and were informed by dozens of interactive discussions with HFS’ NF rate reform stakeholder advisory
group. A complete list of the data used in the model is provided in Attachment 4.
Financial impact on facilities. The first set of analyses attributes staffing increases necessary to meet
the STRIVE equivalent of the state’s minimum staffing requirements to the pre-reform period, since
minimum staffing requirements are already promulgated and set to take effect January 1, 2022. These
estimates assume that all nursing homes reach at least 92% of expected nurse staffing levels under the
STRIVE system by the time that tax assessments and increased payments under this set of
recommendations are implemented.7 The tables below examine the substantial net positive impact that
HFS’ recommendations would have on net income of nursing homeowners. It is important to note that
in these models of net impact, certain elements of the proposal could not be modeled. In particular, the
$85 M CNA payscale and training proposals are modeled as a pass-through to facilities for Medicaid’s
share of the requisite tenure, promotion and training subsidies specified for CNAs even if they already
pay some sort of wage premium for tenure and promotion or provide training subsidies. In other words,
HFS’ model assumes that this $85M investment in workers CANNOT improve any facility’s net income.
Nevertheless, some facilities do currently provide a wage increment for tenure and/or promotion and
under HFS’ proposal would now receive payments equal to Medicaid’s share of those wage increments
(up to the requisite amounts specified in our proposal). For example, a home already paying a
$.35/hourly wage increment for each year of tenure would receive Medicaid’s share of that increment
plus the difference between that increment and the level recommended by HFS ($1.50/hour for year 2 +
$1/hour thereafter to a max of $6.50). The tables below do not credit HFS’ proposal with the positive
impact on facilities of the (re-)payment they would now receive for Medicaid’s share of existing tenure
and promotion-based pay increments. While the costs are reflected in the sources and uses table
above, the net gain to facilities cannot be fully modeled because HFS does not have information about
facilities’ existing pay scales nor the tenure distribution of their CNA staff.
7Columns estimating the annual impact of reform and post-reform net income do not incorporate the costs to facilities of raising staffing levels to at least 92% of STRIVE, i.e., to HFS’ estimate of minimum staffing levels.

63 | P a g e
HFS’ proposal would benefit nursing facilities at every level of Medicaid utilization. In total dollar terms,
the highest-Medicaid homes would gain the most, which is the net result of several factors:
• A lower rate of taxation for the NFs serving the most (and least – see proposal below) number of
Medicaid-funded residents
• Larger facilities: facilities with the highest proportion of Medicaid residents also tend to be
larger, sometimes significantly larger than other types of facilities
• The benefits of meeting state minimum staffing requirements. The tables in this section depict
the impact of HFS’ reforms assuming facilities have already risen to at least 92% of STRIVE
staffing levels. The section below describes the range of possible net effects incorporating the
cost to facilities (v. 2019 net income) of hiring additional staff necessary to reach that 92%
threshold and therefore qualify for at the $10 per diem nursing incentive tier.
• As discussed in the next section, even accounting for additional staffing costs, facilities with
more than 50% Medicaid utilization and beginning at less than 92% of STRIVE are still projected
to earn a profit, partly because their baseline pre-reform (and pre-staffing-minimum) level of
profit is so high.
Notice also in the table above showing distributional effects of HFS’ proposals by Medicaid utilization as
well as in the tables below showing the impact by region, case mix levels, and other facility
characteristics, that HFS’ proposal would – in general – narrow the very large pre-reform variation in the
percentage of facility costs met by Medicaid’s payments. For example, in the table above facilities with
Medicaid utilization of 0-50% currently receive only about half to three-quarters of their costs for the
Medicaid-funded residents they accept. HFS’ proposed reforms would increase cost recovery for these
low-Medicaid facilities by as much as 12 percentage points and would reach at least 85% for facilities at
20-49% Medicaid utilization.
Medicaid Utilization Percentage
Count of
Facilities
Current (RUG) total
Facility Cost
Coverage
Facility Cost
Coverage with all
Proposed Reforms
Net Facility Income
pre-Reform (2019
cost report basis)
Annual Impact From
all Proposed
Reforms5
Estimated Net
Income After all
Proposed Reforms5
RUG
Medicaid CMI
PDPM
Medicaid CMI
90%-100% 39 105% 112% 56,640,492$ 25,238,827$ 81,879,320$ 1.09 1.13
80-89% 105 100% 102% 80,945,586$ 17,483,409$ 98,428,996$ 1.23 1.22
70-79% 104 93% 95% 37,754,635$ 4,685,816$ 42,440,452$ 1.26 1.25
60-69% 121 89% 92% 56,037,499$ 3,324,177$ 59,361,676$ 1.21 1.20
50-59% 104 87% 92% 33,199,478$ 6,554,939$ 39,754,416$ 1.16 1.17
40-49% 51 81% 87% 10,792,112$ 3,272,220$ 14,064,332$ 1.14 1.14
30-39% 44 78% 85% 6,148,187$ 2,124,890$ 8,273,077$ 1.12 1.12
20-29% 25 73% 85% 5,270,373$ 904,511$ 6,174,884$ 1.05 1.08
10-19% 21 64% 76% 18,482,728$ 1,368,662$ 19,851,390$ 1.03 1.08
0-9% 30 49% 58% 5,728,558$ 860,141$ 6,588,699$ 1.09 1.13

64 | P a g e
Region
Count of
Facilities
Current (RUG) total
Facility Cost
Coverage
Facility Cost
Coverage with all
Proposed Reforms
Net Facility Income
pre-Reform (2019
cost report basis)
Annual Impact From
all Proposed
Reforms5
Estimated Net
Income After all
Proposed Reforms5
RUG
Medicaid CMI
PDPM
Medicaid CMI
NW Galena 47 85% 90% 19,665,241$ 2,000,177$ 21,665,418$ 1.13 1.15
NC Peoria 59 89% 96% 18,898,853$ 4,239,828$ 23,138,681$ 1.16 1.17
WC SpringField 51 90% 95% (1,564,246)$ 2,730,151$ 1,165,906$ 1.13 1.12
EC Decatur Champaign 63 89% 94% 19,161,294$ 3,333,672$ 22,494,966$ 1.11 1.12
S Cairo 63 94% 97% 15,750,482$ (242,469)$ 15,508,013$ 1.12 1.10
CHI City 76 95% 99% 90,510,081$ 24,807,050$ 115,317,131$ 1.24 1.23
CHI Outer Cook Dupage 149 82% 86% 135,611,374$ 17,589,528$ 153,200,903$ 1.24 1.23
CHI Lake Kane McHenry 55 82% 87% 18,311,928$ 5,907,042$ 24,218,969$ 1.20 1.23
CHI SW and Will 26 83% 87% (610,928)$ 3,320,774$ 2,709,846$ 1.21 1.18
W Rock Island 14 83% 90% (7,668,067)$ 1,342,620$ (6,325,447)$ 1.15 1.18
SW East St. Louis 41 89% 94% 2,933,635$ 789,221$ 3,722,856$ 1.12 1.12
Current System RUG Medicaid CMI Percentile
Facility
Count
Current (RUG) total
Facility Cost
Coverage
Facility Cost
Coverage with all
Proposed Reforms
Net Facility Income
pre-Reform (2019
cost report basis)
Annual Impact From
all Proposed
Reforms5
Estimated Net
Income After all
Proposed Reforms5
RUG
Medicaid CMI
PDPM
Medicaid CMI
80-100th percentile 129 94% 94% 89,311,358$ (3,560,066)$ 85,751,292$ 1.45 1.38
60-79th percentile 129 89% 92% 85,737,858$ 14,108,507$ 99,846,365$ 1.27 1.24
40-59th percentile 128 89% 93% 73,268,950$ 15,609,416$ 88,878,366$ 1.17 1.17
20-39th percentile 129 82% 90% 32,820,038$ 15,082,345$ 47,902,383$ 1.07 1.10
0-19th percentile 129 82% 92% 29,861,445$ 24,577,390$ 54,438,836$ 0.93 1.00
Percentage of Medicaid Residents Coded with Rehabilitation Services
Count of
Facilities
Current (RUG) total
Facility Cost
Coverage
Facility Cost
Coverage with all
Proposed Reforms
Net Facility Income
pre-Reform (2019
cost report basis)
Annual Impact From
all Proposed
Reforms5
Estimated Net
Income After all
Proposed Reforms5
RUG
Medicaid CMI
PDPM
Medicaid CMI
80-100% 11 94% 90% 6,001,224$ (3,934,462)$ 2,066,762$ 1.24 1.05
60-79.99% 62 90% 89% 9,894,552$ (10,419,948)$ (525,396)$ 1.26 1.12
40-59.99% 165 92% 94% 93,547,271$ 3,517,703$ 97,064,973$ 1.27 1.23
20-39.99% 221 87% 93% 124,626,168$ 45,594,713$ 170,220,881$ 1.18 1.21
Under 20% 185 82% 91% 76,930,434$ 31,059,587$ 107,990,022$ 1.06 1.12
Percentage of Medicaid Residents with Alzhiemers
Count of
Facilities
Current (RUG) total
Facility Cost
Coverage
Facility Cost
Coverage with all
Proposed Reforms
Net Facility Income
pre-Reform (2019
cost report basis)
Annual Impact From
all Proposed
Reforms5
Estimated Net
Income After all
Proposed Reforms5
RUG
Medicaid CMI
PDPM
Medicaid CMI
80-100% 23 73% 80% 3,184,034$ (31,542)$ 3,152,492$ 1.15 1.13
60-79.99% 119 84% 90% 66,512,204$ 2,588,781$ 69,100,985$ 1.13 1.12
40-59.99% 234 87% 91% 50,979,258$ 8,708,271$ 59,687,529$ 1.17 1.16
20-39.99% 225 91% 95% 169,678,395$ 39,980,925$ 209,659,321$ 1.22 1.23
Under 20% 43 88% 95% 20,645,757$ 14,571,157$ 35,216,915$ 1.11 1.15
Percentage of Medicaid Residents with SMI
Count of
Facilities
Current (RUG) total
Facility Cost
Coverage
Facility Cost
Coverage with all
Proposed Reforms
Net Facility Income
pre-Reform (2019
cost report basis)
Annual Impact From
all Proposed
Reforms5
Estimated Net
Income After all
Proposed Reforms5
RUG
Medicaid CMI
PDPM
Medicaid CMI
10-100% 59 100% 107% 32,368,818$ 18,685,501$ 51,054,319$ 0.96 1.04
8-9.99% 14 101% 108% 16,676,354$ 4,466,028$ 21,142,381$ 1.10 1.12
6-7.99% 15 88% 94% 4,566,160$ 2,613,022$ 7,179,182$ 1.12 1.16
4-5.99% 42 90% 93% 23,574,502$ 4,422,742$ 27,997,244$ 1.15 1.15
Under 4% 514 85% 90% 233,813,815$ 35,630,301$ 269,444,115$ 1.21 1.20

65 | P a g e
In all of these tables, only two categories of facilities are shown to have net negative impacts of at least
$1M statewide:
• Facilities coding 60-100% of their residents into a rehabilitation payment category
• Facilities in the 80-100th percentile range of case mix index
In each of these categories above, notice the large drop in CMI in the last two columns due to the
adoption of PDPM. The negative financial effects that will be felt in these facilities is primarily due to
the adoption of PDPM, which Medicare specifically calibrated to better target payment to resident care
needs.
Impact on low-performing and high-Medicaid facilities. Of particular interest to HFS, and a point of
substantial deliberation within HFS’ NF reform advisory stakeholder group over the past eighteen
months, is the potential impact that reform may have on facilities most dependent on Medicaid funding
(high-Medicaid facilities), which also include the facilities with the lowest levels of performance. These
facilities are home to both a disproportionate number of Medicaid residents and a disproportionate
number of Black and Brown residents, and HFS’ recommendations are intended to both motivate and
enable substantial improvements in both staffing and quality care in these facilities.
Comprehensive modeling demonstrates how HFS’ proposal not only motivates but
also enables needed improvements in staffing and care in Illinois’ lowest-performing,
highest-Medicaid facilities.
The first table below provides an updated view of current (pre-COVID-19) net income per resident day
using the most recent staffing and utilization data. The table indicates a clear advantage in current net
income for homes that are both under-staffed and above 50% in Medicaid utilization.8
The next view focuses on the impact of HFS’ proposals on facilities’ bottom line -- net income per
resident day -- assuming that these facilities will have already met state minimum staffing requirements
by the time HFS’ recommendations take effect. Reforms are shown to help high-Medicaid facilities the
most, but also that reforms will target relatively higher payments to better-staffed facilities. But HFS’
proposed reforms ALSO help facilities in their rise to acceptable staffing levels. On net, high-Medicaid
8 The net income data used in this table and those below are based on 2019 cost report information updated with 2020 occupancy and 1Q 2021 facility-level performance.
Net Income Per Resident Per Day Under Current System (2019 basis)
1Q 2021 staffing
below 92% STRIVE
1Q 2021 staffing above
92% STRIVE
Below 50% Medicaid 14.05$ 11.97$
Above 50% Medicaid 17.69$ 10.58$

66 | P a g e
facilities that were understaffed in January 2021 but rise to 92% of STRIVE by the time HFS’ proposals
are implemented will see a $2.44 increase in net income per resident day.
The third view shared below models the net impact of both HFS’ proposals in this report AND facilities’
response to state minimum staffing regulations, set to commence on January 1, 2022. While these
regulations take effect regardless of the outcome of HFS’ proposals, the view provided here is meant to
illustrate the ongoing viability of nursing facilities under the state policies recommended herein.
Ignoring the independent impact that minimum staffing requirements will have on facility staffing levels
apart from HFS’ proposals and instead combining the effects of both the minimum staffing requirement
and HFS’ proposals, the table below illustrates that the two state policy initiatives would leave even
high-Medicaid currently-understaffed facilities with positive earnings.
These tables and the recommendations described below indicate substantial progress toward a number
of HFS’ key goals:
• increase nursing home funding substantially
• tie funding to nursing home performance, including both staffing and quality
• redistribute funds according to a more accurate measure of resident care needs (PDPM)
• eliminate the current incentive for facilities to code higher levels of care needs than their nurse staffing levels indicate
• provide a viable path towards improvement for Illinois’ lowest-performing facilities
• increase payment to low-Medicaid facilities to enhance opportunities for Medicaid-funded
resident admissions in those facilities
[Assumes a pre-reform rise to 92% of STRIVE staffing levels]
1Q 2021 staffing below 92%
STRIVE
1Q 2021 staffing above 92%
STRIVE
Below 50% Medicaid 0.26$ 1.91$
Above 50% Medicaid 2.44$ 4.06$
Positive Incremental Impact of Proposed Reforms on Net Income Per-Resident Per Day (2019 basis) --
Helps Most for High Medicaid and Appropriately Staffed
[Adds in the full costs of a rise to 92% of STRIVE]
1Q 2021 staffing below 92%
STRIVE
1Q 2021 staffing above 92%
STRIVE
Below 50% Medicaid 7.98$ 13.88$
Above 50% Medicaid 9.12$ 14.28$
Sustainable Post-Reform Net Income Per-Resident Per Day (2019 basis) --
Net Income Remains Positive Even When Factoring in the Impact of Minimum Staffing Regulations

67 | P a g e
I. Adopt PDPM
Background • HFS’ Medicaid payments to nursing facilities include components for nursing, capital and
support costs.
• The focus of HFS’ reforms is the direct care portion of the rate that covers nurse staffing. The
Direct care rate consists of a legislatively-set base payment ($85.25 per resident per day) that is
then multiplied by both the facility’s average level of patient need (or case mix index value) and
a regional wage adjustment.
• HFS’ current payment for nursing care is distorted
o Following the introduction of RUGs in January 2014, subsequent direct care rate add-
ons and a ~35% increase in facility-reported resident care need (‘case mixes’), caused a
4.4% compound annual growth rate (CAGR) in Medicaid’s direct care rate through July
2021.
o Most of that increase in payment rates is due to increases in facility-reported levels of
resident care needs
o More than one-quarter (about $450M) of Medicaid’s $1.75B annual direct care
payments to nursing homes are the result of increases in facility-reported resident care
needs in the seven years since the current rate methodology was implemented
• PDPM was designed to address payment distortions
o The federal government noted nationwide over-coding of Medicaid (and Medicare)
nursing home resident care need as a principle motive behind its development of the
Patient Driven Payment Model (PDPM), which it implemented in October 2019.
Medicare’s switch to PDPM was intended to offset the RUGs system’s vulnerability to
over-coding due -- in particular -- to facilities’ over-provision of rehabilitative therapy
services.
o PDPM is built on resident characteristics rather than the volume of services provided to
the resident.
o PDPM was designed to be more resident-centered, better align financial resources with
resident needs (e.g., more precision and variation allowed for Medicare-funded
therapy), and mitigate areas of their reimbursement system that can readily be
influenced by provider operational choices and financial incentives as opposed to direct
resident need (e.g., over-coding of rehab).
o Nearly one-third (30%) of Medicaid residents would need to be reclassified under PDPM
(v. RUGs) due solely to the absence of rehab groups under PDPM, a strong indication of
the over-use of rehab in Medicaid billing since:
▪ there are few truly rehabilitative services that Medicare does not pay for
▪ nearly all Medicaid nursing home residents are also eligible for Medicare
▪ under both RUGs and PDPM therapy itself is to be reimbursed separately under
Medicare through Part B.

68 | P a g e
Recommendation Implement PDPM ($0 M). HFS recommends switching to PDPM in a budget-neutral fashion January 1, 2022.
1. Information needed to classify residents using the PDPM CMI system is already collected from facilities and used in the classification required for HFS’ current RUGs-based payment.
2. The states approach to updating the CMI on a quarterly basis would not change with the adoption of PDPM over RUGs.
3. To protect state general funds from the added costs of future up-coding under the new PDPM system – as occurred before, during, and after adoption of the current RUGs-based payment in 2013-2014 -- HFS would determine on an annual basis the level of case mix index inflation, or “creep.”
a. HFS would then calculate the level of nursing home bed taxation needed to fund the projected total costs of observed inflation.
b. If necessary to remain within federal and state limits for allowable health care provider taxation, the entire PDPM case mix index (i.e., the 25 values representing the relative level of resident need) would be scaled down using a single multiplicative factor to ensure that case mix inflation could be fully funded with the occupied bed tax and associated federal matching payments.
II. Increase and Streamline the Assessment on Nursing Facilities
Background • 45 states impose some sort of provider tax on nursing facilities (Medicaid and CHIP Payment
Advisory Commission, 2021), two more than impose a tax on hospitals. Illinois imposes both,
like most states, but has remained far below federal limits on the level of taxation on its nursing
facilities.
• Federal requirements
o Since 1991 the federal government has imposed restrictions on health care provider
taxes including that they be:
▪ Broad-based (not targeted narrowly at Medicaid providers who would then be
easily repaid through increased Medicaid payments, now matched with federal
revenue drawn down against state provider tax collections)
▪ Uniformly imposed across all taxed providers (not varying in direct proportion to
the level of Medicaid payment)
▪ Devoid of holds-harmless agreements between the state and providers (which
might assure providers that they would not lose any money following the
imposition of a tax and the associated increase in Medicaid payments).
▪ No more than 6% of facility revenue. The federal government limits the amount
taxation equal to no more than 6% of total revenue in the relevant class of
provider.

69 | P a g e
o The streamlined tax HFS proposes below would be broad-based but not uniform (see
schedule of varying tax amounts below) and would therefore need to pass a waiver test
established by the federal government requiring the tax to be “generally redistributive.”
▪ To determine the redistributive nature of a tax proposal, states with non-
uniform taxes must apply a statistical test with a numeric threshold which
depends mainly on the relationship between rates of taxation and the level of
Medicaid utilization across taxed providers.
▪ HFS proposal below would satisfy the generally redistributive test due in large
part to the lower rates of taxation imposed on facilities with the highest
proportion of Medicaid residents.
o The current level of taxation of Illinois nursing facilities is slightly less than half of the
federal limit of 6% (see table below). This is gap of approximately 3 percentage points
of (non-Medicare) nursing facility in the state is the opportunity HFS’ is proposing to use
to fund the increases in payments outlined in recommendations below.
Recommendation
Combine and increase the licensed bed tax (collects $186M).
1. HFS proposes to eliminate the tax on the total number of licensed beds and to increase and vary
the tax on (non-Medicare) occupied beds from the current uniform level of $6.07 per occupied
bed according to the following initial schedule of bed tax amounts:
a. 0-4,999 Medicaid resident days per annum $10.06
b. 5,000-14,999 Medicaid resident days per annum $18.10
c. 15,000-34,999 Medicaid resident days per annum $21.12
d. 35,000-54,999 Medicaid resident days per annum $18.10
e. 55,000-64,999 Medicaid resident days per annum $13.07
f. 65,000+ Medicaid resident days per annum $10.06
2. HFS would update the tax rates annually beginning in 2023 to keep pace with (any) observed
growth in the Medicaid days-weighted statewide average PDPM case mix index, using the
additional funds to support overall CMI inflation over time. Case-mix-driven increases in the
schedule of bed tax amounts would maintain the relative values conveyed by the amounts listed
above, i.e., in any given year the bed tax amounts would be increased by the same multiplier.
3. Estimates of the revenue collected under HFS’ provider tax recommendation are listed in the
table below.

70 | P a g e
III. Introduce Nurse Staffing Incentive Payments
Background
• Nurse staffing levels in Illinois rank at the bottom nationally, largely due to relatively low levels
of CNA staffing.
• Medicaid payment is tied to Minimum Data Set (MDS)-driven resident classifications that are
indexed to the expected costs of staffing (i.e., RUGs now and PDPM recommended), but
Medicaid’s direct care payment is not tied to a facility’s staffing levels.
o Medicaid facilities bear a disproportionate share of under-staffing in Illinois.
o Many of the facilities with the lowest levels of staffing are high Medicaid utilizers, e.g.,
at or above 80% Medicaid utilization.
• Previous increases in Illinois Medicaid’s direct care rate that were intended to support staffing
levels have not resulted in significant increases in nursing home staffing levels.
o The national standard for staffing remains the STRIVE study, calibrated by the federal
Center for Medicare and Medicaid Services to specific RUG categories of need.
o STRIVE staffing targets are the only validated staff performance metric tied directly to
the resident surveys conducted at the facility level, i.e., the MDS.
o STRIVE staffing targets were the basis for both RUGs and PDPM pricing indices.
• HFS recommends pairing the adoption of the STRIVE-based PDPM pricing system with a
substantial STRIVE-related nurse staffing payment incentive that would
o Directly link facility reporting of resident care needs (on the MDS) to both STRIVE-based
staffing incentives and STRIVE-based direct care payments
o Enable stepwise increases in staffing by establishing the first incentive tier at just 80% of
the national STRIVE target in order to facilitate timely and proportionate support for
nursing home owners as they invest in new staff

71 | P a g e
o Address the CNA shortage, which is the principle supply constraint complicating facility
compliance with IDPH minimum staffing regulations [see separate CNA staffing policy
recommendations in the next section]
o Reward both sufficient and sustained levels of staffing
o Align Medicaid payment for staffing to the same determination of patient need as is
used for Medicaid billing by the facilities, e.g., MDS-driven RUGs categories, which also
serve as the building blocks for PDPM classifications.
Recommendation
Nurse Staffing Incentive Payments ($224M). Establish an ongoing nurse staffing improvement applied
to the direct care component and distributed as a rising per diem amount corresponding to facility
performance v. national STRIVE targets.
1. The incentive is a fixed dollar add-on to the direct care component of the nursing per diem.
2. The per diem would start at $6 per Medicaid resident day (PMRD) for facilities with at least 80%
of the STRIVE staffing target, and would increase by an additional $6 at each of the following
tiers
a. $6 PMRD Between 80% and 91.99% of STRIVE
b. $12 PMRD Between 92% and 99.9% of STRIVE
c. $18 PMRD Between 100% and 109.9% of STRIVE
d. $24 PMRD Between 110% and 124.9% of STRIVE
e. $30 PMRD At or above 125% of STRIVE
3. Data used to determine staffing levels
a. Performance v. STRIVE would rely on the same detailed staffing records NFs submit to
Medicare and that are now being used by IDPH to help determine compliance with
minimum staffing regulations: Medicare’s payroll-based journal (PBJ) system
b. Calculations would mimic Medicare’s calculation of STRIVE-based nurse staffing levels
for publication on its COMPARE website and as used in Medicare’s STAR staffing ratings
i. STRIVE targets incorporate nursing staff only, including RNs, LPNs and CNAs.
ii. Hours for all qualified nursing staff are included in the calculation of facility
performance v. STRIVE targets, regardless of employment status, i.e., contract v.
employee. Staff hours would be included if also used in the calculation of STRIVE
targets.
1. Would include directors of nursing time if spent on direct patient care
2. Not therapists and other non-nurse direct care
c. Medicare publishes the PBJ and calculates STRIVE-based staffing levels four months
after the end of any given quarter.
i. HFS anticipates updating NF staffing performance on a two-quarter lag at least
twice a year for purposes of establishing the appropriate per diem tier.
ii. As a point of reference, HFS already updates its acuity-based payments with a
two-quarter lag using MDS survey results.

72 | P a g e
IV. Transform the CNA Payscale and Fully Fund Training Subsidies
Background • Findings above identify CNAs as the key source of Illinois’ last-placed ranking in nurse staffing
levels nationally. • HFS recognizes both the disproportionate share of understaffing borne by Medicaid-funded NF
residents and Medicaid’s leading role in the employment of CNAs across the state, which leaves Medicaid in a pivotal position to drive increased training and employment of CNAs in the state’s nursing facilities.
• Medicaid is the leading purchaser of services from nursing facilities, which are the leading employers of CNAs in the state:
o Comparing BLS employment statistics with HFS cost report records, HFS estimates that nursing facilities employ half of the state’s practicing CNAs (50%).
o Medicaid accounts for more than 60% of Illinois’ NF residents o Medicaid’s CNA reforms may have the greatest impact where needed most — among
high Medicaid-utilizing nursing homes. • Hiring and training of new CNAs is a constant need, costly, and could inhibit resident care
o CNAs must be trained, including meaningful uncompensated classroom time (minimum of 80 hours and three weeks classroom; 40 hours clinical). This carries substantial costs in the form of foregone wages.
o NFs are already obligated to reimburse CNAs for Medicaid’s share of previous educational expenses, but this may leave many CNAs with potential large unreimbursed costs, and may leave other prospective CNAs with a level of uncertainty that could help deter their enrollment in a training program
▪ For a potential CNA trainee who earns $14/hour in their current job, the full costs of training would include:
• Four weeks of lost wages at $14/hour during CNA training, totaling $2,240.
• Unreimbursed CNA training costs that often approach $1,000 in a facility not taking full advantage of Medicaid’s existing training subsidy program or in a low-Medicaid facility where Medicaid’s subsidy covers half or less of the CNA course
• The full economic costs of CNA training could easily exceed $3,000 for a typical trainee, limiting the attractiveness of the CNA role except as a temporary stepping stone for those seeking higher level positions in nursing or other health professions.
• Apart from a signing bonus, even with a CNA position paying $2/hour more (i.e., a $16/hour starting wage) it would take more than half a year – 1,120 hours of CNA work – to break even on just the lost wages during CNA training, and another three months for potentially-unreimbursed CNA course costs.
o The Illinois Department of Public Health has a total of 363 CNA training programs, 25% of which are facility-based, e.g., NFs that provide the full CNA training/classroom in-house. Also among these training programs are “resident attendant” programs for, as an example, feeding only, which typically pays minimum wage but doesn’t count towards staffing requirements.

73 | P a g e
• Reducing CNA turnover is key to addressing the state’s under-staffing crisis o High turnover combines with low CNA-to-patient staffing ratios to weaken continuity in
resident assignments in under-staffed facilities. o CNA is an entry-level position heavy on manual labor with inherently high turnover. This
won’t change. o While available data does not support a direct measure of staff turnover, HFS is
concerned that Medicaid-funded residents are most likely to reside in facilities considered to be temporary destinations by new CNAs. The least desirable facilities to work in as a CNA likely bear a disproportionate burden for overall CNA turnover, and – if they are like similarly-positioned hospitals – provide disproportionately more jobs for the newest CNAs, giving those CNAs on-the-job training they can then use to compete for jobs in nursing facilities with less demanding circumstances.
o The state licenses about 14,000 new CNAs each year, and before the pandemic began there were about 60,000 practicing CNAs in the state9. This implies relatively high professional attrition rates at least for the first year or two of service for CNAs --as also reported anecdotally—if annual retention increases thereafter. Under such reasonable assumptions new CNAs could only represent as much as one quarter of the workforce, illustrating the critical role that CNA retention plays in addressing the state’s COVID-19-induced staffing shortage as well as the longstanding Medicaid-related understaffing crisis. One recent study using national Medicare data measures turnover at the level of nursing facility is substantially higher than turnover in and out of the profession, and that facility staff turnover is highly correlated with nursing home quality. 10
o While the minimum wage in Illinois was already on its way up to $15/hour before the pandemic, evidence presented in the findings above indicates that many NFs had already raised average CNA pay above that level in 2020, especially in the Chicago area, and anecdotal reports suggest this trend continued well into 2021. There are also reports of very substantial signing bonuses – far exceeding CNA training costs – as well as very meaningful increases in hourly rates paid to employment agencies for non-employee CNAs. This indicates substantial and increasingly costly competition between NFs for a limited pool of CNAs.
9 Source: US Bureau of Labor Statistics May Occupational Employment Survey, multiple years 10 Ashvin Gandhi, Huizi Yu, and David C. Grabowski “High Nursing Staff Turnover In Nursing Homes Offers Important Quality Information” Health Affairs 40:3 March 2021

74 | P a g e
o HFS’ recommendations are intended to help increase NF staffing levels (in understaffed facilities) above pre-COVID-19 levels. To achieve this, HFS anticipates the need to elevate the CNA job into a more sustainable and financially attractive career.
o While HFS’ recommendations also include additional training/educational subsidies, HFS’ focus and most of the new funding would be directed towards substantial increases in the pay scale for CNA tenure and promotion. This new funding is intended to leverage Medicaid’s leading role in the market for CNA employment, which is concentrated in higher-Medicaid facilities, in order to:
• Motivate increased interest in CNA training over the long run • Send a strong and immediate signal to the tenured CNA workforce that their
loyalty to the profession --and to nursing facility employment in particular -- will be met with future pay increases
• Pay nearly the full cost of CNA training, tenure and promotion in high-Medicaid nursing facilities (full costs for 100% Medicaid homes), whose residents currently suffer the lowest level of staffing.
Recommendations
To help offset permanent labor market losses due to the pandemic and increase the number of newly trained CNAs: Enhance CNA training subsidies ($5M)
1. Medicaid would increase the subsidy for training costs and on the job wages that it already offers as a pass-through to CNAs working in nursing facilities.
a. Re-interpreting the federal regulation for ‘pro rata’ reimbursement to mean the % of CNA’s first year spent at new employer, rather than Medicaid’s share of that cost.
b. These expenditures appear eligible for at least 50% federal funding as a Medicaid administrative expense.

75 | P a g e
c. Remaining funds could be used to i. Partner with institutions or other organizations to subsidize training directly,
e.g., using Medicaid administrative matching funds ii. Establish temporary or permanent scholarship fund with direct grants for
CNA trainees (like this one for RNs -https://www.dph.illinois.gov/topics-services/life-stages-populations/rural-underserved-populations/nursing-education-scholarship-program) using other funding sources (which removes facilities as middlemen)
iii. HFS would approach federal CMS to address applicability of Medicaid administrative matching funds at 50% federal share for use in these broader educational efforts.
Pay scales for CNA promotion ($5M) and tenure ($75M)
2. Tenure pay scale. Medicaid would pay for its share of posted and observed retention- and promotion-based wage increments for CNAs, including:
a. Pure retention bonus pay to CNAs with increasing tenure equivalent to, e.g.: i. +$1.50/hour for 1+ year ii. +$1.00/hour for each additional year to a max of $6.50 for 6+ years
iii. Could be paid annually, e.g., pro-rated end of year lump sum b. Work with industry and stakeholders to consider alternative approaches at
same or similar scale if they do not diminish Medicaid’s impact on overall the CNA workforce within nursing facilities and across work settings.
c. These increases could increase average CNA pay as much as $3/hour overall – but are focused on years 2 and later of a CNA’s career. At 2,000 hours per year, this represents annual pay increases of $6,000 per worker.
3. Promotion pay scale: Quality-adjusted add-on for a 10-15% subset of CNAs assigned intermediate, specialized or added roles such as CNA trainers, CNA scheduling ‘captains,’ and CNA specialists for resident conditions like dementia/memory care, behavioral health, etc.
a. Retention bonuses attached to specific roles would be comparable to the average tenure bonus of $3/hour for designated CNAs, and would be stacked on top of the tenure pay scale for CNAs, just as they are for civil servant and public school teachers, e.g., annual “steps” v. job-based “grades.”
b. For example, IDPH's LTC facility requirements include heightened CNA training requirements for CNAs working with specific populations, including at least those working with residents with dementia (https://www.ilga.gov/commission/jcar/admincode/077/077003000U70500R.html) and those working with residents with SMI (https://www.ilga.gov/commission/jcar/admincode/077/077003000S40900R.html)
c. Work with industry and stakeholders to consider alternative approaches at same or similar scale if they do not diminish Medicaid’s impact on overall the CNA workforce within nursing facilities and across work settings.
Note: For facilities already paying some level of additional wages for tenure and promotion, HFS’ proposed payments would serve as an additional subsidy to the facilities not countable in the rate modeling presented below.

76 | P a g e
V. Quality Improvement Incentive Payments
Background Of the federally published COMPARE website’s 22 long- and short-stay quality measures, Illinois
currently ranks:
• in the bottom twenty states for nearly two-thirds (n=14) of these measures • in the bottom ten states for 40% (n=9) of these measures
• last (51st) for 14% (n=3) of these measures HFS’ Medicaid Quality Strategy submitted to federal CMS in March 2021 is built on the following four objectives
• Our transformation puts a strong new focus on equity; prevention and public health; • Pays for value and outcomes rather than volume and services; • Proactively uses analytics and data to drive decisions and address health disparities; and • Works to keep individuals in the least restrictive environment and to keep them more closely
connected with families and communities. While many other states have deployed quality improvement incentives in their Medicaid nursing facility payments, Illinois currently has two unfunded quality incentives in rule that were agreed to years ago to encourage staff retention as well as continuity of staff assignments to the same residents. The federal Centers for Medicare and Medicaid Services collects and publishes nursing facility quality information, which could be used for quality-based payments in Illinois.
• CMS collects and reports a range of nursing home quality data and recently launched a very limited value-based payment program.
• Legislation passed in 2014 requires post-acute care providers (including NFs) to submit standardized quality data.
• Data are submitted through the Minimum Data Set (MDS) and Medicare fee-for-service claims data.
• Data are used to calculate quality measures for the NF Quality Reporting Program which are then publicly reported on the Nursing Home Compare website, divided into short-stay (100 days or less) and long-stay quality measures (more than 101 days).
Recommendation Quality incentive payments ($100M). Quality payments would launch alongside other rate reforms using the most recent available data.
1. Payments could be made on a per diem basis, updated semi-annually, and would increase meaningfully with facility performance. For incentives tied to Medicare STAR ratings, as with the Long Stay STAR recommended for initial use, per diem quality add-ons would begin with a STAR rating of 2 and increase with each additional STAR.

77 | P a g e
2. After nearly a year’s consideration through the NF reform stakeholder group, and meaningful feedback from provider associations, HFS recommends initial use of the Medicare STAR rating for long stays, reflecting both Medicaid’s role as the dominant payor for nursing facilities’ longest stays and the maturity of the long stay STAR rating itself. As described in the Results section above, the long-stay 5-STAR rating is a composite index built on individual metrics and weighted according to perceived contribution to overall quality for long-stay residents. Given the long-standing collection of the long stay STAR rating and its component metrics, the distribution of scores across nursing facilities with different geographic and resident characteristics is well-understood and should enable ongoing analysis of performance and remaining opportunities for improvement.
3. For incentives tied to STAR ratings HFS recommends allocation of available funding according to a quality points system:
a. 0-1 Long Stay STARs 0 points b. 2 Long Stay STARs .75 points (e.g., appr. $2.96 per diem) c. 3 Long Stay STARs 1.5 points (e.g., appr. $5.92 per diem) d. 4 Long Stay STARs 2.5 points (e.g., appr. $9.86 per diem) e. 5 Long Stay STARs 3.5 points (e.g., appr. $13.81 per diem)
4. A nursing facility’s share of statewide quality incentive payments would equal its proportion of total statewide quality-points-weighted Medicaid resident days.
a. A facility’s quality-points-weighted Medicaid resident days are simply their number of Medicaid resident days times the appropriate number of points from the schedule above.
b. Based on 2020 resident counts and nursing facility STAR ratings for the first quarter of 2021, these payments would average approximately $7 per Medicaid resident day and would range from $2.96 per diem for 2-STAR (Long Stay) facilities to $13.81 per diem for 5-STAR facilities.
5. Data to be used for the quality incentive program would be specific to each metric. a. Long Stay STARs are published by Medicare four months after the end of a quarter. b. HFS anticipates updating quality incentive payments on a two-quarter lag at least twice
a year for purposes of establishing the appropriate quality-points-weighted per diem. 6. Principles for the management of a dynamic quality improvement program would include:
a. Quality metrics would evolve over time to reflect state performance priorities, but also allowing nursing facilities sufficient time to respond to the quality incentive and recoup anticipated investments for improved resident outcomes and quality of life.
b. Begin with more mature metrics that have well understood score distributions to reduce initial uncertainty over the impact of the full package of rate reforms
c. Include newer metrics over time to capture Medicaid program priorities, including: i. Staffing continuity ii. Staffing turnover
d. Update targeted measures and overall weights annually as with the Medicaid Managed Care program
e. Maintain a level of continuity to offer facilities meaningful gain from their QI investments
f. Publish annual report on NF performance, including QI metrics

78 | P a g e
g. Match incentives to the nature of measurement associated with each metric i. Potentially adjust quality awards for nationally normed metrics to reflect
improvement in state v. national performance (to reward well-performing but low-ranking NFs)
ii. Using state-normed relative metrics temporarily, e.g., 1. new items where competition is intended 2. shorter, more intensive quality improvement initiatives associated with
known performance gaps 3. items targeted for statewide improvement across the performance
spectrum 4. potentially adjusting base level rewards to accommodate the zero-sum
nature of ranked performance metrics

79 | P a g e
Attachment 1
Original Objectives and Principles
• Transparent, outcome driven, patient-centered model with increased accountability
• Transition away from RUGS to federal PDPM case-mix nursing component
• Modify the support and capital rate into a set base rate similar to Medicare non-case-mix rate
• End the $1.50 bed fee and increase the occupied bed assessment to create a single assessment
program which maximizes federal revenue
• Directly tie funding/rates/incentives to demonstrable and sustained performance on key quality
reporting metrics
• Documentation to support, review and validation of level of care coding and appropriateness,
outliers, actual patient experiences, etc.
• Align regulation and payment incentives to the same goals
• Ensure appropriate incentives for community placement, including both uniform and MCO-
specific incentives
• Recalibrate/rethink payment for nursing home infrastructure to support emerging vision for the
industry in the wake of the COVID-19 crisis, including single-occupancy rooms, certified facilities
• Integrate emerging lessons and federal reforms related to the COVID pandemic
• Improved cooperation, support and follow up, data sharing and cross-agency training from
other agencies (OIG, IDPH, DoA)
• Build in flexibility to evolve as the industry evolves and establish ongoing channels of
communication for new, proposed, or upcoming changes

80 | P a g e
Attachment 2
Legal Authority
Sec. 5-2.09. Enhanced federal medical assistance percentage. In accordance with Section 9817 of the American
Rescue Plan Act of 2021 (Pub. L. 117-2) and corresponding federal guidance, the Department of Healthcare and Family Services shall take appropriate actions to claim an enhanced federal medical assistance percentage (FMAP)
provided by Section 9817 of the American Rescue Plan Act of 2021 with respect to expenditures under the State medical assistance program for home and community-based services from April 1, 2021 through March 31, 2022. The Department is authorized to use State funds equivalent to the amount of federal funds attributable to the
increased federal medical assistance percentage under Section 9817 of the American Rescue Plan Act of 2021 to implement or supplement the implementation of activities to enhance, expand, or strengthen home and
community based services under the State's medical assistance program to the extent permitted by and aligned with the goals of Section 9817 of the American Rescue Plan Act of 2021 through March 31, 2024 or any revised
deadline established by the federal government. The use of such funds is subject to compliance with applicable federal requirements and federal approval, including the approval of any necessary State Plan Amendments,
Waiver Amendments, or other federally required documents or assurances. The Department may adopt rules as necessary, including emergency rules as authorized by Section 5-45 of the Illinois Administrative Procedure Act, to
implement the provisions of this Section.
Sec. 5-2.10. Increased accountability for nursing facilities. The Department shall develop a plan for the
revitalization of nursing homes licensed under the Nursing Home Care Act and shall report to the Governor and the General Assembly on a recommended course of action, including, but not limited to, the following:
(1) significantly increasing federal funds by streamlining and raising the nursing home provider assessment on occupied beds;
(2) improving payments through increased funding and providing additional incentives for staffing, quality metrics
and infection control measures; and
(3) transitioning the methodologies for reimbursement of nursing services as provided under this Article to the
Patient Driven Payment Model (PDPM) developed by the federal Centers for Medicare and Medicaid Services.
No later than September 30, 2021, the Department shall submit a report to the Governor and the General
Assembly, which outlines the steps taken by the Department, including discussions with interested stakeholders and industry representatives, and recommendations for further action by the General Assembly to provide for
accountability and to achieve the program objectives outlined in this Section, which shall require action by the General Assembly.

81 | P a g e
Attachment 3
Spring/Summer '21 September '21 Spring/Summer '21 September '21 Spring/Summer '21 September '21
Tax
Max 6% @ projected base (~$239M).
Stratified rates based on Medicaid
utilization: concave shape. $8 <5,000
days, $23.87 @5,001-64,999 days , $17
>65,000 days
Max 6% @ projected base ($239M).
Stratified by Medicaid util. Concave:
peak mid-range.
Max 6% @ projected base ($239M).
Stratified by Medicaid util. Concave:
peak mid-range.
Max 6%. Consider Stratified by Medicaid
util. Peak mid-range.
Base Rate ($85.25)
PDPM
Requested additIonal information from
the dept to evaluate PDPM case mix for
facility specific effects to determine any
necessary changes needed to the
Medicare model.
RUGs
Wage adjuster
Staffing add-on ($4.55)Retain $70M or shift to CNA quality
amount (pay scale/compensation)redirect $70m +$4m SF
Quality Staffing add on $30M Add-on
paid to facilities whose actual hours are
equal or greater than 80% of their CMI
expected staffing hours to include all
categories of direct care staffing under
NHCA and Corresponding rules
Tiered per diem: $6, $9 @92% and 107%
but willing to match HFS -- Adds $46M
Multiplier 6%, 9%, 12% @ 92%, 100%,
107% STRIVE.
"Scrape"
Considering an amount to cover linked
supportive living rate increase (SS #12-
15M)
Consider an amount to cover linked
supportive living rate increase (SS #12-
15M)
Targeted Quality
Improvements -- CNA
specific
Considering use of $4.55 for this
purpose.
Also direct funding towards daily rate for
Medicaid portion of nursing hours, e.g.,
equivalent to ~$2+/hour
$70m for pay scale and training/ with
flexibility
CNA Metrics ?? ?? staffing levels, training & tenure
Other Quality Amount
$30m for QMs plus $25M for Infection
Control, the latter to be distributed per
mediciad day to cover infection
preventionist wages, infection control
education, PPE and and Sanitation
supplies.
$55m QMs and $59M flat infection
control$100M negotiable
Other Quality Metrics
$30 M Overall QM stars 2-5, addons
2=$.75, 3=$1.5, 4=$2.5, 5=$3.75 per
medicaid day
QMs, RN staffing stars 2-5, total nursing
staffing stars 2-5. Not inspections
QMs, RN staffing stars 2-5, total nursing
staffing stars 2-5. Not inspections.
Consider balancing with short stay or
overall STAR rating.
Specific star categories (not overall star)
Staffing stars (this is covered
exhaustively elswhere so depends), Not
inspections.
Next StepsAssumes will re-evaluate after
pandemic
Set quality for year 1, convene regular
conversations to adjust quality and
implement
Set quality for year 1, convene regular
conversations to adjust quality and
implement
Set quality for year 1, convene regular
conversations to adjust quality and
implement
Legend
Agreement with HFS' position (time dependent)
Agreement with HFS in concept: details to follow
Potential agreement with HFS in concept: details/confirmation needed
Alternative proposal, or unclear level of agreement
Disagreement with HFS
IHCA/LAI Petersen HCCI

82 | P a g e
Attachment 4
HFS’ NF rate reform and assessment model is based on the following data:
• All Payor CMI (for cost normalization) - Q3 2017 - Q4 2019 • Medicaid CMI : (PDPM and RUG) – Q2 2021 preliminary MDS records (data through 8/2/2021)
• Special Population Add-on Resident Counts – Q2 2021 preliminary MDS records (data through 8/2/2021)
• Regional Wage Adjustment Factors: Current values
• Medicaid Days: 10/1/2019 – 9/30/2020 Medicaid days (dates of service) PLUS estimate of Medicaid % of MMAI Days for same period.
• 2018/2019 Medicare Cost Reports o Gross Revenue
▪ SNF/NF Routine Revenue – Wrksht G-2 ▪ Total SNF/NF Ancillary Revenue (Prorated) – Wrksht G-2
• Revenues prorated on basis of routine SNF/NF revenue to total revenue o Contractual Adjustments
▪ SNF/NF Contractual Revenue (Prorated) – Wrksht G-3 • Contractuals prorated on basis of SNF/NF(ICF) routine and ancillary
revenue to total revenue o Expenses
▪ SNF/NF Routine Cost – B part I ▪ SNF/NF Ancillary Cost (Prorated) – B part I
• Utilized SNF/NF revenue proration factor to more closely align with traditional Medicare costing mechanics
• 2019/2018 Medicaid Cost Reports if Medicare CRs were not present within HCRIS dataset (~30 providers)
o Net Income (page 19) o Adjustments to Net Income:
▪ Owner’s Compensation (page 7) ▪ Related Party Adjustments (page 5) ▪ Allowable cost adjustment (page 5)