Embed Size (px)
Citation preview

A Comprehensive Framework for Life-Cycle Cost Assessment of Reinforced Concrete Bridge Decks
Project No. 18STOKS02
Lead University: Oklahoma State University
Final Report
August 2019

i
Disclaimer
The contents of this report reflect the views of the authors, who are responsible for the facts and the accuracy of the information presented herein. This document is disseminated in the interest of information exchange. The report is funded, partially or entirely, by a grant from the U.S. Department of Transportation’s University Transportation Centers Program. However, the U.S. Government assumes no liability for the contents or use thereof.
Acknowledgements
The authors thank Ms. Rebecca Dempewolf for conducting the data collection necessary for this project. They also thank the departments of transportation of Texas, New Mexico, Arkansas, and Louisiana for providing their valuable input on the adopted deck construction and maintenance practices.

ii
TECHNICAL DOCUMENTATION PAGE 1. Project No. 18STOKS02
2. Government Accession No.
3. Recipient’s Catalog No.
4. Title and Subtitle 5. Report Date Ayg. 2019
A Comprehensive Framework for Life-Cycle Cost Assessment of Reinforced Concrete Bridge Decks
6. Performing Organization Code
7. Author(s) PI: Mohamed Soliman https://orcid.org/0000-0003-3160- 0933 Co-PI: Samir A. Ahmed https://orcid.org/0000-0001-9530-7213 GRA: Ligang Shen https://orcid.org/0000-0002-3175-4484
8. Performing Organization Report No.
9. Performing Organization Name and Address Transportation Consortium of South-Central States (Tran-SET)
10. Work Unit No. (TRAIS)
University Transportation Center for Region 6 3319 Patrick F. Taylor Hall, Louisiana State University, Baton Rouge, LA 70803
11. Contract or Grant No. 69A3551747106
12. Sponsoring Agency Name and Address United States of America Department of Transportation
13. Type of Report and Period Covered Final Research Report Mar. 2018 – Mar. 2019
Research and Innovative Technology Administration 14. Sponsoring Agency Code
15. Supplementary Notes Report uploaded and accessible at Tran-SET's website (http://transet.lsu.edu/). 16. Abstract Various environmental and mechanical stressors cause deterioration of concrete bridge decks. Normal wear and tear, freeze and thaw cycles, and chloride penetration due to deicing salts can cause aggressive deterioration that usually require frequent interventions during the life-cycle of the bridge. These interventions include deck maintenance and repairs (e.g., application of sealers or overlay placement) as well as bridge deck replacement. The quantification of the life-cycle cost of bridge decks considering maintenance and repair activities represents a significant challenge facing local and state transportation agencies. The life-cycle maintenance activities not only increase the direct life-cycle cost of the bridge, but they also lead to significant indirect user costs due to increasing traffic delays, work zone crashes, and operating cost. Moreover, these traffic delays increase the carbon footprint of the bridge and adversely affect the life-cycle bridge sustainability. Accordingly, the proper quantification of indirect costs associated with life-cycle bridge management activities including maintenance, repair, and rehabilitation activities is of paramount importance. The research attempts to fill in the knowledge gaps in quantifying the indirect costs associated with bridge deck maintenance activities and their impact on the overall bridge life-cycle cost.
17. Key Words Bridge deck, corrosion resistance reinforcement, life-cycle cost
18. Distribution Statement No restrictions. This document is available through the National Technical Information Service, Springfield, VA 22161.
19. Security Classif. (of this report) Unclassified
20. Security Classif. (of this page) Unclassified
21. No. of Pages 35
22. Price
Form DOT F 1700.7 (8-72) Reproduction of completed page authorized.
iii
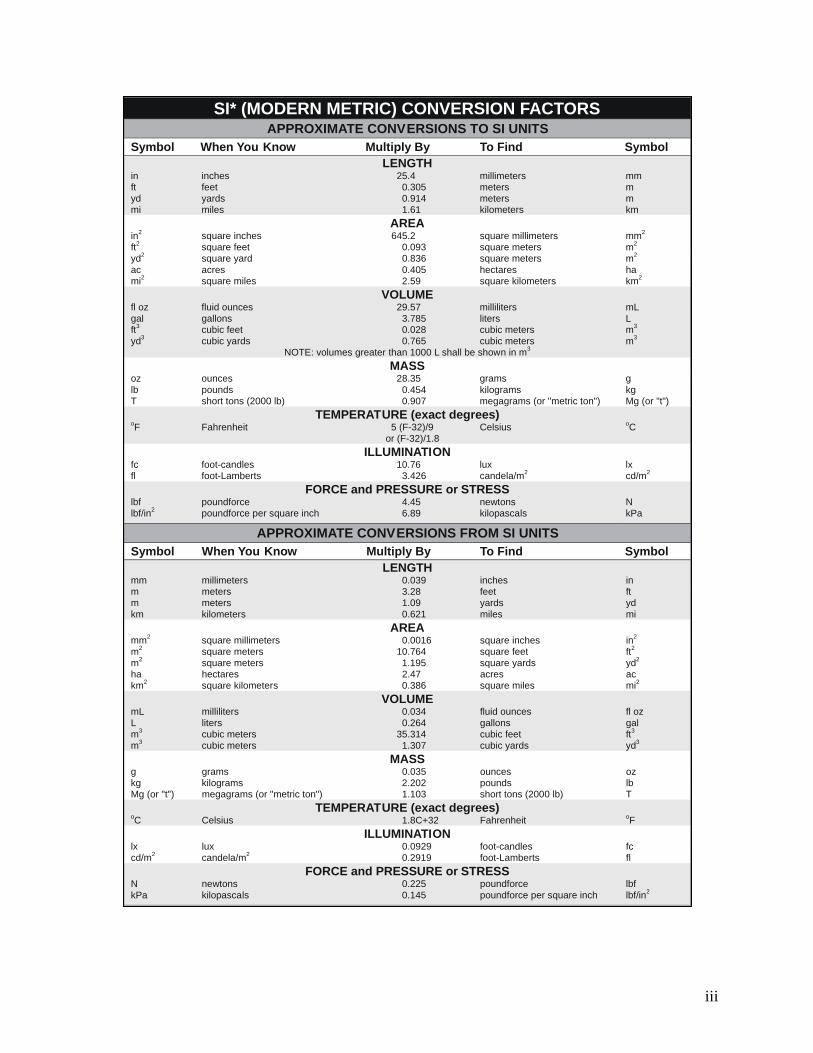
SI* (MODERN METRIC) CONVERSION FACTORS APPROXIMATE CONVERSIONS TO SI UNITS
Symbol When You Know Multiply By To Find Symbol LENGTH
in inches 25.4 millimeters mm ft feet 0.305 meters m yd yards 0.914 meters m mi miles 1.61 kilometers km
AREA in2 square inches 645.2 square millimeters mm2
ft2 square feet 0.093 square meters m2
yd2 square yard 0.836 square meters m2
ac acres 0.405 hectares ha mi2 square miles 2.59 square kilometers km2
VOLUME fl oz fluid ounces 29.57 milliliters mL gal gallons 3.785 liters L ft3 cubic feet 0.028 cubic meters m3
yd3 cubic yards 0.765 cubic meters m3
NOTE: volumes greater than 1000 L shall be shown in m3
MASS oz ounces 28.35 grams glb pounds 0.454 kilograms kgT short tons (2000 lb) 0.907 megagrams (or "metric ton") Mg (or "t")
TEMPERATURE (exact degrees) oF Fahrenheit 5 (F-32)/9 Celsius oC
or (F-32)/1.8 ILLUMINATION
fc foot-candles 10.76 lux lx fl foot-Lamberts 3.426 candela/m2 cd/m2
FORCE and PRESSURE or STRESS lbf poundforce 4.45 newtons N lbf/in2 poundforce per square inch 6.89 kilopascals kPa
APPROXIMATE CONVERSIONS FROM SI UNITS Symbol When You Know Multiply By To Find Symbol
LENGTHmm millimeters 0.039 inches in m meters 3.28 feet ft m meters 1.09 yards yd km kilometers 0.621 miles mi
AREA mm2 square millimeters 0.0016 square inches in2
m2 square meters 10.764 square feet ft2
m2 square meters 1.195 square yards yd2
ha hectares 2.47 acres ac km2 square kilometers 0.386 square miles mi2
VOLUME mL milliliters 0.034 fluid ounces fl oz L liters 0.264 gallons gal m3 cubic meters 35.314 cubic feet ft3
m3 cubic meters 1.307 cubic yards yd3
MASS g grams 0.035 ounces ozkg kilograms 2.202 pounds lbMg (or "t") megagrams (or "metric ton") 1.103 short tons (2000 lb) T
TEMPERATURE (exact degrees) oC Celsius 1.8C+32 Fahrenheit oF
ILLUMINATION lx lux 0.0929 foot-candles fc cd/m2 candela/m2 0.2919 foot-Lamberts fl
FORCE and PRESSURE or STRESS N newtons 0.225 poundforce lbf kPa kilopascals 0.145 poundforce per square inch lbf/in2

iv
TABLE OF CONTENTS
TECHNICAL DOCUMENTATION PAGE .................................................................................. ii
TABLE OF CONTENTS ............................................................................................................... iv
LIST OF FIGURES ....................................................................................................................... vi
LIST OF TABLES ........................................................................................................................ vii
ACRONYMS AND ABBREVIATIONS .................................................................................... viii
EXECUTIVE SUMMARY ........................................................................................................... ix
1. INTRODUCTION ...................................................................................................................... 1
2. OBJECTIVES ............................................................................................................................. 3
3. LITERATURE REVIEW ........................................................................................................... 4
4. METHODOLOGY ..................................................................................................................... 7
4.1. Life-Cycle Cost Analysis ..................................................................................................... 7
4.2. Corrosion-Induced Cracking ................................................................................................ 7
4.2.1. Initiation Period ............................................................................................................ 7
4.2.2. Propagation Period ........................................................................................................ 8
4.2.3. Corrosion-Induced Cracking Time ............................................................................... 9
4.3. Traffic Delay ........................................................................................................................ 9
4.3.1. Traffic Delays due to Reduced Speed ........................................................................... 9
4.3.2. Vehicle Queues Delay ................................................................................................. 10
4.3.3. Traffic Delay per Vehicle ........................................................................................... 11
4.3.4. Traffic Delay Cost ....................................................................................................... 11
4.4. Crash Risk at Work Zone ................................................................................................... 12
4.5. Environmental Influence .................................................................................................... 13
4.6. Life-Cycle Cost Calculation .............................................................................................. 13
4.7. Life-Cycle Cost Analysis Framework ............................................................................... 13
5. ANALYSIS AND FINDINGS ................................................................................................. 15
5.1. Summary of Conducted Survey ......................................................................................... 15
5.1.1. Questionnaire .............................................................................................................. 15
5.1.2. Summary of the Survey Responses ............................................................................. 15

v
5.2. LCCA Framework Example .............................................................................................. 16
5.3. Corrosion Time Analysis ................................................................................................... 17
5.3.1. Corrosion Initiation Period with Different Reinforcement Alternatives .................... 17
5.3.2. Propagation Period Comparison ................................................................................. 18
5.3.3. Corrosion Cracking Time Corresponding to Different Rebar Types .......................... 19
5.4. Traffic Delay Analysis ....................................................................................................... 19
5.5. Crash Risk Analysis ........................................................................................................... 22
5.6. Environmental Influence Cost Analysis ............................................................................ 24
5.7. Life-Cycle Cost of the Bridge Decks ................................................................................. 24
6. CONCLUSIONS....................................................................................................................... 30
REFERENCES ............................................................................................................................. 31

vi
LIST OF FIGURES Figure 1. Concrete cylinder with steel rebar model. ....................................................................... 8
Figure 2. LCCA flowchart of RC bridge decks. ........................................................................... 14
Figure 3. Comparison between corrosion initiation time for different rebar types for (a) B1 and (b) B2. ............................................................................................................................... 18
Figure 4. Comparison of propagation period for different rebar types. ........................................ 19
Figure 5. Corrosion cracking time associated with different rebar types for (a) B1 and (b) B2. . 19
Figure 6. Hourly traffic volume per lane under freeway and work zone conditions. ................... 20
Figure 7. Deceleration, work zone, acceleration, queuing, and total traffic delay within a 24-hour time frame. .................................................................................................................. 21
Figure 8. Probability density function of daily traffic delay cost. ................................................ 22
Figure 9. Probability density function of crash rate within the work zone. .................................. 22
Figure 10. Probability density function of the average crash cost. ............................................... 23
Figure 11. Probability density function of daily crash cost within the work zone. ...................... 24
Figure 12. Life-cycle cost of the deck constructed with conventional black reinforcement for (a) B1 and (b) B2. ............................................................................................................. 25
Figure 13. Life-cycle cost of the deck constructed with galvanized reinforcement for (a) B1 and (b) B2. ......................................................................................................................... 25
Figure 14. Life-cycle cost of the deck constructed with epoxy coated reinforcement for (a) B1 and (b) B2. ......................................................................................................................... 26
Figure 15. Life-cycle cost of the deck constructed with MMFX reinforcement for (a) B1 and (b) B2. ............................................................................................................................... 26
Figure 16. Direct life-cycle cost of deck constructed using different rebar types for (a) B1 and (b) B2. ............................................................................................................................... 27
Figure 17. Traffic delay cost of the deck constructed using different rebar types for (a) B1 and (b) B2. ............................................................................................................................... 27
Figure 18. Crash cost during the life-cycle of the deck constructed using different rebar types for (a) B1 and (b) B2. ....................................................................................................... 28
Figure 19. Total life-cycle cost of the deck constructed using different rebar types for (a) B1 and (b) B2. ......................................................................................................................... 29

vii
LIST OF TABLES Table 1. Data on critical chloride threshold for different rebar types. ............................................ 5
Table 2. Data on current density for different rebar types. ............................................................. 6
Table 3. Statistical parameters of the crash risk model. ............................................................... 12
Table 4. Parameters associated with the investigated case study. ................................................ 16
Table 5. Descriptors of the parameters associated with the corrosion initiation. ......................... 17
Table 6. Descriptors of the corrosion propagation model parameters. ......................................... 18
Table 7. Parameters of variables associated with traffic delay. .................................................... 20
Table 8. Parameters associated with traffic delay cost. ................................................................ 21
Table 9. Observed crashes and human cost with respect to severity level. .................................. 23
Table 10. Adopted parameters associated with the environmental cost. ...................................... 24

viii
ACRONYMS AND ABBREVIATIONS AASHTO American Association of State Highway and Transportation
Officials
ACTs Accelerated Corrosion Tests
ADT Average Daily Traffic
ASCE The American Society of Civil Engineers
FHWA Federal Highway Administration
LCC Life-Cycle Cost
LCCA Life-Cycle Cost Analysis
MMFX Martensitic Microcomposite Formable Steel
PDF Probability Density Function
RC Reinforced Concrete

ix
EXECUTIVE SUMMARY The quantification of the life-cycle cost (LCC) of bridge decks considering maintenance and repair activities and the selection of optimum repair and construction materials from a life-cycle perspective represent a significant challenge to local and state transportation officials. Various environmental and mechanical stressors cause deterioration of concrete bridge decks including freeze/thaw cycles and chloride penetration due to deicing salts or marine environments. These conditions lead to steel reinforcement corrosion, cracking, delamination, and spalling which affect the surface conditions and reduce the safety of the deck. In order to maintain the deck safety above prescribed thresholds, frequent interventions are usually required during the life-cycle of the bridge. The interventions include application of sealers, overlay placement, and complete deck replacement. During these interventions, the bridge may be completely or partially closed to traffic for the duration of the maintenance. In addition to the significant financial resources required to conduct maintenance and repairs, these activities cause traffic disruptions and their associated economic, social, and environmental impacts. The quantification and inclusion of these indirect impacts is required for the proper life-cycle analysis. There is a genuine need for models that can effectively evaluate these impacts and quantify the LCC considering different material alternatives.
This research report addresses these needs by formulating a methodology for quantifying the LCC of reinforced concrete (RC) decks constructed using different reinforcement alternatives. The approach considers the direct and indirect impacts of maintenance and repair activities. Different available maintenance and repair alternatives are included in the LCC modeling to quantify and compare their costs. Various social, economic, and environmental sustainability aspects associated with bridge maintenance are considered in developing the integrated life-cycle cost analysis (LCCA) approach. The indirect life-cycle cost includes the effect of increased travel time, work zone crashes, operating cost, greenhouse gas emissions, and social losses. This report compares different reinforcement materials or coatings based on their long-term performance and maintenance requirements. Several departments of transportation across Region-6 were contacted to collect data on corrosion-related bridge deck interventions, strategies to reduce corrosion deterioration of bridge decks (e.g., deck patching, sealing, and overlays), and the cost associated with these activities. The collected data also include information on the preferred reinforcement type, deck maintenance practices, and traffic control procedures during maintenance/repair activities. Collected data are used to establish a realistic prediction of direct and indirect costs of the bridge deck constructed using a certain reinforcement type. The proposed approach for LCCA employs probabilistic corrosion analysis to quantify the descriptors of the expected service life of decks constructed using different reinforcement alternatives. An approach based on queuing models is used to quantify traffic delays occurring during bridge maintenance activities. Uncertainties in material properties, deterioration rate, and cost of materials and maintenance are included in the proposed approach. Monte Carlo simulation is adopted to establish the LCC profile under uncertainty. These simulations combine probabilistic modeling of corrosion initiation and propagation, maintenance intervals and costs, and traffic disruptions to predict the LCC resulting in identifying the material alternative that minimizes the LCC of the bridge deck.
1
1. INTRODUCTION The American Society of Civil Engineers (ASCE) has identified a grand challenge aiming at enhancing the performance and value of civil infrastructure over their life-cycle. As per the ASCE, this can be achieved by fostering the optimization of infrastructure investments. The implementation of life-cycle cost analysis (LCCA) in infrastructure construction and maintenance projects is necessary to establish this optimization. On another front, the American Association of State Highway and Transportation Officials (AASHTO) developed a transportation asset management roadmap to improve the implementation of asset management methodologies (1). One of the main pillars of this roadmap is to support the implementation of life-cycle cost quantification practices at state, regional, and local levels. Such quantification is essential for proper risk-informed transportation infrastructure life-cycle management practices. In order to address this urgent need, the Federal Highway Administration (FHWA) issued its interim report on using life-cycle planning process to support implementation of asset management techniques (2) in response to the performance-based program introduced in the Moving Ahead for Progress in the 21st Century Act and extended under the Fixing America’s Surface Transportation (FAST). These efforts highlight the role of LCCA in the asset management process and provide general guidance on the steps required to perform such analysis. However, the proper implementation of LCC practices for design and construction of transportation projects still requires significant amount of research before it can be widely implemented in practice. Reinforced concrete (RC) bridges are fundamental components of US transportation system. RC bridges constructed using conventional black reinforcement require regular maintenance and replacements to remedy the deteriorative effects associated with corrosion. Reinforcement manufacturers developed several products that can offer better corrosion resistance than regular steel. Examples include epoxy coated rebar, galvanized reinforcement, and high corrosion resistant steel (e.g., MMFX). The use of corrosion resistance reinforcement will increase the initial cost of the structure but may reduce the maintenance needs along the service life of the bridge, which can lead to a reduction in the life-cycle cost. Accordingly, identifying the steel material with the lowest life-cycle cost requires comprehensive life-cycle analysis which not only considers the initial construction cost, but also the direct and indirect cost of maintenance actions performed along the service life of the bridge.
This report presents an approach that: (a) characterizes the life-cycle maintenance needs and repair intervals associated with bridge decks constructed in FHWA Region-6, (b) develops a systematic methodology for quantifying the impact of bridge maintenance on indirect aspects of the life-cost including the effect of increased travel time, work zone crashes, operating cost, greenhouse gas emissions, and social losses, and (c) compares different steel reinforcement materials (e.g., regular, galvanized, epoxy coated, and MMF) based on their long term performance and maintenance requirements. The life-cycle cost analysis integrates a sustainability assessment that evaluates the carbon footprint of bridge decks constructed using different reinforcement alternatives. Several departments of transportation across FHWA Region-6 were contacted to collect data on corrosion related maintenance/replacement procedures. Data collection covers the strategies adopted by different departments of transportation to reduce corrosion deterioration of bridge decks (i.e., deck patching, sealing, and overlays), the cost associated with these, as well as the application interval of these strategies. The collected data also include information on the reinforcement type and traffic control procedure during maintenance/repair activities.

2
Data from the survey is integrated into the proposed approach for quantifying the life-cycle cost of bridge decks. In addition to direct cost of maintenance and repair activities during the service life, the approach also quantifies the social, economic and environmental impacts of maintenance actions on the LCC arising from traffic disruptions. These impacts include the increased travel time, operating cost, time loss, work zone crashes and fatalities.

3
2. OBJECTIVES The main technical objectives of this research are:
1. Characterize the use of alternative types of deck reinforcement in Region-6 and identify the life-cycle maintenance and repair activities associated with bridge decks constructed using different reinforcement alternatives. Factors to be investigated include reinforcement type and associated maintenance types, durations, intervals, and costs.
2. Formulate a systematic approach for quantifying the impact of bridge maintenance on indirect life-cost for bridges in FHWA Region-6. Investigated indirect impacts will include the social, economic, and environmental effects associated with increased travel time, work zone crashes and fatalities, operating cost and greenhouse gas emissions.
3. Develop a comprehensive life-cycle analysis approach capable of quantifying the LCC associated with different steel reinforcement materials (e.g., regular, galvanized, epoxy coated, and MMFX) under uncertainty. The LCCA will integrate a comprehensive sustainability assessment based on environmental exposure and bridge location.

4
3. LITERATURE REVIEW In a typical bridge system, the deck is the most susceptible component to experience corrosion. Conventional steel reinforcement in RC bridge decks has been shown to have poor corrosion resistance in high chloride environments such as areas exposed to deicing salts and coastal regions (3). This can lead to frequent maintenance or repair activities to keep the performance of the structure above acceptable thresholds (4). In order to extend the service life of bridge decks, corrosion resistant reinforcement such as galvanized rebar (5), epoxy coated rebar (6), and martensitic microcomposite formable steel (MMFX) rebar (7) have been proposed as alternative choices. Despite the higher initial cost associated with several of these alternatives, less subsequent maintenance and lower indirect costs could lead to a more economic bridge from a life-cycle cost perspective. A study by Soliman and Frangopol (8) evaluated the life-cycle cost of a steel bridge using conventional and corrosion-resistant steel. The study shows the advantages of the corrosion-resistant steel in reducing the life-cycle cost of steel bridges. In the past few decades, several studies formulated methodologies for quantifying the LCC of bridge decks considering direct and indirect costs. Eamon et al. (9) conducted a probabilistic study to evaluate the LCC of prestressed bridges constructed using carbon fiber reinforced polymer bars and strands. However, the identification of maintenance needs in these studies was solely based on experience and current practices rather than mechanistic deterioration modelling of performance under corrosion deterioration.
The service life of RC bridge deck employing steel reinforcement is largely influenced by the corrosion cracking time. Corrosion resistant rebar materials generally exhibit different corrosion characteristic compared to conventional rebar. This difference will have a vital influence on the service life and subsequent maintenance activities of RC bridge decks. In this regard, several studies have been conducted to investigate the corrosion performance of different reinforcement alternatives with a main aim of identifying the critical chloride threshold and corrosion rate. A series of accelerated corrosion tests (ACTs) have been established to quantify these parameters within a relatively short experimental time. The basic idea of these ACTs is to expose the specimens to an excessively aggressive environment and quantify the corrosion potential and rate (10). Bench-scale tests including the South Exposure, cracked beam, and ASTM 109 tests, are commonly used and they typically require one to two years to be completed (10). The rapid macrocell test can be executed over the course of 15 weeks (11). Several factors in these tests, such as temperature, moisture content, chloride concentration used, in addition to the specimen configuration and geometry could lead to a large variability in the test outcomes.
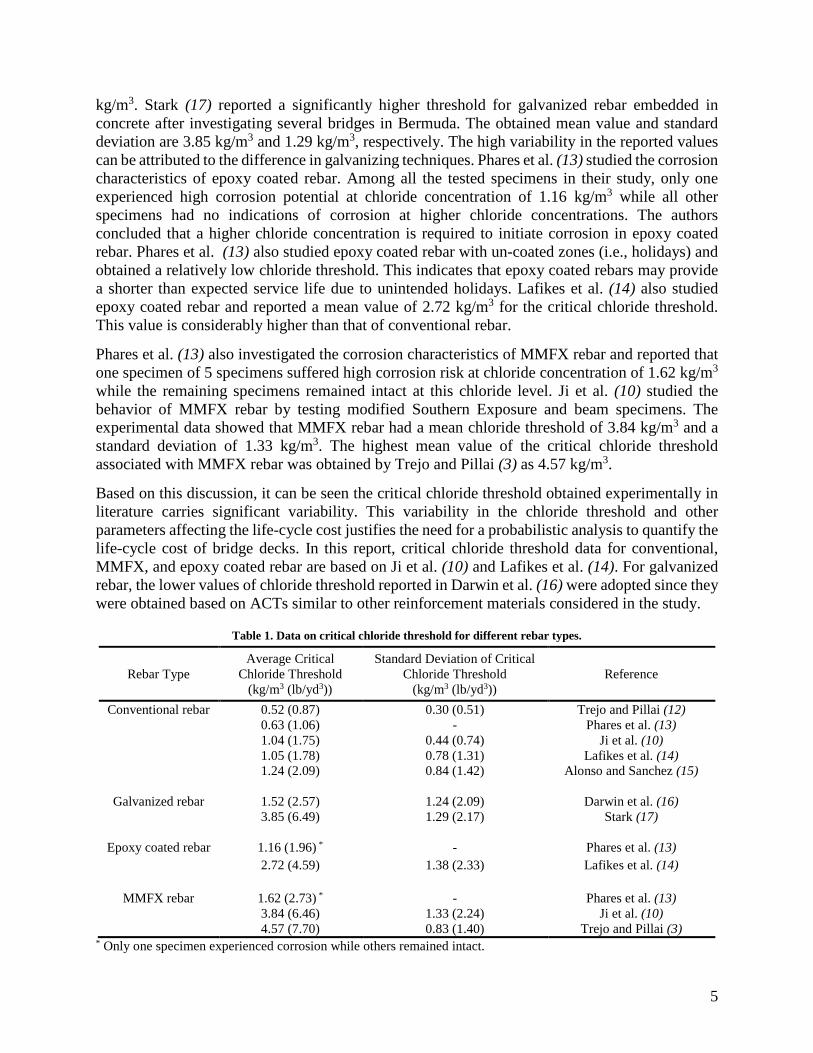
Identifying the critical chloride threshold of reinforcement materials is a main focus of these ACTs. Several experimental studies provide information on the critical chloride threshold of conventional reinforcement. Trejo and Pillai (12) studied conventional reinforcement (i.e., ASTM A615) and reported a critical chloride threshold with a mean value of 0.52 kg/m3 and a standard deviation of 0.30 kg/m3. Phares et al. (13) obtained a very similar mean value of 0.63 kg/m3. However, Ji et al. (10) suggested a higher mean value of 1.04 kg/m3 and a standard deviation of 0.44 kg/m3. Lafikes et al. (14) also reached a very similar mean value of 1.05 kg/m3 with a larger standard deviation of 0.78 kg/m3. Key studies on the identification of critical chloride threshold of different rebar types are summarized in Table 1. Alonso and Sanchez (15) analyzed the variability of published threshold values and obtained a threshold value with a mean value of 1.24 kg/m3 and a standard deviation of 0.84 kg/m3. Darwin et al. (16) conducted a series of ACTs on galvanized rebar and reported a critical chloride threshold with a mean of 1.52 kg/m3 and a standard deviation of 1.24
5
kg/m3. Stark (17) reported a significantly higher threshold for galvanized rebar embedded in concrete after investigating several bridges in Bermuda. The obtained mean value and standard deviation are 3.85 kg/m3 and 1.29 kg/m3, respectively. The high variability in the reported values can be attributed to the difference in galvanizing techniques. Phares et al. (13) studied the corrosion characteristics of epoxy coated rebar. Among all the tested specimens in their study, only one experienced high corrosion potential at chloride concentration of 1.16 kg/m3 while all other specimens had no indications of corrosion at higher chloride concentrations. The authors concluded that a higher chloride concentration is required to initiate corrosion in epoxy coated rebar. Phares et al. (13) also studied epoxy coated rebar with un-coated zones (i.e., holidays) and obtained a relatively low chloride threshold. This indicates that epoxy coated rebars may provide a shorter than expected service life due to unintended holidays. Lafikes et al. (14) also studied epoxy coated rebar and reported a mean value of 2.72 kg/m3 for the critical chloride threshold. This value is considerably higher than that of conventional rebar.
Phares et al. (13) also investigated the corrosion characteristics of MMFX rebar and reported that one specimen of 5 specimens suffered high corrosion risk at chloride concentration of 1.62 kg/m3 while the remaining specimens remained intact at this chloride level. Ji et al. (10) studied the behavior of MMFX rebar by testing modified Southern Exposure and beam specimens. The experimental data showed that MMFX rebar had a mean chloride threshold of 3.84 kg/m3 and a standard deviation of 1.33 kg/m3. The highest mean value of the critical chloride threshold associated with MMFX rebar was obtained by Trejo and Pillai (3) as 4.57 kg/m3.
Based on this discussion, it can be seen the critical chloride threshold obtained experimentally in literature carries significant variability. This variability in the chloride threshold and other parameters affecting the life-cycle cost justifies the need for a probabilistic analysis to quantify the life-cycle cost of bridge decks. In this report, critical chloride threshold data for conventional, MMFX, and epoxy coated rebar are based on Ji et al. (10) and Lafikes et al. (14). For galvanized rebar, the lower values of chloride threshold reported in Darwin et al. (16) were adopted since they were obtained based on ACTs similar to other reinforcement materials considered in the study.
Table 1. Data on critical chloride threshold for different rebar types.
Rebar Type Average Critical
Chloride Threshold (kg/m3 (lb/yd3))
Standard Deviation of Critical Chloride Threshold
(kg/m3 (lb/yd3)) Reference
Conventional rebar 0.52 (0.87) 0.30 (0.51) Trejo and Pillai (12) 0.63 (1.06) - Phares et al. (13) 1.04 (1.75) 0.44 (0.74) Ji et al. (10) 1.05 (1.78) 0.78 (1.31) Lafikes et al. (14) 1.24 (2.09) 0.84 (1.42) Alonso and Sanchez (15)
Galvanized rebar 1.52 (2.57) 1.24 (2.09) Darwin et al. (16) 3.85 (6.49) 1.29 (2.17) Stark (17)
Epoxy coated rebar 1.16 (1.96) * - Phares et al. (13) 2.72 (4.59) 1.38 (2.33) Lafikes et al. (14)
MMFX rebar 1.62 (2.73) * - Phares et al. (13) 3.84 (6.46) 1.33 (2.24) Ji et al. (10) 4.57 (7.70) 0.83 (1.40) Trejo and Pillai (3)
* Only one specimen experienced corrosion while others remained intact.

6
Corrosion rate is another key parameter that governs the service life of RC bridge decks. Current density is commonly used to evaluate the corrosion rate of different rebar types. A lower limit of current density is believed to be 0.1 µA/cm2 which indicates the transition between passive corrosion state and low corrosion state (10). Data on current density of different rebar types reported in literature are summarized in Table 2. Data reported in Ji et al. (10) and Darwin et al. (16) are adopted in this study.
Table 2. Data on current density for different rebar types.
Rebar Type Current Density (µA/cm2) Reference Conventional rebar 0.2431 Ji et al. (10)
0.4 ~ 10 Alonso and Sanchez (15)
Galvanized rebar 0.1288 Darwin et al. (16) 0.2 ~ 1.2 Alonso and Sanchez (15)
Epoxy-coated rebar 0.1509 Ji et al. (10) 0.1 Erdoğdu et al. (18)
MMFX rebar 0.1077 Ji et al. (10) Deteriorated bridge decks require maintenance or repair activities to improve their condition and safety. The traffic flow is disrupted at deck maintenance work zones resulting in delays occurring due to the reduction in traffic capacity and vehicle speed in comparison to other sections of the highway. In addition to the reduced speed, vehicle queues forming at the work zone may lead to considerable delays for transportation network users. The estimation of these traffic delays, which depend on the daily traffic demand and maintenance duration, is essential for quantifying the indirect cost associated with bridge deck maintenance activities. Several tools for estimating traffic delays are available. For example, Quickzone 2.0, can estimate traffic delay and cost due to work zones (19). However, Quickzone does not account for the stochastic nature of traffic flow and may not be able to estimate the queuing under uncongested traffic state (20). Accordingly, a more comprehensive model should be implemented to better predict traffic delays due to work zones.
In this report, the model proposed by Jiang (21) is adopted to predict traffic delays considering the traffic control method implemented during deck maintenance/repair. This model, which is based on queuing theory, can also be implemented in optimizing the work zone lengths to minimize the travel delays (22). After establishing the traffic delays, the time loss cost encountered by the transportation network users can be quantified. Traffic delays also pose an environmental risk due to the increase in the vehicular emissions.
Several studies also reported an increase in the rear-end crash rate at work zone compared to rate under normal traffic conditions (23). Accordingly, traffic disruptions due to RC bridge deck maintenance activities not only lead to an increase in the traffic delays but also the crash risk and its related cost. The model proposed by Meng and Weng (24) is adopted in this report to evaluate the rear-end crash rate at work zone under different traffic patterns. The increased crash rate and the corresponding increase in the indirect life-cycle cost of the bridge deck are considered in this report.

7
4. METHODOLOGY
4.1. Life-Cycle Cost Analysis LCCA provides a mechanism for evaluating the costs related to all aspects of a structure throughout its service life. These costs can be divided into two categories: direct and indirect. The direct cost includes the initial engineering and construction costs, in addition to the cost of maintenance activities (e.g., materials, routine maintenance, repair/patching, rehabilitation and replacement) (25). The indirect cost includes aspects such as economic and social impact of traffic delays on road network users and businesses as well as environmental impact due to increased emissions and pollution resulting from repair activities. These indirect aspects tend to have a vital influence on life-cycle cost (9).
In this report, four main modules are integrated to evaluate the life-cycle cost of RC bridge decks: (a) corrosion time analysis of different rebar types to determine the frequency of maintenance and replacement activities, (b) estimation of traffic delays due to bridge maintenance activities, (c) crash risk analysis for the work zone, and (d) environmental impact of traffic delays arising from bridge interventions.
In this report, a probabilistic framework is established to evaluate the LCC of bridge decks under uncertainty. This framework employs Monte Carlo simulation to evaluate the effect of different reinforcement types on the life-cycle cost of RC bridge decks. The results of this framework can be used to select the most economically efficient materials for RC bridge deck construction from a life-cycle perspective.
4.2. Corrosion-Induced Cracking Corrosion-induced cracking time can provide an indication on the service life of RC bridge decks. The time to corrosion-induced cracking of RC decks can be divided into corrosion initiation and propagation periods (26). These periods depend on the chloride exposure, type of reinforcement, and deck geometry. The quantification of these periods is described in the next subsections.
4.2.1. Initiation Period The corrosion initiation period describes the time required for surface chloride ions to penetrate into the deck and cause the concentration of the ions on the steel rebar surface to reach a critical value, named as critical chloride threshold. Once the chloride ion concentration exceeds this critical value, the steel rebar begins to corrode, and the deck enters the propagation period. The critical chloride threshold is determined by chemical composition of the rebar (27).
Considering the diffusion of chloride ions, the RC is modeled as a concrete cylinder with the steel rebar in its center as shown in Figure 1. Under this assumption, Fick’s second law (28) is adopted to evaluate the corrosion initiation time 𝑇𝑇𝑖𝑖.
Based on Fick’s second law, the chloride concentration at depth x and time t, C(x,t), is given by (29)
𝐶𝐶(𝑥𝑥,𝑡𝑡) = 𝐶𝐶0(1− 𝑒𝑒𝑒𝑒𝑒𝑒( 𝑥𝑥2√𝐷𝐷𝑐𝑐𝑡𝑡
)) [1]
where: C(x,t) = chloride concentration at depth x and time t (kg/m3); 𝐶𝐶0 = surface chloride concentration (kg/m3);

8
𝐷𝐷𝑐𝑐 = apparent diffusion coefficient (mm2/year); 𝑡𝑡 = time of diffusion (years); 𝑥𝑥 = depth at concrete cover (mm); and 𝑒𝑒𝑒𝑒𝑒𝑒 = statistical error function.
Figure 1. Concrete cylinder with steel rebar model.
For a certain reinforcement type, the critical chloride threshold 𝐶𝐶𝑟𝑟 can be determined by accelerated corrosion tests (10). The corrosion initiation period 𝑇𝑇𝑖𝑖, representing the time for the chloride ions to reach this threshold, is given by
𝑇𝑇𝑖𝑖 = 𝐶𝐶2
4𝐷𝐷𝑐𝑐(𝑒𝑒𝑟𝑟𝑒𝑒−1(1−𝐶𝐶𝑟𝑟𝐶𝐶0))2
[2]
where: Ti = time of initiation period (years); C = rebar location from concrete cover surface (mm); and 𝐶𝐶𝑟𝑟 = critical chloride threshold (kg/m3).
4.2.2. Propagation Period The corrosion propagation period represents the time required for the concrete to develop cracks after the steel rebar begins to corrode. The corroded reinforcement will induce expansive pressure on the concrete cover due to volume expansion. Cracks on the surface of the concrete cover occurs when the expansive pressure reaches a critical level. As indicated in El Maaddawy and Soudki (30), a porous zone occurs around the steel rebar; the rust should suffuse this zone before causing pressure on concrete cover.
The crack propagation time can be calculated as
𝑇𝑇𝑐𝑐𝑟𝑟 =𝜌𝜌𝑠𝑠𝑧𝑧𝑧𝑧(2𝐶𝐶𝑓𝑓𝑐𝑐𝑐𝑐𝑘𝑘𝐷𝐷 +𝛿𝛿0)
𝑀𝑀( 1𝛾𝛾𝛾𝛾−1)𝑖𝑖
[3]
where: Tcr = time of propagation period (years); 𝜌𝜌𝑠𝑠 = density of steel (7.85 g/cm3); 𝑧𝑧 = the ionic charge (2 for 𝐹𝐹𝑒𝑒 → 𝐹𝐹𝑒𝑒2+ + 2𝑒𝑒−);

9
F = Faraday’s constant (96,500 As); 𝑒𝑒𝑐𝑐𝑡𝑡 = concrete tensile strength (3.28 MPa); k = hole flexibility; 𝐷𝐷 = diameter of rebar (mm); 𝛿𝛿0 = thickness of porous zone (𝜇𝜇𝜇𝜇); 𝑀𝑀 = atomic mass of iron (56); 𝛽𝛽 = ratio of mass density of rust to mass density of the original steel (0.5); 𝛾𝛾 = ratio of molecular mass of steel to molecular mass of rust; and 𝑖𝑖 = current density (A/cm2).
The hole flexibility, k, is given by:
𝑘𝑘 = (1+𝑣𝑣+∆)(𝐷𝐷+2𝛿𝛿0)(1+𝜑𝜑𝑐𝑐𝑟𝑟)2𝐸𝐸𝑐𝑐
[4]
∆= (𝐷𝐷+2𝛿𝛿0)2
2𝐶𝐶(𝐶𝐶+𝐷𝐷+2𝛿𝛿0) [5]
where: v = Poisson’s ratio of concrete (0.18); ∆ = geometric parameter; 𝜑𝜑𝑐𝑐𝑟𝑟 = concrete creep coefficient (2.35); and 𝐸𝐸𝑐𝑐 = elastic modulus of concrete (24870 MPa).
4.2.3. Corrosion-Induced Cracking Time After estimating the initiation and propagation periods, the corrosion-induced cracking time for a given reinforcement can be calculated as
𝑇𝑇 = 𝑇𝑇𝑖𝑖 + 𝑇𝑇𝑐𝑐𝑟𝑟 [6]
where: T = corrosion-induced cracking time (year).
4.3. Traffic Delay The traffic flow is disrupted and delayed at a work zone due to the reduction in traffic capacity and vehicle speed at the work zone section compared to other sections of the highway. These delays are caused by deceleration of vehicles approaching the work zone, reduced vehicle speed through the work zone, time needed for vehicles to resume freeway speed after exiting the work zone, and vehicle queues formed at the work zone. The model proposed by Jiang (21) is used in this study to predict the traffic delays based on the traffic control method implemented during the deck maintenance.
4.3.1. Traffic Delays due to Reduced Speed When vehicles travel through a work zone, three phases can be identified: deceleration, low-speed, and acceleration phases. Traffic delays associated with these phases have been quantified and included in the proposed approach. The traffic delay due to deceleration is given by (21)
𝑑𝑑𝑑𝑑 = 2𝑠𝑠𝑣𝑣𝑓𝑓−𝑣𝑣𝑧𝑧
− 𝑠𝑠𝑣𝑣𝑓𝑓
[7]
where:
10
dd = deceleration traffic delay (h/per vehicle);𝑠𝑠 = deceleration distance (km); 𝑣𝑣𝑒𝑒 = freeway speed (km/h); and 𝑣𝑣𝑧𝑧 = work zone speed (km/h).
In addition, the reduced speed traffic delays is (21)
𝑑𝑑𝑧𝑧 = 𝐿𝐿𝑣𝑣𝑧𝑧− 𝐿𝐿
𝑣𝑣𝑓𝑓 [8]
where: dz = reduced-speed traffic delay (h/per vehicle); L = length of work zone (km); and vz = speed in the work zone (km/h).
In the acceleration phase, the traffic delay can be computed as (13)
𝑑𝑑𝑎𝑎 = (𝑣𝑣𝑓𝑓−𝑣𝑣𝑧𝑧)2
2𝑎𝑎𝑣𝑣𝑓𝑓 [9]
where: da = acceleration traffic delay (h/per vehicle); and a = average acceleration (km/h2).
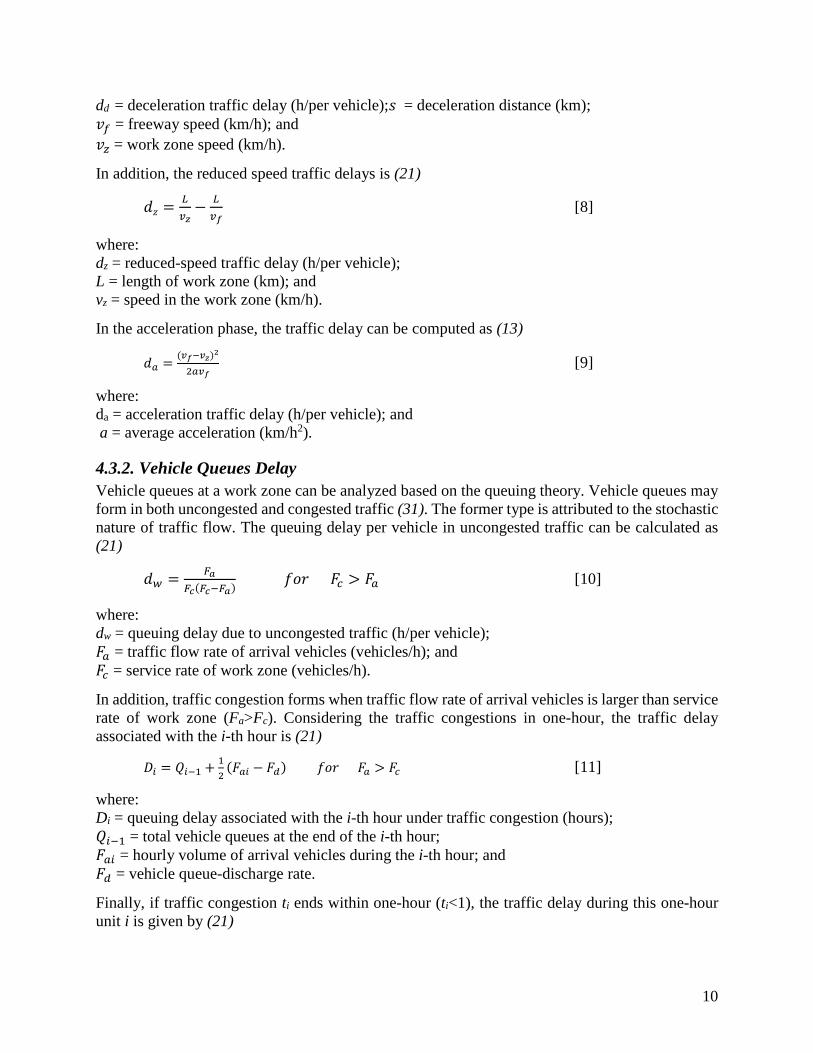
4.3.2. Vehicle Queues Delay Vehicle queues at a work zone can be analyzed based on the queuing theory. Vehicle queues may form in both uncongested and congested traffic (31). The former type is attributed to the stochastic nature of traffic flow. The queuing delay per vehicle in uncongested traffic can be calculated as (21)
𝑑𝑑𝑤𝑤 = 𝑧𝑧𝑎𝑎𝑧𝑧𝑐𝑐(𝑧𝑧𝑐𝑐−𝑧𝑧𝑎𝑎) 𝑒𝑒𝑓𝑓𝑒𝑒 𝐹𝐹𝑐𝑐 > 𝐹𝐹𝑎𝑎 [10]
where: dw = queuing delay due to uncongested traffic (h/per vehicle); 𝐹𝐹𝑎𝑎 = traffic flow rate of arrival vehicles (vehicles/h); and 𝐹𝐹𝑐𝑐 = service rate of work zone (vehicles/h).
In addition, traffic congestion forms when traffic flow rate of arrival vehicles is larger than service rate of work zone (Fa>Fc). Considering the traffic congestions in one-hour, the traffic delay associated with the i-th hour is (21)
𝐷𝐷𝑖𝑖 = 𝑄𝑄𝑖𝑖−1 + 12
(𝐹𝐹𝑎𝑎𝑖𝑖 − 𝐹𝐹𝑑𝑑) 𝑒𝑒𝑓𝑓𝑒𝑒 𝐹𝐹𝑎𝑎 > 𝐹𝐹𝑐𝑐 [11]
where: Di = queuing delay associated with the i-th hour under traffic congestion (hours); 𝑄𝑄𝑖𝑖−1 = total vehicle queues at the end of the i-th hour; 𝐹𝐹𝑎𝑎𝑖𝑖 = hourly volume of arrival vehicles during the i-th hour; and 𝐹𝐹𝑑𝑑 = vehicle queue-discharge rate.
Finally, if traffic congestion ti ends within one-hour (ti<1), the traffic delay during this one-hour unit i is given by (21)

11
𝐷𝐷𝑖𝑖𝑖𝑖 = 𝑄𝑄𝑖𝑖−12
2(𝑧𝑧𝑑𝑑−𝑧𝑧𝑎𝑎𝑖𝑖)+ 𝐹𝐹𝑎𝑎𝑖𝑖(1− 𝑡𝑡𝑖𝑖)𝑑𝑑𝑤𝑤 [12]
where: Dii = queuing delay in the i-th hour when traffic congestion lasts less than one hour (hours); and ti = traffic congestion time in the i-th hour (hour).
4.3.3. Traffic Delay per Vehicle In summary, the total traffic delay per vehicle in the i-th hour under uncongested traffic is given by (21)
𝐷𝐷𝑇𝑇𝑖𝑖 = 𝐹𝐹𝑎𝑎𝑖𝑖(𝑑𝑑𝑑𝑑 + 𝑑𝑑𝑧𝑧 + 𝑑𝑑𝑎𝑎 + 𝑑𝑑𝑤𝑤) [13]
where: DTi = total traffic delay in hour i (h/per vehicle).
Under congested traffic, the total traffic delay per vehicle in the i-th hour is (21)
𝐷𝐷𝑇𝑇𝑖𝑖 = 𝐹𝐹𝑎𝑎𝑖𝑖(𝑑𝑑𝑑𝑑 + 𝑑𝑑𝑧𝑧 + 𝑑𝑑𝑎𝑎) + 𝐷𝐷𝑖𝑖 [14]
The total traffic delay per vehicle in the i-th hour when traffic congestion ends within one-hour 𝑖𝑖 is given by (21)
𝐷𝐷𝑇𝑇𝑖𝑖 = 𝐹𝐹𝑎𝑎𝑖𝑖(𝑑𝑑𝑑𝑑 + 𝑑𝑑𝑧𝑧 + 𝑑𝑑𝑎𝑎) + 𝐷𝐷𝑖𝑖𝑖𝑖 [15]
4.3.4. Traffic Delay Cost Denoting the intervention (i.e., maintenance, repair, or replacement) duration as d (days) and average daily traffic as ADT, the total traffic delay (hours) during the intervention duration is
𝑇𝑇𝑇𝑇 = 𝑑𝑑 × 𝐴𝐴𝐷𝐷𝑇𝑇 × ∑ 𝐷𝐷𝑇𝑇𝑖𝑖24𝑖𝑖=1 [16]
where: TL = total traffic delay during the intervention (hours); d = intervention duration (days); and ADT = average daily traffic (vehicles/day).
The traffic delay cost due to the intervention activity can be estimated as (32)
𝐶𝐶𝑇𝑇𝐿𝐿 = [𝑐𝑐𝑤𝑤𝑂𝑂𝑐𝑐(1− 𝑇𝑇) + (𝑐𝑐𝑐𝑐𝑂𝑂𝑡𝑡 + 𝑐𝑐𝑔𝑔)𝑇𝑇] × 𝑇𝑇𝑇𝑇 [17]
where: CTL = traffic delay cost due to the intervention activity ($); 𝑐𝑐𝑤𝑤 = average wage per hour ($/h); 𝑐𝑐𝑐𝑐 = average compensation per hour for truck drivers ($/h); 𝑐𝑐𝑔𝑔 = time value of the goods transported in a cargo ($/h); 𝑂𝑂𝑐𝑐 = average occupancies for cars; 𝑂𝑂𝑡𝑡 = average occupancies for trucks; and 𝑇𝑇 = ratio of the average daily truck traffic to the average daily traffic.
12
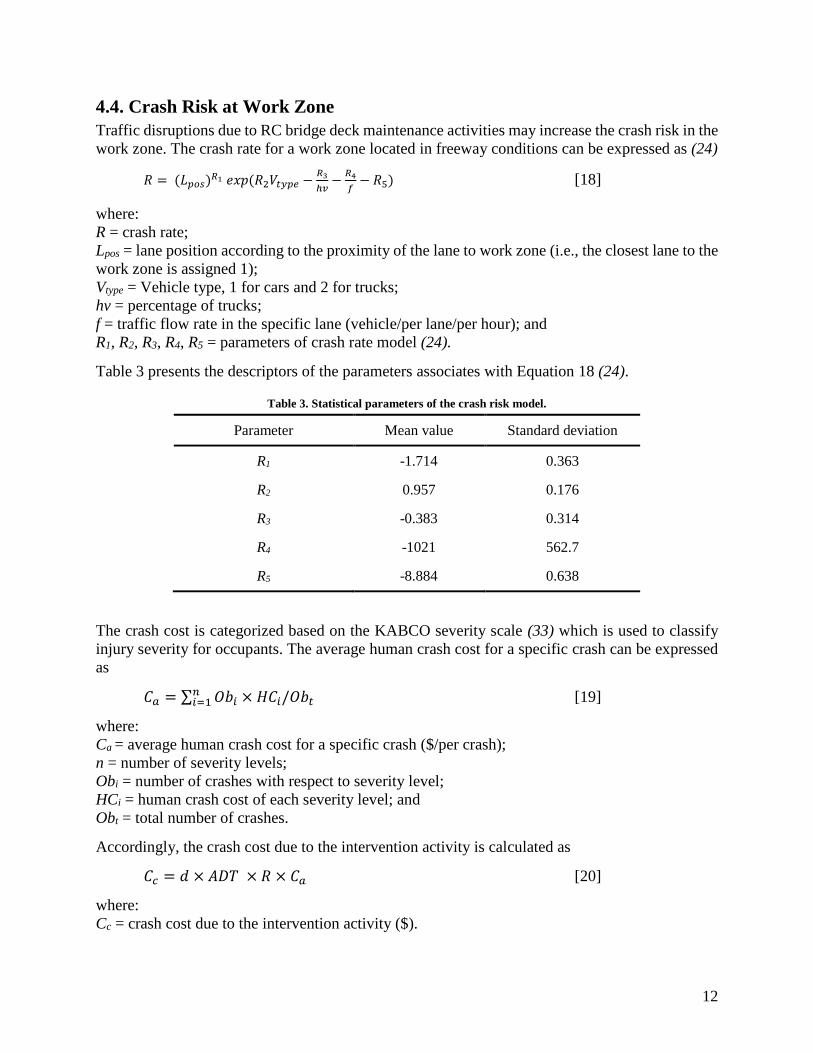
4.4. Crash Risk at Work Zone Traffic disruptions due to RC bridge deck maintenance activities may increase the crash risk in the work zone. The crash rate for a work zone located in freeway conditions can be expressed as (24)
𝑅𝑅 = (𝑇𝑇𝑝𝑝𝑝𝑝𝑠𝑠)𝑅𝑅1 𝑒𝑒𝑥𝑥𝑒𝑒 (𝑅𝑅2𝑉𝑉𝑡𝑡𝑡𝑡𝑝𝑝𝑒𝑒 −𝑅𝑅3ℎ𝑣𝑣− 𝑅𝑅4
𝑒𝑒− 𝑅𝑅5) [18]
where: R = crash rate; Lpos = lane position according to the proximity of the lane to work zone (i.e., the closest lane to the work zone is assigned 1); Vtype = Vehicle type, 1 for cars and 2 for trucks; hv = percentage of trucks; f = traffic flow rate in the specific lane (vehicle/per lane/per hour); and R1, R2, R3, R4, R5 = parameters of crash rate model (24).
Table 3 presents the descriptors of the parameters associates with Equation 18 (24).
Table 3. Statistical parameters of the crash risk model.
Parameter Mean value Standard deviation
R1 -1.714 0.363
R2 0.957 0.176
R3 -0.383 0.314
R4 -1021 562.7
R5 -8.884 0.638
The crash cost is categorized based on the KABCO severity scale (33) which is used to classify injury severity for occupants. The average human crash cost for a specific crash can be expressed as
𝐶𝐶𝑎𝑎 = ∑ 𝑂𝑂𝑂𝑂𝑖𝑖 × 𝐻𝐻𝐶𝐶𝑖𝑖/𝑂𝑂𝑂𝑂𝑡𝑡𝑛𝑛𝑖𝑖=1 [19]
where: Ca = average human crash cost for a specific crash ($/per crash); n = number of severity levels; Obi = number of crashes with respect to severity level; HCi = human crash cost of each severity level; and Obt = total number of crashes.
Accordingly, the crash cost due to the intervention activity is calculated as
𝐶𝐶𝑐𝑐 = 𝑑𝑑 × 𝐴𝐴𝐷𝐷𝑇𝑇 × 𝑅𝑅 × 𝐶𝐶𝑎𝑎 [20]
where: Cc = crash cost due to the intervention activity ($).

13
4.5. Environmental Influence Traffic delay caused by construction and maintenance activities may increase air pollution and accelerate global warming (34, 35). Based on Soliman and Frangopol (8), the increase in emissions E (tons) during the maintenance/repair phase can be estimated as
𝐸𝐸 = 𝐴𝐴𝐷𝐷𝑇𝑇 × 𝑇𝑇 × 𝑑𝑑 × [𝐸𝐸𝐸𝐸𝑑𝑑,𝑐𝑐(1− 𝑇𝑇) + 𝐸𝐸𝐸𝐸𝑑𝑑,𝑡𝑡𝑇𝑇] 𝐸𝐸𝑛𝑛𝑆𝑆𝐷𝐷−𝐸𝐸𝑛𝑛𝑆𝑆𝑆𝑆𝐸𝐸𝑛𝑛𝑆𝑆𝑆𝑆
[21]
where: E = environmental influence due to the construction activity (tons); 𝐸𝐸𝐸𝐸𝑑𝑑,𝑐𝑐 = environmental metric per unit distance for cars, quantified as the carbon dioxide emissions per kilometer (kg/km); 𝐸𝐸𝐸𝐸𝑑𝑑,𝑡𝑡 = environmental metric per unit distance for trucks, quantified as the carbon dioxide emissions per kilometer (kg/km); 𝐸𝐸𝐸𝐸𝑆𝑆𝐷𝐷 = carbon dioxide emissions per kilometer at speeds SD (kg/km); and 𝐸𝐸𝐸𝐸𝑆𝑆𝑆𝑆 = carbon dioxide emissions per kilometer at speeds SO (kg/km).
The costs of carbon dioxide emission can be transferred into monetary value by
𝐶𝐶𝐸𝐸 = 𝐸𝐸 × 𝑐𝑐𝐸𝐸𝑛𝑛𝑣𝑣 [22]
where: CE = environmental influence cost due to the intervention activity ($); and 𝑐𝑐𝐸𝐸𝑛𝑛𝑣𝑣 = cost value of the environmental metric ($/ton).
4.6. Life-Cycle Cost Calculation Based on methodologies in the previous sections, the total life-cycle cost of a structure CT can be expressed as
𝐶𝐶𝑇𝑇 = 𝐶𝐶𝑖𝑖𝑛𝑛𝑖𝑖𝑡𝑡 + ∑ (𝐶𝐶𝑚𝑚𝑎𝑎𝑖𝑖𝑛𝑛 + 𝐶𝐶𝑇𝑇𝐿𝐿𝑖𝑖 + 𝐶𝐶𝑐𝑐𝑖𝑖 + 𝐶𝐶𝐸𝐸𝑖𝑖) ÷ (1 + 𝑒𝑒)𝑡𝑡𝑖𝑖𝑛𝑛𝑖𝑖=1 [23]
where: CT = total life-cycle cost of RC bridge deck ($); Cinit = cost of initiation construction of RC bridge deck ($); n = number of times that maintenance will be performed during the service life; Cmain = maintenance cost of ith maintenance ($); CTLi = traffic delay cost during ith maintenance ($); CEi = environmental influence cost during ith maintenance ($); r = discount rate of money; and yi = number of years used in discounting future costs of ith maintenance.
4.7. Life-Cycle Cost Analysis Framework The framework presented herein can estimate the life-cycle cost of RC bridge decks with respect to the reinforcement type, environmental exposure conditions, and traffic information. Bridge related information including geometry, location, available maintenance activities, and traffic condition, is needed as input parameters of the framework. The geometry of the bridge affects all life-cycle cost aspects while the location determines the environmental exposure condition. The environmental exposure conditions influence the expected service life and maintenance frequency for the investigated bridge. Traffic conditions including the ADT, number of lanes, speed limit,

14
and lane closure plan are needed to estimate the traffic delay cost. Other input parameters include concrete unit cost, reinforcement unit cost, labor cost, and the corrosion properties of the adopted reinforcement type. Once the information is available for the investigated bridge, a probabilistic simulation process is initiated to compute the life-cycle cost under uncertainty. The initial construction cost is calculated based on the bridge geometry and material costs. The corrosion cracking time can be quantified for the specific reinforcement and bridge location. The cracking time will determine the frequency of maintenance activities. Thus, the maintenance cost can be estimated for the entire service life. These two cost aspects (i.e., initial construction and maintenance cost) represent the direct life-cycle cost of the investigated bridge. The indirect costs (i.e., traffic delay, crash risk, and environmental influence) can next be calculated based on the maintenance activities and related traffic, crash and environmental information. The life-cycle cost can then be established for a specific bridge by combining all these costs. Figure 2 shows a flowchart of the proposed framework.
Figure 2. LCCA flowchart of RC bridge decks.
15
5. ANALYSIS AND FINDINGS
5.1. Summary of Conducted Survey A survey of corrosion related maintenance procedures and practices for RC bridge decks in several states across Region-6 was conducted and summarized in this report. Responses were received from the departments of transportation of Texas, Louisiana, New Mexico, and Arkansas. The survey provided essential information on preferred materials, initial construction cost, and adopted maintenance procedures.
5.1.1. Questionnaire The questionnaire consisted of two main sections:
Initial construction:
• What reinforcement types are used in reinforced concrete (RC) bridge deck construction in your state, e.g., black rebar, galvanized rebar, epoxy coated rebar, MMFX, FRP, or stainless steel?
• What is the cost of deck construction using each reinforcement type as a function of deck area?
• What is the typical construction duration for the RC bridge deck as a function of area or span?
Maintenance:
• What are the typical maintenance activities used to extend the life of RC bridge decks, e.g., overlay, or sealants?
• What is the interval of each maintenance activity (on average)? • How long would each maintenance activity take to be performed? • What is the cost associated with each maintenance activity in terms of deck area?
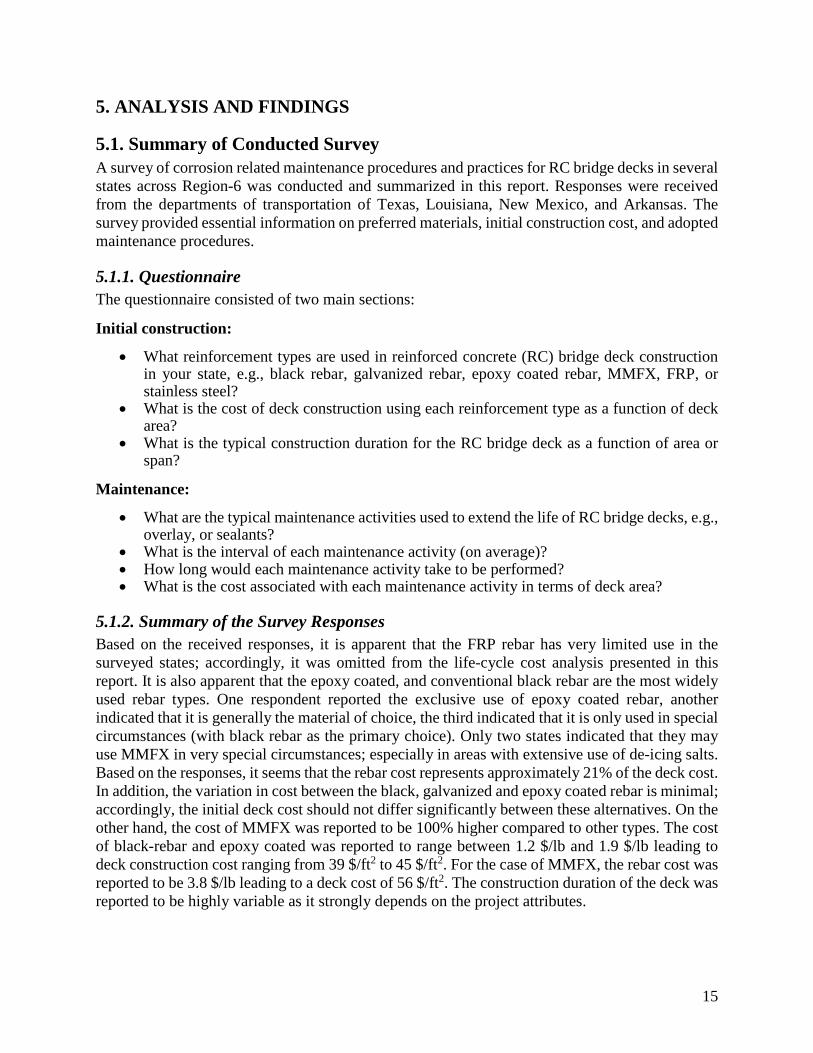
5.1.2. Summary of the Survey Responses Based on the received responses, it is apparent that the FRP rebar has very limited use in the surveyed states; accordingly, it was omitted from the life-cycle cost analysis presented in this report. It is also apparent that the epoxy coated, and conventional black rebar are the most widely used rebar types. One respondent reported the exclusive use of epoxy coated rebar, another indicated that it is generally the material of choice, the third indicated that it is only used in special circumstances (with black rebar as the primary choice). Only two states indicated that they may use MMFX in very special circumstances; especially in areas with extensive use of de-icing salts. Based on the responses, it seems that the rebar cost represents approximately 21% of the deck cost. In addition, the variation in cost between the black, galvanized and epoxy coated rebar is minimal; accordingly, the initial deck cost should not differ significantly between these alternatives. On the other hand, the cost of MMFX was reported to be 100% higher compared to other types. The cost of black-rebar and epoxy coated was reported to range between 1.2 $/lb and 1.9 $/lb leading to deck construction cost ranging from 39 $/ft2 to 45 $/ft2. For the case of MMFX, the rebar cost was reported to be 3.8 $/lb leading to a deck cost of 56 $/ft2. The construction duration of the deck was reported to be highly variable as it strongly depends on the project attributes.

16
With respect to maintenance practices, most departments of transportation follow a similar procedure for maintaining their RC decks. This procedure consists of applying crack sealants every three to five years, followed by using overlays every 10 to 15 years, then hydro-demolition overlay every 20 to 30 years. One respondent indicated washing the bridge deck every one or two years as preventive maintenance. All respondents indicated that deck patching is performed as needed. The washing, patching, or sealing generally takes few hours for application; accordingly, minimal traffic disruptions result during their application. The polymer overlay would require one to two days for application while the hydro-demolition overlay requires 10 days on average to be completed. The cost of deck sealing was reported to range from 15 to 20 $/yard2, polymer overlays range from 40 to 60 $/yard2, while deck replacement ranges from 300 to 400 $/yard2.
5.2. LCCA Framework Example A bridge case study is constructed and analyzed to illustrate the proposed LCCA framework and to investigate the LCC of bridge decks with different reinforcement types and environmental conditions. Two identical bridge are investigated; the first one is assumed to be located under light chloride exposure condition (denoted B1) while the second in aggressive marine environment (denoted B2). B1 represents structures located in Central U.S., while B2 represents bridge decks on the Gulf of Mexico. The bridge is assumed to be a 3-lane freeway bridge with an ADT of 30,000 vehicles per day. The width of the bridge is 12 m (40 ft.), the total length of the bridge is 0.54 km (1760 ft.) and the construction area is 6,500 m2 (70,000 ft2). The material and maintenance costs, in addition to the frequency and durations of maintenance activities are based on the responses from the conducted survey. The sealer application and overlays are considered as the maintenance activities in this case study since they are the most widely used alternatives. The discount rate of money is considered to be 2%. Table 4 summarizes the parameters associated with the investigate case study. This case study covers the (a) corrosion time analysis, (b) traffic delay estimation, (c) quantification of the crash risk, and (d) environmental influence analysis to establish the life-cycle cost of the bridge deck under uncertainty.
Table 4. Parameters associated with the investigated case study.
Parameter Value
Service life 100 years
Length 0.54 km (1760 ft)
Width 12 m (40 ft)
Construction area 6500 m2 (70000 ft2)
Lanes 3
ADT 30,000
Discount rate 2%

17
5.3. Corrosion Time Analysis
5.3.1. Corrosion Initiation Period with Different Reinforcement Alternatives The corrosion initiation period 𝑇𝑇𝑖𝑖 for the RC deck is computed using Equation 2. The variables used to calculate the initiation period are listed in Table 5. The corresponding surface chloride concentration and apparent diffusion coefficient for B1 and B2 are based on field measurements and analysis on bridge decks located in Kansas and Florida, respectively (36). Based on the review of experimental results available in literature, critical chloride thresholds of four reinforcement rebar types (i.e., conventional black rebar, galvanized, epoxy coated, and MMFX) are established. Table 5 shows the descriptors of the corrosion initiation model parameters adopted in this report. Monte Carlo simulation is used in Python environment (37, 38) to draw samples from the probabilistic distribution of the corrosion initiation time for the bridge deck considering the four reinforcement alternatives.
Table 5. Descriptors of the parameters associated with the corrosion initiation.
Variable Mean COV Distribution Type
Surface chloride concentration (B1) 2.2 kg/m3 0.78 Lognormala
Apparent diffusion coefficient (B1) 76.9 mm2/year 1.22 Lognormala
Surface chloride concentration (B2) 3.6 kg/m3 1.06 Lognormala
Apparent diffusion coefficient (B2) 212.9 mm2/year 1.62 Lognormala
Concrete cover depth, x 51 mm 0.20 Lognormal
Critical chloride threshold of black rebar 0.97 kg/m3 0.45 Normalb
Critical chloride threshold of galvanized rebar 1.52 kg/m3 0.82 Normalb
Critical chloride threshold of epoxy coated rebar 2.72 kg/m3 0.51 Normalc
Critical chloride threshold of MMFX 3.76 kg/m3 0.35 Normalb
COV = coefficient of variation; a Weyers et al. (36); b Darwin et al. (16); c Lafikes et al. (14)
Figure 3 shows the probability density functions (PDFs) of the corrosion initiation time associated with the considered reinforcement types for the B1 and B2, respectively. In Figures 3-5, the different rebar types denoted as black, zinc, epoxy, and MMFX refer to conventional, galvanized, epoxy coated, and martensitic microcomposite formable steel, respectively. Simulation results show that for both locations, the deck with black rebar has the shortest corrosion initiation time, galvanized and epoxy coated rebars have a longer initiation time, while the MMFX rebar has the longest corrosion initiation time. These differences can be attributed to the different critical chloride threshold of reinforcement types. Due to the mild chloride exposure conditions, the corrosion initiation periods of the four reinforcement types for B1 are larger than those in B2.

18
(a) (b) Figure 3. Comparison between corrosion initiation time for different rebar types for (a) B1 and (b) B2.
5.3.2. Propagation Period Comparison The corrosion propagation periods 𝑇𝑇𝑐𝑐𝑟𝑟 for the RC deck is next calculated using Equation 3. The descriptors of the corrosion propagation model parameters are presented in Table 6. The corrosion current densities of the different reinforcement types are estimated based on Ji et al. (10) and Darwin et al. (16). Values associated with other environmental conditions can be found in El Maaddawy and Soudki (30). Figure 4 shows the PDFs of propagation time for the deck with the considered reinforcement types. The mean propagation time of corrosion in the deck with black, galvanized, epoxy coated, and MMFX reinforcement is 5.8, 11.0, 9.4, and 13.2 years, respectively.
Table 6. Descriptors of the corrosion propagation model parameters.
Variables Mean Distribution Type
Rebar location from concrete cover surface, C 51 mm Lognormal
Rebar diameter, D 15.5 mm Triangular [15,15.5,16]a
Thickness of porous zone, 𝛿𝛿0 15 𝜇𝜇𝜇𝜇 Triangular [10,15,20]a
Ratio of molecular mass of steel to molecular mass of rust, 𝛾𝛾 0.572 Triangular [0.52, 0.57, 0.62]a
Corrosion current density of black rebar 0.2431(µA/cm2)b deterministic
Corrosion current density of galvanized rebar 0.1288(µA/cm2)c deterministic
Corrosion current density of epoxy coated rebar 0.1509(µA/cm2)b deterministic
Corrosion current density of MMFX rebar 0.1077(µA/cm2)b deterministic a El Maaddawy and Soudki (30); b Ji et al. (10); c Darwin et al. (16)

19
Figure 4. Comparison of propagation period for different rebar types.
5.3.3. Corrosion Cracking Time Corresponding to Different Rebar Types Based on the results of the corrosion initiation and propagation analyses, the PDFs of corrosion cracking time of RC bridge decks using the considered reinforcement rebars are shown in Figure 4. Figure 4(a) and 4(b) depict that corrosion resistant reinforcement materials (i.e., galvanized, epoxy coated and MMFX rebars) have longer corrosion cracking time in comparison to conventional reinforcement (i.e., black rebar). In addition, the corrosion cracking time of RC bridge decks with different reinforcement types for B1 is larger than that associated with B2.
(a) (b) Figure 5. Corrosion cracking time associated with different rebar types for (a) B1 and (b) B2.
5.4. Traffic Delay Analysis Traffic delays are estimated next for the investigated three-lane freeway bridge. It is assumed that during maintenance, one lane will be closed while the other two remain open. An hourly traffic volume input is adopted based on (39). Figure 6 shows that due to the closure of one lane, the hourly traffic volume in the remaining lanes will increase in comparison to the freeway condition.

20
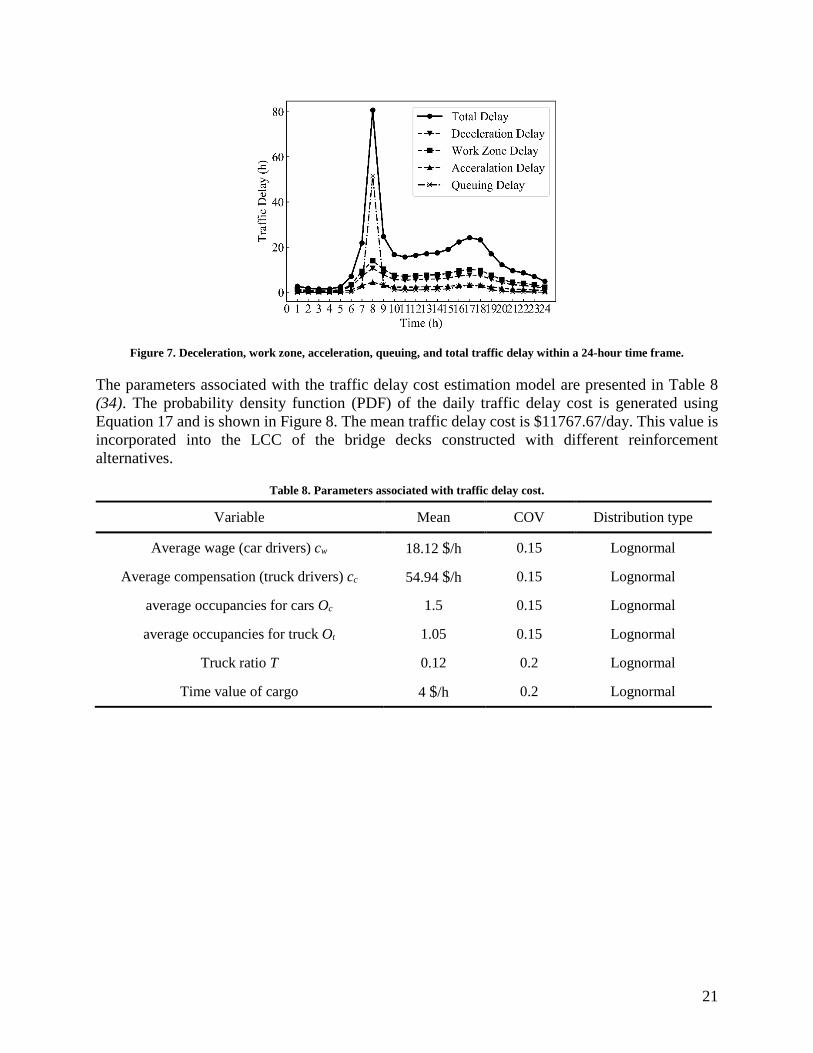
Table 7 presents the values of parameters adopted for performing the traffic delay analysis. In addition, Figure 7 presents the deceleration, work zone, acceleration, queuing, and total traffic delay within a 24-hour time frame based on the adopted traffic delay estimation model. The figure depicts that traffic delays can vary considerably along the day. More importantly, the queuing delay dominates during the peak hours. This highlights the significant impact of vehicle queuing on the total time losses during bridge construction.
Table 7. Parameters of variables associated with traffic delay.
Variable Value
Lanes 3
Freeway speed 110 km/h
Work zone speed 65 km/h
Work zone length 0.8 km
Deceleration zone length 1.4 km
ADT 30000
Figure 6. Hourly traffic volume per lane under freeway and work zone conditions.
21
Figure 7. Deceleration, work zone, acceleration, queuing, and total traffic delay within a 24-hour time frame.
The parameters associated with the traffic delay cost estimation model are presented in Table 8 (34). The probability density function (PDF) of the daily traffic delay cost is generated using Equation 17 and is shown in Figure 8. The mean traffic delay cost is $11767.67/day. This value is incorporated into the LCC of the bridge decks constructed with different reinforcement alternatives.
Table 8. Parameters associated with traffic delay cost.
Variable Mean COV Distribution type
Average wage (car drivers) cw 18.12 $/h 0.15 Lognormal
Average compensation (truck drivers) cc 54.94 $/h 0.15 Lognormal
average occupancies for cars Oc 1.5 0.15 Lognormal
average occupancies for truck Ot 1.05 0.15 Lognormal
Truck ratio T 0.12 0.2 Lognormal
Time value of cargo 4 $/h 0.2 Lognormal

22
Figure 8. Probability density function of daily traffic delay cost.
5.5. Crash Risk Analysis The three-lane freeway bridge example is used to estimate the impact of work zone crashes on the life-cycle cost. The PDF of crash rate in the work zone is illustrated in Figure 9 based on the crash cost estimation model discussed in Section 4.4 (Equation 18). The mean value of crash rate in the work zone is 2.81 × 10⁻⁵ and standard deviation is 5.00 × 10⁻⁵.
Figure 9. Probability density function of crash rate within the work zone.
Data related to the observed crashes and the corresponding human capital cost is obtained from Council et al. (33) and presented in Table 9. The crash severity levels follow the KABCO severity scale (40). Based on this data, the PDF of crash cost per accident can be generated as shown in Figure 10. The mean value and standard deviation of the crash cost per crash is $60,500 and $2,080, respectively.

23
Table 9. Observed crashes and human cost with respect to severity level.
Crash severity Level Observed crashes Mean human capital cost ($) Standard deviation ($)
No injury 8,077 6,291 423
C 3,211 27,393 5,760
B 2,938 35,114 2,695
A 4,179 101,125 10,682
K 356 1,117,167 30,422 Injured, severity
unknown 241 38,344 4,437
Unknown 788 14,577 385
Figure 10. Probability density function of the average crash cost.
Through the Monte Carlo simulation of Equation 20, the PDF of the daily crash cost within the work zone can be established as shown in Figure 11. The mean value of the daily crash cost is found to be $51,000/day. This result will be also incorporated into the total LCC of the bridge decks.

24
Figure 11. Probability density function of daily crash cost within the work zone.
5.6. Environmental Influence Cost Analysis The parameters adopted to evaluate the environmental impact of maintenance activities are presented in Table 10. The adopted data is based on Gallivan (41), Dong et al. (42), and Kendall et al. (43). Under the considered average daily traffic and environmental metric cost, it was observed that the environmental impact is significantly lower than other indirect cost components (i.e., traffic delays and work zone crashes). Accordingly, it is omitted from the life-cycle cost figures shown below.
Table 10. Adopted parameters associated with the environmental cost.
Variables Mean COV Distribution Type
Environmental metric per unit distance for cars, 𝐸𝐸𝐸𝐸𝑑𝑑,𝑐𝑐 0.22 kg/km 0.2 Lognormal
Environmental metric per unit distance for trucks, 𝐸𝐸𝐸𝐸𝑑𝑑,𝑡𝑡 0.56 kg/km 0.2 Lognormal
Carbon dioxide emissions per kilometer at speeds SD, 𝐸𝐸𝐸𝐸𝑆𝑆𝐷𝐷
0.379 kg/km deterministic deterministic
Carbon dioxide emissions per kilometer at speeds SO, 𝐸𝐸𝐸𝐸𝑆𝑆𝑆𝑆
0.298 kg/km deterministic deterministic
Cost of the environmental metric, 𝑐𝑐𝐸𝐸𝑛𝑛𝑣𝑣 26 $/ton 2.93 Lognormal
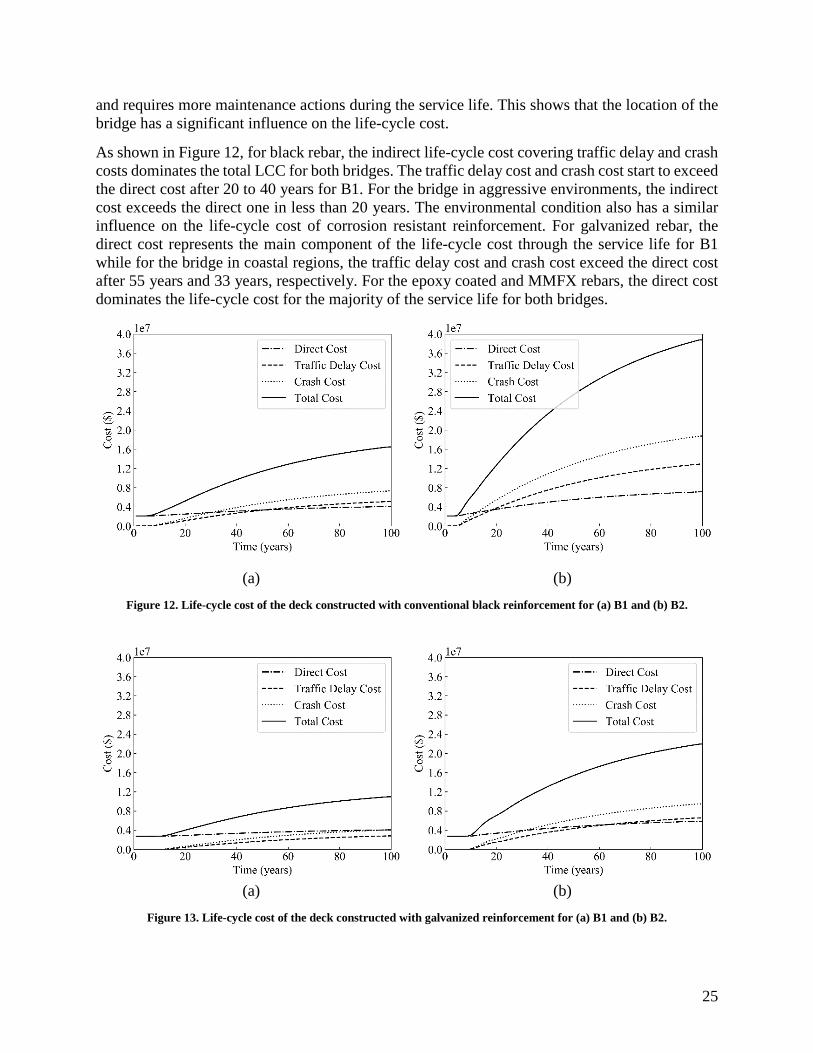
5.7. Life-Cycle Cost of the Bridge Decks The generated life-cycle cost profiles for the bridge decks of B1 and B2 constructed using black, galvanized, epoxy coated, and MMFX rebars are shown in Figures 12 to 15, respectively. Since most transportation authorities currently target 75 to 100 years of service life, a 100-year service life is considered for the presented life-cycle cost study. These figures show that the life-cycle cost of the bridge located in aggressive marine environments is roughly two times higher than that of the bridge located in low chloride exposure conditions for the same reinforcement type. This difference can be attributed to the severe chloride exposure which leads to a shorter service life
25
and requires more maintenance actions during the service life. This shows that the location of the bridge has a significant influence on the life-cycle cost.
As shown in Figure 12, for black rebar, the indirect life-cycle cost covering traffic delay and crash costs dominates the total LCC for both bridges. The traffic delay cost and crash cost start to exceed the direct cost after 20 to 40 years for B1. For the bridge in aggressive environments, the indirect cost exceeds the direct one in less than 20 years. The environmental condition also has a similar influence on the life-cycle cost of corrosion resistant reinforcement. For galvanized rebar, the direct cost represents the main component of the life-cycle cost through the service life for B1 while for the bridge in coastal regions, the traffic delay cost and crash cost exceed the direct cost after 55 years and 33 years, respectively. For the epoxy coated and MMFX rebars, the direct cost dominates the life-cycle cost for the majority of the service life for both bridges.
(a)
(b)
Figure 12. Life-cycle cost of the deck constructed with conventional black reinforcement for (a) B1 and (b) B2.
(a) (b) Figure 13. Life-cycle cost of the deck constructed with galvanized reinforcement for (a) B1 and (b) B2.

26
(a) (b) Figure 14. Life-cycle cost of the deck constructed with epoxy coated reinforcement for (a) B1 and (b) B2.
(a) (b)Figure 15. Life-cycle cost of the deck constructed with MMFX reinforcement for (a) B1 and (b) B2.
Figures 16 to 19 compare respectively the direct, traffic delay, crash and total life-cycle costs associated with the two bridge decks. As depicted in Figure 16, the initial construction cost of the deck varies among the considered reinforcement alternatives. Moreover, additional expenses are accrued during the service life due to the need for maintenance actions. Hence, the reinforcement alternative with the least direct life-cycle cost will change with the service life. Moreover, for the bridge in mild exposure conditions, the black rebar is the best alternative for service life below 35 years and the epoxy coated rebar is the best alternative for a longer service life. For the bridge in aggressive environment, the trend is similar, but the intersection occurs at 17 years. Accordingly, for cases with direct cost as the only consideration, corrosion resistant reinforcement could be more advantageous compared to conventional reinforcement from a life-cycle cost perspective.
Figure 17 compares the traffic delay cost associated with the deck constructed using the four alternatives for the two bridges. As expected, given the low need for maintenance for deck constructed using MMFX, this rebar type has the lowest traffic delay cost among the considered

27
types. In terms of the traffic delay cost, the MMFX is followed by the epoxy coated, galvanized, and finally the black rebar as the alternative with the highest cost. The life-cycle crash cost of the deck with the four alternatives is shown in Figure 17. Again, the MMFX has the lowest cost while the black rebar has the highest. In addition, the bridge constructed in marine environment has more traffic delay cost and crash cost compared to B1.
(a) (b) Figure 16. Direct life-cycle cost of deck constructed using different rebar types for (a) B1 and (b) B2.
(a) (b) Figure 17. Traffic delay cost of the deck constructed using different rebar types for (a) B1 and (b) B2.

28
(a) (b) Figure 18. Crash cost during the life-cycle of the deck constructed using different rebar types for (a) B1 and (b) B2.
The total life-cycle cost for the deck with the considered four reinforcement types is calculated using Equation 23. The computed total life-cycle cost during the service-life of the two bridges is presented in Figure 19. Figure 19(a) depicts the total life-cycle cost of the bridge deck in mild environment and shows that the black rebar provides the lowest life-cycle cost during the first 9 years of service life, while the epoxy coated rebar provides the lowest life-cycle cost between years 9 and 52. After 52 years, MMFX rebar is characterized by the lowest life-cycle cost among these four alternatives. On the other hand, the total life-cycle cost of the bridge deck in marine environment has a different trend as shown in Figure 19(b). In this case, the black rebar is the optimum choice for a service life lower than 5 years. Then, epoxy coated rebar has the lowest cost between years 5 and 17. After 17 years, MMFX rebar becomes the material with the lowest life-cycle cost. The differences in life-cycle cost for the two bridge decks indicate that the bridge location and exposure conditions have a large influence on the material selection. For the investigated case study, epoxy coated rebar tends to be an appealing choice for bridges under mild chloride exposure, while MMFX rebar is a better choice for aggressive environmental conditions. Moreover, at 100 years of service life, the LCC of the deck constructed with black rebar reaches approximately 3.7 and 5.4 times the cost of the deck with MMFX rebar for B1 and B2, respectively. Accordingly, corrosion resistant reinforcement can lead to a considerable reduction in the life-cycle cost of bridge decks; especially those constructed in aggressive marine environments.

29
(a) (b) Figure 19. Total life-cycle cost of the deck constructed using different rebar types for (a) B1 and (b) B2.

30
6. CONCLUSIONS This report presented the results of a probabilistic investigation to evaluate the life-cycle cost of RC bridge decks constructed with conventional and corrosion resistant reinforcement. The presented life-cycle cost considers maintenance and replacement costs, corrosion cracking time, traffic delay (including queuing, deceleration, acceleration, and work zone delays), crash risk and environmental impact of maintenance actions. Probabilistic simulations were conducted to evaluate the life-cycle cost associated with multiple reinforcement alternatives used in bridge deck construction under uncertainty. These uncertainties are associated with material cost, maintenance interval, maintenance durations, environmental conditions, and corrosion deterioration, among others. The life-cycle cost profiles for black, galvanized, epoxy-coated, and MMFX rebars were established and compared for two identical bridges located in mild and aggressive environmental conditions. The following conclusion can be drawn:
• The corrosion cracking time carries significant variability between the studied reinforcement alternatives. This is due to the different critical chloride threshold associated with each rebar type. Probabilistic analysis is required to establish the distribution of the corrosion cracking time under uncertainty. In addition, the corrosion cracking time is significantly affected by the surface chloride content which changes with respect to the bridge location.
• Conventional reinforcement is characterized by its low initial construction cost. However, its direct life-cycle cost (i.e., initial and maintenance/repair costs) increases considerably along the service life. This represents the cost incurred by the agency during the service life of the bridge. The proposed approach is capable of identifying the reinforcement alternative with the lowest direct life-cycle cost at different locations.
• For the investigated case study, traffic delays and crash costs represent the main components of the indirect life-cycle cost for mild chloride exposure conditions. The use of corrosion resistant reinforcement reduces the need for maintenance during the service life and leads to a lower indirect life-cycle cost of the bridge deck.
• Based on the results of this investigation, the type of reinforcement has a significant effect on the life-cycle cost of the bridge deck. Key parameters affecting the total life-cycle cost are the environmental exposure conditions and traffic volume at the bridge. These parameters govern the time interval between maintenance actions, traffic delays, and subsequently, work zone crashes.
31
REFERENCES 1. NCHRP. Transportation Asset Management Research Roadmap. National Cooperative Highway Research Program Report 08-36(134). American Association of State Highway Transportation Officials, Washington, D.C., 2016.
2. FHWA. Using Life-cycle Planning Process to Support Asset Management. Federal Highway Administration Interim Report, Federal Highway Administration, Washington, D.C., 2017.
3. Trejo, D., and R. G. Pillai. Accelerated Chloride Threshold Testing Part II: Corrosion-Resistant Reinforcement. Materials Journal, 2004.101: 57–64.
4. Liu, Y. Modeling the Time-to Corrosion Cracking of the Cover Concrete in Chloride Contaminated Reinforced Concrete Structures. Doctoral dissertation, Virginia Tech, 1996.
5. Berke, N. S. Enhanced Performance Zinc Coating for Steel in Concrete. Transportation Research Board, Washington D.C., 2016.
6. Weyers, R. E., Sprinkel, M. M., and M. C. Brown. Summary Report on the Performance of Epoxy-Coated Reinforcing Steel in Virginia. Virginia Center for Transportation Innovation and Research, VA, 2006.
7. Kahl, S. Corrosion Resistant Alloy Steel (MMFX) Reinforcing Bar in Bridge Decks. Michigan Department of Transportation, 2007. Volume: 1499.
8. Soliman, M., and D. M. Frangopol. Life-Cycle Cost Evaluation of Conventional And Corrosion-Resistant Steel For Bridges. Journal of Bridge Engineering, 2014. Volume 20.
9. Eamon, C. D., Jensen, E. A., Grace, N. F., and X. Shi. Life-Cycle Cost Analysis of Alternative Reinforcement Materials for Bridge Superstructures Considering Cost and Maintenance Uncertainties. Journal of Materials in Civil Engineering, 2012.24: 373–380.
10. Ji, J., Darwin, D., and Browning, J. Corrosion Resistance of Duplex Stainless Steels and MMFX Microcomposite Steel for Reinforced Concrete Bridge Decks. University of Kansas Center for Research, Inc., 2005.
11. Martinez, S. L., Darwin, D., McCabe, S. L., and Locke Jr, C. E. Rapid Test for Corrosion Effects of Deicing Chemicals in Reinforced Concrete. University of Kansas Center for Research, Inc., 1990.
12. Trejo, D., and Pillai, R. G. Accelerated Chloride Threshold Testing: Part I-ASTM A 615 and A 706 Reinforcement. Materials Journal, 2003.100: 519–527.
13. Phares, B. M., Fanous, F. S., Wipf, T. J., Lee, Y. S., and Jolley, M. J. Evaluation of Corrosion Resistance of Different Steel Reinforcement Types. Center for Transportation Research and Education, Iowa State University CTRE Project 02-103, 2006.
14. Lafikes, J., Storm, S., Darwin, D., Browning, J., and O’Reilly, M. Stainless Steel Reinforcement as a Replacement for Epoxy Coated Steel in Bridge Decks. University of Kansas Center for Research, Inc., 2011.
15. Alonso, M. C., and M. Sanchez. Analysis of The Variability of Chloride Threshold Values in the Literature. Materials and Corrosion, 2009.60: 631–637.

32
16. Darwin, D., Browning, J., O’Reilly, M., and Xing, L. Critical Chloride Corrosion Threshold for Galvanized Reinforcing Bars. University of Kansas Center for Research, Inc., 2007.
17. Stark, D. Measurement Techniques and Evaluation of Galvanized Reinforcing Steel in Concrete Structures in Bermuda. In D. Tonini and J. Gaidis (Ed.), STP713-EB Corrosion of Reinforcing Steel in Concrete, 1980: 132-141).
18. Erdogu, S., Bremner, T. W., and Kondratova, I. L. Accelerated Testing of Plain and Epoxy-Coated Reinforcement in Simulated Seawater and Chloride Solutions. Cement and Concrete Research, 2001.31: 861–867.
19. Curtis, D., and Funderburg, K. A. States Estimate Work Zone Traffic Delay Using Quickzone. ITE journal, 2003.73: 40–43.
20. Gou, J., Zhang, L., Altman, J. C., and Davis, W. QuickZone Improvement for Rural Freeway and Model Validation. Transportation Research Record: Journal of the Transportation Research Board, 2009. Volume: 2107.1/34–45
21. Jiang, Y. Estimation of Traffic Delays and Vehicle Queues at Freeway Work Zones. Presented at 80th Annual Meeting of the Transportation Research Board, Washington, D.C., 2001.
22. Chien, S., and Schonfeld, P. Optimal Work Zone Lengths for Four-Lane Highways. Journal of Transportation Engineering, 2001.127: 124–131.
23. Khattak, A. J., Khattak, A. J., and Council, F. M. Effects of Work Zone Presence on Injury and Non-Injury Crashes. Accident Analysis & Prevention, 2002.34: 19–29.
24. Meng, Q., and Weng, J. Evaluation of Rear-End Crash Risk at Work Zone Using Work Zone Traffic Data. Accident Analysis & Prevention, 2011.43: 1291–1300.
25. Yunovich, M., Thompson, N., and Virmani, Y. P. Life Cycle Cost Analysis for Reinforced Concrete Bridge Decks. NACE International, 2003.
26. Liu, Y., and Weyers, R. E. Modeling the Time-To-Corrosion Cracking in Chloride Contaminated Reinforced Concrete Structures. Materials Journal, 1998.95: 675–680.
27. Angst, U., Elsener, B., Larsen, C. K., and Vennesland, Ø. Critical Chloride Content in Reinforced Concrete - A Review. Cement and Concrete Research, 2009.39: 1122–1138.
28. Crank, J. The Mathematics of Diffusion. Oxford University Press, 1979.
29. Kirkpatrick, T. J., Weyers, R. E., Anderson-Cook, C. M., and Sprinkel, M. M. Probabilistic Model for the Chloride-Induced Corrosion Service Life of Bridge Decks. Cement and Concrete Research, 2002.32: 1943–1960.
30. El Maaddawy, T., and Soudki, K. A Model for Prediction of Time From Corrosion Initiation to Corrosion Cracking. Cement and concrete composites, 2007.29: 168–175.
31. Bhat, U. N., and Soudki, G. K. Elements of Applied Stochastic Processes. Hoboken^ eN. JNJ: Wiley-Interscience., 2002.
32. Stein, S. M., Young, G. K., Trent, R. E., and Pearson, D. R. Prioritizing Scour Vulnerable Bridges Using Risk. Journal of Infrastructure Systems, 1999.5: 95–101.

33
33. Council, F. M., Zaloshnja, E., Miller, T., and Persaud, B. N. Crash Cost Estimates by Maximum Police-Reported Injury Severity Within Selected Crash Geometrics. Public FHWA-HRT-05-051. Turner-Fairbank Highway Research Center, 2005.
34. Dong, Y., Frangopol, D. M., and Saydam, D. Sustainability of Highway Bridge Networks Under Seismic Hazard. Journal of Earthquake Engineering, 2014.18: 41–66.
35. Matthews, H. S., and Lave, L. B. Applications of Environmental Valuation for Determining Externality Costs. Environmental Science & Technology, 2000.34: 1390–1395.
36. Weyers, R. E., Fitch, M. G., Larsen, E. P., Al-Qadi, I. L., Chamberlin, W. P., and Hoffman, P. C. Concrete Bridge Protection and Rehabilitation: Chemical and Physical Techniques. Service Life Estimates. Publication No. SHRP-S-668. Strategic Highway Research Program, 1994.
37. Van Der Walt, S., Colbert, S. C., and Varoquaux, G. The Numpy Array: A Structure for Efficient Numerical Computation. Computing in Science & Engineering, 2011.13: 22.
38. Van Rossum, G., and Drake Jr, F. L. Python Reference Manual. Python Software Foundation, Netherlands, 1995.
39. Texas A&M Transportation Institute. Analysis Procedures and Mobility Performance Measures 100 Most Congested Texas Road Sections. Technical Memorandum, College Station, TX, 2018.
40. American National Standards Institute. Manual on Classification of Motor Vehicle Traffic Accidents. American National Safety Council, Illinois, USA, 2007.
41. Gallivan, F., Ang-Olson, J., Papson, A., and Venner, M. Greenhouse Gas Mitigation Measures for Transportation Construction, Maintenance, and Operations Activities. ICF International. Inc., Fairfax, Va, 2010.
42. Dong, Y., Frangopol, D. M., and Saydam, D. Time-Variant Sustainability Assessment of Seismically Vulnerable Bridges Subjected to Multiple Hazards. Earthquake Engineering & Structural Dynamics, 2013.42: 1451–1467.
43. Kendall, A., Keoleian, G. A., and Helfand, G. E. Helfand. Integrated Life-Cycle Assessment and Life-Cycle Cost Analysis Model for Concrete Bridge Deck Applications. Journal of Infrastructure Systems, 2008.14: 214–222.