Embed Size (px)
Citation preview

A Competitive Analysis of Web 2.0 Communities:
Differentiation with User-Generated Content
Kaifu Zhang Miklos Sarvary1
June 19, 2011
(Job market paper; under revision for invited 2nd round at Marketing Science)
1Kaifu Zhang is a Ph.D. student in Marketing and Miklos Sarvary is Professor of Marketing at INSEAD, Bd. deConstance, Fontainebleau, France. [email protected], [email protected]. This paper is the 1 st essayin Kaifu Zhang’s dissertation.

A Competitive Analysis of Web 2.0 Communities:Differentiation with User-Generated Content
Abstract
This paper studies the competition between Web 2.0 communities in a game theoretic framework.
We model three important features of these institutions: (i) firms’ content is usually user-generated;
(ii) consumers’ content preferences are governed by local network effects, and (iii) consumers have
strong tendencies to multi-home. Our analyses reveal that ex-ante identical community sites can
acquire differentiated market positions that spontaneously emerge from user-generated content.
Moreover, sites may obtain unanticipated and sometimes ambiguous market positions, wherein one
site simultaneously attracts distinct and isolated consumer segments that seldom interact. Spon-
taneous differentiation reduces firm competition but may imply too much consumer segregation
and lower social welfare. In most equilibria, a subset of consumers multi-home. We show that the
degree of spontaneous differentiation increases in the localness of network effects. Interestingly,
more multi-homing consumers imply reduced differentiation and intensify site competition. In
one extension, we show that market growth tends to lead to lower market concentration, in contrast
to the prediction by the classical horizontal differentiation model. We also study competing sites’
community design strategies and provide conditions under which sites reduce or enhance user con-
nectivity within their communities, leading to maximal and minimal spontaneous differentiation
respectively.
1
1 Introduction
“Web 2.0 communities”, such as social networks (e.g., Facebook, Orkut), video sharing sites (e.g.,
YouTube), virtual world platforms (e.g., Second Life), on-line dating communities (e.g., eHar-
mony, Match.com) represent a diverse and rapidly growing industry. In this industry, typically,
multiple sites compete in a relatively well-defined category (e.g., on-line dating). While these cat-
egories are quite different, Web 2.0 community sites share a number of important features: First,
most community sites rely extensively on user-generated content where consumers largely define
the firms’ product offerings. Typically, users have heterogeneous content preferences and favor
content generated by similar users, leading to large but local network externalities. In addition, it
is easy for consumers to join multiple communities (multi-homing), and sites compete for share
of consumer time. While the overall business impact of Web 2.0 communities has been well doc-
umented, the competitive implications of these novel economic properties have not been formally
addressed. The goal of this study is to close this gap. We study the competition between Web 2.0
communities defined by the above features in a game theoretic framework.
Although the industry is still young, a few stylized facts seem to emerge. First, as a con-
sequence of user-generated content, the content positioning of competing firms can sometimes be
determined by their users. Firms may acquire largely unintended and sometimes ambiguous prod-
uct positioning. Consider the early players in the social networking industry. Myspace, Friendster
and Google’s Orkut are notable competitors before the ascent of Facebook. All three websites
started in California and targeted the US market initially. Over time, however, Myspace became
the largest player in the US market, Friendster remained popular only in South East Asian coun-
tries, and Orkut has become one of the most visited websites in three culturally distinct countries:
Brazil, India and Estonia. While the sites were still competing for consumer time (as evidenced by
the large number of consumers who join multiple networks), they acquired differentiated positions
defined by distinct languages and cultures. There were strong evidences that this differentiation
2

was not a consequence of the firms’ deliberate strategic choices. For example, Friendster’s CTO
realized that half of its traffic was coming from the Phillipines when he accidentally spotted that
the site’s traffic peaked everyday past mid-night, San Francisco time. Differentiation also sponta-
neously emerged between Myspace and Facebook, the major contestants for US market leadership
between 2006-2009. In an ethnographic study, Boyd (2010) documents a so-called ‘white flight’
from MySpace to Facebook, and suggests that the two leading players in the US social networking
market acquired differentiated market positions with racial connotations. Anecdotes in the on-line
dating domain also suggest that consumers play important roles in shaping firms’ market position-
ing. Match.com, one of the earliest entrant in this industry, had an ambitious positioning which
catered to daters with a range of different objectives2. Its major competitors eHarmony, however,
specifically targeted the serious, marriage-minded daters by marketing its sophisticated personal-
ity matching algorithm. eHarmony became so successful among serious daters that Match.com
soon (unwillingly) acquired a reputation of being more popular among daters who only seek short-
term relationships. To compete with eHarmony, Match.com launched a premium service called
Chemistry.com based on a different personality matching algorithm. Some consumers considered
Chemistry.com’s algorithm to be superior. But even to these consumers, eHarmony often remained
more attractive due to its ‘high quality pool’ of serious daters3. The above examples illustrate some
interesting cases where consumers play key roles in determining the firms’ market positions, a phe-
nomenon we later describe as ‘spontaneous product differentiation’.
Second, while network externalities are clearly significant in all Web 2.0 community mar-
kets, different Web 2.0 community categories exhibit widely varying levels of concentrations. In
some markets, we observe the emergence of a dominant site (e.g., YouTube in the video-sharing
industry and most recently Facebook in the social-networking industry) and a ‘winner-take-all’
market structure, which is the typical market outcome in traditional network industries. In other
2Match.com states that ‘Whether you are looking for marriage, a long term relationship, or just a friend, you willfind what you’re looking for at Match.com.’
3See http://www.edatereview.com/ for consumers’ comparison of these services
3

Approx. Herfindahl Index
Mobile Community 0.1427
Casual Gaming 0.1583
Social Networks 0.3919
Auto Classified 0.4861
Video Sharing 0.5840
Table 1: Herfindahl Indices in different Web 2.0 community categories
markets, as discussed above, competing firms are able to coexist with differentiated positions de-
spite strong network externalities. Table 1 lists the approximate Herfindahl indices4 for five Web
2.0 community markets and shows that the index exhibits large variations across these domains.
Furthermore, rapid market growth seems to lead to lower market concentration in many Web 2.0
community markets. This is contrary to the conventional wisdom from the network literature that
market growth is believed to foster higher market concentration.
Third, some consumers have strong tendencies to multi-home in competing communities
while others are loyal to one site. A survey by Pew Research on North American adult social net-
work users reveals that 51% of the respondents keep multiple profiles on different websites while
43% of respondents state that they only maintain one profile in a single community5. Moreover,
it is believed that, as the market grows, consumers will be more likely to share their time between
multiple specialized communities instead of single-homing in one large community with a general
audience (Stafford 2009, Bloomberg Businessweek 2009).
Finally, with respect to firm strategies, established Web 2.0 community sites increasingly
4The index has been derived from the top ten sites in each category, with the following formula H = ∑i=1...N s2i ,
where si is the market share of firm i (Hirschman 1964). Data source: Hitwise 2009.5See the report ‘Social Networks Grow: Friending Mom and Dad’ (Lenhart 2009).
4

take actions to ‘limit connections’ and encourage fragmentation within their communities. Armano
(2009) observes that interaction within the successful social networks starts looking ‘less social’
as lists, groups, and ‘friend control’ functions proliferate. As a notable example, Facebook has
recently introduced features that allow users to interact in smaller groups (New York Times 2010).
Similarly, the virtual world platform Second Life has made dramatic changes to the ‘geographic’
layout of its virtual world. Second Life started as a massive ‘Mainland’ where participants had
a high chance to meet and interact. In recent years, its geography changed as an archipelago of
walled-off islands were added to the virtual world.
Our paper seeks to shed some light on these stylized patterns and trends in the Web 2.0
community industry. Beyond replicating market outcomes, we are interested in identifying the
determinants of firm profits and study competing firms’ strategic choices. To do so, we develop a
model of competing Web 2.0 community sites with the following main features:
• User-Generated Content: We assume that firms host user-generated content and don’t pro-
duce content on their own. Each consumer (user) generates content consistent with her own
preferences. Consumers derive utility from consuming the content generated by all the other
consumers in the same community.
• Local Network Effects: The marginal utility from consuming a piece of content depends
on the similarity between the consumer who contributes the content and the consumer who
consumes the content. Consumers have stronger preferences for content generated by similar
others6.
• Saturation from Content Consumption: Repeated consumption of similar content yields de-
creasing returns to consumers.
6As opposed to local network effects, we say that the network effects are global when a consumer’s content pref-erences don’t depend on who generates the content.
5

Besides these main features, our model assumes that consumers develop expectations about
firms’ customer bases and maximize utility by freely allocating a limited amount of time between
competing Web 2.0 communities. On the supply side, we consider a duopoly of ex-ante identical
Web 2.0 community firms who profit from advertising.
Our first set of results relate to the market outcomes in a competitive Web 2.0 community
industry. The analysis reveals the existence of three qualitatively different types of equilibria.
When network effects are relatively global, there exists a winner-take-all equilibrium where all
consumers join a single dominant firm’s network. When network effects are relatively local, ex-
ante identical sites can obtain differentiated market positions that emerge spontaneously from user-
generated content. The sites attract different but overlapping consumer segments who then generate
content consistent with their respective tastes. When network effects are sufficiently local, there
exists an interesting equilibrium where one sites attracts two distinct consumer segments who do
not value the content generated by each other. Despite its ambiguous positioning, this site coexists
with its competitor who has a clear market position. Importantly, we show that the type of market
outcome depends on the localness of network effects, not the magnitude of network effects. Firms
are able to coexist under large network effects and winner-take-all outcome can emerge even when
network effects are relatively small. In most equilibria, we also observe a segment of consumers
who multi-home. Stronger saturation from content consumption enlarges this segment.
Our second set of results shed light on the properties of spontaneous differentiation and the
determinants of firm profits. On the firm side, we show that spontaneous differentiation reduces
firm competition similar to the case of classic horizontal differentiation. As expected, the degree
of spontaneous differentiation is increasing in the localness of network effects. Thus, firm profits
rise when members strongly favor the content generated by similar members. Interestingly, more
multi-homing consumers result in fiercer competition between the communities and lead to lower
profits. We show that this is a unique implication of user-generated content. It arises from the fact
6

that as more users multi-home, the competing communities end up hosting overlapping content and
face reduced differentiation. On the consumer side, we show that spontaneous differentiation may
emerge even when consumers collectively prefer to join the same community. Thus, spontaneous
differentiation may imply ‘too much’ consumer segregation from a social welfare perspective.
These results resonate to many of the stylized facts mentioned above.
In two extensions, we explore two market trends in the Web 2.0 community industry. First,
we study the effect of market growth on market structure in a comparative static framework. The
analysis reveals that market expansion in both breadth and density reduces the likelihood of the
winner-take-all outcome and leads to lower market concentration. This stands in contrast with
traditional network industries where a denser market usually implies higher concentration. Sec-
ond, we consider the firms’ community design problem where firms either enhance or reduce user
connectivity in their communities. We find that in a heterogeneous market, competing firms may
intentionally reduce connectivity, which leads to strictly lower but more local network effects. This
strategy effectively maximizes spontaneous differentiation resulting from user-generated content.
However, when consumer heterogeneity is low, firms are more likely to enhance user connectivity
within their communities which leads to minimal differentiation.
The rest of the paper is organized as follows. In Section 2, we review the relevant literature
in marketing and economics. Section 3 presents the model. Section 4 presents the analyses and
discuss the equilibrium results. We present the extensions in Section 5. Section 6 discusses other
aspects of the Web 2.0 community industry and concludes. To facilitate reading all proofs have
been relegated to an appendix.
2 Literature Review
Our paper is related to four broad literature streams. First, it is related to the economics literature
on product differentiation. Classic product differentiation models often assume a two-stage pro-
7

cess where competing firms choose their product positioning in the first stage and then compete in
prices (d’Aspremont, Gabszewicz, and Thisse 1979, Shaked and Sutton 1982). In a user-generated
content context, we study product differentiation in a model where “content positioning” depends
on which users a site attracts. This setup is similar to Dmitri and Shachar (2010) where a brand’s
identity depends on the consumers who own it. We study competitive outcomes in this ‘sponta-
neous’ differentiation context and compare it with classic horizontal differentiation. We also study
firms’ incentives to influence spontaneous differentiation by managing consumer interactions7.
Second, our study is closely related to the vast literature on network externalities, in both
economics (Katz and Shapiro 1985, 1986, Farrell and Klemperer 2005) and marketing (Xie and
Sirbu 1995, Ofek and Sarvary 2001, Sun, Xie, and Cao 2004, Chen and Xie 2007, Tucker and
Zhang 2010). Most of these models assume a consumer utility function that increases linearly
in network size. This simple assumption is sufficient to explain general industry outcomes such
as the winner-take-all market structure. However, the Web 2.0 community industry is typically
characterized by local, as opposed to global network effects. Local network effects have been
studied by a few recent papers in economics (Fjeldstad, Moen, and Riis 2009, Banerji and Dutta
2009). Our model is similar to these papers but, in line with the Web 2.0 community context, has
other features such as saturation from repeated content consumption. More importantly, we apply
a more general solution concept to the game. To our knowledge, ours is the first model with local
network effects that yields the classic global network effect model and winner-take-all outcome as
a special case.
Third, to model advertising competition between communities, we adopt the standard ‘ad-
vertising disutility’ paradigm (Dukes and Gal-Or 2003, Dukes 2004, Gabszewicz, Laussel, and
Sonnac 2004, Anderson and Coate 2005, Anderson and Gans 2010). This framework assumes
that consumers consider advertising as nuisance. The tendency of ad avoidance has found much
7Godes, Mayzlin, Chen, Das, Dellarocas, Pfeiffer, Libai, Sen, Shi, and Verlegh (2005) discuss this issue whenconsumer interactions are mostly interpreted as word-of-mouth.
8

empirical support (see Wilbur (2008) for a recent example).
Finally, we assume consumer multi-homing and as a result, the paper is also related to
papers on multiple buying, wherein consumers purchase multiple products from competing firms
(Caillaud and Jullien 2003, Doganoglu and Wright 2006, Guo 2006, Xiang and Sarvary 2007).
In particular, Caillaud and Jullien (2003), Doganoglu and Wright (2006) both study the impact
of multi-homing behavior on platform competition under network effects. Both papers consider
network products sold via fixed prices. Multi-homing implies paying for both products and prod-
uct utilities are also additive. Our model introduces features specific to the Web 2.0 community
context. We assume that consumers allocate a fixed amount of time between the communities.
Both advertising disutility and consumption utility are proportional to the amount of time spent in
a site, and repeated content consumption yields decreasing return. Importantly to our context, this
aspect of the demand also affects our supply function: the amount of content a user generates for
the community depends on how much time she allocates to the site.
3 The Model
We consider a simple Web 2.0 community market with two ex-ante identical community sites
indexed i = 1,2 competing for a heterogeneous set of consumers. Sites earn profits from advertis-
ing8. A site’s subscribers derive utility from consuming the content generated by other members
in the same community and choose to allocate their limited amount of time between the competing
sites (multi-homing). Site’s content depends on the type of consumers they attract (user-generated
content) and the amount of time these consumers spend at the sites. Consumers prefer content
generated by similar users (local network effect) and derive disutility from advertising.
8There are three major revenue models for Web 2.0 community websites: advertising (as in YouTube), membershipfees (as in the case of dating websites) and taxing the virtual economy (as in the case of Second Life). In an appendixavailable from the authors, we show that all three revenue models can be modeled in a mathematically equivalent wayand we use the term advertising throughout the paper to facilitate reading.
9

The game consists of the following stages. First, all parties (both consumers and firms)
form expectations about which users will join which website and how much time they will spend
on the sites. Firms set advertising levels according to their expectations about the type and amount
of content they will host. Then consumers make time allocation decisions based on the advertising
levels and the expected type and amount of content in each community. We seek the Fulfilled
Expectation Equilibrium where the expected consumer time allocation pattern coincides with the
realized time allocation pattern (Katz and Shapiro 1985, Farrell and Klemperer 2005). Below, we
elaborate on these features in greater details.
3.1 Consumers
Consumers are heterogeneous and we assume that their types are uniformly distributed on a linear
city C = [0,1]. Each user is simultaneously ‘content consumer’ and ‘content contributor’ and each
consumer’s preference is correlated with the content generated by her. Specifically, a consumer
located at x ∈ [0,1] generates a piece of content at the same location in each unit of her time.
We assume that consumers have access to the content generated by the other consumers in the
same community9. Thus, the total content consumption benefit consumer x derives from joining
community i, vix is:
vix =
∫y∈C
δ (x,y)T ei (y)dy, (1)
where δ (x,y) denotes the marginal utility consumer x derives from consuming the content gener-
ated by consumer y and T ei (y) is the market expectation about the amount of time consumer y will
spend in community i. It also measures the amount of content consumer y is expected to contribute
to community i. Under single-homing, T ei (y) can be modeled as an indicator function, taking the
value of 1 if consumer y is in community i and 0 otherwise.
9We explain the model in terms of content consumption. The analysis also applies to cases where consumers deriveutility from direct social interaction.
10

A consumer’s location (x) may carry different interpretations in different Web 2.0 com-
munity contexts. For example, in the case of global social networks, a consumer’s type may be
determined by her language or culture, whereas in the case of video sharing websites, a consumer’s
type corresponds to her preference for different categories of videos. While we do not explicitly
model a user’s incentive to generate content, it is a reasonable assumption that users generate
content according to their own preferences. For instance, Facebook consumers generate content
by writing blogs, uploading pictures etc. Presumably, this content is related to the consumers’
personal experiences and reflect their preferences.
As a result, δ (x,y) depends on the similarity between the content contributor y and the
content consumer x. In other words, there are local network effects, where consumers benefit more
from the presence of ‘similar’ others in the same community. Specifically, we assume δ (x,y) is
decreasing as x and y become more distant10:
δ (x,y) = α −β |x− y| . (2)
The above formulation allows for the possibilities of negative marginal content utility. For
example, it is a well documented phenomenon that some Second Life participants consider each
other annoying. We complete the consumers’ utility function by incorporating advertising disutility
ai that is proportional to advertising intensity (Dukes and Gal-Or 2003) and a constant term c11.
The total utility a consumer derives from site i is therefore:
10It is useful to examine the network benefit function v ix under the special case of global network effects. When
δ (x,y) = α , the formulation reduces to the classic network externality function proposed by Katz and Shapiro (1985,1986): vi
x =∫
y∈C δ (x,y)T ei (y)dy =
∫y∈C αT e
i (y)dy = αxei , where xe is the expected number of consumers joining
network i. As such, a consumer’s utility only depends on the size of the community.
11We do not model the fact that under certain cases, consumers may actually derive positive utility from seeing awell-designed ad. The non-content benefit c that a consumer gets from joining a community may capture, for example,the intrinsic motivation from content contribution (e.g., making a YouTube video or writing a blog article may be funon its own right); See Benabou and Tirole (2006) for a discussion. This is also a standard technical assumption in theproduct differentiation literature that guarantees market coverage.
11

uix = c+ vi
x −ai . (3)
When consumers single-home, consumer x will join network i if uix > u−i
x .
Next, we allow multi-homing where consumers allocate their time between the competing
communities. For simplicity we assume that each consumer disposes only two units of time. Each
consumer x chooses Ti(x) based on her expectation of all the other consumers’ time allocation
decisions T ei (y), y ∈ [0,1]. Ti(x) = k if x allocates k units of her time to community i (k = 0,1,2).
Clearly, T−i(x) = 2−Ti(x). Multi-homing takes place when a consumer allocates 1 unit of her time
in each community.
We assume that y generates k units of content in community i if y allocates k units of her
time in community i. As such, consumer x may repeatedly consume the content generated by
y. Given T e1 (y), the number of times that consumer x consumes y’s content is txy(T1(x),T e
1 (y)) =
∑i=1,2 Ti(x)T ei (y), where txy ∈ {0,2,4}. For example, when T1(x) = T2(x) = 1 and T e
1 (y)= T e2 (y) =
1, both x and y multi-home, and x consumes 2 of y’s content in two different communities. When
T1(x) = T2(x) = 1,T e1 (y) = 2,T e
2 (y) = 0, x allocates one unit of her time to community 1 while
y generates two units of content in community 1. Thus, x consumes 2 of y’s content in the same
community. When T1(x) = 2,T e1 (y) = 2, both x and y singe-home in community 1, and x consumes
4 of y’s content.
We consider a network utility function δ ′(x,y, txy) concave in txy, which implies ‘satura-
tion’ from repeated consumption of the same type of content. Formally, δ ′(x,y,4)− δ ′
(x,y,2) <
δ ′(x,y,2)−δ ′
(x,y,0). Consumer x chooses T1(x) to maximize:
ux = c+∫
y∈Cδ
′(x,y, txy)dy−T1(x)a1 −T2(x)a2 , (4)
where
12

δ′(x,y, txy) =
⎧⎨⎩
0 if txy = 0δ (x,y) if txy = 2(1+ γ)δ (x,y) if txy = 4 ,
(5)
where 0 < γ < 1. Note that the time allocation decision of consumer x is a function of T e1 (y) and
a1,a2, which we denote as T r1 (x,T
e1 ,a1,a2). Put differently, a consumer’s time allocation decision
depends on her expectation about all other consumers’ time allocation decisions and the firms’
advertising levels. As will be defined in Section 3.3, the equilibrium time allocation involves self-
fulfilling expectation and is denoted as T ∗1 (x).
3.2 Firms
We consider two competing sites setting their advertising intensities ai > 0. Ad intensity can be
thought of as the number of ads displayed on each page. The site’s profit is proportional to the
number of ads multiplied by the price for each ad:
Πi = ai p(∫
x∈CT r
i (x,Te
1 ,a1,a2)dx) . (6)
p(·) is the mapping from the consumer impressions a website receives to an advertiser’s
willingness to pay for an ad slot on this website. We assume that advertisers have higher willing-
ness to pay for an ad slot with more consumer impressions. Specifically,
p(∫
x∈CT r
i (x,Te
1 ,a1,a2)dx) = s∫
x∈CT r
i (x,Te
1 ,a1,a2)dx, (7)
where∫
x∈C T ri (x,T
e1 ,a1,a2)dx is the total amount of consumer time spent in community i and s is
the prevailing cost per impression (normalized to 12).
Recall that we assume that displaying more ads in general leads to less enjoyable consumer
experience since consumers find ads a nuisance. When consumers spend less time on a community,
the advertising price on this website will also drop. The profit function captures this tradeoff
13

between ad intensity and ad price and is a standard formulation from the literature (Dukes and
Gal-Or 2003, Gabszewicz et al. 2004, Anderson and Gans 2010).
3.3 Equilibrium Concept
We generalize the solution concept of Fulfilled Expectation Equilibrium (FEE) from the network
effect literature (see e.g., Katz and Shapiro). In its classic form, a Fulfilled Expectation Equilibrium
consists of a network size that is a fixed point of the mapping from expected network size to realized
network size xr = Γ(xe)12. The FEE solution concept has a straightforward extension in our setup.
We consider the functional Γ that maps the expected time allocation function T e1 to the realized
time allocation pattern T r1 when firms set advertising levels taking T e
1 as given. The consumer time
allocation pattern in a Fulfilled Expectation Equilibrium satisfies T ∗1 = Γ(T ∗
1 ). Equivalently, the
equilibrium consists of a time allocation function T ∗1 and advertising levels a∗1 and a∗2 such that:
⎧⎪⎪⎪⎪⎨⎪⎪⎪⎪⎩
a∗1 = argmaxa1a1p(
∫x∈C T r
1 (x,T∗
1 ,a1,a2)dx)
a∗2 = argmaxa2a2p(
∫x∈C 1−T r
1 (x,T∗
1 ,a1,a2)dx)
∀x, T ∗1 (x) = T r
1 (x,T∗
1 ,a∗1,a
∗2).
(8)
The mapping Γ is defined as Γ(T ∗1 )(x) = T r
1 (x,T∗
1 ,a∗1,a
∗2). We further restrict our interests
to stable FEEs. The precise definition of stability is given in the appendix. While conceptually
straightforward, extending expectation from a real number to a function leads to considerable
complexity in solving the fixed-point problem of Γ, which we address in the Appendix.
12Let xe denote the expected network size of firm 1. Firm 2’s network size is therefore 1 − x e. The mappingΓ is derived as follows. Consumers make purchase decisions based on x e and prices, and the demand function isxr(xe, p1, p2). Firms set prices to maximize profits, leading to p∗
1(xe), p∗2(x
e). The mapping Γ is defined as Γ(xe) =xr(xe, p∗1(x
e), p∗2(xe)).
14

4 Analysis
We first present equilibrium results from the basic model. As in the network externality literature,
there are many possible equilibria and uniqueness can rarely be obtained. Our analysis focuses on
existence results to highlight interesting outcomes that may relate to the stylized facts discussed
in the introduction. We focus on three aspects of market outcomes: market shares, consumer
multi-homing behavior and site profits. To set a benchmark, we start by showing that when the
network effects are relatively global, the classic winner-take-all outcome emerges where only one
firm makes positive profit.
Proposition 1. When α > 3β2 and γ > 1
2 , there exist two stable winner-take-all equilibria where
one firm dominates the market and consumers single-home in the dominant community. Formally,
∀ x, T ∗i (x) = 2 (i = 1,2). The dominant firm’s profit is γ(α − β
2 ) and its competitor’s profit is 0.
The winner-take-all outcome is a typical market structure in many traditional industries
characterized by global network effects (see Farrell and Klemperer for empirical evidences). Our
analysis further suggests that this winner-take-all outcome persists even when the network effects
are ‘slightly local’. Furthermore, Proposition 1 also shows that decreasing returns from content
consumption (small γ) reduce the likelihood of winner-take-all outcome.
Next, we explore a more interesting outcome, namely the ‘spontaneous differentiation’
equilibrium where ex-ante identical sites acquire differentiated market positions that the firms can-
not control.
Proposition 2. When β4 < α < 5β+7βγ
8γ−5γ2+5 , there exist two stable ‘spontaneous differentiation’ equi-
libria where
T ∗i (x) =
⎧⎪⎪⎨⎪⎪⎩
2 if x < 2(β−α+αγ)β (γ+3) ,
1 if 2(β−α+αγ)β (γ+3) ≤ x ≤ 1− 2(β−α+αγ)
β (γ+3) ,
0 if x > 1− 2(β−α+αγ)β (γ+3) .
(i = 1,2) (9)
Firm profits are βγ+β+αγ2−α2(γ+3) .
15

Proposition 2 describes a type of content differentiation where website i hosts more content
generated by users at x< 12 and website −i hosts more content generated by users at x> 1
2 . Figure 1
illustrates the equilibrium multi-homing pattern. The consumers on the two extremes single-home
in their preferred communities while the consumers in the middle multi-home in order to consume
both types of content. We name this equilibrium outcome ‘spontaneous differentiation’ to reflect
the fact that the firms are ex-ante identical and the differentiation is created completely with user-
generated content. The spontaneous differentiation equilibrium has the following features:
• Similar to the classic horizontal differentiation, spontaneous differentiation reduces compe-
tition and leads to higher profits. Both firms earn non-zero profits even if they are ex-ante
identical.
• It is sometimes impossible to differentiate with user-generated content at all. The spon-
taneous differentiation equilibrium only exists when network effects are sufficiently local.
Comparing the conditions in Propositions 1 and 2, it can be seen that the winner-take-all
outcome and the spontaneous differentiation equilibrium represent mutually exclusive mar-
ket outcomes.
• Spontaneous differentiation equilibria always exist in pairs. Firms don’t choose their market
positions (e.g., left vs right) and market positions emerge as a result of consumer coordina-
tion. Put differently, firms may obtain ‘unanticipated’ market positions.
Clearly, spontaneous differentiation is a consequence of user-generated content as well as
local network effects. But does competition also play a role in the creation of spontaneous differen-
tiation? We find that site competition is often a necessary condition for spontaneous differentiation
to be sustained. To illustrate this point, consider a model where the firms do not interact in a com-
petitive way (e.g., advertising levels are fixed at zero). Proposition 3 states the existence condition
for spontaneous differentiation when firms don’t compete.
16

2( )( 3)
2( )1( 3)
Single-homingconsumers in community i
Single-homingconsumers in community -i
Multi-homingconsumers
0 10
1
2
T* i(x)
x
Figure 1: Spontaneous Differentiation
Proposition 3. When a1 = a2 ≡ 0, the stable spontaneous differentiation equilibrium exists if and
only if β4 < α < 1+3γ
8γ−γ2+1β . This condition implies negative network externalities between the
consumers who single-home in different communities. Formally,
β4< α <
1+3γ8γ − γ2 +1
β →∫ ∫
(x,y)∈{(x,y)|txy=0}δ (x,y)dydx < 0,
where txy is defined by the equilibrium time allocation pattern:
T ∗i (x) =
⎧⎪⎪⎨⎪⎪⎩
2 if x < 2(β−α+αγ)β (γ+3) ,
1 if 2(β−α+αγ)β (γ+3) ≤ x ≤ 1− 2(β−α+αγ)
β (γ+3) ,
0 if x > 1− 2(β−α+αγ)β (γ+3) .
(i = 1,2) (10)
Proposition 3 states that when firms do not compete, spontaneous differentiation equilib-
rium exists only when two groups of consumers ‘dislike’ each other. Specifically, the time alloca-
tion function T ∗i defines two groups of single-homing consumers who do not consume the content
generated by each other ((x,y)|txy = 0}). For spontaneous differentiation equilibrium to be stable,
it is a necessary condition that these consumers collectively prefer to stay in different communities
rather than join the same community. Conversely, if the single-homing consumers derive higher
welfare from joining the same community, the spontaneous differentiation outcome is non-stable.
17

Comparing the conditions in Proposition 2 and Proposition 3, it is clear that the spontaneous
differentiation equilibrium is more likely to exist when sites compete with each other in advertising.
When firms compete, spontaneous differentiation equilibrium may exist even when consumers
collectively prefer joining the same community. This is evident from the fact that differentiation
can be sustained even when the marginal network externality is always strictly positive (α−β > 0),
such that no two consumers ‘dislike’ each other. In summary, spontaneous differentiation is a result
of competitive site interaction and may lead to too much ‘consumer segregation’ that implies lower
social welfare.
The equilibrium described in Proposition 2 resonates with anecdotal evidence. The stories
of Orkut and Friendster serve as lively examples where consumers with similar culture and lan-
guage background joined the same website, thereby granting the websites ‘market positions’ they
did not intend to obtain. For example, during its first year of launch, Orkut had the largest user
base in the United States. Soon after, however, Orkut started taking off in Brazil and soon became
‘Portuguese speaking’13. Some English speaking users started switching to competing services14.
In fact, amazed by its unexpected popularity, Orkut’s creator visited Brazil in 2007 to ‘understand
Orkut’s success in that country’15. Today Orkut remains the biggest social networking website in
Brazil despite of strong competition from Facebook. Similarly in a qualitative study, Boyd (2010)
suggests that a type of differentiation shaped by ‘race and class’ emerged between MySpace and
Facebook during the years 2006-2009. Drawing from interview and observation data from mul-
tiple US communities, Boyd (2010) suggests that “subculturally identified teens appeared more
frequently drawn to MySpace while more mainstream teens tended towards Facebook.”
Such spontaneous differentiation seemed to be a clear feature of the early social network-
ing industry. More recently, however, Facebook is emerging as the dominant social networking
13http://slashdot.org/article.pl?sid=04/07/17/224323214http://en.wikipedia.org/wiki/Orkut15http://info.abril.com.br/aberto/infonews/042007/02042007-9.shl.
18

service across the world. It surpassed Friendster as the most popular social networking site in the
Phillipines and Orkut as the most popular site in India. According to Kirkpatrick (2011), there are
three reasons that underly the success of Facebook: first, the site has a simple and clean design,
which enhanced user experience. Second, the site’s collaborative translation tool greatly facilitated
its adoption into local languages. Third, the social networking industry has seen a paradigm shift
since 2007. In May 2007, Facebook introduced its app platform which allowed third party develop-
ers to develop their own applications and keep 100% of the revenues. Within six months, 250,000
developers signed up. Myspace quickly followed suit later in the same year. Since Facebook’s
users were considered the most valuable by advertisers, more apps were developed for Facebook.
These apps were easily translated into other languages with the same collaborative translation tool,
and this gave Facebook an edge over its competitors. In our terminology, when social networking
users’ primary activity was browsing the photos and posts by their friends, the network effects are
local in scope. Photos posted by one consumer are only of interests to her friends. When third
party apps entered the picture, the network effects become much more global, since apps devel-
oped for one group of consumers are most likely also of interests to another group of consumers.
This eventually leads to a winner-take-all outcome.
Our finding about consumer multi-homing is also consistent with empirical observations.
We find that multi-homing consumers are those who locate in the middle of the linear city. For
example, Brazilians who live in the US are most likely to join both Myspace and Orkut to connect
to friends in both countries16. In the Pew Research survey on social network users (Lenhart 2009),
the most stated reasons for multi-homing include ‘keeping up with friends on different sites’, ‘sep-
arating personal and professional life’ and ‘representing different parts of my personality’.
When network externalities are sufficiently local, more complicated differentiation struc-
tures can be sustained. Proposition 4 states the existence of a type of equilibrium where one site
16See this argument examined in http://www.zephoria.org/thoughts/archives/2010/08/17/social-divisions-between-orkut-facebook-in-brazil.html.
19

attracts two distinct groups of users:
Proposition 4. When β2 < α <
β (γ+3)2(3−γ) , there exist two stable equilibria where
T ∗i (x) =
⎧⎪⎪⎪⎪⎨⎪⎪⎪⎪⎩
2 if x < A(α,β ,γ),1 if A(α,β ,γ)≤ x ≤ B(α,β ,γ),0 if B(α,β ,γ)< x < 1−B(α,β ,γ),1 if 1−B(α,β ,γ)≤ x ≤ 1−A(α,β ,γ),2 if x > 1−A(α,β ,γ).
(i = 1,2) (11)
where B(α,β ,γ) > A(α,β ,γ). Exact expressions for λ (γ),A(α,β ,γ),B(α,β ,γ) are given in the
appendix17.
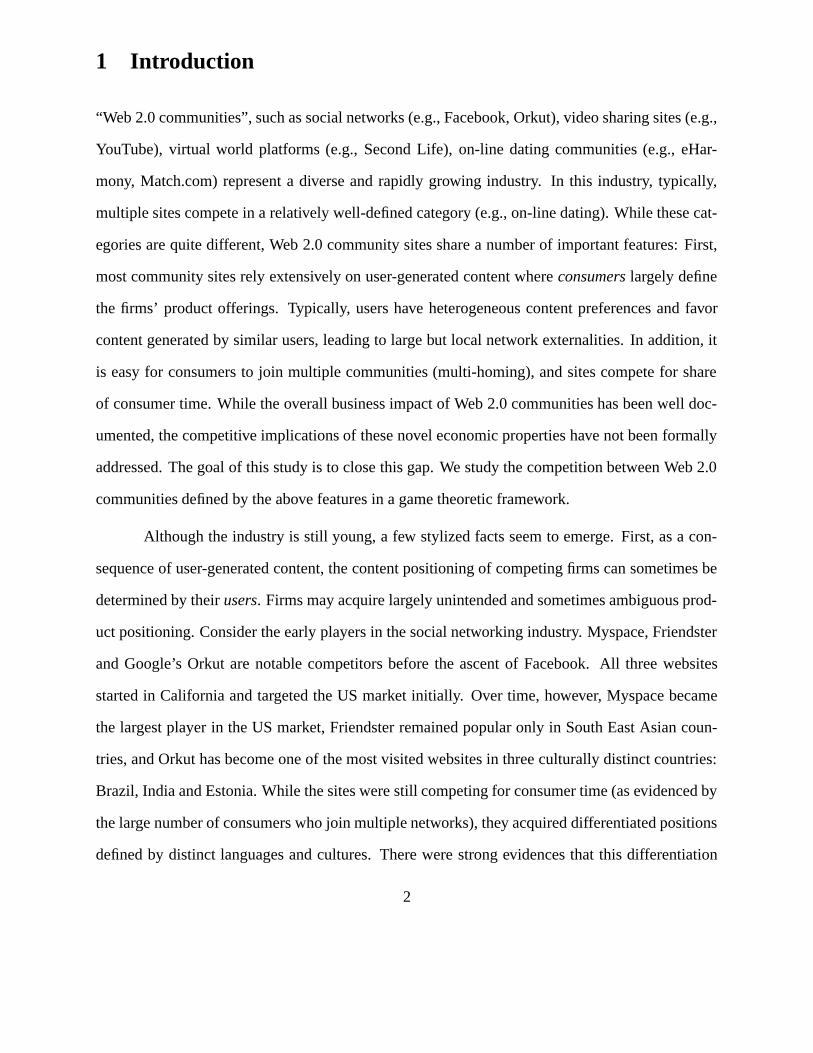
The equilibrium time allocation patterns are illustrated on Figure 2. Consumers located at
the two ‘ends’ of the linear city prefer the content hosted in site i while the consumers residing in
the ‘middle’ prefer the content hosted in site −i. In equilibrium, the firm with the divided clientele
sets a lower advertising level to retain its consumers. Interestingly, although the mass centers of
the two firms’ content overlap (at x = 12), the sites are differentiated because of the highly localized
content preferences. Furthermore, firm i attracts two distinct segments of consumers who do not
enjoy the presence of each other. More specifically, the marginal network effects δ (x,y) between
these two segments of consumers are small and can be negative.
This outcome is reminiscent of Orkut’s simultaneous success in three culturally distinct
countries: Brazil, India and Estonia. Orkut became one of the most visited websites in Brazil and
India until 2010. As of April 2010, 48% of Orkut’s traffic comes from Barzil while 39% of its
traffic is from India. At the same time, it has also become the most used social network platform in
17We provide a special case to better illustrate the intuition: when γ = 1, the equilibrium becomes:
T ∗i (x) =
⎧⎪⎪⎪⎨⎪⎪⎪⎩
2 if x < 12 −
4α+β+2∗√
4α2−5αβ+2β 2
14β
0 if 12 −
4α+β+2∗√
4α2−5αβ+2β 2
14β ≤ x ≤ 12 +
4α+β+2∗√
4α2−5αβ+2β 2
14β
2 if x > 12 +
4α+β+2∗√
4α2−5αβ+2β 2
14β
20
Estonia18. Although these three user groups are simultaneously present in the Orkut community,
they form subcommunities that seldomly interact with each other. Figure 2 can be considered an
illustration of the Orkut case where Myspace (later Facebook) dominates the US market while
Orkut is popular among Barzilians and Indians (i.e., two disjoint segments of consumers). In
addition, multicultural consumers - such as Brazilians and Indians living in the US - are found to
be the most likely multi-homers who join both Orkut and Facebook/Myspace.
Single-homingconsumers in community i
Single-homingconsumers in community i
Multi-homingconsumers
Multi-homingconsumers
Single-homingconsumers in community -i
0 10
2
1
x
T* i(x
)
Figure 2: Spontaneous Differentiation with Divided Clientele for Firm i
To summarize, the model provides a variety of qualitatively different market outcomes and
may explain some of the observed patterns in the evolution of Web 2.0 communities. Importantly,
the existence of different types of equilibria depends on the localness ( βα ), not the magnitude
(δ (x,y)), of network effects. For example, the case α = 3,β = 3 represents large network ex-
ternalities. The average marginal network effect is δ (x,y) = 2. On the other hand, α = 1,β = 0
represent small average marginal network effects with δ (x,y) = 1. Spontaneous differentiation can
be sustained in the former case but winner-take-all outcome emerges in the latter.
Being a unique feature of the Web 2.0 community market, what is the profit implication of
spontaneous differentiation? Since users generate content, how do consumer behavior parameters
18http://en.wikipedia.org/wiki/Orkut
21

impact firm profits? Next, we present a number of comparative static results to examine how the
localness of network externalities (measured by β when α is fixed) and saturation from repeated
content consumption (measured by γ) impact consumer behavior and firm profits. We focus on the
case described in Proposition 2 where spontaneous differentiation emerges between the competing
firms. Corollary 1 examines consumer behavior.
Corollary 1 (Consumer Behavior). In the spontaneous differentiation equilibrium, more con-
sumers multi-home when γ and β are small. Put differently, multi-homing is more likely when
network effects are more global and saturation from repeated content consumption is strong.
As expected, consumers are more likely to multi-home when saturation from repeated con-
tent consumption is strong (γ is small). Furthermore, global network effects lead to more con-
sumers multi-homing. Global network effects imply that consumers have broader interests. There-
fore, they multi-home in order to reach out to different types of content. Taken together with the
findings from Proposition 1, we observe that when network effects become more global, the num-
ber of multi-homing consumers first increases — then decreases as the winner-take-all outcome
emerges, in which case all consumers single-home in the same community.
Corollary 2 (Firm Profits). In the spontaneous differentiation equilibrium, firm profits are increas-
ing in β and γ: i.e., firm profits are higher when network effects are more local and saturation in
content consumption is weaker.
In the classic horizontal differentiation literature, the degree of product differentiation is
usually measured by a ‘transportation cost’ parameter t a la Hotelling. Higher transportation cost
implies higher profits. In the Web 2.0 community setup, we observe that the localness of network
effect β is the counterpart of the transport cost parameter in the classic scenario. As Figures 1 and 2
illustrate, differentiation between Web 2.0 community websites stems from the different locations
of their content generating users. The localness of network effects makes this differentiation more
pronounced. Firm profits rise as network effects become more local.
22

0 0.5 10
1
2
x
T* i(x)
α = 8, β = 6, γ = 0.5
0 10.50
1
2
xT* i(x
)
α = 8, β = 6, γ = 0.95
Product Position of Community −iProduct Position of Community i
Product Position of Community i
Product Position of Community −i
Figure 3: Content Positions under High and Low γ
Interestingly, we observe that consumer multi-homing coincides with lower firm profits.
This stands in sharp contrast with the earlier findings in the literature. When horizontal differentia-
tion depends on firms’ choices of market positioning, multi-buying usually diminishes the strategic
incentives of price cutting since there is less need to compete for consumers who purchase both
products (Guo 2006, Xiang and Sarvary 2007, Doganoglu and Wright 2006). Consequently, in the
classic model, more multi-homing consumers would likely lead to higher firm profits. When con-
tent is user-generated, we observe that consumer multi-homing behavior endogenously changes
the degree of spontaneous differentiation. When a user participates in competing websites, the
content she contributes is also likely to appear on both websites. Thus, multi-homing behavior
leads to greater overlap of content and therefore less product differentiation. Figure 3 illustrate
the equilibrium product positions of competing firms for γ = 0.95 and γ = 0.5. Clearly, sites’
product offerings become more similar under lower γ . Figure 4 illustrates the degree of product
differentiation (as measured by v1x=0−v2
x=0) and the number of multi-homing consumers as a func-
tion of γ . The figure shows a clear negative relationship between the two variables: the degree of
23

0.65 0.7 0.75 0.8 0.85 0.9 0.95 10
0.5
Multi
−hom
ing C
onsu
mers
γ
0.65 0.7 0.75 0.8 0.85 0.9 0.95 10.6
0.8
Pro
duct
Diff
ere
ntia
tion
Multi−homing Consumers
Product Differentiation
Figure 4: Multi-homing Coincides with Less Spontaneous Differentiation
spontaneous differentiation is maximized when no consumer multi-homes.
It is worth pointing out that saturation from repeated content consumption is just one of
the many possible causes to consumer multi-homing behavior. However, we believe that the above
link between multi-homing and the degree of product differentiation is a fundamental property
of user-generated content. The finding in Corollary 2 is likely to generalize to situations where
consumer multi-homing is caused by other factors.
5 Extensions
In this section, we explore two extensions to the basic model. First, we analyze the effect of market
growth both in terms of depth and breadth. Second, we study the firms’ incentives to influence the
localness of network externalities.
5.1 Market Growth
The growth of the Web 2.0 community market is significant not just in terms of size (i.e., the
number of new consumers) but as importantly, in terms of breadth (i.e., the heterogeneity of con-
24

sumers). For example, while at the outset only young people used social networks, today all age
groups start embracing social network services. To model market growth, we introduce ‘market
density’ and ‘market heterogeneity’ as additional parameters. We analyze the impacts of market
growth in a comparative static framework. Formally, we assume that a mass ρ of consumers are
uniformly distributed on a linear city [0,H], where H measures the heterogeneity of the consumers.
Proposition 5 establishes the comparative static result about the impact of ρ and H on the market
structure.
Proposition 5. Under larger H, the spontaneous differentiation equilibrium is more likely to exist
and the winner-take-all equilibrium is less likely to exist. ρ has no impact on equilibrium market
structure.
Consistent with the findings from the classic network externality literature, market expan-
sion in heterogeneity leads to less concentrated market structure where competing firms co-exist.
The intuition is that the degree of horizontal product differentiation grows with market heterogene-
ity. Market tipping (e.g., the winner-take-all outcome) is less likely to take place when product
differentiation is large.
More surprisingly, we find that growth in market size (ρ) has no impact on the likelihood
of different market outcomes. This result stands in contrast with the conventional wisdom from
the network effect literature. The classic network effect model predicts that when the breadth of
the market is fixed, increase in market density will increase the likelihood of the winner-take-
all outcome. This is because market density determines the magnitudes of network effects, and
larger network effects lead to market tipping when differentiation is exogenously given. However,
when differentiation spontaneously emerges from user-generated content, product differentiation
increases when the market is denser. The growth in product differentiation counterbalances the
growth in network effects and does not change the equilibrium market structure.
Overall, Proposition 5 reveals that when the market grows in both size and heterogeneity,
25

the Web 2.0 community industry tends to become more fragmented with multiple firms coexisting.
This provides a demand-side explanation to industry observations on market fragmentation. Social
media practitioners observe that social networks will ‘become smaller’ (Stafford 2009), and that
niche networks are becoming tremendously successful despite the immense user bases of dominant
players (e.g., Facebook) in the market (Bloomberg Businessweek 2009). For example, Ning.com, a
provider of customized social networks, has experienced dramatic growth in recent years, hosting
over 1 million specialized social networks as of 2009 (Read Write Web 2009). Similarly, the online
dating industry has observed a plethora of specialized dating websites, such as the Geek-to-Geek
network which has drawn over 200000 self declared geeks (Bloomberg Businessweek 2011). What
underlies the success of niche networks? Supply side factors certainly play important roles. As the
Web 2.0 community industry matures and its profit potential becomes clearer, more players have
entered the market and tried to creatively target niche segments. However, in traditional network
industries, we often observe a higher degree of market concentration as the market matures, even
when there is market entry. Our analysis provides a demand-side explanation to the fragmentation
phenomenon by arguing that when user-generated content is responsible for the differentiation
between firms, market growth leads to more differentiation, which in turn prevents the winner-
take-all outcome from taking place.
5.2 Designing Internet Communities: Connectivity vs Fragmentation
Since spontaneous differentiation derives from user-generated content, can firms take actions to
influence the degree of differentiation? In this section, we address this ‘community design’ prob-
lem. We argue that firms can endogenously influence α and β by either enhancing or dampening
connectivity within their communities. Consider the following example:
• In the Second Life meta-verse, social interaction can be managed through the geographical
layout of the virtual world. An ‘archipelago’ layout makes the users reside in isolated,
26

more exclusive communities. From consumer x’s perspective, the addition of a dissimilar
consumer y into the community has little marginal benefit, since the probability that x will
encounter y is very low. This corresponds to a higher β — δ (x,y) quickly diminishes as |x−y| becomes large. On the other hand, a ‘Pangaea’ layout, where every user can potentially
meet every other, offers the users maximal opportunities to encounter dissimilar others. The
enhanced connectivity leads to a lower β such that the consumer derives some marginal
utility as a dissimilar other joins the community.
• Video-sharing websites such as YouTube can endogenously influence α and β by choosing
the level of content cross-linking. On YouTube, for example, a ‘suggestion’ list of related
videos is displayed to viewers of a certain video. Increasing cross-linking is likely to de-
crease β .
• Social networking websites can use design features such as ‘groups’ and ‘lists’ to reduce
user interaction. On the two extremes, the community can allow highly customized ‘gated
communities’ to exist (like Ning.com where each user builds his own social network and
users can hardly reach each other across different networks) or the site can provide an open
environment where everyone interacts in the same grand network.
Clearly, many of the above actions have simultaneous impacts on α and β . When con-
sumers interact in exclusive groups, both α and β are likely to be increased, leading to enhanced
network effects when |x− y| is small and diminished network effects when |x− y| is large. Put
differently, the connectivity-fragmentation decision has both a direct effect (by influencing the
level of network effects in each community) and a strategic effect (by influencing the degree of
spontaneous differentiation between the communities). To isolate the strategic effect as best as we
can, we consider a special case where firm decisions only impact β . Specifically, we consider a
two stage game where firms choose between two alternative ‘designs’ in the first stage: (α,β ) or
27

(α,β), where β < β . To keep the model tractable, we assume γ = 1 and focus on the sponta-
neous differentiation equilibrium in Proposition 2. We keep parameters ρ and H introduced in the
previous section. Proposition 6 states the firms’ equilibrium community design strategies.
Proposition 6. The firms’ equilibrium strategic choices can be described by a threshold policy.
Specifically, both firms design their communities to encourage fragmentation (i.e., choosing β ) if:
β > β ∗(α,β ,H). Furthermore, β ∗ is decreasing in H. Both firms encourage connectivity (i.e.,
choosing β ) when β is close to β .
Proposition 6 outlines the equilibrium conditions under which firms prefer to encourage
fragmentation versus connectivity in their communities. Contrary to conventional wisdom that en-
hancing network externalities in a network industry is beneficial for the firms, Web 2.0 community
firms have an incentive to reduce the connectivity in their communities. Moreover, firms are more
likely to reduce connectivity if such reduction leads to lower network effects (higher β ). The intu-
ition underlying this result resembles the idea of maximal product differentiation. By unilaterally
making the network externalities more local, a firm faces smaller demand (a negative direct ef-
fect). On the other hand, more local network externalities reduce the firms’ incentives to compete
for consumers (a positive strategic effect). When the strategic effect dominates, firms will deliber-
ately decrease connectivity in their community. Put differently, firms have incentives to maximize
the ex-post spontaneous differentiation.
In contrast to the classic product differentiation literature, however, there exists a parame-
ter region where both firms encourage connectivity in their respective communities, which leads to
minimal spontaneous differentiation. In a model of classic horizontal differentiation, the strategic
effect of higher differentiation always exceeds the direct effect. Under spontaneous differentiation,
however, the direct effect of higher connectivity (lower β ) is magnified by the network externali-
ties. A larger demand translates into higher network effects, which leads to even higher demand.
As Proposition 6 states, there exist a parameter region where the direct effect of decreasing β
28

exceeds the strategic effect and both firms choose high connectivity. This case represents a pris-
oner’s dilemma situation where firm profits would be higher if both firms chose more local network
effects, but they cannot coordinate on such an outcome.
Finally and intuitively, as the market expands in heterogeneity (H), the firms are more
likely to pursue the fragmentation strategy. Again, we find that market size ρ does not have an
effect on firm decisions.
The above results provide a strategic explanation to some stylized facts in the industry. As
discussed in the introduction, we observe that various successful Web 2.0 community sites have
recently implemented measures to enhance local interaction at the cost of broader connectivity. Ex-
amples include the recent move by Facebook which allows users to interact in smaller groups (New
York Times 2010) and Second Life’s shifting focus into the archipelago design. These changes are
believed to be motivated by the need to minimize negative network effects and boost interactivity
within exclusive spaces. Beyond this obvious reason, our analysis suggest that firms may encour-
age fragmentation within their own communities also to reduce competition. Notably, firms have
incentives to make consumers interact in smaller groups even if this approach strictly decreases the
marginal network effects.
6 Concluding Remarks
In this paper, we study the competition between Web 2.0 community websites. We model three
unique aspects of the Web 2.0 community industry, namely (i) user-generated content, (ii) local
network externalities and (iii) consumer multi-homing. We find that when content is strictly user-
generated, identical firms may spontaneously acquire differentiated market positions by attracting
different groups of content contributors. We study the properties of this spontaneous differentiation
and find that more local network effects increase the degree of differentiation while multi-homing
coincides with reduced differentiation. As extensions, we analyze the role of market expansion
29

and study firms’ community design problem, where the firms may either encourage ‘fragmenta-
tion’ or enhance ‘connectivity’. The analysis reveals that as the market grows, the Web 2.0 com-
munity market tends to become less concentrated and firms are more likely to design fragmented
communities. Our results are consistent with a number of stylized facts observed in the Web 2.0
community industry.
The Web 2.0 community industry is a fast developing industry with many innovations in
both the technology and business domains. The power of mass interaction and user generated
content is being leveraged into more and more business and public policy contexts, such as distance
learning and collaboration within organizations, new product ideation and open innovation contests
as well as social ventures such as peer-to-peer micro-finance. Our stylized model intends to capture
some fundamental features of Web 2.0 community competition, leaving a number of interesting
issues for future research. For example, many Web 2.0 community sites are characterized by a
mixture of user-generated content and firm-produced content. Firms can increase the site’s appeal
to a certain segment of consumers by interface design or by injecting relevant content into their
community. Under such circumstances, the interaction between spontaneous differentiation and
firm chosen differentiation becomes an interesting issue. As another example, one trend observed
in the Web 2.0 community industry is the sharing of content between sites (see e.g., the recent
content sharing agreement between LinkedIn and Twitter). Similarly, the OpenSocial standard
advocated by Google greatly facilitates the sharing of content among participating websites. An
interesting research direction is to explore firms’ incentives to share content in a competitive setup.
Finally, as a theoretical note, we believe that the development of user-generated content is
a phenomenon that is of interest for both marketing and economics. There is broad agreement that
user-generated content represents a novel situation not fully addressed by the traditional economics
literature. Theoretically, our analysis suggest a close link between the notion of user-generated
content and network effects. The classic model of network externalities can be considered a model
30

of user-generated content where the quality of the product (network) depends on the number of
contributing users. Ex-ante identical firms can obtain ex-post different quality levels as a result of
consumer coordination. When network effects are localized, both vertical (quality) and horizontal
differentiation can occur as a result of user coordination. Further developing this argument is an
interesting avenue for theoretical research.
Appendix
A Stable Fulfilled Expectation Equilibrium
In this section, we provide definitions for Stable Fulfilled Expectation Equilibrium. Stability im-
plies that in equilibrium, when there is a small perturbation in the market expectation, the con-
sequent market outcome (consumer time allocation pattern) is not ‘too different’ from the equi-
librium. We assume that when the market expectation changes, the market expects the marginal
consumers (those who are the most likely to change their time allocation pattern) to change their
time allocation decisions first.
Definition 1. (Marginal Consumer) In any FEE equilibrium T ∗1 ,a
∗1,a
∗2, a marginal consumer is
defined as x ∈ [0,1] who is indifferent between two alternative time allocation plans. We say T′
1 is
an ε-marginal perturbation of T ∗1 if T
′1(x) and T ∗
1 (x) are different only in ε intervals around the
marginal consumers.
Definition 2. (Stable Fulfilled Expectation Equilibrium) A Stable Fulfilled Expectation Equilib-
rium consists of a time allocation pattern T ∗i (x) that satisfies the following condition: ∃δ , ∀ ε-
marginal perturbation T′i (x) of T ∗
i (x) where ε < δ ,∥∥∥Γ(T ′
i (x))−Γ(T ∗i (x))
∥∥∥ <∥∥∥T
′i (x)−T ∗
i (x)∥∥∥,
where ‖·‖ is the 1-norm of real-valued functions: ‖ f (x)‖= ∫x∈[0,1] | f (x)|dx.
Intuitively, the above condition states that given any small perturbation in market expecta-
tion, the change in realized time allocation patterns is not too large. This condition is a generaliza-
31

tion of the stability conditions in the classic network externalities literature, which are shown to be
necessary to rule out implausible outcomes19.
B Proofs for Propositions
PROOF OF PROPOSITION 1: A stable FEE meets three necessary conditions:
⎧⎪⎪⎪⎪⎨⎪⎪⎪⎪⎩
a∗1 = argmaxa1a1p(
∫x∈C T r
1 (x,T∗
1 ,a1,a2)dx)
a∗2 = argmaxa2a2p(
∫x∈C 1−T r
1 (x,T∗
1 ,a1,a2)dx)
∀x, T ∗1 (x) = T r
1 (x,T∗
1 ,a∗1,a
∗2).
In words, the advertising levels are best responses to each other given the market expec-
tation, and the market expectation is self-fulling. In addition, the market expectation is stable as
defined in Definition 2. We first show that the equilibrium stated in Proposition 1 ∀x,T ∗1 (x) = 2,
a∗1 = γ(α − β2 ) and a∗2 = 0 satisfy these conditions iff α > 3β
2 and γ > 12 . Next we verify that the
equilibrium is always stable.
Step 1: We first provide conditions such that given market expectation ∀x,T ∗1 (x) = 2, ad-
vertising levels a∗1 = γ(α − β2 ) and a∗2 = 0 are best responses to each other. To solve the advertising
game, we first derive the demand and profit functions. When ∀x,T ∗1 (x) = 2 and a∗2 = 0, from Equa-
tion (4), the consumer located at x derives utility c+ x(α −β x2)+ (1− x)(α −β 1−x
2 )−a1 −a2 if
she multi-homes (spends one unit of time in each community). Her utility is c+(1+ γ)(x(α −β x
2) + (1 − x)(α − β 1−x2 ))− 2a1 if she spends both units of her time in community 1. Thus
when a2 = 0 and a1 < γ(x(α −β x2)+ (1− x)(α −β 1−x
2 )), consumer x will prefer spending both
units of her time in community 1. Otherwise, the consumer will allocate one unit of time in
each community. The marginal consumer can be determined by solving the x that is indifferent
19See Farrell and Klemperer (2005). For example, without the stability condition, the outcome that each firm hasa 50% market share is always a FEE. This outcome, however, is not stable when network effects are global. Anyinfinitestimal perturbation in market expectation will lead to the winner-take-all outcome.
32

between single-homing in community 1 and multi-homing. Specifically, when a1 ≤ γ(α − β2 ),
all consumers single-home in site 1. When γ(α − β2 ) < a1 < min{γ(α − β
4 ),α − β2 }, consumers
x ∈ (12 −
√4αβγ2−β 2γ2−4a1βγ
2βγ , 12 +
√4αβγ2−β 2γ2−4a1βγ
2βγ ) will single-home in community 1 while the
other consumers multi-home. When γ(α − β4 ) < a1 < α − β
2 , all consumers multi-home. When
a1 > α − β2 , consumers on the two ends of the linear city start to single-home in community 2.
Given T ∗1 (x) = 2 and a∗2 = 0, site 1’s profit function in the range a1 ∈ (0,α − β
2 ) is:
Π(a1,a∗2,T
∗1 (x)) =
⎧⎪⎪⎨⎪⎪⎩
a1 for a1 ≤ γ(α − β2 )
a1(12 +
√4αβγ2−β 2γ2−4a1βγ
2βγ ) for γ(α − β2 )< a1 < min{γ(α − β
4 ),α − β2 }
12a1 for γ(α − β
4 )< a1 < α − β2 ,
The profit function is increasing when a1 ≤ γ(α − β2 ) and γ(α − β
4 )< a1. The profit func-
tion is concave when γ(α − β2 )< a1 <min{γ(α− β
4 ),α− β2 }. For a∗1 = γ(α− β
2 ) to be the optimal
advertising level, it is required that:
{ ∂Π(a1,a∗2,T∗
1 (x))∂a1
|a1=γ(α− β
2 )< 0
γ(α − β2 )>
12(α − β
2 ).(12)
The first condition implies that when a1 = γ(α − β2 ), site 1 has no incentives to marginally
rise advertising such that the consumers located at 0 and 1 start to multi-home. The second condi-
tion implies that the site doesn’t choose an advertising level such that all consumers multi-home.
Since ∂Π(a1,a∗2,T∗1 (x))
∂a1|a1=γ(α− β
2 )= 3β−2α
2β , these conditions are satisfied i f f α > 3β2 and γ > 1
2 .
Finally, observe that when a1 > α − β2 , consumers on the two ends of the linear city start
to single-home in site 2. Clearly, ∂Π(a1,a∗2,T∗
1 (x))∂a1
|a1=α− β
2<
∂Π(a1,a∗2,T∗
1 (x))∂a1
|a1=γ(α− β
2 )< 0. Thus, site
1 doesn’t have incentives to advertise beyond α − β2 when a∗1 = γ(α − β
2 ) is locally optimal.
Given ∀x,T ∗1 (x) = 2, a∗1 = γ(α − β
2 ), we show that site 2’s best response is a∗2 = 0. Given
site 1’s advertising level, site 2 cannot gain positive demand regardless of its advertising level.
33

Thus, any positive advertising level is weakly dominated.
Step 2: We next prove that given the advertising levels, T ∗1 (x) = 2 is self-fulfilling. It
can be easily seen that given a∗1 = γ(α − β2 ) and a∗2 = 0, all consumers prefer to single-home in
community 1.
Step 3: We next prove that this equilibrium is always stable. Consider an ε-perturbation in
market expectation as described in Definition 2:
T′(x) =
⎧⎨⎩
1 for x < ε2 for ε ≤ x ≤ 1− ε1 for x > 1− ε.
The consumers’ time allocation can be characterized as follows: consumer x multi-homes
if a1−a2 < γ((x−ε)(α−β x−ε2 )+(1−x−ε)(α −β 1−x−ε
2 )) and single-homes in site 1 otherwise.
The demand and profits functions can be derived accordingly. Importantly, at any advertising level,
we have Π(a1,a2,T′
1(x)) = Π(a1,a2,T ∗1 (x))+o(ε), where o(ε) is on the same order of magnitudes
as ε . It is easy to verify that a1 = γ(α − β2 )− γ(2α −β )ε −βγε2 and a2 = 0 are best responses to
each other when:
⎧⎨⎩
∂Π(a1,0,T′
1 (x))∂a1
|a1=γ(α− β
2 )−γ(2α−β )ε−βγε2 < 0
γ(α − β2 )− γ(2α −β )ε −βγε2 > 1
2(α − β2 )+(β −α)ε − (βε2)/2.
(13)
The left-hand-sides of inequalities in condition (13) differ from the left-hand-sides of the
inequalities in condition (12) by amounts that are on the order of magnitude of ε . Since the
inequalities in condition (12) are not binding when α > 3β2 and γ > 1
2 , condition (13) are also
satisfied when ε is sufficiently small. Intuitively, when ε is sufficiently small, site 1 can win the
entire market by a small decrease in advertising level a∗1 and will indeed do so. In other words,
Γ(T ′(x)) = Γ(T ∗(x)) for sufficiently small ε . This is true for any parameter values α > 3β
2 and
γ > 12 . The equilibrium is thus stable. This concludes the proof.
34

�
PROOF OF PROPOSITION 2: Consider a∗1 = a∗2 =γβ+β+αγ2−α
2(γ+3) and T ∗1 (x) as described in Propo-
sition 2. We first verify that for any parameters, the advertising levels are best responses to each
other and that the time allocation pattern is self-fulfilling. Then we show that the equilibrium is
also stable iff α < 5β+7βγ8γ−5γ2+5 .
Step 1: The market expectation T ∗1 (x) defines the marginal consumers x∗1 =
2(β−α+αγ)β (γ+3) such
that consumers y < x∗1 and y > 1− x∗1 are expected to be the single-homers. We first derive firm
profit functions. From Equation (4) and (5), we know that when consumer y’s content is expected to
appear in both communities, consumer x derives marginal utility δ (x,y) from y’s content regardless
of her time allocation decision (txy = 2). Thus, only the unique content (i.e., content that appears in
only one community) matters for consumer x’s decision of multi-homing vs single-homing. From
Equation 4, we know consumer x’s decision can be characterized by the following rule:
T r1 (x,T
∗1 ,a1,a2) =
⎧⎪⎪⎪⎪⎪⎪⎪⎨⎪⎪⎪⎪⎪⎪⎪⎩
2 if γ∫
y<x∗1δ (x,y)dy−a1 >
∫y>1−x∗1
δ (x,y)dy−a2
1 ifγ∫
y<x∗1δ (x,y)dy−a1 ≤
∫y>1−x∗1
δ (x,y)dy−a2
γ∫
y>1−x∗1δ (x,y)dy−a2 ≤
∫y<x∗1
δ (x,y)dy−a1
0 if γ∫
y>1−x∗1δ (x,y)dy−a2 >
∫y<x∗1
δ (x,y)dy−a1.
(14)
For a∗1 = a∗2 to be best responses to each other, it is necessary for them to be local best
response to each other. When a1 and a2 are not too different, consumers x< 12 prefer single-homing
in community 1 to single-homing in community 2. Thus, x < 12’s time allocation decision reduces
to choosing between single-homing in community 1 and multi-homing. Similarly, consumers x> 12
choose between single-homing in community 2 and multi-homing. Thus, the demand schedule can
be characterized by:
35

T r1 (x,T
∗1 ,a1,a2) =
⎧⎨⎩
2 if x < x1(x∗1,a1,a2)1 if x1(x∗1,a1,a2)< x < x2(x∗1,a1,a2)0 if x > x2(x∗1,a1,a2),
(15)
where x1(x∗1,a1,a2) is defined by γ∫
y<x∗1δ (x1,y)dy−a1 =
∫y>1−x∗1
δ (x1,y)dy−a2 and x2(x∗1,a1,a2)
is defined by∫
y<x∗1δ (x2,y)dy− a1 = γ
∫y>1−x∗1
δ (x2,y)dy− a2. The T r1 (x,T
∗1 ,a1,a2) function can
be fully described by x1 and x2. The exact expressions for x1(x∗1,a1,a2) and x2(x∗1,a1,a2) are
complicated, but the derivatives ∂x1(x∗1,a1,a2)∂a1
and ∂x1(x∗1,a1,a2)∂x∗1
at x∗1 = 2(β−α+αγ)β (γ+3) are easy to obtain
from implicit function theorems. For example,
∂x1(x∗1,a1,a2)
∂a1
=−∂ (γ
∫y<x∗1
δ (x1,y)dy− ∫y>1−x∗1
δ (x1,y)dy−a1 +a2)/∂a1
∂ (γ∫
y<x∗1δ (x1,y)dy− ∫
y>1−x∗1δ (x1,y)dy−a1 +a2)/∂x1
=− 1β (1− x∗1)+ γβx∗1
.
Firm profits are:
Π1(a1,a2,x∗1) = (x1(x∗1,a1,a2)+x2(x∗1,a1,a2)−x1(x∗1,a1,a2)
2 )a1
Π2(a1,a2,x∗1) = (1− x2(x∗1,a1,a2)+x2(x∗1,a1,a2)−x1(x∗1,a1,a2)
2 )a2.(16)
The best responses are characterized by the first order conditions:
{ ∂Π1(a1,a2,x∗1)∂a1
= 0∂Π2(a1,a2,x∗1)
∂a2= 0.
(17)
The exact expressions of ∂Π1(a1,a2,x∗1)a1
and ∂Π2(a1,a2,x∗1)a2
can be obtained by plugging in
∂x1(x∗1,a1,a2)∂a1
=− 1β (1−x∗1)+γβx∗1
, ∂x1(x∗1,a1,a2)∂a2
= 1β (1−x∗1)+γβx∗1
, ∂x2(x∗1,a1,a2)∂a1
= 1βx∗1+γβ (1−x∗1)
, ∂x2(x∗1,a1,a2)∂a2
=
− 1βx∗1+γβ (1−x∗1)
at x1 = x∗1 and x2 = 1−x∗1. We verify that the advertising levels a∗1 = a∗2 =γβ+β+αγ2−α
2(γ+3)
satisfy the first order conditions. It is easy to see that the sites do not have incentives to deviate
their advertising levels far from a∗1 = a∗2 to qualitatively change the demand schedule, such that no
36

consumer will single-home in community 1 or 2. Thus, the advertising levels are also global best
response to each other.
Step 2: It is easy to verify that the market expectation is self fulfilling, by observing that
the advertising levels and market expectation satisfy the following system of equations:
{x1(x∗1,a
∗1,a
∗2) = x∗1
x2(x∗1,a∗1,a
∗2) = 1− x∗1
(18)
Step 3: Finally we provide conditions under which the equilibrium is also stable according
to Definitions 1 and 2. Note that the marginal consumers in this case consist of the consumers
located at x∗1 and 1− x∗1. Any marginal perturbation of T′
1(x) of T ∗1 (x) can be described by x
′1 and
x′2 such that |x′
1 − x∗1| < ε and |x′2 − (1− x∗1)| < ε . Thus the Γ mapping is reduced to a function
R2 → R2, which defines (x′1,x
′2)→ (Γ1(x
′1,x
′2),Γ2(x
′1,x
′2)). The stability condition can be inferred
from the eigenvalues of the Jacobian matrix:
∣∣∣∣∣∣∣⎛⎜⎝
∂Γ1(x′1,x
′2)
∂x′1
∂Γ1(x′1,x
′2)
∂x′2
∂Γ2(x′1,x
′2)
∂x′1
∂Γ2(x′1,x
′2)
∂x′2
⎞⎟⎠−σ I
∣∣∣∣∣∣∣x′1=x∗1,x
′2=1−x∗1
= 0. (19)
The partial derivatives are obtained by the total derivative formula. In words, when market
expectation changes, the realized time allocation pattern changes for two reasons. First, when
advertising levels are fixed, consumers change their time allocation behavior due to the change in
their valuation of the sites’ content. Second, sites change their advertising level, which leads to
further change in consumer time allocation decision. For example,
∂Γ1(x′1,x
′2)
x′1
=∂x1(x
′1,a1,a2)
∂x′1
+∂x1(x
′1,a1,a2)
∂a1
∂a1
∂x′1
+∂x1(x
′1,a1,a2)
∂a2
∂a2
∂x′1
,
where derivatives ∂a1
∂x′1
and ∂a2
∂x′1
describe how the equilibrium advertising levels change with x′1.
All the derivatives are evaluated at x∗1 = 2(β−α+αγ)β (γ+3) and a∗1 = a∗2 =
γβ+β+αγ2−α2(γ+3) . ∂x1(x
′1,a1,a2)
∂x′1
and
37

∂x1(x∗1,a1,a2)∂a1
are evaluated as before based on the implicit function theorem and the implicit defi-
nition of x1(x′1,a1,a2).
∂a1
∂x′1
and ∂a2
∂x′1
are obtained based on the implicit function theorem from the
first order conditions (17).
The stability condition is met when both eigenvalues σ are bounded by 1 in absolute values.
This leads to the condition α < 5β+7βγ8γ−5γ2+5
. Finally, when α > β4 , the consumers always derive
positive network utility from the community they join.
�
PROOF OF PROPOSITION 3: When a1 = a2 ≡ 0, the fulfilled expectation equilibrium must
satisfy ∀x, T ∗1 (x) = T r
1 (x,T∗
1 ,0,0). Clearly, the same equilibrium time allocation pattern described
in Proposition 2 is self-fulfilling:
T ∗1 (x) =
⎧⎪⎪⎨⎪⎪⎩
2 if x < 2(β−α+αγ)β (γ+3) ,
1 if 2(β−α+αγ)β (γ+3) ≤ x ≤ 1− 2(β−α+αγ)
β (γ+3) ,
0 if x > 1− 2(β−α+αγ)β (γ+3) .
(20)
This is due to the fact that when a1 = a2, the time allocation decision of a consumer depends
only on her expectation of other consumers’ time allocation pattern. Thus T ∗1 (x) is self-fulling
under a1 = a2 = 0 if and only if it is self-fulfilling under a∗1 = a∗2 =
γβ+β+αγ2−α2(γ+3) .
The stability of the equilibrium can be determined by examining the eigenvalues of the
Jacobian matrix, as in the proof for Proposition 2. Without competitive interaction, we have
∂Γ1(x′1,x
′2)
x′1
=∂x1(x
′1,a1,a2)
∂x′1
. This leads to the conditions given in Proposition 3.
Finally, the stability conditions is equivalent to γ(α − βx∗1) +α − β (1− x∗1) < 0 where
x∗1 =2(β−α+αγ)
β (γ+3) . Since α −βx∗1 >α−β (1−x∗1), it is a necessary condition that α −β (1−x∗1)< 0.
Note that ∫ ∫(x,y)∈{(x,y)|txy=0}
δ (x,y)dydx = (1− x∗1)(α −β (1− x∗1)).
38

Thus, a necessary condition for the spontaneous differentiation outcome to be stable is
∫ ∫(x,y)∈{(x,y)|txy=0}
δ (x,y)dydx < 0
.
�
PROOF OF PROPOSITION 4: The proof of Proposition 4 follows the exact same logic as Propo-
sition 2. The derivation is algebraically tedious and is done with the help of mathematical software.
Consider any symmetric market expectation in which the consumers located in the middle of the
linear city will single-home in site 1 and the consumers located at the two ends of the linear city
will single-home in site 2. Observe that given this market expectation and any advertising levels,
the consumer behavior is monotonic: those located at the ends of the linear city are strictly more
likely to single-home in community 2 while those located closer to x = 12 are strictly more likely to
single-home in community 1. We derive demand schedules as before. We show that the advertising
levels are locally best response to each other by verifying that they simultaneously solve the two
first order conditions.
We provide the analytical expressions for A(α,β ,γ) , B(α,β ,γ) and λ (γ). A and B are
described by the following general expressions:
A(α,β ,γ) = λ1(γ)α+λ2(γ)β+λ3(γ)√
λ4(γ)α2+λ5(γ)β 2+λ6(γ)αβλ7(γ)β
B(α,β ,γ) = λ8(γ)α+λ9(γ)β+λ10(γ)√
λ4(γ)α2+λ5(γ)β 2+λ6(γ)αβλ7(γ)β
(21)
where λ1 −λ10 are defined as:
39

λ1(γ) = γ5 +3γ4 + γ3 −21γ2 +18γ +6λ2(γ) = 6γ2 −3γ4 −3/2γ3 −1/2γ5 −10γ −3λ3(γ) = 3/2γ −1+1/2γ2
λ4(γ) = 4γ6 −8γ5 +40γ4 −112γ3 +116γ2 +24γλ5(γ) = γ6 +6γ5 + γ4 −14γ3 +32γ2 +6γλ6(γ) =−γ6 −16γ5 +12γ4 −96γ3 +120γ2 +24γλ7(γ) = γ5 +6γ4 −7γ3 −6γ2 +28γ +6λ8(γ) = 2γ5 +4γ4 −18γ3 +38γ2 −8γ −2λ9(γ) = 2γ4 +4γ3 −14γ2 +10γ +2λ10(γ) =−2γ +3+ γ−1
The condition α > β2 is required such that in equilibrium, all consumers derive positive
network utility from the communities they join.
�
PROOF OF COROLLARY 1: From Proposition 2, the percentage of multi-homing consumers is
measured by m = 1−2x∗1 where x∗1 =2(β−α+αγ)
β (γ+3) . Taking derivatives of m with respect to β and γ ,
we have ∂m∂β =−4α(1−γ)
β 2(γ+3) < 0 and ∂m∂γ =−16α−4β
β (γ+3)2 < 0. Thus, more consumers multi-home when γ
and β are smaller.
�
PROOF OF COROLLARY 2: From Proposition 2, firm profits are Π = βγ+β+αγ2−α2(γ+3) . Taking
derivatives of Π with respect to β and γ , we have ∂Π∂β = 1+γ
2(γ+3) > 0 and ∂Π∂γ = α
2 − 4α−β(γ+3)2 > 0. Thus,
profits increase when γ and β are larger.
�
PROOF OF PROPOSITION 5: When we introduce market size ρ and heterogeneity H, the con-
sumer utility function becomes:
ux = c+ γ∫
y∈[0,H]
ρH
δ′(x,y, txy)dy−T1(x)a1 −T2(x)a2 (22)
40

The equilibrium of the game can be found in the exact same way as in the proof of Propo-
sition 1 and 2. The existence condition for the winner-take-all equilibrium is: α > 3Hβ2 . The exis-
tence condition for the spontaneous differentiation equilibrium is: α < H 5β+7βγ8γ−5γ2+5
. Since H > 1,
∀α,β , α < 5β+7βγ8γ−5γ2+5
implies α < H 5β+7βγ8γ−5γ2+5
and α > H 3β2 implies α > 3β
2 . Thus, winner-take-all
equilibrium is less likely under higher H, spontaneous differentiation equilibrium is more likely
under higher H. ρ is a scaling factor for the equilibrium profits but it doesn’t have an impact on
the existence of different types of equilibria. �
PROOF OF PROPOSITION 6: The strategic choice game is solved by backward induction. We
first solve for the subgames (β ,β ), (β ,β ), (β ,β ). Then we find the conditions for first stage
equilibrium.
From Proposition 5, when γ = 1, firm profits equal H3 β4 in the (β ,β ) subgame and H3 β
4
in the (β ,β) subgame. The (β ,β ) subgame can be solved following the procedure described in
the proof of Proposition 2. Specifically, assume that market expectation is T e1 (x) =
{2 x < xe
10 x > xe
1.
The equilibrium advertising levels are obtained from the first order conditions:
a∗1 =4αxe
1−2Hα+3H2β+βxe21 −βxe2
1 +2Hβxe21 −2Hβ xe
16
a∗2 =2Hα−4αxe
1+3H2β−βxe21 +βxe2
1 +4Hβxe1−4Hβ xe
16
(23)
From the advertising levels, we obtain the realized consumer time allocation patterns as
functions of the market expectation. From the condition that market expectation is self-fulfilling,
we obtain the equilibrium consumer time allocation pattern:
x∗1 =H5+
2α −3Hβ +
√H2β 2
+7H2ββ +H2β 2 −6Hαβ −6Hαβ +4α2
5(β −β )(24)
Recall that we fix γ = 1 and therefore consumers do not multi-home in this setup. x∗1 is
the fulfilled network size of the site who chooses β . Consumers from [0,x∗1] will join site 1 and
41

consumers from [x∗1,1] will join site 2. Plugging x∗1 into the equilibrium advertising levels, we
obtain the equilibrium site profits:
Π1 =(48α2+12H2β 2−18H2β 2
+24H2ββ−72Hαβ−12Hαβ+(24α+12Hβ−18Hβ )Φ)2
4500(2α+Hβ+Hβ+Φ)(β−β )2
Π2 =(48α2+12H2β 2−18H2β 2+24H2ββ−72Hαβ−12Hαβ+(24α+12Hβ−18Hβ )Φ)2
4500(2α+Hβ+Hβ+Φ)(β−β )2
, (25)
where Φ =
√4α2 −6Hαβ −6Hαβ +H2β 2 +7H2ββ +H2β 2
.
The equilibrium firm strategies can be obtained by comparing the profits in the subgames.
It is an equilibrium strategy that both firms encourage fragmentation if:
(48α2 +12H2β 2 −18H2β 2+24H2ββ −72Hαβ −12Hαβ +(24α +12Hβ −18Hβ )Φ)2
4500(2α +Hβ +Hβ +Φ)(β −β)2< H3 β
4. (26)
The strategy defined above can be described by a threshold policy: both sites pursue the frag-
mentation strategy if β > β ∗(α,β ,H). To prove this, first observe that the inequality (26) can be
rewritten as:
F(β ) = H3 4500β4
(2α +Hβ +Hβ +Φ)(β −β )2−
(48α2 +12H2β 2 −18H2β2+24H2ββ −72Hαβ −12Hαβ +(24α +12Hβ −18Hβ)Φ)2
> 0
The equation F(β ) = 0 has three real roots which can be identified with the help of math
software: β∗1 = β , β
∗2 =− 2αβ
2α−β , and β∗3 > β
∗1. Thus, F(β ) crosses zero at most once in the range
[β ,+∞]. Further, note that dF(β )dβ
|β=β = 0. The first derivative function is semi-differentiable:
d2F(β )dβ 2 |β→β− > 0 and d2F(β )
dβ 2 |β→β+ < 0. Thus we know F(β) is negative for β that is slightly
larger than β and positive for β that is slightly smaller than β . In addition, F(+∞) > 0 since
the coefficient of the β4
term is positive. Therefore, F(β ) > 0 for β ∈ (β∗3,+∞) and F(β ) < 0
for β ∈ (β ,β ∗3). This concludes the proof: firms both encourage fragmentation when β > β ∗
3. In
42

addition, the threshold is decreasing in H. Due to symmetry, we show that the firms pursue the
connectivity strategy when F(β)> 0. This is satisfied when β is slightly smaller than β .
�
References
Anderson, S.P., S. Coate. 2005. Market Provision of Broadcasting: A welfare analysis. Review ofEconomic Studies 72(4) 947–972.
Anderson, S.P., J. Gans. 2010. Platform Siphoning: Ad-Avoidance and Media Content. CEPRDiscussion Papers .
Armano, D. 2009. Six Social Media Trends for 2010. http://blogs.hbr.org/cs/2009/11/six_social_media_trends.html. [Online; accessed 04-Nov-2010].
Banerji, A., B. Dutta. 2009. Local Network Externalities and Market Segmentation. InternationalJournal of Industrial Organization 27(5) 605–614.
Benabou, R., J. Tirole. 2006. Incentives and Prosocial Behavior. The American Economic Review96(5) 1652–1678.
Bloomberg Businessweek. 2009. Special Report: The Future of Social Media. http://www.businessweek.com/technology/special_reports/20080519thefuture.htm. [Online;accessed 04-Nov-2010].
Bloomberg Businessweek. 2011. The Lonely Hearts Clubs. http://www.businessweek.com/magazine/content/11_05/b4213105926073.htm. [Online; accessed 04-Feb-2011].
Boyd, D. 2010. White Flight in Networked Publics? How Race and Class Shaped American TeenEngagement with MySpace and Facebook. Lisa Nakamura, Peter Chow-White, eds., DigitalRace Anthology. Routledge.
Caillaud, B., B. Jullien. 2003. Chicken & Egg: Competition Among Intermediation ServiceProviders. Rand Journal of Economics 34(2) 309–328.
Chen, Y., J. Xie. 2007. Cross-market Network Effect with Asymmetric Customer Loyalty: Impli-cations for competitive advantage. Marketing Science 26(1) 52.
d’Aspremont, C., J.J. Gabszewicz, J.F. Thisse. 1979. On Hotelling’s” Stability in Competition”.Econometrica: Journal of the Econometric Society 47(5) 1145–1150.
Dmitri, K., R. Shachar. 2010. User Generated Content and Image Advertising. Working Paper,Washington University and Tel Aviv University .
43

Doganoglu, T., J. Wright. 2006. Multihoming and Compatibility. International Journal of Indus-trial Organization 24(1) 45–67.
Dukes, A. 2004. The Advertising Market in a Product Oligopoly. The Journal of IndustrialEconomics 52(3) 327–348.
Dukes, A., E. Gal-Or. 2003. Negotiations and Exclusivity Contracts for Advertising. MarketingScience 22(2) 222–245.
Farrell, J., P. Klemperer. 2005. Coordination and Lock-in: Competition with Switching Costs andNetwork Effects. Handbook of Industrial Organization 3 1967–2072.
Fjeldstad, Ø., E.R. Moen, C. Riis. 2009. Competition with Local Network Externalities. WorkingPaper, Norwegian School of Management .
Gabszewicz, J.J., D. Laussel, N. Sonnac. 2004. Programming and Advertising Competition in theBroadcasting Industry. Journal of Economics & Management Strategy 13(4) 657–669.
Godes, D., D. Mayzlin, Y. Chen, S. Das, C. Dellarocas, B. Pfeiffer, B. Libai, S. Sen, M. Shi,P. Verlegh. 2005. The Firm’s Management of Social Interactions. Marketing Letters 16(3)415–428.
Guo, L. 2006. Consumption Flexibility, Product Configuration, and Market Competition. Market-ing Science 25(2) 116–130.
Hirschman, A.O. 1964. The paternity of an index. The American Economic Review 761–762.
Katz, M.L., C. Shapiro. 1985. Network Externality, Competition and Compatibility. AmericanEconomic Review 75(3) 424–440.
Katz, M.L., C. Shapiro. 1986. Technology Adoption in the Presence of Network Externalities. TheJournal of Political Economy 94(4) 822.
Kirkpatrick, D. 2011. The Facebook effect: The inside story of the company that is connecting theworld. Simon & Schuster.
Lenhart, A. 2009. Social Networks Grow: Friending Mom and Dad. http://blogs.hbr.org/cs/2009/11/six_social_media_trends.html. [Online; accessed 04-Nov-2010].
New York Times. 2010. Facebook Lets Users Interact in Small Groups. http://www.nytimes.com/2010/10/07/technology/07facebook.html. [Online; accessed 04-Nov-2010].
Ofek, E., M. Sarvary. 2001. Leveraging the Customer Base: Creating Competitive AdvantageThrough Knowledge Management. Management Science 47(11) 1441.
Read Write Web. 2009. Ning Now Hosts 1 Million Social Networks. http://www.readwriteweb.com/archives/ning_now_hosts_1_million_social_networks.php.[Online; accessed 04-Nov-2010].
44

Shaked, A., J. Sutton. 1982. Relaxing Price Competition Through Product Differentiation. TheReview of Economic Studies 49(1) 3–13.
Stafford, P. 2009. The Next 15 Trends in Social Networking. http://www.smartcompany.com.au/index.php?option=com_content&view=article&id=33750&Itemid=27. [On-line; accessed 04-Nov-2010].
Sun, B., J. Xie, H.H. Cao. 2004. Product Strategy for Innovators in Markets with Network Effects.Marketing Science 23(2) 243–254.
Tucker, Catherine, Juanjuan Zhang. 2010. Growing Two-Sided Networks by Advertising the UserBase: A Field Experiment. Marketing Science 29(5) 805–814.
Wilbur, K.C. 2008. A Two-Sided, Empirical Model of Television Advertising and Viewing Mar-kets. Marketing Science 27(3) 356.
Xiang, Y., M. Sarvary. 2007. News Consumption and Media Bias. Marketing Science 26(5) 611–628.
Xie, J., M. Sirbu. 1995. Price Competition and Compatibility in the Presence of Positive DemandExternalities. Management Science 41 909–909.
45


![05[2] Strategy competitors, competitive rivalry, competitive behavior, and competitive dynamics · PDF fileDefine competitors, competitive rivalry, competitive behavior, and competitive](https://img.pdfslide.us/doc/110x75/5aa5b2eb7f8b9ac8748d8018/052-strategy-competitors-competitive-rivalry-competitive-behavior-and-competitive.jpg)