Embed Size (px)
Citation preview

Vision Research 38 (1998) 2277–2288
A comparison of two computer-based face identification systemswith human perceptions of faces
Peter J.B. Hancock *, Vicki Bruce, Mike A. BurtonDepartment of Psychology, Uni6ersity of Stirling, Stirling, FK9 4LA, Scotland, UK
Department of Psychology, Uni6ersity of Glasgow, Glasgow, Scotland, UK
Received 20 December 1996; received in revised form 26 June 1997; accepted 18 November 1997
Abstract
The performance of two different computer systems for representing faces was compared with human ratings of similarity anddistinctiveness, and human memory performance, on a specific set of face images. The systems compared were a graph-matchingsystem (Lades M, Vorbruggen JC, Buhmann J, Lage J, von der Malsburg C, Wurtz RP, Konen W. IEEE., Trans Comput1993;42:300–311.) and coding based on principal components analysis (PCA) of image pixels (Turk M, Pentland A. J CognitiveNeurosci 1991;3:71–86.). Replicating other work, the PCA-based system produced very much better performance at recognisingfaces, and higher correlations with human performance with the same images, when the images were initially standardised usinga morphing procedure and separate analysis of ‘shape’ and ‘shape-free’ components then combined. Both the graph-matching and(shape+shape− free) PCA systems were equally able to recognise faces shown with changed expressions, both providedreasonable correlations with human ratings and memory data, and there were also correlations between the facial similaritiesrecorded by each of the computer models. However, comparisons with human similarity ratings of faces with and without the hairvisible, and prediction of memory performance with and without alteration in face expressions, suggested that the graph-matchingsystem was better at capturing aspects of the appearance of the face, while the PCA-based system seemed better at capturingaspects of the appearance of specific images of faces. © 1998 Elsevier Science Ltd. All rights reserved.
Keywords: Computer systems; Similarity; Human memory performance; Face; Images
1. Introduction
Engineers attempting to build computer systems forthe recognition and matching of faces have at theirdisposal a bewildering variety of possible techniques.For example, faces may be represented and comparedas lists of measurements of features (e.g. interoculardistance, length of nose, width of mouth)1, or morecomplex area or ratio measures (e.g. ratio of face widthto face height), or they may be described in terms ofparametric variations on an underlying 3D surface [1].However, the techniques which have had most recentsuccess have been based upon relatively low level
image-features (note the hyphen: the term ‘features’ isreserved here for facial landmarks such as nose andeyes). For example, in a recent competition funded bythe Army Research Laboratory to find the most robustface recognition method [2], the systems which reachedthe final stages were those of Pentland et al. [3], basedupon principal components analysis (PCA) of imagepixel values, Wiskott et al. [4], based upon graph-matching of Gabor wavelets and Atick [5], based uponlocal feature analysis, which is derived from PCA.
The apparent success of these systems is particularlyinteresting given that they all seem to rely not onabstracted information about faces, per se, but insteadcode images of faces in terms only of lower-level char-acteristics. PCA is a method of dimensional reductionwhich codes statistical regularity in a set of images (inthis case faces). Treating each image as a vector of(pixel intensity) values, it is possible to derive eigenvec-tors, relatively few of which capture most of the vari-
* Corresponding author. Fax: +44 1786 467641; e-mail:[email protected].
1 Some of these measurements, however, would require reliableand automatic methods for locating features, itself a far from trivialproblem.
0042-6989/98/$19.00 © 1998 Elsevier Science Ltd. All rights reserved.
PII: S0042-6989(97)00439-2

P.J.B. Hancock et al. / Vision Research 38 (1998) 2277–22882278
ance in the image set. Images of faces can subsequentlybe represented not as a vector of pixels, but as theweighted sum of eigenvectors which best reconstructsthe original. In this way, facial images are representedin terms of the statistical regularities within a set. Incontrast, the system based on graph-matching of Gaborwavelets does not capture regularity within a set, butspecific image characteristics. The images are filtered bysets of Gabor filters at several scales and orientations(see Fig. 4), centred at each of a number of pointsaround the face. These points form a labelled graph,with vertices represented by the outputs of the filters. Inthe graph-matching system described by Wiskott et al.[4], the graph derived from a particular facial image ismatched against a set of stored graphs derived fromother face images. Successful matching occurs as afunction of goodness of fit measures derived from thesematches.
Although these classes of system are very differentfrom one another, they share the characteristic of beingbased on image properties, rather than abstract repre-sentations of faces. Interestingly, there is now consider-able evidence that human representation of faces maysimilarly be based upon relatively low level image-fea-tures rather than more abstract descriptions of facialfeatures (i.e. feature separations or protuberances).Suggestive evidence for this proposal comes from thefact that human face recognition is severely disruptedby certain image transformations which might bethought to leave abstract representations untouched.First, human face recognition is considerably disturbedif faces are shown in photographic negatives [6,7], andit is not clear why this should be so if simple featuremeasurements formed the basis of our representations.Recognition and matching of faces is also severelydisrupted by changes in direction of lighting, particu-larly where unfamiliar lighting directions are used [8,9].Human face recognition is also very poor if simple linedrawings are shown which depict the outline of facefeatures (thereby preserving their spatial layout), butvery much enhanced if a simple thresholding operationis added which blacks in areas which were originallydark in the image [10,1]. Again, it is not clear why thisresult should occur if faces were represented as lists offeature measurements, although effects of negation,image thresholding and lighting might all be explicableif 3D shape-from shading were an important compo-nent of building face representations. However, if hu-man face perception delivers a 3D model of a face it isunclear why recognition of previously unfamiliar facesis so badly disrupted when viewpoint is changed [11].
Such observations have led us to suggest that thehuman visual system encodes faces on the basis of animage coding which preserves information about rela-tive light and dark, which may permit recovery of shapefrom shading. The artificial face recognition systems
described by [12,13,4] have each been attributed somepossible biological plausibility. Principal componentsanalysis is readily implemented by neural networks, andTurk and Pentland [12] speculate that human facerecognition is a good candidate for a recognition mech-anism based upon fast, low-level 2D image processing,in contrast to the multi-stage model-based approachcommon in descriptions of 3D object recognition. Thedevelopment of von der Malsburg’s system was guidedby a dynamic link theory of binding [14,15] and theGabor wavelets which it uses have been likened toreceptive fields in primary visual cortex [16]. Thesesystems are described in more detail below.
Given the appeal made by the authors of such sys-tems to their psychological/biological plausibility, therehave been rather few attempts to evaluate them againsthuman data. A number of authors have examined howwell human recognition memory for faces, or ratings offace distinctiveness, memorability and so forth, corre-late with measures of distinctiveness/typicality derivedfrom PCA applied to the same set of images [17–19]. Ingeneral, PCA yields good predictions of human perfor-mance with the same set of face images. Thus O’Tooleet al. [18] found that measures of face distinctivenessdelivered by PCA coding cross-loaded with human faceratings and with d % scores obtained from memory ex-periments. Hancock et al. [19] demonstrated that sepa-rate coding and recombination of faces via ‘shape’ and‘shape-free’ image components (see section on com-puter analyses, below) produced better performancestill. However, one disadvantage of all previous evalua-tions of PCA against human performance with faces isthat it is memory for the pictures, rather than of thefaces, which has been tested. As noted by a number ofauthors [11,20,21], typical face memory experiments inwhich identical pictures are shown at study and testconfound face recognition with picture memory. Oneaim of the work described in this article is to examinehow well PCA is able to predict which faces will be wellremembered when they must be recognised in differentexpressions.
Research which examines how well performance ofthe graph-matching system correlates with human per-formance has been more limited still, though Bieder-man [25] reports some preliminary data using a facematching paradigm. In these studies, the graph-match-ing system has proved able to predict how humanmatching of faces declines as viewpoint between thefaces-to-be matched is increased. However, the systemhas not been used to predict the similarity space be-tween different individual faces.
In none of the above studies has any attempt beenmade to compare the performance of the system undertest with another image-based coding system, so wherethere are correlations with human performance it is notknown if these arise because of general aspects of the

P.J.B. Hancock et al. / Vision Research 38 (1998) 2277–2288 2279
Fig. 1. From left: Original face image, from the expression set; neutral version of same face with hair manually removed; triangulation used tomark the ‘shape’ of the face; ‘shape free’ face after morphing to the average shape.
system (e.g. coding of image-features) or from some-thing more specific. In the work presented here, theperformance of human observers against both graph-matching and PCA systems are compared, to identifywhich of the two computational models provides abetter prediction of human performance, and why.
Three different areas of human performance withfaces were examined: (1) similarity; (2) rated distinctive-ness; and (3) actual memory. For similarity judgements,observers were asked to sort face images into piles,based on their appearance. For distinctiveness, theywere asked to rate how easily they thought they wouldrecognise the face. Subsequently, their actual ability torecognise the faces was tested in a surprise recognitiontask, thereby producing actual memory scores. Thefollowing section describes the collection of these datain more detail. Then described are the two computer-based recognition systems and finally, the human andcomputer perceptions of the same faces are compared.
2. Human perceptions of faces
2.1. Materials
Our image set was derived from 50 young adultCaucasian males. Each person was photographed froma set distance with a neutral expression, and then askedto display happiness, disgust and surprise. However,not all of the original 200 images were usable fortechnical reasons and in addition, some of the ‘expres-sions’ were not entirely convincing, leaving us with 186usable images. The set of 50 neutral expressions wasused as targets, and an additional two or three extraimages of each person, a total of 136, as a test set.
3. Distinctiveness and memorability measurements
3.1. Materials
The 50 neutral faces and another 50, picked arbitrar-ily from the expressing faces, one per identity, were
used. They were displayed at 240×280 pixels, corre-sponding to approximately 5 cm width on a Sun moni-tor, with 256 grey levels. Backgrounds were removedmanually using a digital editing program and replacedwith a plain white field. Each set was split arbitrarilyinto two halves, A and B. An example of one of theexpressing faces is shown in Fig. 1.
3.2. Participants
Sixty volunteer white Caucasian undergraduates, ap-proximately half male, were paid to take part in theexperiment. The participants did not know any of thepeople shown in the photographs.
3.3. Method
Participants were initially shown 25 faces, from oneof the half sets A or B, sequentially, and asked to rateeach for distinctiveness on a scale of 1–10, promptedby the question: ‘suppose you had to meet this personat a station, how easy would it be to pick them out’. Ascore of ten corresponds to easy, meaning distinctive.
After a gap of 10–15 minutes, while they were doingunrelated object-recognition tasks, participants wereshown 50 faces, without prior warning. They wereasked to respond, again on a scale of 1 to 10, howcertain they were that each face had been shown in thefirst part of the experiment, with 10 being certain that ithad. The responses to those that had in fact been seenwere averaged to give a hit score for each face, whilethose for distracter faces were averaged to give falsepositive scores.
There were three test conditions. One set of partici-pants were shown neutral faces initially, and subse-quently tested on the same set (NN). A second set wereshown neutral and tested on expressing (NE), while thethird were shown expressing and tested on neutral(EN). In the NN condition, the images used in ratingand recognition phases were identical, allowing thepossibility of image rather than face recognition. Therewere 20 participants in each condition, half seeing theA set for rating, half the B set.

P.J.B. Hancock et al. / Vision Research 38 (1998) 2277–22882280
Table 1Average ratings for the three test conditions
Hit score S.D. False positive S.D. S.D.Distinctiveness S.D.
1.1 7.5NN 1.36.1 3.5 1.2NE 6.1 1.1 6.5 1.5 4.5 1.1
0.90 6.3EN 1.56.0 4.0 1.5
S.D. criterion S.D.d %
1.2 0.12 0.56NN 1.91.0 0.05 0.420.88NE
1.3EN 1.1 0.27 0.65
S.D., standard deviation.
The values for distinctiveness, hit score and falsepositive score from the ten participants for each half setwere combined to give average values for each face.Since two groups (NN and NE) rated the neutral facesfor distinctiveness, these values could be averaged over20 ratings for subsequent comparison with computerdata.
3.4. Results
Table 1 shows mean and standard deviations (S.D.)of the results for the three different conditions. There isno significant difference in the three distinctivenessratings (Anova, F (2,98)=0.27), but there is an effectof condition on memorability of the faces (hit score: F(2,98)=24.8, PB0.01; false positive score: F (2,98)=14.3, PB0.01). Our observers did find it easier torecognise the same image than the same face with adifferent expression. That they should also find it easierto reject distracter images in the NN condition ispresumably because of their increased confidence withrecognising the correct targets, since the distracter im-ages in all three conditions are equally unseen.
A high hit score for an individual face does notnecessarily mean it was memorable: it could be that italso has a high false positive score. In this case, observ-ers are responding yes whether or not it was actuallyseen before; the face simply seems familiar. This effecthas been termed ‘context free familiarity’ [22], since theconfusion presumably comes from the participants’other experience of faces, though it could also be thatthe face really does resemble one in the distracter set.
By signal detection theory, a high familiarity (=highhit and false positive) score would correspond to partic-ipants using a low criterion. Highly memorable faces,with high hit score and low false positive score, willhave a high value for d %. Although it is not usual tocompute d % values using single observations from multi-ple observers, it can be done. The responses are bi-narised such that responses of six or above are countedas ‘yes’, five and below as ‘no’. These average hit rates
yield values for d % and criterion, average values forwhich are reported in Table 1. The values for d %confirm an effect of condition on memorability (F(2,98)=26.3, PB0.01) but there is no effect on crite-rion (F (2,98)=2.86, P\0.01).
4. Similarity ratings
A sorting task was used to gather information aboutthe perceived similarity of our set of faces. The task wascarried out with and without hair information.
4.1. Materials
The same 50 male face images, on a white back-ground as before, were printed at 3.5×4.5 in. on alaser printer and enclosed in clear sleeves to preventhandling damage. A second set of prints was producedfollowing editing to remove the hair from the images,see Fig. 1.
4.2. Participants
Eighty volunteer white Caucasian undergraduates,approximately half male and none of whom had partic-ipated in experiment 1, were paid to take part in theexperiment, half sorting images with hair, half without.
4.3. Method
The participants were given the set of 50 prints, andasked to sort them into sets based on facial similarity.They were free to choose how many subsets to createand what the basis for separation should be. If printsare laid on top of each other in piles, there is atemptation to match only to the most recent member ofa pile. Participants were therefore encouraged to spreadthem out on a large table or the floor, in order to helpwith the identification of coherent groupings. The pro-cess typically took about 20 min.
P.J.B. Hancock et al. / Vision Research 38 (1998) 2277–2288 2281
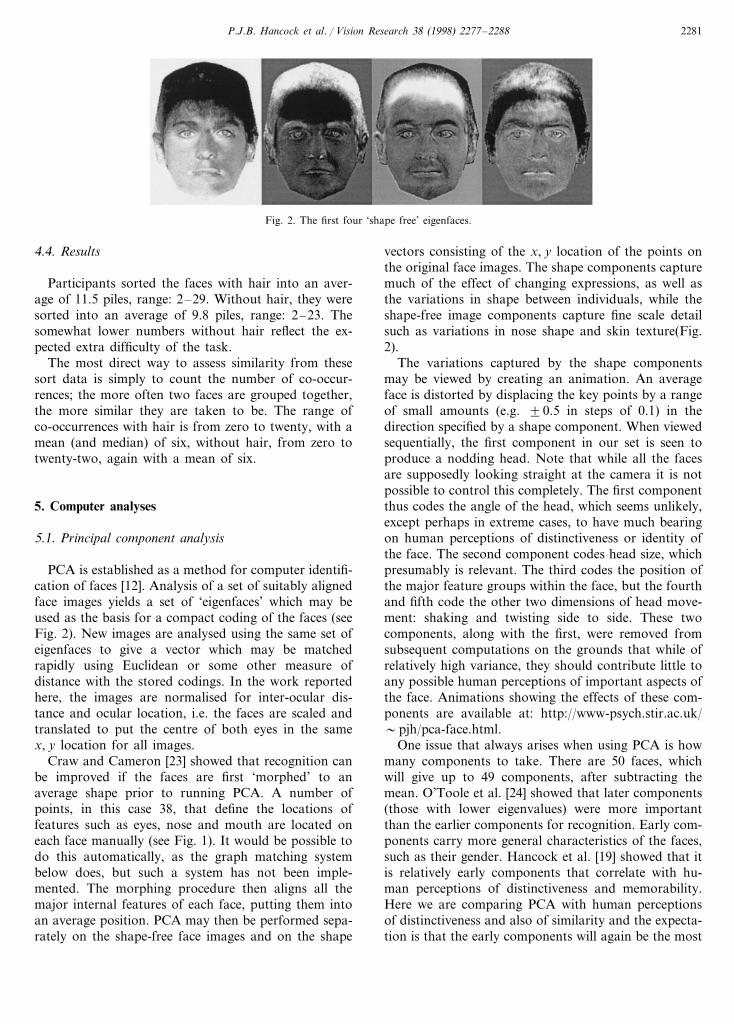
Fig. 2. The first four ‘shape free’ eigenfaces.
4.4. Results
Participants sorted the faces with hair into an aver-age of 11.5 piles, range: 2–29. Without hair, they weresorted into an average of 9.8 piles, range: 2–23. Thesomewhat lower numbers without hair reflect the ex-pected extra difficulty of the task.
The most direct way to assess similarity from thesesort data is simply to count the number of co-occur-rences; the more often two faces are grouped together,the more similar they are taken to be. The range ofco-occurrences with hair is from zero to twenty, with amean (and median) of six, without hair, from zero totwenty-two, again with a mean of six.
5. Computer analyses
5.1. Principal component analysis
PCA is established as a method for computer identifi-cation of faces [12]. Analysis of a set of suitably alignedface images yields a set of ‘eigenfaces’ which may beused as the basis for a compact coding of the faces (seeFig. 2). New images are analysed using the same set ofeigenfaces to give a vector which may be matchedrapidly using Euclidean or some other measure ofdistance with the stored codings. In the work reportedhere, the images are normalised for inter-ocular dis-tance and ocular location, i.e. the faces are scaled andtranslated to put the centre of both eyes in the samex, y location for all images.
Craw and Cameron [23] showed that recognition canbe improved if the faces are first ‘morphed’ to anaverage shape prior to running PCA. A number ofpoints, in this case 38, that define the locations offeatures such as eyes, nose and mouth are located oneach face manually (see Fig. 1). It would be possible todo this automatically, as the graph matching systembelow does, but such a system has not been imple-mented. The morphing procedure then aligns all themajor internal features of each face, putting them intoan average position. PCA may then be performed sepa-rately on the shape-free face images and on the shape
vectors consisting of the x, y location of the points onthe original face images. The shape components capturemuch of the effect of changing expressions, as well asthe variations in shape between individuals, while theshape-free image components capture fine scale detailsuch as variations in nose shape and skin texture(Fig.2).
The variations captured by the shape componentsmay be viewed by creating an animation. An averageface is distorted by displacing the key points by a rangeof small amounts (e.g. 90.5 in steps of 0.1) in thedirection specified by a shape component. When viewedsequentially, the first component in our set is seen toproduce a nodding head. Note that while all the facesare supposedly looking straight at the camera it is notpossible to control this completely. The first componentthus codes the angle of the head, which seems unlikely,except perhaps in extreme cases, to have much bearingon human perceptions of distinctiveness or identity ofthe face. The second component codes head size, whichpresumably is relevant. The third codes the position ofthe major feature groups within the face, but the fourthand fifth code the other two dimensions of head move-ment: shaking and twisting side to side. These twocomponents, along with the first, were removed fromsubsequent computations on the grounds that while ofrelatively high variance, they should contribute little toany possible human perceptions of important aspects ofthe face. Animations showing the effects of these com-ponents are available at: http://www-psych.stir.ac.uk/�pjh/pca-face.html.
One issue that always arises when using PCA is howmany components to take. There are 50 faces, whichwill give up to 49 components, after subtracting themean. O’Toole et al. [24] showed that later components(those with lower eigenvalues) were more importantthan the earlier components for recognition. Early com-ponents carry more general characteristics of the faces,such as their gender. Hancock et al. [19] showed that itis relatively early components that correlate with hu-man perceptions of distinctiveness and memorability.Here we are comparing PCA with human perceptionsof distinctiveness and also of similarity and the expecta-tion is that the early components will again be the most

P.J.B. Hancock et al. / Vision Research 38 (1998) 2277–22882282
Fig. 3. The effects of varying the number of ‘shape free’ components on correlations with human data: (1) Correlation with d % scores; (2) Averagerank correlations with similarity ratings. For each graph, last PC includes all components from one up to that one, first PC includes allcomponents from that one up to 49.
significant. To anticipate our results somewhat, Fig. 3shows correlations with similarity and distinctiveness asthe number of components is varied. The details ofwhat is being plotted are explained below, for now it isthe general form of the graphs tha are of interest. Muchof the correlation comes from the very first componentand in both cases rises to a maximum after only a fewcomponents are included. Removing the early compo-nents from the correlation causes it to fall away rapidly,leaving only noise by the time ten are excluded.
Similar results are obtained for all the varieties ofPCA considered here. Exactly where the maximumoccurs varies, but in all cases it was at less than tencomponents. Rather than fiddle about using differentnumbers of components in each condition, the first tenwill be used in all our tests, since it is patterns of resultsrather than the ultimate performance that is interestingand the fall-off of correlation is very slight in any case.The stability of the plots in Fig. 3 indicates that it isunlikely that much is being missed.
This leaves the question of how to combine the shapeand shape-free image components. Some form of scal-ing is necessary, since otherwise the shape componentswill dominate as they have a larger numerical variance,for no interesting reason (one set of components beingin the dimension of pixel co-ordinates, the other in thedimension of pixel grey-levels). Since there is no priorreason to suppose either component type has moresignificance, the two sets are scaled to have equalvariance prior to combination. The first ten shape-freeimage components, and the first ten shape componentsare taken, excluding one, four and five. Plots similar tothose in Fig. 3 (but not reproduced here) indicate thatthis combination is in a stable region, where adding orremoving one or two components either way has littleeffect on the results.
This results in having four sets of PCA data for thefaces: full image, as per Turk and Pentland, shape-freeimages, as per Craw and Cameron, the shape vectoralone and finally shape+shape-free components com-bined. The components are generated from the targetset of 50 faces, and subsequently used to analyse thetest set of 136. All the results here use the first tencomponents from images (with or without shape re-moval) and the first ten, minus one, four and five, fromthe shape vectors.
5.2. Graph matching system
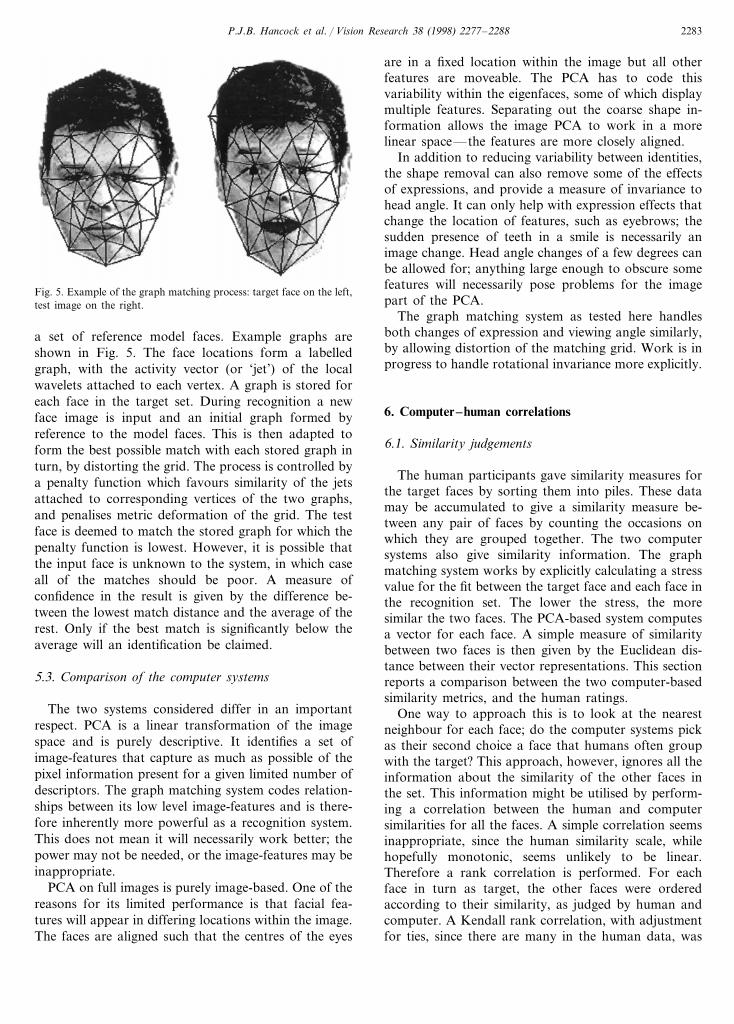
The graph matching face recognition system testedhere was developed by von der Malsburg’s group atRuhr-Universitat Bochum [13]. A full explanation of itsoperation would be impractical here, and readers arereferred to [13]. In summary: face images are coded byfamilies of Gabor-type wavelets (see Fig. 4), at severalscales and orientations, located at a number of loca-tions around the face. The locations are found auto-matically for a new face, by comparing the image with
Fig. 4. Response of an example Gabor filter.
P.J.B. Hancock et al. / Vision Research 38 (1998) 2277–2288 2283
Fig. 5. Example of the graph matching process: target face on the left,test image on the right.
are in a fixed location within the image but all otherfeatures are moveable. The PCA has to code thisvariability within the eigenfaces, some of which displaymultiple features. Separating out the coarse shape in-formation allows the image PCA to work in a morelinear space—the features are more closely aligned.
In addition to reducing variability between identities,the shape removal can also remove some of the effectsof expressions, and provide a measure of invariance tohead angle. It can only help with expression effects thatchange the location of features, such as eyebrows; thesudden presence of teeth in a smile is necessarily animage change. Head angle changes of a few degrees canbe allowed for; anything large enough to obscure somefeatures will necessarily pose problems for the imagepart of the PCA.
The graph matching system as tested here handlesboth changes of expression and viewing angle similarly,by allowing distortion of the matching grid. Work is inprogress to handle rotational invariance more explicitly.
6. Computer–human correlations
6.1. Similarity judgements
The human participants gave similarity measures forthe target faces by sorting them into piles. These datamay be accumulated to give a similarity measure be-tween any pair of faces by counting the occasions onwhich they are grouped together. The two computersystems also give similarity information. The graphmatching system works by explicitly calculating a stressvalue for the fit between the target face and each face inthe recognition set. The lower the stress, the moresimilar the two faces. The PCA-based system computesa vector for each face. A simple measure of similaritybetween two faces is then given by the Euclidean dis-tance between their vector representations. This sectionreports a comparison between the two computer-basedsimilarity metrics, and the human ratings.
One way to approach this is to look at the nearestneighbour for each face; do the computer systems pickas their second choice a face that humans often groupwith the target? This approach, however, ignores all theinformation about the similarity of the other faces inthe set. This information might be utilised by perform-ing a correlation between the human and computersimilarities for all the faces. A simple correlation seemsinappropriate, since the human similarity scale, whilehopefully monotonic, seems unlikely to be linear.Therefore a rank correlation is performed. For eachface in turn as target, the other faces were orderedaccording to their similarity, as judged by human andcomputer. A Kendall rank correlation, with adjustmentfor ties, since there are many in the human data, was
a set of reference model faces. Example graphs areshown in Fig. 5. The face locations form a labelledgraph, with the activity vector (or ‘jet’) of the localwavelets attached to each vertex. A graph is stored foreach face in the target set. During recognition a newface image is input and an initial graph formed byreference to the model faces. This is then adapted toform the best possible match with each stored graph inturn, by distorting the grid. The process is controlled bya penalty function which favours similarity of the jetsattached to corresponding vertices of the two graphs,and penalises metric deformation of the grid. The testface is deemed to match the stored graph for which thepenalty function is lowest. However, it is possible thatthe input face is unknown to the system, in which caseall of the matches should be poor. A measure ofconfidence in the result is given by the difference be-tween the lowest match distance and the average of therest. Only if the best match is significantly below theaverage will an identification be claimed.
5.3. Comparison of the computer systems
The two systems considered differ in an importantrespect. PCA is a linear transformation of the imagespace and is purely descriptive. It identifies a set ofimage-features that capture as much as possible of thepixel information present for a given limited number ofdescriptors. The graph matching system codes relation-ships between its low level image-features and is there-fore inherently more powerful as a recognition system.This does not mean it will necessarily work better; thepower may not be needed, or the image-features may beinappropriate.
PCA on full images is purely image-based. One of thereasons for its limited performance is that facial fea-tures will appear in differing locations within the image.The faces are aligned such that the centres of the eyes

P.J.B. Hancock et al. / Vision Research 38 (1998) 2277–22882284
then calculated on the two orderings. This gives a totalof 50 rank correlations, one per target face, for eachcomparison between the human and computer data.Average values over the 50 faces are shown in Fig. 6.The numbers of components used for the differenttypes of PCA are as described in the section on PCAabove. Note that while the human participants wererating the faces with and without hair, the computersystems are only looking at the faces with hair. It is notthe intention of the authors to establish what thecomputer systems would do if presented with a hairlessface, but what they do when presented with a normalimage with hair, e.g. to what extent might they be‘distracted’ from the inner features when hair informa-tion is present?
Fig. 6 shows that all of the numbers are above theline that marks an average correlation of 0.057, whichcorresponds to PB0.005, so that a formally significantagreement between humans and computer systems isthe case. As the correlations themselves are quite smalland the values approximately normally distributed,statistical tests are performed upon themuntransformed.
Considering differences between the systems, twothings are apparent from Fig. 6: the average correla-tions for the graph matching system when comparedwith humans seeing faces without hair are higher thanfor anything from the PCA-based system, and thefigures for matching with hair are higher than thosewithout. A paired t-test shows no difference betweenthe shape+shape free PCA and graph matching sys-tems’ results with hair (t49=0.98, P\0.05). Anova,comparing graph matching with shape+shape-freePCA with and without hair, shows no effect of com-puter system (F1,49=2.9), but an effect of hair presence(F1,49=11.1, PB0.005) and an interaction betweenthem (F1,49=11.9, PB0.005). It is evident that most ofthe difference between the systems comes from the nohair condition. The graph matching system appearsalmost equally able to capture the similarities used by
humans, whether their judgements come from faceswith or without hair (t49=1.16, p\0.05).
Comparing shape+shape-free with full-image PCA,ANOVA confirms an improvement from the shapeseparation (F1,49=12.3, PB0.05) and again shows aneffect of the presence of hair (F1,49=38.7, PB0.05) butno interaction (F1,49=0.46). Shape-only PCA performsidentically with or without hair which suggests thatpeople do use the shape of the face to assess similaritywhether or not they can see the hair. It does notimprove when humans can see the hair because theshape model contains no information about hair. Thecombination of shape and shape-free image compo-nents again fares best of the PCA systems, both withand without hair.
A final point of interest is whether the two computersystems themselves agree on a similarity ordering. Thatthis is the case is suggested by the observation that therank correlations themselves tend to be correlated.Thus the scores for graph matching and shape+shapefree PCA with human with-hair ratings show r=0.65,PB0.005. Direct comparison of the orderings pro-duced by the two systems confirms this, producing anaverage rank correlation of 0.48, higher than any of thevalues in Fig. 6. Conversely, comparison of the shapewith shape free PCA shows no significant agreement,with an average correlation of only 0.04. Apparentlythese two varieties of PCA capture different aspects ofsimilarity, which combine to produce a better matchwith the human data than either alone.
While the correlations are formally significant, theyare small. Neither computer system does a particularlygood job of explaining the human variance. One possi-ble explanation for this is that the human data arerather noisy. Biederman [25] reports much better corre-lations between the graph matching system and humandata derived from a psychophysical presentationmethod. Two faces are presented in rapid succession,and the participant has to respond simply with whetherthe faces are the same or not. A pilot experiment usingsome of the faces from this experiment also gave largercorrelations than those from the sorting task of thisexperiment, at around 0.35. This method shall be fur-ther explored.
Another possibility is that humans use several simi-larity metrics, of which our computer systems captureonly some subset. Previous work relating computersystems to human performance has indicated that thelatter may be mediated by a number of factors notdirectly addressed by our experiments. Thus O’Toole etal. [18] used principal components analysis to recodetheir human rating data into factors such as memora-bility and accuracy, the latter yielding particularly goodcorrelation with their computer analysis. It is hopedthat further investigation of this area will help to teaseout these complexities.
Fig. 6. Average Kendall rank correlations between human and com-puter-based similarity judgements, when humans are rating faces withand without visible hair. The line marks correlation for PB0.005.

P.J.B. Hancock et al. / Vision Research 38 (1998) 2277–2288 2285
Fig. 7. Correlations between computer systems and human perceptions of distinctiveness.
6.2. Distincti6eness and memorability
The human distinctiveness and memorability datacame from showing participants one set of face imagesfor rating and subsequently testing on a larger set. Thecomputers were given a similar task, being trainedinitially on the complete set of 50 neutral faces. ForPCA, this means using this set to extract the principalcomponents; for the graph matching system, building amodel for each target face. Both systems recognise thetarget set perfectly, so there is no useful information tobe had about distinctiveness from there. The systemswere tested on the complete set of 136 expressionimages. The full PCA system identified all of thesecorrectly, the graph matching system failed on five2.Since none of the images were identical to the targets,there was always some error in the matching process,and it is this error that can be related to humanconcepts of distinctiveness.
There are three sets of human data, from the condi-tions NN, NE and EN. The distinctiveness data fromthe first two may usefully be combined, since bothgroups were rating the same neutral faces. For memo-rability measures, the closest match to the computertask is given by the NE condition, since then bothhumans and computer have a neutral target set and aretested on expressing faces.
For the graph matching system, it is possible tomeasure how confident the system is of its match. It ishoped that a positive correlation between this confi-dence measure and the human-judged distinctivenessand hit rate can be found. For the PCA systems there
are two possible measures. One is a confidence measuresimilar to the graph matching system: what is thedifference between the distance to the desired targetand the mean distance to all the others, as measured onthe axes defined by the principal components. Thesecond is the error of reconstruction; a measure of howwell the test image is coded by the PCA basis faces.Previous work has shown that there are correlationsbetween reconstruction error and human ratings ofdistinctiveness and memorabilty [18,19]. Here, for con-sistency with the graph matching system, results arereported from the PCA confidence measure, but errorof reconstruction shows a very similar pattern ofresults.
6.2.1. Distincti6enessThe results are summarised in Fig. 7, which also
indicates with a vertical line the value of r=0.24, whichis significant at P=0.005 (this low value chosen toadjust for the total of ten correlations computed).
A number of points are apparent from Fig. 7. Thereis generally little to choose between the correlationswith human ratings of expressing and neutral faces. Theshape free PCA is better than full image PCA, while theaddition of shape information again offers some im-provement over the shape free image alone. The graphmatching system is comparable with the PCA-basedsystem.
6.2.2. RecognitionTable 2 summarises the correlations with memory
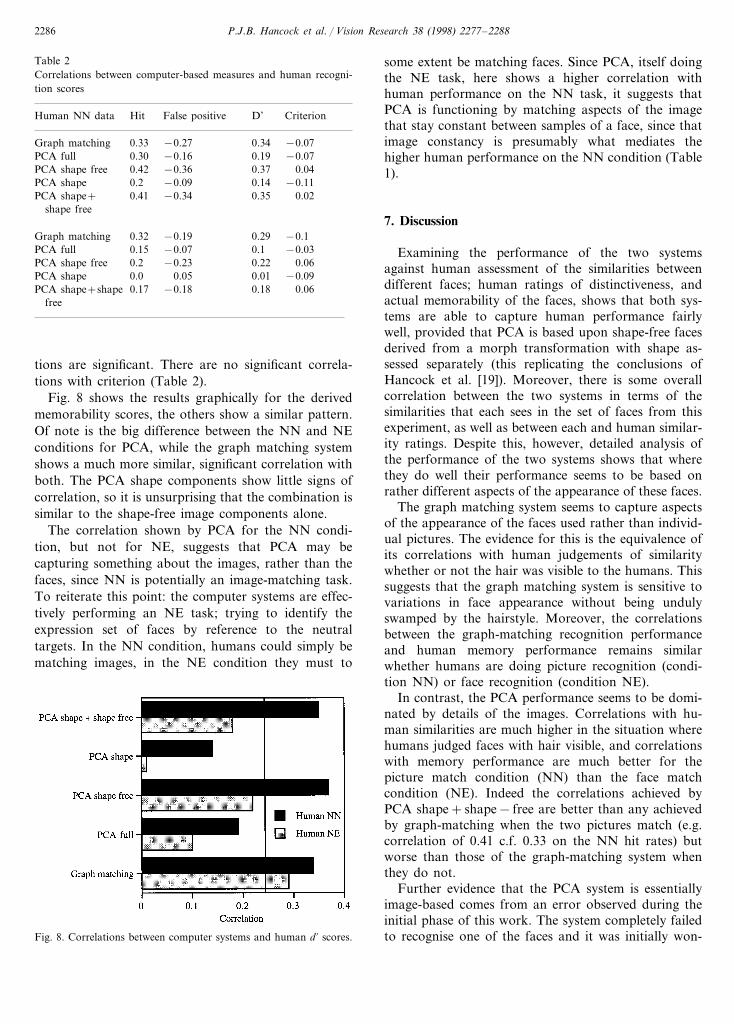
scores, showing the performance of each system againsthit scores, false positive scores, d % and criterion values.In Table 2 again, rcrit for PB0.005 is 0.24, so for theNE data, the only significant correlations come fromgraph matching. For the NN data, many of the correla-
2 This should not be taken as evidence that the PCA system isgenerally better at identification than the graph system. With bothsystems working at or close to ceiling the difference is not significant,and another set of faces might produce a different result.
P.J.B. Hancock et al. / Vision Research 38 (1998) 2277–22882286
Table 2Correlations between computer-based measures and human recogni-tion scores
False positive D’Human NN data CriterionHit
Graph matching 0.33 −0.27 0.34 −0.07−0.16 0.190.30 −0.07PCA full
0.42PCA shape free −0.36 0.37 0.04−0.09 0.14PCA shape −0.110.2−0.34 0.350.41 0.02PCA shape+
shape free
−0.19Graph matching 0.290.32 −0.1−0.07 0.10.15 −0.03PCA full
PCA shape free 0.2 −0.23 0.22 0.060.05 0.01 −0.09PCA shape 0.0
0.17 −0.18PCA shape+shape 0.18 0.06free
some extent be matching faces. Since PCA, itself doingthe NE task, here shows a higher correlation withhuman performance on the NN task, it suggests thatPCA is functioning by matching aspects of the imagethat stay constant between samples of a face, since thatimage constancy is presumably what mediates thehigher human performance on the NN condition (Table1).
7. Discussion
Examining the performance of the two systemsagainst human assessment of the similarities betweendifferent faces; human ratings of distinctiveness, andactual memorability of the faces, shows that both sys-tems are able to capture human performance fairlywell, provided that PCA is based upon shape-free facesderived from a morph transformation with shape as-sessed separately (this replicating the conclusions ofHancock et al. [19]). Moreover, there is some overallcorrelation between the two systems in terms of thesimilarities that each sees in the set of faces from thisexperiment, as well as between each and human similar-ity ratings. Despite this, however, detailed analysis ofthe performance of the two systems shows that wherethey do well their performance seems to be based onrather different aspects of the appearance of these faces.
The graph matching system seems to capture aspectsof the appearance of the faces used rather than individ-ual pictures. The evidence for this is the equivalence ofits correlations with human judgements of similaritywhether or not the hair was visible to the humans. Thissuggests that the graph matching system is sensitive tovariations in face appearance without being undulyswamped by the hairstyle. Moreover, the correlationsbetween the graph-matching recognition performanceand human memory performance remains similarwhether humans are doing picture recognition (condi-tion NN) or face recognition (condition NE).
In contrast, the PCA performance seems to be domi-nated by details of the images. Correlations with hu-man similarities are much higher in the situation wherehumans judged faces with hair visible, and correlationswith memory performance are much better for thepicture match condition (NN) than the face matchcondition (NE). Indeed the correlations achieved byPCA shape+shape− free are better than any achievedby graph-matching when the two pictures match (e.g.correlation of 0.41 c.f. 0.33 on the NN hit rates) butworse than those of the graph-matching system whenthey do not.
Further evidence that the PCA system is essentiallyimage-based comes from an error observed during theinitial phase of this work. The system completely failedto recognise one of the faces and it was initially won-
tions are significant. There are no significant correla-tions with criterion (Table 2).
Fig. 8 shows the results graphically for the derivedmemorability scores, the others show a similar pattern.Of note is the big difference between the NN and NEconditions for PCA, while the graph matching systemshows a much more similar, significant correlation withboth. The PCA shape components show little signs ofcorrelation, so it is unsurprising that the combination issimilar to the shape-free image components alone.
The correlation shown by PCA for the NN condi-tion, but not for NE, suggests that PCA may becapturing something about the images, rather than thefaces, since NN is potentially an image-matching task.To reiterate this point: the computer systems are effec-tively performing an NE task; trying to identify theexpression set of faces by reference to the neutraltargets. In the NN condition, humans could simply bematching images, in the NE condition they must to
Fig. 8. Correlations between computer systems and human d % scores.
P.J.B. Hancock et al. / Vision Research 38 (1998) 2277–2288 2287
dered whether it had somehow been mis-labelled. In-spection indicated otherwise, and it took some time torealise that the problem was that this image had acci-dentally been mirror-reversed during scanning. Thiswas unnoticeable to the casual human observer, andto the graph-matching system, but the reversal, per-haps because of a slight luminosity gradient, evidentlyfooled the PCA system.
A question of obvious interest is why the two sys-tems differ in their tendency to look at the face or theimage. PCA based on pixels is precise at a pictoriallevel, once proper linearisation of the image space isachieved via the morphing operations. This shape-freetransformation can improve the performance of PCAeven if it is working on relatively uninteresting imageproperties such as contrast gradients, because it willalign those in both images. The graph matching sys-tem uses Gabor wavelets as local image-feature detec-tors, which will be relatively insensitive to such imageproperties. The importance of hair also differs be-tween the two systems. PCA analyses the whole im-age, of which hair may contribute quite a largenumber of pixels and, therefore, overall variance. Thegraph matching system fits a grid over the face, thatconcentrates relatively more on inner features and isthus less affected by hair.
Does this mean that graph-matching is a bettermodel of human perception? Not necessarily. First,the pixel-level analysis of the PCA that has been usedis only one possible instantiation of such a system.The PCA could be used based on initially filteredimages to give a more physiologically plausible frontend [26]. Second, in any case humans also seem tohave their memory for unfamiliar faces dominated bypictorial details initially, illustrated here by the signifi-cantly better performance in the NN condition. PCAmay provide a better account of how humans recog-nise pictures of previously unfamiliar faces, whilegraph-matching may provide a closer approximationto the representational processes which eventually al-low us to generalise to novel exemplars.
Here has been presented a methodology for thecomparison of computer-based face processing sys-tems that goes beyond the simple question of howmany they identify correctly. It is hoped that an ex-tension to the comparisons to include other systems,such as the local feature analysis developed by Penevand Atick [5],or the related independent componentsanalysis [27] can be done, as well as to look at theeffects of filtration of images prior to the applicationof PCA [26]. Since PCA is a just a linear redescrip-tion of variables, it might be possible also to look athow much it is adding to analysis beyond the im-provements given by separating out the shape.
Acknowledgements
The authors are grateful to Kiran Chitta and DerekCarson who ran the experiments with human partici-pants. Norbert Kruger and Michael Potzsch patientlyexplained how to use the Bochum face recognitionsystem. Michael Rinne and Michael Potzsch producedthe Gabor plot shown in Fig. 4. The paper has beenimproved following helpful suggestions by reviewersof an earlier version. This research was supported bya SERC grant to Burton, Bruce and Craw (GRH93828) and an ESRC grant to Bruce and Burton(R000 236688).
References
[1] Bruce V, Hanna E, Dench N, Healy P, Burton AM. Theimportance of ‘mass’ in line drawings of faces. Appl CognitivePsychol 1992;6:619–28.
[2] Phillips J, Rauss PJ, Der SZ. FERET (Face recognition technol-ogy) recognition algorithm development and test results; ArmyResearch Lab, technical report.
[3] Pentland A, Moghaddam B, Starber T. View-based and modulareigenspaces for face recognition. Proceedings of IEEE ComputerSociety conference on computer vision and pattern recognition,1994:84–91.
[4] Wiskott L, Fellous J-M, Kruger N, von der Malsburg C. Facerecognition and gender determination. Proceedings of the inter-national workshop on automatic face and gesture recognition;Zurich, 1995.
[5] Penev JS, Atick JJ. Local feaure analysis: a general statisticaltheory for object representation. Netw Comput Neural Sys1996;7:477–500.
[6] Galper RE, Hochberg J. Repetition memory for photographs offaces. Am J Psychol 1971;84:351–4.
[7] Bruce V, Langton S. The use of pigmentation and shadinginformation in recognizing the sex and identities of faces. Percep-tion 1994;23:803–22.
[8] Hill H, Bruce V. The effects of lighting on the perception offacial surfaces. J Exp Psychol: Human Perception and Perfor-mance 1996;22:986–1004.
[9] Johnston A, Hill H, Carman N. Recognizing faces: effects oflighting direction, inversion and brightness reversal. Perception1992;21:365–75.
[10] Davies GM, Ellis HD, Shepherd JW. Face recognition accuracyas a function of mode of representation. J Appl Psychol1978;63:180–7.
[11] Bruce V. Changing faces: visual and non-visual coding processesin face recognition. Br J Psychol 1982;73:105–16.
[12] Turk M, Pentland A. Eigenfaces for recognition. J CognitiveNeurosci 1991;3:71–86.
[13] Lades M, Vorbruggen JC, Buhmann J, Lage J, von der Mals-burg C, Wurtz RP, Konen W. Distortion invariant object recog-nition in the dynamic link architecture. IEEE Transactions onComput 1993;42:300–11.
[14] von der Malsburg C. Nervous structures with dynamical links.Berichte der Bunsengesellschaft fyr Physikalische Chemie1985;89:703–10.
[15] Bienenstock E, Doursat R. Issues of representation in neuralnetworks. Vision and vision research. A. Gorea, editor. Cam-bridge MA: Cambridge University Press, 1991.

P.J.B. Hancock et al. / Vision Research 38 (1998) 2277–22882288
[16] Jones J, Palmer L. An evaluation of the two-dimensional Gaborfilter model of simple receptive-fields in cat striate cortex. JNeurophysiol 1987;58:1233–58.
[17] O’Toole AJ, Abdi H, Deffenbacher KA, Valentin D. Low dimen-sional representation of faces in higher dimensions of the facespace. J Am Opt Soc A 1991;10:405–11.
[18] O’Toole AJ, Deffenbacher KA, Valentin D, Abdi H. Structuralaspects of face recognition and the other race effect. MemCognition 1994;22:208–24.
[19] Hancock PJB, Burton AM, Bruce V. Face processing: humanperception and principal components analysis. Mem Cognition1996;24:26–40.
[20] Klatzky RL, Forrest FH. Recognizing familiar and unfamiliarfaces. Mem Cognition 1984;12:60–70.
[21] Bruce V, Young A. Understanding face recognition. Bri J Psy-chol 1986;77:305–27.
[22] Vokey JR, Read JD. Familiarity, memorability and the effect oftypicality on the recognition of faces. Mem Cognition1992;20:291–302.
[23] Craw I, Cameron P. Parameterising images for recognition andreconstruction. In: Mowforth P, editor. Proceedings of the BritishMachine Vision Conference. Berlin: Springer-Verlag, 1991.
[24] O’Toole AJ, Abdi H, Deffenbacher KA, Bartlett JC. Simulatingthe other-race effect as a problem in perceptual learning. ConnectSci J Neural Comput Artif Intell Cognitive Res 1993;3:163–78.
[25] Biederman I. Neural and psychophysical analysis of object andface recognition, To appear In: Wechsler H, Phillips JP, Bruce V,Fogelman Soulie F, Huang T, editors. Face recognition: Fromtheory to applications. Berlin: Springer-Verlag, 1998.
[26] Hancock PJB, Burton AM, Bruce V. Preprocessing images offaces, correlations with human perceptions of distinctiveness andfamiliarity. Proceedings of IEE Fifth international conference onimage processing and its applications. Edinburgh, July, 1995.
[27] Bartlett MS, Sejnowski TJ.@ Independent component analysis offace images: A representation for face recognition. Proceedings ofthe 4th Annual Joint Symposium on Neural Computation.Pasadena, CA, May 1997. Institute for Neural Computation LaJolla, CA 1997.
.


![BIPIN RELA[1][1]. PROJECT](https://img.pdfslide.us/doc/110x75/577d2bac1a28ab4e1eab126e/bipin-rela11-project.jpg)