Embed Size (px)
Citation preview
A COMPARISON OF TRIPS TO SCHOOLS
IN SUBURBAN BANGKOK
Nattapol PIYAEISARAKUL King Mongkut’s University of Technology
Thonburiand
Associate Professor Viroat SRISURAPANON
King Mongkut’s University of Technology Thonburi
TOPICS INTRODUCTION METHODOLOGY SCHOOL LOCATION SCHOOL BUS MANAGEMENT CHARACTERISTICS OF PARENTS RESULTS
INTRODUCTIONIn Bangkok, the private car is
favored more than other transportation modes; it is the most favorite method to send or pick up students from home to school and vice versa (Dissanayake & Morikawa, 2010). However, private cars are the main reason for traffic congestion around schools such as blockage of streets and areas around schools (La Vigne, 2007).
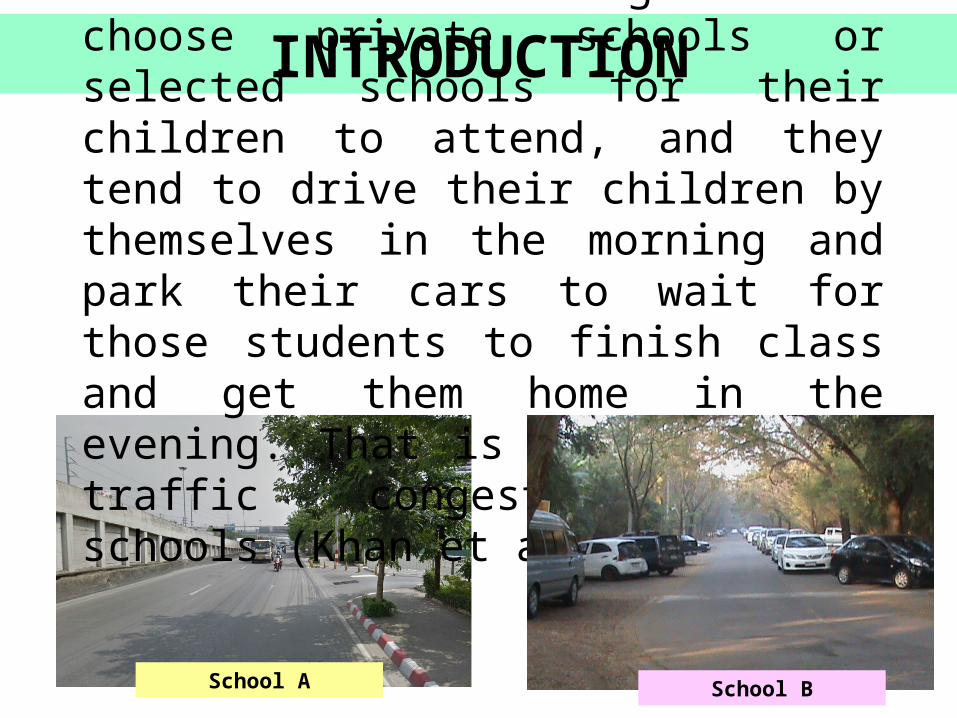
INTRODUCTIONParents who have high incomes choose private schools or selected schools for their children to attend, and they tend to drive their children by themselves in the morning and park their cars to wait for those students to finish class and get them home in the evening. That is the reason of traffic congestion around schools (Khan et al., 2011).
School A School B
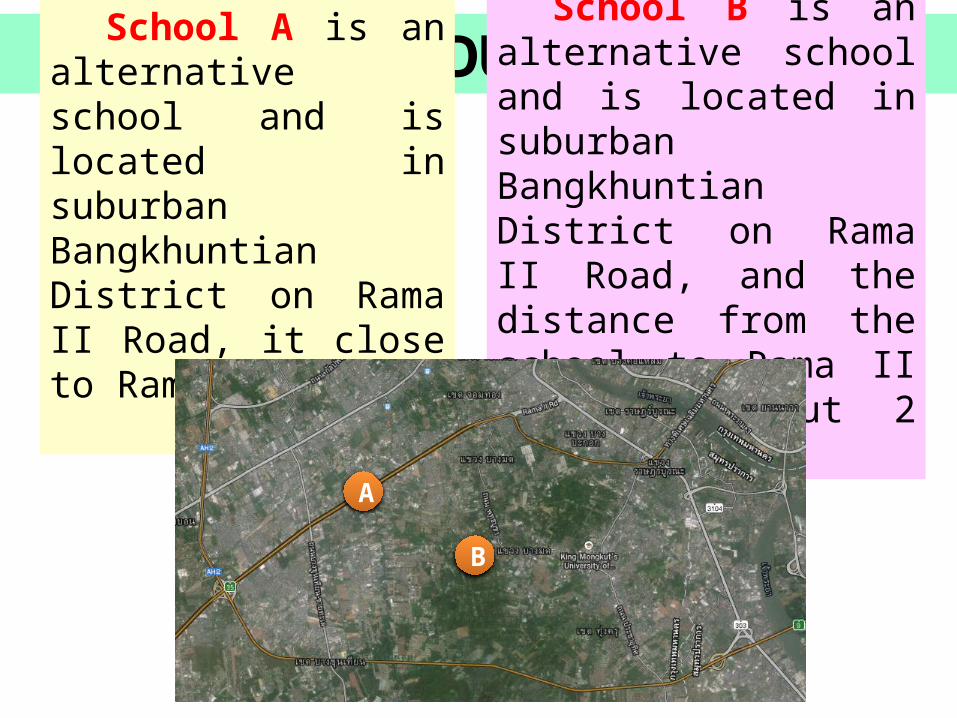
INTRODUCTIONSchool A is an alternative school and is located in suburban Bangkhuntian District on Rama II Road, it close to Rama II Road.
School B is an alternative school and is located in suburban Bangkhuntian District on Rama II Road, and the distance from the school to Rama II Road is about 2 km.
A
B
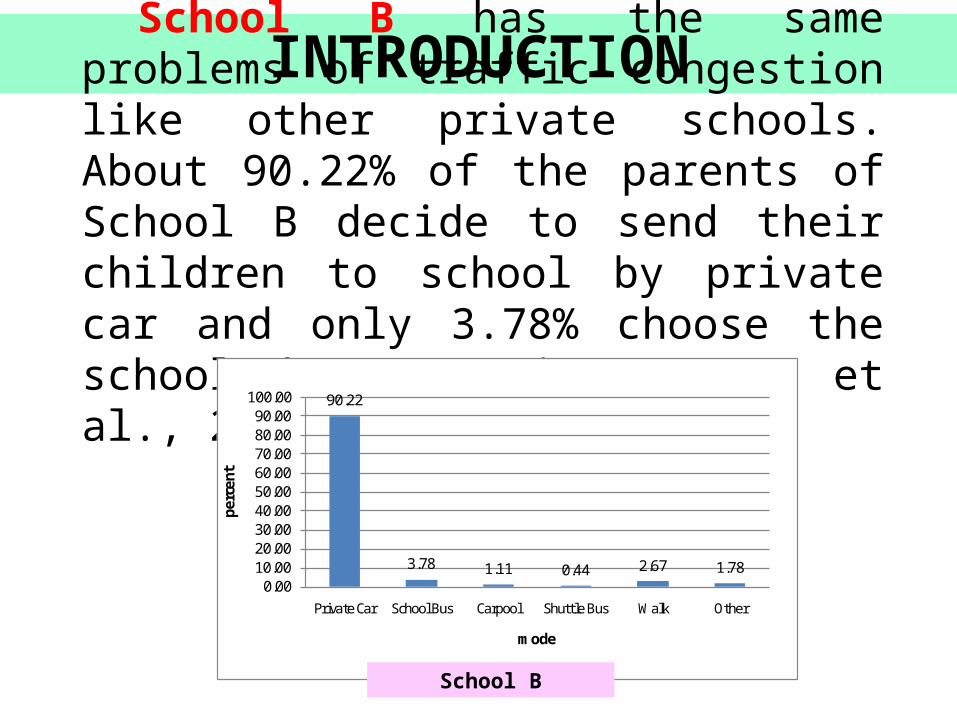
INTRODUCTIONSchool B has the same problems of traffic congestion like other private schools. About 90.22% of the parents of School B decide to send their children to school by private car and only 3.78% choose the school bus (Srisurapanon et al., 2014).
90.22
3.78 1.11 0.44 2.67 1.780.00
10.0020.0030.0040.0050.0060.0070.0080.0090.00
100.00
Private Car School Bus Carpool Shuttle Bus Walk Other
perc
ent
mode
School B
INTRODUCTIONHowever, if we change the
location of schools, do we observe the same characteristics of parent behavior?
If the results are similar to School B, then suburban schools display similar characteristics.
If the results are not similar, it shows that suburban schools do not exhibit similar characteristics, and the characteristics of parents are influenced by other factors. That is the interesting reason why we should study this phenomenon.
INTRODUCTIONThe objectives of this study are to conduct a comparison of two schools and find the reasons. If we change our focus from School B to another school which is in the same location or same district, and the type of school is private school or selected school similar to School B, is the percentage of parents who decide to drive to school similar to School B or not?
INTERESTING ISSUES TO ANALYZE
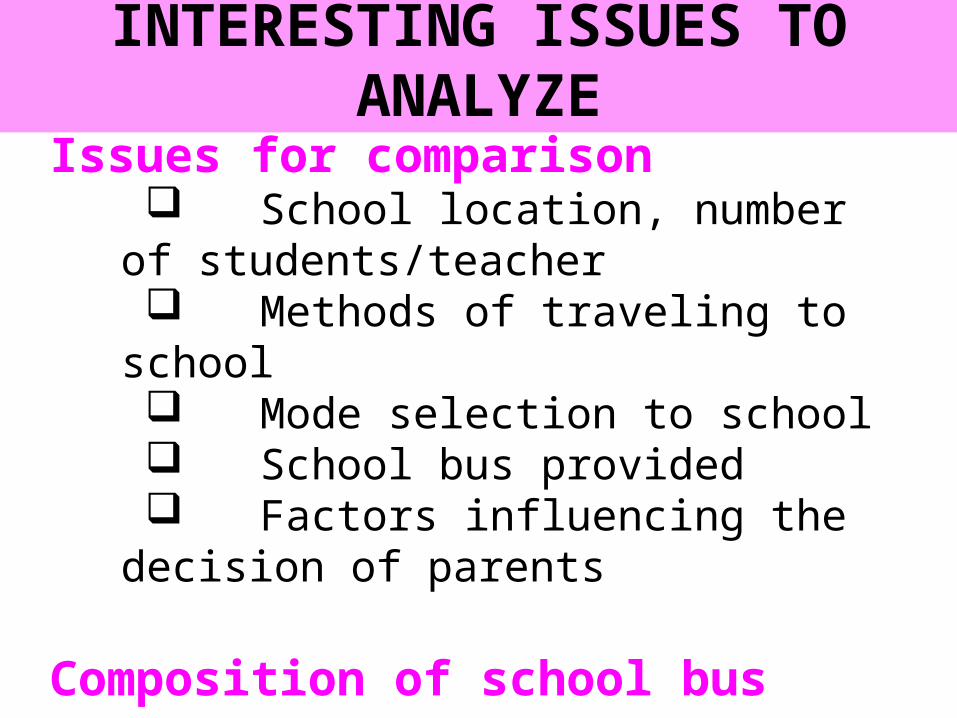
Issues for comparison School location, number of
students/teacher Methods of traveling to school Mode selection to school School bus provided Factors influencing the decision
of parents
Composition of school bus systemsSchool bus managementDegree of importance of the management
METHODOLOGY
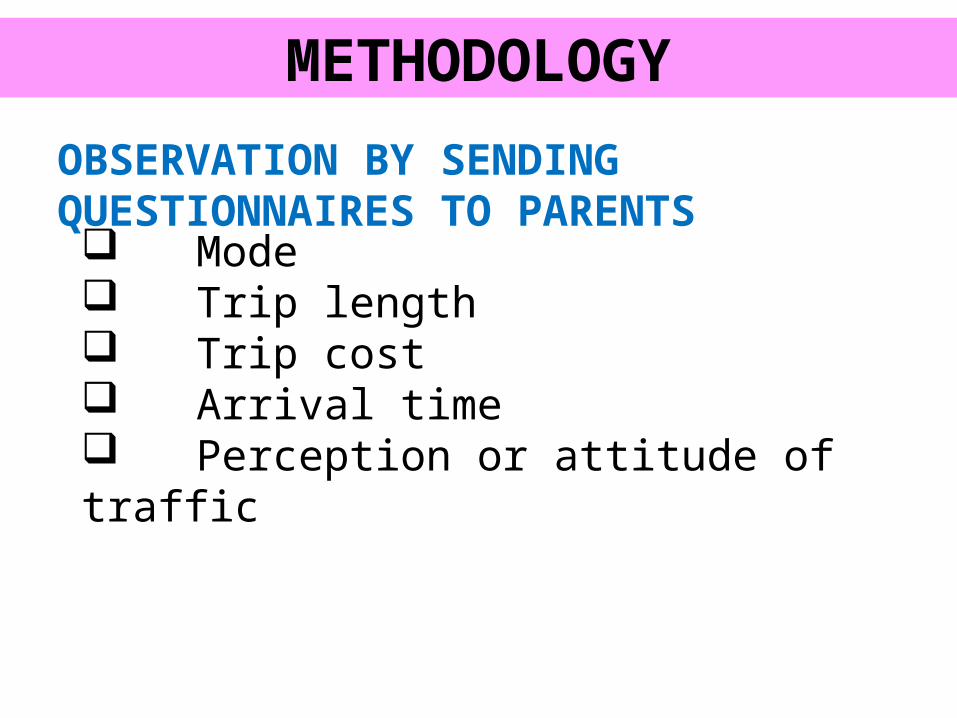
OBSERVATION BY SENDING QUESTIONNAIRES TO PARENTS Mode Trip length Trip cost Arrival time Perception or attitude of traffic
METHODOLOGY
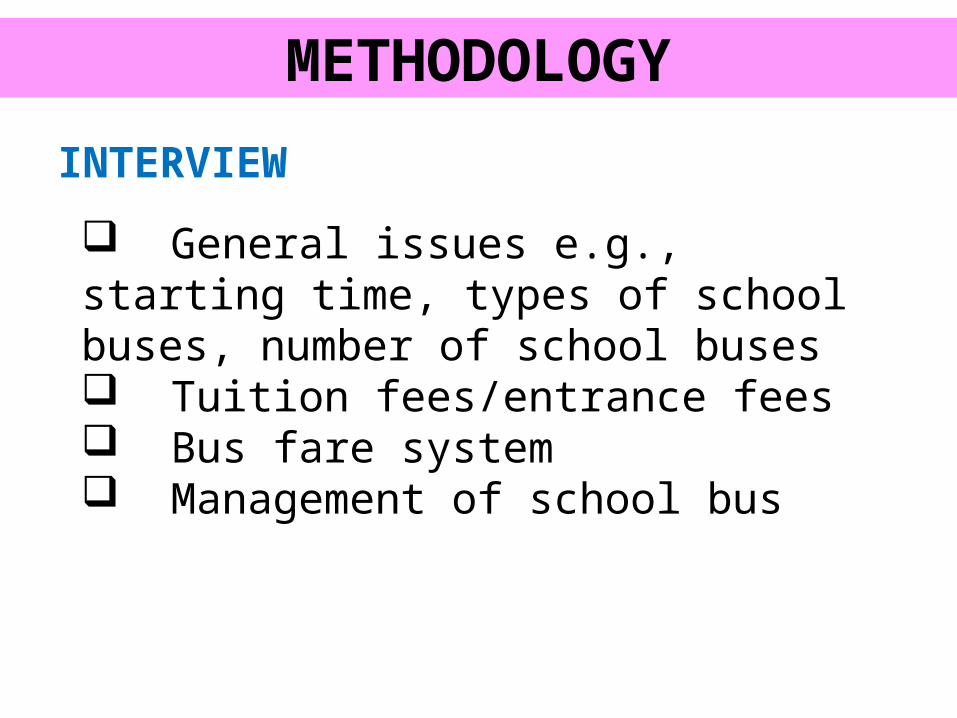
INTERVIEW
General issues e.g., starting time, types of school buses, number of school buses Tuition fees/entrance fees Bus fare system Management of school bus
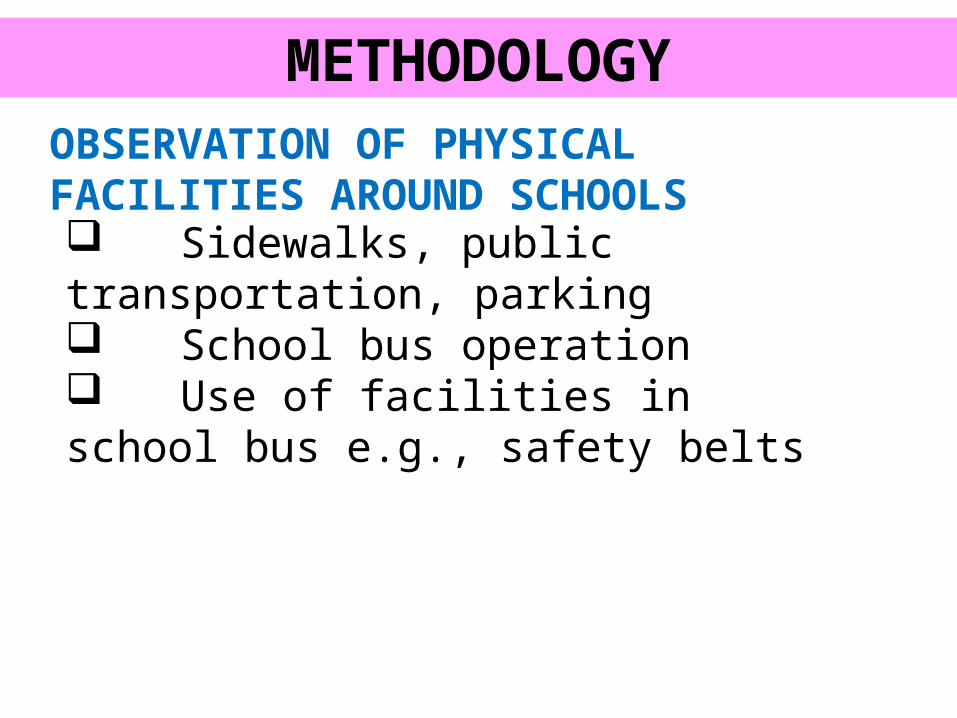
METHODOLOGYOBSERVATION OF PHYSICAL FACILITIES AROUND SCHOOLS Sidewalks, public transportation, parking School bus operation Use of facilities in school bus e.g., safety belts
SCHOOL LOCATION
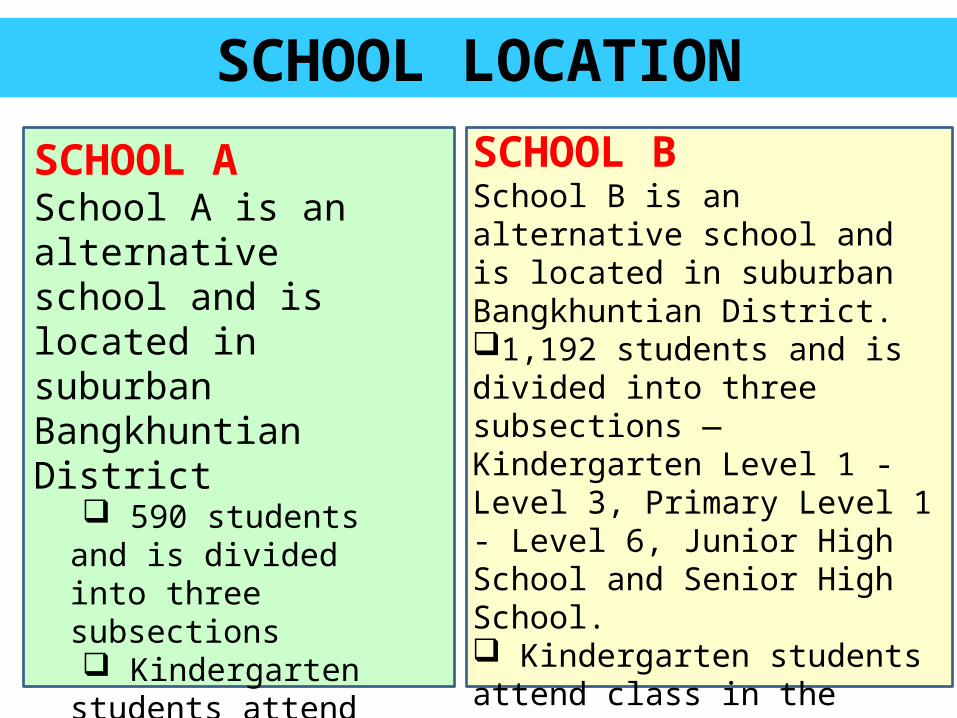
SCHOOL ASchool A is an alternative school and is located in suburban Bangkhuntian District
590 students and is divided into three subsections Kindergarten
students attend class in the morning before 09:00 AM. Primary students
attend class starting at 08:10 AM. All levels of School
A have about 20 students per class room.
SCHOOL BSchool B is an alternative school and is located in suburban Bangkhuntian District. 1,192 students and is divided into three subsections — Kindergarten Level 1 - Level 3, Primary Level 1 - Level 6, Junior High School and Senior High School. Kindergarten students attend class in the morning before 0900. Primary school, junior high school and senior high school students attend class in the morning at 0750. All levels of School A have a student population of about 25 students per classroom.
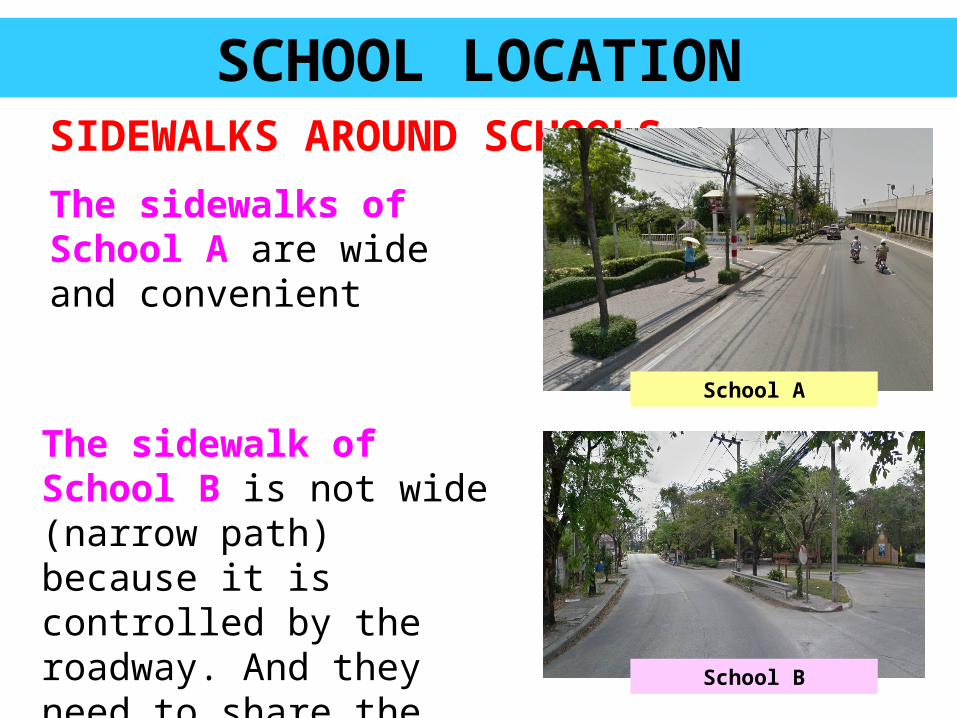
SCHOOL LOCATIONSIDEWALKS AROUND SCHOOLS :
The sidewalks of School A are wide and convenient
The sidewalk of School B is not wide (narrow path) because it is controlled by the roadway. And they need to share the road with vehicles and that is harmful for children.
School A
School B
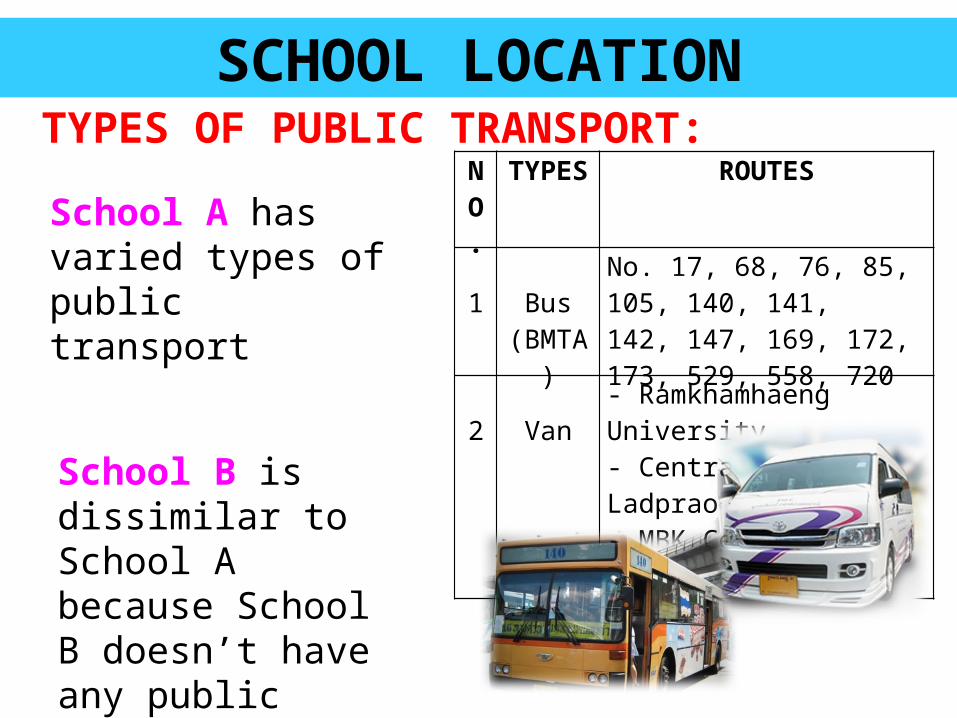
SCHOOL LOCATIONTYPES OF PUBLIC TRANSPORT:
School A has varied types of public transport
NO.
TYPES
ROUTES
1 Bus (BMTA
)
No. 17, 68, 76, 85, 105, 140, 141, 142, 147, 169, 172, 173, 529, 558, 720
2 Van- Ramkhamhaeng University- Central Plaza Ladprao- MBK Center- Central Plaza Pinklao
School B is dissimilar to School A because School B doesn’t have any public transport; only taxis or motorcycles support travel to and from the school.
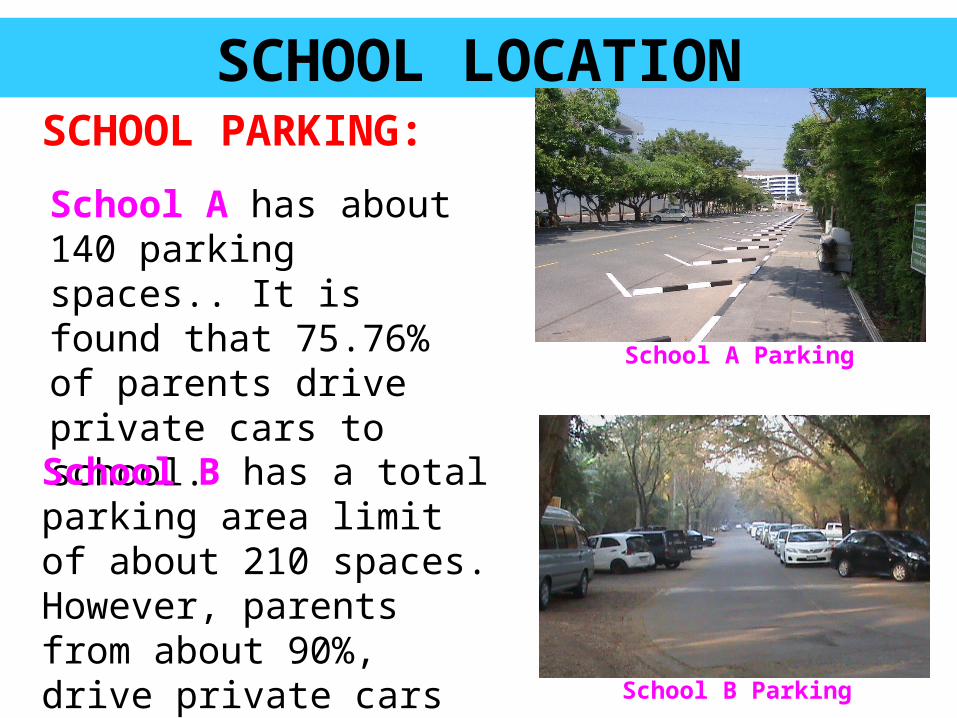
SCHOOL LOCATIONSCHOOL PARKING:
School A has about 140 parking spaces.. It is found that 75.76% of parents drive private cars to school.
School B has a total parking area limit of about 210 spaces. However, parents from about 90%, drive private cars to school
School A Parking
School B Parking
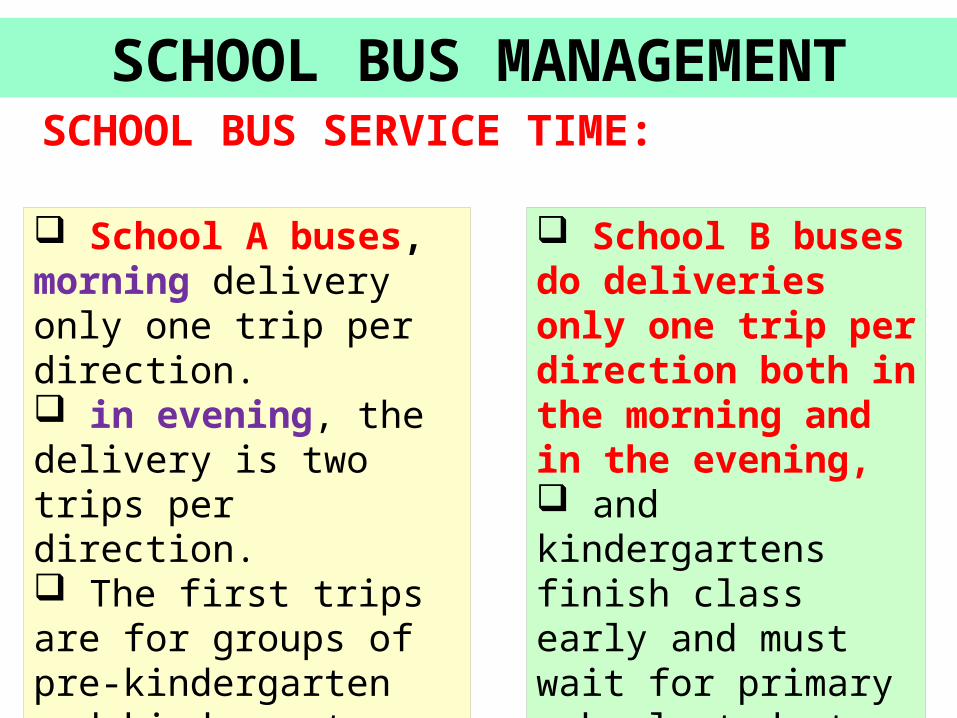
SCHOOL BUS MANAGEMENTSCHOOL BUS SERVICE TIME:
School A buses, morning delivery only one trip per direction. in evening, the delivery is two trips per direction. The first trips are for groups of pre-kindergarten and kindergarten students who finish class at 2.50 p.m., and the second trips are for groups of primary school students who early than primary school at 03.50 p.m.
School B buses do deliveries only one trip per direction both in the morning and in the evening, and kindergartens finish class early and must wait for primary school students.
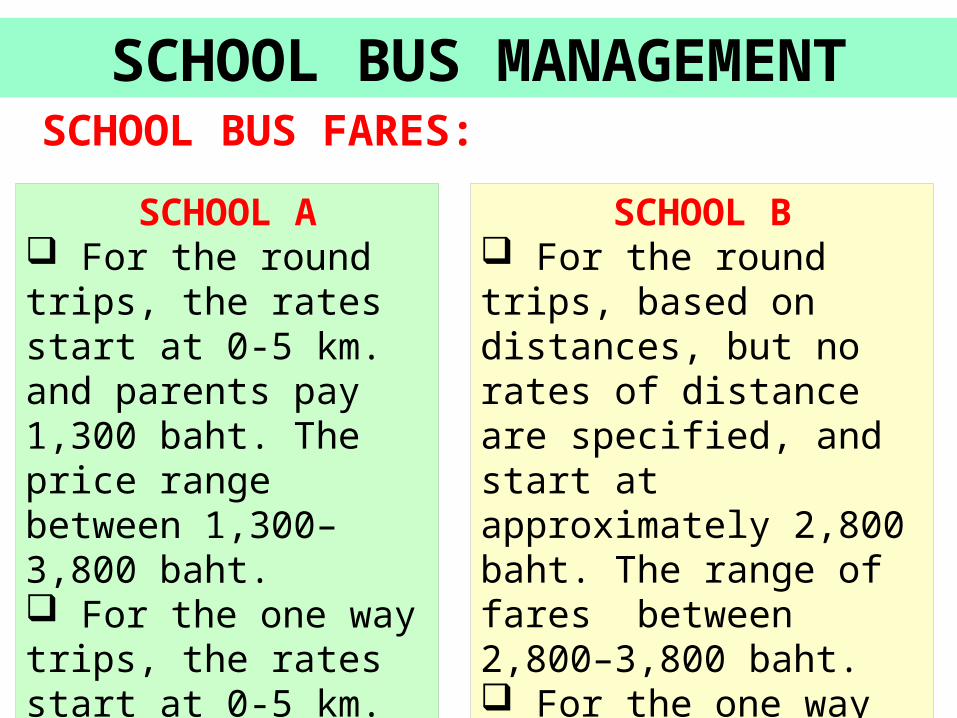
SCHOOL BUS MANAGEMENTSCHOOL BUS FARES:
SCHOOL A For the round trips, the rates start at 0-5 km. and parents pay 1,300 baht. The price range between 1,300–3,800 baht. For the one way trips, the rates start at 0-5 km. for which parents pay 800 baht. The price range between 800–2,300 baht.
SCHOOL B For the round trips, based on distances, but no rates of distance are specified, and start at approximately 2,800 baht. The range of fares between 2,800–3,800 baht. For the one way trips, has no rates of distance and the fares are not clear, it appears to start up at approximately 2,500 baht. The rates increase based on distances to school.
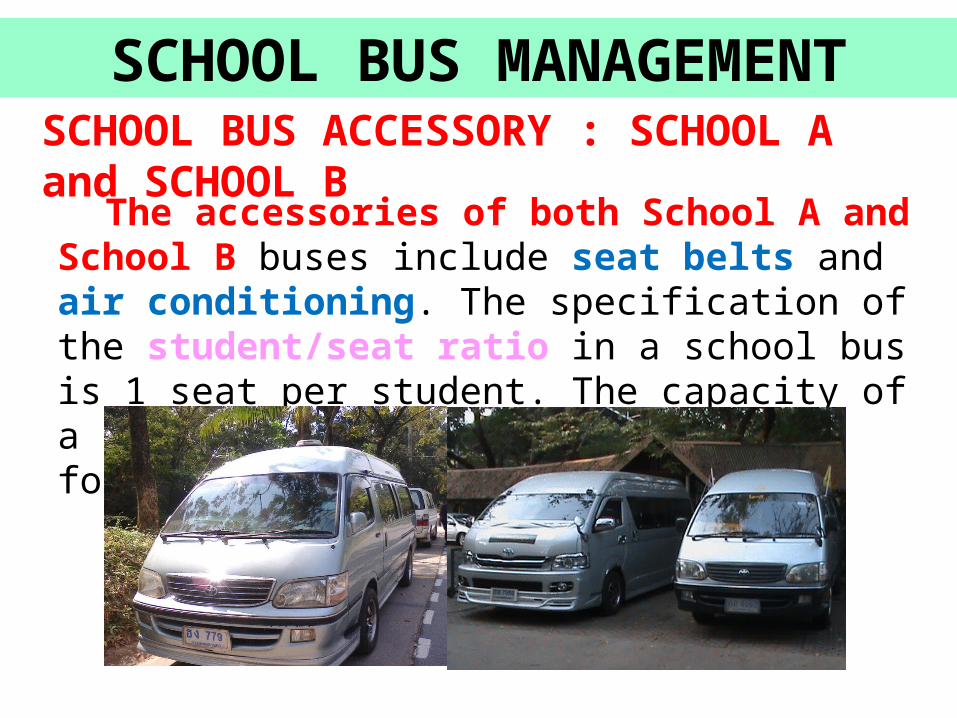
SCHOOL BUS MANAGEMENTSCHOOL BUS ACCESSORY : SCHOOL A and SCHOOL B
The accessories of both School A and School B buses include seat belts and air conditioning. The specification of the student/seat ratio in a school bus is 1 seat per student. The capacity of a school bus is 14 seats — 12 seats for students.
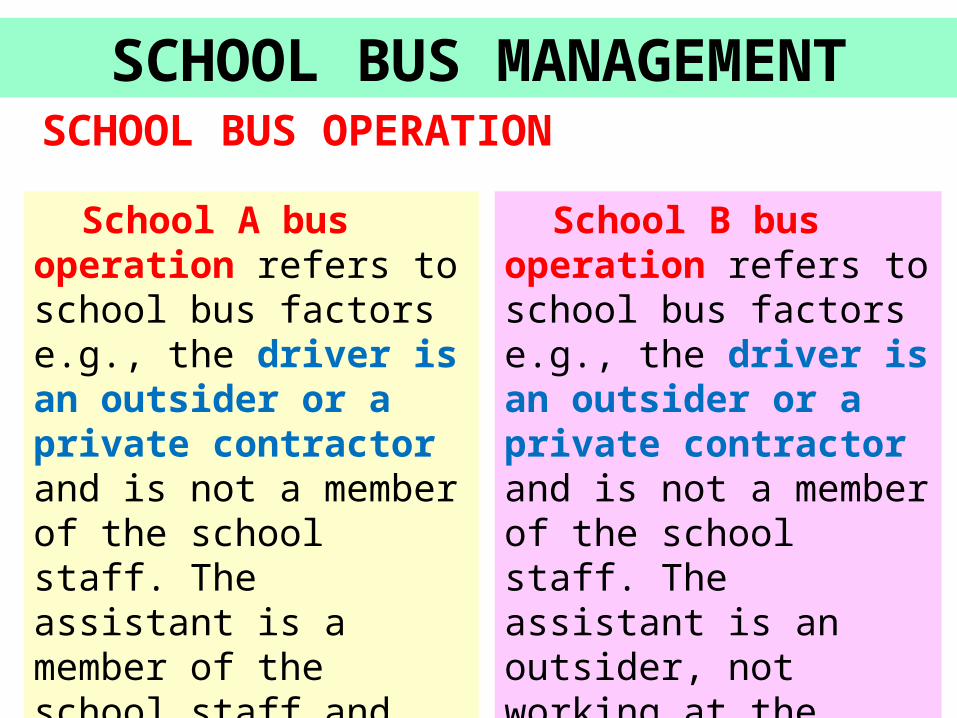
SCHOOL BUS MANAGEMENTSCHOOL BUS OPERATION
School A bus operation refers to school bus factors e.g., the driver is an outsider or a private contractor and is not a member of the school staff. The assistant is a member of the school staff and reports to the vehicle division every day the number of students who use the school bus
School B bus operation refers to school bus factors e.g., the driver is an outsider or a private contractor and is not a member of the school staff. The assistant is an outsider, not working at the school. Sometimes, the assistant is absent, so the drivers must take care of additional children themselves
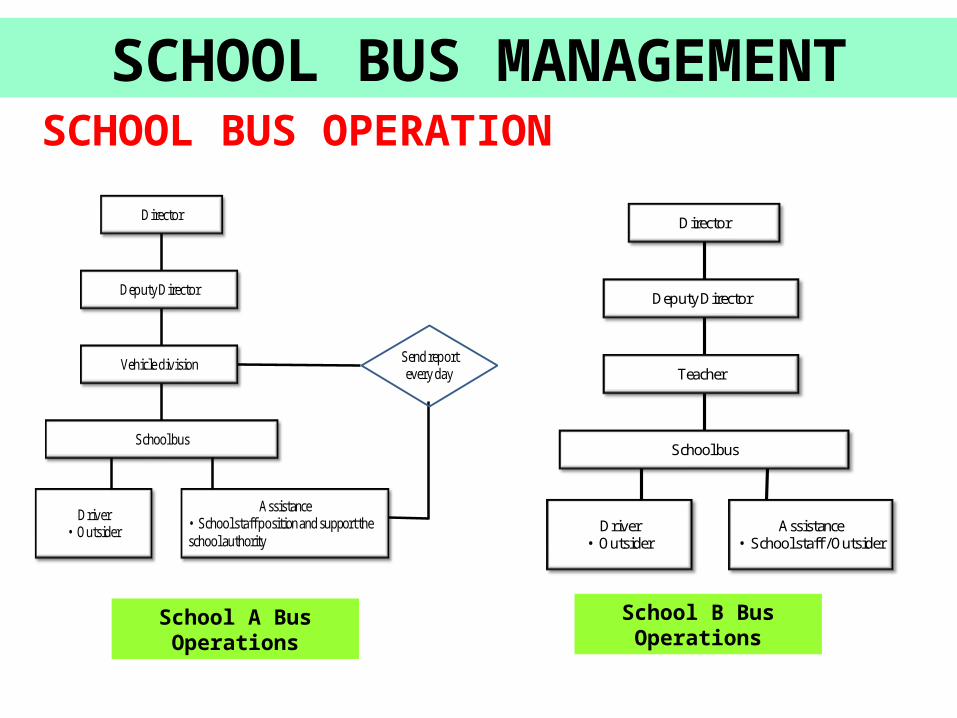
SCHOOL BUS MANAGEMENTSCHOOL BUS OPERATION
Director
Deputy Director
Vehicle division
School bus
Assistance• School staff position and support the school authority
Driver• Outsider
Send report every day
Director
Deputy Director
Teacher
School bus
Assistance• School staff / Outsider
Driver• Outsider
School A Bus Operations School B Bus Operations
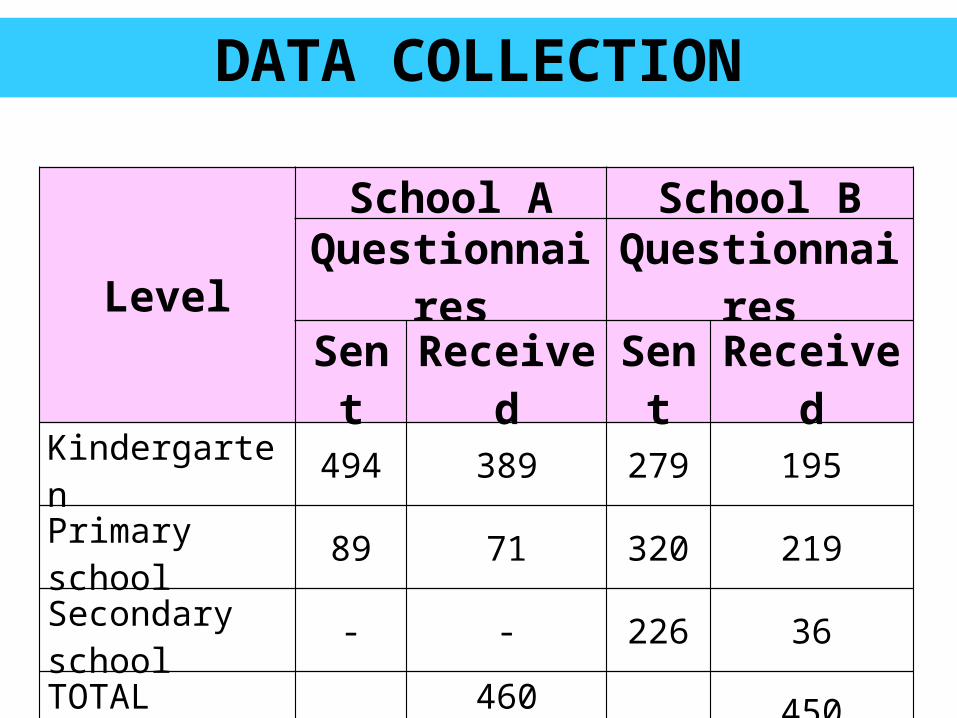
DATA COLLECTION
Level
School A School BQuestionnai
resQuestionnai
resSen
tReceiv
edSent
Received
Kindergarten 494 389 279 195 Primary school 89 71 320 219
Secondary school - - 226 36
TOTAL583 460
(78.90%. )825 450
(54.54%)
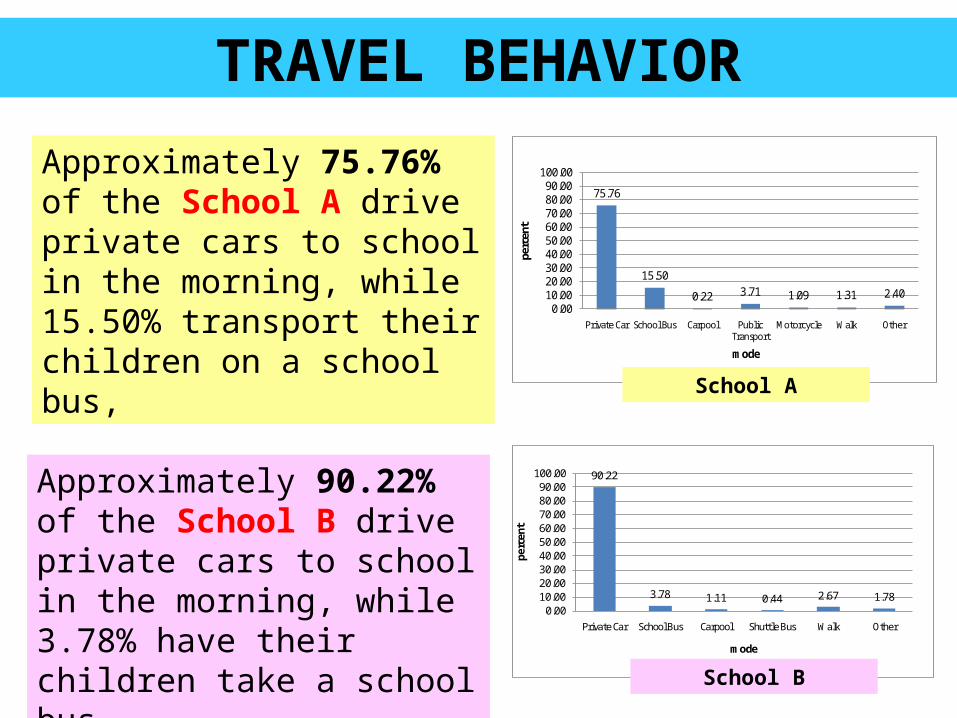
TRAVEL BEHAVIOR
Approximately 75.76% of the School A drive private cars to school in the morning, while 15.50% transport their children on a school bus,
75.76
15.50
0.22 3.71 1.09 1.31 2.400.00
10.0020.0030.0040.0050.0060.0070.0080.0090.00
100.00
Private Car School Bus Carpool Public Transport
Motorcycle Walk Other
perc
ent
mode
90.22
3.78 1.11 0.44 2.67 1.780.00
10.0020.0030.0040.0050.0060.0070.0080.0090.00
100.00
Private Car School Bus Carpool Shuttle Bus Walk Other
perc
ent
mode
School A
School B
Approximately 90.22% of the School B drive private cars to school in the morning, while 3.78% have their children take a school bus
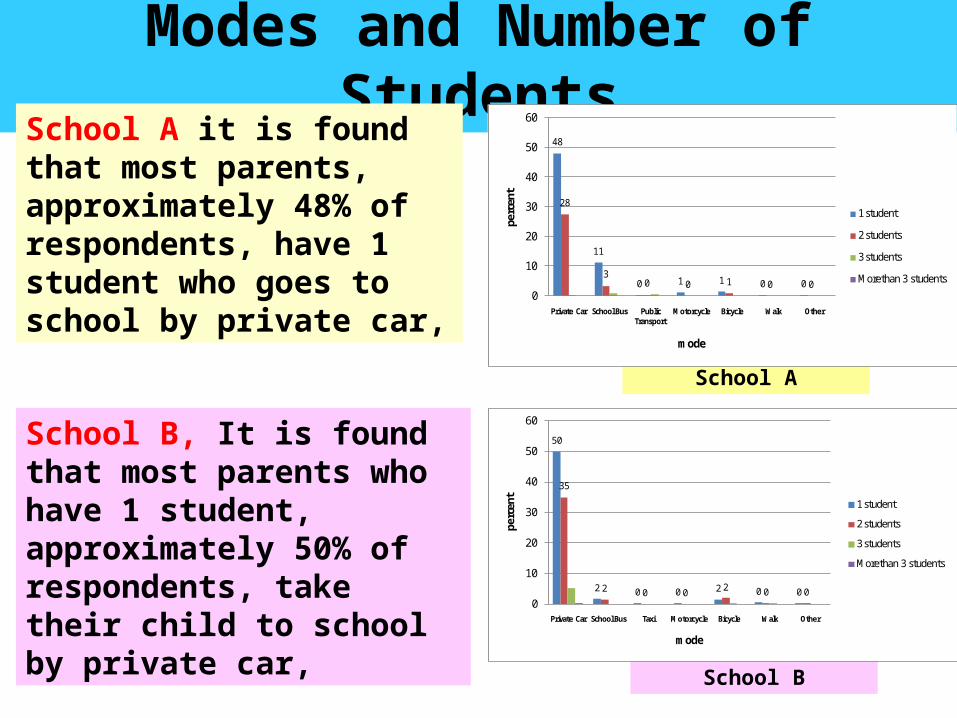
Modes and Number of Students
School A it is found that most parents, approximately 48% of respondents, have 1 student who goes to school by private car,
School A
School B
School B, It is found that most parents who have 1 student, approximately 50% of respondents, take their child to school by private car,
48
11
0 1 1 0 0
28
30 0 1 0 0
0
10
20
30
40
50
60
Private Car School Bus Public Transport
Motorcycle Bicycle Walk Other
perc
ent
mode
1 student
2 students
3 students
Morethan 3 students
50
2 0 0 2 0 0
35
2 0 0 2 0 00
10
20
30
40
50
60
Private Car School Bus Taxi Motorcycle Bicycle Walk Other
perc
ent
mode
1 student
2 students
3 students
Morethan 3 students
42%
43%
3% 12%
to work
back home
other
Did not answer
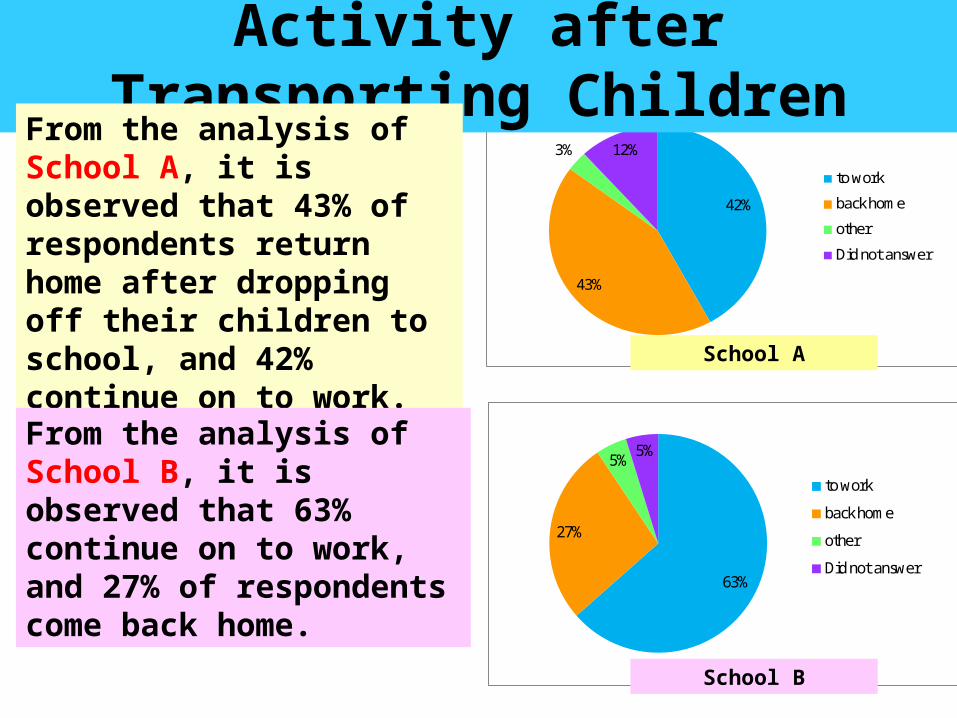
Activity after Transporting Children
From the analysis of School A, it is observed that 43% of respondents return home after dropping off their children to school, and 42% continue on to work.
School A
From the analysis of School B, it is observed that 63% continue on to work, and 27% of respondents come back home.
63%
27%
5%5%
to work
back home
other
Did not answer
School B
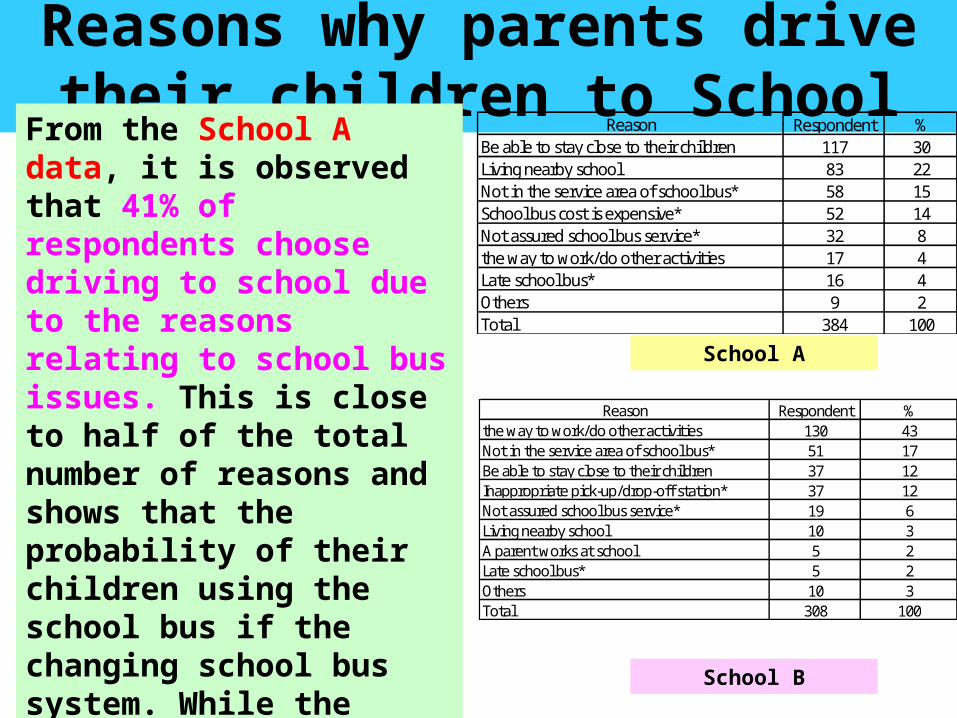
Reasons why parents drive their children to School
From the School A data, it is observed that 41% of respondents choose driving to school due to the reasons relating to school bus issues. This is close to half of the total number of reasons and shows that the probability of their children using the school bus if the changing school bus system. While the School B data shows that 37% of respondents do so because of the reasons relating to school bus factors.
School A
School B
Reason Respondent %Be able to stay close to their children 117 30Living nearby school 83 22Not in the service area of school bus* 58 15School bus cost is expensive* 52 14Not assured school bus service* 32 8the way to work/do other activities 17 4Late school bus* 16 4Others 9 2Total 384 100
Reason Respondent %the way to work/do other activities 130 43Not in the service area of school bus* 51 17Be able to stay close to their children 37 12Inappropriate pick-up/drop-off station* 37 12Not assured school bus service* 19 6Living nearby school 10 3A parent works at school 5 2Late school bus* 5 2Others 10 3Total 308 100
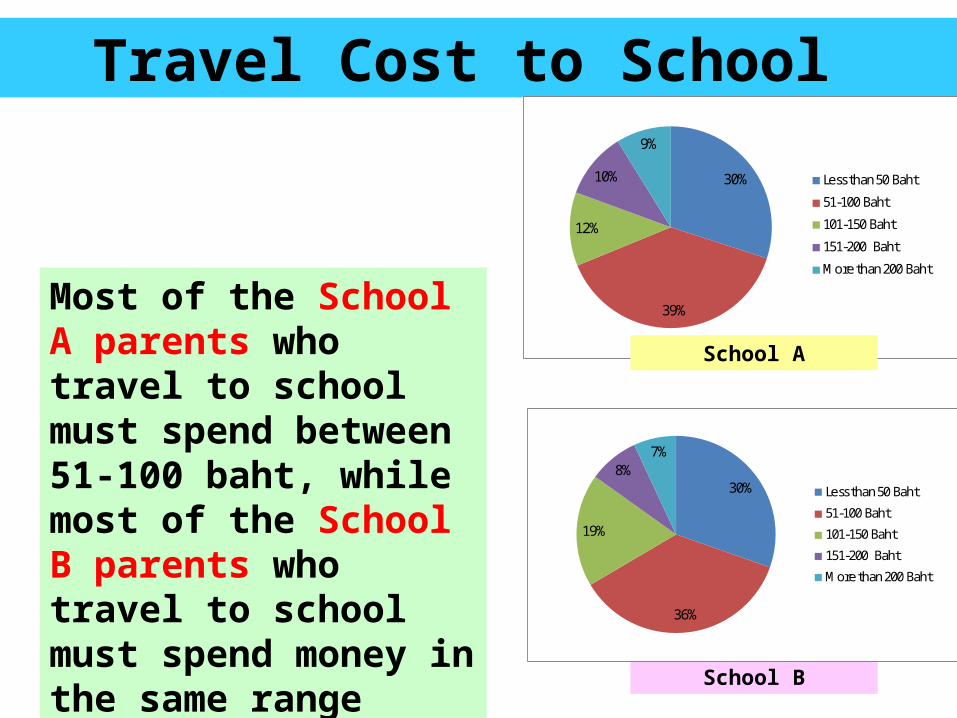
Travel Cost to School
Most of the School A parents who travel to school must spend between 51-100 baht, while most of the School B parents who travel to school must spend money in the same range
School B
30%
39%
12%
10%
9%
Less than 50 Baht
51-100 Baht
101-150 Baht
151-200 Baht
More than 200 Baht
School A
30%
36%
19%
8%7%
Less than 50 Baht
51-100 Baht
101-150 Baht
151-200 Baht
More than 200 Baht
0 1
16
33
10
1 003
16
117
2 00
5
10
15
20
25
30
35
40
6.01 a.m. -6.30 a.m.
6.31 a.m. -7.00 a.m.
7.01 a.m. -7.30 a.m.
7.31 a.m. -8.00 a.m.
8.01 a.m. -8.30 a.m.
8.31 a.m. -9.00 a.m.
after 9.00 a.m.
perc
ent
time
Problem
No Problem
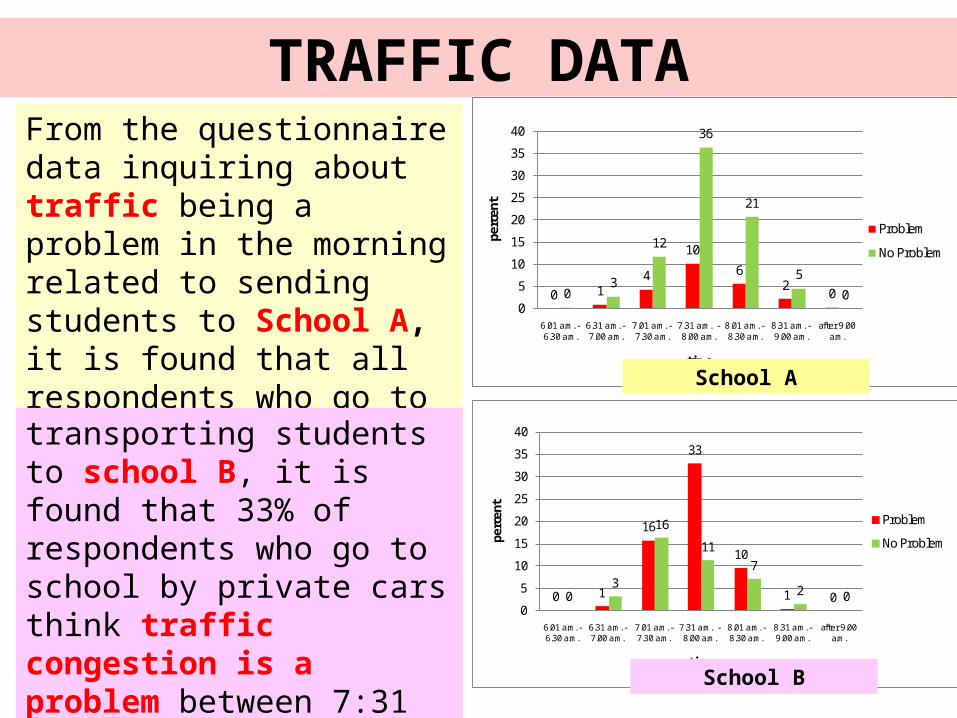
TRAFFIC DATAFrom the questionnaire data inquiring about traffic being a problem in the morning related to sending students to School A, it is found that all respondents who go to school by private cars don’t think traffic congestion is a problem.
School B
transporting students to school B, it is found that 33% of respondents who go to school by private cars think traffic congestion is a problem between 7:31 a.m. and 8:00 a.m., and 10% of the respondents who go to school by private cars think traffic is problematic between 8:01 a.m. and 8:30 a.m.,
0 14
10
62
003
12
36
21
5
00
5
10
15
20
25
30
35
40
6.01 a.m. -6.30 a.m.
6.31 a.m. -7.00 a.m.
7.01 a.m. -7.30 a.m.
7.31 a.m. -8.00 a.m.
8.01 a.m. -8.30 a.m.
8.31 a.m. -9.00 a.m.
after 9.00 a.m.
perc
ent
time
Problem
No Problem
School A
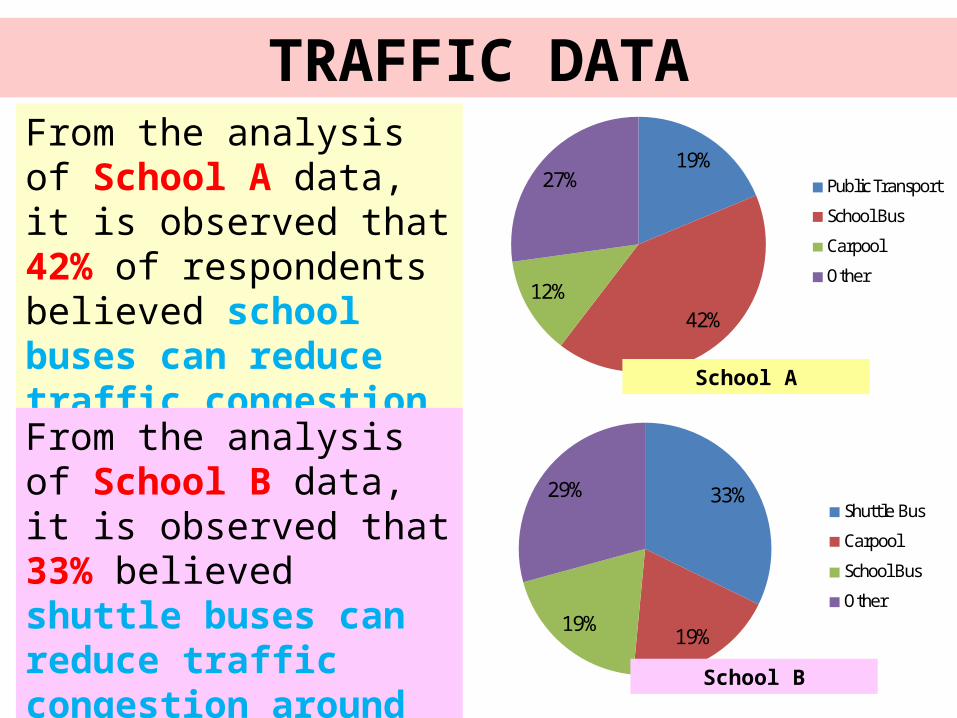
33%
19%19%
29%Shuttle Bus
Carpool
School Bus
Other
19%
42%12%
27% Public Transport
School Bus
Carpool
Other
TRAFFIC DATAFrom the analysis of School A data, it is observed that 42% of respondents believed school buses can reduce traffic congestion around school.
School B
From the analysis of School B data, it is observed that 33% believed shuttle buses can reduce traffic congestion around school.
School A
RESULTSSchool A data
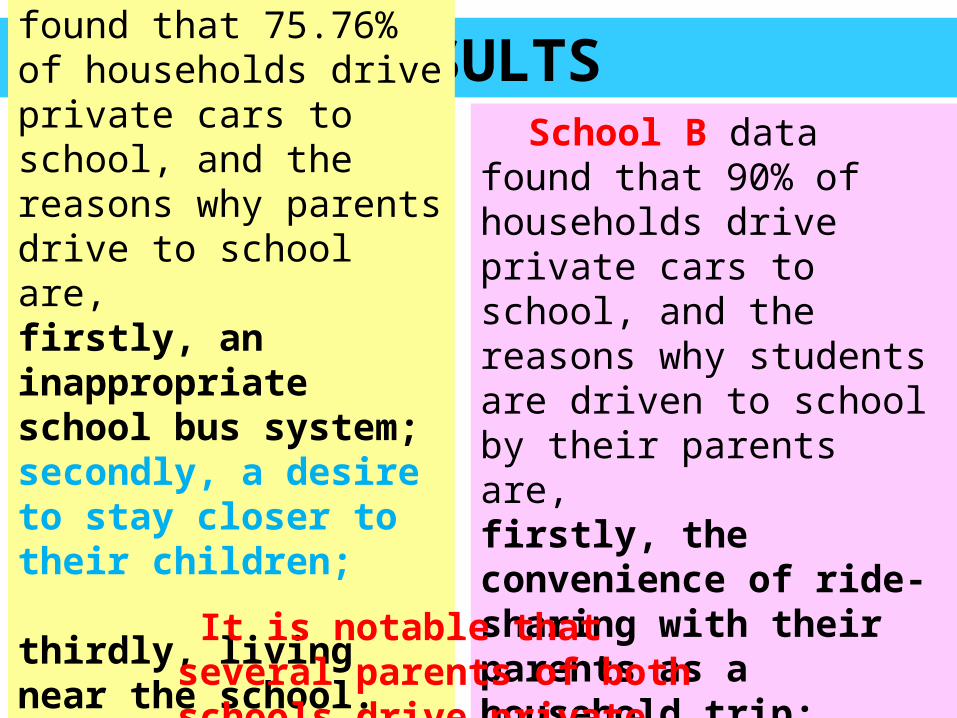
found that 75.76% of households drive private cars to school, and the reasons why parents drive to school are, firstly, an inappropriate school bus system; secondly, a desire to stay closer to their children;
thirdly, living near the school.
School B data found that 90% of households drive private cars to school, and the reasons why students are driven to school by their parents are, firstly, the convenience of ride-sharing with their parents as a household trip; secondly, an inappropriate school bus system
thirdly, the desire for parents to stay closer to their children.
It is notable that several parents of both schools drive private cars.
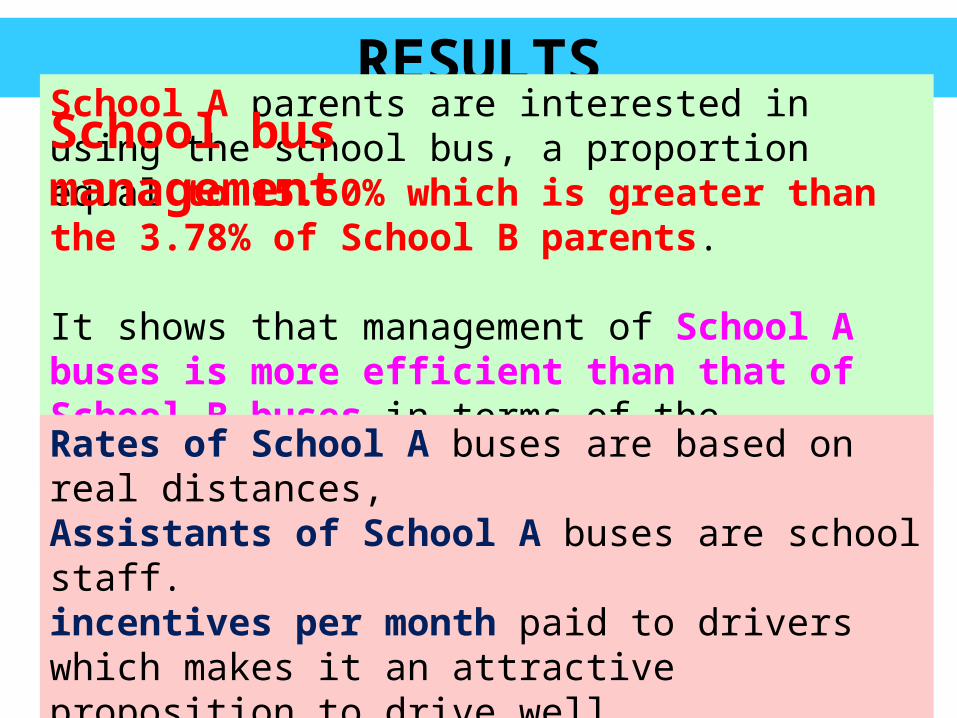
RESULTSSchool A parents are interested in using the school bus, a proportion equal to 15.50% which is greater than the 3.78% of School B parents.
It shows that management of School A buses is more efficient than that of School B buses in terms of the following factors:Rates of School A buses are based on real distances, Assistants of School A buses are school staff. incentives per month paid to drivers which makes it an attractive proposition to drive well. Parents must of School A pay money directly to School or transfer to bank account.
School bus management
RESULTS
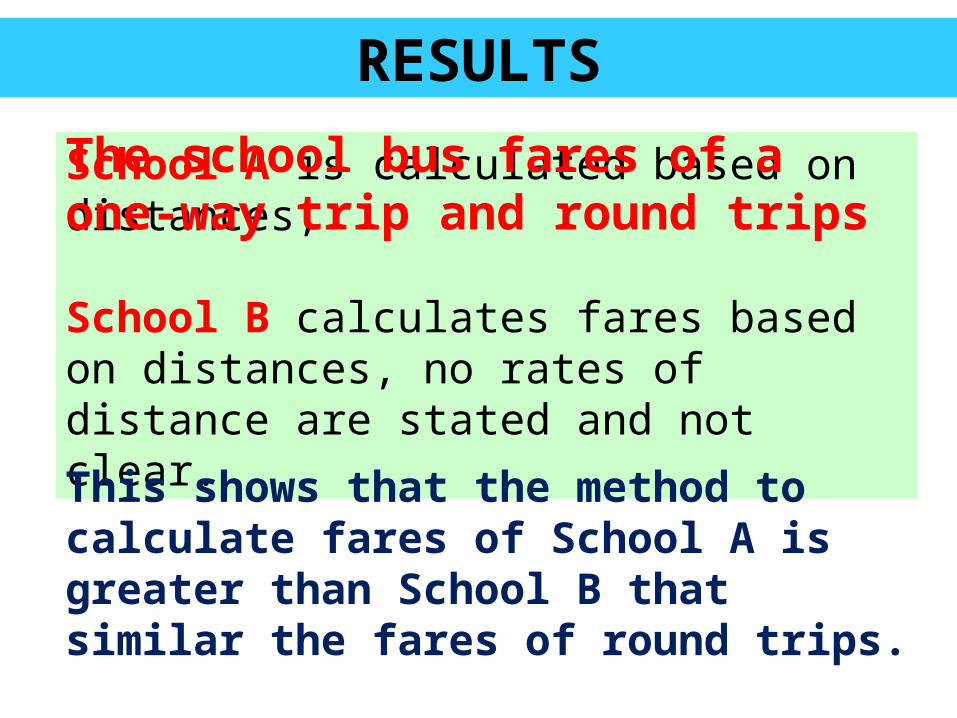
School A is calculated based on distances,
School B calculates fares based on distances, no rates of distance are stated and not clear.
The school bus fares of a one-way trip and round trips
This shows that the method to calculate fares of School A is greater than School B that similar the fares of round trips.
RESULTSSchool A is located in an arterial road, the location is not in the same direction as parents’ workplaces, and it can support high traffic volume in peak hours.
School B is sited on a local road, the location is conveniently in the same direction as the workplaces of some parents, and there are traffic jams in morning peak hours. The location of School A is better than that of School B.
The physical data
RESULTSmost parents of School A think traffic congestion isn’t a problem around school,
while most parents of School B think the traffic congestion is a problem. Regardless, 90% of them still drive to school
The traffic data,
It shows that a different perception exists about traffic congestion around these two schools despite School A and School B being located in the same district.
CONCLUSIONThe results indicate that parents’ decision to use school bus management for their children’s transportation to school includes school bus service time, school bus fares, and school bus operation. Further work would be interesting and is recommended to construct the logit model for School A and use ArcGIS to analysis household locations.