Embed Size (px)
Citation preview
Accepted Manuscript
A comparison of the thermal conductivity of oil palm shell foamed concrete with
conventional materials
U. Johnson Alengaram, Baig Abdullah Al Muhit, Mohd Zamin bin Jumaat,
Michael Liu Yong Jing
PII: S0261-3069(13)00401-9
DOI: http://dx.doi.org/10.1016/j.matdes.2013.04.078
Reference: JMAD 5414
To appear in: Materials and Design
Received Date: 5 January 2013
Accepted Date: 20 April 2013
Please cite this article as: Johnson Alengaram, U., Al Muhit, B.A., bin Jumaat, M.Z., Jing, M.L.Y., A comparison
of the thermal conductivity of oil palm shell foamed concrete with conventional materials, Materials and Design
(2013), doi: http://dx.doi.org/10.1016/j.matdes.2013.04.078
This is a PDF file of an unedited manuscript that has been accepted for publication. As a service to our customers
we are providing this early version of the manuscript. The manuscript will undergo copyediting, typesetting, and
review of the resulting proof before it is published in its final form. Please note that during the production process
errors may be discovered which could affect the content, and all legal disclaimers that apply to the journal pertain.
1
A comparison of the thermal conductivity of oil palm shell foamed concrete with conventional materials
U. Johnson Alengaram*, Baig Abdullah Al Muhit, Mohd Zamin bin Jumaat, Michael Liu Yong Jing Department of Civil Engineering, Faculty of Engineering, University of Malaya, 50603 Kuala Lumpur, Malaysia Abstract
Foamed concrete (FC) is characterized by its low self-weight and insulation properties. This paper reports on the thermal conductivity of structural and non-structural grade foamed concretes developed using locally available waste materials – oil palm shell (OPS) – as lightweight coarse aggregate. Six mixes of oil palm shell foamed concrete (OPSFC) of oven-dry density ranging from 1100 to 1600 kg/m3 were prepared and tested for thermal insulation and compared with the non-foamed oil palm shell concrete (OPSC) as the control concrete and conventional materials, such as brick and block. Non-structural grade OPSFC with a density of 1100 kg/m3 showed the lowest thermal conductivity of 0.40 W/m.K, which is 33% and 56% lower than the conventional materials – block and brick – respectively. OPSFC with 1500 and 1600 kg/m3 can be considered as structural and insulating concrete as per the RILEM classification. The tiny air pores created in the concrete act as an insulator and it was found that the thermal conductivity of OPSFC with densities of 1100 and 1300 kg/m3 are similar to those of pumice concrete and expanded perlite aggregate concrete (EPAC), respectively.
Keywords: Oil palm shell foam concrete, Thermal conductivity, Conventional materials, Temperature variation, Structural and insulating concrete
*Corresponding author. Tel.: +60 379677632. Fax. +60 379675318. E-mail address: [email protected] (U. Johnson Alengaram)
1. Introduction
Foamed concrete (FC) falls under the broader category of cellular concrete. In the cellular concrete, air-voids are introduced artificially either by the use of aluminum powder or a foaming agent in the concrete [1, 2]. FC is prepared by adding foam, produced by a foaming agent solution, into the cement paste or concrete [3]. The presence of air voids in foamed concrete makes the concrete light. Furthermore, it has the following characteristics such as high flowability, low controlled strength and excellent thermal insulation [2, 4, 5]. So far, researchers have been successful in producing foamed concrete in the density range of 300 to 1800 kg/m3 [2, 5]. Jones and McCarthy [4] produced foamed concrete in the density range of 600 to 1200 kg/m3 using a cement content of 300 to 600 kg/m3. Nambiar and Ramamurthy [3] used fly ash (FA) produced to develop foamed concrete with densities of 1000, 1250 and 1500 kg/m3. Utilization of waste materials, such as FA, slag, sludge, etc. to produce foamed concrete adds to the sustainability of the material. Kearsley and Wainwright [6, 7] concluded that the long-term properties of FC can be enhanced by replacing 75% cement with fly ash. They [7] also investigated the relationship between the porosity and the compressive strength of foamed concrete. Kim et al. [8] investigated the thermal conductivity of aerated concrete using expanded shale and reported that the pore size became smaller and the distribution of pores was enhanced with the inclusion of 0.5% of air entraining agent. T.S. Yun et al. [9] used hollow glass bubble to enhance the thermal insulating capacity of lightweight concrete (LWC). Thermal conductivity depends on the pores and the density of FC [5]. Khamphee Jitchaiyaphum et al. [10] reported that the replacement of fly ash by 30% of cement weight decreases the pore sizes and hence increase the compressive strength of LWC. In addition, microstructural investigations have been carried out by Narayanan and Ramamurthy [1] using X-ray diffraction (XRD) analysis on FC. Because of the presence of a volume of air inside, FC is an excellent choice for thermal insulation [2, 5]. Recently trends
2
have changed to use FC for structural purposes besides being used as thermal insulation and a void filling material. Due to its low density, and controlled low strength, FC can be very useful for structural utilities, floor topping and the foundations of a building. FC has also been used as a void filling material due to its high flowability, which is, however, dependent upon the air volume [3]. Oil palm shell (OPS) is the waste product at the time of extracting palm oil, which originates from the oil palm tree [11]. The oil palm tree, being in the same genera as the coconut palm tree, shares many features with it. Its scientific name is Elaeisguineensis and it happens to be found mainly in East Africa [12]. According to Ramli [13], Malaysia alone produces 4 million tons of OPS annually and it is predicted that Malaysia will have nearly 5 million hectares (ha) of palm oil trees by the year 2020. Being the second largest palm oil producing country in the world, Malaysia is also responsible for producing a large amount of palm oil waste. The use of OPS as lightweight aggregate (LWA) has been exploited by researchers and it has been shown that structural grade OPS concrete (OPSC) could be produced with the 28-day cube compressive strength in the range of 24-35 MPa and a density reduction of about 20% compared to normal weight concrete (NWC) [14]. Further investigation found that the 90-day drying shrinkage of OPSC was 14% higher than the NWC [15].
Alengaram et al. [16] investigated the influence of diverse size of OPS on the mechanical properties of OPSC and reported that the use of 70% of OPS of particle size more than 10 mm produced higher modulus of elasticity compared to OPSC with all particles. The recent investigations on the OPSC include shear behaviour, bond properties and the development of high strength concrete using OPS [17-19]. Alengaram et al. [17, 18] reported that reinforced OPSC beam of grade 30 produced 24% higher shear strength than the corresponding NWC; in addition, the bond between the reinforcement and OPSC was strong with no slip failure. The latest development in the OPSC is the enhancement of the compressive strength of about 53 MPa using crushed OPS aggregate [19]. Jumaat et al. [20] reported the density of OPS foamed concrete (OPSFC) in the range 1600 - 1700 kg/m3 similar to the density of FC of 300 - 1800 kg/m3 reported by other researchers [1, 2, 5]. The cube compressive strength of OPSFC was reported to be in the range of 16 - 24 MPa, which satisfies the requirement for structural lightweight concrete (SLWC) stipulated by ASTM C330-09 and ACI 318M-08 [21]. However, a higher compressive strength of FC in the range of 1 - 43 MPa was reported; the compressive strength depends on the density and use of cementitious materials as a cement replacement [2]. Cementitious materials, such as fly ash and silica fume, help to ensure a uniform distribution of air-voids created by foam. In the FC of higher density, the compressive strength decreases with an increase in void diameter. If the pore diameter increases the air bubbles merge with each other resulting in lesser paste volume, and, consequently, results in lower compressive strength [3]. Kearsley and Wainwright [6] found that with the use of fly ash, the later strength of FC could be increased up to 67%. Small changes in the w/c ratio do not affect the strength of FC [4]. Most of the above mentioned researches on OPSC focused on the mechanical, structural and durability characteristics. However, there is no research work has been carried out on the thermal insulating characteristics of OPSC. The convex surface of OPS has lot of tiny pores of size in the range of 16–24 m [5] and hence the thermal insulating characteristic of OPS through the air trapped inside the OPS could be exploited. In addition, the use of foam to introduce further air bubbles in the OPSC might enhance the thermal insulating property of OPSC.
3
Although the effect on foam in enhancing the thermal insulation properties of OPSC has not yet received much attention from the researchers, the issue of thermal insulation of buildings has recently received immense consideration worldwide due to the energy crisis [22]. The use of foam in OPSC is a relatively new area of research. From the economic and environmental point of view, it is more effective to design buildings with high thermal insulation characteristics. In hot weather areas, buildings are being built with solid or hollow concrete blocks termed as single skin walls [23]. It is well known that the thermal conductivity of air is lower than that of concrete; thus, by incorporating air bubbles inside concrete, a thermally insulating material can be produced. It has been reported by Uysal et al. [24] that thermal conductivity of concrete increases with an increase in the cement content. In this investigation, artificially generated foam is introduced to produce both structural and non-structural grade LWC in which OPS was used as the coarse aggregate. Since air is a good insulator, air voids were induced through foaming. Cementitious materials, such as Class-F fly ash (FA) and silica fume were used as cement replacement and additional cementitious materials, respectively. The oven dry densities (ODD) along with the compressive strengths up to the age of 28-day were reported. The main objective of this research is to determine the thermal conductivity of foamed OPS concrete and make a comparison with non-foamed OPSC and materials, such as brick and blocks, which are conventionally used for walls in buildings in Malaysia. The ODD of FC was in the range of 1100 - 1600 kg/m3.
2. Experimental study
2.1. Materials
2.1.1. Cement
Ordinary Portland cement (OPC) conforming to MS 522:1 [25] from Tasek Corporation Berhad, was used in the concrete as the primary binding material.
2.1.2. Fine and coarse aggregates
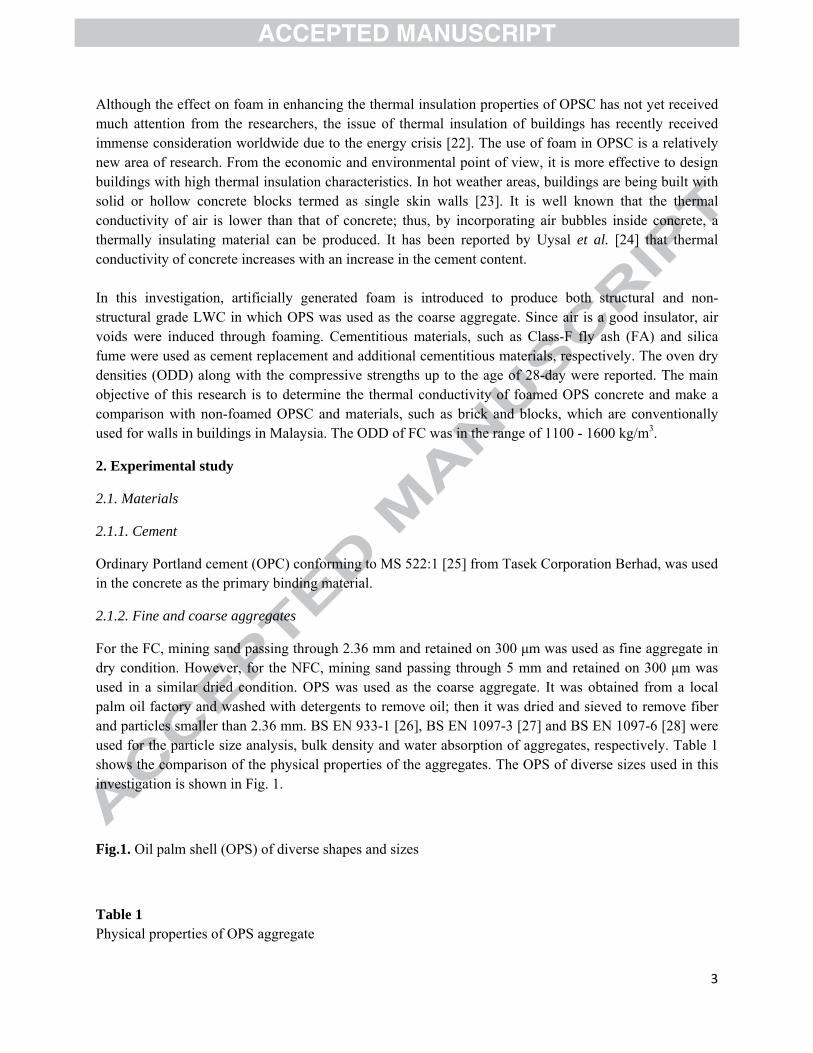
For the FC, mining sand passing through 2.36 mm and retained on 300 μm was used as fine aggregate in dry condition. However, for the NFC, mining sand passing through 5 mm and retained on 300 μm was used in a similar dried condition. OPS was used as the coarse aggregate. It was obtained from a local palm oil factory and washed with detergents to remove oil; then it was dried and sieved to remove fiber and particles smaller than 2.36 mm. BS EN 933-1 [26], BS EN 1097-3 [27] and BS EN 1097-6 [28] were used for the particle size analysis, bulk density and water absorption of aggregates, respectively. Table 1 shows the comparison of the physical properties of the aggregates. The OPS of diverse sizes used in this investigation is shown in Fig. 1.
Fig.1. Oil palm shell (OPS) of diverse shapes and sizes
Table 1 Physical properties of OPS aggregate
4
2.1.3. Mineral admixtures
Class-F (low calcium) FA and silica fume (SF) were used as cement replacement (5%) and additional cementitious materials (10%) by weight of cement, respectively. These two admixtures conforming to ASTM C618-12a and ASTM C1240-12, respectively, were supplied by Lafarge Cement and Sika, respectively. The chemical compositions of cement, FA and SF are shown in Table 2.
Table 2 Chemical compositions of cement, fly ash and silica fume (%)
2.1.4. Chemical admixture
Rheobuild 1000 naphthalene based high range water reducing admixture, alternatively known as superplasticizer (SP), was used as a chemical admixture in concrete with a dosage of 0.5% and 1% by weight of cement for foamed and NFC, respectively. The SP used in the concrete, which has the commercial name Rheobuild 1000, is chloride free, chemically stable and non-hazardous with a specific gravity of 1.20 g/cm3.
2.1.5. Water
Potable water was used for the mixing of concrete.
2.1.6. Foaming agent and foam
A synthetic foaming agent (Naphthalene Sulfonated - Finefoam 707) with a specific gravity of 1.02 was used in this investigation. The ratio of foaming agent to water was 1:20; the foaming agent was then poured into the foaming generator to produce foam and its density was found as 50 kg/m3. The air pressure in the foaming generator was maintained at 75 psi or 517 kN/m2 for foam generation. The generated foam was then added into the concrete during mixing of the concrete. Fig. 2 shows the foam generated.
Fig. 2. Generated foam
2.2. Mix proportion and casting
The quantity of foam used and the compressive strength along with standard deviations are given in Table 3. The mineral admixtures used were 5% FA and 10% SF, as cement replacement and additional material,
5
respectively. The terms cement content (C) and the cementitious materials content (CM) differ; cement content means the quantity of cement and FA, whereas cementitious ratio implies the cement, FA and SF contents. The sand to cement (S/C) and the aggregate to cement (A/C) ratios were kept at 1.6 and 0.8, respectively. The sand and OPS contents were 788 and 394 kg/m3, respectively. The FA content used was 5% (24.65 kg/m3 as cement replacement); thus, the total cement content used was 468+24.65 = 493 kg/m3. The water to cementitious material (w/cm) ratio was kept constant at 0.35 whereas SP was used with dosages of 0.5% and 1% of cement weight for foamed and non-foamed concrete, respectively. Table 3
Quantities of foam used and the compressive strength of foamed and non-foamed concrete Mixing was done in a rotary drum mixture with a mixing capacity of 200 litres. The washed and dried OPS were soaked in water for one hour prior to casting and air-dried to SSD condition before mixing. This was done to prevent the absorption by the OPS of water meant for hydration. OPS followed by sand were mixed for 1 minute. Then the cement, FA and SF were added. Part of the water was added and mixed for 2 minutes. The remaining water and SP were then added and mixed thoroughly for 1 minute. Finally, the required foam, as indicated in Table 3, was added. The total mixing procedure took up to about 5 minutes. In NFC, the preparation was similar to the foamed except for the addition of foam.
2.3. Specimen preparation
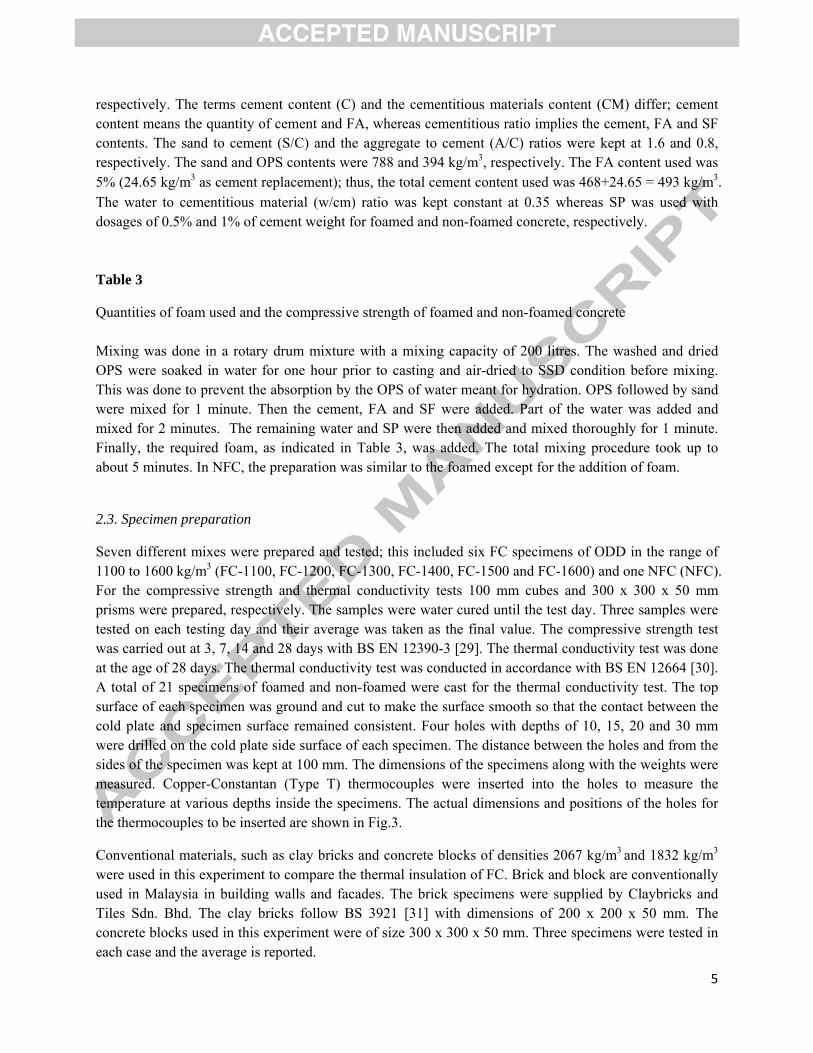
Seven different mixes were prepared and tested; this included six FC specimens of ODD in the range of 1100 to 1600 kg/m3 (FC-1100, FC-1200, FC-1300, FC-1400, FC-1500 and FC-1600) and one NFC (NFC). For the compressive strength and thermal conductivity tests 100 mm cubes and 300 x 300 x 50 mm prisms were prepared, respectively. The samples were water cured until the test day. Three samples were tested on each testing day and their average was taken as the final value. The compressive strength test was carried out at 3, 7, 14 and 28 days with BS EN 12390-3 [29]. The thermal conductivity test was done at the age of 28 days. The thermal conductivity test was conducted in accordance with BS EN 12664 [30]. A total of 21 specimens of foamed and non-foamed were cast for the thermal conductivity test. The top surface of each specimen was ground and cut to make the surface smooth so that the contact between the cold plate and specimen surface remained consistent. Four holes with depths of 10, 15, 20 and 30 mm were drilled on the cold plate side surface of each specimen. The distance between the holes and from the sides of the specimen was kept at 100 mm. The dimensions of the specimens along with the weights were measured. Copper-Constantan (Type T) thermocouples were inserted into the holes to measure the temperature at various depths inside the specimens. The actual dimensions and positions of the holes for the thermocouples to be inserted are shown in Fig.3.
Conventional materials, such as clay bricks and concrete blocks of densities 2067 kg/m3 and 1832 kg/m3
were used in this experiment to compare the thermal insulation of FC. Brick and block are conventionally used in Malaysia in building walls and facades. The brick specimens were supplied by Claybricks and Tiles Sdn. Bhd. The clay bricks follow BS 3921 [31] with dimensions of 200 x 200 x 50 mm. The concrete blocks used in this experiment were of size 300 x 300 x 50 mm. Three specimens were tested in each case and the average is reported.
6
Fig. 3. A typical diagram showing the holes for thermocouple attachment
2.4. Test apparatus and method
The thermal conductivity testing apparatus contains a battery (Fig. 4) (operating between 12.75V and 11V), an AM25T multiplexer, a CR800 series data logger, a motor, a device for controlling the hot plate and cold plate temperatures (Fig. 5), a CS10-L current transformer (capable of measuring current between 0 and 200 A), twelve type-T thermocouples (Copper-Constantan), and the main body of the apparatus or chamber where the specimens were to be kept (Fig. 6). To measure the hot and cold plate temperature, four thermocouple sensors were used in addition to the four thermocouples used to measure the temperature at different depths of the specimen. The whole test-setup with associated parts is presented in a schematic diagram in Fig. 7.
Fig.4. Wiring through multiplexer, data logger and battery
Fig.5. Hot and cold plate temperature controller
Fig.6.Specimen sandwiched between hot and cold plates
The temperature setting is an important task as far as thermal insulation testing is concerned. The cold plate temperature represents the room temperature, and, hence, it was set at 18˚C; similarly, the hot plate temperature was kept at 40˚C (Fig. 6) to simulate the exterior temperature.
Fig.7. Schematic diagram showing the position of a specimen inside the thermal chamber and its associated parts
The hot and cold plates were covered with one layer of thermal barrier cushion. The specimen was kept between these two plates and thermally insulated using a cork sheet. All the sides of the specimen were insulated using an insulating cushion to ensure that the heat was only conducted in the vertical direction of the specimen. The outer surface of the hot plate was also covered with two thick layers of insulating cushions. Each specimen was tested for 48 hours. The data stored in the data logger were collected and analysed after 48 hours using the LoggerNet program.
7
3. Results and discussion
3.1. Relationship between oven dry density and thermal conductivity of foamed and non-foamed concretes
The target ODDs for FC were 1100, 1200, 1300, 1400, 1500 and 1600 kg/m3. The measured ODD and thermal conductivities of the foamed and non-foamed concretes along with conventional materials – brick and block – are shown in Table 4.
Table 4 Oven dry density and thermal conductivity
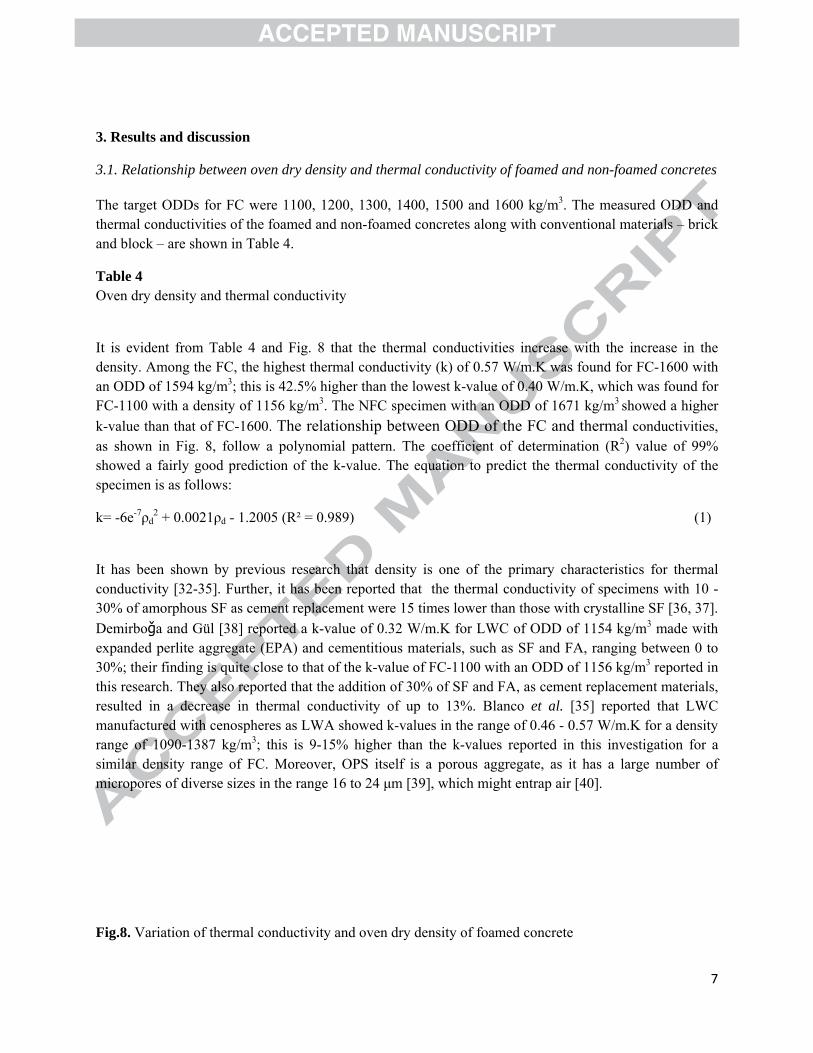
It is evident from Table 4 and Fig. 8 that the thermal conductivities increase with the increase in the density. Among the FC, the highest thermal conductivity (k) of 0.57 W/m.K was found for FC-1600 with an ODD of 1594 kg/m3; this is 42.5% higher than the lowest k-value of 0.40 W/m.K, which was found for FC-1100 with a density of 1156 kg/m3. The NFC specimen with an ODD of 1671 kg/m3 showed a higher k-value than that of FC-1600. The relationship between ODD of the FC and thermal conductivities, as shown in Fig. 8, follow a polynomial pattern. The coefficient of determination (R2) value of 99% showed a fairly good prediction of the k-value. The equation to predict the thermal conductivity of the specimen is as follows:
k= -6e-7ρd2 + 0.0021ρd - 1.2005 (R² = 0.989) (1)
It has been shown by previous research that density is one of the primary characteristics for thermal conductivity [32-35]. Further, it has been reported that the thermal conductivity of specimens with 10 - 30% of amorphous SF as cement replacement were 15 times lower than those with crystalline SF [36, 37]. Demirboǧa and Gül [38] reported a k-value of 0.32 W/m.K for LWC of ODD of 1154 kg/m3 made with expanded perlite aggregate (EPA) and cementitious materials, such as SF and FA, ranging between 0 to 30%; their finding is quite close to that of the k-value of FC-1100 with an ODD of 1156 kg/m3 reported in this research. They also reported that the addition of 30% of SF and FA, as cement replacement materials, resulted in a decrease in thermal conductivity of up to 13%. Blanco et al. [35] reported that LWC manufactured with cenospheres as LWA showed k-values in the range of 0.46 - 0.57 W/m.K for a density range of 1090-1387 kg/m3; this is 9-15% higher than the k-values reported in this investigation for a similar density range of FC. Moreover, OPS itself is a porous aggregate, as it has a large number of micropores of diverse sizes in the range 16 to 24 μm [39], which might entrap air [40].
Fig.8. Variation of thermal conductivity and oven dry density of foamed concrete
8
3.2. Temperature variation on the surface and interior of the specimen
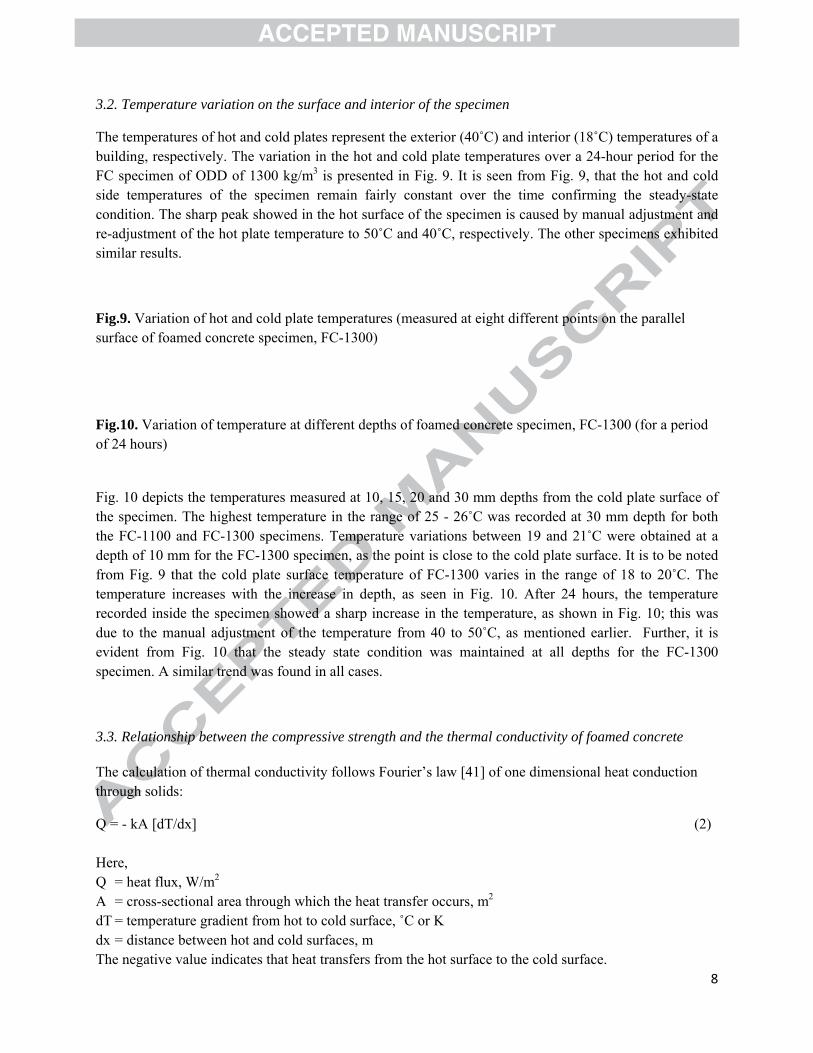
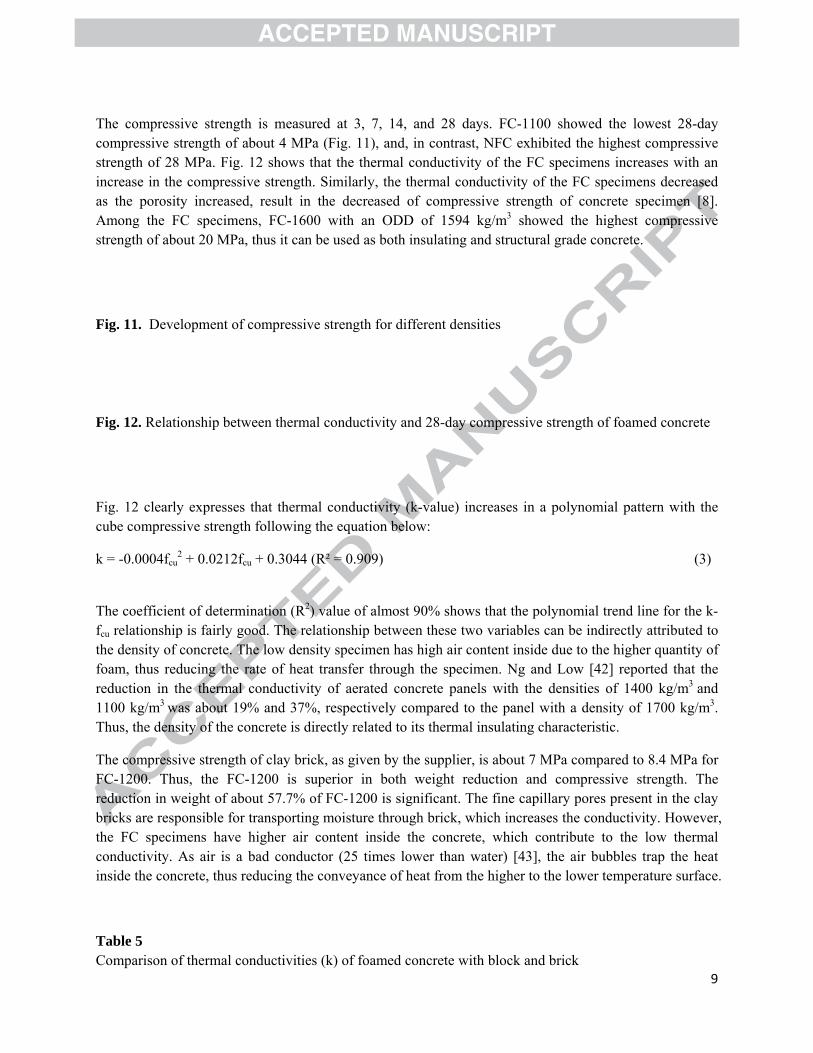
The temperatures of hot and cold plates represent the exterior (40˚C) and interior (18˚C) temperatures of a building, respectively. The variation in the hot and cold plate temperatures over a 24-hour period for the FC specimen of ODD of 1300 kg/m3 is presented in Fig. 9. It is seen from Fig. 9, that the hot and cold side temperatures of the specimen remain fairly constant over the time confirming the steady-state condition. The sharp peak showed in the hot surface of the specimen is caused by manual adjustment and re-adjustment of the hot plate temperature to 50˚C and 40˚C, respectively. The other specimens exhibited similar results.
Fig.9. Variation of hot and cold plate temperatures (measured at eight different points on the parallel surface of foamed concrete specimen, FC-1300)
Fig.10. Variation of temperature at different depths of foamed concrete specimen, FC-1300 (for a period of 24 hours)
Fig. 10 depicts the temperatures measured at 10, 15, 20 and 30 mm depths from the cold plate surface of the specimen. The highest temperature in the range of 25 - 26˚C was recorded at 30 mm depth for both the FC-1100 and FC-1300 specimens. Temperature variations between 19 and 21˚C were obtained at a depth of 10 mm for the FC-1300 specimen, as the point is close to the cold plate surface. It is to be noted from Fig. 9 that the cold plate surface temperature of FC-1300 varies in the range of 18 to 20˚C. The temperature increases with the increase in depth, as seen in Fig. 10. After 24 hours, the temperature recorded inside the specimen showed a sharp increase in the temperature, as shown in Fig. 10; this was due to the manual adjustment of the temperature from 40 to 50˚C, as mentioned earlier. Further, it is evident from Fig. 10 that the steady state condition was maintained at all depths for the FC-1300 specimen. A similar trend was found in all cases.
3.3. Relationship between the compressive strength and the thermal conductivity of foamed concrete
The calculation of thermal conductivity follows Fourier’s law [41] of one dimensional heat conduction through solids:
Q = - kA [dT/dx] (2) Here, Q = heat flux, W/m2
A = cross-sectional area through which the heat transfer occurs, m2
dT = temperature gradient from hot to cold surface, ˚C or K dx = distance between hot and cold surfaces, m The negative value indicates that heat transfers from the hot surface to the cold surface.
9
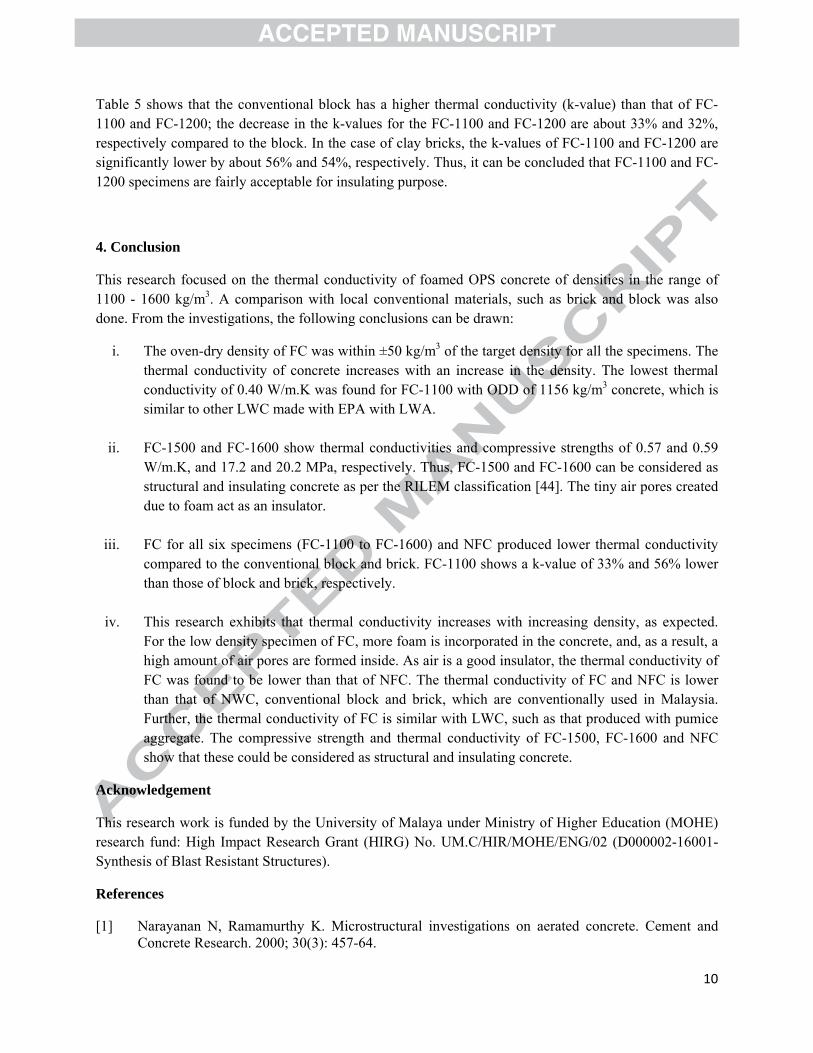
The compressive strength is measured at 3, 7, 14, and 28 days. FC-1100 showed the lowest 28-day compressive strength of about 4 MPa (Fig. 11), and, in contrast, NFC exhibited the highest compressive strength of 28 MPa. Fig. 12 shows that the thermal conductivity of the FC specimens increases with an increase in the compressive strength. Similarly, the thermal conductivity of the FC specimens decreased as the porosity increased, result in the decreased of compressive strength of concrete specimen [8]. Among the FC specimens, FC-1600 with an ODD of 1594 kg/m3 showed the highest compressive strength of about 20 MPa, thus it can be used as both insulating and structural grade concrete.
Fig. 11. Development of compressive strength for different densities
Fig. 12. Relationship between thermal conductivity and 28-day compressive strength of foamed concrete
Fig. 12 clearly expresses that thermal conductivity (k-value) increases in a polynomial pattern with the cube compressive strength following the equation below:
k = -0.0004fcu2 + 0.0212fcu + 0.3044 (R² = 0.909) (3)
The coefficient of determination (R2) value of almost 90% shows that the polynomial trend line for the k-fcu relationship is fairly good. The relationship between these two variables can be indirectly attributed to the density of concrete. The low density specimen has high air content inside due to the higher quantity of foam, thus reducing the rate of heat transfer through the specimen. Ng and Low [42] reported that the reduction in the thermal conductivity of aerated concrete panels with the densities of 1400 kg/m3 and 1100 kg/m3 was about 19% and 37%, respectively compared to the panel with a density of 1700 kg/m3. Thus, the density of the concrete is directly related to its thermal insulating characteristic.
The compressive strength of clay brick, as given by the supplier, is about 7 MPa compared to 8.4 MPa for FC-1200. Thus, the FC-1200 is superior in both weight reduction and compressive strength. The reduction in weight of about 57.7% of FC-1200 is significant. The fine capillary pores present in the clay bricks are responsible for transporting moisture through brick, which increases the conductivity. However, the FC specimens have higher air content inside the concrete, which contribute to the low thermal conductivity. As air is a bad conductor (25 times lower than water) [43], the air bubbles trap the heat inside the concrete, thus reducing the conveyance of heat from the higher to the lower temperature surface.
Table 5 Comparison of thermal conductivities (k) of foamed concrete with block and brick
10
Table 5 shows that the conventional block has a higher thermal conductivity (k-value) than that of FC-1100 and FC-1200; the decrease in the k-values for the FC-1100 and FC-1200 are about 33% and 32%, respectively compared to the block. In the case of clay bricks, the k-values of FC-1100 and FC-1200 are significantly lower by about 56% and 54%, respectively. Thus, it can be concluded that FC-1100 and FC-1200 specimens are fairly acceptable for insulating purpose.
4. Conclusion
This research focused on the thermal conductivity of foamed OPS concrete of densities in the range of 1100 - 1600 kg/m3. A comparison with local conventional materials, such as brick and block was also done. From the investigations, the following conclusions can be drawn:
i. The oven-dry density of FC was within ±50 kg/m3 of the target density for all the specimens. The thermal conductivity of concrete increases with an increase in the density. The lowest thermal conductivity of 0.40 W/m.K was found for FC-1100 with ODD of 1156 kg/m3 concrete, which is similar to other LWC made with EPA with LWA.
ii. FC-1500 and FC-1600 show thermal conductivities and compressive strengths of 0.57 and 0.59 W/m.K, and 17.2 and 20.2 MPa, respectively. Thus, FC-1500 and FC-1600 can be considered as structural and insulating concrete as per the RILEM classification [44]. The tiny air pores created due to foam act as an insulator.
iii. FC for all six specimens (FC-1100 to FC-1600) and NFC produced lower thermal conductivity compared to the conventional block and brick. FC-1100 shows a k-value of 33% and 56% lower than those of block and brick, respectively.
iv. This research exhibits that thermal conductivity increases with increasing density, as expected. For the low density specimen of FC, more foam is incorporated in the concrete, and, as a result, a high amount of air pores are formed inside. As air is a good insulator, the thermal conductivity of FC was found to be lower than that of NFC. The thermal conductivity of FC and NFC is lower than that of NWC, conventional block and brick, which are conventionally used in Malaysia. Further, the thermal conductivity of FC is similar with LWC, such as that produced with pumice aggregate. The compressive strength and thermal conductivity of FC-1500, FC-1600 and NFC show that these could be considered as structural and insulating concrete.
Acknowledgement
This research work is funded by the University of Malaya under Ministry of Higher Education (MOHE) research fund: High Impact Research Grant (HIRG) No. UM.C/HIR/MOHE/ENG/02 (D000002-16001-Synthesis of Blast Resistant Structures).
References [1] Narayanan N, Ramamurthy K. Microstructural investigations on aerated concrete. Cement and
Concrete Research. 2000; 30(3): 457-64.
11
[2] Ramamurthy K, Nambiar EKK, Indu Siva Ranjani G. A classification of studies on properties of foam concrete. Cement and Concrete Composites. 2009; 31(6): 388-96.
[3] Nambiar EKK, Ramamurthy K. Air-void characterisation of foam concrete. Cement and Concrete Research. 2007; 37(2): 221-30.
[4] Jones MR, McCarthy A. Heat of hydration in foamed concrete: Effect of mix constituents and plastic density. Cement and Concrete Research. 2006; 36(6): 1032-41.
[5] Alengaram UJ, Al Muhit BA, Jumaat MZ. Utilization of oil palm kernel shell as lightweight aggregate in concrete – A review. Construction and Building Materials. 2013; 38: 161-72.
[6] Kearsley EP, Wainwright PJ. The effect of high fly ash content on the compressive strength of foamed concrete. Cement and Concrete Research. 2001; 31(1): 105-12.
[7] Kearsley EP, Wainwright PJ. Porosity and permeability of foamed concrete. Cement and Concrete Research. 2001; 31(5): 805-12.
[8] Kim HK, Jeon JH, Lee HK. Workability, and mechanical, acoustic and thermal properties of lightweight aggregate concrete with a high volume of entrained air. Construction and Building Materials. 2012; 29: 193-200.
[9] Yun TS, Jeong YJ, Han T-S, Youm K-S. Evaluation of thermal conductivity for thermally insulated concretes. Energy and Buildings. 2013; 61: 125-32.
[10] Jitchaiyaphum K, Sinsiri T, Chindaprasirt P. Cellular Lightweight Concrete Containing Pozzolan Materials. Procedia Engineering. 2011; 14: 1157-64.
[11] Okafor FO. Palm kernel shell as a lightweight aggregate for concrete. Cement and Concrete Research. 1988; 18(6): 901-10.
[12] Pantzaris TP, Ahmad MJ. Properties and utilization of palm kernel oil. MPOB (Europe), editor. Hertford, SG13 8NL, UK: Brickendonbury; 2001.
[13] Ramli A. Short-term and long-term projection of Malaysian palm oil production. Oil palm industry economic journal. 2003; 3(1): 32-6.
[14] Basri HB, Mannan MA, Zain MFM. Concrete using waste oil palm shells as aggregate. Cement and Concrete Research. 1999; 29(4): 619-22.
[15] Mannan MA, Ganapathy C. Engineering properties of concrete with oil palm shell as coarse aggregate. Construction and Building Materials. 2002; 16(1): 29-34.
[16] Alengaram UJ, Mahmud H, Jumaat MZ, Shirazi S. Effect of aggregate size and proportion on strength properties of palm kernel shell concrete. International Journal of Physical Sciences. 2010; 5(12): 1848-56.
[17] Alengaram UJ, Jumaat MZ, Mahmud H, Fayyadh MM. Shear behaviour of reinforced palm kernel shell concrete beams. Construction and Building Materials. 2011; 25(6): 2918-27.
[18] Alengaram UJ, Mahmud H, Jumaat MZ. Comparison of mechanical and bond properties of oil palm kernel shell concrete with normal weight concrete. Int J Phys Sci. 2010; 5(8): 1231-9.
[19] Shafigh P, Jumaat MZ, Mahmud H, Alengaram UJ. A new method of producing high strength oil palm shell lightweight concrete. Materials & Design. 2011; 32(10): 4839-43.
[20] Jumaat MZ, Alengaram UJ, Mahmud H. Shear strength of oil palm shell foamed concrete beams. Materials & Design. 2009; 30(6): 2227-36.
[21] ACI 318M-08. Building code requirements for structural concrete (ACI 318M-08) and commentary. 2008.
[22] Goual M, Bali A, Queneudec M. Effective thermal conductivity of clayey aerated concrete in the dry state: experimental results and modelling. Journal of Physics D: Applied Physics. 1999; 32(23): 3041-6.
[23] Al-Jabri KS, Hago AW, Al-Nuaimi AS, Al-Saidy AH. Concrete blocks for thermal insulation in hot climate. Cement and Concrete Research. 2005; 35(8): 1472-9.
[24] Uysal H, Demirboğa R, Şahin R, Gül R. The effects of different cement dosages, slumps, and pumice aggregate ratios on the thermal conductivity and density of concrete. Cement and Concrete Research. 2004; 34(5): 845-8.
12
[25] MS 522. Portland cement (ordinary and rapid-hardening): Part 1: Specification (second revision). 2003.
[26] BS EN 933-1. Tests for geometrical properties of aggregates. Determination of particle size distribution. Sieving method. 1997.
[27] BS EN 1097-3. Tests for mechanical and physical properties of aggregates. Determination of loose bulk density and voids. 1998.
[28] BS EN 1097-6. Tests for mechanical and physical properties of aggregates. Determination of particle density and water absorption. 2000.
[29] BS EN 12390-3. Testing hardened concrete. Compressive strength of test specimens. 2009. [30] BS EN 12664. Thermal performance of building materials and products. Determination of thermal
resistance by means of guarded hot plate and heat flow meter methods. Dry and moist products of medium and low thermal resistance, London: British Standards. 2001.
[31] BS 3921. Specification for clay bricks. British Standard Institutions, London. 1985. [32] Valor RC. Cellular concretes-physical properties. Journal of the American Concrete Institute. 1954;
25: 817-36. [33] Lu-shu K, Man-qing S, Xing-Sheng S, Yun-xiu L. Research on several physiomechanical
properties of lightweight aggregate concrete. International Journal of Cement Composites and Lightweight Concrete. 1980; 2(4): 185-91.
[34] Akman M, Tasdemir M. Perlite concrete as a structural material. Proceedings of the First National Perlite Congress. 1977.
[35] Blanco F, Garcı ́a P, Mateos P, Ayala J. Characteristics and properties of lightweight concrete manufactured with cenospheres. Cement and Concrete Research. 2000; 30(11): 1715-22.
[36] Loudon AG. The thermal properties of lightweight concretes. International Journal of Cement Composites and Lightweight Concrete. 1979; 1(2): 71-85.
[37] Fu X, Chung D. Effect of admixtures on the thermal and thermo mechanical behavior of cement paste. ACI Materials Journal. 1999; 96(4): 455-61.
[38] Demirboǧa R, Gül R. Thermal conductivity and compressive strength of expanded perlite aggregate concrete with mineral admixtures. Energy and Buildings. 2003; 35(11): 1155-9.
[39] Alengaram UJ, Mahmud H, Jumaat MZ. Enhancement and prediction of modulus of elasticity of palm kernel shell concrete. Materials and Design. 2011; 32(4): 2143-8.
[40] Kupaei RH, Alengaram UJ, Jumaat MZ, Nikraz H. Mix design for fly ash based oil palm shell geopolymer lightweight concrete. Construction and Building Materials. 2013; 43: 490-496.
[41] Long C, Sayma N. Heat transfer. Frederiksberg: Ventus Publishing ApS; 2009. [42] Ng S-C, Low K-S. Thermal conductivity of newspaper sandwiched aerated lightweight concrete
panel. Energy and Buildings. 2010; 42(12):2452-6. [43] Narayanan N, Ramamurthy K. Structure and properties of aerated concrete: a review. Cement and
Concrete Composites. 2000; 22(5): 321-9. [44] FIP Manual of Lightweight Aggregate Concrete. 2nd Ed. London: Surrey University Press; 1983.
13
List of Figures and Tables
Fig.1. Oil palm shell (OPS) of diverse shapes and sizes
Fig. 2. Generated foam
Fig. 3. A typical diagram showing the holes for thermocouple attachment
Fig.4. Wiring through multiplexer, data logger and battery
Fig.5. Hot and cold plate temperature controller
Fig.6.Specimen sandwiched between hot and cold plates
Fig.7. Schematic diagram showing the position of a specimen inside the thermal chamber and its associated parts
Fig.8. Variation of thermal conductivity and oven dry density of foamed concrete
Fig.9. Variation of hot and cold plate temperatures (measured at eight different points on the parallel surface of foamed concrete specimen, FC-1300)
Fig.10. Variation of temperature at different depths of foamed concrete specimen, FC-1300 (for a period of 24 hours)
Fig. 11. Development of compressive strength for different densities
Fig. 12. Relationship between thermal conductivity and 28-day compressive strength of foamed concrete
Table 1 Physical properties of OPS aggregate Table 2 Chemical compositions of cement, fly ash and silica fume (%) Table 3 Quantities of foam used and the compressive strength of foamed and non-foamed concrete Table 4 Oven dry density and thermal conductivity Table 5 Comparison of thermal conductivities (k) of foamed concrete with block and brick
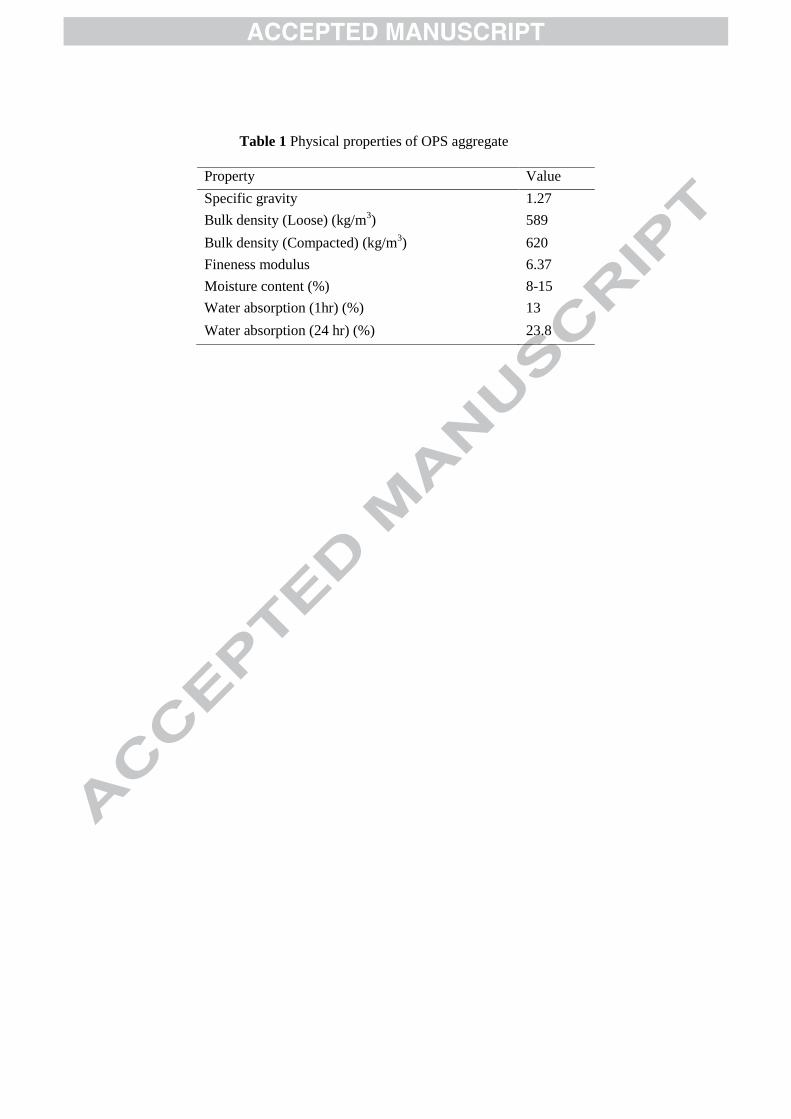
Table 1 Physical properties of OPS aggregate
Property Value
Specific gravity 1.27
Bulk density (Loose) (kg/m3) 589
Bulk density (Compacted) (kg/m3) 620
Fineness modulus 6.37
Moisture content (%) 8-15
Water absorption (1hr) (%) 13
Water absorption (24 hr) (%) 23.8
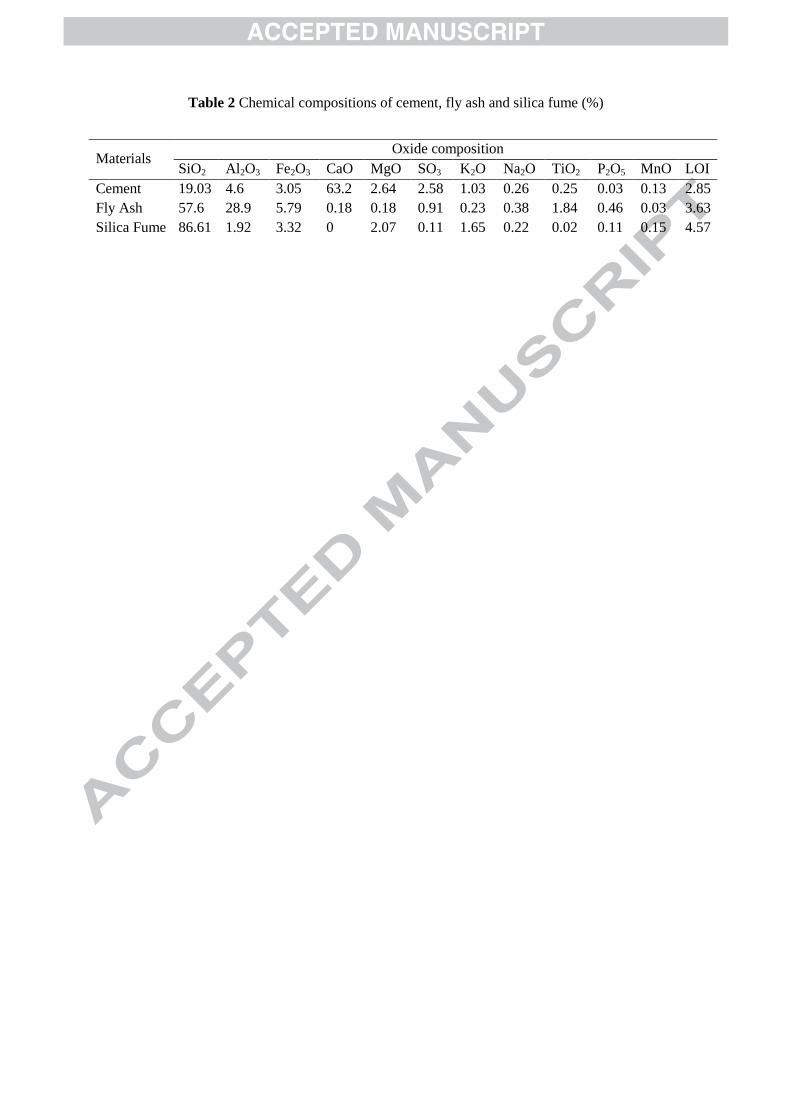
Table 2 Chemical compositions of cement, fly ash and silica fume (%)
Materials Oxide composition
SiO2 Al2O3 Fe2O3 CaO MgO SO3 K2O Na2O TiO2 P2O5 MnO LOI
Cement 19.03 4.6 3.05 63.2 2.64 2.58 1.03 0.26 0.25 0.03 0.13 2.85
Fly Ash 57.6 28.9 5.79 0.18 0.18 0.91 0.23 0.38 1.84 0.46 0.03 3.63
Silica Fume 86.61 1.92 3.32 0 2.07 0.11 1.65 0.22 0.02 0.11 0.15 4.57
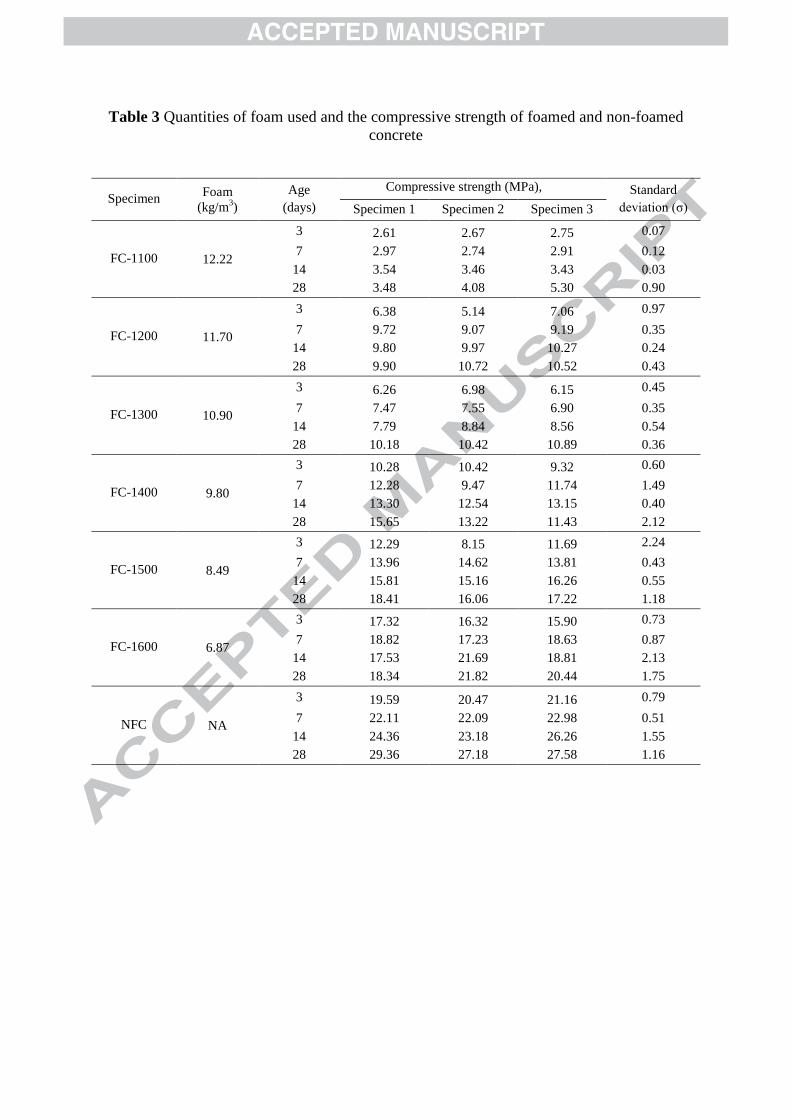
Table 3 Quantities of foam used and the compressive strength of foamed and non-foamed
concrete
Specimen Foam
(kg/m3)
Age
(days)
Compressive strength (MPa), Standard
deviation (σ) Specimen 1 Specimen 2 Specimen 3
FC-1100 12.22
3 2.61 2.67 2.75 0.07
7 2.97 2.74 2.91 0.12
14 3.54 3.46 3.43 0.03
28 3.48 4.08 5.30 0.90
FC-1200 11.70
3 6.38 5.14 7.06 0.97
7 9.72 9.07 9.19 0.35
14 9.80 9.97 10.27 0.24
28 9.90 10.72 10.52 0.43
FC-1300 10.90
3 6.26 6.98 6.15 0.45
7 7.47 7.55 6.90 0.35
14 7.79 8.84 8.56 0.54
28 10.18 10.42 10.89 0.36
FC-1400 9.80
3 10.28 10.42 9.32 0.60
7 12.28 9.47 11.74 1.49
14 13.30 12.54 13.15 0.40
28 15.65 13.22 11.43 2.12
FC-1500 8.49
3 12.29 8.15 11.69 2.24
7 13.96 14.62 13.81 0.43
14 15.81 15.16 16.26 0.55
28 18.41 16.06 17.22 1.18
FC-1600 6.87
3 17.32 16.32 15.90 0.73
7 18.82 17.23 18.63 0.87
14 17.53 21.69 18.81 2.13
28 18.34 21.82 20.44 1.75
NFC NA
3 19.59 20.47 21.16 0.79
7 22.11 22.09 22.98 0.51
14 24.36 23.18 26.26 1.55
28 29.36 27.18 27.58 1.16
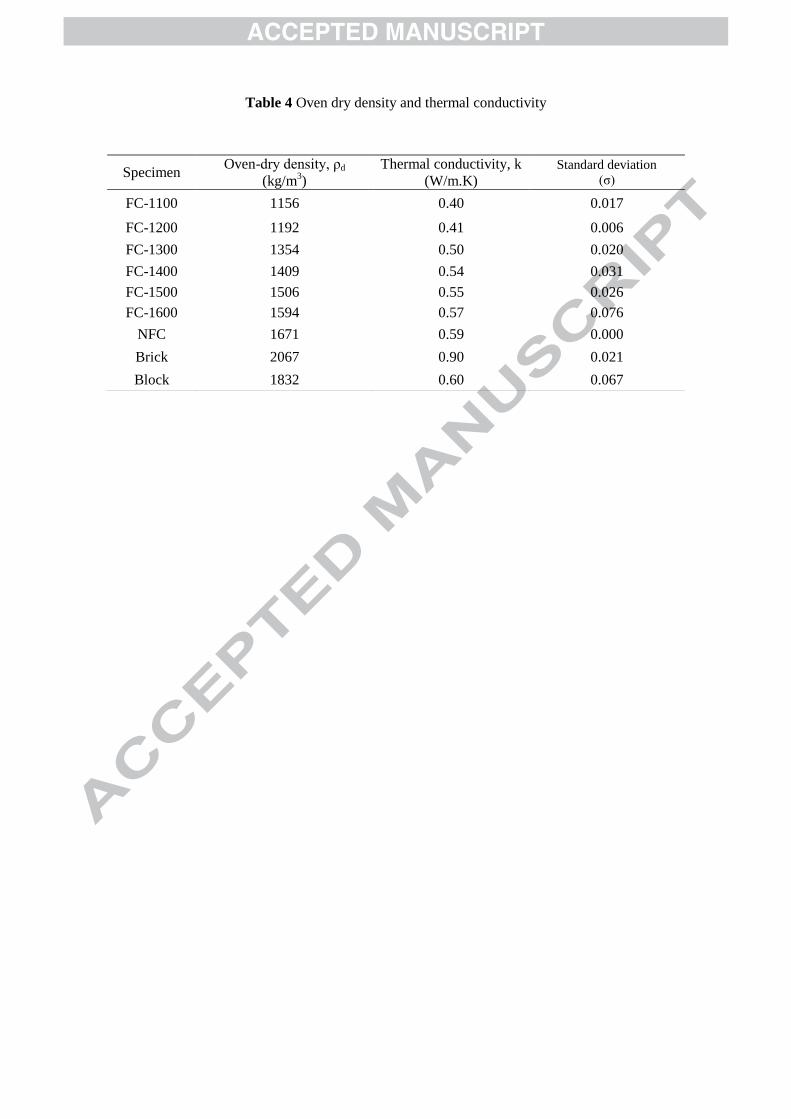
Table 4 Oven dry density and thermal conductivity
Specimen Oven-dry density, ρd
(kg/m3)
Thermal conductivity, k
(W/m.K) Standard deviation
(σ)
FC-1100 1156 0.40 0.017
FC-1200 1192 0.41 0.006
FC-1300 1354 0.50 0.020
FC-1400 1409 0.54 0.031
FC-1500 1506 0.55 0.026
FC-1600 1594 0.57 0.076
NFC 1671 0.59 0.000
Brick 2067 0.90 0.021
Block 1832 0.60 0.067
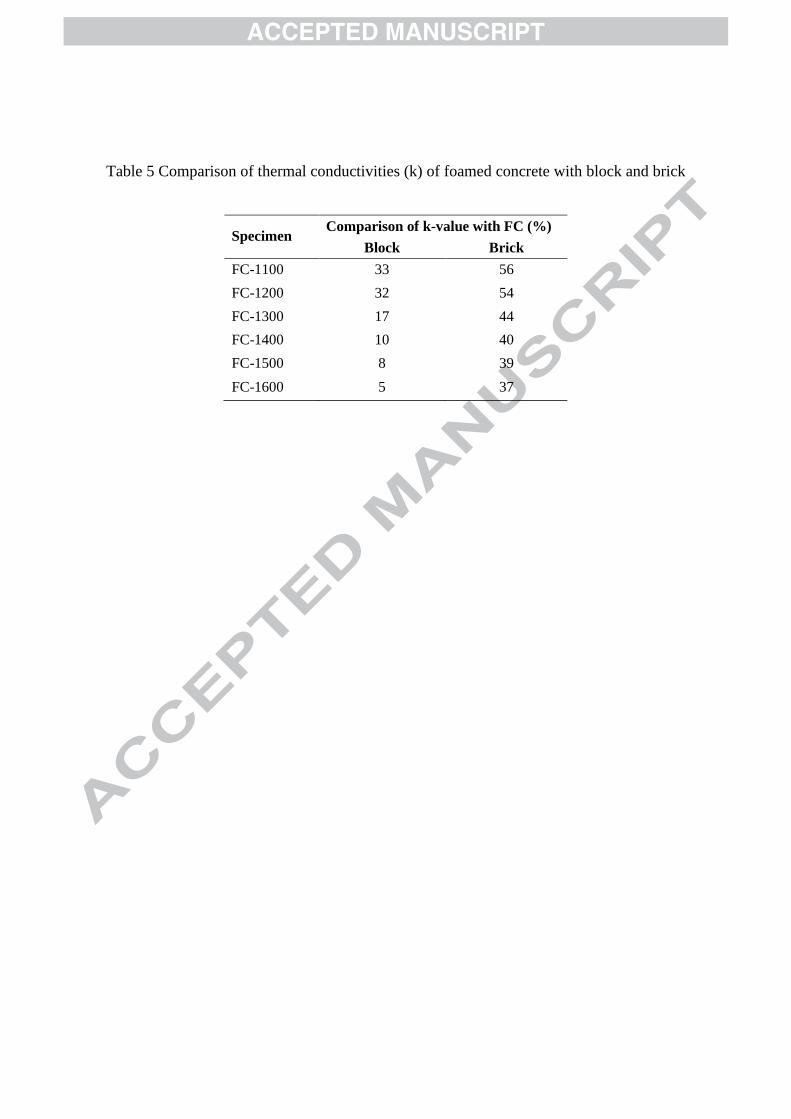
Table 5 Comparison of thermal conductivities (k) of foamed concrete with block and brick
Specimen Comparison of k-value with FC (%)
Block Brick
FC-1100 33 56
FC-1200 32 54
FC-1300 17 44
FC-1400 10 40
FC-1500 8 39
FC-1600 5 37
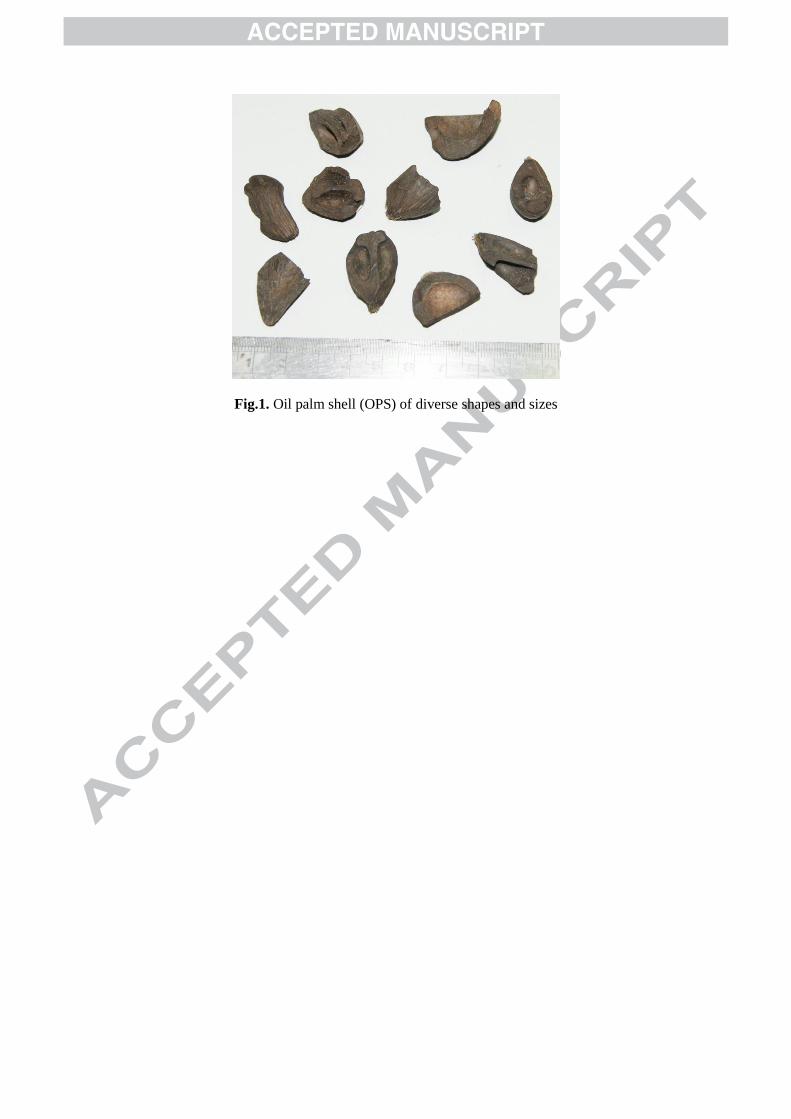
Fig.1. Oil palm shell (OPS) of diverse shapes and sizes
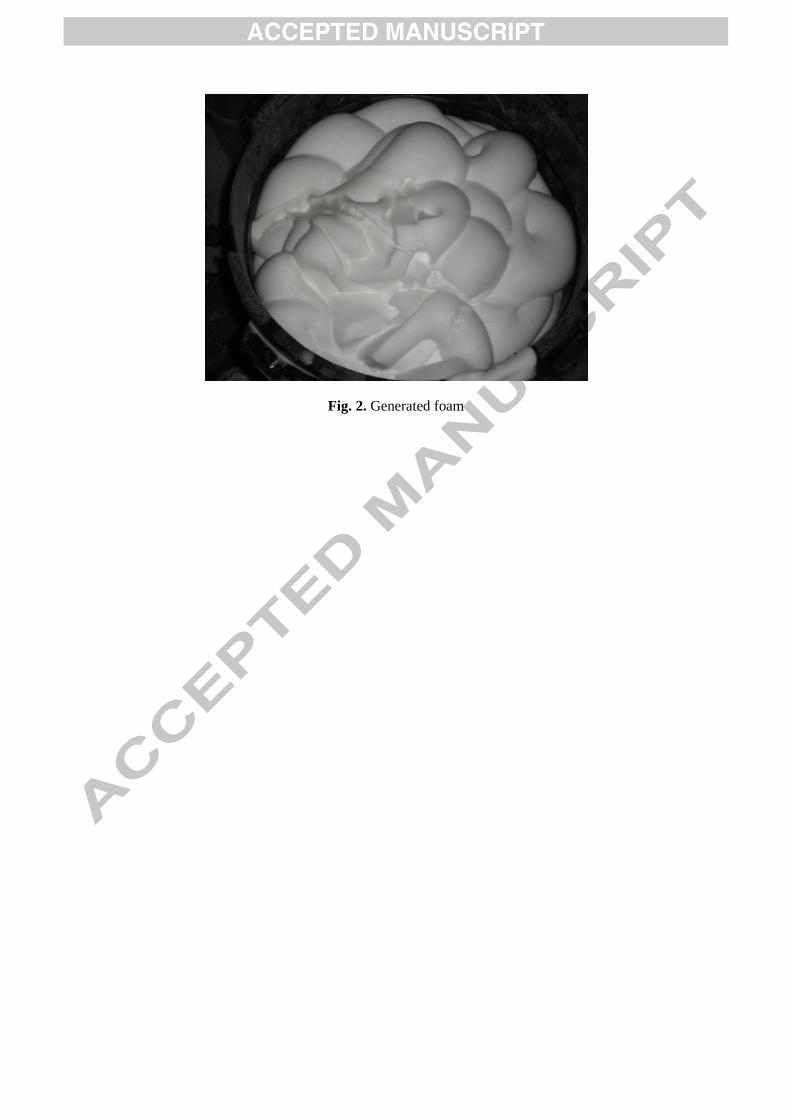
Fig. 2. Generated foam
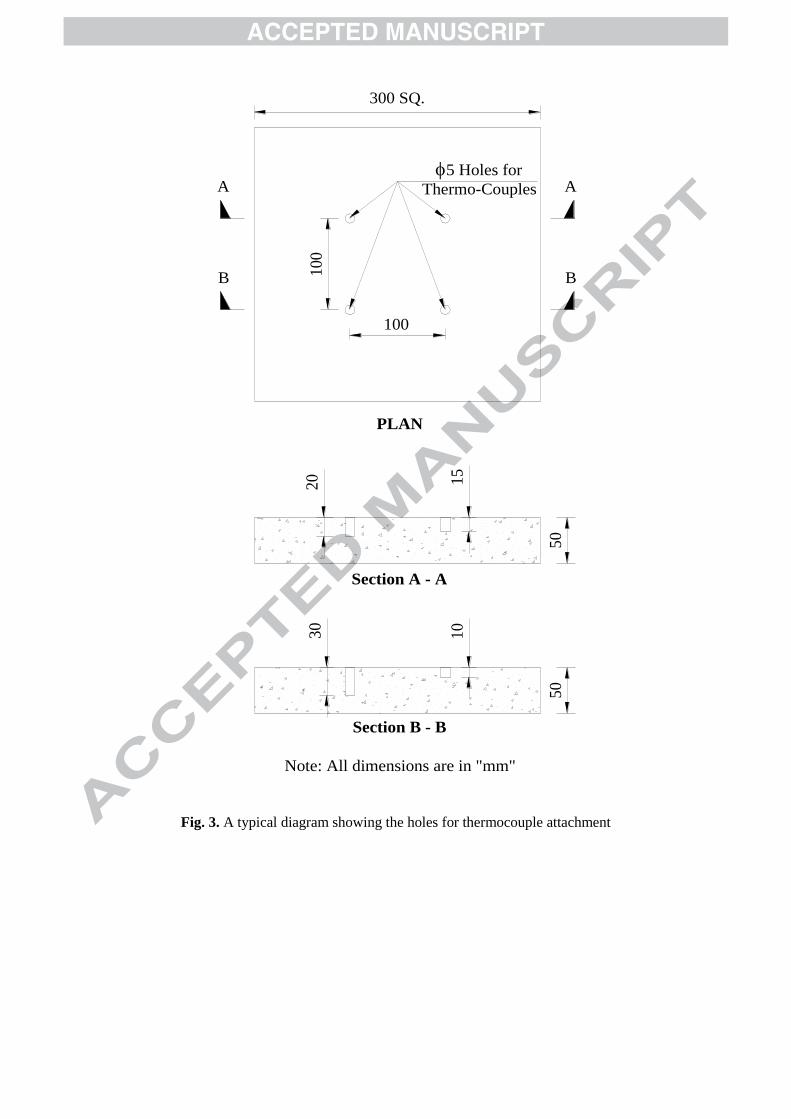
Fig. 3. A typical diagram showing the holes for thermocouple attachment
100
A A
B B100
PLAN
Section A - A
Section B - B
50
15
20
1030
Note: All dimensions are in "mm"
50
300 SQ.
5 Holes for
Thermo-Couples
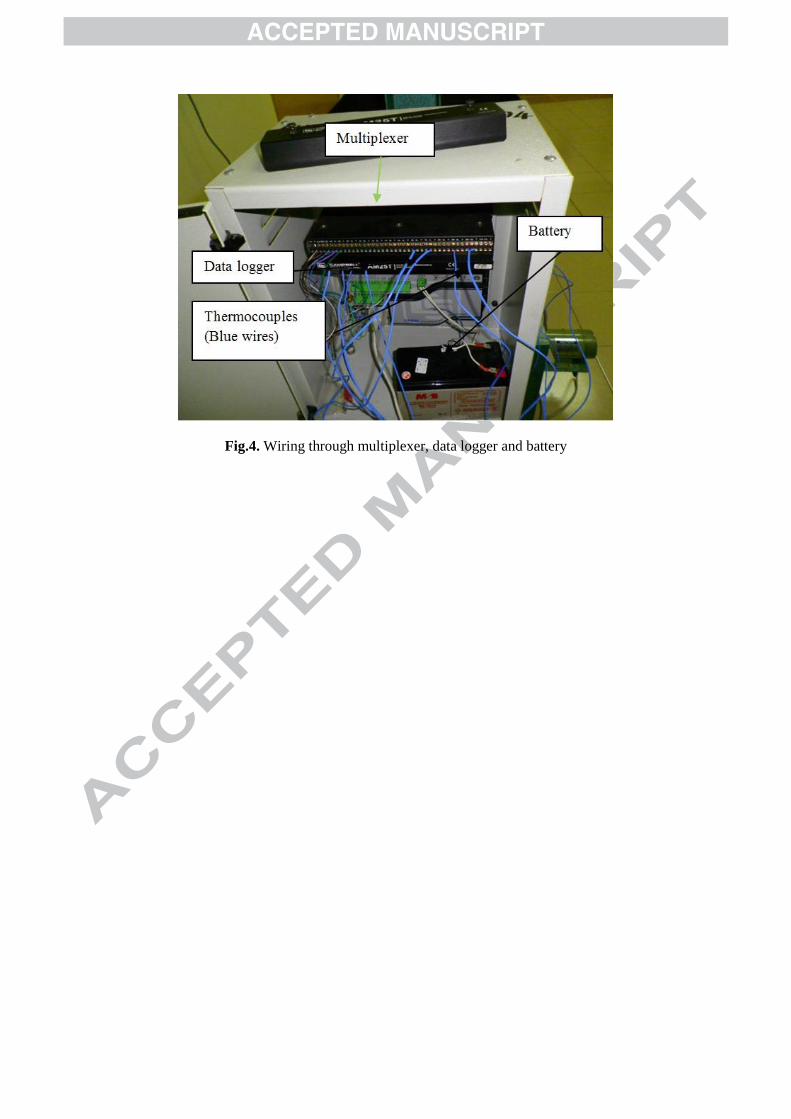
Fig.4. Wiring through multiplexer, data logger and battery
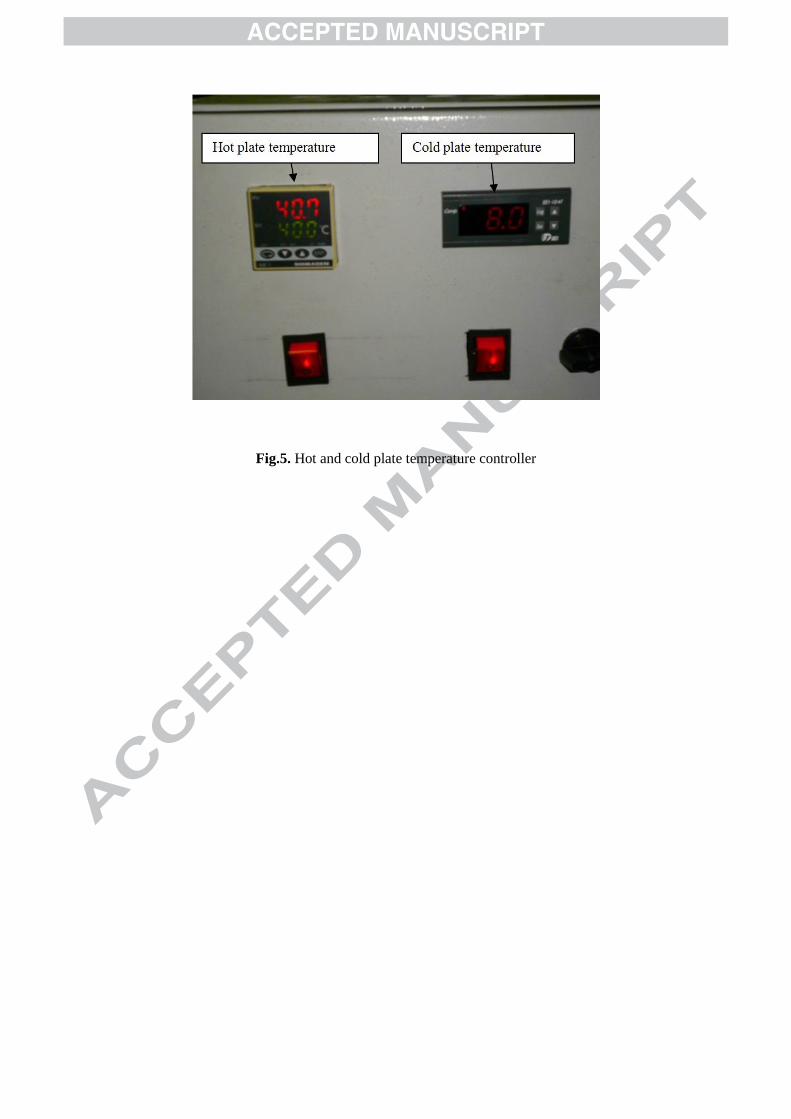
Fig.5. Hot and cold plate temperature controller
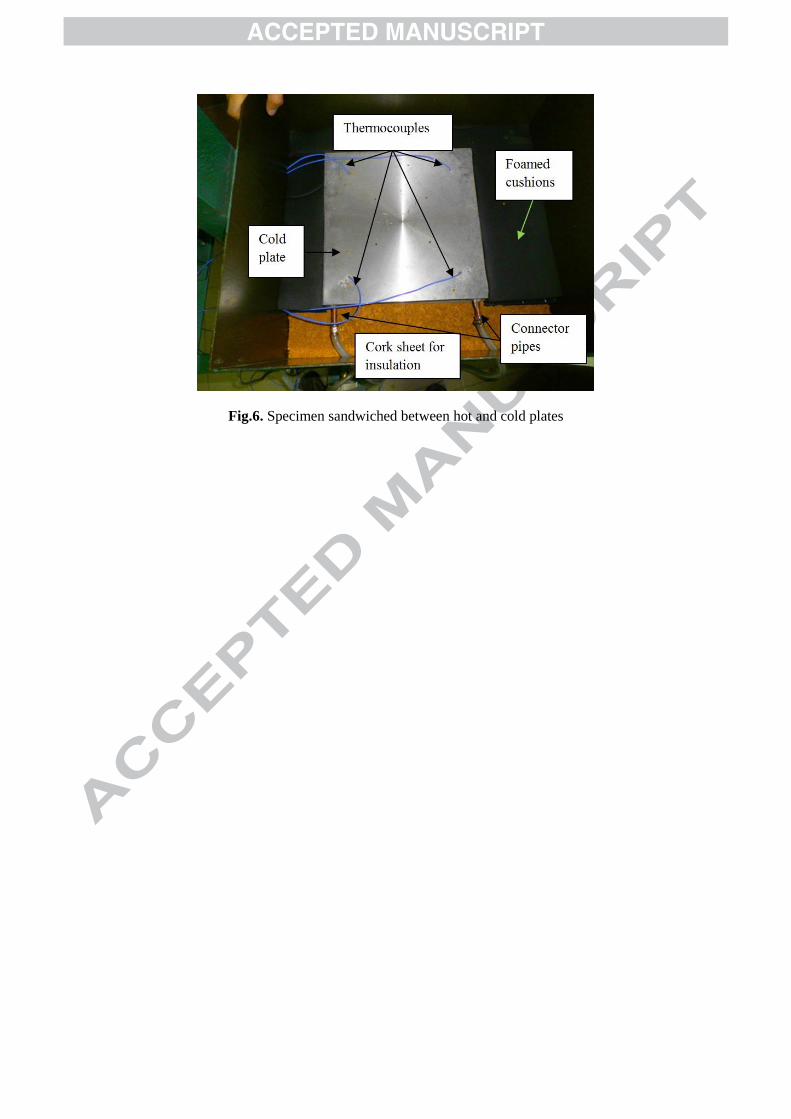
Fig.6. Specimen sandwiched between hot and cold plates
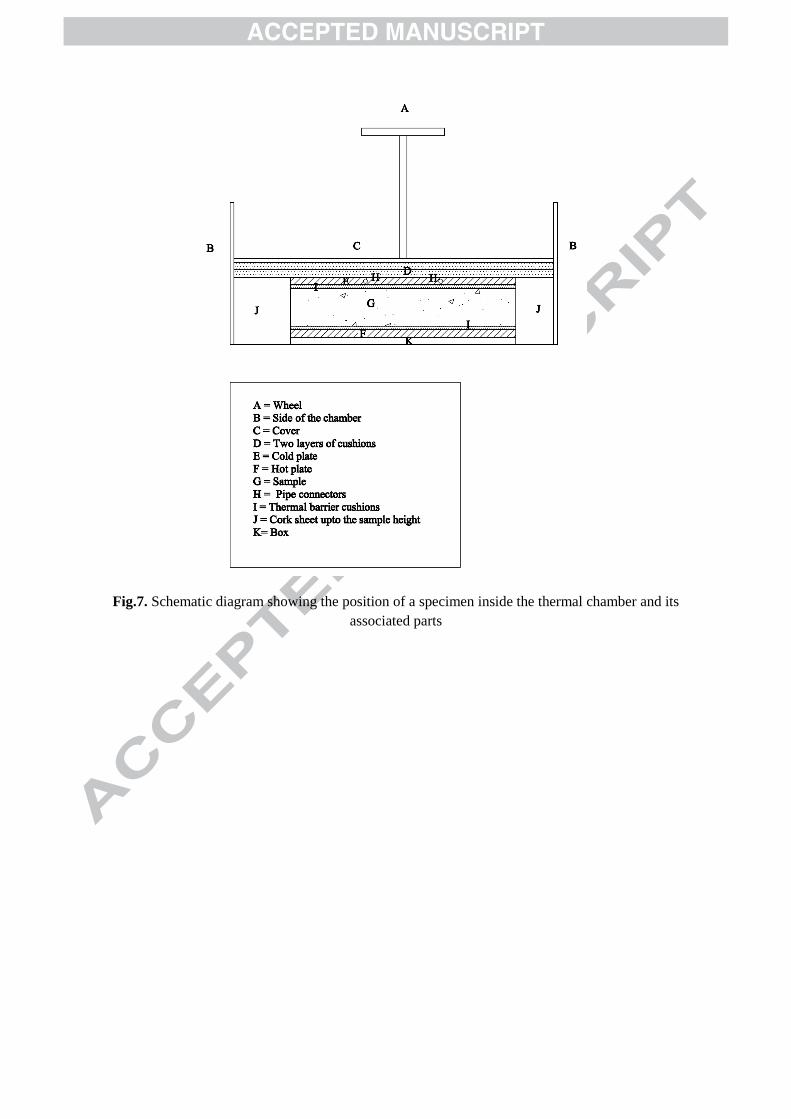
Fig.7. Schematic diagram showing the position of a specimen inside the thermal chamber and its
associated parts
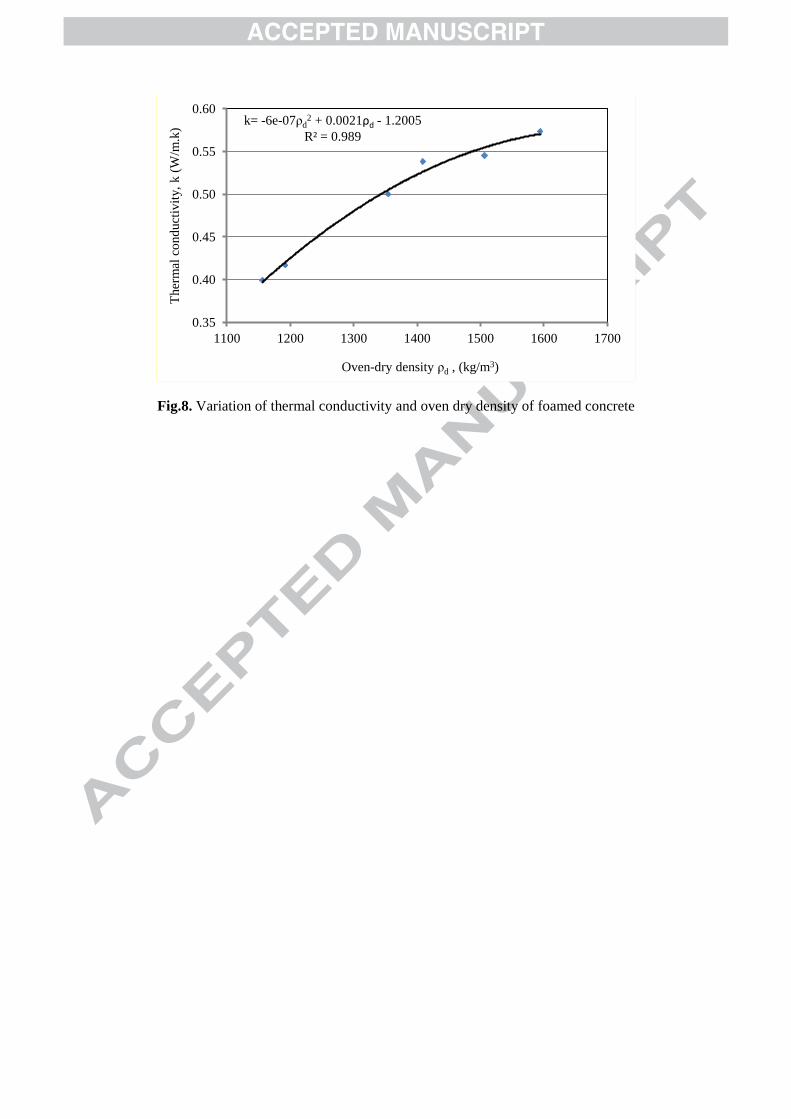
Fig.8. Variation of thermal conductivity and oven dry density of foamed concrete
k= -6e-07ρd2 + 0.0021ρd - 1.2005
R² = 0.989
0.35
0.40
0.45
0.50
0.55
0.60
1100 1200 1300 1400 1500 1600 1700
Ther
mal
co
nd
uct
ivit
y,
k (
W/m
.k)
Oven-dry density ρd , (kg/m3)
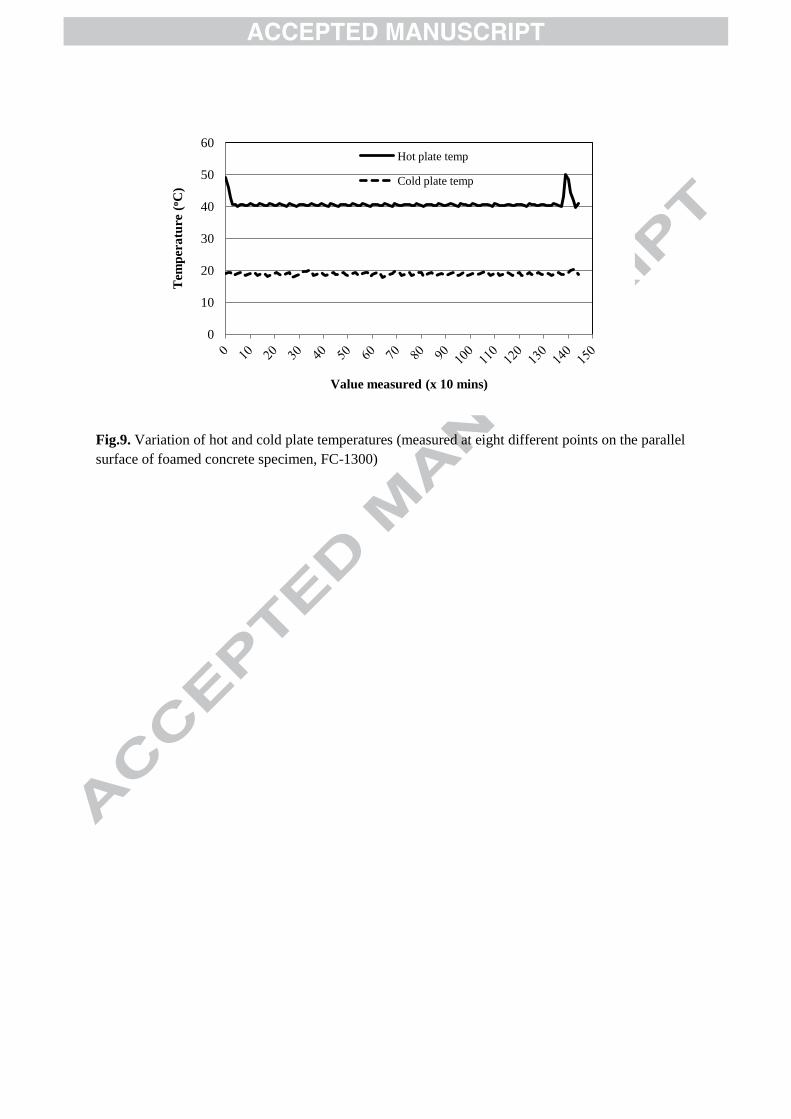
Fig.9. Variation of hot and cold plate temperatures (measured at eight different points on the parallel
surface of foamed concrete specimen, FC-1300)
0
10
20
30
40
50
60
Tem
per
atu
re (
oC
)
Value measured (x 10 mins)
Hot plate temp
Cold plate temp
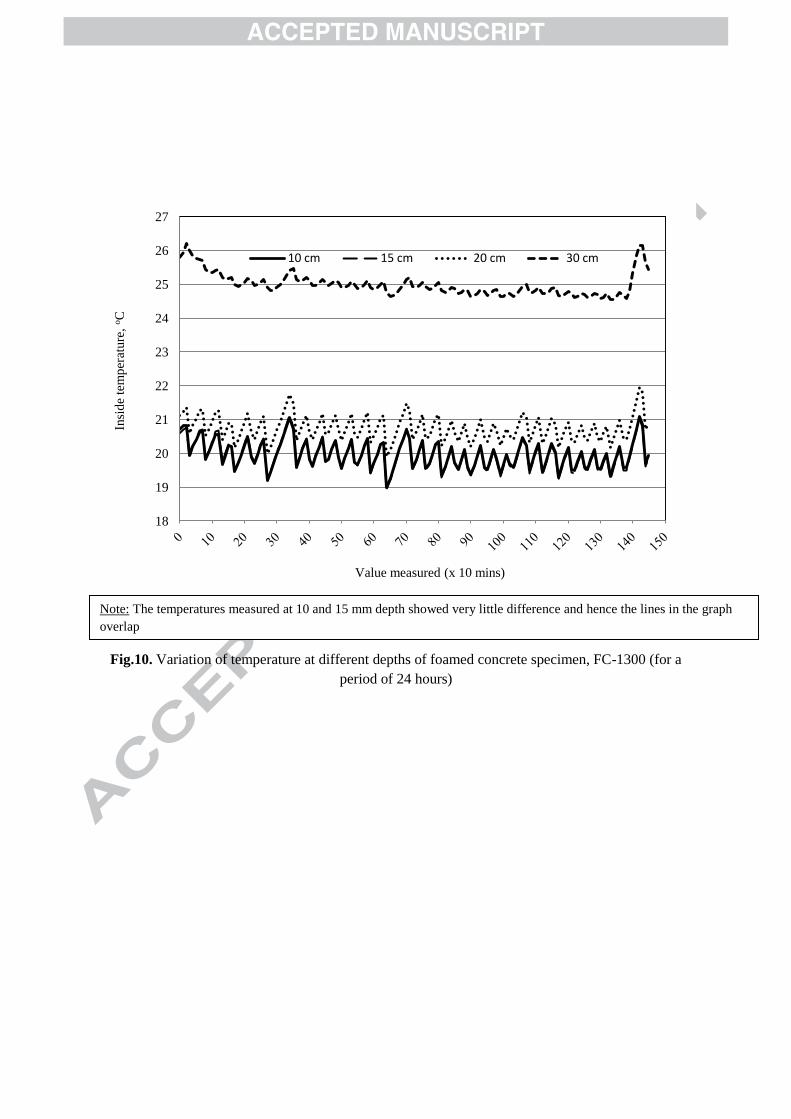
Fig.10. Variation of temperature at different depths of foamed concrete specimen, FC-1300 (for a
period of 24 hours)
18
19
20
21
22
23
24
25
26
27
Insi
de
tem
per
ature
, oC
Value measured (x 10 mins)
10 cm 15 cm 20 cm 30 cm
Note: The temperatures measured at 10 and 15 mm depth showed very little difference and hence the lines in the graph
overlap
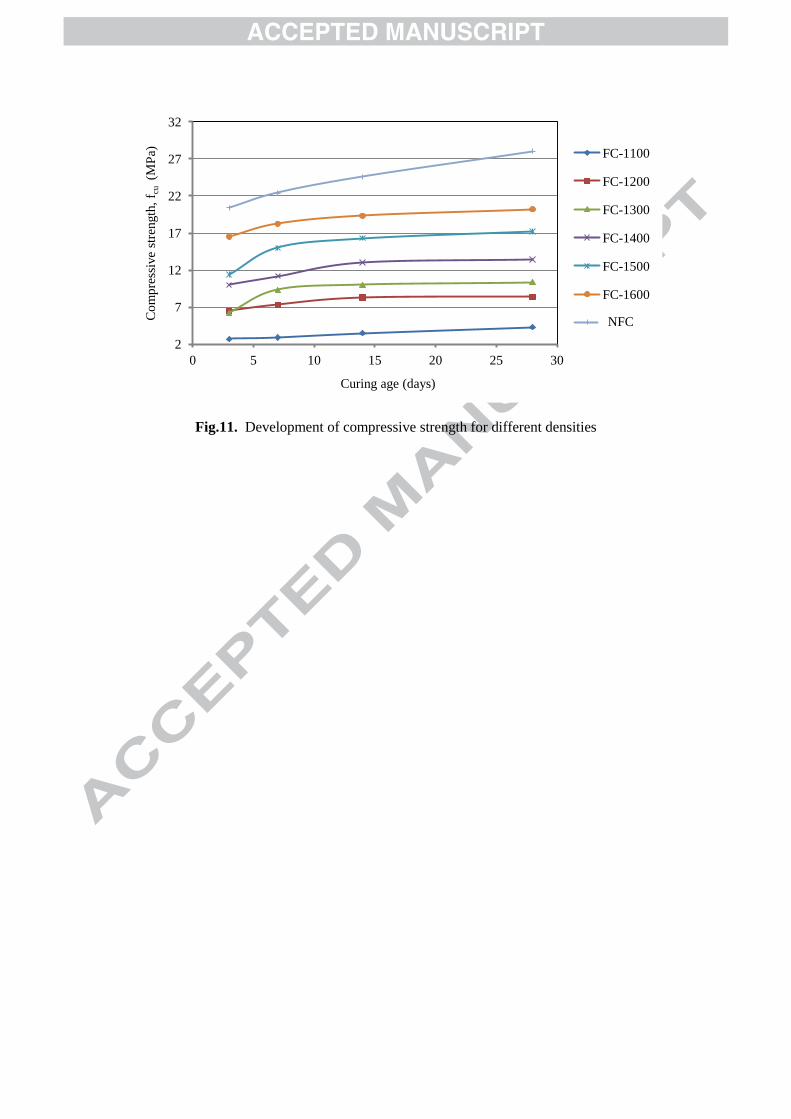
Fig.11. Development of compressive strength for different densities
2
7
12
17
22
27
32
0 5 10 15 20 25 30
Co
mp
ress
ive
stre
ngth
, f c
u (
MP
a)
Curing age (days)
FC-1100
FC-1200
FC-1300
FC-1400
FC-1500
FC-1600
NF NFC
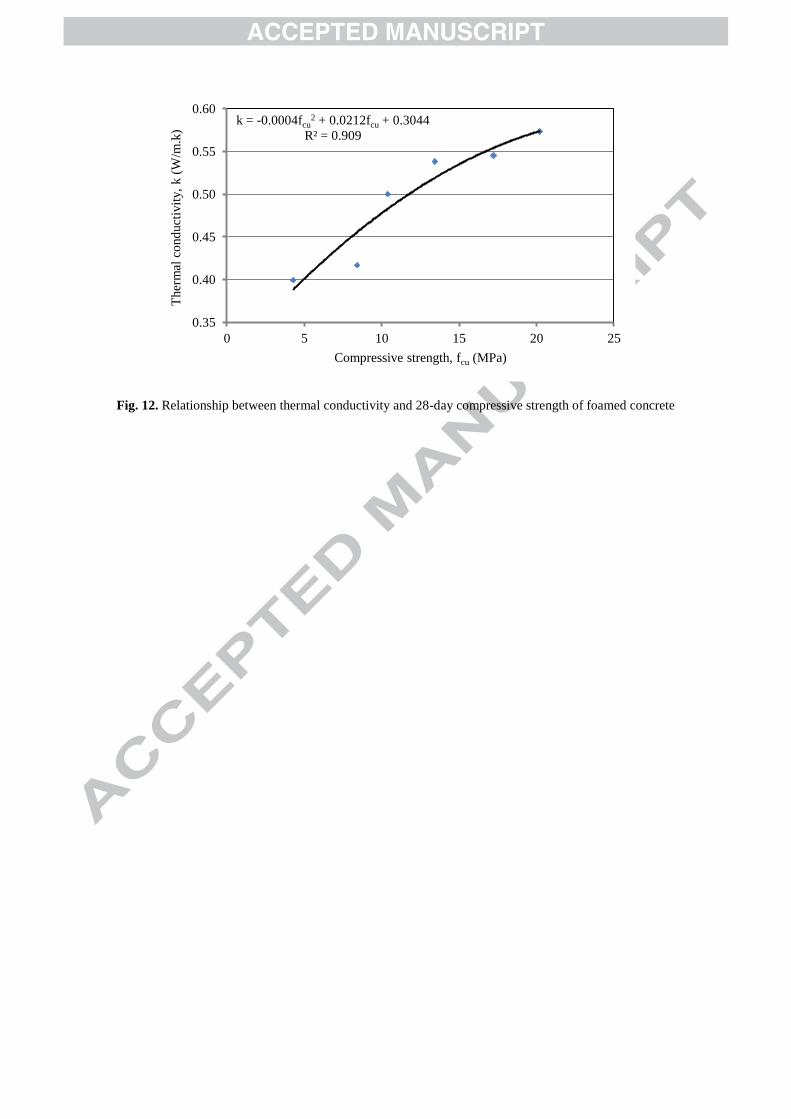
Fig. 12. Relationship between thermal conductivity and 28-day compressive strength of foamed concrete
k = -0.0004fcu2 + 0.0212fcu + 0.3044
R² = 0.909
0.35
0.40
0.45
0.50
0.55
0.60
0 5 10 15 20 25
Ther
mal
co
nd
uct
ivit
y,
k (
W/m
.k)
Compressive strength, fcu (MPa)
19
A comparison of the thermal conductivity of oil palm shell foamed concrete with conventional materials
The highlights of the research article are:
- Development of OPSFC with oven dry density (ODD) of 1100-1600 kg/m3
- Investigation on thermal conductivity of OPSFC
- Temperature variation on the surface and interior of the specimen
- Relationship between the compressive strength and conductivity of OPSFC
- Comparison of thermal conductivity with conventional materials