Embed Size (px)
Citation preview
1
A comparison of the socio-economic status of female-headed and
male-headed households in Kenya: Use of Ordinal Logistic
Regression
MWANGI Agnes Wanjiru1,*, OTIENO Joseph2,, and NDIRITU John2
1CEMASTEA, 24214-00502 Nairobi, Kenya 2Department of Mathematics, University of Nairobi, 30197-00100 Nairobi, Kenya
* Corresponding author email: [email protected]
ARTICLE INFO ABSTRACT Article History:
Submitted: 30 October
2018
Accepted: 6 May 2020
Available online: June
2020
With the many challenges facing the nations in sub-Saharan Africa, such as epidemics, civil wars, among others, there is an upsurge in the number of female-headed households. The socio-economic status of such households is low. Many studies in the recent past have attempted to identify the determinants of poverty in Kenya but did not do a comparison of these determinants across female-headed and male-headed households. This study has conducted a comparative analysis of the socio-economic status of the two types of households in Kenya applying an ordinal logistic regression model using data from Kenya Demographic and Health Survey (2008-2009). The results obtained indicate that education is the key determinant of socio-economic status. Both female-headed and male-headed households in rural Kenya are less likely to rise up the wealth index categories unlike in urban Kenya. Female-headed households in Nairobi are less likely to rise through the wealth index categories unlike the male-headed households in the same region. Also, both types of households in Western and North Eastern Kenya are the least likely to move up the categories of wealth index as compared to other regions. Formulation and implementation of proper policies would address these disparities.
©2020 Africa Journal of Physical Sciences (AJPS). All rights reserved.
ISSN 2313-3317
Keywords: Poverty levels
Socio-economic
Wealth index
Gender disaggregated
Africa Journal of Physical Sciences Vol. 4, pp. 1-22, June 2020
http://journals.uonbi.ac.ke/index.php/ajps/index
ISSN 2313-3317
I
S
S
N
2
3
1
3
-
3
3
1
7
MWANGI et al. |MATHEMATICS
2
1. Introduction
1.1 Background
Many nations in the sub-Saharan Africa are plagued with a myriad of challenges ranging
from natural to man-made. Some of these challenges are: epidemics, civil wars, natural
disasters, social injustices, displacements of persons from their ancestral land, just to
mention but a few. These are a constant threat to sustainable economic development
and compromise the socio-economic status of households which is reflected in the high
poverty levels as witnessed in most households. The head of the household is burdened
with the responsibility of keeping the household afloat in the wake of these challenges.
In the African family set up, households were headed by men. However, in the face of
epidemics, civil wars, social injustices, among others, there is the emergence of female-
headed households as well as child-headed households. The aftermath of these factors is
that widowed grandmothers and mothers take up the responsibility of caring for their
grandchildren and orphans albeit facing severe economic constraints [17]. As such, it is
hypothesized that many female-headed households are in higher poverty levels as
compared to the male-headed households. The World Bank report estimated the fraction
of the female-headed households in Kenya as one-quarter [10]. However, the Kenya
Demographic and Health Survey Report cited the fraction to have risen to about a third
of all households in Kenya [16].
As a result of all these, a better understanding of the socio-economic status of the
female-headed households is necessary in order to first identify the key factors that
determine their poverty levels and then empower them accordingly. A comparison of the
effect of each of the determinants of socio-economic status of the female-headed
households with that of the male-headed households would uniquely point out the
disparities, which if addressed through policies, would alleviate the poverty levels in the
female-headed households.
The objectives of the paper were, therefore, to (1) identify the economic factors, socio-
cultural factors and demographic factors affecting the socio-economic status of female-
headed and male-headed households across regions in Kenya, and (2) draw a comparison
MWANGI et al. |MATHEMATICS
3
of the effect of each of the determinants of the socio-economic status of the female-
headed households with respect to the male-headed households in Kenya.
1.2 Overview
The research in [1] considered the gender inequality, poverty and human development in
Kenya using indicators of poverty as defined by United Nations Development Program
(UNDP). Though internationally accepted, these indicators do not capture the actual
socio-economic status of households in Kenya. A household level comparative analysis
would be more reflective of the real state of affairs across households. Another research
considered a household level analysis of determinants of poverty using the 1994 Welfare
Monitoring Survey data [2]. However, the economy of Kenya has since improved and so
have the living standards of households with the introduction of devolved funds to the
constituency levels. A household level analysis using more recent data would reveal the
impact of the improved economy on the socio-economic status of households and also
allow for a comparison across female-headed and male-headed households in Kenya in
order to identify any disparities.
Not many researchers have analyzed the socio-economic status of women in different
regions across Kenya. A research conducted on poverty levels and food security among
female-headed households pointed out that female-headed households are living in
abject poverty in Western Kenya [4]. The research was confined in only one region of
Kenya. However, a study conducted in all the regions of Kenya would allow for
comparative analysis of all types of households across the regions in order to identify the
gaps and put in place policies geared towards bridging such gaps.
According to World Bank Kenya Poverty Report, poverty incidence in Nairobi and Central
was below the national average and higher in Coast and Western Kenya as at 2006 [13].
This reflected regional disparities across households. A comparative analysis of the socio-
economic status of the female-headed households with respect to the male-headed
households across the regions using the households' wealth index, which is determined
using more recent household level gender disaggregated data, would enable to identify
disparities, if any. The socio-economic status of households in this paper is described by
the category of wealth index a household belongs to. Using the ordinal logistic regression
model with the wealth index as the response variable, the measure of effect of each of
MWANGI et al. |MATHEMATICS
4
the key factors determining the socio-economic status of households allows for the
comparative analysis for the female-headed as well as the male-headed households.
1.3 Determinants of Socio-economic Status
1.3.1 Education Level
According to Millennium Development Goals Kenya Report, Kenya has achieved the
Universal Primary Education through the Free Primary Education Programme (2003) [6].
The Constitution of Kenya guarantees all children the right to basic education [3].
However, many women across the regions of Kenya still remain semi-illiterate. It is noted
that providing accessible schooling is a very effective way of addressing gender
inequalities in education [5]. Improvement of literacy levels in any region combats
poverty and improves the socio-economic status of the members of the society [7]. This
reduces the dependency on the central government. Such resources can be used to
develop the region like in construction of roads, health facilities and also construction of
water dams to improve the agricultural sector.
Female-headed households are more likely to be poor than the male-headed households.
As such, empowering the women through formal education and entrepreneurial skills
majorly contributes to their quality of life. As witnessed in Nepal, primary, secondary and
tertiary education has played a significant and crucial role in economic growth [8].
According to this research, the result gives the message to the developing countries that
there is a high contribution of education to economic growth and ultimately socio-
economic development of developing countries especially in Africa and Asia. Poverty is a
global problem that affects millions of people across the globe with women being the
most vulnerable as compared to men. This leads to hunger, disease and death. To fight it,
there is need for an accumulation of human capital in education and health with
availability of public health services [9]. In this research on reducing poverty through
education planning and policy formulation in Swaziland, it is evident that with higher
levels of education, there is a likelihood of women choosing to have smaller families,
sending their children to school, reduced fertility, decreased infant and child mortality,
increased work force participation and relatively higher income.
MWANGI et al. |MATHEMATICS
5
1.3.2 Occupation
To enter into prestigious occupations in the social system, education is generally
observed to be a prerequisite. Some of the highly prestigious occupations include
medical functions, managerial positions, legal services and financial functions. It follows
that lawyers, bankers, medical specialists and corporation executives are highly rewarded
in the society owing to the functions within the jobs they do [18]. The occupation of both
men and women determines the socio-economic status of the household. Employment is
a major source of income in Kenya. In Facts and Figures on inequality in Kenya,
employment is singled out as an important dimension, among other dimensions, of
inequality [13]. As observed, most poor people are employed in the agriculture sector,
majority of them being women. The more professional the occupation is, the higher the
income.
1.3.3 Income
In any society, an individual who has a regular income, whether from an employment,
offering services or farming, is considered to be well-to-do and regarded as of higher
status. As such, income is seen as one of the indicators of socio-economic status as well
as a predictor of good health and ensures food security and good education [20]. This can
only predict a higher socio-economic status and a secure future. However, men generally
have higher income as compared to women owing to the fact that, more often than not,
they undertake the technical courses which have better rewards.
1.3.4 Sex of Household Head
According to The World's Women by United Nations, unmarried women with children as
well as older women in one-person households in developed and developing regions
have higher poverty levels as compared to men with similar characteristics [14]. The
World Bank Report on Kenya Poverty showed that one-quarter of all households were
headed by a woman but that fraction keeps increasing [10]. Such households tend to be
significantly large with poverty levels averaging five percent points higher than those of
male-headed households.
MWANGI et al. |MATHEMATICS
6
1.3.5 Age of Household Head
Some of the challenges experienced in sub-Saharan Africa, such as civil wars and
epidemics, leave a trail of death of humanity at the prime age. The persons who bear the
consequences are mostly the orphaned children who take up the role of family heads at a
very tender age. In the case of epidemics, such as HIV/AIDS, research has shown that
when the man succumbs to the unfortunate eventuality, the wife follows shortly
thereafter and the children are left as orphans with limited or no resources at all [19].
Such children heading households are deprived of their opportunity to attend school
therefore plunging the household into deeper poverty.
1.3.6 Type of Place of Residence
Poverty is highly concentrated in rural areas in Kenya where most people are farmers in
the agricultural sector [2]. According to this research, there is need for the government
to direct more resources to this sector to improve the quality of land to not only reduce
poverty levels but also to ensure that every person across all regions in Kenya is not
denied of his or her right to be free from hunger and to have adequate food of
acceptable quality according to the Constitution [3]. Interestingly, urbanization is one of
the many causes of poverty in the rural areas [4]. This is because the able-bodied
population migrate to the major urban towns in search of employment leaving behind
land which is a main resource for food production. Reduced workforce poses a major
challenge for this exposes the households to food insecurity. The Kenya Integrated
Household Budget Survey (2005-2006) showed that almost half of the population (forty-
seven percent) lived below poverty line of which eighty-five percent were in rural areas
as reported by World Bank [10]. Poverty incidence was significantly lower in urban than
in rural areas.
1.3.7 Geographical Region
Agriculture plays a very important role in the livelihood security of households especially
in the rural areas. Livelihood security in this case referring to the secured ownership of
resources and income-generating activities [21]. The households in the arable lands are
better placed as compared to the households in the semi-arid and arid regions. Female-
MWANGI et al. |MATHEMATICS
7
headed households in arable regions rarely produce cash crops as compared to the male
-headed households. This attributes to the difference in the farm output even though in
such regions the female-headed households are not less productive [23].
1.3.8 Religion
In most communities in Africa, the religion dictates the position of women in the society.
Across most religions in Kenya, women do not have any right to own land or movable
property. The right to property is usually pegged on their relationship to their husbands,
fathers or brothers who possess and control the land as noted by Federation of Women
Lawyers (FIDA) in Kenya [11]. This leaves the female heads more exposed to lower socio-
economic status as compared to men who control the economic resources. However,
significant efforts are needed to implement the Constitution which guarantees gender
equality in ownership of land and property [12].
1.3.9 Number of Household Members
Africans believe in living in communities and have relatively large families which may
include relatives who may extend their stay longer than is necessary. The budget of
consumption therefore increases compromising the quality of life for the household.
According to World Bank Report, the female-headed households tend to be significantly
larger in size, especially for women who are divorced, never married or whose husbands
are away [10]. Their poverty incidence averages five percent points higher than those of
the male-headed households. There is need to promote family planning to ensure that
economic gains made and reduced burden on households as a result of free and
subsidized education and health services do not translate to higher population growth
rate [15].
1.3.10 Number of Children in the Household
The number of dependent children in a household largely determines the family budget.
The more the number of children in a household, the more the expenses on education,
food and health care. Where women have a higher level of education, it is observed that
such a household has fewer number of children. Education of females and their fertility
are correlated negatively [2]. The less educated a woman is, the more the number of

MWANGI et al. |MATHEMATICS
8
children, more so, following each other closely compromising the quality of life of the
household.
1.3.11 Marital Status
Marital status largely influences the socio-economic status of a woman. Most females
heading households are either widowed, separated, divorced, or never married single
mothers. Unmarried women lack social, financial and economic security in a male-
dominated world [22]. These female-headed households are deprived of the basic needs,
not to mention that the widows are sometimes denied of their entitlement to the land
resources left behind by their deceased husbands. However, not all women heading
households are unmarried. In the African culture, polygyny is accepted and recognized. In
such a polygynous household, the man, more often than not, lives with the first wife but
occasionally visits the other households for the purpose of fulfilling his duty to them. In
essence, though the other wives are married, they are the household heads by default.
They go through similar struggles just as for the other female-headed households though
not as severe.
2. Methods
The wealth index is the response variable in the model used because it is the basic
measure of a household's socio-economic status. The ordinal logistic regression model
with the interaction of the variable sex of household head with the other predictor
variables is the most appropriate model. The predictor variables used in the model were
selected using Random Regression Forest and the literature review. This method of
selection categorized the variables in order of significance with respect to the association
of each predictor variable with the wealth index. From the results, a comparison of the
female-headed households with respect to the male-headed households is drawn.
2.1 Data
The research has used data from Kenya Demographic and Health Survey (KDHS 2008-
2009) which was collected using sample survey in all the eight provinces of Kenya (now
subdivided into counties). It comprises 6,079 observations. The 2008 - 2009 KDHS is one
of the population and health surveys conducted in Kenya every five years by Kenya
National Bureau of Statistics (KNBS). The 2008 - 2009 KDHS household-based survey was
MWANGI et al. |MATHEMATICS
9
conducted on population households living in Kenya. A representative sample of 10,000
households was drawn at random to form the national master sample frame. The
sampling technique used is multistage. This is a sampling method used in large surveys
where primary units are selected in the first stage and then secondary units are selected
from the primary units. Stage 1 involved selecting clusters from the national master
sample frame. A total of 400 clusters, 133 from urban areas and 267 from rural areas,
were selected. Stage 2 involved systematic sampling of households within the clusters
using an updated list of households.
2.2 Survey Instruments
The instruments used for the survey were questionnaires. The 2008 - 2009 KDHS used
three sets of questionnaires to collect survey data, namely Household, Women's and
Men's Questionnaires. The questionnaires reflected relevant issues in Kenya. The
questionnaires were then translated from English to Kiswahili and to 10 other local
languages. Training of field staff and pre-testing of the questionnaires was done through
pilot surveys for the purpose of refining them in order to set up strong, logistical
arrangements thereby ensuring the success of the survey. With the finalized survey
instruments, the Household Questionnaire was filled first. This captured the data on the
basic characteristics such as age, sex and education for all household members. Also
captured by this questionnaire was data on characteristics of household's dwelling unit,
ownership of various durable goods, ownership of agricultural land and ownership of
domestic animals. The household heads in the survey were between 15 years and 92
years of age.
The Household's Questionnaire provided data on the wealth index of each household in
either of the five categories which include poorest, poorer, average, richer and richest.
The wealth index reflects the living standard of the households. It is a measure of the
socio-economic status of each household and therefore it is used as the response
variable in the estimated model. In the Kenya Demographic and Health Survey (KDHS)
2008 -2009 data set, the wealth index is based on the data of the household's ownership
of consumer goods (which include durable goods, non-durable goods and services), type
of toilet facilities, dwelling characteristics and the type of drinking water source.
MWANGI et al. |MATHEMATICS
10
The model estimated has included type of place of residence, level of education of
household head, age of household head, occupation of household head, geographical
region and body mass index of the household head as some of the most significant
predictor variables influencing the wealth index of a household. Using Random
Regression Forest and the literature review, about 40 variables from the sample data
were identified to be associated to the wealth index. However, only six of the most
significant variables are used in the model estimated.
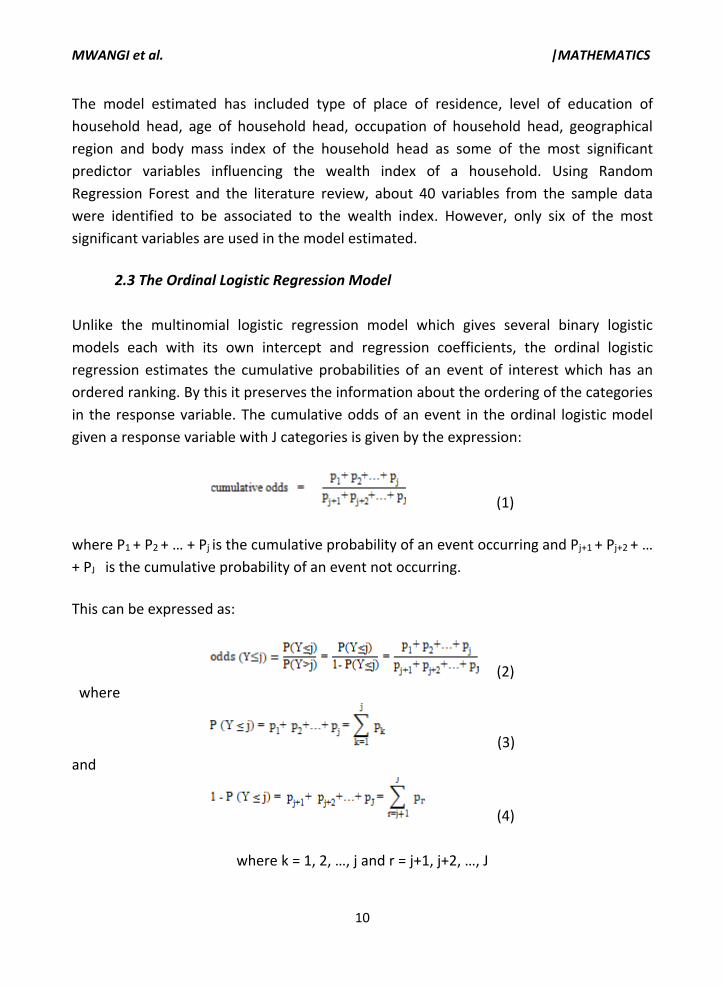
2.3 The Ordinal Logistic Regression Model
Unlike the multinomial logistic regression model which gives several binary logistic
models each with its own intercept and regression coefficients, the ordinal logistic
regression estimates the cumulative probabilities of an event of interest which has an
ordered ranking. By this it preserves the information about the ordering of the categories
in the response variable. The cumulative odds of an event in the ordinal logistic model
given a response variable with J categories is given by the expression:
(1)
where P1 + P2 + … + Pj is the cumulative probability of an event occurring and Pj+1 + Pj+2 + …
+ PJ is the cumulative probability of an event not occurring.
This can be expressed as:
(2)
where
(3)
and
(4)
where k = 1, 2, …, j and r = j+1, j+2, …, J
MWANGI et al. |MATHEMATICS
11
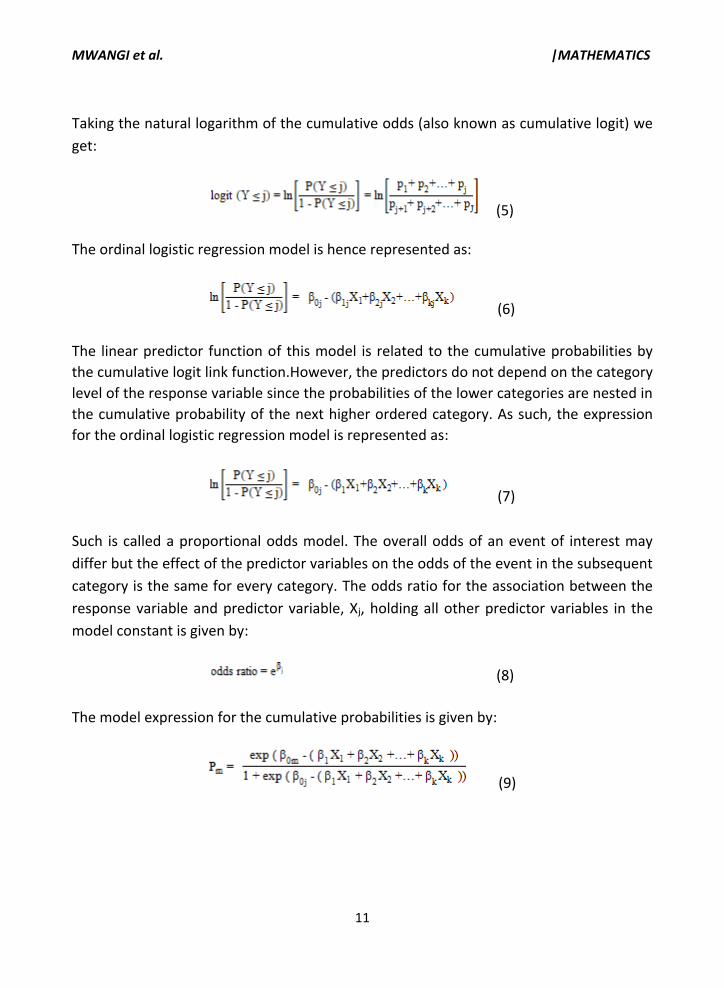
Taking the natural logarithm of the cumulative odds (also known as cumulative logit) we
get:
(5) The ordinal logistic regression model is hence represented as:
(6)
The linear predictor function of this model is related to the cumulative probabilities by
the cumulative logit link function.However, the predictors do not depend on the category
level of the response variable since the probabilities of the lower categories are nested in
the cumulative probability of the next higher ordered category. As such, the expression
for the ordinal logistic regression model is represented as:
(7)
Such is called a proportional odds model. The overall odds of an event of interest may
differ but the effect of the predictor variables on the odds of the event in the subsequent
category is the same for every category. The odds ratio for the association between the
response variable and predictor variable, Xj, holding all other predictor variables in the
model constant is given by:
(8)
The model expression for the cumulative probabilities is given by:
(9)
MWANGI et al. |MATHEMATICS
12
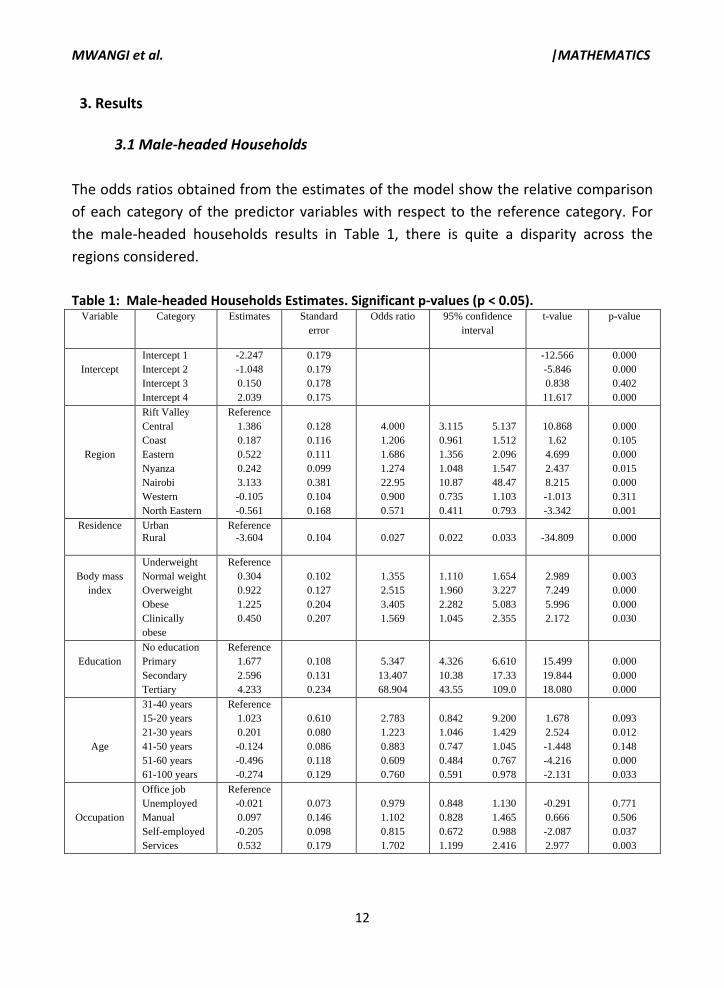
3. Results
3.1 Male-headed Households
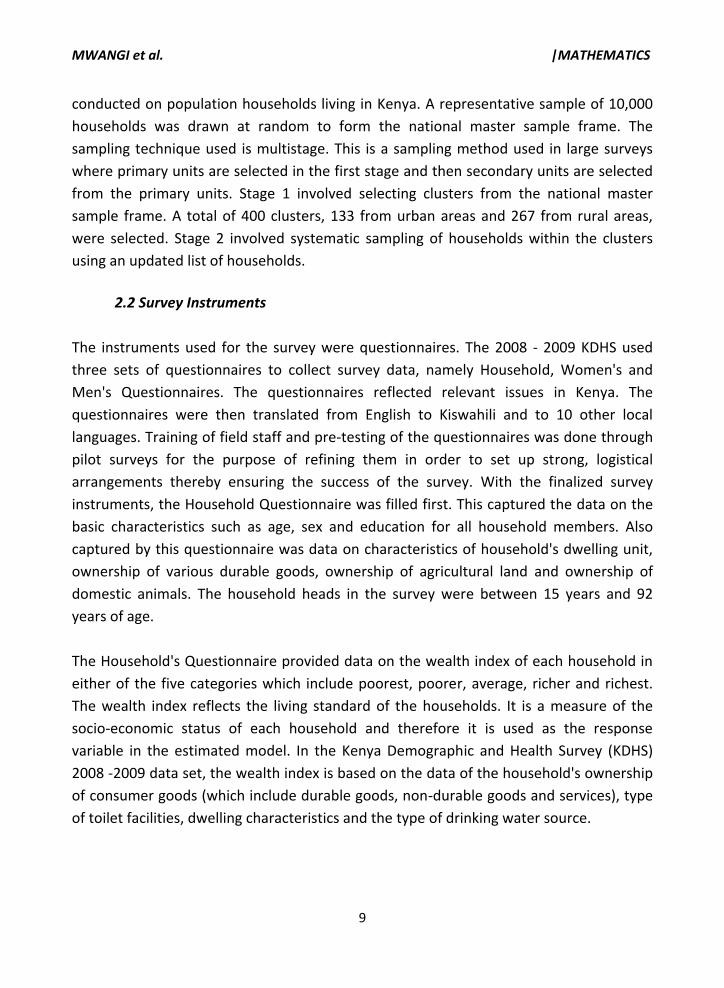
The odds ratios obtained from the estimates of the model show the relative comparison
of each category of the predictor variables with respect to the reference category. For
the male-headed households results in Table 1, there is quite a disparity across the
regions considered.
Table 1: Male-headed Households Estimates. Significant p-values (p < 0.05).
Variable Category Estimates Standard
error
Odds ratio 95% confidence
interval
t-value p-value
Intercept
Intercept 1
Intercept 2
Intercept 3
Intercept 4
-2.247
-1.048
0.150
2.039
0.179
0.179
0.178
0.175
-12.566
-5.846
0.838
11.617
0.000
0.000
0.402
0.000
Region
Rift Valley
Central
Coast
Eastern
Nyanza
Nairobi
Western
North Eastern
Reference
1.386
0.187
0.522
0.242
3.133
-0.105
-0.561
0.128
0.116
0.111
0.099
0.381
0.104
0.168
4.000
1.206
1.686
1.274
22.95
0.900
0.571
3.115 5.137
0.961 1.512
1.356 2.096
1.048 1.547
10.87 48.47
0.735 1.103
0.411 0.793
10.868
1.62
4.699
2.437
8.215
-1.013
-3.342
0.000
0.105
0.000
0.015
0.000
0.311
0.001
Residence
Urban
Rural
Reference
-3.604
0.104
0.027
0.022 0.033
-34.809
0.000
Body mass
index
Underweight
Normal weight
Overweight
Obese
Clinically
obese
Reference
0.304
0.922
1.225
0.450
0.102
0.127
0.204
0.207
1.355
2.515
3.405
1.569
1.110 1.654
1.960 3.227
2.282 5.083
1.045 2.355
2.989
7.249
5.996
2.172
0.003
0.000
0.000
0.030
Education
No education
Primary
Secondary
Tertiary
Reference
1.677
2.596
4.233
0.108
0.131
0.234
5.347
13.407
68.904
4.326 6.610
10.38 17.33
43.55 109.0
15.499
19.844
18.080
0.000
0.000
0.000
Age
31-40 years
15-20 years
21-30 years
41-50 years
51-60 years
61-100 years
Reference
1.023
0.201
-0.124
-0.496
-0.274
0.610
0.080
0.086
0.118
0.129
2.783
1.223
0.883
0.609
0.760
0.842 9.200
1.046 1.429
0.747 1.045
0.484 0.767
0.591 0.978
1.678
2.524
-1.448
-4.216
-2.131
0.093
0.012
0.148
0.000
0.033
Occupation
Office job
Unemployed
Manual
Self-employed
Services
Reference
-0.021
0.097
-0.205
0.532
0.073
0.146
0.098
0.179
0.979
1.102
0.815
1.702
0.848 1.130
0.828 1.465
0.672 0.988
1.199 2.416
-0.291
0.666
-2.087
2.977
0.771
0.506
0.037
0.003
MWANGI et al. |MATHEMATICS
13
Male-headed households in Nairobi are 23 times more likely to move to the next higher
ordered category of wealth index as compared to the households in the Rift Valley. The
center of power and economy in Kenya is in Nairobi. Men in this region have the most
opportunities of transacting businesses and engaging in many economic activities. This
may possibly be the reason why male-headed households in Nairobi are most likely to
rise through the categories of wealth index as compared to households in other regions.
The male-headed households in Central Kenya are 4 times more likely to move to the
next higher ordered category of wealth index as compared to the households in the Rift
Valley. Male-headed households in Eastern Province are 69% more likely to move up the
wealth index categories while male-headed households in Coast and in Nyanza are 21%
and 27%, respectively, more likely to move to the next higher ordered category of wealth
index as compared to the households in the Rift Valley. However, male-headed
households in Western and North Eastern Kenya are 10% and 43%, respectively, less
likely to move to the next higher ordered category of wealth index as compared to the
households in the Rift Valley. This may be attributed to the frequent droughts
experienced in North Eastern Kenya every so often. This reduces their livestock which is
their main source of livelihood.
Of interest to note is that male-headed households in rural Kenya are 97% less likely to
move to the next higher ordered category of wealth index as compared to the
households in urban Kenya. This indicates that there is little, if any, economic activities
being carried out in rural Kenya. Households headed by males of normal weight and
those who are clinically obese are 36% and 57%, respectively, more likely to move to the
next higher ordered category of wealth index as compared to household whose heads
are underweight. Households headed by males who are overweight and obese are 2.5
times and 3.4 times, respectively, more likely to move to the next higher ordered
category of wealth index as compared to the household whose heads are underweight.
Though being overweight is detestable in the developed countries, it is considered as an
indicator of wealth in Africa and as such, little effort is put to shed it off. These results
attest to it.
The education level of heads of households plays a very important role in determining
the probability of households rising up the categories of wealth index. This is reflected in
the results in which households headed by males with primary education, secondary
MWANGI et al. |MATHEMATICS
14
education and tertiary education are 5 times, 13 times and 69 times, respectively, more
likely to move to the next higher ordered category of wealth index as compared to the
households whose heads have no education.
In comparison to households whose heads are in the age group 31-40 years, households
headed by males aged 41-50 years, 51-60 years and 61-100 years are 12%, 39% and 24%,
respectively, less likely to move to the next higher ordered category of wealth index.
Households headed by males aged 21-30 years are 22% more likely to move up the
categories of wealth index as compared to the households whose heads are in the age
group 31-40 years. The results clearly point out that the most productive age for males
heading households is 21-40 years.
Households headed by males offering services as an occupation are 70% more likely to
move to the next higher ordered category of wealth index as compared to the
households whose heads are office employees. Interestingly, of the sample considered,
the households headed by males in manual labour are 10% more likely to move to the
next higher ordered category of wealth index as compared to the households whose
heads are in office employment. Households headed by unemployed and self-employed
males are 2% and 19%, respectively, less likely to move up the categories of wealth index
as compared to households headed by office employees.
3.2 Female-headed Households
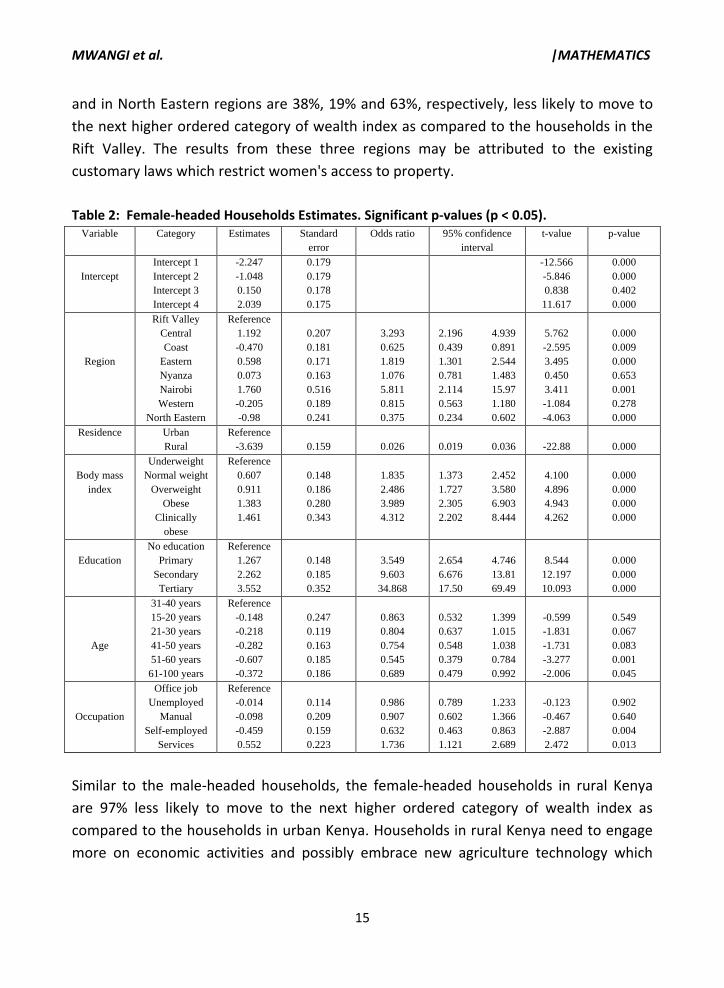
Table 2 shows the results obtained for the female-headed households considered in the
model. Comparing the female-headed households from different regions in Kenya to the
households in the Rift valley, those in Central and in Nairobi regions are 3 times and 6
times, respectively, more likely to move to the next higher ordered category of wealth
index. The women in these regions have an advantage over other regions because of
their proximity to business centers. This may explain why female-headed households in
these regions are more likely to rise up through the wealth index categories as compared
to households in other regions. Female-headed households in Eastern Kenya are 82%
more likely to move to the next higher ordered category of wealth index as compared to
the households in the Rift Valley. The female-headed households in Nyanza region have
almost an equal probability of moving up the categories of wealth index with the
households in the Rift Valley. The female-headed households in the Coast, in Western
MWANGI et al. |MATHEMATICS
15
and in North Eastern regions are 38%, 19% and 63%, respectively, less likely to move to
the next higher ordered category of wealth index as compared to the households in the
Rift Valley. The results from these three regions may be attributed to the existing
customary laws which restrict women's access to property.
Table 2: Female-headed Households Estimates. Significant p-values (p < 0.05). Variable Category Estimates Standard
error
Odds ratio 95% confidence
interval
t-value p-value
Intercept
Intercept 1
Intercept 2
Intercept 3
Intercept 4
-2.247
-1.048
0.150
2.039
0.179
0.179
0.178
0.175
-12.566
-5.846
0.838
11.617
0.000
0.000
0.402
0.000
Region
Rift Valley
Central
Coast
Eastern
Nyanza
Nairobi
Western
North Eastern
Reference
1.192
-0.470
0.598
0.073
1.760
-0.205
-0.98
0.207
0.181
0.171
0.163
0.516
0.189
0.241
3.293
0.625
1.819
1.076
5.811
0.815
0.375
2.196 4.939
0.439 0.891
1.301 2.544
0.781 1.483
2.114 15.97
0.563 1.180
0.234 0.602
5.762
-2.595
3.495
0.450
3.411
-1.084
-4.063
0.000
0.009
0.000
0.653
0.001
0.278
0.000
Residence Urban
Rural
Reference
-3.639
0.159
0.026
0.019 0.036
-22.88
0.000
Body mass
index
Underweight
Normal weight
Overweight
Obese
Clinically
obese
Reference
0.607
0.911
1.383
1.461
0.148
0.186
0.280
0.343
1.835
2.486
3.989
4.312
1.373 2.452
1.727 3.580
2.305 6.903
2.202 8.444
4.100
4.896
4.943
4.262
0.000
0.000
0.000
0.000
Education
No education
Primary
Secondary
Tertiary
Reference
1.267
2.262
3.552
0.148
0.185
0.352
3.549
9.603
34.868
2.654 4.746
6.676 13.81
17.50 69.49
8.544
12.197
10.093
0.000
0.000
0.000
Age
31-40 years
15-20 years
21-30 years
41-50 years
51-60 years
61-100 years
Reference
-0.148
-0.218
-0.282
-0.607
-0.372
0.247
0.119
0.163
0.185
0.186
0.863
0.804
0.754
0.545
0.689
0.532 1.399
0.637 1.015
0.548 1.038
0.379 0.784
0.479 0.992
-0.599
-1.831
-1.731
-3.277
-2.006
0.549
0.067
0.083
0.001
0.045
Occupation
Office job
Unemployed
Manual
Self-employed
Services
Reference
-0.014
-0.098
-0.459
0.552
0.114
0.209
0.159
0.223
0.986
0.907
0.632
1.736
0.789 1.233
0.602 1.366
0.463 0.863
1.121 2.689
-0.123
-0.467
-2.887
2.472
0.902
0.640
0.004
0.013
Similar to the male-headed households, the female-headed households in rural Kenya
are 97% less likely to move to the next higher ordered category of wealth index as
compared to the households in urban Kenya. Households in rural Kenya need to engage
more on economic activities and possibly embrace new agriculture technology which
MWANGI et al. |MATHEMATICS
16
enhances better yields. This would ensure food security and the surplus sold thereby
improving the quality of life in rural Kenya.
Households headed by females of normal weight are 84% more likely to move to the next
higher ordered category of wealth index as compared to households whose heads are
underweight. The households headed by females who are overweight, obese and also
the clinically obese are 2.5 times, 4 times and 4.3 times, respectively, more likely to move
up the hierarchy of wealth index as compared to the households whose heads are
underweight. These results concur with the misinformed common belief in Sub Saharan
Africa that the plus-size woman is both healthy and wealthy.
Similar to the households headed by males, households headed by females who have
attained primary education, secondary education and tertiary education are 3.5 times, 10
times and 35 times, respectively, more likely to move to the next higher ordered category
of wealth index as compared to the households whose heads have no education. The
head of household's education level is a key determinant of the socio-economic status of
any household.
Comparing the households headed by females in their respective age groups with the
households whose heads are in the age group 31-40 years, households headed by
females in the age groups 15-20 years, 21-30 years, 41-50 years, 51-60 years and 61-100
years are 14%, 20%, 25%, 46% and 31%, respectively, less likely to move to the next
higher ordered category of wealth index. Unlike the men, the most productive age for
women is 31-40 years according to these results.
The households headed by females providing services are 74% more likely to rise up the
categories of wealth index as compared to the households whose heads are in office
employment. However, the households headed by females who are in manual jobs and in
self-employment are 9.3% and 37%, respectively, less likely to move to the next higher
ordered category of wealth index as compared to the households whose heads are office
employees. From the results, both female and male heads of households should be
encouraged to venture more into providing services as opposed to working in offices for
there is more hope of moving to the next higher category of wealth index in rendering
services as an occupation.
MWANGI et al. |MATHEMATICS
17
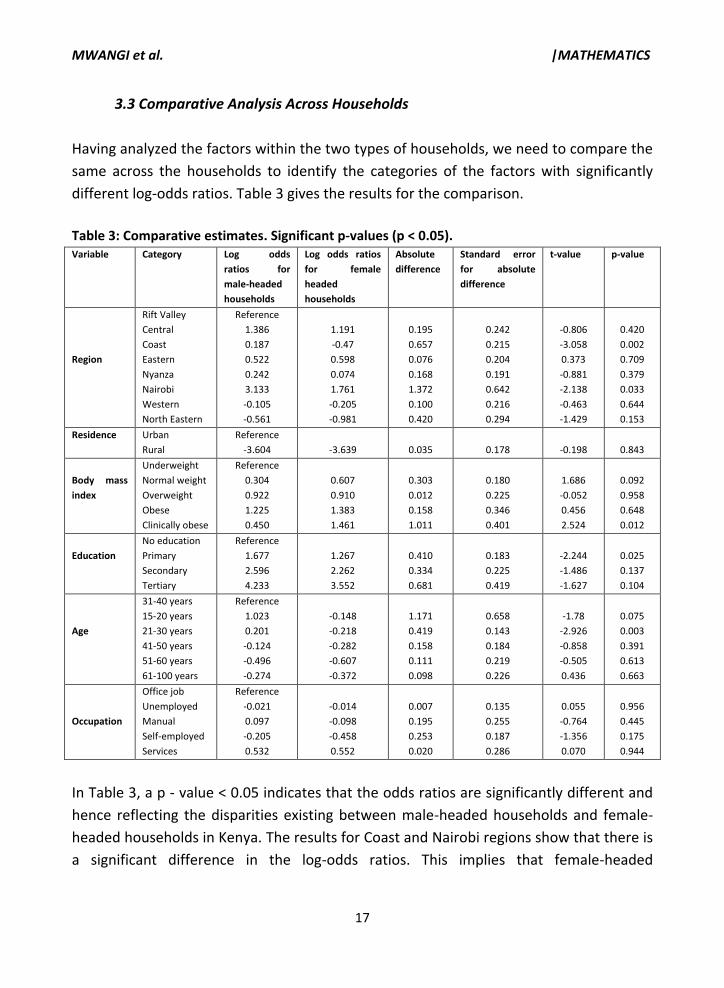
3.3 Comparative Analysis Across Households
Having analyzed the factors within the two types of households, we need to compare the
same across the households to identify the categories of the factors with significantly
different log-odds ratios. Table 3 gives the results for the comparison.
Table 3: Comparative estimates. Significant p-values (p < 0.05). Variable Category Log odds
ratios for
male-headed
households
Log odds ratios
for female
headed
households
Absolute
difference
Standard error
for absolute
difference
t-value p-value
Region
Rift Valley
Central
Coast
Eastern
Nyanza
Nairobi
Western
North Eastern
Reference
1.386
0.187
0.522
0.242
3.133
-0.105
-0.561
1.191
-0.47
0.598
0.074
1.761
-0.205
-0.981
0.195
0.657
0.076
0.168
1.372
0.100
0.420
0.242
0.215
0.204
0.191
0.642
0.216
0.294
-0.806
-3.058
0.373
-0.881
-2.138
-0.463
-1.429
0.420
0.002
0.709
0.379
0.033
0.644
0.153
Residence Urban
Rural
Reference
-3.604
-3.639
0.035
0.178
-0.198
0.843
Body mass
index
Underweight
Normal weight
Overweight
Obese
Clinically obese
Reference
0.304
0.922
1.225
0.450
0.607
0.910
1.383
1.461
0.303
0.012
0.158
1.011
0.180
0.225
0.346
0.401
1.686
-0.052
0.456
2.524
0.092
0.958
0.648
0.012
Education
No education
Primary
Secondary
Tertiary
Reference
1.677
2.596
4.233
1.267
2.262
3.552
0.410
0.334
0.681
0.183
0.225
0.419
-2.244
-1.486
-1.627
0.025
0.137
0.104
Age
31-40 years
15-20 years
21-30 years
41-50 years
51-60 years
61-100 years
Reference
1.023
0.201
-0.124
-0.496
-0.274
-0.148
-0.218
-0.282
-0.607
-0.372
1.171
0.419
0.158
0.111
0.098
0.658
0.143
0.184
0.219
0.226
-1.78
-2.926
-0.858
-0.505
0.436
0.075
0.003
0.391
0.613
0.663
Occupation
Office job
Unemployed
Manual
Self-employed
Services
Reference
-0.021
0.097
-0.205
0.532
-0.014
-0.098
-0.458
0.552
0.007
0.195
0.253
0.020
0.135
0.255
0.187
0.286
0.055
-0.764
-1.356
0.070
0.956
0.445
0.175
0.944
In Table 3, a p - value < 0.05 indicates that the odds ratios are significantly different and
hence reflecting the disparities existing between male-headed households and female-
headed households in Kenya. The results for Coast and Nairobi regions show that there is
a significant difference in the log-odds ratios. This implies that female-headed
MWANGI et al. |MATHEMATICS
18
households in the Coast and in Nairobi regions have a lower probability of moving to the
next higher ordered category of wealth index as compared to the male-headed
households in these regions. Both the female-headed households and the male-headed
households in Central, in Eastern, in Nyanza, in Western and in North Eastern regions
have relatively equal probabilities of rising up the categories of wealth index because the
log-odds ratios for each of these regions are not significantly different across households.
However, individual odds for households in Western and in North Eastern regions
indicate that the households have very low probabilities of moving up the categories of
wealth index. The female-headed households and male-headed households living in rural
Kenya have almost equal probabilities of rising up the categories of wealth index.
However, the independent odds for each type of households show that the households in
rural Kenya are very unlikely to move to the next higher ordered category of wealth index
as compared to households in urban Kenya.
There is a significant difference in the log-odds ratios of households headed by females
and those headed by males who are clinically obese. The households headed by females
in this category have a higher probability of moving to the next higher ordered category
of wealth index as compared to the households headed by males in the same category of
body mass index. There is no significant difference in the log-odds ratios of households
whose heads are of normal weight, the overweight and the obese indicating that the
households headed by females and males in each category have relatively equal
probabilities of rising up the levels of wealth index. The households headed by females
who have attained primary education have lower probability of rising up the levels of
wealth index as compared to the households headed by males having attained the same
level of education. However, there are no disparities for the households headed by both
females and males who have attained secondary education and those who have attained
tertiary education because the log-odds ratios are not significantly different.
Households headed by females in the age groups 15-20 years and in the age group 21-30
years have lower probability of moving to the next higher ordered category of wealth
index as compared to households headed by males in the same age groups. However,
there is no significant difference in the probabilities of rising up the categories of wealth
index for households whose heads are in the age group 41-50 years, in the age group 51-
60 years and in the age group 61-100 years. The independent odds for households whose
heads are in these age groups also show that they are less likely to move to the next
MWANGI et al. |MATHEMATICS
19
higher ordered category of wealth index. For all categories of occupation, there is no
significant difference between the probabilities of rising up the levels of wealth index for
households headed by females and those headed by males.
4. Conclusion
From the analysis done, the key indicators that predict the socio-economic status of a
household are: level of education of the head of household, the type of place of
residence, the region where the household lives, occupation of household head, age of
household head and, interestingly, the body mass index. The results from across the
regions clearly indicate that households living in Nairobi have the highest probability of
moving to the next higher category of wealth index as compared to households in all the
other regions. This suggests that there is a great disparity of resources across the regions
in Kenya and some regions are underprivileged. The most underprivileged regions as
observed are Western and North Eastern regions. However, both types of households in
Western Kenya are equally less likely to move to the next higher category of wealth
index.
Education for both men and women plays the most vital role in predicting the socio-
economic status of households across Kenya. However, it influences the status of male-
headed households more than it does for the female-headed households. Households
headed by males who have attained tertiary education are 69 times more likely to rise up
the levels of wealth index as compared to households whose heads have no education
while households headed by females with tertiary education are 35 times more likely to
rise up the levels of wealth index as compared to households whose heads have no
education. Surprisingly, households whose heads provide services as an occupation are
better placed than for those who are in office employment. The returns are more
promising in improving the household's socio-economic status as compared to a monthly
salary. Household heads in the age group 31-40 years are at the prime of productivity
and have a higher probability of moving to the next higher ordered category of wealth
index. As noted, households whose heads are above 40 years are less likely to rise up the
levels of wealth index as compared to households whose heads are in the age group 31-
40 years. From the comparative analysis done across the households, it is evident that
the female-headed households in Nairobi and in Coast are underprivileged as compared
to the male-headed households in the same regions. However, the disparity across
MWANGI et al. |MATHEMATICS
20
households is insignificant in all the other regions even though they are less likely to
move to the next higher ordered category of wealth index as compared to households in
Nairobi which have the highest probability of upgrading the socio-economic status.
Of great concern is the households headed by both females and males in rural Kenya
because they are 97% less likely to move up the categories of wealth index as compared
to households in urban Kenya. High poverty levels are concentrated in the rural areas.
There may be some other factors contributing to this very low probability of rural
households improving on the socio-economic status as compared to the urban
households. Having analyzed the socio-economic status of households using household
level gender disaggregated data, the results obtained give a clearer picture of the socio-
economic status of households in Kenya.
From the findings of this research, there is evidence of great disparities between
households living in rural Kenya and households living in urban Kenya which need to be
addressed. There is therefore need to consider formulating policies that would enhance
the improvement of the socio-economic status of households, especially where
disparities have been identified from the findings. Policies on economic development,
expansion and promotion of service industry, and review of secondary school curriculum
so as to give more emphasis on technical subjects are recommended. Economic
development initiatives such as light industries and income generating activities devolved
across all regions of rural Kenya, especially in Western and North Eastern regions, would
ensure an improvement in the economic and social well-being of households. Service
industry, such as in finance, hospitality, information technology, transport, among others,
if promoted and expanded, would attract a significant number of service providers. This
would in turn improve the quality of life of the households across the regions of Kenya.
Agriculture, if included as one of the core subjects in the secondary school curriculum,
would equip the high school graduates with the necessary skills to engage in agricultural
economic activities and in turn improve the socio-economic status of households across
the regions.
This research has used Kenya Demographic and Health Survey 2008-2009 data set which
was collected before the promulgation of the new Constitution of Kenya. Included in the
constitution is devolution of power and resources to the counties, which are subdivisions
of the former provinces. This was aimed at developing all regions of Kenya in order to
MWANGI et al. |MATHEMATICS
21
eradicate poverty. Further research using more recent household level gender
disaggregated data set would measure the impact of devolution on the socio-economic
status of households in Kenya.
Acknowledgements I would like to appreciate Demographic and Health Surveys for the access to Kenya
Demographic and Health Survey 2008-2009 data set used for the research.
References [1] Kiriti, T. and Tisdell, C. (2003) Gender inequality, poverty and human development in Kenya: Main
indicators, trends and limitations. Working Papers on Social Economics, Policy and Development No.
105587, University of Queensland, Brisbane 4072, Australia.
https://ideas.repec.org/p/ags/uqsese/105587.html
[2] Geda, A., Jong, N., Mwabu, G. and Kimenyi, M.S. (2001) Determinants of poverty in Kenya: A household level analysis. Institute of Social Studies and Kenya Institute for Public Policy Research Analysis [KIPPRA], Nairobi, Kenya. https://media.economics.uconn.edu/working/2005-44.pdf
[3] Laws of Kenya (2010) The Constitution of Kenya. National Council for Law Reporting with the Authority of the Attorney General. http://www.klrc.go.ke/index.php/constitution-of-kenya
[4] Mwawuda, G.W. and Nyaoke, S.O. (2015) Poverty and food security among female-headed households in Kenya: The case of Nyatike constituency, Migori county, western Kenya. Pathways to African Feminism and Development; Journal of African Women’s Studies Centre 2, 2-8.
[5] McCracken, K., Unterhalter, E., Chelstowska, A. and Marquez, S. (2015) Empowering women and girls through education. Policy Department: Citizen’s Rights and Constitutional Affairs, European Union, Brussels. http://www.europarl.europa.eu/studies
[6] UNESCO (2013) Millennium Development Goals: Status Report for Kenya. Ministry of Devolution and Planning, Nairobi, Kenya. https://planipolis.iiep.unesco.org/en/2014/millennium-development-goals-status-report-kenya-2013-6187
[7] Chege, J., Stephen, K.A., Wairimu, M.E. and Njoroge, L. (2015) Education and poverty alleviation in Kenya: Interrogating the missing link. International Journal of Humanities and Social Science 5 (1), 81-88.
[8] Nowak, A.Z. and Dahal, G. (2016) The contribution of education to economic growth: Evidence from Nepal. International Journal of Economic Sciences 5 (2), 22-41.
[9] Sukati, C.W.S. (2010) Reducing poverty: Education planning and policy implications for Swaziland. The Journal of the International Society for Educational Planning 19 (2), 8-21.
[10] The World Bank (2008) Kenya Poverty and Inequality Assessment. Poverty Reduction and Economic Management Unit Africa Region, pp. 8 – 21. http://documents.worldbank.org/curated/en/425611468089394594/Kenya-Poverty-and-inequality-assessment-executive-summary-and-synthesis-report
[11] Federation of Women Lawyers, Kenya (2017) Women’s Land and Property Rights in Kenya. https://land.igad.int/index.php/documents-1/countries/kenya/gender-3/625-women-s-land-and-property-rights-in-kenya/file
MWANGI et al. |MATHEMATICS
22
[12] Gaafar, R. (2014) Women’s Land and Property Rights in Kenya. LANDESA, Center for Women’s Land Rights, New Delhi, India. https://www.landesa.org/wp-content/uploads/LandWise-Guide-Womens-land-and-property-rights-in-Kenya.pdf
[13] SID (2004) Pulling Apart: Facts and Figures on Inequality in Kenya. Society for International Development, Nairobi Kenya. https://www.sidint.net/sites/www.sidint.net/files/docs/pulling-apart.pdf
[14] United Nations (2015) The World’s Women: Trends and Statistics. Department of Economics and
Social Affairs, New York, USA.
https://unstats.un.org/unsd/gender/downloads/WorldsWomen2015_report.pdf
[15] Ngunyi, A., Mwita, P.N., Odhiambo, R.O. and Masanja, V.G. (2015) Multidimensional analysis of the determinants of poverty indicators in the Lake Victoria Basin, Kenya. IOSR Journal of Mathematics 11 (3), 73- 87.
[16] KNBS (2014) The Kenya Demographic and Health Survey Report. Kenya National Bureau of Statistics, Nairobi, Kenya. https://dhsprogram.com/pubs/pdf/fr308/fr308.pdf
[17] Donahue, J. (1998) Community-based economic support for households affected by HIV/AIDS. Discussion Paper on HIV/AIDS Care and Support No. 6, Health Technical Services (HTS) Project for USAID.
[18] Hollingshead, A.B. (2011) Four factor index of social status. Yale Journal of Sociology 8, 21-51. [19] Ayieko, M.A. (2003) From single parents to child-headed households: The case of children orphaned
by HIV/AIDS in Kisumu and Siaya districts. University of Illinois, UNDP HIV and Development Programme, New York.
[20] Kennedy, B.P., Kawachi, I., Glass, R. and Deborah, P. (1998) Income distribution, socio-economic
status and self-related health in the United States: Multilevel analysis. British Medical Journal 317
(7163), 917-921.
[21] Acharya, S.S. (2006) Sustainable agriculture and rural livelihoods. Agricultural Economics Research Review 19, 205-217.
[22] Shikha, D. (2009) Single Women: Problems and Challenges. [Unpublished manuscript]. https://shodhganga.inflibnet.ac.in/bitstream/10603/114235/16/16_synopsis.pdf
[23] Githinji, M., Konstantinidis, C. and Barenberg, A. (2011) Small and as productive: Female-headed households and the inverse relationship between land size and output in Kenya. Economics Department Working Paper Series No. 139, University of Massachusetts, Amherst, USA. https://scholarworks.umass.edu/econ_workingpaper/139