Embed Size (px)
Citation preview
Examensarbete 10p C-nivå, Vt 07Institutionen för medicinsk biokemi och mikrobiologiBiomedicinska analytikerprogrammet
A comparison of helium dilution andplethysmography
in measuring static lung volumes
Anna Guldbrand
Anja Matzke, International Coordinator Päivi Piirilä M D, Ph. Dof Degree Programme in Biomedical Laboratory Science Laboratory of Clinical PhysiologyHelsinki Polytechnic Stadia Helsinki University Central Hospital
CONTENTS
ABSTRACT
1 INTRODUCTION 1
2 THE RESPIRATORYSYSTEM 2
3 DISEASES OF RESPIRATION 6
3.1 Obstructive diseases 6
3.2 Restrictive diseases 8
4 LUNG VOLUMES AND CAPACITIES 9
5 METHODS OF EXAMINATION 12
5.1 The single breath helium dilution method 12
5.2 The multi breath helium dilution method 14
5.3 Body plethysmography 17
6 METHOD COMPARISON 20
7 OBJECTIVE OF THE STUDY 23
8 IMPLEMENTATIONOF THE STUDY 25
8.1 Patient characteristics 25
8.2 The apparatus 28
8.3 Statistical analysis 30
9 RESULTSOF THE STUDY 33
10 RELIABILITY OF THE STUDY 37
11 DISCUSSION 39
ACKNOWLEDGEMENTS
APPENDIX
REFERENCES
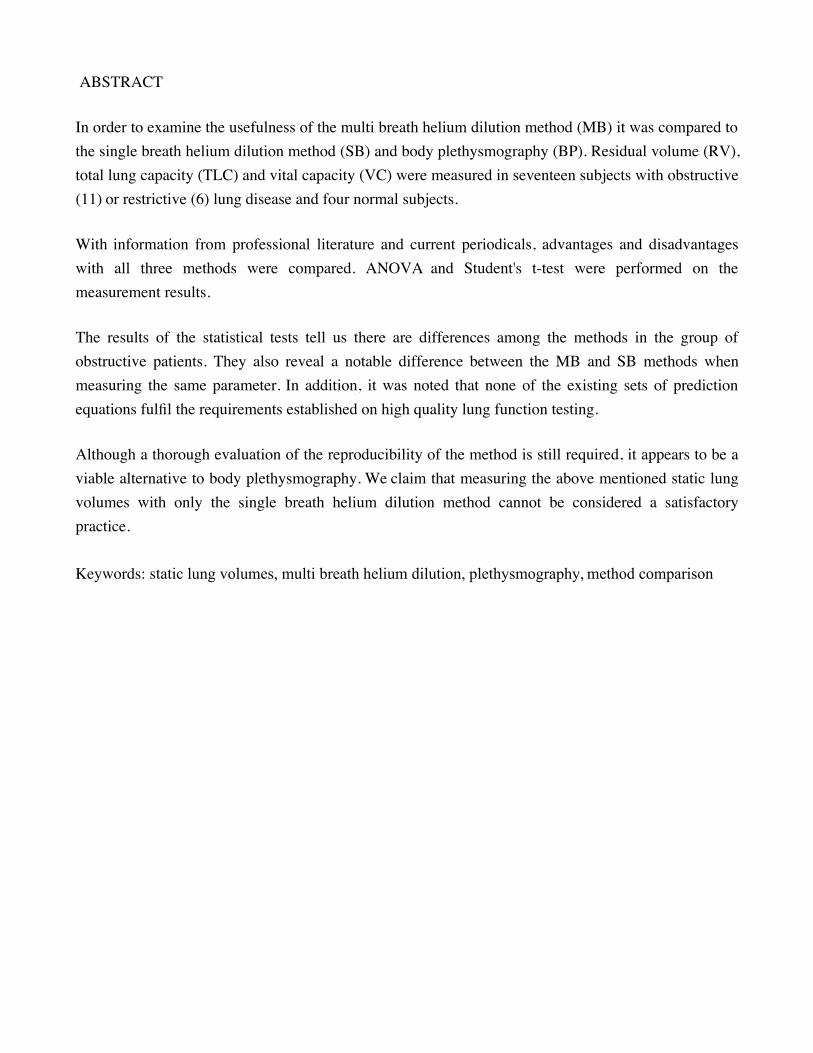
ABSTRACT
In order to examine the usefulness of the multi breath helium dilution method (MB) it was compared to
the single breath helium dilution method (SB) and body plethysmography (BP). Residual volume (RV),
total lung capacity (TLC) and vital capacity (VC) were measured in seventeen subjects with obstructive
(11) or restrictive (6) lung disease and four normal subjects.
With information from professional literature and current periodicals, advantages and disadvantages
with all three methods were compared. ANOVA and Student's t-test were performed on the
measurement results.
The results of the statistical tests tell us there are differences among the methods in the group of
obstructive patients. They also reveal a notable difference between the MB and SB methods when
measuring the same parameter. In addition, it was noted that none of the existing sets of prediction
equations fulfil the requirements established on high quality lung function testing.
Although a thorough evaluation of the reproducibility of the method is still required, it appears to be a
viable alternative to body plethysmography. We claim that measuring the above mentioned static lung
volumes with only the single breath helium dilution method cannot be considered a satisfactory
practice.
Keywords: static lung volumes, multi breath helium dilution, plethysmography, method comparison
1
1 INTRODUCTION
In the year 1800 H. Davy attempted measuring the volume of residual gas remaining in his own lungs
after a forced expiration, as well as their volume in a state of voluntary inspiration. Further attempts to
measure what was called “residual air” in the nineteenth century yielded confusing views, estimates
varying between 650-3600mL. Therefore a significant advance was made when the Danish
physiologist Christian Bohr at the turn of the last century turned interest to measuring the entire lung
volume, with all its components and more stress was put on the relationship between the components
than on their absolute values (1).
Today, it is well known that the diagnostic value of lung function tests is small used alone. Together
with an appropriate clinical and radiographic picture the results of lung function tests may suggest or
support a specific diagnosis. In addition to identifying defective function, respiratory function tests also
allow quantification of its severity. Modern respiratory function tests (like body plethysmography) also
have a role in identifying the likely site of the pathological process, i.e. whether obstructive defects are
situated in the central or peripheral airways and whether restrictive defects originate from the chest
wall or the alveoli (2).
The purpose of this study was to compare three methods used to measure static lung volumes. The
methods compared were body plethysmography (BP as in body plethysmography), the single breath
helium dilution method (SB as in single breath) and the multi breath helium dilution method (MB as in
multi breath). The MB method is not in current daily use at Meilahti Hospital, so this study was also
aimed to validate its usability for the laboratory of Clinical Physiology at Meilahti Hospital, Helsinki.
The study included twenty one patients and the parameters studied were total lung capacity (TLC),
residual volume (RV) and vital capacity (VC).
2
2 THE RESPIRATORYSYSTEM
The lung is the organ of external respiration for the exchange of oxygen and carbon dioxide between
blood and surrounding air. The two lungs are divided into several lobes. In the normal human adult the
lungs are soft and spongy and they weigh about 800-1200 g. Blood accounts for 40 % of the weight of
the lungs and also for their light pink colour. (3, 4)
Respiration includes several functional events, ventilation of the airways and some air spaces being the
pre-eminent one. Respiration also involves mixing and diffusion of gases in the alveolar ducts, air sacs
and alveoli and transfer of gases across the alveolar membranes in the lung parenchyma. (5, 6) The
distribution of gases is carried out by the respiratory system, which consists of the lungs, diaphragm
and upper and lower airways (7). The upper airways are the nasal cavities, glottis and larynx with vocal
cords. The lower airways are made up of the trachea, bronchi and bronchioles.
On its way towards the lungs, the air is prepared by what is called the air conditioning function of the
upper passageways. The hairs at the entrance of the nostrils filter the air to prevent large particles from
entering the airways. The air is warmed by the extensive and heavily vascularised surfaces of the
conchae and almost completely humidified. The surface of all respiratory passage, from nose to
terminal bronchioles is lined with ciliated epithelium with about 200 cilia on each epithelial cell. These
cilia carry a layer of mucus secreted by goblet cells in the stratified epithelium of the airways that traps
all the small particles in the inspired air. The cilia beat continually at a rate of 10 to 20 times per
second. The rhythmic beating of the ciliated cells effectively transports the surface film of mucus and
particles out of the lung by way of the trachea to the pharynx where mucus and particles are swallowed
or coughed out. (3, 9)
The cough reflex is, like the sneeze reflex, a very important reaction. It is initiated to allow large
amounts of air to pass rapidly through the nose or glottis and vocal cords and thus clearing the areas of
mucus and any foreign matter present. (8)
The respiratory airways are also referred to as the bronchial tree due to their continuous branching into
bronchi and bronchioles of decreasing length and diameter. (9) Between the trachea and the alveolar
sacs the airways divide 23 times. These multiple divisions greatly increase the total cross-sectional area
of the airways. Consequently the velocity of air flow in the small airways declines to very low values.
3
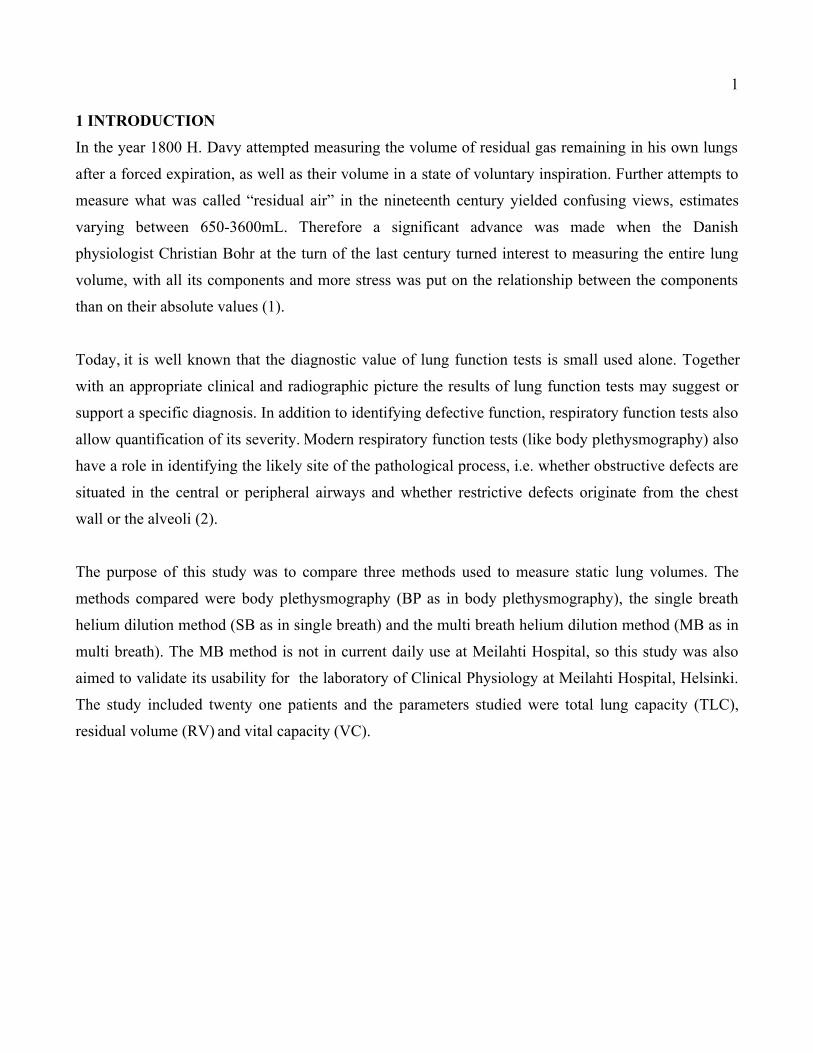
Figure 1 presents the bronchial tree, which is divided into the conducting and respiratory zones. The
first 17 generations of passages (i.e. trachea and 16 airway branches) form the conducting zone of the
airways that transports gas from and to the exterior. (5)
Figure 1. Bronchi, Bronchial Tree and Lungs http://www.web-
books.com/eLibrary/Medicine/Physiology/Respiratory/bronchi_lungs.jpg 18.04.07
The airways of the conducting zone are made up by bronchi, bronchioles and terminal bronchioles. (5)
The trachea and the first four generations of bronchi are supported by horseshoe or C-shaped rings of
hyaline cartilage to prevent airway collapse caused by positive intra thoracic pressures during forced
expiration. In the lobar and segmental bronchi, the cartilaginous rings give way to very small plates of
cartilage. (9) The cartilage disappears completely in airways about 1 mm in diameter, leaving
bronchioles and terminal bronchioles without cartilage but suspended by elastic tissue and smooth
muscle fibres in the lung parenchyma.(3, 9)
4
Respiratory bronchioles, alveolar ducts and alveoli make up the remaining respiratory zone. The lungs
of a normal human adult contain about 300-500 million alveoli. The many alveoli give the human lung
a total internal surface area of approximately 1 m2/ kg body weight or 75 m2, roughly the size of a
tennis court. (3,9) The alveolar walls are extremely thin and lined with so many capillaries, the
capillaries almost touch one another. This exceedingly thin membrane, in some places less than 0.5 !m
that separates the blood in the pulmonary capillaries from the gas in the alveoli is referred to as the
blood-gas interface. Air is brought to one side of the interface, by ventilation, blood to the other side by
pulmonary circulation and oxygen and carbon dioxide cross the interface by diffusion. (8, 9)
The space between the visceral and parietal pleura is the pleural cavity, which contains a thin layer of
fluid, about 10 !m thick. This lubricant allows the lungs to slide easily on the chest wall, but also
prevents them from being pulled away from it. (5, 9)
Breathing is an automatic and rhythmic process regulated by the central nervous system. The process of
contraction and relaxation of the skeletal muscles of the diaphragm and rib cage that causes gas to
move in and out of the lungs is divided into inspiration, the active phase and expiration, the passive
phase. Inspiration is performed as a response to motor impulses from respiratory control centres in the
brain stem. The contraction of the diaphragmal and external intercostal muscles causes the thoracic
cavity to expand. (3) Since the chest cavity is airtight, this increase in thoracic volume decreases the
pressure in both lungs and alveoli. This fills the lungs with air. At the end of inspiration, the lung recoil
begins to pull the chest back to the expiratory position. The pressure in the airways becomes slightly
positive and air flows out of the lungs. Expiration during quiet breathing is passive in the sense that no
muscles which decrease intra thoracic volume contract. Only during forced expiration (i.e. during
exercise) do the expiratory intercostals and abdominal muscles contract and actively contract and
compress the thoracic cavity. (5)
Pleural pressure is the pressure of the fluid in the narrow space between the lung wall pleura and the
chest wall pleura. This pressure is normally, during quiet breathing, slightly negative, and changes in
lung volume due to breathing also causes change in pleural pressures. Alveolar pressure is the pressure
inside the lung alveoli. When the glottis is open and no air is flowing in or out, this pressure, as in all
parts of the respiratory tree, equals atmospheric pressure. The pressure difference between the alveoli
and the outer parts of the lungs is called the transpulmonary pressure.
5
The changes in lung volume that occur with changes in pressure can be plotted as a pressure-volume
curve. The slope of the line is known as compliance. Compliance has an effect on ventilation and
causes air to be unevenly distributed. Low compliance indicates a stiff lung and means that more work
is required to bring in a normal amount of air. Loss of elastic recoil in the is lungs increases with age. A
highly compliant lung is also undesirable. In emphysema the elastic tissue has been damaged, usually
due to over-stretching caused by chronic coughing. Patients with high lung compliance have no
problems inflating the lungs but have extreme difficulty exhaling air. Normally, compliance is lower at
the top part of the lung than at the base. This difference in compliance between the apex and base is
known as regional compliance. The pressure-volume is non-linear and compliance is not the same at all
lung volumes as it decreases at high lung volumes and increases at low lung volumes. (9)
6
3 DISEASES OF RESPIRATION
Diseases of the lungs and chest wall affect lung volumes and capacities in various ways. Based on
common characteristics and the changes in lung volumes and capacities they share, the majority of lung
diseases may be classified as either obstructive or restrictive lung disease.
3.1 Obstructive diseases
The four major pathophysiological disorders classified as obstructive diseases are chronic bronchitis,
chronic obstructive lung disease (COPD), emphysema and asthma. The pathophysiology and ethiology
in the diseases are different, but their common trait is that they cause the slowing down of air
movement during forced expiration. The air flow can be obstructed by excessive mucus production
(bronchitis), airway narrowing due to bronchial spasms (asthma) or airway collapse during forced
expiration (emphysema). (9)
Asthma is a common disease of the airways characterized by airway inflammation, airway hyper
responsiveness to a variety of stimuli and/or episodes of markedly increased airway obstruction that is
at least partially reversible spontaneously or with treatment. (3, 10) In emphysema the alveolar walls
progressively degenerate; the elastic lung tissue, airway support and structural elements are destroyed.
(3)
Patients with COPD have slowly progressive airway obstruction. The course of disease is punctuated
by periodic worsening with an increase in sputum production and dyspnoea. The deterioration of the
disease is often associated with pulmonary infection or poor patient compliance with prescribed
therapy. The temporal variability in the degree of airway obstruction associated with asthma is not
present in COPD. All of the above mentioned pathophysiologic disorders are also recognized as a part
of the syndrome of COPD: emphysema, small airway disease and chronic bronchitis (and asthma). In
any given patient one or more of these manifestations may predominate.
Airway obstruction leads to characteristic changes in lung volumes, with an increase in residual volume
(RV) and functional residual capacity (FRC). Total lung capacity, TLC remains normal or is increased.
Vital capacity (VC) is decreased as the RV takes up more and more of the thoracic gas volume. (10)
Emphysema and COPD also increase lung compliance. (3)
7
It is generally agreed that small airways collapse during expiration thus trapping air and defining the
residual volume even in normal subjects. The degenerative process in emphysema and COPD
accentuates this process, which leads to an increase in RV,at the expense of VC. Trapped air is found
virtually invariably in patients with emphysema (collapsed airways) and in patients with severe chronic
bronchitis or asthma. Cysts filled with air or extrapulmonary air (pneumothorax) may also contribute to
the amount of trapped air. Air trapping is generally revealed by an increased RV/TLC ratio. (11)
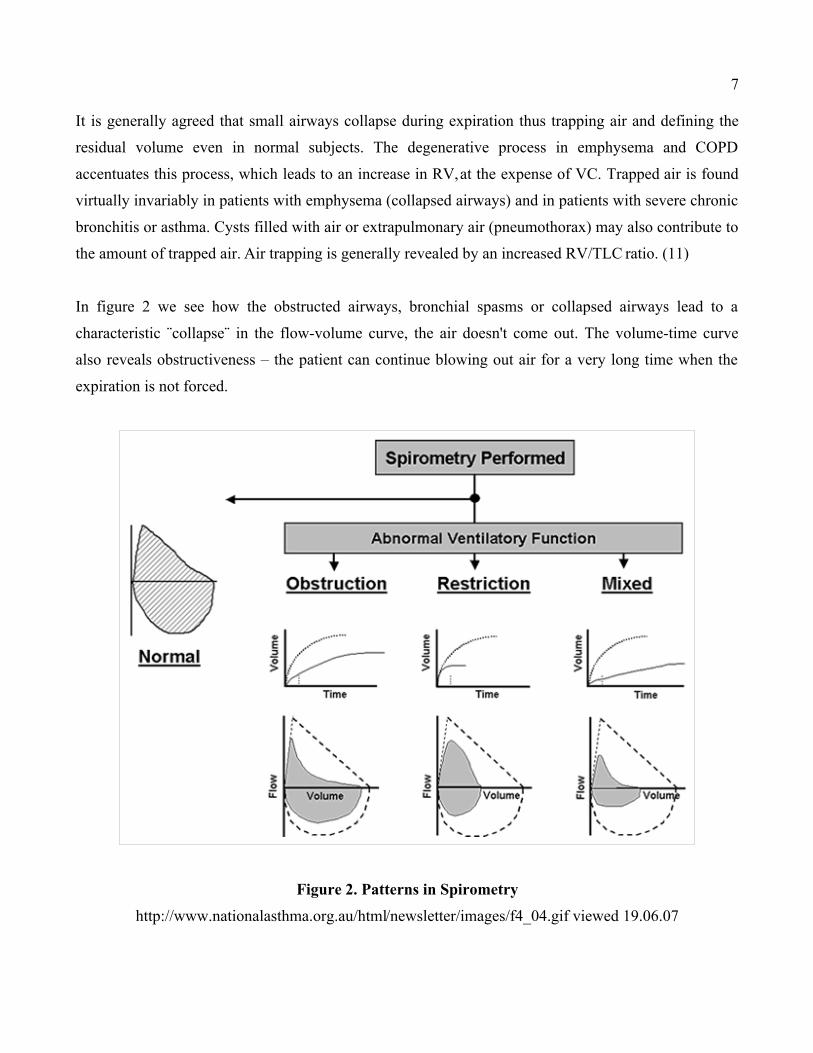
In figure 2 we see how the obstructed airways, bronchial spasms or collapsed airways lead to a
characteristic ¨collapse¨ in the flow-volume curve, the air doesn't come out. The volume-time curve
also reveals obstructiveness – the patient can continue blowing out air for a very long time when the
expiration is not forced.
Figure 2. Patterns in Spirometry
http://www.nationalasthma.org.au/html/newsletter/images/f4_04.gif viewed 19.06.07
8
3.2 Restrictive diseases
Restrictive lung diseases are characterized by a fall in lung compliance, a decline in the diffusing
capacities and a fall in all lung volumes. For any point in volume, however, flow is normal, see figure
2. The reduction in static lung volumes may be caused by disorders that restrict lung expansion, such as
neuromuscular disorders, diseases of the chest wall and abdomen. Restrictive diseases may also cause
increase in lung stiffness, decrease in the number of alveolar units (lung resection, atelectarsis, scars) or
the replacement or infiltration of normal lung tissue by abnormal tissue. (3, 6, 12) These changes
prevents the patient from breathing in or our for very long, which can be seen in the volume-time curve
in figure 2. The process causing the changes may be due to direct toxicity, a result of an inflammatory
response, or an immunologically mediated reaction.
Restrictive lung diseases also include interstitial and infiltrative diseases, ILD. ILD is a group of
diseases characterized by diffuse lung injury and inflammation that frequently progresses to irreversible
fibrosis and severely compromised gas exchange. These lung diseases are produced by exposure to
respirable substances. The degree of injury depends on the size of the particles, their noxiousness and
the dose and duration of exposure.
The dusts may be fibrous minerals, such as asbestos, or non-fibrous minerals, such as silica or metals.
Asbestos is the most important health hazard among the fibrous minerals and among non fibrous
minerals; silica is the substance causing the greatest physiologic impairment. Immunological disorders
and syndromes such as rheumatoid arthritis, systemic lupus erythematosus and Sjögren’s syndrome are
also associated with different pulmonary manifestations, such as interstitial fibrosis and pulmonary
vasculitis. (10, 12)
9
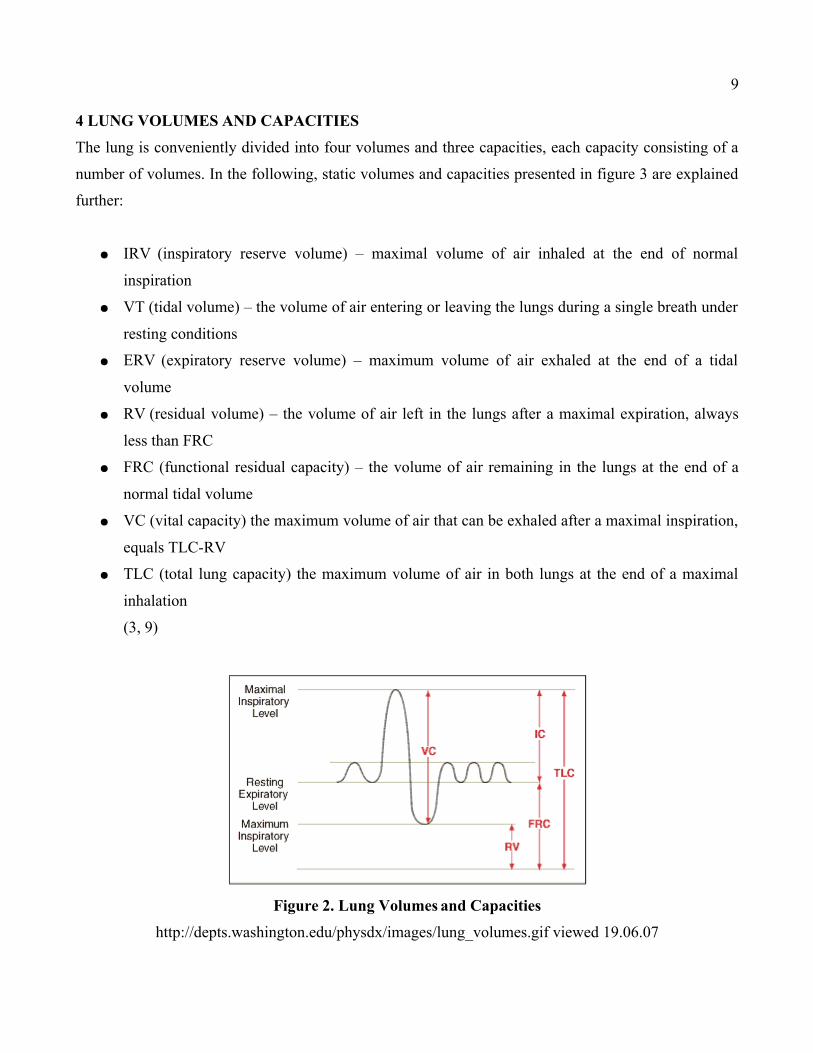
4 LUNG VOLUMES AND CAPACITIES
The lung is conveniently divided into four volumes and three capacities, each capacity consisting of a
number of volumes. In the following, static volumes and capacities presented in figure 3 are explained
further:
! IRV (inspiratory reserve volume) – maximal volume of air inhaled at the end of normal
inspiration
! VT (tidal volume) – the volume of air entering or leaving the lungs during a single breath under
resting conditions
! ERV (expiratory reserve volume) – maximum volume of air exhaled at the end of a tidal
volume
! RV (residual volume) – the volume of air left in the lungs after a maximal expiration, always
less than FRC
! FRC (functional residual capacity) – the volume of air remaining in the lungs at the end of a
normal tidal volume
! VC (vital capacity) the maximum volume of air that can be exhaled after a maximal inspiration,
equals TLC-RV
! TLC (total lung capacity) the maximum volume of air in both lungs at the end of a maximal
inhalation
(3, 9)
Figure 2. Lung Volumes and Capacities
http://depts.washington.edu/physdx/images/lung_volumes.gif viewed 19.06.07
10
Volume changes of the lung are usually measured at the mouth, preferably by means of a spirometer.
Since the lungs cannot be emptied completely following forced expiration, neither RV nor FRC can be
measured directly by simple spirometry, as the other above mentioned volumes and capacities. (3, 6)
RV and FRC can instead be measured with two gas dilution techniques or with a body plethysmograph.
(13)
Gas dilution methods can be subdivided into those based on wash-in (usually helium) or wash-out
(usually nitrogen) of an inert tracer gas, employing a multiple or single breath protocol. (14) In a body
plethysmograph volume changes can be measured from the body surface and the method is based on
the physical fact that the pressure in a closed space with constant temperature is inversely proportional
to the volume of the space. (6, 7)
The parameters studied in this work are VC, TLC and RV.A very easy way of testing vital capacity is
to ask the subject to inspire maximally and then expire completely into a spirometer. The vital capacity
can also be estimated as the sum of the separately measured inspiratory capacity and expiratory reserve
volume. In general, the mean of several trials is considered to be the most useful for variations in data,
but the measurement most often used for vital capacity is the maximum of several trials. Reduction in
vital capacity occurs in very many diseases and is not unique to any single disorder. It is also possible
that a patient may have a pulmonary disability even though his/her vital capacity is in the normal range.
The residual volume (the volume of gas remaining in the lungs after a complete expiration) is the only
one of the four lung volumes that cannot be measured by direct spirometry and must determined by
indirect means. RV and FRC are usually measured by either an open-or a closed circuit method that
estimates the volume of gas in the lungs in communication with the major airways at the time of the
test.
An increase in RV means that the lung is still hyperinflated even after maximal expiratory effort, i.e.
the patient cannot by voluntary effort force her/his thorax and lungs to as small a volume as a normal
person. RV and FRC usually increase together. RVmay increase without the corresponding increase in
FRC and this must mean the VC is reduced. (15)
11
The measurement of total lung capacity, TLC, provides important information in patients suspected of
restrictive lung disease as it is used to identify restrictive disease and assess its severity. More recent
studies have also shown the importance of estimating TLC as increased residual volume appears to be
an important characteristic for determining suitability for lung reduction in patients with COPD. (16)
TLC is usually determined by measuring the FRC and adding the inspiratory capacity. TLC also equals
VC plus RV.The TLC is decreased in patients who have a net decrease in the sum of VC and RV.Most
often it is a decrease in the VC that is most important. In emphysema there is an increase in RV that
may decrease VC, particularly as the disease becomes more severe. This results in a normal or
moderately increased TLC. (15)
12
5 METHODS OF EXAMINATION
Measurements should normally be made during normal working hours by a well-trained operator. Time
of day and season should be noted as diurnal variations are larger in subjects with lung disease than in
healthy subjects. It is helpful to record the time of the last cigarette and medication taken. At Meilahti
Hospital all patients are given special instructions in written form as an introduction to each
examination.
The subject should have been at rest at least 15 minutes prior to the test. The procedure should be
carefully described to the subject, with the emphasis on the need of avoiding leaks round the
mouthpiece and of making maximal inspiratory and expiratory effort. The measurements are to be
made with the subject seated in an upright posture. A nose clip is mandatory for measurements made
during normal breathing. Dentures, unless fitting very badly so that they come loose and obstruct air
flow, should not be removed, since the cheeks and lips then loose support, which promotes air leaks
from the mouth. (6) Posture has important effects on certain lung capacities, most particularly on FRC,
which is appreciably lower with the subject supine than upright. (2)
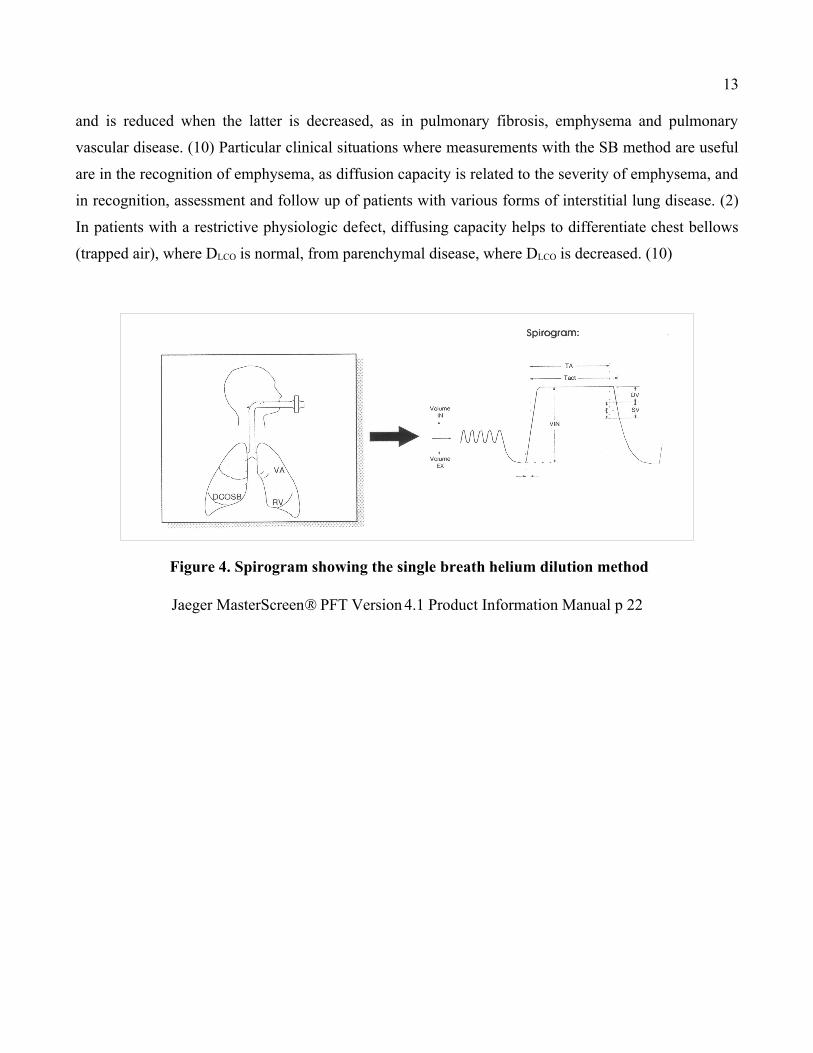
5.1 The single breath helium dilution method
The single breath method is used to determine TLC and RV.The method is usually included with the
measurement of pulmonary diffusing capacity for carbon monoxide (DLCO) and provides an estimate of
TLC, commonly referred to as alveolar volume (VA). (7, 13) With the standard method for SB the
effective alveolar volume can be measured by helium dilution at full inspiration during 10 (6-12)
seconds of breath holding. (11) Figure 4 shows normal tidal breathing and expiration to RV after which
the test gas is inspired. The plateau is when the patient is holding his/her breath and the diffusion takes
place. The sample is taken during the expiration, after air not participating in diffusion (from dead
space) has first been discarded.
Allowance should be made for the effects the deadspace of the equipment has on the helium
concentration. To obtain the alveolar volume the estimated anatomical deadspace and the deadspace of
the apparatus should be subtracted from the inspired gas volume before being multiplied by the ratio of
the corrected alveolar helium concentration. (6) The measurement of the diffusing capacity for carbon
monoxide (DLCO) is however primarily an indicator of the adequacy of the alveolar-capillary membrane
13
and is reduced when the latter is decreased, as in pulmonary fibrosis, emphysema and pulmonary
vascular disease. (10) Particular clinical situations where measurements with the SB method are useful
are in the recognition of emphysema, as diffusion capacity is related to the severity of emphysema, and
in recognition, assessment and follow up of patients with various forms of interstitial lung disease. (2)
In patients with a restrictive physiologic defect, diffusing capacity helps to differentiate chest bellows
(trapped air), where DLCO is normal, from parenchymal disease, where DLCO is decreased. (10)
Figure 4. Spirogram showing the single breath helium dilution method
Jaeger MasterScreen® PFT Version4.1 Product Information Manual p 22
14
5.2 The multi breath helium dilution method
The MB helium equilibration method is based on equilibration of gas in the lung with a known volume
of gas containing a known amount (or fraction) of helium. (14)
The purpose of the examination is to measure the total volume of the lungs that participate in
ventilation and to establish the residual volume. The method is also used to differentiate "true"
restriction from dynamic restriction caused by obstructive diseases and to estimate the degree of
difficulty in obstructive diseases. (17) The spirometer is filled with a mix of air and 10 per cent helium.
(7) The initial 10 per cent concentration of the helium in the spirometer is designated as C1 and the
volume of air in the spirometer is V1. Since the lung initially contains no helium, the helium
concentration in the lung becomes the same as in the spirometer after equilibration. The concentration
in the lungs after equilibration is C2 and the unknown volume of the lungs is V2. By conservation of
mass:
V 1C1=V 2C 2
Vs" He 1=V s
#Vds#FRC " He 2
FRC=Vs"He1$He 2He 2
$Vds
Vs= the volume of the spirometer
Vds = deadspace of the apparatus/spirometer
He1 = the initial helium concentration
He2 = the helium concentration in the closed circuit at equilibration.
By adding inspiratory capacity to FRC, TLC may be obtained.
(7, 18)
During measurements the subject should be seated and at rest so that both the oxygen uptake and FRC
are stable. Dentures need not be removed, but a nose clip must be worn. The subject breathes through a
special mouthpiece connected to the spirometer. The patient is instructed to breathe quite normally. (6)
15
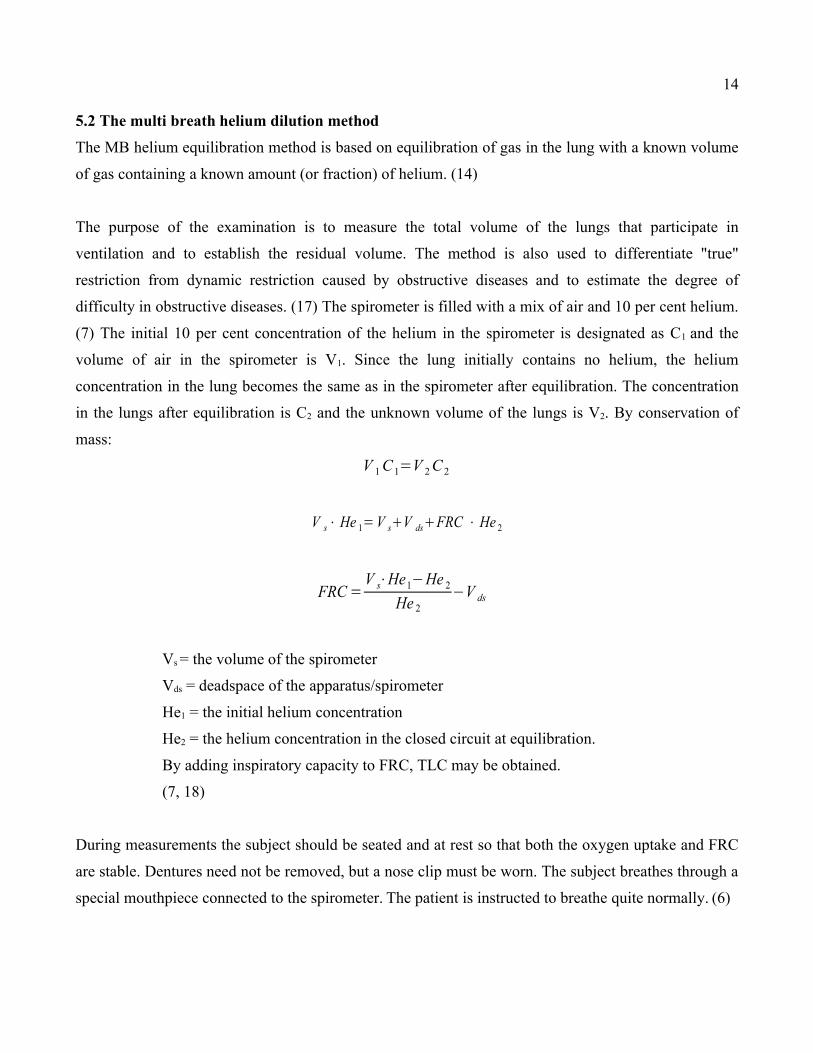
The official statement of the European respiratory society recommends an end-of-test -criterion of 2
minutes, or simply ending the test after 10 minutes of tidal breathing, i.e. after the beginning of the
measurement. The time to equilibration (or the lack of equilibration after 10 minutes) should be
reported. In practice, the test rarely exceeds 10 minutes, even in patients with severe gas exchange
abnormalities. (6, 14) Ideally the slope of helium/time signal should also be examined for a smooth
decline and plateau during the test. The process can be followed in figure 5. When the end-of-test
criterion is met the patient is instructed to exhale slowly and fully to RV. Once RV is reached, the
patient should be coached to inhale completely, to TLC. This way ERV can be estimated, and by
calculating
FRC – ERV= RV
RV is defined. This in turn makes it possible to establish
TLC = VC + RV
Figure 5. Spirogram showing the multi breath helium dilution method
Jaeger MasterScreen® PFT Version4.1 Product Information Manual p 30
In some laboratories, it is the practice to encourage patients to make intermittent deep inhalations
during the test. The purpose is to encourage gas mixing in regions of relatively poor ventilation and to
decrease equilibration time. Following a deep inhalation, however, a patient with severe airway
obstruction may take many breaths before returning to original FRC. This will lead to errors in the
amount of oxygen added during the procedure. (14) The deep inhalation may also temporarily open
airways that are non-ventilated at rest, which lowers the helium concentration in the circuit. (6)

16
The results are presented in absolute values, reference values and percentage values of the reference
values for all the variables. (17) Due attention should be given the subject during the procedure, in
order to be able to perceive and possibly avoid leaks around the mouthpiece and nose clip, excessive
swallowing during the test and posture changes. The apparent degree of effort during the IVC and EVC
manoeuvres should also be noted. (6)
17
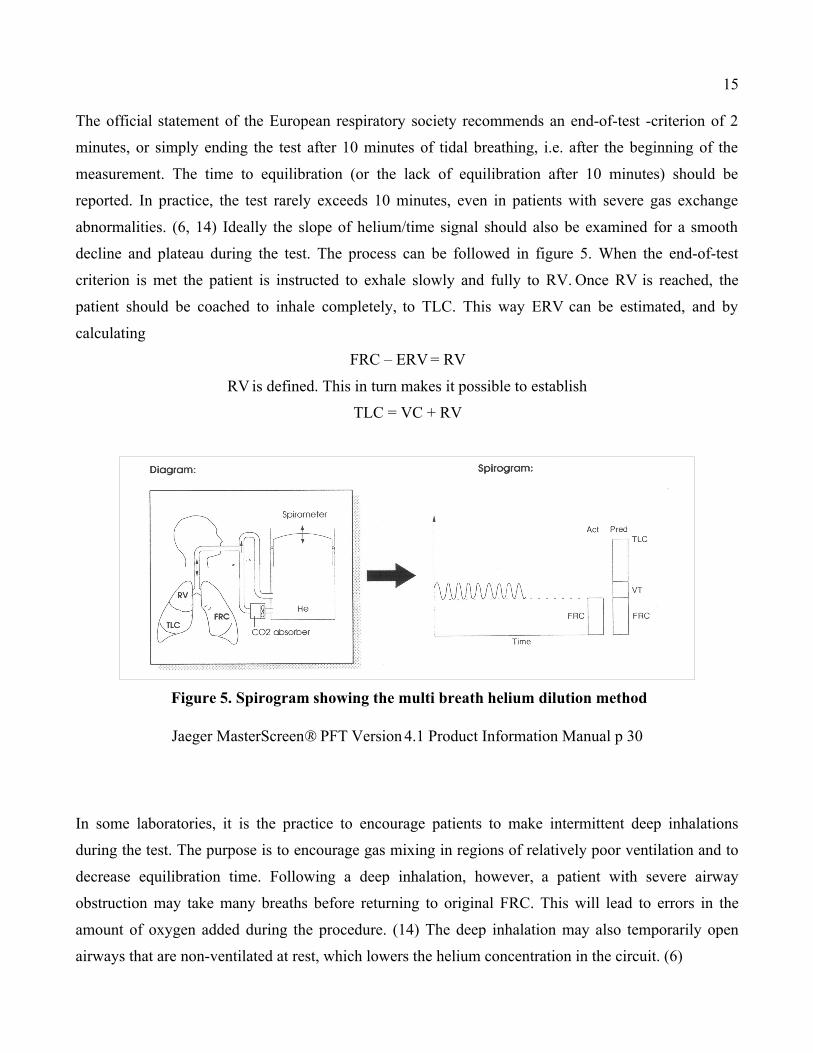
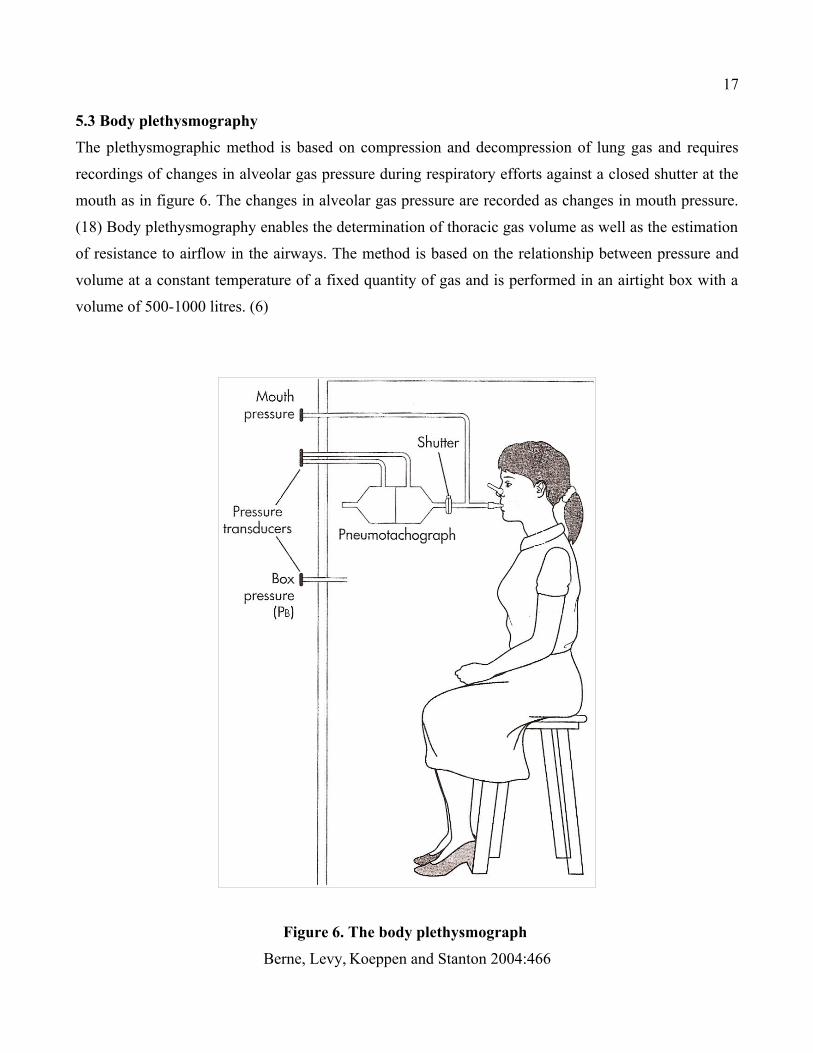
5.3 Body plethysmography
The plethysmographic method is based on compression and decompression of lung gas and requires
recordings of changes in alveolar gas pressure during respiratory efforts against a closed shutter at the
mouth as in figure 6. The changes in alveolar gas pressure are recorded as changes in mouth pressure.
(18) Body plethysmography enables the determination of thoracic gas volume as well as the estimation
of resistance to airflow in the airways. The method is based on the relationship between pressure and
volume at a constant temperature of a fixed quantity of gas and is performed in an airtight box with a
volume of 500-1000 litres. (6)
Figure 6. The body plethysmograph
Berne, Levy, Koeppen and Stanton 2004:466
18
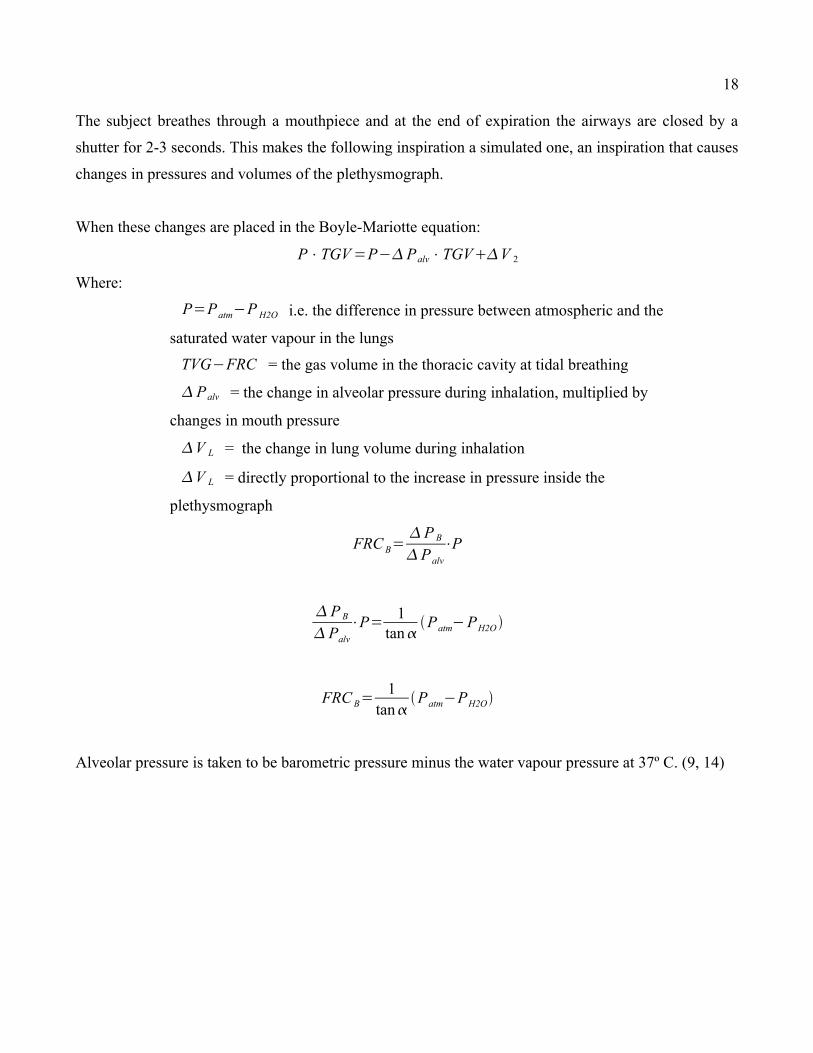
The subject breathes through a mouthpiece and at the end of expiration the airways are closed by a
shutter for 2-3 seconds. This makes the following inspiration a simulated one, an inspiration that causes
changes in pressures and volumes of the plethysmograph.
When these changes are placed in the Boyle-Mariotte equation:
P"TGV=P$%Palv"TGV#%V 2
Where:
P=Patm$P
H2O i.e. the difference in pressure between atmospheric and the
saturated water vapour in the lungs
TVG$FRC = the gas volume in the thoracic cavity at tidal breathing
%Palv = the change in alveolar pressure during inhalation, multiplied by
changes in mouth pressure
%V L = the change in lung volume during inhalation
%V L = directly proportional to the increase in pressure inside the
plethysmograph
FRCB=
%PB%P
alv
"P
%PB%P
alv
"P=1
tan&'P
atm$P
H2O(
FRCB=
1
tan&'P
atm$P
H2O(
Alveolar pressure is taken to be barometric pressure minus the water vapour pressure at 37º C. (9, 14)
19
There are two kinds of plethysmographs, volume-displacement and volume-constant plethysmographs.
In a volume displacement plethysmograph, the change in lung volume caused by change in alveolar
pressure is expressed as "VL .In a volume-constant plethysmographs "VL is measured indirectly by
instead measuring "Pbox, from which the change in lung volume can be calculated. Repeated
measurements of thoracic gas volume made in healthy subjects as well as in patients at the level of the
functional residual capacity have shown a coefficient of variation of about 5 %. It is recommended to
report TLC as the mean FRCbox plus the largest of the inspiratory capacities. Residual volume should be
reported as TLC – IVC. (6)
20
6 METHOD COMPARISONS
Out of the three methods in focus, the single-breath test has the advantage of requiring least co-
operation from the patient, who has only to inhale and hold his/her breath for ten seconds. The test can
be repeated a number of times in succession if desired. Originally, a waiting period of four minutes
between measurements was recommended. In clinical reality however, this recommendation is seldom
followed, which makes it the fastest one of the methods. The method has the disadvantage of breath
holding not being a normal breathing state. Some patients may find it difficult to hold their breath for
ten seconds. Others may not be able to inhale and deliver an alveolar sample rapidly; making it difficult
to measure the exact time the carbon monoxide and helium resided in the lung. (15)
Another disadvantage is that the test in practice is impossible to perform on patients with very small
volumes. (1-1.2 L) This is due to the method requiring a sample and discard volume of minimum 1100
ml (Sample volume 600 ml, discard volume 500 ml). (7)
Advantages of the MB helium dilution method are its operational simplicity, reproducibility and that it
generally requires less patient effort than for instance body plethysmography. Disadvantages of the
method are errors in the measurements, either from non-linearity of the helium gas analysers or due to
leaks in the patient-spirometer system. There is also a waiting period before this test can be repeated to
allow time for re-equilibration with room air. (13)
Continued loss of helium leads to failure to achieve equilibration as it has been defined (not in the
instance of extremely small leaks) and it causes overestimation of the FRC. Paths of helium loss
include leaks around mouthpiece and nose clip, from the equipment, transfer of test gas through
ruptured tympanic membranes and swallowing gas. (14)
If gas mixing is continued long enough, helium will not only mix between the spirometer and lung, but
will also equilibrate with the blood and thereafter with body water and fat. Oxygen supply imperfectly
matched to oxygen consumption also influences gas concentration. A common cause of errors in gas
dilution methods is leaks in the patient-instrument-system, from the mouth or nose. The gas-dilution
bag may have small holes and the junctions to the soda lime absorption canister must be screwed on
tight. Gas analysers and pneumotachographs are naturally sensitive to disturbances. (7, 14)
21
Both gas dilution methods may underestimate the lung volume in the presence of very poorly or not at
all ventilated airspaces since they can only measure the volume of gas in the lungs that is actually in
direct communication with the airways. Such poorly ventilated airspaces are included in the
plethysmographic lung volumes, and the plethysmographic technique is recommended in such
circumstances. The plethysmographic determination of thoracic gas volume is the method of choice in
patients with airflow limitation and air trapping. The combined use of body plethysmography and gas
dilution gives information about the volume of “trapped gas”, which may be clinically useful. (6, 13)
Many subjects have difficulties expiring to RV, but no difficulties when inspiring to TLC. (19) This
affects all three methods since they presuppose an exhalation as close to RV as possible, but is critical
in the single breath helium dilution method, which relies on the patient reaching RV. The different
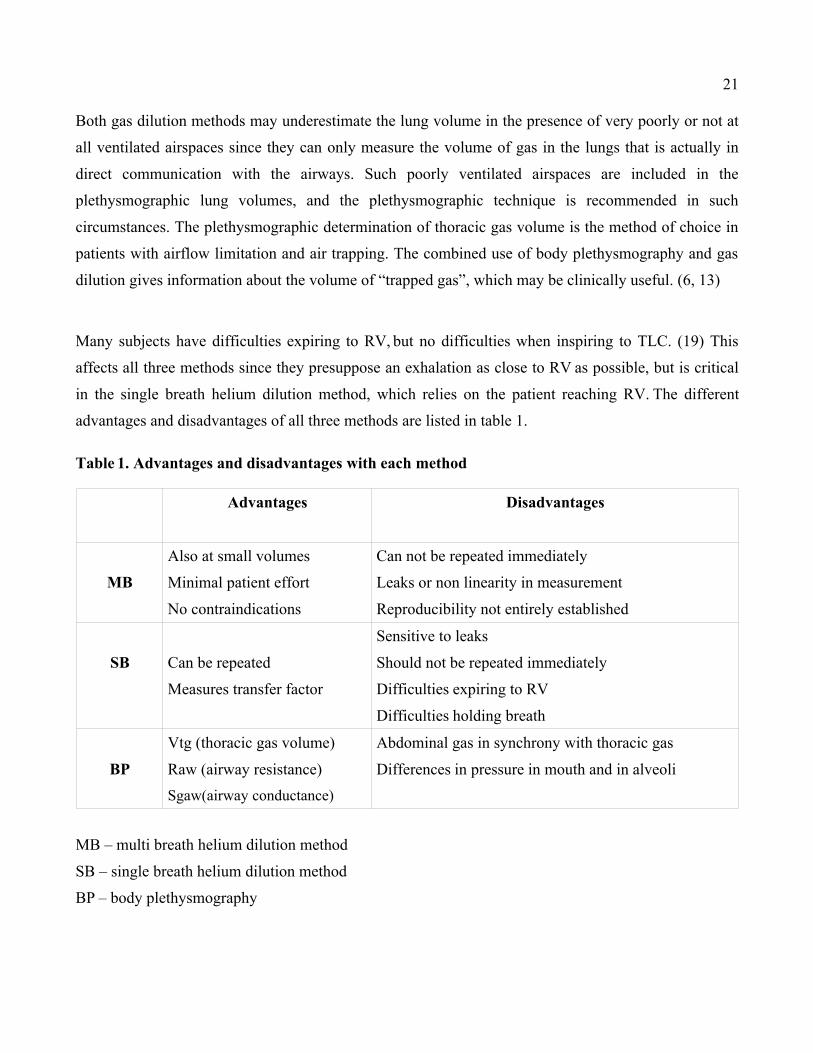
advantages and disadvantages of all three methods are listed in table 1.
Table 1. Advantages and disadvantages with each method
Advantages Disadvantages
MB
Also at small volumes
Minimal patient effort
No contraindications
Can not be repeated immediately
Leaks or non linearity in measurement
Reproducibility not entirely established
SB Can be repeated
Measures transfer factor
Sensitive to leaks
Should not be repeated immediately
Difficulties expiring to RV
Difficulties holding breath
BP
Vtg (thoracic gas volume)
Raw (airway resistance)
Sgaw(airway conductance)
Abdominal gas in synchrony with thoracic gas
Differences in pressure in mouth and in alveoli
MB – multi breath helium dilution method
SB – single breath helium dilution method
BP – body plethysmography
22
There are a number of known mechanisms by which plethysmography can overestimate lung volume.
One occurs when abdominal gas is compressed and decompressed in synchronic with thoracic gas.
However, the mechanism during which flow occurs between the thorax and extra-thoracic airways
seems to be the most substantial. In the presence of obstructed airways this leads to significant pressure
losses between alveoli and the airway opening. The result is an overestimation of lung volume because
the plethysmographic method takes pressure changes at the airway opening to represent alveolar
pressure changes. (14)
It has been shown that changes in mouth pressure may lead to overestimation of the changes in alveolar
pressure in the presence of airway obstruction and thereby result in an overestimation of lung volumes.
The error increases with increasing breathing frequency. A high frequency may lead to an
overestimation of the volume of the lungs. Another postulated error in plethysmography lies in the
contribution of abdominal gas to lung volumes .(18)
In body plethysmography sources of error are leaks in the plethysmograph, pressure sensor hose, leaks
from mouth or nose, “puffy” cheeks when breathing against a closed shutter and errors in pressure and
flow sensors. These leaks usually cause characteristic openings in the diagrams, which is why errors of
this kind should easily be detected. (7)
23
7 OBJECTIVES OF THE STUDY
The methods of examination of pulmonary function that are in daily use at the laboratory of Clinical
Physiology at Meilahti Hospital, have a strong focus on estimates of dynamic capacities and volumes.
Static lung volumes are represented almost solely by the single breath helium dilution method.
However, arriving at the correct diagnosis of a pulmonary disorder and coming to a decision regarding
treatment requires a thorough evaluation of all volumes, static as well as dynamic. The situation is all
the more serious when it is well known that the single breath helium dilution underestimates lung
volumes in patients with obstructive lung disease. Several studies have shown a clear discrepancy
between the single-breath TLC and the multi breath TLC associated with pulmonary obstruction, mean
values deviating sometimes more than 1 L. (13)
This evaluation has its motivation in the need of a method that more reliably than the SB method
determines static volumes. The main objective of this study was to examine the usefulness of the MB
method by comparing it to the SB method and body plethysmography. The comparison and analysis of
all three methods in both theory and practice should permit an estimation of the reliability of the
estimates achieved with the MB method. The results and experience achieved will hopefully lead to a
more frequent use of the MB method at the laboratory of Clinical Physiology at Meilahti Hospital.
Studies comparing the two gas dilution methods with body plethysmography have, to the author’s
knowledge, not been performed in Finland. Studies including body plethysmography and one or both of
the gas dilution methods are, on the whole rather rare. Searching for information on the Internet gave
enough information on the subject. The unanimous opinion gathered from different journals and
periodicals covering clinical physiology is that the SB and MB dilution methods, the SB method in
particular, consequently underestimates functional residual capacity and total lung capacity. (13, 16, 20)
The only study found to contradict that opinion is a study made by Andersson, Ringqvist and Walker at
Västerås Central Hospital in Sweden in 1988. It was concluded that the gas dilution methods and body
plethysmography gave estimates of TLC, which agreed even in patients with airway obstruction or
emphysema. This did however not apply for patients with very severe lung disease. (18)
24
In this work and in very many studies, the standard method against which new methods and methods
under evaluation are compared is body plethysmography. Body plethysmography is considered the
most accurate of the methods available today and is the “golden standard”. There are, however, several
limitations with this method. Many patients cannot tolerate being in a sealed environment for even
short periods of time and some are unable to perform the required panting manoeuvre. (13) Advantages
and disadvantages with the method are further examined in the method comparison.
25
8 IMPLEMENTATIONOF THE STUDY
8.1 Patient characteristics
Twenty one patients were chosen by a medical doctor and specialist in clinical physiology from
referrals sent to the laboratory of clinical physiology at Meilahti Hospital, Helsinki, Finland. Patients
with lung volume characteristics referring mainly to obstructive diseases were selected on the premises
of a suspicion of enlarged residual volume. The patients were collected during a time span of nearly
two months, 05/03/02 to 29/04/02. Patients in the process of lung transplantation, suffering from lung
or haematologic cancer or with interstitial alveolitis were excluded from the study.
During the first examination (dynamic spirometry or diffusion capacity by single breath helium dilution
method, depending on what examinations were asked for in the referral), the subjects were approached
with the question whether they would like to volunteer for the study. The subjects were informed of the
purpose of the study and all results, also the additional ones, were included in the medical statement
given and added to the patients dossier. The volunteers were not pressured to take part in the study and
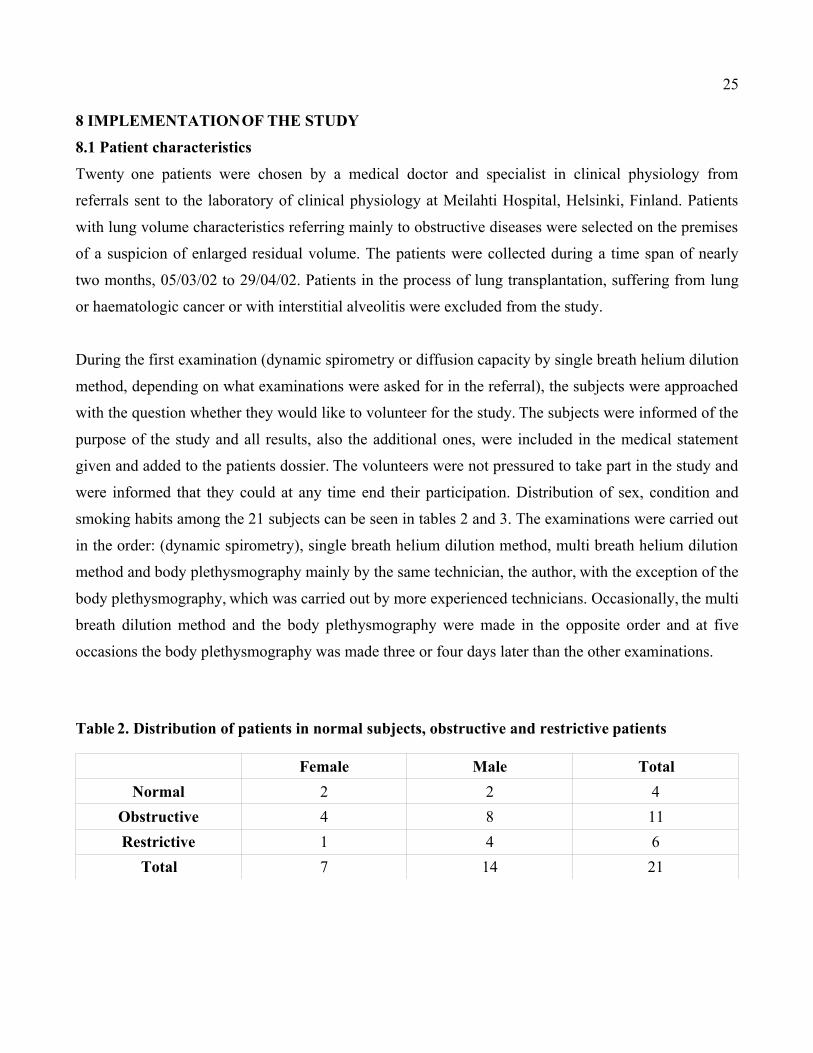
were informed that they could at any time end their participation. Distribution of sex, condition and
smoking habits among the 21 subjects can be seen in tables 2 and 3. The examinations were carried out
in the order: (dynamic spirometry), single breath helium dilution method, multi breath helium dilution
method and body plethysmography mainly by the same technician, the author, with the exception of the
body plethysmography, which was carried out by more experienced technicians. Occasionally, the multi
breath dilution method and the body plethysmography were made in the opposite order and at five
occasions the body plethysmography was made three or four days later than the other examinations.
Table 2. Distribution of patients in normal subjects, obstructive and restrictive patients
Female Male Total
Normal 2 2 4
Obstructive 4 8 11
Restrictive 1 4 6
Total 7 14 21
26
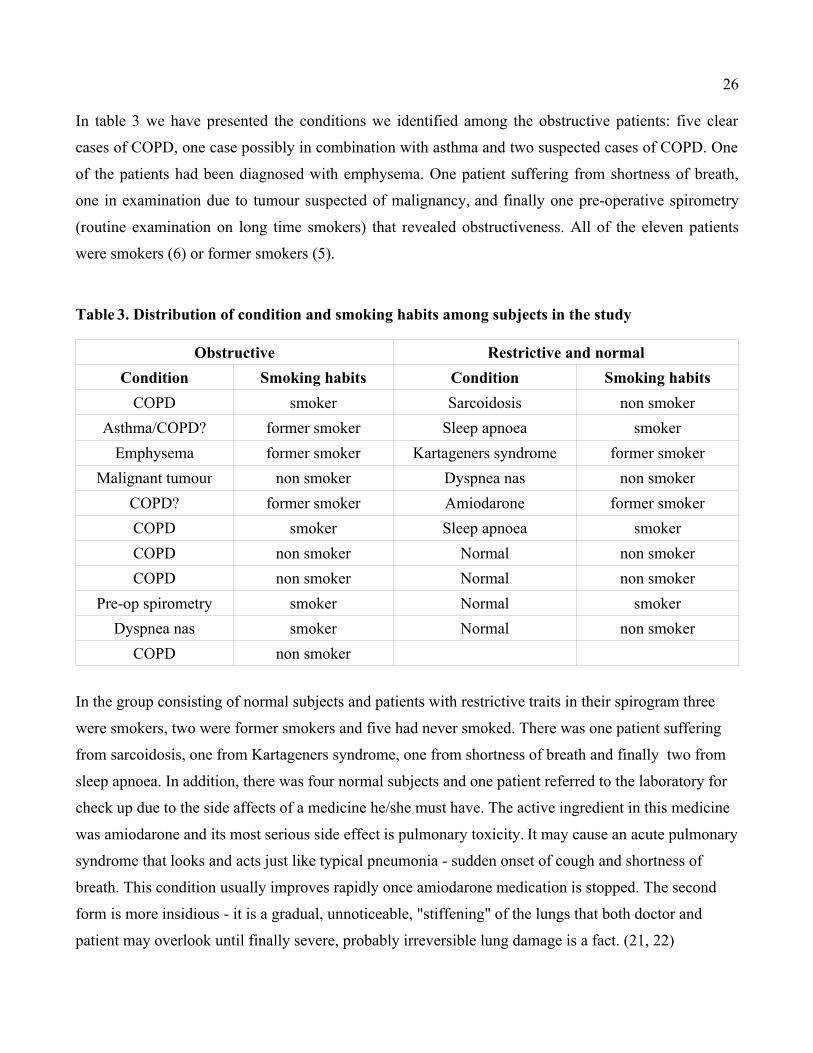
In table 3 we have presented the conditions we identified among the obstructive patients: five clear
cases of COPD, one case possibly in combination with asthma and two suspected cases of COPD. One
of the patients had been diagnosed with emphysema. One patient suffering from shortness of breath,
one in examination due to tumour suspected of malignancy, and finally one pre-operative spirometry
(routine examination on long time smokers) that revealed obstructiveness. All of the eleven patients
were smokers (6) or former smokers (5).
Table 3. Distribution of condition and smoking habits among subjects in the study
Obstructive Restrictive and normal
Condition Smoking habits Condition Smoking habits
COPD smoker Sarcoidosis non smoker
Asthma/COPD? former smoker Sleep apnoea smoker
Emphysema former smoker Kartageners syndrome former smoker
Malignant tumour non smoker Dyspnea nas non smoker
COPD? former smoker Amiodarone former smoker
COPD smoker Sleep apnoea smoker
COPD non smoker Normal non smoker
COPD non smoker Normal non smoker
Pre-op spirometry smoker Normal smoker
Dyspnea nas smoker Normal non smoker
COPD non smoker
In the group consisting of normal subjects and patients with restrictive traits in their spirogram three
were smokers, two were former smokers and five had never smoked. There was one patient suffering
from sarcoidosis, one from Kartageners syndrome, one from shortness of breath and finally two from
sleep apnoea. In addition, there was four normal subjects and one patient referred to the laboratory for
check up due to the side affects of a medicine he/she must have. The active ingredient in this medicine
was amiodarone and its most serious side effect is pulmonary toxicity. It may cause an acute pulmonary
syndrome that looks and acts just like typical pneumonia - sudden onset of cough and shortness of
breath. This condition usually improves rapidly once amiodarone medication is stopped. The second
form is more insidious - it is a gradual, unnoticeable, "stiffening" of the lungs that both doctor and
patient may overlook until finally severe, probably irreversible lung damage is a fact. (21, 22)
27
Within subject variation is mostly due to diurnal variation. Exposure to tobacco smoke or other
chemical or physical stimuli may also cause variability. Variation in the activity of a disease process
(infection, exposure to allergens), exposure to cold air, tobacco smoke or pollutants also affect results.
In order to control these sources of error, the patients undergoing examination were given a written
instruction in connection to the making of appointment. Enjoying heavy meals, drinking coffee, tea or
beverages containing caffeine was restricted two hours before the examination. Intake of alcohol was
forbidden 36 hours prior to the examination. Medication was interrupted or left on depending on the
purpose of the examination. The measurement procedure in itself affected the respiratory system, for
example deep inhalation can cause bronchodilation and a change in the elastic properties of the lung.
An important characteristic of any group is the variation between and within subjects. The most
obvious source of variation between normal subjects is naturally body size. Standardization of normal
data for body size is usually achieved by incorporating a term for body weight in the appropriate
prediction equations. Sex differences in normal respiratory function are closely related to size
differences, but even after accounting for size, important differences in certain tests remain. In
particular VC and TLC of men are larger than those of woman of similar size. Subjects of European
origin generally have values of VC and TLC 10-15 per cent larger than non-Europeans of similar
height. (2, 6)
28
8.2 The apparatus
The material in the study was gathered with a Jaeger MasterScreen and a Jaeger BodyScreen II. Both
apparatus were equipped with measurement programs specific for the three methods. The Jaeger
MasterScreen was used for the SB and MB methods and the Jaeger BodyScreen II for the
plethysmographic measurements. The MB and SB methods had different equipment requirements
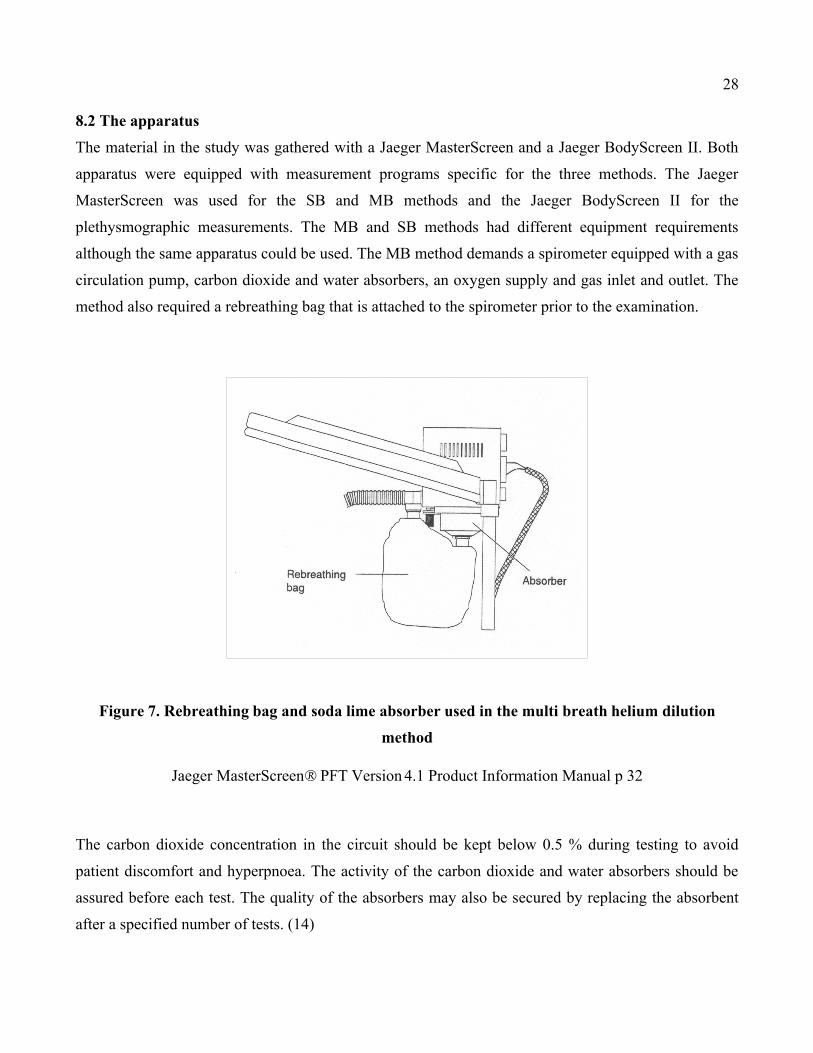
although the same apparatus could be used. The MB method demands a spirometer equipped with a gas
circulation pump, carbon dioxide and water absorbers, an oxygen supply and gas inlet and outlet. The
method also required a rebreathing bag that is attached to the spirometer prior to the examination.
Figure 7. Rebreathing bag and soda lime absorber used in the multi breath helium dilution
method
Jaeger MasterScreen® PFT Version4.1 Product Information Manual p 32
The carbon dioxide concentration in the circuit should be kept below 0.5 % during testing to avoid
patient discomfort and hyperpnoea. The activity of the carbon dioxide and water absorbers should be
assured before each test. The quality of the absorbers may also be secured by replacing the absorbent
after a specified number of tests. (14)
29
The operational principle of the spirometer is shown in figure 7. Oxygen was added automatically
during the measurements in order to maintain a constant concentration of oxygen in the patient-
spirometer-system, carbon dioxide and water vapour were absorbed with soda lime. (6) During the
equilibration period, the helium concentration was noted every 15 s and the measurement was ended
when the helium concentration was increasing by less than 0.02 % in 30 s. (14)The BodyScreen II
plethysmograph is a volume-constant body plethysmograph. It can be used for all standard spirographic
and plethysmographic tests. During spirometric measurements the door may be open but during
plethysmographic measurements the patient is sitting in the closed box. The box is therefore equipped
with a loudspeaker/intercom, so that the patient can communicate with the technician. Eye-contact
between the two of them is also very important. The volume of the plethysmograph, also called body-
box must be calibrated every morning. This should be done after a 60 minute warm-up.
All volunteers participated in measurements with all three techniques. The results; numerical values
and percentages of the reference values achieved and medical statements were copied and the values of
the parameters in focus entered into SPSS (Statistical Package for Social Sciences) where also the
statistical processing was made with a paired t-test. For the ANOVAanalysis software R was used. The
values used in the study were the mean values, in the single breath helium dilution method the mean
out of two analysis not differing more than 5 %, in the plethysmography, the mean out of five
technically successful blows. Only the MB measurements were made once in each patient, accordingly
to laboratory protocol.
30
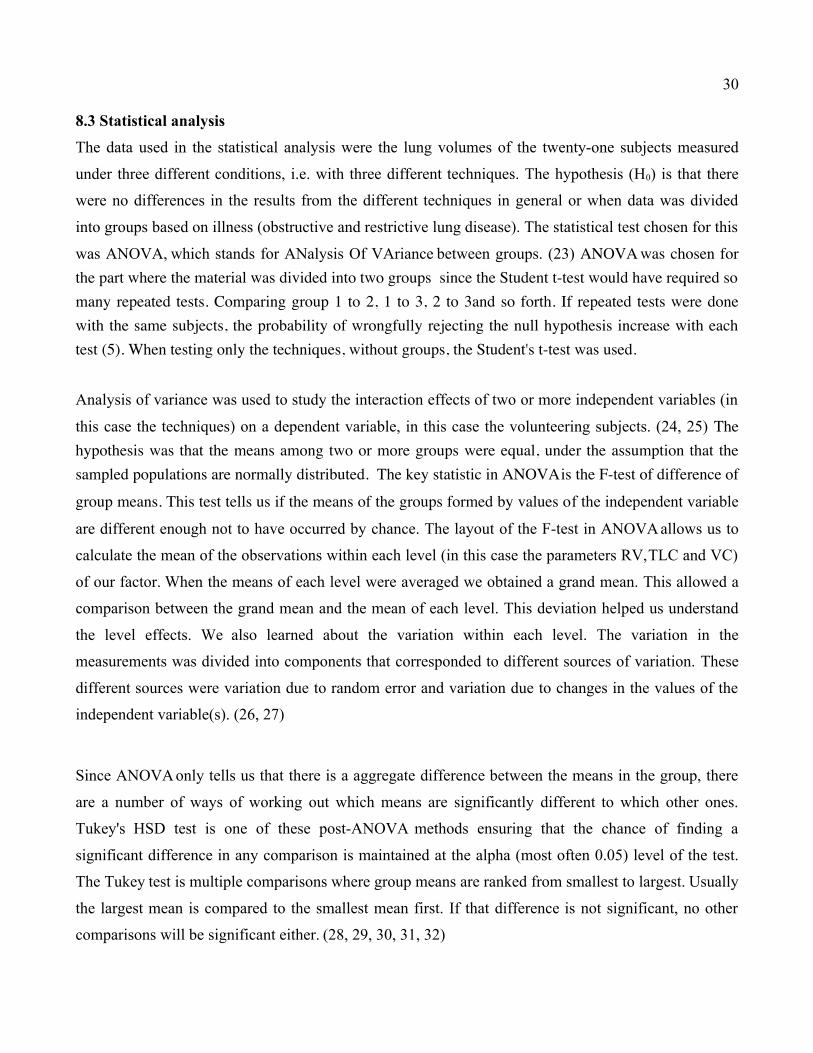
8.3 Statistical analysis
The data used in the statistical analysis were the lung volumes of the twenty-one subjects measured
under three different conditions, i.e. with three different techniques. The hypothesis (H0) is that there
were no differences in the results from the different techniques in general or when data was divided
into groups based on illness (obstructive and restrictive lung disease). The statistical test chosen for this
was ANOVA, which stands for ANalysis Of VAriance between groups. (23) ANOVAwas chosen for
the part where the material was divided into two groups since the Student t-test would have required so
many repeated tests. Comparing group 1 to 2, 1 to 3, 2 to 3and so forth. If repeated tests were done
with the same subjects, the probability of wrongfully rejecting the null hypothesis increase with each
test (5). When testing only the techniques, without groups, the Student's t-test was used.
Analysis of variance was used to study the interaction effects of two or more independent variables (in
this case the techniques) on a dependent variable, in this case the volunteering subjects. (24, 25) The
hypothesis was that the means among two or more groups were equal, under the assumption that the
sampled populations are normally distributed. The key statistic in ANOVAis the F-test of difference of
group means. This test tells us if the means of the groups formed by values of the independent variable
are different enough not to have occurred by chance. The layout of the F-test in ANOVAallows us to
calculate the mean of the observations within each level (in this case the parameters RV,TLC and VC)
of our factor. When the means of each level were averaged we obtained a grand mean. This allowed a
comparison between the grand mean and the mean of each level. This deviation helped us understand
the level effects. We also learned about the variation within each level. The variation in the
measurements was divided into components that corresponded to different sources of variation. These
different sources were variation due to random error and variation due to changes in the values of the
independent variable(s). (26, 27)
Since ANOVAonly tells us that there is a aggregate difference between the means in the group, there
are a number of ways of working out which means are significantly different to which other ones.
Tukey's HSD test is one of these post-ANOVA methods ensuring that the chance of finding a
significant difference in any comparison is maintained at the alpha (most often 0.05) level of the test.
The Tukey test is multiple comparisons where group means are ranked from smallest to largest. Usually
the largest mean is compared to the smallest mean first. If that difference is not significant, no other
comparisons will be significant either. (28, 29, 30, 31, 32)
31
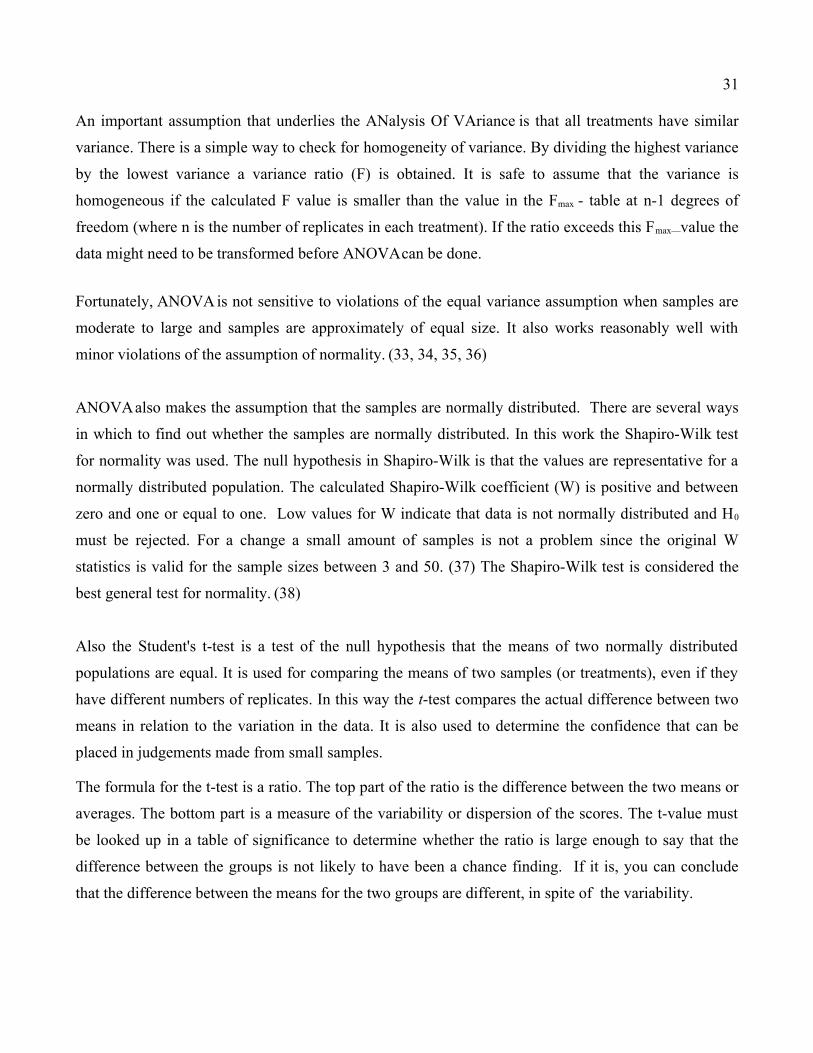
An important assumption that underlies the ANalysis Of VAriance is that all treatments have similar
variance. There is a simple way to check for homogeneity of variance. By dividing the highest variance
by the lowest variance a variance ratio (F) is obtained. It is safe to assume that the variance is
homogeneous if the calculated F value is smaller than the value in the Fmax - table at n-1 degrees of
freedom (where n is the number of replicates in each treatment). If the ratio exceeds this Fmax—value the
data might need to be transformed before ANOVAcan be done.
Fortunately, ANOVAis not sensitive to violations of the equal variance assumption when samples are
moderate to large and samples are approximately of equal size. It also works reasonably well with
minor violations of the assumption of normality. (33, 34, 35, 36)
ANOVAalso makes the assumption that the samples are normally distributed. There are several ways
in which to find out whether the samples are normally distributed. In this work the Shapiro-Wilk test
for normality was used. The null hypothesis in Shapiro-Wilk is that the values are representative for a
normally distributed population. The calculated Shapiro-Wilk coefficient (W) is positive and between
zero and one or equal to one. Low values for W indicate that data is not normally distributed and H0
must be rejected. For a change a small amount of samples is not a problem since the original W
statistics is valid for the sample sizes between 3 and 50. (37) The Shapiro-Wilk test is considered the
best general test for normality. (38)
Also the Student's t-test is a test of the null hypothesis that the means of two normally distributed
populations are equal. It is used for comparing the means of two samples (or treatments), even if they
have different numbers of replicates. In this way the t-test compares the actual difference between two
means in relation to the variation in the data. It is also used to determine the confidence that can be
placed in judgements made from small samples.
The formula for the t-test is a ratio. The top part of the ratio is the difference between the two means or
averages. The bottom part is a measure of the variability or dispersion of the scores. The t-value must
be looked up in a table of significance to determine whether the ratio is large enough to say that the
difference between the groups is not likely to have been a chance finding. If it is, you can conclude
that the difference between the means for the two groups are different, in spite of the variability.
32
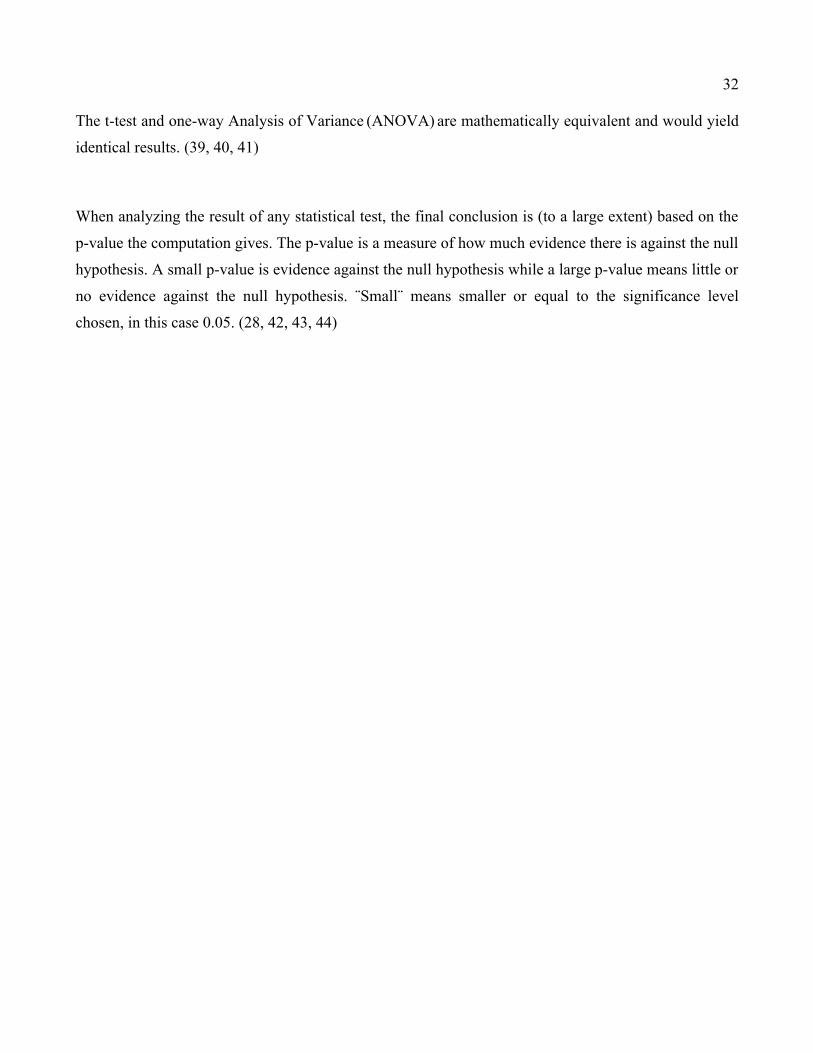
The t-test and one-way Analysis of Variance (ANOVA) are mathematically equivalent and would yield
identical results. (39, 40, 41)
When analyzing the result of any statistical test, the final conclusion is (to a large extent) based on the
p-value the computation gives. The p-value is a measure of how much evidence there is against the null
hypothesis. A small p-value is evidence against the null hypothesis while a large p-value means little or
no evidence against the null hypothesis. ¨Small¨ means smaller or equal to the significance level
chosen, in this case 0.05. (28, 42, 43, 44)
33
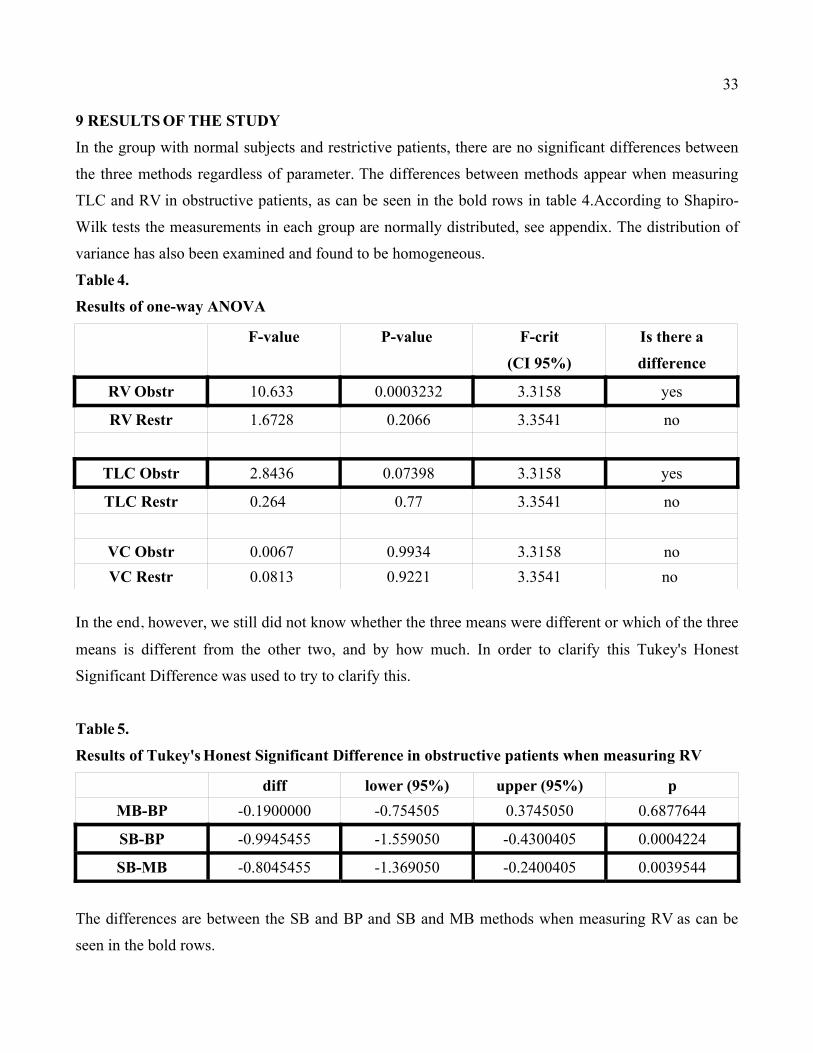
9 RESULTSOF THE STUDY
In the group with normal subjects and restrictive patients, there are no significant differences between
the three methods regardless of parameter. The differences between methods appear when measuring
TLC and RV in obstructive patients, as can be seen in the bold rows in table 4.According to Shapiro-
Wilk tests the measurements in each group are normally distributed, see appendix. The distribution of
variance has also been examined and found to be homogeneous.
Table 4.
Results of one-way ANOVA
F-value P-value F-crit
(CI 95%)
Is there a
difference
RVObstr 10.633 0.0003232 3.3158 yes
RVRestr 1.6728 0.2066 3.3541 no
TLC Obstr 2.8436 0.07398 3.3158 yes
TLC Restr 0.264 0.77 3.3541 no
VC Obstr 0.0067 0.9934 3.3158 no
VC Restr 0.0813 0.9221 3.3541 no
In the end, however, we still did not know whether the three means were different or which of the three
means is different from the other two, and by how much. In order to clarify this Tukey's Honest
Significant Difference was used to try to clarify this.
Table 5.
Results of Tukey'sHonest Significant Difference in obstructive patients when measuring RV
diff lower (95%) upper (95%) p
MB-BP -0.1900000 -0.754505 0.3745050 0.6877644
SB-BP -0.9945455 -1.559050 -0.4300405 0.0004224
SB-MB -0.8045455 -1.369050 -0.2400405 0.0039544
The differences are between the SB and BP and SB and MB methods when measuring RV as can be
seen in the bold rows.
34
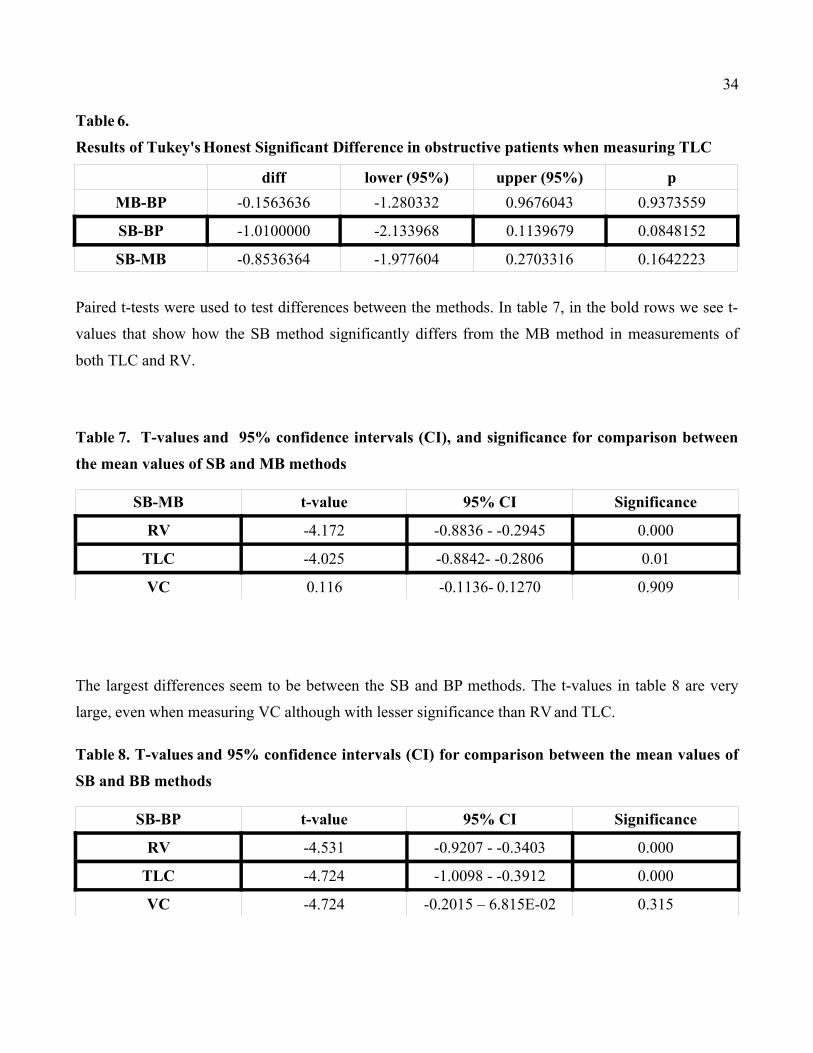
Table 6.
Results of Tukey'sHonest Significant Difference in obstructive patients when measuring TLC
diff lower (95%) upper (95%) p
MB-BP -0.1563636 -1.280332 0.9676043 0.9373559
SB-BP -1.0100000 -2.133968 0.1139679 0.0848152
SB-MB -0.8536364 -1.977604 0.2703316 0.1642223
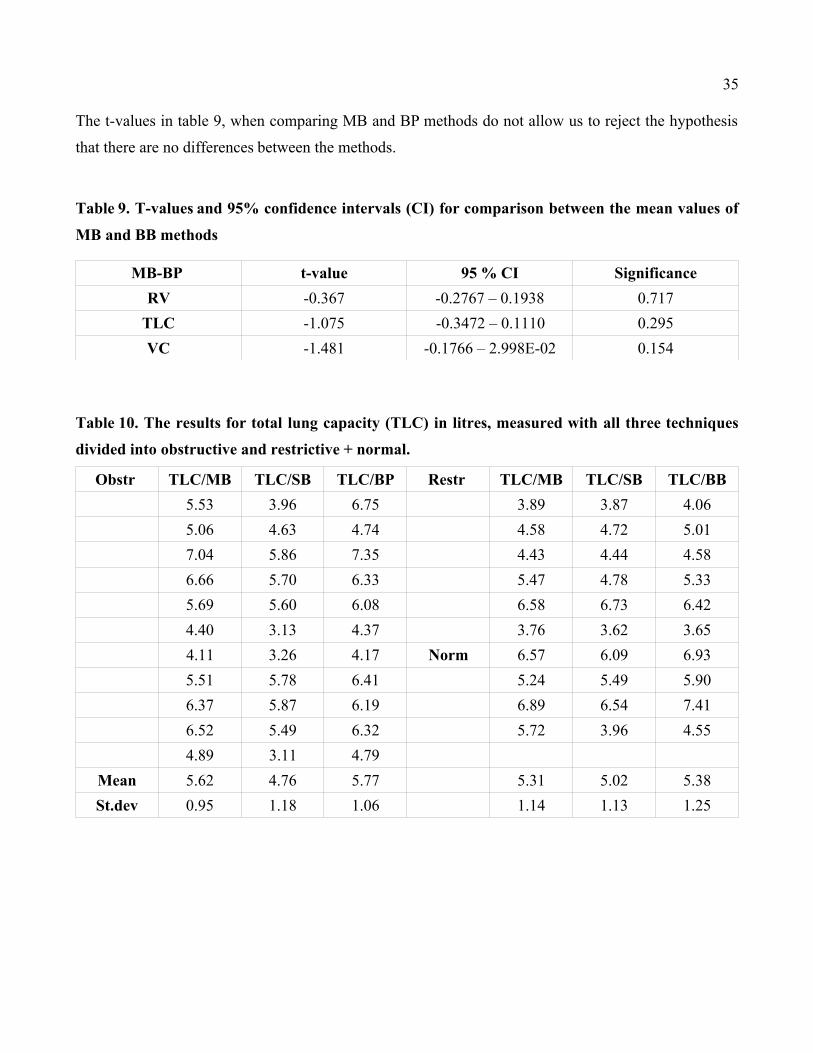
Paired t-tests were used to test differences between the methods. In table 7, in the bold rows we see t-
values that show how the SB method significantly differs from the MB method in measurements of
both TLC and RV.
Table 7. T-values and 95% confidence intervals (CI), and significance for comparison between
the mean values of SB and MB methods
SB-MB t-value 95% CI Significance
RV -4.172 -0.8836 - -0.2945 0.000
TLC -4.025 -0.8842- -0.2806 0.01
VC 0.116 -0.1136- 0.1270 0.909
The largest differences seem to be between the SB and BP methods. The t-values in table 8 are very
large, even when measuring VC although with lesser significance than RVand TLC.
Table 8. T-values and 95% confidence intervals (CI) for comparison between the mean values of
SB and BB methods
SB-BP t-value 95% CI Significance
RV -4.531 -0.9207 - -0.3403 0.000
TLC -4.724 -1.0098 - -0.3912 0.000
VC -4.724 -0.2015 – 6.815E-02 0.315
35
The t-values in table 9, when comparing MB and BP methods do not allow us to reject the hypothesis
that there are no differences between the methods.
Table 9. T-values and 95% confidence intervals (CI) for comparison between the mean values of
MB and BB methods
MB-BP t-value 95 % CI Significance
RV -0.367 -0.2767 – 0.1938 0.717
TLC -1.075 -0.3472 – 0.1110 0.295
VC -1.481 -0.1766 – 2.998E-02 0.154
Table 10. The results for total lung capacity (TLC) in litres, measured with all three techniques
divided into obstructive and restrictive + normal.
Obstr TLC/MB TLC/SB TLC/BP Restr TLC/MB TLC/SB TLC/BB
5.53 3.96 6.75 3.89 3.87 4.06
5.06 4.63 4.74 4.58 4.72 5.01
7.04 5.86 7.35 4.43 4.44 4.58
6.66 5.70 6.33 5.47 4.78 5.33
5.69 5.60 6.08 6.58 6.73 6.42
4.40 3.13 4.37 3.76 3.62 3.65
4.11 3.26 4.17 Norm 6.57 6.09 6.93
5.51 5.78 6.41 5.24 5.49 5.90
6.37 5.87 6.19 6.89 6.54 7.41
6.52 5.49 6.32 5.72 3.96 4.55
4.89 3.11 4.79
Mean 5.62 4.76 5.77 5.31 5.02 5.38
St.dev 0.95 1.18 1.06 1.14 1.13 1.25
36
In the objectives of this study was described an evaluation of the usefulness of the MB method by
comparing it to the SB and BP methods. The comparison of methods has been performed at several
levels. The results of the measurements made at the laboratory of Clinical Physiology at Meilahti
hospital are presented above, in tables 4-8. Results of the comparison based on current literature and
publications are presented in Table 1, page 22. Based on the frame of reference given by professional
literature, periodicals covering clinical physiology and the results of the statistical analysis it should be
stated that the measuring of the above mentioned static lung volumes with only the single breath
helium dilution method can not be considered a satisfactory practice.
37
10 RELIABILITY OF THE STUDY
It is customary and not unreasonable to define analytic goals in terms of accuracy and precision. The
measurements and the results in this study were effected by a variety of random and systematic errors
occurring at all possible stages of the examinations.
The precision error, usually denoted reproducibility, is the numerical difference between successive
measurements. The accuracy error is the systematic difference between the true and the measured
value. This accuracy may be improved by calibrating the instrument, i.e. the act of checking it against a
known standard. (6) In this study, all instruments had been calibrated every day in accordance to the
quality control protocols used at the laboratory of Clinical Physiology at Meilahti hospital.
Sources of error specific to the MB method could be traced to the gases used in the method, for
instance holes in the analyser bag or leaks elsewhere. It was also important to look out for the humidity
gathered in the hoses. Due to the duration of the test, water vapour may condense on the insides of the
hoses, causing an underestimation of the volume (Specialist Päivi Piirilä, private communication
26/05/04). It was also important that the absorption of O2 and CO2 functioned properly as the volume of
the circuit (spirometer and patient volumes) must stay constant. Water vapour may also damage the
helium analyser.
As the subject exhaled into a spirometer, the air he or she exhales was measured at atmospheric
pressure at room temperature. At room temperature water vapour pressure is normally 24 mm Hg.
These conditions are described as ambient temperature saturated (ATPS). The volumes exhaled were
however still at body temperature, where water vapour pressure was 47 mm Hg. The volumes
measured needed thus to be corrected to BTPS from ATPS. It is important that this conversion had been
thoroughly tested and that room temperature and barometric pressure were checked at least once a day
with validated instruments. (45)
It has been found that the N2 concentration in the spirometer increases due to the movement of helium
into the lungs, thus displacing N2 to the outside. If the thermal conductivity analyser is sensitive to N2
this may cause an overestimation of FRC. The helium absorbed from the lungs and the excess of CO2

38
production caused by a respiratory quote smaller than 1.0 will lead to negligible overestimations.
Another cause of overestimation of FRC was connected to the ERV-VCmanoeuvre performed when
helium and FRC levels were stable and the test was reaching its end. The patient was asked to exhale
thoroughly, to breathe in to a maximum, to exhale to a maximum and then to continue breathing quite
normally. If the patient did not exhale properly, FRC will be overestimated. (45, 46)
39
11 DISCUSSION
The aim of the study was to evaluate the MB method. This evaluation was motivated by the need to
determine static lung volumes more reliably than with the single breath helium dilution method. The
reliability of the MB method was examined by comparing the MB method to the SB method and BP,
the latter being used as a standard. Twenty-one subjects volunteered to be examined by all three
methods. The frame of reference was built on information gathered from professional literature and
current periodicals.
The results of the statistical tests told us there were differences among the methods and interestingly
enough these differences were in the group of obstructive patients. Since ANOVAdid not tell us where
(between which of the methods) these differences were, Tukey's Honest Significant Difference was
used to try to clarify this. (All of the Tukey HSD results can be seen in appendix 1.) The differences are
between the SB and BP methods when measuring both RVand TLC. There is also a difference between
the SB and MB methods when measuring RV.
As for the t-tests, they were made without dividing the patient material into groups. The results were
included since they required only two t-tests per comparison and parameter and because they give
evidence that supports our suggestion of the MB and BP methods being equal. Perhaps most
importantly they show the great difference between the MB and SB methods. It could be described as
an expected finding, considering the frame of reference but it must be said that the extent of the
differences was a surprise.
In the comparison between both SB and MB and SB and BP the only parameter were there is no
difference is VC. The t-test suggests in both cases the results from measuring TLC and RV with the
two methods are not compatible and has good significance (see tables 5 and 6). The only comparison
where H0 could not be rejected was the one between MB and BP, table 9. The t-values are not as far
¨out¨ as the t-values in the other comparisons but the p-values do not allow us to reject the hypothesis
of sameness.
Table 10 shows TLC values from all patients, and was included to exemplify how the SB method gives
TLC values more than 1 l smaller than MB and BB among the obstructive patients. The means from
restrictive and normal patients differ much less.
40
The study must be considered successfully completed since the suggestion that there was no difference
between estimates made by MB and BB could not be rejected. ANOVA, the t-test and Tukey's HSD all
gave very similar results. The statistical results of the study were in line with the information gathered
from reference literature. It was also gratifying that the results were unanimous and did not contradict
each other and that theory and practice supported each other.
What should have been made differently? The weakness of the study was the small amount of subjects
and the insufficient measurements of reproducibility.
The reproducibility of the MB method was not evaluated thoroughly enough in this study. There was
very little information available in the literature upon which to base reproducibility standards for the
MB method in measurements for either clinical or research purposes. There was also a great need for
base recommendations for the number of tests that should be performed in each patient. Questions that
arose were what magnitude of change in the results are of clinical importance, how is reproducibility
affected by patient stature, age, disease state and posture, or how much time is required for helium
washout to occur between measurements.
However, unpublished data from same-day duplicate analysis of FRCs using the MB method gave
coefficients of variation (CVs) of 5 % and only slightly larger, 6 % in patients with COPD. There are
also reports on waiting periods of 5 and 8 minutes between duplicate measurements and no significant
differences in volumes. Helium retained in the lungs would cause the second FRC to be smaller than
the first, which was not the case in our study.(14)
The accuracy of both the MB method and BP has been questioned in the presence of airway obstruction
but the difference in obtained values has mainly been interpreted as a systematic error of the MB
method. (6, 16, 18, 47) At several occasions it has however been shown that factors that lead to
overestimation of lung volumes do occur in connection to all three methods. For instance,
overestimation of lung volumes may have been caused in earlier studies, when patients were asked to
pant (not breathe) against the closed valve. The high panting frequency could have been the cause of
the larger lung volumes obtained with BP. This cannot however be the case in studies where constant
volume variable pressure pletysmographs have been used. Also in these studies the larger lung volumes
have been obtained with plethysmography. When all three methods have advantages and disadvantages
41
it should be investigated which one is the one with least faults or in which one the over-and under
estimations are easiest to asses and thereby correct. In the material used in this particular study, it
appeared to be more disadvantages with the plethysmography method. This may very well have its
explanation in the prevalence of the method, which is much larger than the one of the MB method.
When establishing whether the volumes measured in an individual fall within a range to be expected
for a healthy person, reference values play an important role. In the case of the MB method at Meilahti,
there are two sets of reference values in use. One of them, the prediction equations reported by Grimby
and Söderholm in Acta Medica Scandinavica in 1963 have in a published comparison of prediction
equations been shown to give results tending to the underestimation of VC, FRC, RV and TLC, mainly
in women. (20) Also Grimby and Söderholm in their time compared results of previous spirometric
studies and observed large variations. Most authors use different models without stating why the
specific model was preferred. The general requirements of incorporating terms for age, sex, height and
sometimes ethnic origin still give a lot of opportunity for variation.
The equations should be derived from a healthy and representative population tested by standardised
methods. “Healthy” means a person without present or previous conditions that affect their lung
function and with no history of smoking. The number of subjects included should be large enough and
the material subjected to appropriate statistic analysis as the usefulness of such reference equations
depends critically on the size and comparability of the reference population. However, a review of
reference values for static lung volumes shows remarkable discrepancies in predicted values among
different authors, which implies differences in selection of subjects, methods and techniques. The level
at which the result of an individual test should be considered abnormal is also under some contention,
the ideal reference data being the pre morbid lung function of the patient. (2, 20)
The other set of reference values was reported by Viljanen et al in 1982 and made for the Finnish
population. They are however acquired by using the SB method. As can be seen in this work and in the
frame of reference presented, the SB method tends to underestimate lung volumes, especially in
patients with obstructive lung disease. Prediction equations should be derived from a healthy and
representative population with the same technique as the examination where it will be applied.
More recent studies have also shown the importance of estimating TLC as increased residual volume
42
appears to be an important characteristic for determining suitability for lung reduction in patients with
COPD. (16) As COPD is steadily increasing and most probably will continue doing so, alternatives to
the treatment available today should be carefully examined.
As none of the existing sets of prediction equations fulfil the requirements established on high quality
lung function testing there is a challenging task in developing new reference values. A thorough
evaluation of the reproducibility of the method - comparisons including normal subjects as well as
patients with varying kinds and severity of disease will hopefully also lead to a new look on the
reliability and usefulness of the method, thereby increasing the amount of examinations performed.
REFERENCES
1. Yernault, J-C - Pride, N – Laszlo G 2000: How the measurement of residual volume developed
after Davy (1800). – The European Respiratory Journal 3 (16). 561-564.
2. Brewis, R A L - Gibson, G J - Geddes, D M 1990: Respiratory Medicine. London, England. W
B Saunders. 229-236
3. Berne, Robert M – Levy,Matthew N 1998: Physiology. Fourth edition. St. Louis, Missouri.
Mosby. 517-544.
4. Moore, Keith L – Dalley, Arthur F 1999. Clinically Oriented Anatomy. Fourth edition.
Baltimore, Maryland Lippincott Williams and Wilkins. 62-113
5. Ganong, William F 1999: Review of Medical Physiology. Nineteenth edition. Stamford,
Conetticut, Appleton & Lange. 617-633.
6. Quanjer, P H – Tammeling, G J – Cotes, J E – Pedersen, O F – Peslin, R – Yernault, J-C 1993:
Lung volumes and forced ventilatry flows. Standardized Lung Function testing.
The European Respiratory Journal 6 (16). 6-40.
7. Sovijärvi, Anssi – Uusitalo, Arto – Länsimies, Esko – Vuori, Ilkka (toim.) 1994. Kliininen
Fysiologia. Jyväskylä: Kustannus Oy Duodecim.
8. Guyton, Arthur C – Hall, John E 1996: Textbook of Medical Physiology. Ninth edition.
Philadelphia, Pennsylvania W B Saunders Company. 477-542.
9. Rhoades, Rodney A – Tanner,George A 1995: Medical Physiology. Boston (Mass): Little,
Brown and Company. 341-366.
10. Andreoli, T E – Bennett, Claude – Carpenter, Charles C J – Plum, Fred 1997: Cecil Essentials
of Medicine. Fourth edition. Philadelphia, Pennsylvania. W B Saunders Company.
111-154.
11. Kilburn, K H – Miller, A – Warshaw,R H 1993: Measuring lung volumes in advanced
asbestosis: comparability of plethysmographic and radiographic versus helium
rebreathing and single breath methods. Respiratory Medicine 2 (87). 115-120.
12. Andreoli, T E – Carpenter, C C J – Griggs R C, Loscalzo J 2001: Cecil Essentials of Medicine.
Fifth edition. Philadelphia, Pennsylvania. W B Saunders Company. 194-197.
13. Punjabi, Naresh M – Shade, David – Wise, Robert 1998: Correction of Single-Breath Helium
Lung Volumes in Patients With Airflow Obstrucion. Chest 3 (114). 907-918
14. Brown, R – Leith, D E – Enright, P L 1998: Multiple breath helium dilution measurement of
lung volumes in adults. The European Respiratory Journal 11 (16). 246-255.
15. Forster, R – DuBois, A – Briscoe, W – Fisher A 1986: Physiologic Basis of Pulmonary Function
Tests. Third edition. YearBook Medical Publishers Inc, Chicago, Illinois.
16. Schünemann, H J – Dmochowski, J – Campbell, L A – Grant, B J B 2003: A novel approach for
quality control of total lung capacity in the clinical pulmonary function laboratory:
A study in a veteran population. Respirology 2003:8, 365-370
17. Laboratory protocol at the Finnish Institute of Occupational Health
18. Andersson, L G – Ringqvist, I – Walker,A 1988: Total lung capacity measured by body
plethysmography and by the helium dilution method. A comparative study in
different patient groups. Clinical Physiology 2(8). 113-120.
19. Roberts, C M – MacRae, K D – Seed, W A 1990: Multi-breath and single breath helium dilution
lung volumes as a test of airway obstruction. The European Respiratory Journal 3
(5). 515-520.
20. Cordero, P J – Morales, P – Benlloch, E – Miravet L – Cebrian J 1999: Static lung volumes:
Reference values from a latin population of Spanish decent. Respiration
1999;66:242-250
21. Atrial Fibrillation Foundation, Patient Information, Medications, Amiodarone
http://www.affacts.org/Medications/amiodarone.html viewed 27.05.2006
22. Amiodarone, in Wikipedia, the Free Encyclopedia
http://en.wikipedia.org/w/index.php?title=Amiodarone&oldid=161259834,
viewed 27.05.2006
23. HyperStat Online Textbook, Chapter 12 Introduction to ANOVA,David Lane, Associate
Professor of Psychology, Statistics, and Management at Rice University, Houston,
Texas, USA http://davidmlane.com/hyperstat/intro_ANOVA.htmlviewed
01.04.2006
24. Univariate GLM, ANOVA,and ANCOVA,Quantitative Research in Public Administration,
David Garson, Professor of Public Administration, North Carolina State
University, Raleigh, North Carolina, USA
http://www2.chass.ncsu.edu/garson/PA765/anova.htmviewed 01.04.2006
25. Investigating Statistics, Chapter 11, One-WayAnalysis of Variance (ANOVA),Department of
Educational Psychology, School Psychology, and Special Education (ESPSE)
Robert L. Hale Professor of Education, Pennsylvania State University, State
College, Pennsylvania, USA
http://espse.ed.psu.edu/edpsych/faculty/rhale/statistics/Chapters/Chapter11/Chap1
1.html#ANOVA%20Calculation%20Formulas viewed 19.05.2007
26. Engineering Statistics Handbook, 1-WayANOVAoverview, p-value, Technical Editors Carroll
Croarkin, Statistical Engineering Division, Information Technology Laboratory,
NIST and Paul Tobias - Statistical Methods Group, SEMATECH
http://www.itl.nist.gov/div898/handbook viewed 01.04.2006, 18.5.2007,
12.06.2007
27. Testing Normality of Data using SAS® Guangbin Peng, Eli Lilly and Company, Indianapolis,
Indiana, USA http://www.lexjansen.com/pharmasug/2004/posters/po04.pdf
viewed 12.06.2007
28. StAT;Steve's Attempt to Teach Statistics, Hypothesis testing, P-value, Steve Simon, Ph. D,
Research Biostatistician Children's Mercy Hospitals & Clinics, Kansas City,
Missouri, USA http://www.childrens-mercy.org/stats/definitions/pvalue.htm
viewed 14.06.2007
29. What is a P-value? GraphPad Software
http://www.graphpad.com/articles/pvalue.htm viewed 14.06.2007
30. Distribution tables, F-distribution table, alpha .05
http://www.statsoft.com/textbook/sttable.html#f05 viewed 15.06.2007
31. Resources, Statistical Glossary, Tukey's HSD
http://www.statistics.com/resources/glossary/t/tukeyhsdtst.php viewed 17.06.2007
32. HyperStat Online Textbook, Chapter 12, Tests supplementing ANOVA,David Lane, Associate
Professor of Psychology, Statistics, and Management at Rice University, Houston,
Texas, USA http://davidmlane.com/hyperstat/B95999.html viewed 17.06.2007
33. Variance, in Wikipedia, the Free Encyclopedia,
http://en.wikipedia.org/w/index.php?title=Variance&oldid=160553090viewed
27.05.2006
34. Computing News, The Analysis of Variance is Changing, Assumptions, Robin High, Statistical
Programmer and Consultant, University of Oregon, Eugene, Oregon, USA
http://www.uoregon.edu/~robinh/glm01_assumpt.txt viewed 25.06.2007
35. The Really Easy Statistics Site, Statistical Tests, Student's t-test, comparing means of three or
more variables, Dr Jim Deacon, Molecular Plant Sciences, School of Biological
Sciences, University of Edinburgh, UK
http://www.biology.ed.ac.uk/research/groups/jdeacon/statistics/tress4a.html
21.06.2007, 25.06.2007
36. StatPrimer, equal variance assumption in ANOVA,Post hoc Comparisons, Burt Gerstman,
Professor of Epidemiology, Department of Health Science, San José State
University, San José, California, USA
http://www.sjsu.edu/faculty/gerstman/StatPrimer/anova-b.pdf viewed 25.06.2007
37. Testing Normality of Data using SAS® Guangbin Peng, Eli Lilly and Company, Indianapolis,
Indiana, USA http://www.lexjansen.com/pharmasug/2004/posters/po04.pdf
viewed 12.06.2007
38. Technical Guidance Manual For Hydrogeologic Investigations and Ground WaterMonitoring,
Chapter 13 Statistics for Ground Water Quality Comparison, Division of Drinking
and Ground Waters, Columbus, Ohio, USA
http://www.epa.state.oh.us/ddagw/Documents/TGM-13.pdf viewed 12.06.2007
39. Statistics to Use, ANOVA:ANalysisOf VAriancebetween groups, TomKirkman, Professor of
Physics College of Saint Benedict and Saint John's, St. Joseph, Minnesota, USA
http://www.physics.csbsju.edu/stats/anova.html viewed 24.03.2007
40. The Really Easy Statistics Site, Statistical Tests, Student's t-test, comparing means of three or
more variables, Dr Jim Deacon, Molecular Plant Sciences, School of Biological
Sciences, University of Edinburgh, UK
http://www.biology.ed.ac.uk/research/groups/jdeacon/statistics/tress4a.html
viewed 21.06.2007, 25.06.2007
41. Research Method Knowledge Base, Analysis, Inferential Statistics, The t-test, Professor
WilliamM.K. Trochim, Department of Policy Analysis and Management, Cornell
University, Ithaca, New York,USA
http://www.socialresearchmethods.net/kb/stat_t.php viewed 21.06.2007
42. On-line statistics, Analysis of Variance (ANOVA)Dr TedGaten - Principal Experimental
Officer, Department of Biology, University of Leicester, Leicester, UK
http://www.le.ac.uk/bl/gat/virtualfc/Stats/anova.html viewed 12.06.2007
43. The Basics of SPSS, ANOVA(Analysis of Variance),Kathryn C. Oleson Department Head,
Department of Psychology, Reed College, Portland, Oregon, USA
http://academic.reed.edu/psychology/RDDAwebsite/spssguide/anova.html
12.06.2007
44. p-value, in Wikipedia, the Free Encyclopedia
http://en.wikipedia.org/w/index.php?title=P-value&oldid=160510793, viewed
12.07.2007
45. Tisi, G M 1983. Pulmonary physiology in clinical medicine. Second edition. Baltimore,
Maryland. The Williams and Wilkins Company. 63-69
46. Miller, Albert 1986: Pulmonary function tests in clinical and occupational lung disease.
Orlando, Grune & Stratton. 77-84
47. García-Rio, F – Pino-García, J M – Serrano, S – Racionero, M A – Terreros-Caro, J G –
Alvarez-Sala, R – Villasante, C – Villamor J 1997: Comparison of helium dilution
and plethysmographic lung volumes in pregnant women. The European
Respiratory Journal 10 (16). 2371-2375.
Brewis, R A L, 1992: Lecture notes on respiratory Disease Fourth edition. Oxford, England. Blackwell
Scientific Publications.
Campbell, Michael J – Machin, David, 2000: Medical Statistics – a commonsense approach. Third
edition. Chichester, England. John Wiley & Sons, LTD
Chest 3 (114). 907-918.
Cliff, Ian J – Evans, Angela H – Pantin, Charles F A – Baldwin, David R 1999: Comparison of two
new methods for the measurement of lung volumes with two standard methods. Thorax 4
(54). 329-333.
Herrala, Jaakko - Hämäläinen, Päivi - Järvinen, Markku - Karivaara Eija 2000: Hengityshoito 4. 1.
painos. Hämeenlinna. Etelä-Hämeen Keuhkovammayhdistys ry.
Johansen, B – Björtuft, Ö – Boe, J 1993: Static lung volumes in healthy subjects assessed bu helium
dilution during occlusion of one mainstem bronchus. Thorax 4 (48). 381-384.
Kinnula, Vuokko – Tukianinen, Pentti – Laitinen, Lauri (toim.) 1996. Keuhkosairaudet. 9. painos.
Jyväskylä: Kustannus Oy Duodecim.
Löfgren, H – Näverskog, H 1999: Statistisk dataanalys med StatView för Windows och Macintosh.
Version fem. Studentlitteratur, Lund.
Stocks, J – Quanjer, P H 1995: Reference values for residual volume, functional residual capacity and
total lung capacity. The European Respiratory Journal 1995: 8, 492-506
Yernault, J-C - Pride, N – Laszlo G 2000: How the measurement of residual volume developed after
Davy (1800). – The European Respiratory Journal 3 (16). 561-564.
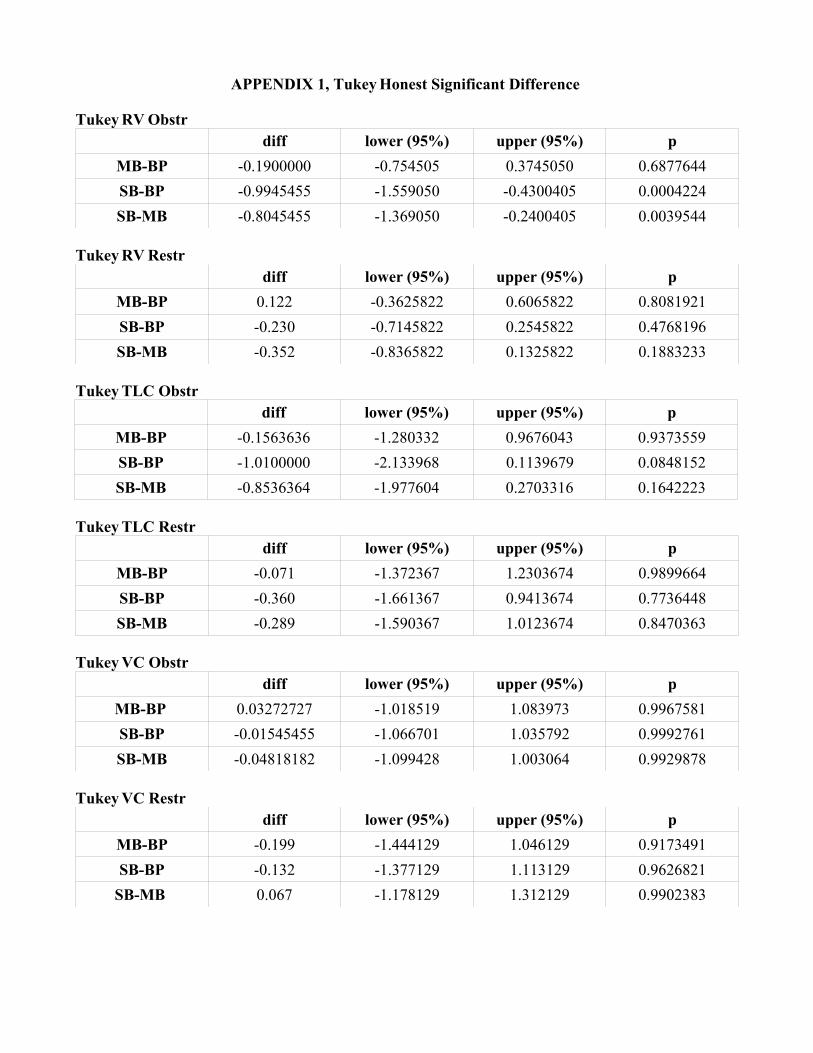
APPENDIX 1, TukeyHonest Significant Difference
TukeyRVObstr
diff lower (95%) upper (95%) p
MB-BP -0.1900000 -0.754505 0.3745050 0.6877644
SB-BP -0.9945455 -1.559050 -0.4300405 0.0004224
SB-MB -0.8045455 -1.369050 -0.2400405 0.0039544
TukeyRVRestr
diff lower (95%) upper (95%) p
MB-BP 0.122 -0.3625822 0.6065822 0.8081921
SB-BP -0.230 -0.7145822 0.2545822 0.4768196
SB-MB -0.352 -0.8365822 0.1325822 0.1883233
TukeyTLC Obstr
diff lower (95%) upper (95%) p
MB-BP -0.1563636 -1.280332 0.9676043 0.9373559
SB-BP -1.0100000 -2.133968 0.1139679 0.0848152
SB-MB -0.8536364 -1.977604 0.2703316 0.1642223
TukeyTLC Restr
diff lower (95%) upper (95%) p
MB-BP -0.071 -1.372367 1.2303674 0.9899664
SB-BP -0.360 -1.661367 0.9413674 0.7736448
SB-MB -0.289 -1.590367 1.0123674 0.8470363
TukeyVC Obstr
diff lower (95%) upper (95%) p
MB-BP 0.03272727 -1.018519 1.083973 0.9967581
SB-BP -0.01545455 -1.066701 1.035792 0.9992761
SB-MB -0.04818182 -1.099428 1.003064 0.9929878
TukeyVC Restr
diff lower (95%) upper (95%) p
MB-BP -0.199 -1.444129 1.046129 0.9173491
SB-BP -0.132 -1.377129 1.113129 0.9626821
SB-MB 0.067 -1.178129 1.312129 0.9902383
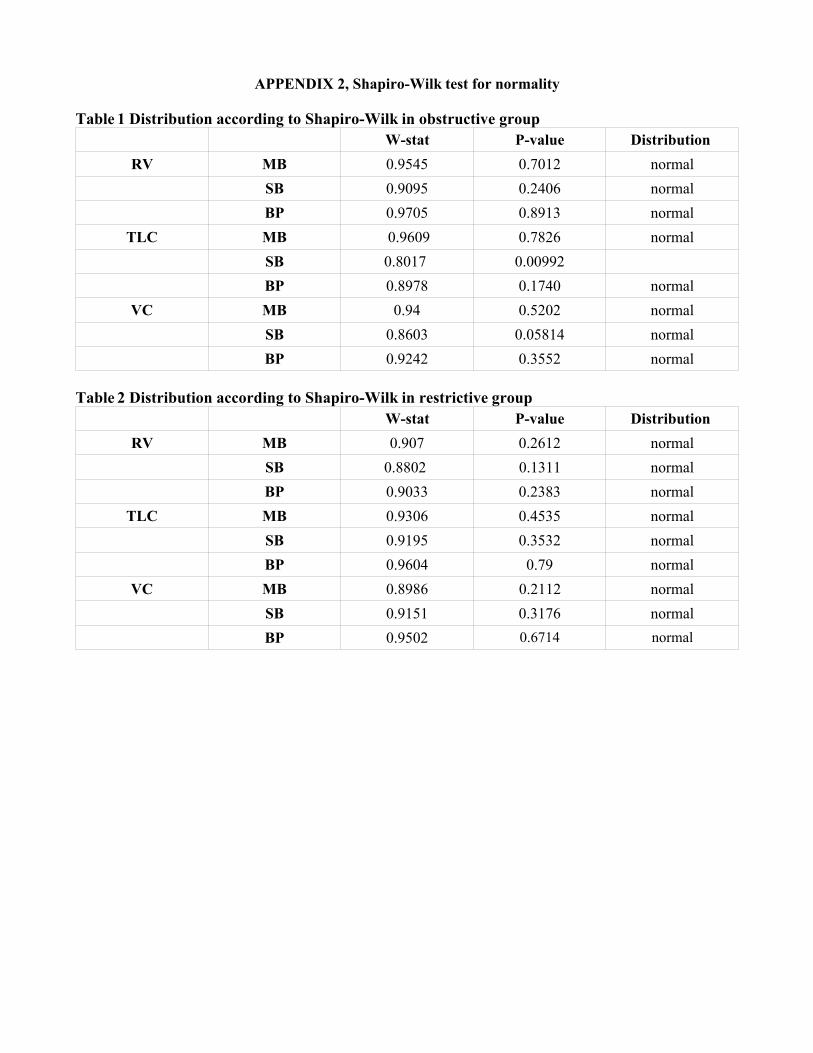
APPENDIX 2, Shapiro-Wilk test for normality
Table 1 Distribution according to Shapiro-Wilk in obstructive group
W-stat P-value Distribution
RV MB 0.9545 0.7012 normal
SB 0.9095 0.2406 normal
BP 0.9705 0.8913 normal
TLC MB 0.9609 0.7826 normal
SB 0.8017 0.00992
BP 0.8978 0.1740 normal
VC MB 0.94 0.5202 normal
SB 0.8603 0.05814 normal
BP 0.9242 0.3552 normal
Table 2 Distribution according to Shapiro-Wilk in restrictive group
W-stat P-value Distribution
RV MB 0.907 0.2612 normal
SB 0.8802 0.1311 normal
BP 0.9033 0.2383 normal
TLC MB 0.9306 0.4535 normal
SB 0.9195 0.3532 normal
BP 0.9604 0.79 normal
VC MB 0.8986 0.2112 normal
SB 0.9151 0.3176 normal
BP 0.9502 0.6714 normal


![Center For Hjerneskade...»Hjerneskaderehabilitering - en medicinsk teknologivurdering« [2] bidrager til en giftig cocktail i relation til en bekymrende udvikling, 2) at Sundhedsstyrelsen](https://img.pdfslide.us/doc/110x75/5ff1e2cffff35f6df06ac0f4/center-for-hjerneskade-hjerneskaderehabilitering-en-medicinsk-teknologivurdering.jpg)