Embed Size (px)
Citation preview

A COMPARISON OF ENERGY DENSITIESOF PREVALENT ENERGY SOURCES IN UNITSOF JOULES PER CUBIC METER
Bradley E. LaytonDepartment of Mechanical Engineering and Mechanics, Drexel University
Typically, the energy densities of solids or liquids such as coal and oil are measured in
dimensions of energy per unit volume or energy per unit mass, whereas solar, wind, and
hydroelectric sources are rated in dimensions of power per unit area. This article provides a
unifying framework for comparing several prevalent energy sources on an energy-per-unit
volume basis for the purpose of unifying conventional metrics. The energy density of oil is 35 to
45 gigajoules (10,000 kWh) per cubic meter*. When measured using the methods presented,
solar energy has a density of 1.5 microjoules per cubic meter, over twenty quadrillion times less
than oil. Human energy density is approximately 1000 J/m3, while other inexhaustibles such as
wind and tidal have energy densities of 0.5 to 50 J/m3. This article provides an educational
engineering mathematics framework for calculating energy densities of prevalent energy
sources. The goal is to provide a new perspective on how to compare energy sources on a
more fundamental basis. Finally, the article provides a method of estimating the dollars-per-
joule for natural resources versus human resources and concludes with commentary on how
political decisions may be affected by energy densities and energy costs.
Keywords: Energy density; Inexhaustible; Oil; Human power; Sustainability
INTRODUCTION
Dwindling oil supplies and concern over climate change caused by combustion-engine
emissions have sparked a new debate over alternative energy investment. If citizens, political
leaders, and policy makers are to be well informed, a basis of comparison in consistent units is
needed. We provide a basis for measuring energy density on a joules-per-cubic-meter basis and
then on a dollars-per-joule basis. From these two metrics, a volume of space or area of land and
its associated space above and below may be valued on a dollars-per-cubic-meter basis. With
this information, energy densities, and thus dollar values, may then be assigned to regions of the
world based upon variables such as local wind speed, solar flux, as well as fossil fuel prospects.
Energy as a state variable is typically categorized into chemical, electrical, mechanical,
radiant, thermal, nuclear, or relativistic. Since multiple energy modes may occupy the same
region of space, a volume that contains photons (i.e., light) and wind has both radiant energy
International Journal of Green Energy, 5: 438–455, 2008
Copyright � Taylor & Francis Group, LLC
ISSN: 1543-5075 print / 1543-5083 online
DOI: 10.1080/15435070802498036
*One gigajoule equals one billion joules, and there are 3,600,000 joules in a kWh. A cubic meter is about
half the volume of a kitchen refrigerator.
Address correspondence to Bradley E. Layton, Department of Mechanical Engineering and Mechanics,
3141 Chestnut St., 151G Curtis Hall, Philadelphia, PA 19104. E-mail: [email protected]
438
and mechanical energy. If a volume of space contains combustible material, such as
hydrocarbons (i.e., coal or oil), it contains chemical energy. Summing the energy densities
within a given volume of space for each mode within the natural environment, an appropriate
technology may be selected or developed to perform the extraction or procurement of that
volume. The cost to develop or acquire a given technology may then be used to evaluate
whether extraction is economically feasible based on an energy returned on energy invested
(EROEI) basis. History has shown that early EROEI numbers for oil are typically quite high,
but these numbers dwindle unless more efficient extraction technologies are developed
(Ruppert 2003). Likewise, alternative energy sources such as wind and solar typically have
very low or even negative EROEI ratios initially, because of the relatively low energy
densities of these sources, but over the course of their lifespans surpass fossil fuel-based
technologies because alternatives such as wind and solar technologies have only maintenance
costs, but no extraction costs other than initial land acquisition.
Typically, energy resources are categorized as either renewables or nonrenewables.
Traditional nonrenewables are oil, coal, natural gas, and uranium. Nature is still making
these, but at a rate far slower than human consumption. Energy sources traditionally
classified as renewable include solar, wind, ocean, and geothermal. In reality, these are
inexhaustible. True renewables are biofuels such as wood, soy-derived biodiesel, and
grain-derived ethanol (Hill et al. 2006). Inexhaustibles will be present for the next five
billion years. Oil is likely to dwindle significantly in the next one to two hundred years.
Indeed global ‘‘peak oil,’’ or the point at which we have exhausted half of the world’s oil
supply, was predicted to occur in 2008 (ASPO August 2004; Attarian 2002). Peak oil
occurred within the continental United States in 1970 to 1971, and in the Soviet Union in
the mid 1980s (Clark 2005). Indeed, it has been suggested that ‘‘the United States rode a
wave of liquid petroleum to win both world wars’’ (Yergin 1991).
The goals of the article are threefold: (1) to educate the readers inexperienced in
evaluating energy densities with elementary formulae for doing so, (2) to suggest to experts
a unifying method for measuring energy density values, and (3) to provide a framework for
measuring human versus technological energy densities.
REVIEW OF PREVALENT ENERGY SOURCES
Solar Energy Density
Our sun delivers to the earth a constant supply of 1,300 to 1,400 watts of power per
square meter (Berger 1978; Thekaekara 1975). A watt of power is equivalent to one joule
of energy per second. For example, it takes about 100 joules of energy to stand from a
sitting position, and about 300,000 joules to boil a quart of water. One square meter has
about the same area as ten square kitchen floor tiles. At the equator on a clear day, the
equivalent of thirteen 100-watt bulbs shines on this patch of ten tiles. This is enough power
to run all of the electrical appliances of an average American household. A typical American
household’s electrical energy consumption could theoretically be met by a patch of only five
kitchen–floor tile-sized solar panels. While this sounds promising, it is unfortunately only
valid for a home at the equator with twenty-four hours of sunlight per day. At latitudes farther
north and south, direct available solar power diminishes. At 40�N or 40�S, the amount of
power per square meter on a sunny day at noon may be half of that of the equator (NREL
1992). These latitudes represent a swath in the Northern Hemisphere through San Francisco,
Philadelphia, Madrid, Rome, and Beijing, and in the southern hemisphere through Buenos
PRACTICAL ENERGY DENSITY COMPARISONS 439
Aires and Sydney. With its southern tip at 35�S, all of Africa is north of 40�S. The U.S.
national average is closer to only 100–150 W/m2, or about 10% of the brightest days at the
equator.
What is the power density of solar energy? How much solar power per cubic meter is
there? The volume of the space between a one-meter-square patch on Earth and the center
of our orbit around the sun is 50 billion cubic meters (the earth is 150 billion meters from the
sun, or 4,000 earth circumferences). Dividing the usable 100 watts per square meter by this
volume, yields two-billionths of a watt per cubic meter. Sunlight takes about eight minutes
(499 seconds) to reach the earth. Multiplying 499 seconds by twenty-six billionths of a W/
m3 reveals that solar radiation has an energy density of 1.5 microjoules per cubic meter (1.5
· 10-6 J/m3). Indeed, the space between the earth’s surface and the sun is the most precious
to any photosynthetic organism or solar technologist. Just as a phototrophic plant living in
the shade quickly dies, someone who finds his solar panel in the shade quickly loses the
money invested in its purchase.
Energy Density of Wind and Waves
Wind is driven by changes in weather patterns, which in turn are driven by thermal
gradients. Tides are driven by fluctuations in gravity caused by lunar revolutions. The
energy densities of wind and water systems are proportional to the mass, m, moving
through them, and the square of the speed, v, of this mass, or ½mv2. At sea level, air with
a density of about one kilogram per cubic meter moving at five meters per second
(ten miles per hour) has a kinetic energy of 12.5 joules per cubic meter. Applying Betz’s
Law, which limits efficiency to 59% (Betz 1926), yields about seven joules per cubic
meter. Thus, wind energy on a moderately windy day is over a million times more
energy-dense than solar energy. This number may sound misleading at first when
comparing a residential wind turbine to a residential-sized solar panel in a sparsely
populated region. However, consider the following problem. To supply energy to a
densely populated area using only the footprint of the area, the maximum amount of
solar energy available is fixed; however, the amount of wind energy may be expanded by
stacking wind turbines as high as is mechanically feasible, thus justifying the energy per
unit volume basis.
There are two prevalent mechanisms for extracting tidal energy. In one system,
barrages move up and down, extracting energy with the rise and fall of the tides. On the
second type strategy, tidal stream systems act more like underwater wind turbines,
extracting energy from tidal waters as they move past. As with wind, the energy of a
moving volume of water is also ½mv2. Tidal systems have the advantage over wind systems
in that water is approximately one thousand times denser than air. Their disadvantage lies in
generally low tidal velocities of only ten centimeters per second to one meter per second.
Thus, a cubic meter of water, with a mass of about 1000 kg, yields an energy density of
about five joules per cubic meter for slow water1 and five hundred joules per cubic meter
for fast water2. These are also subject to Betz’s law and represent only peak values, so the
average energy densities are closer to one-half of a joule per cubic meter to fifty joules per
cubic meter, or about the same as wind.
1 kinetic energy (tidal low velocity) = ½ mv2 = ½ · 1000 kg · (0.1 m/s)2 = 5 joules.2 kinetic energy (tidal high velocity) = ½ mv2 = ½ · 1000 kg · (1 m/s)2 = 500 joules.
440 LAYTON
Geothermal Energy
The only way to extract thermal energy from the atmosphere is to construct an insulated
pipe between it and a reservoir at lower temperature (preferably a much lower one). This is
how geothermal heat pumps work. Typical ground temperature is 52�F (284 K). On a 90�Fday, such a system has a peak efficiency of 7%, and a power density of only 0.05 mW/m3
(Stopa and Wojnarowski 2006): typical surface power fluxes for geothermal wells are on the
order of 50 mW/m2 and have typical depths of 1 km. To find the energy density, a
characteristic time must be included. The time used should be that of the time required for
water being pumped into the ground to circulate through the system once. This number is on
the order of ten days (Sanjuan et al. 2006). The resulting energy density is 0.05 J/m3, or
roughly two to three orders of magnitude lower than wind or waves.
Human and Animal Energy Density
Well-fed humans consume between 2,500 to 4,500 Calories per day (10–20 MJ per
day). This represents a total metabolic power of 100 to 200 watts3. The volume of a human
is about 0.1 m3. Approximating the work that a human can do as the equivalent of walking
steadily at a rate of 2 m/s shows that a human has an energy density of 1,000 joules per cubic
meter4, or about twenty to two thousand times greater than wind and water, and about a
billion times greater than solar5 (Table 1).
Petroleum Energy Density
A single gallon of gasoline contains approximately forty megajoules of chemical
energy. Dividing energy by volume yields an energy density of ten billion joules per cubic
meter. Gasoline is ten quadrillion times more energy-dense than solar radiation, one
billion times more energy-dense than wind and water power, and ten million times more
energy-dense than human power.
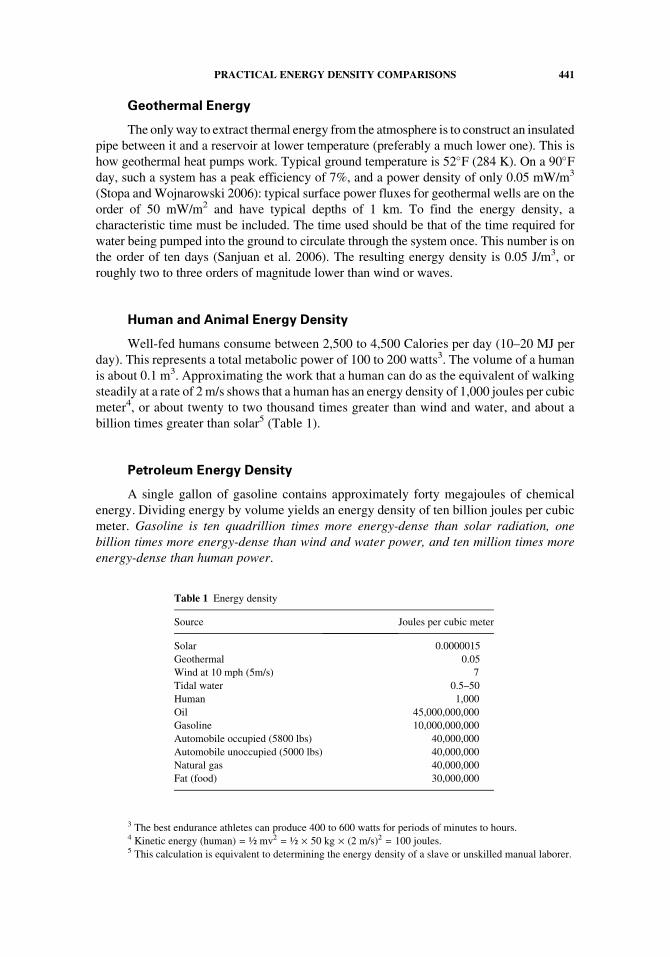
Table 1 Energy density
Source Joules per cubic meter
Solar 0.0000015
Geothermal 0.05
Wind at 10 mph (5m/s) 7
Tidal water 0.5–50
Human 1,000
Oil 45,000,000,000
Gasoline 10,000,000,000
Automobile occupied (5800 lbs) 40,000,000
Automobile unoccupied (5000 lbs) 40,000,000
Natural gas 40,000,000
Fat (food) 30,000,000
3 The best endurance athletes can produce 400 to 600 watts for periods of minutes to hours.4 Kinetic energy (human) = ½ mv2 = ½ · 50 kg · (2 m/s)2 = 100 joules.5 This calculation is equivalent to determining the energy density of a slave or unskilled manual laborer.
PRACTICAL ENERGY DENSITY COMPARISONS 441
How does the energy density of petroleum change when it is added to a system that
contains an automobile? The approximate volume of an average-sized car with (or without)
people is approximately ten cubic meters. After adding the volume of the vehicle carrying
ten gallons (0.04 cubic meters) of gasoline, the energy density of a gasoline-powered car is
still forty megajoules per cubic meter. Putting more people into the car such as in
carpooling means that a greater fraction of the fuel is being spent to move people rather
than metal, but it has no effect on the energy density of the system even if the amount of
work the occupants may be doing is considered (Layton et al. 2007). Thus, a car full of
people is one thousand times less energy-dense than the raw fuel but is still forty thousand
times more energy-dense than a human alone and over a trillion times more energy-dense
than the sun’s radiation. Coal, by comparison, has an energy density 50–75% that of oil.
Nuclear Energy Density
The energy density of nuclear energy can range from very great 1.5 · 1015 J/m3, for
purified uranium, to less than half a percent of this in the naturally occurring state.
Theoretically, the energy density in a nuclear reaction is E = mc2. When U235 splits in a typical
reactor, a very small mass is converted to radiant thermal energy. If all of the matter were being
converted to energy, the energy density would be about 1021 joules per cubic meter, or over ten
billion times more energy-dense than petroleum. The total global uranium available normalized
by the volume of the earth would likely render its energy density comparable to geothermal.
Comparison of Energy Sources
Fundamentally, the rate of solar influx is the upper limit on our natural energy
capture rate. Since cells may not be stacked, the best-case scenario of 100% capture of
1,300 watts per square meter yields a daily energy delivery of 14.3 · 1021 joules. We
currently use 1.17 · 1021 joules technologically per year. Note that before the discovery
of fire and the domestication of animals, the number was zero. An easy comparison is that
we as a species use less energy in a year than hits the planet in an hour (Lewis and Nocera
2006). This is equivalent to about one percent of one percent of the total solar incident
energy, or the equivalent of covering an area nearly the size of Texas with solar panels
that are 10% efficient.
HUMAN ENERGY CONSUMPTION
Home Energy Consumption
An average person eats ten million joules of energy in food per day and consumes about
200 million ‘‘technological joules’’ of energy per day (Lewis and Nocera 2006). For a
summary, see Table 2. The averages in some countries are currently above 1,000 MJ per
person per day (Ang and Liu 2006). As an example, the average Malaysian consumed 265 MJ
per day in 2000, while the average Pakistani consumed 56 MJ that year (Sari and Soytas
2007). By comparison, the average American was consuming over 650 MJ per day in 1950
(Marcotullio and Schulz 2007). The estimates of Haberl et al. (2006) (Haberl et al. 2006) are
about 550 MJ per day for Europeans, and 1200 MJ per day for U.S. citizens. As has been the
trend since the Industrial Revolution, this consumption rate is likely to continue to increase
and is typically positively correlated with gross domestic product (GDP).
442 LAYTON
The author’s August 2007 energy bill indicates 517 kWh (kilowatt-hours) of electrical
energy consumed. This is an average energy consumption rate of about 720 watts or nearly
one horsepower (746 watts): literally the power that a single horse can provide. The
author’s monthly household natural gas consumption rate was between one thousand and
twenty thousand cubic feet (300 cubic meters). A cubic meter of natural gas contains
about 40 megajoules of energy. Thus the author’s family of four consumes energy at a rate
of about 25 MJ per person per day at home. The household use of natural gas consumption
was about 4,000 watts, approximately six times the rate of electrical energy consumption.
How do we use this energy in our homes? On the inside of the door of most
refrigerators is a label listing the amperes, or peak electrical current the compressor
motor uses when starting. A typical refrigerator has a rating of 6.5 amps. Multiplying the
number of amps by 110 volts results in about 750 watts (one horsepower) to run the
refrigerator’s compressor at full power. If an average refrigerator runs three hours per
day, it consumes energy at a rate of 90 watts, a rate slightly greater than 10% of the total
household electrical energy consumption.
Using the example above, the cost of U.S. home energy is about 1.6 cents per megajoule
for natural gas and about 5.0 cents per MJ for electricity. This is based on an August 2007
power bill of $116.87, where fifteen hundred cubic feet of natural gas were burned for a cost
of $27.19 and 517 kWh of electricity was consumed at a cost of $89.68. Electricity is more
expensive than natural gas because of control and transmission technologies.
Transportation Energy Consumption
A person living in a valley who drives her car up a hill then parks it has given the car an
additional energy of mgh, where m is the vehicle’s mass, g is gravity, and h is the change in the
vehicle’s change in elevation6. While the vehicle is moving, it has energy ½ mv2, where v is
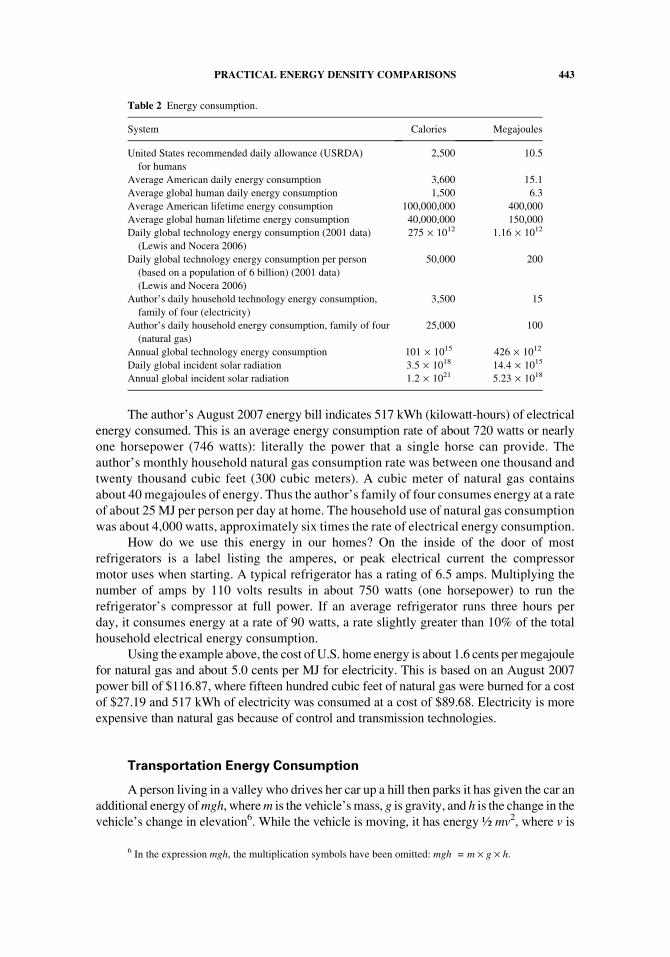
Table 2 Energy consumption.
System Calories Megajoules
United States recommended daily allowance (USRDA)
for humans
2,500 10.5
Average American daily energy consumption 3,600 15.1
Average global human daily energy consumption 1,500 6.3
Average American lifetime energy consumption 100,000,000 400,000
Average global human lifetime energy consumption 40,000,000 150,000
Daily global technology energy consumption (2001 data)
(Lewis and Nocera 2006)
275 · 1012 1.16 · 1012
Daily global technology energy consumption per person
(based on a population of 6 billion) (2001 data)
(Lewis and Nocera 2006)
50,000 200
Author’s daily household technology energy consumption,
family of four (electricity)
3,500 15
Author’s daily household energy consumption, family of four
(natural gas)
25,000 100
Annual global technology energy consumption 101 · 1015 426 · 1012
Daily global incident solar radiation 3.5 · 1018 14.4 · 1015
Annual global incident solar radiation 1.2 · 1021 5.23 · 1018
6 In the expression mgh, the multiplication symbols have been omitted: mgh = m · g · h.
PRACTICAL ENERGY DENSITY COMPARISONS 443
the velocity of the vehicle. When the driver returns to her home in the valley and parks the car
in its original location, it has the same mechanical energy as it did before leaving: none. But
during the trip, chemical energy stored in gasoline was consumed. Where is this energy now
that the car is parked? All of it now exists as thermal energy: molecules of air that were
moving slowly prior the vehicle’s passing are now moving faster and colliding with
neighboring molecules, transferring the energy through microscopic collisions.
How may the trip be viewed on an EROEI basis? The driver has likely gained food or
clothing resources during the trip. For example, if fifty pounds of food (25 kg) was
purchased, this represents approximately 735 megajoules of energy (7,000 calories per
gram · 25,000 grams · 4.2 joules per calorie) and likely the trip resulted in a positive
EROEI. If, however, the traveler were to burn a gallon of gasoline (40 megajoules) and
purchase less than six pounds of food, the EROEI is negative. Beyond this simple ‘‘fuel for
food’’ analysis, what the driver has to show for the journey is a thermal signature left on the
atmosphere. As the car sits in the driveway, its engine and brakes are radiating energy into
the atmosphere at a very low wavelength that cannot practically be captured for performing
additional work. What has occurred is that one energy source (food) has been moved from
one location to a location nearer to the consumer (i.e., the refrigerator) at the expense of
burning another energy source (gasoline). In the end, both the burning of the gasoline and
the burning of the food will result merely in the acceleration of global heat generation: all of
the E = 425 · 1018 joules we consume per year heats the earth’s crust, oceans, and
atmosphere. A simplistic calculation on warming of the atmosphere, �T, neglecting heat
radiated into space, absorbed by the earth, and neglecting greenhouse gas interactions that
has a mass of ma = 5.15 · 1018 kg and a specific heat capacity, cp = 1 J(g-1K-1 yields
about a 0.1 K increase per year (�T = E/cpma).
Some of the most fuel-efficient diesel engines for automobiles get sixty to eighty mpg.
A gallon of liquid petroleum such as diesel or gasoline contains about forty megajoules of
energy. Driving at fifty mph in a car at twenty mpg consumes power at a rate of about 30,000
watts (about forty horsepower). Thus, an automobile consumes energy at a rate approxi-
mately ten to one hundred times that of a house. For a summary of power consumption see
Table 3. First mention If we ran our cars incessantly, like we do our houses, this would be
expensive indeed! To simply idle an engine between 500 to 1,000 rpms, an automobile
requires between one and five horsepower (750 to 3,500 watts), or the power of six to thirty
exercising people just to overcome engine friction (Figure 1). Since solar technology is only
about 10% to 20% efficient, the effective power per square meter is perhaps only 10–20 W/m2.
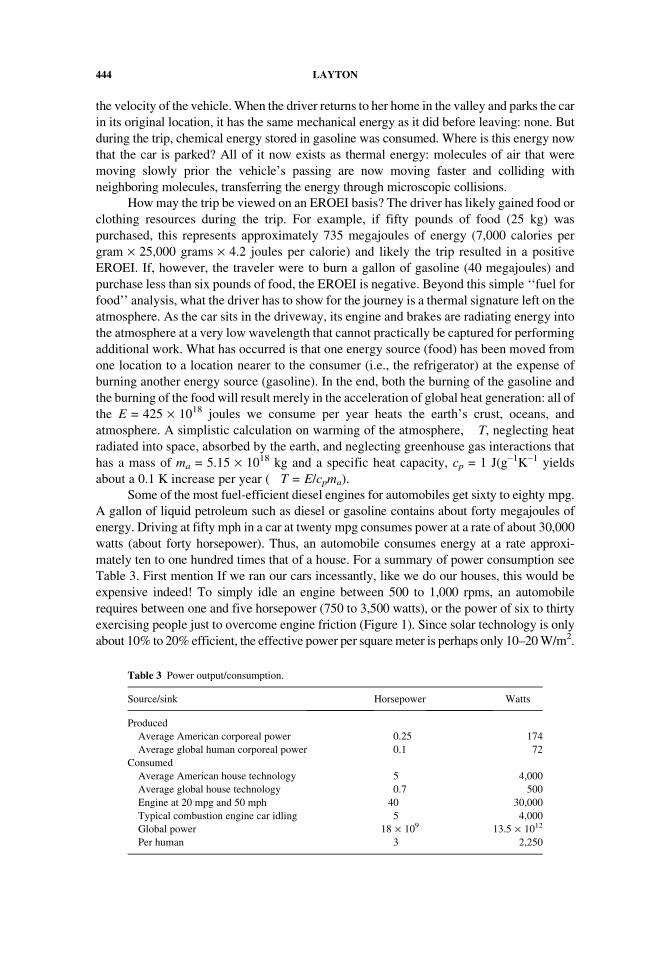
Table 3 Power output/consumption.
Source/sink Horsepower Watts
Produced
Average American corporeal power 0.25 174
Average global human corporeal power 0.1 72
Consumed
Average American house technology 5 4,000
Average global house technology 0.7 500
Engine at 20 mpg and 50 mph 40 30,000
Typical combustion engine car idling 5 4,000
Global power 18 · 109 13.5 · 1012
Per human 3 2,250
444 LAYTON
Thus, it takes the equivalent of forty to three hundred square meters (400 to 3000 square feet),
or the footprint of a house, to keep a typical car idling.
At velocities around 50 mph (80 km/h), the power equivalent of about one hundred
people is required to move an automobile. Consider, however, that the unaided land speed
record for a human on a bicycle is 81 mph (130.36 km/h), achieved in 2002 by Canadian
rider Sam Whittingham on a fully-fared, highly aerodynamic recumbent bicycle. It is
likely that this rider was producing between 600 and 700 watts during the effort. The
greatest distance ridden in 24 hours is around 650 miles (1046.1 km) by Greg
Kolodziejzyk at an average speed of 27 mph (43 km/h). However, the rider’s power
generation rate was only a fraction of a horsepower, likely around 200 to 250 watts.
Average people can generate approximately 100 watts continuously. The two primary
reasons that these riders were able to go so fast and so far are because (1) the mass of their
vehicles is only about 25 kg (50 pounds) and (2) the drag coefficients have been
minimized by shaping the bicycles to slip through the air easily. By contrast, an
American car or truck may weigh 2,000 to 4,500 kg (4,000 to 9,000 pounds) and a
vehicle’s aerodynamics are unfortunately, from an engineering efficiency perspective,
typically only considered after aesthetics.
Every second an automobile sits idling, the engine is typically running at
approximately 1,000 rpms. This means that the pistons in the car’s engine go up and down
about fifteen times each second. During each one of these seconds, fuel is injected into the
cylinder at a mass fraction sufficient to keep the crankshaft and camshaft turning. This
maintains the momentum of the drive shafts such that it can continue to overcome its internal
friction. It is burning gasoline at a rate of between 0.1 cubic centimeters per second and 0.5
cubic centimeters per second. An engine idling at five horsepower burns an ounce (30 grams)
of fuel every three minutes. Not only is this wasteful of precious energy, but carbon monoxide
emissions are typically higher for an idling engine than those of a running engine (Tsunogaia
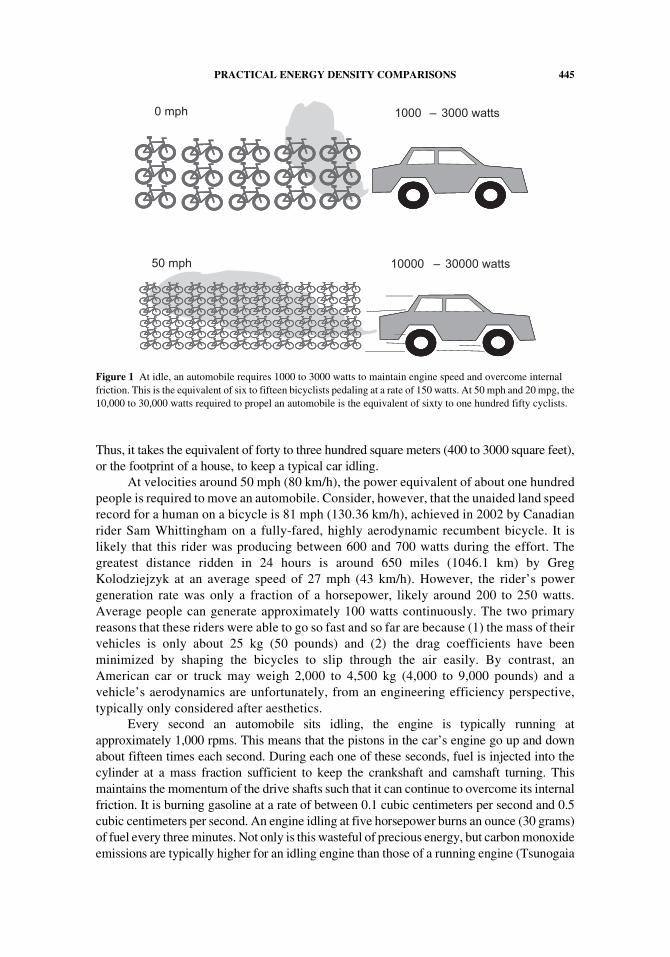
0 mph 1000 – 3000 watts
50 mph 10000 – 30000 watts
Figure 1 At idle, an automobile requires 1000 to 3000 watts to maintain engine speed and overcome internal
friction. This is the equivalent of six to fifteen bicyclists pedaling at a rate of 150 watts. At 50 mph and 20 mpg, the
10,000 to 30,000 watts required to propel an automobile is the equivalent of sixty to one hundred fifty cyclists.
PRACTICAL ENERGY DENSITY COMPARISONS 445
et al. 2003). Indeed, some U.S. cities such as Washington DC have passed laws making it
illegal to idle an engine for more than three minutes (DCMR 2007).
Cost of Food in Dollars per Joule
At the grocery store, food that costs one dollar per pound is typically considered a
bargain. A pound of pasta has approximately 1680 Calories of energy (7 megajoules). Food
that is high in fat has an energy density approximately equal to oil, but the price of food on a
per-mass basis is ten to one hundred times that of oil (Table 4). The energy densities of
meats (proteins) and grains (carbohydrates) are slightly less than half of that of high-fat
food. For meat, however, the cost per calorie is considerably greater, partially because of
the inefficiency of an animal’s energy conversion and partially because of greater demand,
since meat is such a protein-rich source of food. For example, the energy of pasta is only
about $0.14 per megajoule and steak is about $1.30 per megajoule. The price of food will
likely increase as arable land is being hastily and shortsightedly converted into ethanol and
biodiesel farms. This cost increase has already been felt in Mexico, where the price of
tortillas has nearly tripled in one year. Indeed the price per kilogram rose from 63 cents in
2006 to between $1.36 and $1.81 in January 2007 (Roig-Franzia 2007).
Cost of Natural Energy in Dollars per Joule
By comparison, the cost of solar (Rehman et al. 2007), wind, tidal, and geothermal
are all in the neighborhood of $0.10 per MJ. Since the predicted peak of oil may have
occurred in mid 2008, it is unlikely that price of oil will ever fall substantially. On the other
hand, the cost of energy from inexhaustibles should come down as effective, efficient
technologies are developed. In the meantime, there is a tremendous growing market for the
development of chemical and electrical energy storage devices (Carrasco et al. 2006). For a
comparison of energy costs among prevalent sources, see Table 4.
A recent review (Tonn and Peretz 2007) summarizing the U.S. Energy Information
Administration (EIA) reports states that kWh costs for electricity may increase from 1.7 cents
per kWh (0.5 cents per MJ) in 1970 (2003 dollars) to 12.5 cents per kWh (3.5 cents per kWh)
in 2025. Natural gas costs may increase from $1.55 per one hundred cubic feet (1.4 cents per
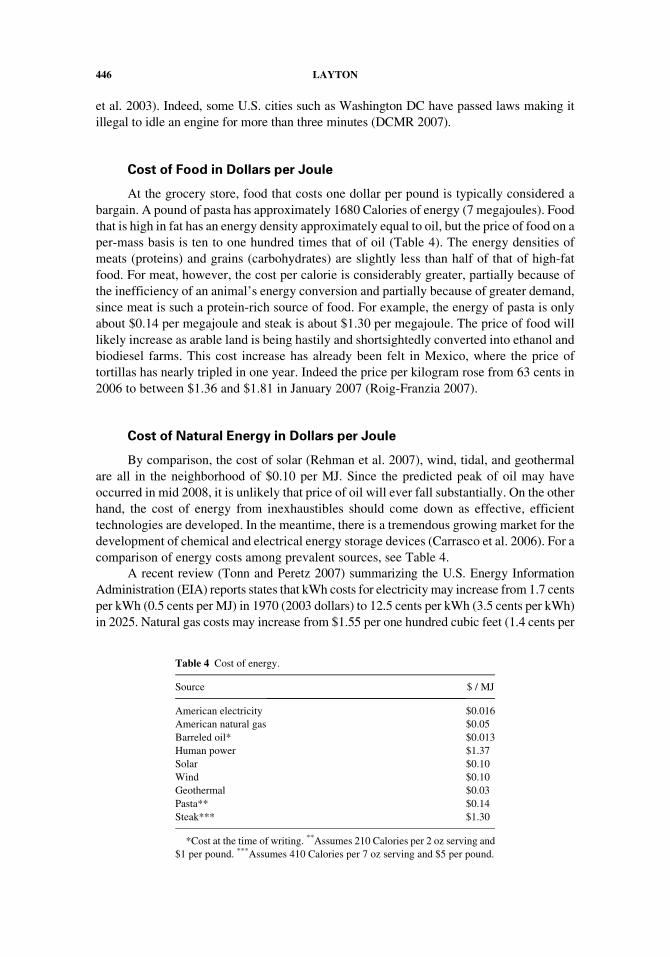
Table 4 Cost of energy.
Source $ / MJ
American electricity $0.016
American natural gas $0.05
Barreled oil* $0.013
Human power $1.37
Solar $0.10
Wind $0.10
Geothermal $0.03
Pasta** $0.14
Steak*** $1.30
*Cost at the time of writing. **Assumes 210 Calories per 2 oz serving and
$1 per pound. ***Assumes 410 Calories per 7 oz serving and $5 per pound.
446 LAYTON
megajoule) in 1995 (2003 dollars) to $8.23 per one hundred cubic feet (7.3 cents per
megajoule) in 2025.
The cost of wind power is scheduled to drop dramatically from nearly $0.25 per MJ to
nearly one cent per MJ in the next decade (Pan and Kohler 2007) as production of turbines
and adoption of the technology becomes more prevalent.
Geothermal energy has an estimated production cost of less than one cent per MJ
(United States Department of Energy 2008), to approximately three cents per MJ (Schneider
et al. 2007).
Human Energy Potential
Unfortunately, most people are not conversant in the jargon of energy and power. The
following is intended to allow the reader to build a better conceptualization of what energy
and power are through the use of simple numerical examples. One watt is the amount of power
required to perform one joule of work (to spend one joule of energy) in one second. One joule
of energy is equivalent to pushing something with one newton of force (1/5th of a pound)
through a distance of one meter (three feet). How many watts can a human generate? Lifting a
twenty-pound bag of groceries into a car through a distance of one meter in one second uses
100 joules of energy (1/40th of a Calorie)7. On the other hand, an Olympic weightlifter clean-
and-jerking a 250 kg bar to a height of two meters in two seconds does five kilojoules (over
one Calorie) of work. This is equivalent to 2500 watts, or over three horsepower.
Lifting the bag took 100 joules of work. In other words, 100 joules of energy was
spent. This energy was produced from muscle, which derives its energy from the chemical
energy of food. Food energy content is measured in Calories (kilocalories). One calorie is
approximately four joules. So 25 calories are ‘‘burned’’ in lifting the bag. There are 1000
calories (small c) in a Calorie (big C). So lifting the bag took 0.025 Calories or one
ten-thousandth of the USDA daily recommended intake of 2,500 Calories. It also takes
energy simply to raise an arm during lifting, to maintain body posture, and to control the
eyes and head during the motion. A daily chemical consumption of approximately 2,500
Calories is the equivalent of 10 megajoules each day. Athletes or people who perform
heavy lifting or operate heavy machinery require a greater amount of energy: 20 to 40 MJ of
daily energy to maintain their activities.
Energy Lost During Conversion
Why can’t all the thermal energy being pumped into the atmosphere to run our motors
be converted back into usable mechanical or electrical energy? A concept that is unknown
by most people and largely misunderstood by most engineers is that an internal combustion
engine (gasoline engine) is a heat engine. The only way for a gasoline or diesel engine to
run is not by simply converting octane and oxygen (C8H18 and O2) into carbon dioxide and
water (CO2 and H2O). It is the heat of expansion that performs work. When materials
combust in the presence of oxygen, they expand and become hotter. The combination of
heating and expansion keep pistons and gears spinning. The hotter an internal combustion
7 Twenty pounds is about ten kilograms, and a kilogram weighs about ten newtons. The bag thus weighs
one hundred newtons. Lifting the bag into the car in one second requires 100 watts as seen in the following
equation.100 newtons · 1 meter � 1 second ¼ 100 watts:
PRACTICAL ENERGY DENSITY COMPARISONS 447
engine becomes, the more efficient it is via: � = (Thot – Tcool)/Thot. Our atmosphere is on
average 16�C (60�F, 300 Kelvin). An engine running at 600 K (326�C, or 620�F) has a
theoretical maximum efficiency of (600 – 300)/600 = 0.5.
True Costs
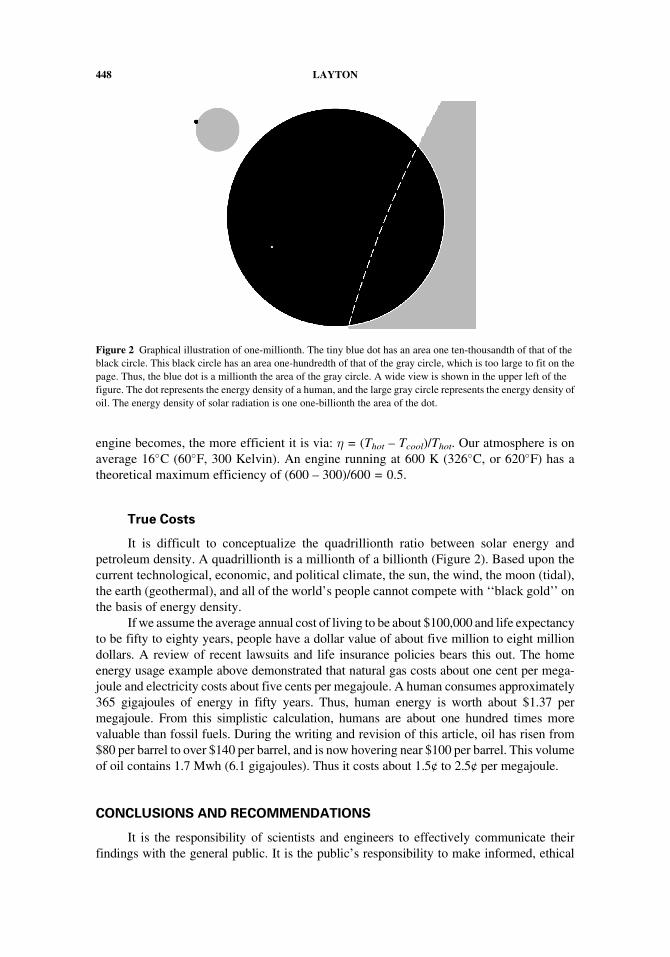
It is difficult to conceptualize the quadrillionth ratio between solar energy and
petroleum density. A quadrillionth is a millionth of a billionth (Figure 2). Based upon the
current technological, economic, and political climate, the sun, the wind, the moon (tidal),
the earth (geothermal), and all of the world’s people cannot compete with ‘‘black gold’’ on
the basis of energy density.
If we assume the average annual cost of living to be about $100,000 and life expectancy
to be fifty to eighty years, people have a dollar value of about five million to eight million
dollars. A review of recent lawsuits and life insurance policies bears this out. The home
energy usage example above demonstrated that natural gas costs about one cent per mega-
joule and electricity costs about five cents per megajoule. A human consumes approximately
365 gigajoules of energy in fifty years. Thus, human energy is worth about $1.37 per
megajoule. From this simplistic calculation, humans are about one hundred times more
valuable than fossil fuels. During the writing and revision of this article, oil has risen from
$80 per barrel to over $140 per barrel, and is now hovering near $100 per barrel. This volume
of oil contains 1.7 Mwh (6.1 gigajoules). Thus it costs about 1.5¢ to 2.5¢ per megajoule.
CONCLUSIONS AND RECOMMENDATIONS
It is the responsibility of scientists and engineers to effectively communicate their
findings with the general public. It is the public’s responsibility to make informed, ethical
Figure 2 Graphical illustration of one-millionth. The tiny blue dot has an area one ten-thousandth of that of the
black circle. This black circle has an area one-hundredth of that of the gray circle, which is too large to fit on the
page. Thus, the blue dot is a millionth the area of the gray circle. A wide view is shown in the upper left of the
figure. The dot represents the energy density of a human, and the large gray circle represents the energy density of
oil. The energy density of solar radiation is one one-billionth the area of the dot.
448 LAYTON
voting decisions regarding who becomes responsible for establishing national energy policy.
It is the responsibility of science and engineering educators to give their students the tools
necessary to quickly calculate and evaluate the most salient parameters that affect humanity
and the balance of nature. Additionally, science and engineering educators must impress
upon their students a sense of the ethical implications of their decisions to develop one
technology in favor of another. It is the hope of the author that this article has enhanced the
mathematical literacy of those who have taken the time to read it.
What can we do to kick the oil habit? Can we teach our engineering students to build
more efficient cars? Can we defray war debt with gasoline cost? Can we invest more in
developing effective solar technologies (Abulfotuh 2007; Demirbas 2007)? Can we invest
more in energy storage technologies? Can we carpool more? Can we ride our bicycles
more? Can we keep our most energetically expensive resources such as aluminum, steel,
glass, and plastic out of landfills? Can we create solutions that enable people to safely
exercise while they work in an atmosphere that is not clouded by particulates (Reddy and
Boucher 2007), carbon monoxide, ozone, nitrous oxides, and sulfur oxides emitted from
combustion engines (Wiedmann et al. 2007)? Yes, we can do all of these things. Now that
some of the political, economic, and environmental costs of going to war for oil are
becoming apparent, we can begin to invest in energy resources and habits that will keep
our unique species alive, healthy, prosperous, and peaceful.
The acceleration of the rate of global per-capita energy consumption seems inevitable.
The only human force that can reverse this trend is the use of the energy from food consumed
and the application of the knowledge gained through education to alter the environment in a
way that will result in a entropy mitigation (Layton 2008). A primary example is planting a
CO2-absorbing plant or tree. Another example would be the development of a technology
designed to reduce greenhouse gas emissions while still maintaining human and ecosystem
health. And while these ‘‘environmentally friendly’’ actions may seem well-intentioned, it
has been recently noted by Lomborg (2007) in his book (Lomborg, 2007) Cool It that many
such behavioral and policy changes suggested by the Kyoto treaty may be misguided.
Lomborg contends that many of the detrimental effects of global warming may be mitigated
by changes in social and political policies such as limiting development in ecologically
fragile locations, creating incentives for reducing birth rates, and approving civil engineering
projects that do not disrupt natural floodplains.
In Thomas Friedman’s ‘‘A New Mission for America,’’ he states that
If Bush made energy independence his moon shot, he would dry up revenue for
terrorism; force Iran, Russia, Venezuela, and Saudi Arabia to take the path of reform
. . . strengthen the dollar; and improve his own standing in Europe, by doing something
huge to reduce global warming. He would also create a magnet to inspire young people
to contribute to the war on terrorism and America’s future by becoming scientists,
engineers and mathematicians (Friedman, 2004).
A similar sentiment is shared by Richard Ballantine, editor of Human Power. In his
Spring 2003 editorial he writes:
The war in Iraq is about black gold—the last significant reserves of oil. Once Iraq is
conquered, the coalition forces intend to take the oil to pay for the costs of the war,
establishing a new regime, and rebuilding the country. The oil will go to developed
countries and be used to fuel motor vehicles.
PRACTICAL ENERGY DENSITY COMPARISONS 449
The primary argument of this article is that careful thought, education, and arithmetic
can elucidate some of the most pressing economic and ethical polemics of our time. This was
recently exemplified in a discourse in The Mother Earth News. In the August/ September 2007
issue, James Kliesch encourages truck owners to consider the responsibility of American
citizens to become less energy dependent by purchasing vehicles that get better gas mileage.
He states that a truck owner who decides to purchase a vehicle with 14 mpg rather than 16 mpg
will save as much fuel as a car owner who drives a car with 51 mpg rather than 35 mpg. A reader
from Denver, Colorado, responded, stating that Mr. Kliesch must have ‘‘dozed off in math
class’’ because according to his calculations, the car owner would save eight times more fuel
than the truck owner: [(51 – 35) 7(16 – 14) = 8)]. Indeed, the reader was wrong and should
have been paying more attention in his math class. What the Denver reader did not do was to
calculate the annual fuel consumption for both vehicles individually. For the car, the equation is
(15,000 ( 51) – (15,000 7 35) = 134. For the truck, (15,000 (16) – (15,000 7 14) = 134.
What now are the responsibilities of the world’s leading scientists, engineers, and
political advisors? It is our responsibility to construct a model of sustainable energy and
natural resource consumption that does not continue to negatively impact the world’s
fragile ecosystem. William C. Clark suggests that any worthwhile model will include an
EROEI (energy return on energy invested) term8. He goes on to recommend that anyone
who builds a viable model for ‘‘ecological economics’’ deserves a nomination for the
Nobel Peace Prize.
Approximately half of trips by automobile are of a distance of five miles or less, a
distance easily covered by most people on a bicycle in average weather conditions (Wilson,
2004). It is the author’s contention that nearly any trip may be made by bicycle. Enclosed
transportation where the occupant is not responsible for producing any of the power of
locomotion is not new. Human-carried carriages date back for centuries but were only
available to the ruling elite. Most Americans can now afford an automobile, effectively raising
our energy consumption luxury above that of a typical African tribal leader. We have paid for
this luxury with obesity, heart disease, traffic fatalities, wasted time in traffic, and the burden
of insurance payments. How do we avoid the perils of a gasoline and oil-based economy? In
the author’s opinion, it is our challenge to pass along memetically (through behavior, speech,
and writing), the message that we as a species cannot afford to continue to exploit the natural
resources of our planet in the manner and at the present rate without dire and immediate
consequences. Each time we pass along our genetics to our children we are essentially creating
a new 200 MJ + per day demand for energy that simply cannot be sustained.
One solution is to spread your memes rather than your genes (Dawkins 1989). By
spending time enhancing your own education level and by practicing self-replacement
rather than self-proliferation, the problems associated with young, undereducated
populations may be avoided (Ness 2000). We have become the biggest threat to our own
survival (Liu et al. 2003) and our intelligence necessitates that we accelerate the pace of
educating ourselves. Sadly, much of the time of many of the earth’s most intelligent people
spend their time thinking of effective weaponry. A lot of other very intelligent people also
spend their time trying to subdue the intelligence of others through false advertising. A
well-educated, well-informed population is the only antidote for the sloppy arrogance that
8 What is ‘‘energy return on energy invested?’’ Simply put, it means how many gallons of oil must be
burned to extract one gallon of oil. If one gallon must be burned to extract one gallon, the EROEI ratio is 1:1, and
there is obviously no point to burning a gallon of fuel, only to regain it. At the height of American and Saudi oil
production this ratio may have been as great as 200:1. Only one barrel of oil was burned to extract 200 barrels.
450 LAYTON
we have allowed our current government administrators to fall into. Indeed, it is the opinion
of many leading political scholars that the U.S. government of the past eight years has
maintained its power through the use of deceit and scare tactics such as false allegations of
weapons of mass destruction WMDs in Iraq. Rather than spending our national blood and
national treasure on weaponry and political policies to bomb the people of the Middle East
back another five hundred years, we should spend our intelligence on things such as
effective medicines (Bland 2007) or space-exploration technology (Lin 2006).
In the author’s opinion, other emerging energy technologies that warrant funding
include supercapacitors (Chmiola et al. 2006), battery technology (Liu et al. 2002), and
nanobiosolar (Trammell et al. 2006). Other recent efforts to reduce the excessive emissions
during cold starts must also be considered (Ashford and Matthews 2006). We should support
work done to increase the efficiency of gasoline-electric hybrids (Wang et al. 2007). We
should support work to reduce automobile emissions of polycyclic aromatic hydrocarbons
(Mi et al. 1996), a known carcinogen (Alguacil et al. 2003; Bieler et al. 2005; Elci et al. 2003).)
Funding research that makes vehicles more energy efficient makes sense from an
engineering perspective as well as a health perspective. Exposure to emissions from
gasoline, but more acutely diesel exhaust, can lead to greater rates of cancer ( Jo and
Song 2001; Parent et al. 2007; Weisel et al. 1992). A recent study showed that residents of
Hamilton, Canada, would be willing to purchase alternative fuel vehicles if there were
economic incentives such as tax relief and a reduced cost of the vehicle (Potoglou and
Kanaroglou 2007). The study also indicated that people would purchase an alternative fuel
vehicle if they knew that their emissions contributing to climate change would be reduced.
There are a multitude of other things that we may do to reduce our dependence on
foreign oil. Simple examples include limiting the amount of trash we put by the curb by
composting, reusing, and recycling. Using gasoline-powered trash trucks to pile unwanted
waste at remote locations accelerates the problems of CO2 emissions.
It is also the author’s opinion that we should indeed maintain security of the world’s
energy-dense resources for fueling scientific endeavors such as space exploration. While
hydrocarbons are not typically used directly as fuel for spacecraft, the purification of
molecular hydrogen and molecular oxygen are very energy-intensive and thus typically
rely on the combustion of fossil fuels. Instead of spending energy on space exploration, we
are wasting the world’s petroleum reserves standing still in traffic jams in luxury cars.
Elementary engineering mathematics demonstrates that the energy density of oil
exceeds the energy density of all other available sources to such a great extent that oil may
no longer be considered a commodity but a dwindling global natural energy resource
currently being fought over (Clark 2005). In fact, it has been argued by leading scholars
and stated publicly by national leaders as Ohio U.S. Congressman Dennis Kucinich that
‘‘Everyone knows that the Iraq War is about oil’’ (Debate 2007). In fact, securing and
protecting Iraq’s oil fields is one of the primary roles of the U.S. military.
By evaluating the energy density of liquid petroleum on a joules per volume basis and a
dollars per joule basis, it may become apparent that military costs of protecting energy
resources, while ethically questionable, may be economically justifiable by political leaders
with agendas that include keeping oil prices low and maintaining a global military presence.
These figures suggest a semiquantitative basis for explaining the willingness citizens of
the Confederate States to fight and die for maintenance of control over this very energy-dense
resource of unpaid, semiskilled labor! While domesticated animals have energy densities
comparable to that of humans, their limited dexterity makes them less valuable.
PRACTICAL ENERGY DENSITY COMPARISONS 451
The figures presented in this article may help to partially explain the recent U.S.
national energy policy that appears to favor military control of energy sources over
domestic investment in developing infrastructure to promote alternative energy sources.
The United States has plenty of coal to run its refrigerators, air conditioners, hair dryers,
and toasters at a rate of up to five to ten cents per megajoule. The United States does not,
however, have enough oil to run its semi tractor trailers, motor boats, lawn mowers, leaf
blowers, jet skis, and SUVs. As humans, running at $1.37 per megajoule, we must educate
ourselves as to the additional costs of extracting and protecting natural energy resources so
that they are not wasted and so that human life is not spent in procuring and protecting them.
For further discussion of the urban implications of peak oil, read Newman (2007).
For a discussion of the effects of human population on energy consumption, read Sato
(2007).
A forthcoming article will further investigate the recently introduced notion that the
primary purpose of energy consumption is to reduce our entropy and to reduce the entropy
of our immediate surroundings and technological prosthetics (Layton 2008). In essence, we
use our intelligence and proclivity for violence as a species to gain access to energy sources
at the expense of other societies and at the expense of all species that compete with us for
resources. It is the need to ‘‘deentropize’’ ourselves and our surroundings that drives our
need for energy (Nielsen 2007). This deentropization of our bodies and technological
prostheses in turn accelerates the entropization of the environment. This can be no clearer
than when we observe the human-enabled disasters of Hurricane Katrina, the Twin Towers
collapse, the Dust Bowl of the 1930s, and the devastation wrought upon Middle East
citizens by the U.S. military practices.
ACKNOWLEDGMENTS
This work was funded in part by ‘‘A Green Alternative to Municipal Maintenance and
Transportation,’’ Grant # C000021433’’ through the Pennsylvania Department of Community and
Economic Development with help from Pennsylvania State Representative James Roebuck. The
author also thanks John Tetz, Richard Sadler, and David Gordon Wilson for valuable discussions on
ethics and efficiency.
REFERENCES
Abulfotuh, F. 2007. Energy efficiency and renewable technologies: The way to sustainable energy
future. Desalination 209: 275–282.
Alguacil, J., M. Porta, T. Kauppinen, N. Malats, M. Kogevinas, and A. Carrato. 2003. Occupational
exposure to dyes, metals, polycyclic aromatic hydrocarbons and other agents and K-ras activa-
tion in human exocrine pancreatic cancer. International Journal of Cancer 107: 635–641.
Ang, B.W., and N. Liu. 2006. A cross-country analysis of aggregate energy and carbon intensities.
Energy Policy 34: 2398–2404.
Ashford, M., and R. Matthews. 2006. On-board generation of a highly volatile starting fuel to reduce
automobile cold-start emissions. Environmental Science & Technology 40: 5770–5777.
Association for the Study of Peak Oil and Gas (ASPO). 2004. Newsletter 44.
Attarian, J. 2002. The coming end of cheap oil. The Social Contract (Summer): 276–286.
Ballantine, R. 2003. The politics of human powered vehicles. Human Power 54: 3.
Berger, A.L. 1978. Long-term variations of daily insolation and quaternary climate change. Journal of
the Atmospheric Sciences 35: 2362–2367.
452 LAYTON
Betz, A. 1926. Wind-energie und ihre ausnutzung durch windmuhlen. Gottingen: Vandenhoeck &
Ruprecht.
Bieler, C.A., M.G. Cornelius, R. Klein, V.M. Arlt, M. Wiessler, D.H. Phillips, and H. H. Schmeiser.
2005. DNA adduct formation by the environmental contaminant 3-nitrobenzanthrone after
intratracheal instillation in rats. International Journal of Cancer 116: 833–838.
Bland, K. I. 2007. Concerning trends and outcomes for National Institutes of Health funding of cancer
research. Journal of Surgical Oncology 95: 161–166.
Carrasco, J.M., L.G. Franquelo, J. T. Bialasiewicz, E. Galvan, R.C.P. Guisado, A.M. Prats,
J.I. Leon, and N. Moreno-Alfonso. 2006. Power-electronic systems for the grid integration
of renewable energy sources: A survey. IEEE Transactions on Industrial Electronics
53: 1002–1016.
Chmiola, J., C. Portet, P.L. Taberna, P. Simon, G. Yushin, and Y. Gogotsi. 2006. Structure porosity
and electrochemical behavior of carbide derived carbon for supercapacitor applications.
American Chemical Society 51: 187–188.
Clark, W.R. 2005. Petrodollar warfare: Oil, Iraq and the future of the dollar. Gabriola Island, British
Columbia: New Society Publishers.
Dawkins, R. 1989. The selfish gene. New York: Oxford University Press.
DCMR (2007). Title 20 of the District of Columbia Municipal Regulations. 900 ENGINE IDLING.
D. o. C. M. Regulations.
Democratic National Debate. 2007. Drexel University, Philadelphia, PA, USA, October 30, 2007.
Demirbas, M.F. 2007. Electricity production using solar energy. Energy Sources, Part A: Recovery
Utilization and Environmental Effects 29: 563–569.
Elci, O.C., M. Akpinar-Elci, A. Blair, and M. Dosemeci. 2003. Risk of laryngeal cancer by occupa-
tional chemical exposure in Turkey. Journal of Occupational and Environmental Medicine 45:
1100–1106.
Friedman, T.L. December 2004. A new mission for America. International Herald Tribune.
Haberl, H., H. Weisz, C. Amann, A. Bondeau, N. Eisenmenger, K. H. Erb, M. Fischer-Kowalski, and
F. Krausmann. 2006. The energetic metabolism of the European Union and the United
States—Decadal energy input time-series with an emphasis on biomass. Journal of
Industrial Ecology 10: 151–171.
Hill, J., E. Nelson, D. Tilman, S. Polasky, and D. Tiffany. 2006. Environmental, economic, and
energetic costs and benefits of biodiesel and ethanol biofuels. Proceedings of the National
Academy of Sciences of the United States of America 103: 11206–11210.
Jo, W.K., and K.B. Song. 2001. Exposure to volatile organic compounds for individuals with
occupations associated with potential exposure to motor vehicle exhaust and/or gasoline
vapor emissions. Science of the Total Environment 269: 25–37.
Layton, B.E. 2008. Recent patents in bionanotechnologies: Nanolithography, bionanocomposites,
cell-based computing and entropy production. Recent Patents in Nanotechnology 2: 1–12.
Layton, B. E., L. Jablonowski, R. Kirby, and N. Lampe. 2007. Bicycle Infrastructure development
strategy for suburban commuting. ASME International Mechanical Engineering Congress and
Exposition, Seattle, Washington, November 11–15.
Lewis, N.S., and D.G. Nocera. 2006. Powering the planet: Chemical challenges in solar energy
utilization. Proceedings of the National Academy of Sciences of the United States of America
103: 15729–15735.
Lin, P. 2006. Viewpoint: Look before taking another leap for mankind—Ethical and social
considerations in rebuilding society in space. Astropolitics 4: 281–294.
Liu, J.G., G.C. Daily, P.R. Ehrlich, and G. W. Luck. 2003. Effects of household dynamics on resource
consumption and biodiversity. Nature 421: 530–533.
Liu, P., S.H. Lee, C.E. Tracy, Y.F. Yan, and J.A. Turner. 2002. Preparation and lithium insertion
properties of mesoporous vanadium oxide. Advanced Materials 14: 27–30.
Lomborg, B. 2007. Cool it: The skeptical environmentalist’s guide to global warming. New York:
Alfred A. Knopf.
PRACTICAL ENERGY DENSITY COMPARISONS 453
Marcotullio, P.J., and N.B. Schulz. 2007. Comparison of energy transitions in the United States and
developing and industrializing economies. World Development 35: 1650–1683.
Mi, H.-H., W.-J. Lee, T.-L. Wu, T.-C. Lin, L.-C. Wang, and H.-R. Chao. 1996. PAH emissions from a
gasoline-powered engine. Journal of Environmental Science and Health A31: 1981–2003.
National Renewable Energy Laboratory (NREL). (1992). National Renewable Energy Laboratory
Resource Assessment Program. http://www.nrel.gov/rredc/solar_resource.html (accessed January
30, 2008).
Ness, G.D. 2000. Five cities: Modeling Asian urban population-environment dynamics. Oxford:
Oxford University Press.
Newman, P. 2007. Beyond peak oil: Will our cities collapse? Journal of Urban Technology 14: 15–30.
Nielsen, S.N. 2007. What has modern ecosystem theory to offer to cleaner production, industrial
ecology and society? The views of an ecologist. Journal of Cleaner Production 15: 1639–1653.
Pan, H., and J. Kohler. 2007. Technological change in energy systems: Learning curves, logistic
curves and input-output coefficients. Ecological Economics 63: 749–758.
Parent, M.E., M.C. Rousseau, P. Boffetta, A. Cohen, and J. Siemiatycki. 2007. Exposure to diesel and
gasoline engine emissions and the risk of lung cancer. American Journal of Epidemiology 165:
53–62.
Potoglou, D., and P. Kanaroglou. 2007. Household demand and willingness to pay for clean vehicles.
Transportation Research, Part D: Transport and Environment 12: 264–274.
Reddy, M.S., and O. Boucher. 2007. Climate impact of black carbon emitted from energy
consumption in the world’s regions. Geophysical Research Letters 34: L11802.
Rehman, S., M.A. Bader, and S.A. Al-Moallem. 2007. Cost of solar energy generated using
PV panels. Renewable & Sustainable Energy Reviews 11: 1843–1857.
Roig-Franzia, M. 27 January 2007. ‘‘A Culinary and Cultural Staple in Crisis.’’ Washington Post,
section A01.
Ruppert, M.C. 2003. Paris Peak Oil Conference reveals deepening crisis. From the Wilderness.
Association for the Study of Peak Oil and Gas.
Sanjuan, B., J.L. Pinault, P. Rose, A. Gerard, M. Brach, G. Braibant, C. Crouzet, J.C. Foucher,
A. Gautier, and S. Touzelet. 2006. Tracer testing of the geothermal heat exchanger at
Soultz-sous-Forets (France) between 2000 and 2005. Geothermics 35: 622–653.
Sari, R., and U. Soytas. 2007. The growth of income and energy consumption in six developing
countries. Energy Policy 35: 889–898.
Sato, Y. 2007. Energy consumption: An environmental problem. IEEJ Transactions on Electrical and
Electronic Engineering 2: 12–16.
Schneider, D. R., N. Duic, and Z. Bogdana. 2007. Mapping the potential for decentralized energy
generation based on renewable energy sources in the Republic of Croatia. Energy 32: 1731–1744.
Stopa, J., and P. Wojnarowski. 2006. Analytical model of cold water front movement in a geothermal
reservoir. Geothermics 35: 59–69.
Thekaekara, M.P. 1975. The total and spectral solar irradiance and its possible variations. Proc.
Workshop on the Solar Constant and the Earth’s Atmosphere, Big Bear Solar Observatory.
Tonn, B., and J.H. Peretz. 2007. State-level benefits of energy efficiency. Energy Policy
35: 3665–3674.
Trammell, S. A., A. Spano, R. Price, and N. Lebedev. 2006. Effect of protein orientation on electron
transfer between photosynthetic reaction centers and carbon electrodes. Biosensors &
Bioelectronics 21: 1023–1028.
Tsunogaia, U., Y. Hachisub, D.D. Komatsua, F. Nakagawaa, T. Gamoa, and K.-I. Akiyama. 2003. An
updated estimation of the stable carbon and oxygen isotopic compositions of automobile CO
emissions. Atmospheric Environment 37: 4901–4910.
United States Department of Energy (2008). Geothermal FAQs. http://www1.eere.energy.gov/
geothermal/faqs.html (accessed February 10, 2008).
Wang, F., T. Zhang, L. Yang, and B. Zhuo. 2007. Steady-state optimization of an internal combustion
engine for hybrid electric vehicles. International Journal of Automotive Technology 8: 361–373.
454 LAYTON
Weisel, C.P., N.J. Lawryk, and P.J. Lioy. 1992. Exposure to emissions from gasoline within auto-
mobile cabins. Journal of Exposure Analysis and Environmental Epidemiology 2: 79–96.
Wiedmann, T., M. Lenzen, K. Turner, and J. Barrett. 2007. Examining the global environmental
impact of regional consumption activities, Part 2: Review of input-output models for the
assessment of environmental impacts embodied in trade. Ecological Economics 61: 15–26.
Wilson, D.G. 2004. Bicycling science. Cambridge, MA: MIT Press.
Yergin, D. 1991. The prize: The epic quest for oil, money and power. New York: Free Press.
APPENDIX
All machines heat their surroundings. No technology has been or can be invented that
has a net cooling effect. Fire is the most obvious and arguably first example of a human
technology. Every subsequent technology from the cotton gin to the personal computer
heats the atmosphere. With very few exceptions, organisms heat their surroundings. All
local technological cooling efforts such as air conditioners and refrigerators result in global
heating.
The heating of the environment by all mechanical devices may be demonstrated by
one of the most fundamental equations of mechanics. Newton’s f = ma states that force
equals mass times acceleration. The units of force are newtons. By replacing the
acceleration term, a, with gravitational acceleration, g, and by replacing the force term
with kx, where k is spring stiffness and x is displacement we obtain,
kx ¼ �mg (1)
This equation says that a mass of m will stretch a spring of stiffness k, a distance of x if it is
in a gravitational field with strength g, which points down, thus the negative sign. Examples
abound. A dining room chandelier stretches its chain. If gravity were stronger, the
chandelier would be closer to the floor. If gravity were weaker, it would be closer to the
ceiling. This phenomenon occurs daily in our spines, which are also springs. Greater body
mass and longer times spent upright in a gravity field compress our springy spines, reducing
their length. Newton’s equation, however, is for conservative systems, which are
idealizations of reality. Conservative models predict that a ball will bounce indefinitely.
Experience shows that energy is lost to heat and noise. Modifying (1) by adding this
damping effect yields
mgþ cvþ kx ¼ 0 (2)
The additional term cv is the part that is lost to heat every time a machine operates. In (2),
v is velocity and c is friction. Every time something moves, some of its energy is dissipated
as heat through the c term.
PRACTICAL ENERGY DENSITY COMPARISONS 455