Embed Size (px)
Citation preview

Implementing Energy Efficiency: Program Delivery Comparison Study
IEE WhitepaperMarch 2010


Implementing Energy Efficiency: Program Delivery Comparison Study
IEE Whitepaper
March 2010
Prepared by
Luisa Freeman
Dr. Shawn Intorcio
Jessica Park
Black & Veatch Corporation
Management Consulting

TABLE OF CONTENTS
EXECUTIVE SUMMARY .......................................................................................................... 1
INTRODUCTION......................................................................................................................... 3
A BRIEF HISTORY OF ENERGY EFFICIENCY .................................................................. 6 ENERGY EFFICIENCY EVOLUTION AND FUNDING ......................................................................... 6 DRIVERS OF ENERGY EFFICIENCY ................................................................................................ 9
REGULATORY LANDSCAPE FOR EE ................................................................................. 10
COMPARISONS......................................................................................................................... 17 CHALLENGES IN COMPARATIVE MEASURES .............................................................................. 17 IMPACTS ACHIEVED.................................................................................................................... 17 PROGRAM SAVINGS AND EXPENDITURES: IOUS AND STATE ENTITIES ...................................... 18 PROGRAM INSIGHTS ................................................................................................................... 21
CONCLUSIONS AND RECOMMENDATIONS .................................................................... 24
APPENDICES ........................................................................................................................... A-1
APPENDIX A: IOU DESCRIPTIONS .................................................................................. A-2
APPENDIX B: STATE ENTITY DESCRIPTIONS ............................................................. A-7
APPENDIX C: INTERVIEW PARTICIPANTS ................................................................ A-11
APPENDIX D: INTERVIEW QUESTIONS....................................................................... A-12
APPENDIX E: DETAILED FINDINGS FROM INTERVIEWS WITH ELECTRIC
UTILITIES .............................................................................................................................. A-13
APPENDIX F: DETAILED FINDINGS FROM INTERVIEWS WITH STATE
ENTITIES ................................................................................................................................ A-24
APPENDIX G: BLACK & VEATCH TASK DESCRIPTIONS ....................................... A-32
KEY SOURCES ...................................................................................................................... A-33
1
EXECUTIVE SUMMARY
Energy efficiency (EE) is an increasingly important energy resource. IOUs, state administrators,
regulators, legislators, and politicians increasingly accept the premise that energy efficiency is
currently a least-cost new energy source with the potential for EE to maintain this position into the
foreseeable future. At an average cost of about $0.035 per kWh saved, it is currently less expensive
to save a kWh than the fully loaded costs to construct a facility to generate a kWh, regardless of the
generation fuel source.
Utilities continue to dominate the energy efficiency program delivery landscape, with budgets
comprising 93% of total EE budgets nationwide in 2009. Utilities have a demonstrated capability to
manage EE programs cost-effectively through existing expertise, partnerships, and infrastructure,
utilizing their existing relationships with customers to deliver verified benefits to ratepayers under
regulatory oversight. The ability of a state entity to administer and deliver EE programs largely
depends on the capabilities the state can offer. In some states, such entities are very successful. But,
the majority of states rely on utilities to deliver EE, which suggests that building the expertise,
infrastructure, and the customer relationships necessary for a state entity to successfully administer
EE programs may be more difficult than expanding on existing utility programs, systems, and
relationships or creating partnerships. In some states, both electric utilities and state entities deliver
programs. In these cases, state entities may be better suited to serve specific market segments or to
pursue specific goals.
It is difficult to compare utilities versus state entities in terms of their cost effectiveness in delivering
energy efficiency programs for two reasons. First, where utilities are obligated to pursue only cost-
effective energy efficiency as a result of state regulatory oversight, state entities sometimes have
different and broader goals. Second, we currently lack both national guidelines for standardized
evaluation, measurement, and verification (EM&V) methods as well as standardized reporting
requirements.
Finally, utilities‘ existing relationships with customers, the trust customers have in utility expertise,
and utilities‘ knowledge of customer usage patterns and impacts of EE strategies are all important
benefits associated with utility administration of energy efficiency programs. This will be even
more important as EE program delivery is increasingly coupled with smart metering. On the other
hand, state entity efficiency administrators may be well suited to serve specific market segments,

2
especially low-income customers, due to the existing infrastructure for state-run weatherization and
energy assistance programs, and are also well positioned to advance market transformation.

3
INTRODUCTION
In most states in the U.S., electric utilities deliver energy efficiency (EE) programs to customers via
rate-payer funded programs: in some states, a statewide entity has this responsibility. The vast
majority of investments in energy efficiency programs in the U.S. and the associated energy savings
achieved occur as a result of utility-administered programs. In fact, based on recent CEE survey
results, of the $4.4 billion total budget for energy efficiency programs in 2009, utility programs
comprised 93%.1 With several years of experience in the performance of both utility-administered
and state entity-administered energy efficiency programs, this paper examines the relative pros and
cons of each, with an eye toward identifying the most effective ways to rapidly realize major gains in
energy efficiency nationwide.
Investor-owned electric utilities (IOUs) have been operating energy efficiency programs since the
early 1980s, funded by ratepayers and approved by state regulatory commissions. Utilities face
disincentives for saving energy via energy efficiency: timing of the recovery of direct program costs,
lost revenue that results from diminished sales, and a higher rate of return for investments in supply-
side resources. Over the past few years, these issues have been addressed aggressively by state
utility commissions to encourage utility investments in energy efficiency.
In the early 2000s, regulators introduced the concept of public benefits charges, whereby a surcharge
on utility bills collected from ratepayers would fund a state entity – either the regulatory
commission, a state agency, or a third party created for the purpose – to implement energy efficiency
programs instead of the utility. A few states implemented this approach assuming that it would
deliver higher levels of energy savings per dollar spent. However, this approach is not widespread,
it has not shown itself to be necessarily more cost-effective, and in some states with a state entity,
the utility still has a major role in delivering EE programs.
1 Based on a joint CEE/IEE/AGA survey, conducted in 2009, aggregate results can be found in CEE‘s Annual
Industry Report, 2009. This paper does not consider the over $10 billion in stimulus funding targeted to energy
efficiency in 2009. While representing a huge influx of funding for EE activity, this funding is temporary and outside of the EE delivery entities discussed in this paper. The federal initiatives and the energy savings they are
likely to produce may be a complicating factor in trying assess the effect of utility and state administrator EE
programs in the future, particular in those states where attribution of energy savings is a sensitive matter.

4
This paper identifies insights into capturing energy savings using different administrator models and
recommends roles and possible collaborations to achieve higher levels of cost-effective energy
efficiency (EE) going forward.
Several trends underlie the importance of ramping up energy efficiency:
Potential climate legislation. A major issue driving utilities and other entities to ramp up their
energy efficiency efforts is potential federal climate legislation. EE programs contribute to
reducing greenhouse gas emissions by reducing the amount of electricity that is generated via
fossil fuels. Other federal policies under discussion include a national energy efficiency resource
standard or using energy efficiency to meet a national renewable energy standard.
Legislative and regulatory targets for energy efficiency. An increasing number of states have
enacted or are enacting legislation, energy efficiency resource standards, and (in a few cases)
demand reduction targets for utilities operating in those states. These laws and directives vary
and include a range of features including incentives and penalties for achievement/non-
achievement of targets; sector-specific targets (e.g., residential, low income, etc.); budget caps
for spending; and cost-benefit criteria for either individual programs or for the portfolio of
programs.2
Costs for generating electricity. Volatile fuel costs, existing generation infrastructure
replacement costs, and high capital costs are all factors that will put pressure on and influence
the market price of electricity in the future. As a result, energy efficiency measures that were
previously not cost effective may become cost effective. A utility‘s ―avoided costs‖ are often the
basis of comparison for energy efficiency program investments.3 As fuel and generating costs
rise, more energy efficient investments can become a more cost-effective strategy to pursue
when compared to selected alternatives.
Stimulus funds. About $14 billion was allocated for state and local entities to increase energy
efficiency in 2009. As plans are implemented to spend these one-shot funds, utilities and state
administrators will play a vital role in keeping these energy efficiency efforts alive.
Such policy initiatives imply that all organizations that deliver energy efficiency services will need
to be engaged and efforts coordinated in order to meet the future targets for energy savings and
greenhouse gas reductions. The recent increased funding for energy efficiency beyond rate-payer
funded programs presents opportunities for partnering and leveraging of funding across program
administrators to increase energy efficiency significantly nationwide.
2 Barbose, Galen, Charles Goldman, and Jeff Schlegel. Ernest Orlando Lawrence Berkeley National Laboratory.
―The Shifting Landscape of Ratepayer Funded Energy Efficiency in the U.S.‖ October 2009. LBNL-2258E. 3 In the past EE programs were viewed as avoiding the next power plant or unit of capacity, and ―avoided costs‖
were calculated based on that investment. This method essentially set a price threshold below which EE
programs were cost-effective. Some utilities are now using the market price for the cost of purchased power as
the basis for avoided cost calculations. Escalating fuel costs are a significant component in either case, thus
setting the ―clearing price‖ for EE investments higher.

5
Over the next decade, we expect an unprecedented nationwide push toward energy efficiency.
Relative to building new generation, EE is currently the lowest cost resource for meeting demand
(about $0.035 per kWh saved) when compared to full life cycle generation and can be considered a
cost-effective alternative to meet carbon reduction goals. However, there are some implementation
challenges for both utilities and state entities that deliver EE programs.
Both utilities and state entities need to be able to measure and verify the energy savings that they
have generated in order to claim the energy savings. This is typically conducted through third
party evaluation, measurement, and verification (EM&V) reviews. At this point, however,
utilities alone face actual monetary penalties related to these reviews. Statewide entities also
have to undergo varying levels of EM&V, but (so far) state entities do not face financial
penalties for non-performance.
To the extent that utilities, statewide entities, federal programs, or codes and standards achieve
efficiency savings (either alone or in collaboration with each other), there is the issue of
assigning attribution. Who gets the ―credit‖ for achieved savings? This contentious issue, left
unresolved, could result in a disincentive to collaborate to achieve savings when, in fact, it makes
sense to encourage collaboration.
Based on experience-to-date, information from publicly available data, and interviews conducted
with a sample of leaders from both utility and state-entity administered energy efficiency programs
nationwide, this paper attempts to define the roles of utilities and state entities in administering EE
programs; and the delivery models, capabilities, and the relative benefits of each entity.

6
A BRIEF HISTORY OF ENERGY EFFICIENCY
This section describes the two major types of organizations that deliver energy efficiency programs
and services to end-use customers: investor owned utilities (IOUs) and statewide entities. We also
discuss the approaches to funding energy efficiency and key drivers. Both electric and gas utilities
deliver energy efficiency; about 85% is electric efficiency and 15% is gas efficiency. For electric
efficiency programs, electric utility budgets for EE comprise about 90% of total spending and state
entity budgets comprise 10%.
ENERGY EFFICIENCY EVOLUTION AND FUNDING
Over time, energy efficiency programs in the U.S. have changed in response to economic, political,
and environmental pressures. Those pressures have led to changes in the types of programs and
services offered as well as how the programs are funded and administered.
Energy Efficiency: 1970s through early 1990s
High energy prices triggered by the Arab Oil Embargo in the mid 1970s helped to make consumers
aware of their energy usage and receptive to taking steps to reduce energy consumption. Following
an initial push to increase energy independence, the National Energy Conservation Policy Act of
1978 tapped electric and natural gas utilities to help advance public policy by offering home energy
audits. The Residential Conservation Services (RCS) program was soon followed by a commercial
energy audit program. As they took on this role, some utilities realized that providing programs that
reduced energy usage and peak load were cheaper than undertaking the construction and operation of
new generation facilities. Utilities, with the support of their regulators, began offering energy
efficiency services including educational programs to customers and introducing time-of-use rates to
large commercial and industrial customers.
Utilities‘ use of EE programs as an alternative to building new generation capacity, moved to a new
level in the 1980s with the introduction of integrated resource planning (IRP), or least cost planning.
Under IRP, utilities evaluate the cost and load shape impact of a portfolio of EE measures relative to
the cost of generation resources. In its simplest form, the objective of IRP is for utilities to develop
the mix of demand-side and supply-side resources that provides reliable service for ratepayers at the
lowest possible cost.

7
Widespread implementation of EE programs (rebate programs in addition to simple energy audits)
created a conflict for utilities. Efficiency programs reduce energy sales; hence, utilities
administering successful EE programs can be faced with lower revenues, dependent on the rate
recovery mechanisms, while still having to cover their fixed costs. In the United States, rates are
commonly designed such that fixed costs are recovered, in part, via a throughput charge based on
kWh consumed. If usage decreases due to energy efficiency, a utility will not fully recover its fixed
costs. Some regulators responded to this dilemma by allowing utilities to recover their fixed costs
provided that the EE programs met cost-effectiveness criteria. The IRP and cost recovery model
remained the framework for many utilities, particularly those facing high energy prices, until the late
1990s when electric restructuring began.
Energy Efficiency: Late 1990s and Public Benefits Charges
As deregulation of the electric power sector heated up in the late 1990s, energy efficiency declined.
In an attempt to make the market more competitive, the electric utility industry began to unbundle
generation from transmission and distribution resources. Emphasis on EE programs declined
dramatically. Utility EE spending dropped from a high of $3.2 billion (1.7% of revenues) in 1993 to
roughly $1.6 billion in 1997.4,5
As a result, energy efficiency funding methods started to evolve.
The reductions in energy efficiency funding that occurred under electric restructuring caused
concern. Efficiency advocates viewed energy efficiency and other services (such as renewable
energy and low-income programs) as public benefits that needed to be maintained. In response,
regulators introduced the concept of a system benefits or public benefits surcharge, collected from
all ratepayers to fund such programs.
Funding levels and how charges are collected to fund EE vary across states. In many states, the
system benefits charge is a cent per kilowatt-hour (kWh) fee assessed on customer usage. States
have adopted various names for this surcharge, such as a Systems Benefits Charge (SBC – New
York), Public Goods Surcharge (PGS – California) or Reliable Energy Trust Fund (RETF –District
of Columbia). The charge is typically based on usage and is neutral with respect to the generation
supplier. However, in a few states such as Vermont, Oregon and Montana, large C&I customers
4 Kushler, Martin, Dan York and Patti White, American Council for an Energy-Efficiency Economy, Five Years
In: An Examination of the First Half-Decade of Public Benefits Energy Efficiency Policies, Report Number
U042, April 2004. 5 Charles River Associates, Primer on Demand-Side Management, CRA Document D06090, February 2005

8
receive a reduced charge if they can document independent energy efficiency projects undertaken in
their facilities. In other states, energy efficiency is funded either by a fee embedded directly into the
rate or by a monthly flat charge.
The administration of the SBC funds varies by jurisdiction and is the responsibility of either the state
utility regulators or a state agency (e.g., the state energy office). In states with either embedded fees
or flat rates, funds allocated for energy efficiency are distributed to the implementation entity which
may be a utility and/or a state entity. Regardless of administrator, utility ratepayers are the primary,
if not exclusive, source of EE funding.
Energy Efficiency Today: 2000 and Beyond
The SBC remains a common funding tool for energy efficiency programs across the U.S. This
funding mechanism provides flexibility in how programs are delivered and assures that EE continues
to thrive.6 The delivery of EE programs has changed over the past decade and, in some states, non-
utility providers deliver energy efficiency. The SBC enables regulators to deploy program money to
the program delivery entity, whether it is a utility, state agency, or 3rd
party efficiency provider.
Some states, such as New York, Oregon, and Vermont, moved away from the model of
utility-administered programs and have third-party or state agencies deliver EE programs.
However, New York has gone full circle and is now moving back toward a model where
utilities deliver some energy efficiency programs.
States such as California and most other states have utility-sponsored EE programs. In
California and New Jersey, funds are collected through a public goods surcharge, but utilities
still are responsible for program delivery.
Other states, such as Pennsylvania and Ohio, have avoided central collection of energy
efficiency funds into a statewide pool for deployment by a state agency or regulatory body.
These states leave the planning, budgeting, and implementation of energy efficiency up to the
utilities, but have defined energy savings targets and, in some cases, spending caps or
minimums that utilities must meet.
6 Kushler, Martin, Dan York and Patti White, American Council for an Energy-Efficiency Economy, Five Years
In: An Examination of the First Half-Decade of Public Benefits Energy Efficiency Policies, Report Number
U042, April 2004.

9
In general, state regulators and legislators across the U.S. have become more prescriptive in their
directives regarding delivery of energy efficiency services to end-use customers. Many states now
have energy efficiency resource standards, energy efficiency goals/targets, and/or the requirement to
implement all cost-effective energy efficiency prior to building a power plant.
In addition, over the past few years states have made significant progress in adopting policies that
both remove the disincentive and provide incentives for utilities to invest in energy efficiency,
putting EE on a level playing field with investments in new power plants. As of March 2010, 19
states have some type of fixed-cost recovery (e.g., decoupling, lost revenue recovery, or save-a-
watt), 21 states have some type of performance incentive for energy efficiency, and 19 states have
energy efficiency resource standards.
DRIVERS OF ENERGY EFFICIENCY
Regardless of the delivery entity, regulators across the U.S. expect EE programs to achieve energy
and/or peak demand savings cost-effectively. The specifics of program and savings goals are unique
to each utility/entity and regulatory jurisdiction. Resource constraints, environmental concerns, and
social benefits are a few of the key issues driving how programs are delivered.
Some important attributes of EE programs include:
What are the savings targets and is the focus on peak savings, energy savings, or both?
What are the spending levels and what is the source of funding?
Which customer segments will be served: residential, commercial/industrial, low income?
What specific measures and services will be provided? What type of incentives will be offered
(i.e., rebates, loans, etc.)?
What criteria will be used to measure cost-effectiveness (i.e., societal benefit cost, total resource-
cost test, etc.)?
Which costs will be recovered?
Is decoupling or another form of lost revenue recovery in place?
Are performance incentives or other mechanisms to earn a return on energy efficiency
investments in place?
Energy efficiency drivers are important to understand when interpreting the performance of
efficiency programs, particularly when comparing programs across states. Different goals or drivers

10
often makes it difficult to develop a single metric for comparing program results, such as cents per
kWh saved. Applying a single metric can lead to misleading conclusions about the success of an
individual program and its particular delivery model. For example, in a state where EE programs are
focused on peak reduction, such as Florida, load control programs may appear to be more ―costly‖ in
cents per kWh than programs focusing on energy savings, such as residential lighting. However, a
load control program is typically highly cost-effective when compared on a dollars per MW saved
basis to new generation capacity.
REGULATORY LANDSCAPE FOR EE
We selected six electric investor owned utilities (IOUs) for detailed interviews based on energy
efficiency experience, regulatory environments, and geographic diversity: CenterPoint Energy, Inc.
(Texas); Florida Power & Light (Florida); National Grid (New England); NV Energy (Nevada);
Pacific Gas & Electric (California); and Southern California Edison (California). Summary
descriptions of these utilities are provided in Appendix A.
We also interviewed five statewide entities that administer EE programs using state public benefits
funds – Efficiency Maine; Energy Trust of Oregon; New York State Energy Research and
Development Authority; Wisconsin Focus on Energy; and Vermont Efficiency Investment
Corporation. This group was selected based on experience implementing programs, geographic
dispersion, and information availability. Summary descriptions of these entities are provided in
Appendix B.
Based on the energy efficiency literature and one-on-one interviews with the six investor owned
utilities (IOUs) and five statewide entities in Maine, Oregon, Wisconsin, Vermont, and New York, a
summary of the regulatory landscape in the states where interviews were conducted is provided
below.

11
Table 1: Characteristics of IOUs and Statewide Organizations Interviewed
Investor-Owned Utility Location Service Area CEO
EE+LM
Expenditures
2008 $M (CEE)
Customers
Served
(Millions)
CenterPoint Energywww.centerpointenergy.com
Florida Power & Light (FPL)www.fplgroup.com
National Grid
www.nationalgridus.com
Nevada (NV) Energywww.nvenergy.com
Pacific Gas & Electric (PG&E)www.pge.com
Southern California Edisonwww.sce.com
State/Third Party Organization Location Service Area
Executive
Director
EE+LM
Expenditures
2008 $M (Annual
Reports)
Customers
Served
(Millions)
Efficiency Maine
www.efficiencymaine.org
Energy Trust of Oregon, Inc.www.energytrust.org
New York State Energy Research
and Development Authority
(NYSERDA)www.nyserda.org
Efficiency Vermontwww.veic.org)
Wisconsin Focus on Energy
www.focusonenergy.com
Notes: Wisconsin Focus on Energy expenditures based on Wisconsin PSC Evaluation data.
Southern California
Northern California
Nevada and
northeastern California
Massachusetts, New
Hampshire, New York
and Rhode Island
East and lower west
coasts of Florida
Madison, WI Wisconsin
Burlington, VT
Albany, NY
Arkansas, Louisiana,
Minnesota, Mississippi,
Oklahoma, and Texas
Rosemead, CA
San Francisco,
CA
Las Vegas, NV
Waltham, MA
Miami, FL
Houston, TX
Portland, OR
Augusta, ME Maine
New York
Global
Oregon
Scott
Johnstone
Michael L.
Morgan
N/A
5.6
3.8
$568.3 15.0
Peter A.
Darbee
Theodore F.
Craver, Jr.
$163.8
Francis J.
Murray, Jr. 19.5
John R.
Brautigam
Margie Harris
$385.6 13.0
$14.0 1.3
David M.
McClanahan
Armando
Olivera
Steve Holliday
Michael W.
Yackira $56.2
$70.4
$31.5
$67.1
12.0
$180.7 4.6
3.4
$24.2
2.4
$49.8
California
California is a pioneer in energy efficiency. Currently, generation and T&D constraints combined
with above average retail rates and environmental concerns make California one of the most active
states in this area.
Implementation of EE programs resides with the utilities and their subcontractors. Programs are
funded via a system benefits charge (SBC). Utilities implement evaluation, monitoring and
verification (EM&V) plans and file the results with the California Public Utilities Commission
(CPUC) each year.
Since utilities continue to implement efficiency programs, the CPUC must address both the lost
revenue and EM&V issues. By instituting EE programs the regulators are requiring utilities to sell
less of their product that estimated during general rate cases, resulting in reduced revenues. In 1982

12
the CPUC established decoupling. In 2007 the CPUC established a financial metric that linked a
utility‘s ability to recover revenue from ratepayers to their success in achieving savings goals pre-
approved by the CPUC. A company is assessed a financial penalty if it achieves less that 65% of its
goal, and receives incentive payments if it exceeds 85% of its goal. Incentive payments range from
9% to 12%.
To further push the state‘s commitment to EE, in 2008 the CPUC adopted a Long-Term Energy
Efficiency Strategic Plan. The Plan was the result of a year-long collaborative effort with utilities,
regulators, consumer advocates, and third-parties. The Plan provides a number of broad-based
initiatives and specifies a number of energy efficiency goals but does not prescribe how the goals
must be met. The Plan will be updated in 2010, and the CPUC has ordered utilities to include the
Plan‘s milestones in their 2012-2014 EE plans that will be filed in 2011.
Florida
Demographics have driven the focus of EE programs in Florida. The rapid influx of new residents
coupled with the increase in house size makes peak demand the critical issue. This makes Florida
unique from most other states, in that the focus is on demand reduction rather than energy savings.
The prescriptive role of the PSC also makes Florida unique from the other states. Under the Florida
Energy-Efficiency Conservation Act (FEECA), the PSC mandates the capacity and energy savings
required for each regulated entity.7 Efficiency programs focus on load management, interruptible
service and, to a lesser extent, conservation measures to reduce summer and winter peak demand.
While the goals are set by the PSC, the utilities specify measures, design programs, and are directly
responsible for the delivery of the programs – either directly through utility staff or through
subcontractors. Utilities are required to submit annual evaluation studies to the PSC for cost
recovery. Decoupling (or another form of lost revenue recovery) and financial incentives for over-
achievement of program goals are not in place in Florida.
Maine
Maine‘s regulatory environment actively encourages implementation of EE programs and the use of
renewable resources. In the mid 1980s, Maine was one of the first states to require its IOUs to
implement integrated resource planning (IRP) and to annually update their avoided generation costs.
7 Florida Public Service Commission, Florida Energy-Efficiency and Conservation Act, February 2006.

13
Currently, EE program delivery in Maine uses a hybrid model: some programs are delivered by
utilities and others are delivered by a state entity – Efficiency Maine – established in 2002 by the
Maine Public Utility Commission (MPUC). Efficiency Maine operates under the direction of the
MPUC and is focused on delivering programs across the state in: residential lighting; low-income;
education and training; building operator certification; schools; and commercial new construction.
Utilities continue to offer EE education programs, residential space and water heating programs, and
commercial and industrial business programs.
All programs are funded through an SBC fund. Both Efficiency Maine and the utilities are required
to submit annual evaluations to the MPUC to validate programs saving and for cost recovery
purposes. Maine does not have decoupling or financial performance incentives in place.
Nevada
In Nevada, utilities implement EE programs. In Nevada, utilities receive program funding through
an SBC and recover program costs through rate cases filed every two years. All program plans must
be filed and approved by the Nevada PUC.
Decoupling is not in place in Nevada, however, financial incentives are in place for utilities that
exceed their savings targets. Utilities may receive an additional 5% return-on-equity in addition to
their base return-on-equity of 10.25%. Utilities are also penalized if savings targets are not met.
Financial penalties and incentives are determined as part of a utility‘s rate case.
New York
New York‘s Public Service Commission (NY PSC) continues to take a proactive and comprehensive
approach to promoting EE programs for both the near and long-term energy plans for the state.
Initially, EE programs were the sole responsibility of the utilities. Since 1998, in response to the
initial movement toward restructuring, EE programs have been delivered through a statewide
administrator, the New York Energy Research and Development Authority (NYSERDA), which is
charged with planning and implementing programs throughout the State. The programs are funded
under an SBC that replaced earlier utility-run EE programs.
In 2008, the PSC established the New York Energy Efficiency Portfolio Standard (EEPS) with a
goal of 15 percent reduction in electricity consumption by 2015. In addition to the aggressive

14
savings goals, the PSC continues to encourage other program attributes including: increased system
reliability; reduction in cost burden to customers, in particular low-income customers; mitigation of
environmental impacts through the use of energy efficiency measures and renewable generation
resources; and development of emerging energy technologies.
As a result of this shift toward more aggressive goals, most of the electric utilities in the state have
filed proposals with the NY PSC in anticipation of again having a direct role in implementing EE
programs. Most of these proposals are still awaiting commission approval.
Oregon
The Oregon Public Utility Commission (OPUC) has taken a very high-level approach to establishing
goals for EE programs. Like New York, early EE programs were delivered by the state‘s utilities,
but in 2002, Oregon shifted responsibility to a statewide entity and established a non-profit group,
the Energy Trust of Oregon, to deliver energy efficiency programs using the funds collected from the
public purpose charge.
The OPUC establishes aggregate savings goals for the Energy Trust. EE Programs in Oregon are
funded by a 3% public purpose fee assessed on all ratepayers. The funds from the fee are used for
EE programs, renewables, and low-income services. The Oregon Energy Trust is responsible for
developing and implementing EM&V plans and for filing annual evaluations to demonstrate the
cost-effectiveness of programs.
Texas
In Texas, EE programs are delivered by the state‘s utilities. Unlike other states, Texas sets savings
targets rather than funding levels—the Texas PUC requires each utility to achieve annual savings
equal to 15% of projected load growth. The PUC is assessing continued opportunities to further
increase peak demand savings.
Most efficiency programs are funded directly through customer rates, however, an SBC is assessed
to support low income and consumer education programs. Utilities must undertake EM&V for each
program and submit annual performance evaluations to the PUC. These evaluation filings are the
basis for cost recovery for the utilities.

15
Decoupling is not in place in Texas, but financial incentives are available to utilities that achieve
100% of targets. A utility receives a bonus of 1% of net benefits for every 2% by which a program
exceeds its demand reduction goal, with a maximum of 20% of the utility‘s program costs. A utility
can also receive an incentive for achieving at least 120% of demand reduction goals and for
capturing at least 10% of achieved savings through low income programs.
Vermont
Vermont was one of the first states to adopt an alternative program delivery option. In 1999, the
Vermont Department of Public Service (DPS) ordered that EE program delivery be shifted from the
utilities to a third-party provider called an energy-efficiency utility (EEU). Efficiency Vermont, a
division of the Vermont Energy Investment Corporation (VEIC), was awarded the EEU contract in
2000 and recently completed its third three-year contract.
Services provided by Vermont Energy are funded through an SBC (i.e., an energy efficiency
charge). The DPS sets binding savings targets for Efficiency Vermont and provides financial
incentives if Efficiency Vermont exceeds its energy and demand savings targets. The
implementation and regulatory responsibilities of Efficiency Vermont are similar to those required of
utilities providing EE services. Efficiency Vermont is required to conduct annual process and
impact evaluations for each of its programs and to file the results with the DPS. These program
evaluations are the basis for assessing the cost-effectiveness of the programs as well as for
determining whether a financial bonus is awarded to Efficiency Vermont and, if so, the amount.
Wisconsin
Like Maine, Wisconsin has shifted from having utilities implement all EE programs to a hybrid
model where some programs are delivered by utilities while others are delivered by a statewide
entity. In 2002, regulators and non-utility third parties established Focus on Energy, a state entity
responsible for statewide implementation of EE programs. The Wisconsin Public Service
Commission approves annual budgets and reviews annual program evaluation filings. Wisconsin‘s
IOUs continue to offer additional programs.
Funding for all EE programs is through an SBC. Program costs for utility-implemented programs
are recovered as part of the utility‘s rate case.

16
Wisconsin has no mechanism for lost revenue recovery or decoupling but does use a ―future test‖
year for setting rates. Since future test year data account for some savings from energy efficiency
programs, lost revenue impacts from efficiency programs are reduced. Utilities are eligible to
receive a rate of return on their EE spending equal to the rate of return on capital investments.

17
COMPARISONS
CHALLENGES IN COMPARATIVE MEASURES
Two primary metrics of interest as measures of how efficiently a program is capturing energy
savings and that illustrate performance are dollars per kWh saved and dollars per kW shifted for load
management programs. Several concerns surround this type of data.
Consistency – Organizations measure, compile, and publish different performance metrics. For
example, budget numbers may include different program elements, making it difficult to make
straightforward one-to-one comparisons between organizations.
Data sensitivity – Some organizations are reluctant to provide performance statistics. Risks
include misinterpretation or misuse of data, complication of ongoing regulatory action, and an
organization‘s achievements may not be fully reflected in statistics.
The data in the tables in this section combine publicly available sources with data gathered from
interviews.
IMPACTS ACHIEVED
Table 2 presents the annual spending and savings achieved from EE programs in 2008, as well as
dollar per MWh saved, at the national level compiled using data available from the Energy
Information Administration (EIA) of the U.S. DOE. This table includes EE direct costs and
incentives only; load management costs are excluded and indirect costs are excluded because they
can be associated with other programs. The state entity-administered EE programs (e.g., NYSERDA
and The Energy Trust of Oregon) are not included in this table because they do not report data to
EIA.
Of the $2.3 billion spent on energy efficiency (direct costs and incentives only), 78% was spent by
IOUs; this is somewhat higher than the IOU share of the generation mix nationwide. IOUs
accounted for 86% of kWh saved in 2008 as reported to EIA, this is somewhat higher than their
share of spending. IOUs dominate the EE program landscape in terms of both spending and savings
achieved. Overall, as shown in Table 2, the cost per MWh saved varies significantly across the
different entities.

18
Table 2: U.S. Energy Efficiency Spending and Savings Data – 2008 (EIA)
Type of Organization
Number of
Organizations
(N)
Annual Energy Efficiency
Expenses 2008 (Direct
Costs and Incentives)
Annual Energy
Efficiency Savings
2008 (MWh) $/MWh
Cooperative 294 34,413,000$ 1,954,950 17.60$
Federal - TVA 1 4,794,000 754,667 6.35
Investor Owned Utility 109 1,840,866,000 74,029,973 24.87
Municipal Utility 324 281,024,000 4,907,263 57.27
Municipal Marketing Authority 7 5,866,000 13,998 419.06
Political Subdivision 52 70,642,000 2,950,224 23.94
State Power Authority 5 107,815,000 1,399,389 77.04
Total 792 2,345,420,000$ 86,010,464 27.27$
Data from EIA Annual Electric Utility Data - EIA861 final Data file for 2008.
http://www.eia.doe.gov/cneaf/electricity/page/eia861.html Note: Load Management not included.
PROGRAM SAVINGS AND EXPENDITURES: IOUS AND STATE ENTITIES
Table 3 shows 2008 energy savings and electric efficiency expenditures for IOUs and state entities
interviewed for this paper based on EIA data, CEE data, annual reports, and interview information.
The magnitude of program expenditures varies widely across the reporting utilities: from
CenterPoint with 2008 expenditures of $24 million to the two largest California utilities, Southern
California Edison (SCE) and Pacific Gas and Electric (PG&E) with expenditures of $386 million
and $568 million, respectively. Both SCE and PG&E each saved more than 10 million MWh of
energy in 2008. When analyzed on a dollar per MWh saved basis, National Grid achieved the
lowest cost, at $22 per MWh saved. CenterPoint Energy represents the upper end of the range at
$139 per MWh saved. However, it is difficult to use this metric alone to make comparisons across
entities, as discussed below.
Among the state organizations, NYSERDA had by far the largest 2008 expenditures, at $164
million. The other state organizations‘ annual expenditures on electric efficiency programs range
from $14 to $50 million. Looking at the organizations on a dollar per MWh saved basis, three of the
five state entities fell within the range of $120 to $180 per MWh. Wisconsin Focus on Energy
achieved over 390,000 MWh of savings at a cost of $120 per MWh. The NYSERDA figure of
$1024 per MWh saved is an outlier and may reflect the fact that, in 2008, NYSERDA‘s program

19
funding increased significantly to support the ―15-by-15‖ state initiative, shifting staff resources to
program planning and design during the second half of the year. In addition, the programs pursued
by NYSERDA include research, development, and demonstration projects that have longer-term and
more comprehensive elements which require more time to design and implement. In contrast, in
2007, NYSERDA‘s cost per MWh saved was $150 per MWh.
Some potential limitations in this data are worth noting. First, state spending may include a
significant educational component or audit services, and the savings delivered by such programs
may not be realized until after the current program year. Second, state spending may be targeted at
hard-to-reach customer segments such as low-income customers. These programs may be more
expensive to implement than typical programs, for instance, by requiring higher incentive levels to
motivate customer action. State entity-administered programs may have very different goals than
IOU-administered programs. Typically, the main goal for IOUs is to pursue cost-effective energy
efficiency (to gain approval by state regulatory commissions). On the other hand, state entity
programs may be pursuing more social goals. The bottom line is that the relative magnitude of the
dollar per MWh saved metric alone does not indicate a program‘s effectiveness; other factors must
be considered.
When examining the IOUs and state entities in this study, it is not possible to draw a simple
conclusion about which group can more efficiency administer energy efficiency programs; the
particulars vary state-by-state. Carbon reduction and other environmental requirements, the types of
programs offered (e.g., low-income, consumer education, shared savings), long-term resource
planning initiatives, and the savings focus (energy vs. peak demand savings) will all affect the level
of savings realized within a program budget. As NYSERDA‘s data demonstrate, it is critical to
understand the factors that shape the program delivery environment. Therefore, as a starting point in
assessing the effectiveness and efficiency of an efficiency program or suite of programs offered by a
provider, consistent evaluation, measurement, and verification (EM&V) methods are critical, as well
as a standard reporting system.
Currently, there is no consistency in EM&V or standard reporting. Variations in program evaluation
and reporting methods make comparisons impossible. EM&V is and will continue to be a central
focus in the efficiency industry; it will become even more critical with carbon legislation. It is
critically important to establish both standard reporting requirements and EM&V guidelines that can
be used across jurisdictions.

20
Table 3: 2008 Energy Efficiency Program Data (Multiple Sources)
IOU
2008 Energy
Savings
MWh (EIA)
2008
Efficiency
Expenditures
$M (CEE)* $/MWh saved*
2008
Demand
Reduction
MW (EIA)
Residential
(Non-Low
Income)
Low
Income C/I and Other EM&V Source/Notes
CenterPoint Energy 173,919 $24.2 $139 70 21% 37% 42% 1% Interview/EIA/CEE
National Grid 3,209,884 $70.4 $22 541 - - - 5%
Interview/EIA/Massachusetts Electric
Company Nantucket Electric Company d/b/a
National Grid 2008 Energy Efficiency Annual
Report revised/National Grid Electric and Gas
Demand-Side Management Programs - 2008
Year-End Report/Granite State Electric
Company d/b/a National Grid Energy
Efficiency 2008 Year-End Report.
Nevada (NV) Energy 1,112,314 $56.2 $51 351 - - - 5% Interview/EIA/CEE
Pacific Gas & Electric 11,238,192 $568.3 $51 2,738 - - - 8% Interview/EIA/CEE
Southern California Edison 10,291,029 $385.6 $37 3,556 - - - 8% Interview/EIA/CEE
State Entity
2008 Energy
Savings
MWh
(Annual
Reports)
2008
Efficiency
Expenditures
$M (Annual
Reports)* $/MWh saved*
2008
Demand
Reduction
MW (EIA)
Residential
(Non-Low
Income)
Low
Income C/I and Other EM&V Source/Notes
Efficiency Maine 107,517 $14.0 $130 6 20% 20% 60% - Interview/2008 Annual Report, pg. 3
Energy Trust of Oregon 281,371 $49.8 $177 - 41% - 59% 3-5% Interview/2008 Annual Report, pg 8
NYSERDA 160,000 $163.8 $1,024 1,079 23% 33% 44% 2%
Interview/New York Energy $mart Program
2008 Annual Report, tables ES-2 and ES-4
Efficiency Vermont 140,562 $31.5 $224 43 - - - 5%
Interview/2008 Annual Report, figure 2, table
2.1.1
Wisconsin Focus on Energy 390,074 $47.0 $120 68 - - - 0%
Interview/Wisconsin PSC Focus on Energy
Evaluation Semiannual Report (18-month
Contract Period), April 2009.
EE Electric Programs Percent of Budget Allowed To:
Note: 2008 expenditures for state entities are from annual reports. 2008 expenditures for electric utilities are from CEE. Figures reported are not standardized, and may therefore not be directly
comparable. Spending figures for NYSERDA,include research, development, and demonstration program costs. For explanation of comparability of figures, and the factors that shape program
delivery, please see pages 18-19.

21
PROGRAM INSIGHTS
The information provided by the interviews with IOUs and state entities yielded several insights
into energy efficiency program management.
Energy efficiency program staff size is largely independent of the type of organization
administering the program. Staff size is determined primarily by which services are provided
by in-house staff versus outsourced to third-party contractors. Efficiency Vermont provides
all of its services in-house and has a staff of 160 highly technical professionals and had
expenditures of $30 million in 2008. Pacific Gas and Electric has over 550 full-time staff for
its EE programs and had expenditures of $568 million in 2008. On the other hand, the
Energy Trust of Oregon uses contractors to deliver all of its programs and employs only 10
program staff members. In general, when IOUs administer EE programs, the work is
contracted out and typically only 10-15% of the total budget is used internally for utility EE
staff.
Where IOUs administer EE programs, they are typically responsible for the entire process,
including EE planning and goal-setting, program and portfolio development, marketing and
operations, vendor selection and oversight, and monitoring and reporting to regulatory
authorities.
IOUs have a demonstrated capability to manage EE programs. However, many rely on
independent contractors and third-party vendors for program delivery and support depending
on the expertise and size of utility efficiency staffs, the scale and complexity of the target
market, and state and local expectations and legislation.
State-entity administrators of EE programs use a variety of different delivery models, with
NYSERDA and Wisconsin Focus on Energy implementing programs with significant
involvement of in-house technical staff and Efficiency Maine and Energy Trust of Oregon
contracting out the majority of their programs. In general, delivery models depend on the
nature of the organization administering the program and its specific mandates, which are
dictated by state legislation and regulation.
Utilities‘ existing relationships with customers and the trust customers have in utility
expertise represent unique benefits of utility administration. Utilities‘ knowledge of
customer usage patterns is also a unique aspect of their ability to communicate EE strategies
and benefits to customers (such as through on-line audits), as well as report on impacts. This
ability will be even more critical in the future as EE program delivery is increasingly coupled
with smart metering. These benefits make utilities best suited to develop EE programs and
marketing strategies, and to educate customers about the benefits of EE, load management,
and best practices for saving energy.
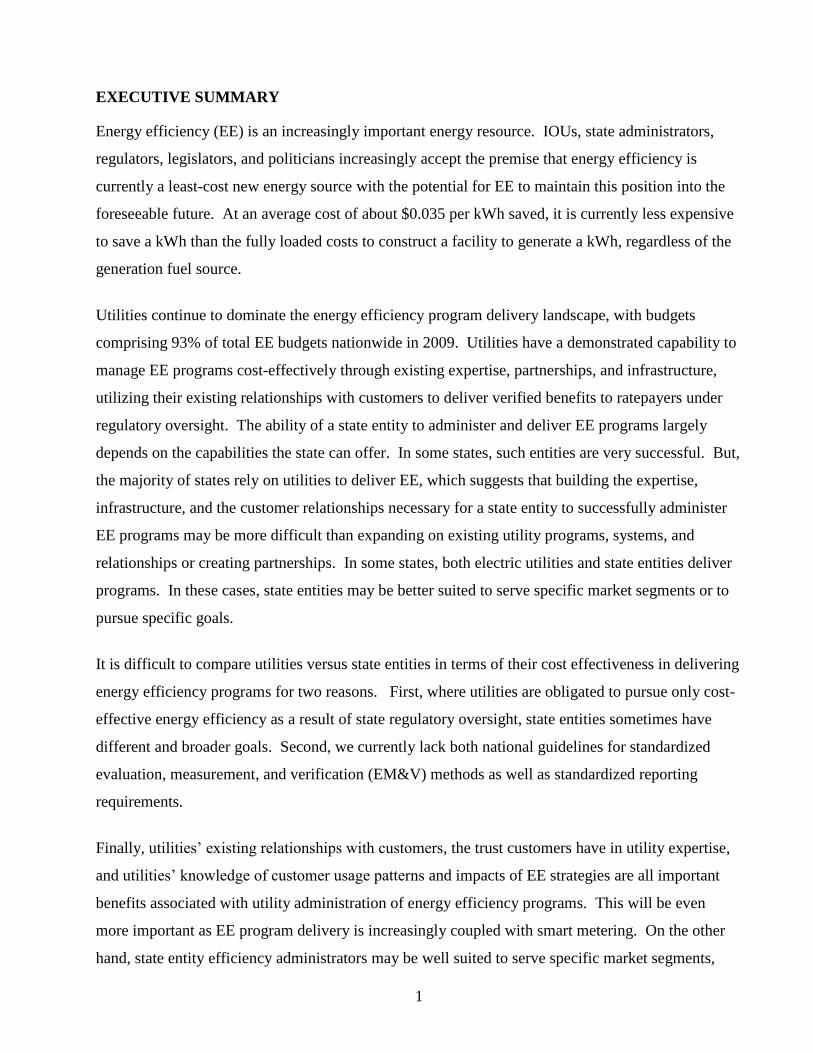
The ability of a state entity to administer and deliver EE programs depends on what
capabilities the entity has to offer. Some can offer successful programs to particular markets
and customer segments, while many other state entities would be challenged by a lack of
22
internal expertise and systems. The majority of states do not currently have an EE-related
state entity, which suggests that building the expertise and infrastructure necessary to
successfully administer EE programs at the state level may be more difficult than expanding
on existing utility programs, systems, and relationships.
Independent contractors and vendors have shown to be well suited to provide the final stage
of delivery, especially installation of specific measures for mass market and residential
customers, which typically requires relatively modest technical expertise but present
challenges to scalability.
A benefit of state-entity administration is the potential for simpler communication with
groups that span multiple utility service territories, such as retail associations. Statewide
organizations may have an advantage over utilities with more limited geographic borders.
Under a third-party administrator model, organizations looking for information on statewide
programs would interact with a single statewide administrator rather than multiple different
utility program administrators. Consumer education and general marketing is often effective
when done at the statewide level. Insofar as the administrators of EE programs are statewide
entities, however, utilities that span state lines might also enjoy this advantage over state-
based program administrators.
Several utilities interviewed view state entity/third party organizations as best suited to
deliver EE programs to the low-income community since the infrastructure for state-run
weatherization and energy assistance programs is already in place.
Utility and third-party administrators agree on the importance of partnering with
organizations that have specific knowledge and skills for the target customer segment,
especially when serving low-income customers. Local community service and housing
organizations can be invaluable partners as they are often better positioned to reach low-
income customers and implement programs. Similarly, mid-stream and upstream
partnerships can improve market transformation initiatives.
Commercial and industrial customers represent an important segment of savings potential.
Of those interviewed, the percentage of total program budget allocated to C&I customers
ranged from 40-60% with no significant difference between IOUs and state agencies.
Large C/I customers require considerable technical assistance. Custom incentive programs to
this customer segment are best administered by organizations with a large in-house technical
staff. Utilities naturally consider themselves best suited to delivering these programs due to
their experience serving these sophisticated customers, and their detailed knowledge of usage
and demand patterns. At the same time, third-party administrators such as Wisconsin Focus
on Energy and Efficiency Vermont also pride themselves on their technical expertise and
have a demonstrated ability to deliver such programs. These organizations see themselves as
equally capable of implementing EE programs as IOUs and believe utilities are better suited
to directing customers to independent resources and supporting measurement and verification
activities.

23
Utility EE administrators are already engaged with state and federal agencies on a number of
issues, including planning for EE goals and mandates, the development of efficiency codes
and standards, and coordination of utility administered programs with state and federal
efforts to ensure that programs complement rather than undercut one another. Utilities are
also actively engaged with counties, cities, and towns within their service territories to build
awareness among local officials of the importance of EE. While the third-party
administrators interviewed all have some involvement with state, federal, and local agencies
regarding the delivery of EE programs, their relationships tend to be less comprehensive than
that of utility administrators. This may be related to the more limited focus of third-party
administrators, whose mandate is often limited to efficiency.
Participation in and partnership with regional organizations has the potential to establish
consistent approaches to EE across state and utility service territory lines.
The importance of EM&V in assessing the effectiveness of efficiency programs continues to
grow. Budgets for EM&V activities currently range from 3-8% of total program budgets.
All respondents in this study indicated that they expect EM&V costs to increase over the next
few years.
The need for consistent industry-wide data and reporting standards is critical. Lack of
consistent data hampers program evaluation, measurement, and verification efforts, thereby
preventing effective comparison of energy efficiency to other energy resources. In addition,
lack of clarity and consistency in EM&V proceedings can present a major obstacle to EE cost
recovery, preventing program administrators and investors from viewing energy efficiency as
a sustainable business.

24
CONCLUSIONS AND RECOMMENDATIONS
Utilities continue to dominate the energy efficiency program delivery landscape, comprising
93% of the $4.4 billion in total efficiency budgets nationwide in 2009 as reported to CEE and
86% of kWh saved in 2008 as reported to EIA. Based on the available data, utilities appear
to be doing so in a more cost effective manner than state entity administrators. This may be
in part because of the public service and/or research nature of the program mission of state
entities. Limitations in available data prevent conclusive comparison of which
administration model is most efficient at delivering value for ratepayers on a program by
program basis. To make such a comparison, we recommend the establishment of
standardized reporting requirements and guidelines for evaluation, measurement, and
verification.
Based on the opinions of those interviewed, there are some roles that are best suited to one
program delivery model. Respondents indicate that state agencies are best positioned to
conduct outreach to low income customers, market transformation, and education functions
while IOUs are best suited to deliver programs that target energy efficiency as a resource and
that require more complex technical expertise.
Energy efficiency is an increasingly important energy resource. IOUs, state administrators,
regulators, legislators, and politicians increasingly accept the premise that energy efficiency
is currently the least-cost source of energy capacity. At an average cost of about $0.035 per
kWh saved, it is less expensive to save a kWh than the costs to construct and operate a
generation facility, regardless of the generation fuel source.
Utilities are required to publicly report generating capacity and sales and must do so using
standard reporting protocols. They document their expenditures on energy efficiency
programs and achieved savings in regulatory filings and hearings in order to obtain recovery
of costs and lost sales. Currently, the same transparency, accountability, and reporting
standards are not required for state administrators in reporting energy savings and demand
reductions achieved. This limits the ability to draw conclusions about comparative
effectiveness, and comparative accountability for expenditure of ratepayer funds.
Stakeholders would benefit from the accurate data that would result if all entities delivering
energy efficiency programs were required to similarly report energy savings and demand
reductions achieved.
Emerging carbon markets will put additional pressure on EE providers to be transparent and
adopt common reporting formats. Just as a market cannot operate if each state has a different
currency, the valuation of energy efficiency will require a common definition and reporting
scheme for efficiency program administrators.
All energy efficiency programs are ultimately funded by ratepayers through surcharges on
utility bills, regardless of whether IOUs or state administrators deliver the programs.
Accountability for ratepayer funds varies significantly. IOUs report rigorous public
information to regulators and state-based administrators have various reporting requirements
to boards, advisory committees, and other oversight organizations.

25
The legislated and/or regulatory targets established for utilities in many states should
similarly be imposed upon all entities delivering energy efficiency programs that receive
ratepayer funds, along with the financial penalties for non-attainment.
Finally, this paper recognizes the near term influx of federal funding for energy efficiency
programs, but does not consider this influx to be a long term influence. Efficiency funds and
programs in the American Recovery and Reinvestment Act are intended to be short term;
when those funds expire, existing utility and state entity administered programs will bear the
burden of keeping energy efficiency moving forward across the nation.

A-1
APPENDICES

A-2
APPENDIX A: IOU DESCRIPTIONS
CENTERPOINT ENERGY, INC.
CenterPoint Energy, headquartered in Houston, Texas is a domestic energy delivery company
that includes an electric transmission and distribution (wires-only) utility serving the Houston
metropolitan area, natural gas distribution, competitive natural gas sales and services, interstate
pipeline operations, and field services operations. The company serves more than five million
metered customers primarily in Arkansas, Louisiana, Minnesota, Mississippi, Oklahoma, and
Texas, but has just under two million retail electric customers, primarily in the Houston area.
Assets total over $19 billion. With about 8,600 employees, CenterPoint Energy and its
predecessor companies have been in business for more than 130 years.
CenterPoint Energy has seven energy efficiency programs:
Commercial and Industrial Standard Offer
Residential and Small Commercial Standard Offer
ENERGY STAR® Homes Market Transformation
Residential ENERGY STAR® Windows Market Transformation
Load Management Standard Offer
Hard-to-Reach Customer Standard Offer
Multifamily Water and Space Heating Programs
While the primary goal of the programs is to reduce peak demand within CenterPoint Energy‘s
service territory, several secondary goals provide the basis for the various program rules and
procedures. These secondary goals are to: make energy efficiency incentive programs available
to all customer classes, encourage private sector delivery of energy efficiency products and
services, maximize customer energy and bill savings, stimulate investment in efficient
technologies that are most likely to reduce CenterPoint Energy‘s peak capacity requirements, and
acquire cost-effective energy efficiency resources.

A-3
FLORIDA POWER & LIGHT (FPL)
FPL Group is a leading clean energy company with 2008 revenues of more than $16 billion and
more than 15,000 employees in 27 states and Canada. FPL serves more than 8.7 million people
throughout most of the east and lower west coasts of Florida. Headquartered in Juno Beach,
Florida, FPL Group‘s principal subsidiaries are Florida Power & Light Company, which serves
more than 4.5 million customer accounts in Florida and is one of the largest rate-regulated
electric utilities in the nation, and NextEra Energy Resources, LLC, North America‘s largest
generator of wind and solar renewable energy. Together, FPL‘s and NextEra Energy Resources‘
generating assets represent approximately 39,000 MW of capacity.
FPL began offering efficiency programs to customers in 1981. Through the end of 2008,
FPL‘s portfolio has achieved:
Residential Programs
2.57 million Home Energy Surveys performed
769,000 Building Envelope participants
1.17 million rebates for high-efficiency A/C systems
465,000 A/C duct system tests and repairs
20,800 FPL BuildSmart®
homes constructed
772,700 customers enrolled in the FPL On Call® program
Business Programs
129,100 Business Energy Evaluations performed
19,000 upgraded lighting systems installed
14,900 high-efficiency A/C systems installed
20,100 customers enrolled in the FPL Business On Call®
program
These efforts have allowed FPL to avoid building 12 medium-sized power plants.

A-4
NATIONAL GRID
National Grid USA is a wholly-owned subsidiary of London-based National Grid plc., and was
formed in 1990, when the U.K. government-run electricity system was privatized. Currently,
National Grid USA owns generation plants with capacity of over 4,000 megawatts and, through
its distribution systems, supplies electricity to approximately 3.4 million customers in New York
state, Massachusetts, Rhode Island, and New Hampshire.
In the U.S., National Grid is the largest distributor of natural gas in the Northeastern US, serving
customers in Massachusetts, New Hampshire, New York, and Rhode Island. National Grid also
has a number of businesses operating in related areas such as LNG importation, land
remediation, metering, and interconnectors. National Grid employs approximately 27,500
individuals, with 63% in the U.S. and 37% in the U.K. National Grid USA had revenue totaling
approximately $2.1 billion in 2008.
In 2007, a total of 293,773 customers participated in National Grid‘s energy efficiency programs:
283,704 residential customers, 8,543 low-income customers, and 1,526 commercial and
industrial customers. The programs achieved evaluated lifetime energy savings that exceeded
filed targets by 34% and evaluated lifetime demand savings that exceeded filed targets by 24%.
Based on savings, value, and performance metrics, National Grid received $2.8 million in
incentive payments after taxes for their 2007 efficiency efforts.
NV ENERGY, INC.
NV Energy has served citizens in Nevada and northeastern California for over 100 years. The
company was formerly three separate entities, Nevada Power, Sierra Pacific Power, and Sierra
Pacific Resources, which merged in July 1999. In 2008, two subsidiaries, Nevada Power
Company and Sierra Pacific Power, began operating under the name NV Energy. The new
company‘s service area covers approximately 54,500 square miles.
NV Energy provides electricity to 2.4 million electric citizens throughout Nevada and in
northeastern California as well as a state tourist population exceeding 40 million annually. NV
Energy also provides natural gas to more than 145,000 citizens in the Reno-Sparks area.

A-5
NV Energy prides itself on a three-part energy strategy that emphasizes a statewide focus on
energy efficiency and conservation, development of new renewable energy resources, and the
addition of the cleanest, most energy efficient new facilities fueled with traditional fossil fuels.
In 2008, NV Energy‘s energy efficiency and conservation initiatives saved nearly 435 million
kWh.
PACIFIC GAS & ELECTRIC (PG&E)
Pacific Gas and Electric Company, incorporated in California in 1905, is one of the largest
combination natural gas and electric utilities in the United States. Based in San Francisco, the
company is a subsidiary of PG&E Corporation. Pacific Gas and Electric Company and other
utilities in the state are regulated by the California Public Utilities Commission.
There are approximately 20,000 employees who carry out Pacific Gas and Electric Company‘s
primary business—the transmission and delivery of natural gas and electric service to
approximately 15 million people throughout a 70,000 square-mile service area in northern and
central California. Of these customers, 5.1 million are electric customers.
Through PG&E‘s 2006-2008 energy efficiency programs, customers saved enough energy to
power almost 800,000 homes and enough natural gas to heat another 145,000 homes for a year.
The greenhouse gases avoided were equal to taking 476,000 cars off the road for one year.
PG&E has won nearly 50 energy efficiency awards, including two ENERGY STAR®
awards in
2008.
In addition to energy efficiency, PG&E works to help manage energy demand. In 2008, PG&E
added two new demand response programs: PeakChoiceTM
, which eases large-commercial
customer engagement by allowing customers to tailor a demand response option that suits their
unique needs, and SmartRateTM
, which offers dynamic pricing for residential and small-business
customers. More than 10,000 customers signed up for the initial SmartRateTM
offering.
Over the next 10 years, PG&E plans to meet almost half of new energy demand through energy
efficiency.

A-6
SOUTHERN CALIFORNIA EDISON
A subsidiary of Edison International, headquartered in Rosemead, California, Southern
California Edison is the largest electric utility in California, serving more than 13 million people
in a 50,000 square-mile area of central, coastal, and Southern California (excluding the City of
Los Angeles and certain other cities).
SCE has been providing electric service in the region for more than 120 years and its service
territory includes more than 180 cities. As of December 2008, SCE had consolidated assets of
approximately $32.6 billion and approximately 17,000 employees.
Over the past five years, SCE‘s energy efficiency programs have saved more than 5 billion kWh.
These programs have reduced greenhouse gas emissions by nearly 2 million metric tons. During
the next two years, SCE plans to save an additional 2 billion kWh, reducing greenhouse gas
emissions by another 1 million tons. SCE‘s participation in the Department of Energy‘s
―Change a Light, Change the World‖ program has resulted in the installation of more than
935,000 CFLs. In April 2008, SCE received its seventh ENERGY STAR® award from the U.S.
Environmental Protection Agency and Department of Energy, recognizing the effectiveness of its
energy efficiency programs.

A-7
APPENDIX B: STATE ENTITY DESCRIPTIONS
EFFICIENCY MAINE
Efficiency Maine, founded in 1996, is a statewide entity that promotes the more efficient use of
electricity and helps Maine residents and businesses reduce energy costs. Efficiency Maine is
funded by electricity consumers through a ―system benefit charge,‖ which is a surcharge of less
than one cent per kWh sold by Maine electric utilities to all but the very largest industrial
customers. The surcharge amounts to about $8 per year on a typical residential electricity bill.
Efficiency Maine is overseen by the Maine Public Utilities Commission.
With the program investments, Efficiency Maine is helping consumers to understand and
implement efficiency options through incentives, training, and other initiatives. By statute,
Efficiency Maine reports annually to the Maine legislature regarding the results of the program
year and explains the costs and benefits of the various programs (all reports are available at
efficiencymaine.com). The goal is to deliver value cost-effectively, with a minimum of one
dollar saved for every dollar spent. Collectively, the Efficiency Maine‘s programs deliver
verified returns of three to four dollars per dollar spent.
In 2008, Efficiency Maine offered six distinct programs to meet its dual goals of market
transformation and resource acquisition. Overall, these programs saved 107,517 MWh, a 24
percent increase in savings from 2007, worth an estimated $122.5 million in lifetime economic
benefits. In terms of yield (dollars invested per kWh saved), Efficiency Maine generated savings
at a levelized cost of $.031 per kWh in 2008, 2¢ per kWh less than in 2007. Cumulative annual
savings since the inception of Efficiency Maine have grown to 316,108 MWh, representing an
estimated $310.3 million in avoided power purchases.
ENERGY TRUST OF OREGON, INC. (ENERGY TRUST)
The Energy Trust of Oregon is a public-purpose organization whose mission is to change how
Oregonians produce and use energy. In order to accomplish this goal, Energy Trust invests in
energy efficiency and renewable-energy generation that will help Oregonians save energy,
increase the comfort of their homes and businesses, and move toward energy independence.

A-8
Energy Trust began operation in March 2002, charged by the Oregon Public Utility Commission
(OPUC) with investing in cost-effective energy conservation, helping to pay the above-market
costs of renewable energy resources, and encouraging energy market transformation in Oregon.
A 1999 energy restructuring law required Oregon‘s two largest investor-owned utilities to collect
a three percent ―public purposes charge‖ from their customers and funded the Energy Trust from
this public purposes charge.
As part of its oversight of Energy Trust, the OPUC has performance measures to benchmark the
Energy Trust‘s performance. In 2009, these measures were:
Save at least 31 average megawatts of electricity, computed on a three-year rolling average
basis at a levelized cost of no more than 3.5 cents per kWh.
Save at least 1,800,000 therms of gas, computed on a three-year rolling average basis at a
levelized cost of no more than 60 cents per therm.
Secure at least 3 average MW (aMW) of new renewable resources per year, computed on a
three-year rolling average, from a variety of small-scale projects.
Earn an unqualified audit opinion.
Keep administrative and program support costs below 11 percent of annual revenues.
Maintain a reasonable level of customer satisfaction, as measured by surveys, and maintain
statistics on complaints.
Report the benefit/cost ratio for conservation acquisition programs based on the utility
system perspective and societal perspective; report any significant mid-year changes in
benefit/cost performance.
NEW YORK STATE ENERGY RESEARCH AND DEVELOPMENT AUTHORITY
(NYSERDA)
NYSERDA is a public benefit corporation created in 1975. NYSERDA‘s earliest efforts focused
solely on research and development with the goal of reducing the State‘s petroleum
consumption. Subsequent research and development projects focused on topics including
environmental effects of energy consumption, development of renewable resources, and
advancement of innovative technologies. In 1998, the NY PSC gave NYSERDA the additional
role of implementing energy efficiency programs to customers, which had previously been
delivered by the State‘s electric and gas utilities.
A-9
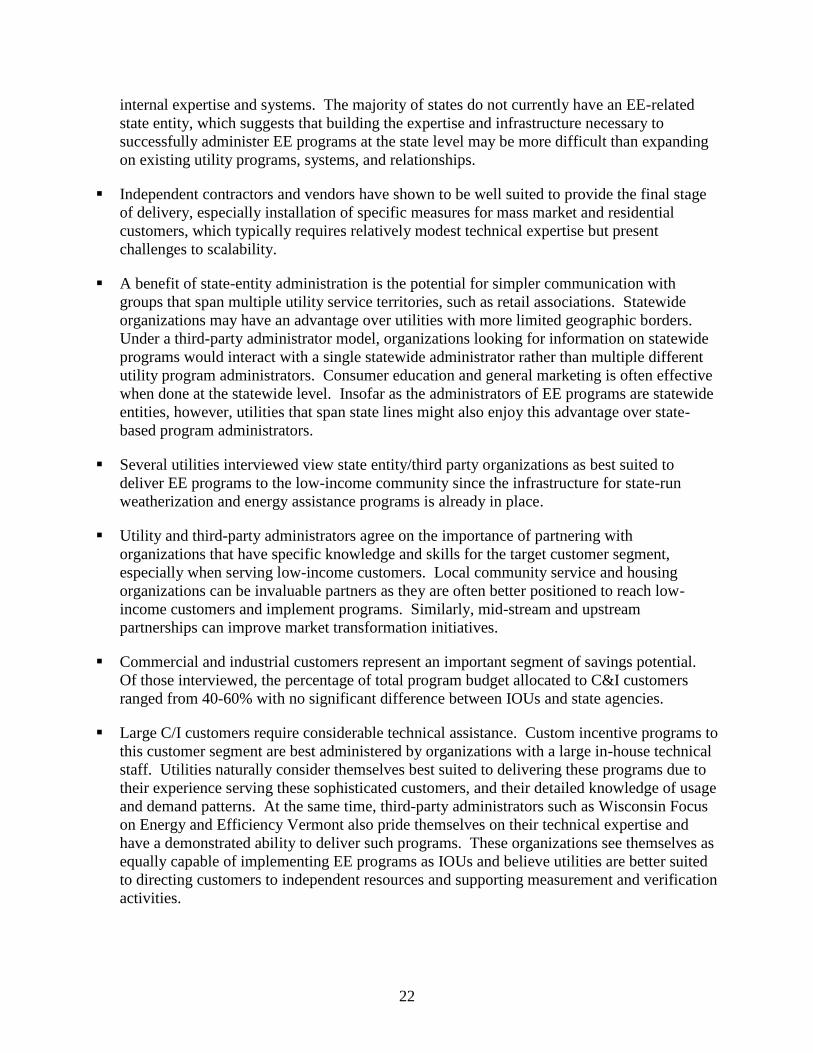
Consumers of electric and gas utilities in New York state pay fees that provide much of
NYSERDA‘s $335.8 million in annual revenue through the System Benefits Charge (SBC).8
Other funding comes from Federal grants, voluntary contributions from the New York Power
Authority and corporate donations. SBC funds are allocated for energy-efficiency programs,
research and development initiatives, low-income energy programs, and environmental
disclosure activities. The SBC also funds New York Energy SmartSM
, a program that seeks to
develop competitive markets for energy efficiency; demand management; outreach and
education services; research, development, and demonstration; low-income services; and to
provide direct economic and environmental benefits to New Yorkers.
NYSERDA strives to facilitate change through the widespread development and use of
innovative technologies to improve the state‘s energy, economic, and environmental wellbeing.
NYSERDA‘s programs and services provide a vehicle for the state to work collaboratively with
businesses, academia, industry, the federal government, the environmental community, public
interest groups, and energy market participants.
VERMONT ENERGY INVESTMENT CORPORATION (VEIC)
The Vermont Energy Investment Corporation (VEIC), founded in 1986, is a non-profit
organization with approximately 100 employees. VEIC‘s mission is to reduce the economic,
social, and environmental costs of energy consumption through the promotion of cost-effective
energy efficiency and renewable energy technologies. VEIC provides services for Efficiency
Vermont – the nation‘s first statewide ‗energy efficiency utility‘ – as well as Residential Energy
Services, Business Energy Services, and Planning and Evaluation Consulting.
In local, national, and international settings, VEIC has worked to design, critique, and improve
electric efficiency, gas efficiency, green building, renewable energy, and energy-efficient
product programs. VEIC also provides ongoing support during the implementation of efficiency
and renewable programs.
8 For more information on New York‘s SBC, see the New York State Public Service Commission website at:
http://www.dps.state.ny.us/sbc.htm

A-10
In the energy efficiency regulatory arena, VEIC provides cost effectiveness screening, expert
witness testimony, and program design, and evaluation services. Clients include consumer
advocates, environmental groups, government agencies, utilities, and other program
administrators in more than 20 states throughout the U.S., Canada, and other countries. VEIC
operates out of offices in Burlington, Vermont.
WISCONSIN FOCUS ON ENERGY
Wisconsin Focus on Energy was created in 1999 by the state‘s Office of Energy Independence to
help achieve Wisconsin‘s aggressive goal of meeting 25 percent of its electric needs and 25
percent of its transportation needs from renewable energy sources by 2025. Focus on Energy is
funded by Wisconsin‘s Public Benefits Program. The organization‘s goals are to help Wisconsin
residents and businesses manage rising energy costs, promote in-state economic development,
protect the environment, and control Wisconsin‘s growing demand for electricity and natural gas.
Focus on Energy is a consortium of organizations working toward these goals. Primary members
of the Focus on Energy program include: the Public Service Commission of Wisconsin,
Statewide Energy Efficiency and Renewable Administration (SEERA), Wisconsin Energy
Conservation Corporation, Energy Center of Wisconsin, PA Consulting Group, Wipfli LLP,
Virchow, Krause & Company LLC, and Science Application International Corporation (SAIC).
Focus on Energy works with eligible Wisconsin residents and businesses to install cost effective
energy efficiency and renewable energy projects. Focus on Energy provides information,
resources, and financial incentives to help implement efficiency projects that otherwise might not
be completed and to complete projects ahead of schedule.
As of 2007, Focus on Energy has helped consumers save nearly 249 million kWh and more than
15 million therms. Together, the 227,000 participants in the Focus on Energy Program have
saved more than $36 million in annual energy costs already this year – a 14 percent increase in
savings over last fiscal year.

A-11
APPENDIX C: INTERVIEW PARTICIPANTS
We wish to thank the organizations who participated in the interviews for this study.
Centerpoint Energy, www.centerpoint.com
FPL, www.fplgroup.com
National Grid, www.nationalgrid.com
NV Energy, www.nvenergy.com
PG&E, www.pge.com
Southern California Edison, www.sce.com
Efficiency Maine, www.efficiencymaine.com
Energy Trust of Oregon, www.energytrust.org
Vermont Efficiency Investment Corporation (VEIC), www.veic.org
Wisconsin Focus on Energy, www.focusonenergy.com
New York State Energy Research and Development Authority, www.nyserda.org
Figure 1: Map of Organizations Profiled in Study

A-12
APPENDIX D: INTERVIEW QUESTIONS
1. What is your current role in the delivery of energy efficiency programs?
2. Do you currently administer your own EE programs or contract them out? What is mix?
3. Which EE programs do you think that your company is best suited to deliver? Why?
4. Are there some programs that other organizations are better suited to administer? Which
ones? Why?
5. Approximately, what percentage of total energy efficiency program costs each year is
devoted to supporting monitoring and evaluation? How do you see the EM&V process
changing in the future?
6. Is your company currently cooperating with any state or federal agency in the delivery of
energy efficiency programs (Energy Efficiency Block Grants, American Recovery and Act or
stimulus money)? If so, what is your role?
7. Based on your experience, what are the 2 or 3 things that utilities are best suited to do
regarding energy efficiency programs?
8. Based on your experience, what are the 2 or 3 things that other organizations are best suited
to do regarding energy efficiency programs?
9. Are there specific programs where a partnership between a utility and another organization
makes sense? Which ones?
10. For your company, what is your forecast of savings due to energy efficiency programs over
the next 5 to 10 years?

A-13
APPENDIX E: DETAILED FINDINGS FROM INTERVIEWS WITH ELECTRIC
UTILITIES
To gain insight into energy efficiency programs from investor-owned utilities, interviews were
conducted with six major IOUs from across the country.
The discussion topics included the following:
The role of the IOU in the delivery of EE programs and the role of third party providers.
Opinions regarding which programs are best suited for delivery by IOUs and which are better
suited to delivery by third parties.
The costs related to EM&V and opinions regarding future changes in the EM&V process.
The role of the IOU in working with state and federal agencies regarding the delivery of EE
programs.
Opinions regarding partnerships with other organizations.
Forecasted savings due to EE programs.
A list of questions asked is provided in Appendix C. Conclusions from these interviews are
summarized below.
CENTERPOINT ENERGY
The role of the IOU in the delivery of EE programs and the role of third party
providers:
CenterPoint operates in the state of Texas.
CenterPoint administers the entire process including preparing EE plans and determining
which programs to offer.
CenterPoint must contract with competitive energy efficiency providers to deliver the
measures to customers.
Opinions regarding which programs are best suited for delivery by IOUs and which are
better suited to delivery by third parties:
The utility is best suited to develop those EE programs that need to educate customers and
need a lot of knowledge base.
The utility is best positioned to drive EE market transformation and work with entities such
as Energy Star to bring the benefits to its customers.

A-14
Currently there are no statewide EE-related entities in Texas and therefore all programs are
administered by utilities.
The utility is currently not allowed to perform energy audits.
The costs related to EM&V and opinions regarding future changes in the EM&V
process:
Annual EM&V costs are capped at 5 percent of the total budget—actual percentages are less.
The utility does not anticipate any near term changes in this amount.
The role of the IOU in working with state and federal agencies regarding the delivery
of EE programs:
CenterPoint is focusing on making its programs complement state and federal EE spending
programs.
The utility helps educate its various counties, cities, and towns regarding potential energy
and cost savings that may be achieved through the implementation of EE measures.
Opinions regarding partnerships with other organizations:
The utility works closely with local organizations such as Sheltering Arms Senior Services,
Rebuilding Houston, and the City of Houston, regarding educating the entities about the
benefits of installing EE measures and how to receive funds from the utility for EE programs.
These community based organizations are better positioned to reach low income customers
and implement programs.
These organizations can also combine EE programs with other services.
Forecasted savings due to EE programs:
In 2008 the utility‘s goal for its customers was 105,000 MWh.
There is currently a demand goal of meeting 20 percent of expected demand growth through
EE, which translates to about 40 MW of capacity reduction.
FLORIDA POWER AND LIGHT
The role of the IOU in the delivery of EE programs and the role of third party
providers:
FPL operates in the State of Florida.
FPL administers the entire DSM program process including program development,
implementation, and operations.

A-15
FPL‘s delivery process is supported by thousands of trade allies, who are participating
independent contractors.
FPL‘s staff is qualified to perform EE audits; FPL uses internal specialists to support more
complex DSM evaluations, such as for commercial HVAC systems. FPL may also fund
feasibility studies performed by external parties for complex HVAC-related system designs.
FPL supplements its staff with vendors to assist with staff training and other support
requirements, as needed.
There is no requirement to utilize third party vendors in Florida.
Opinions regarding which programs are best suited for delivery by IOUs and which are
better suited to delivery by third parties:
EE measure research and development re best provided by organizations such as EPRI and
universities with FPL acting in a project oversight role.
There are no statewide EE-related entities in Florida, and therefore all programs are
administered by utilities. The utilities have been administering robust programs to meet the
needs of Florida‘s citizens, as specified by Florida statutes.
FPL has customers‘ trust and uses its many contact points to inform and educate customers
about the benefits of EE measure installation, energy saving practices, and load management
programs.
FPL understands it customers‘ needs and is recognized as the energy expert by its customers,
so it is best suited to develop EE programs, develop the marketing strategy, manage delivery,
and provide program administration functions.
The final stage of delivery of EE programs is best provided by vendors, i.e., participating
independent trade contractors qualified to install the specific EE measures.
The costs related to EM&V and opinions regarding future changes in the EM&V
process:
Annual EM&V costs are budgeted at 3 percent to 4 percent of the total program budget.
There is no anticipated change expected in EM&V costs.
Potential changes in the process may come about in the future due to a nationwide industry
movement to standardize the EM&V approach and/or from a desire for EM&V to be used
with an emphasis on prospective continuous improvement rather than a focus on
retrospective application.
The role of the IOU in working with state and federal agencies regarding the delivery
of EE programs:
FPL works with the State Energy Office on energy plans and EE programs.

A-16
FPL also works with the State of Florida regarding its weatherization assistance programs
and how to coordinate these offers with the utility‘s EE programs.
FPL works with the state, counties, cities, and towns on state and federal funding programs.
Opinions regarding partnerships with other organizations:
The utility works closely with local community organizations to educate them regarding the
benefits of installing EE measures and how to receive funds from the utility for EE programs.
These community-based organizations are sometimes better positioned to reach a local
community customer base and help promote the utility‘s EE programs.
These organizations can also combine the utility‘s EE programs with other services, such as
customer assistance programs.
FPL also works with state government entities on state building codes and participates in
federal programs such as ENERGY STAR.
Forecasted savings due to EE programs:
In 2009 the utility‘s incremental DSM Program goal is 100,000 MWh of energy savings and
78.7 MW of Summer peak demand reduction.
NATIONAL GRID
The role of the IOU in the delivery of EE programs and the role of third party
providers:
National Grid operates in four states (Massachusetts, New York, New Hampshire, and Rhode
Island) and therefore must manage four distinct state regulatory processes.
The States have an expectation that the utility will bid most of the EE programs delivery
work out to third party EE providers, in an effort to keep the utility‘s costs to a minimum
(i.e., 15-25% of total costs). Most of the costs of programs are spent on customer equipment
and vendor delivery services.
National Grid determines EE measures for potential utilization, plans and designs the
programs, estimates the potential for EE savings, and then implements, delivers, and
administers the overall EE corporate program.
The utility‘s capability to manage the scale of the residential and small-commercial customer
markets is well established, including its bidding processes for vendor delivery support.
The utility depends on third party vendors for EE program delivery support, especially in the
mass-residential and small-commercial & industrial markets.
The utility is in a unique position through its large C&I account managers to bring a ―tool
box of services to their customers.‖ The account managers‘ ―tools‖ include deep knowledge

A-17
of the utility‘s EE programs, proper application of individual EE measures for specific
customer needs, and strong understanding of the customer‘s business and
manufacturing/operating processes. For large C&I customers with unique applications that
require a higher level of technical engineering, National Grid will have third party
engineering or specialty firms provide the technical study for specific applications.
Opinions regarding which programs are best suited for delivery by IOUs and which are
better suited to delivery by third parties:
The utilities have been offering all programs for many years, from low income residential
markets to the largest C&I accounts.
Compared to the smaller programs for residential and small C&I customers, large C&I
programs require a greater amount of utility support, which is efficiently provided through
the one-on-one relationships between the customer and the utility‘s large account managers.
The majority of residential and small commercial customers‘ delivery requirements are best
served by vendors.
Direct load control—third party aggregators in the company‘s New England territory have
large numbers of direct load control customers compared with the utility. Due to the focus of
their business model, third party aggregators have the processes in place to manage their
customers well.
The ability of a statewide entity to administer and deliver EE programs depends on what
capabilities a state has to offer. Some can offer successful programs to residential and small
C&I customers, for example in Massachusetts, Action Inc. delivers the low-income programs
very effectively through the Community Action Programs (CAP) agencies. Many other
states would be challenged by the lack of internal expertise and systems to deliver programs,
for example, large C/I programs are best offered by utilities because of the relationships
between account managers and customers.
The costs related to EM&V and opinions regarding future changes in the EM&V
process:
Annual EM&V costs are approximately 5 percent of the total budget and may vary slightly
by state.
The increasing amount of money being spent on EE programs annually may result in
regulatory authorities seeking further review and scrutiny to ensure that funds are being
wisely spent. National Grid is observing an increasing trend towards greater emphasis on
M&V, both in quality and quantity.
Annual regulatory filings are a huge effort for the utility and vary by state. For example,
Massachusetts requires evaluations of all programs, a significant amount of customer studies,
and for large projects to perform ―before and after‖ metering analyses.

A-18
The utilities must continue to be involved in the dialog with regulators and stakeholders
regarding the future M&V process. While utilities have the data and billing systems, having
a third party provide specific components of M&V can help avoid any question of reporting
bias.
The role of the IOU in working with state and federal agencies regarding the delivery
of EE programs:
National Grid coordinates closely with the Massachusetts State Energy Office regarding its
Weatherization program.
The utility helps educate its various counties, cities, and towns regarding potential energy
and cost savings that may be achieved through the implementation of EE measures. They
also help educate these entities regarding available grants.
National Grid works closely with the federal and state governments on energy efficiency
standards and state building codes.
Opinions regarding partnerships with other organizations:
Regional organizations, such as Northeast Energy Efficiency Partnerships, focus on regional
EE programs and help bring a consistent approach to EE across states by sharing EE ideas,
and fostering open dialog and trust among members.
Regarding Block Grants—National Grid helps cities and towns identify and make known
efficiency opportunities.
Forecasted savings due to EE programs:
In 2008 the utility‘s goal for its customers across all four states was 450,000 MWh saved.
This amount is expected to grow to 900,000 MWh in 2012.
NV ENERGY
The role of the IOU in the delivery of EE programs and the role of third party
providers:
NV Energy operates in the state of Nevada.
NV Energy administers the entire process including preparing IRP plans and determining
which programs to offer. The utility handles delivery of all programs to customers through
vendors selected through an RFP process.
The utility also monitors customer satisfaction with awareness and delivery of programs.
A-19
Opinions regarding which programs are best suited for delivery by IOUs and which are
better suited to delivery by third parties:
The utility is best suited to develop EE programs, marketing strategy, manage delivery, and
offer the umbrella under which all programs are administered.
The utility is in the best position to administer, deliver, and maintain relationship oriented
programs, e.g., direct load control.
Short life EE programs, such as pool pump replacements, are best delivered by vendors
rather than by adding utility staff.
There are no statewide EE-related entities in Nevada, and therefore all programs are
administered by utilities. However, if there were a statewide entity, that entity might be best
positioned to administer low income weatherization programs, since a governmental entity
may have better access to income data to help identify at-risk customers.
The costs related to EM&V and the opinions regarding future changes in the process:
Annual EM&V costs are budgeted at 5 percent of the total budget.
The future direction of the cost of EM&V is not certain due to potential additional scrutiny.
This increased scrutiny may result from the company‘s legislative efforts to recover lost
revenues that result from EE measure implementation.
The role of the IOU in working with state and federal agencies regarding the delivery
of EE programs:
NV Energy is focused on making its programs complement State and Federal EE spending
programs. As an example, the utility is targeting its lighting programs to the same customers
covered by the weatherization programs with Stimulus funding, so multiple improvements
are implemented at the same time.
The State Energy Office is the entity working with counties, cities and towns on state and
federal funding programs.
Opinions regarding partnerships with other organizations:
The money collected through the Universal Energy Conservation Fund is distributed to non-
profit organizations throughout the state that perform low income weatherization activities.
Consumers above the low income threshold are offered EE measures by the utility.
NV Energy works with national accounts to educate and promote EE programs. National
account headquarters need to be supportive of the utility‘s EE program efforts and push down
the programs to their retail outlets.

A-20
Certain vendors are best positioned to help educate and promote EE measures. For example,
vendors that support the water industry, are best positioned to educate consumers and
promote EE measures relevant to the water industry.
Forecasted savings due to EE programs:
In 2008 the utility‘s goal for its customers was 400,000 MWh (approximately 1.5% of total
load).
In 2009 the goal is 400,000 MWh.
PACIFIC GAS & ELECTRIC
The role of the IOU in the delivery of EE programs and the role of third party
providers:
PG&E operates in the state of California.
PG&E administers all EE programs in its service area, including program design,
development, implementation, and operations.
The utility is required by the CPUC to have 20% of its EE programs supported by third party
vendors.
The utility utilizes a large matrix of pre-approved vendors with varying skills to support the
programs.
PG&E has 85 individual EE programs.
Opinions regarding which programs are best suited for delivery by IOUs and which are
better suited to delivery by third parties:
PG&E is well equipped to take the long term view regarding EE processes and programs.
The utility runs the CPUC-funded low income weatherization program and the CSD (state
agency) runs the federally funded program.
PG&E participates in the Flex Your Power campaign. Flex Your Power is California‘s
statewide energy efficiency marketing and outreach campaign and a partnership of
California‘s utilities, residents, businesses, institutions, government agencies, and nonprofit
organizations working to save energy.
The utility has a long-standing relationship with its customers‘ needs and brings economies
of scale to the administration of EE programs that cannot be matched by other organizations.
The final stage of delivery of end use EE programs (i.e., measure installation) is best
provided by vendors.

A-21
The costs related to EM&V and opinions regarding future changes in the EM&V
process:
Annual EM&V costs are required by the state to be budgeted at 8% of the total budget (of
which 5% is for M&V and 3% is for market research and program improvements).
The process should be reexamined with the goal of getting the most value for the customers
out of the M&V process.
The role of the IOU in working with state and federal agencies regarding the delivery
of EE programs:
PG&E works with counties, cities, and towns on state and federal funding of EE related
programs. PG&E also helps these entities develop programs to spend availabe EE funds
more effectively.
The utility also has a significant program to train state weatherization contractors.
Opinions regarding partnerships with other organizations:
The utility works closely with state and local community organizations as well as large
institutions (universities, hospitals, Department of Corrections, etc.) to educate them
regarding the benefits of installing EE measures and how to receive funds from the utility for
EE programs.
Vendors and community-based organizations hired by the utility work directly with
customers since they are often better positioned to reach customers and implement programs.
PG&E also works closely with the federal and state governments on energy efficiency
standards and state building codes.
Forecasted savings due to EE programs:
In 2008 the utility‘s goal for its customers was 1,053,000 MWh.
SOUTHERN CALIFORNIA EDISON
The role of the IOU in the delivery of EE programs and the role of third party
providers:
SCE operates in the state of California.
The utility administers all EE programs including program design, development,
implementation, and operations.
The utility is required by the CPUC to have 20% of its EE programs supported by third party
vendors.

A-22
Opinions regarding which programs are best suited for delivery by IOUs and which are
better suited to delivery by third parties:
There are no statewide EE-related entities in California that administer SCE programs.
The utility runs the CPUC-funded low income programs and the CSD (state agency) runs the
federally funded programs.
SCE understands its customers‘ needs and perspective and is best suited to develop EE
programs, marketing strategy, and to manage program administration.
The utility‘s existing relationships with customers represent unique benefits of utility
administration of EE programs not reproducible by third-party administrators that facilitates
the success of those programs.
Final engineering for certain EE projects may be performed by third parties under the
direction of SCE administration.
The costs related to EM&V and opinions regarding future changes in the EM&V
process:
Annual EM&V costs are required by the state to be budgeted at 8% of the total budget (of
which 5% is for M&V and 3% is for market research and program improvements).
The process is cumbersome and could be reexamined with the goal of getting the most value
for the customers out of the M&V process.
The role of the IOU in working with state and federal agencies regarding the delivery
of EE programs:
SCE works with the state, counties, cities and towns on state and federal funding of EE
related programs.
Opinions regarding partnerships with other organizations:
SCE works closely with local community organizations as well as large institutions
(universities and hospitals, etc.) to educate decision-makers regarding the benefits of
installing EE measures and how to receive funds from the utility for EE programs.
Community based organizations can facilitate the delivery of some programs to customers by
combining the utility‘s EE programs with other services.
SCE works closely with the federal and state governments on energy efficiency standards
and state building codes.

A-23
Forecasted savings due to EE programs:
In 2008, SCE‘s EE programs produced about 1.7 million MWh in energy savings for its
customers on a net basis (i.e., savings attributed to utility efforts), with an average annual
spending level of approximately $250 million over the 3 year period.

A-24
APPENDIX F: DETAILED FINDINGS FROM INTERVIEWS WITH STATE ENTITIES
Interviews were conducted with representatives of each of five statewide efficiency
administrating organizations from across the country. A list of questions asked is provided in
Appendix C. Conclusions from these interviews are summarized below.
EFFICIENCY MAINE
The role of the third-party administrator in the delivery of EE programs and the role of
IOUs:
Efficiency Maine administers its programs through a mix of efforts:
o Some programs are designed in-house and then bid out to independent contractors for
program implementation. This process represents about 70% of funds.
o Other programs are designed in-house and then enter into a contract or MOU/grant
with an organization that specializes in the program delivery to the target market
(almost exclusively low income). This process represents about 20% of funds.
o The remaining 10% of funds are administered in-house in the form of education,
special programs, and small grants.
The costs related to EM&V and opinions regarding future changes in the EM&V
process:
Annual EM&V costs are 1.3-1.4% per year.
EM&V costs are relatively low because Efficiency Maine is a part of the public utility
commission.
Funding for EM&V will continue to come primarily from rate payers.
The Northeast has a regional EM&V forum to foster collaboration of efforts in EM&V.
Opinions regarding partnerships with other organizations:
Implementing energy efficiency with demand response would make sense.
Forecasted savings due to EE programs:
2008 savings totals are expected to be nearly 108,000 MWh.

A-25
ENERGY TRUST OF OREGON, INC.
The role of the third-party administrator in the delivery of EE programs and the role of
IOUs:
Energy Trust of Oregon, Inc. (Energy Trust) is an independent non-profit organization
dedicated to energy efficiency and renewable energy generation.
Energy Trust is funded by a 3% public purpose charge on the bills of utility customers.
Energy Trust is accountable to the Oregon Public Utility Commission (OPUC).
All programs except industrial and renewable energy programs are competitively bid and
contracted out.
Programs with large industrial customers are managed in-house because of the long-term
nature of these relationships.
OPUC has adopted minimum performance measures against which to benchmark Energy
Trust‘s performance. These benchmarks include:
o Save at least 31 MW/year at a levelized cost less than $0.035/kWh.
o Save at least 1,800,000 therms of gas at a levelized cost less than $0.60/thm.
o Secure at least 3 MW of new renewable resources per year.
Opinions regarding which programs are best suited for delivery by third parties and
which are better suited to delivery by IOUs:
Energy Trust collaborates with the four IOUs in Oregon for: customer communication, co-
branding initiatives, campaigns, and co-sponsored events.
The organization engages in least cost planning with each IOU.
Energy Trust has a fuel neutral policy and does not promote fuel switching.
The costs related to EM&V and the opinions regarding future changes in the process:
Annual EM&V costs are approximately 3 to 5 percent of the total budget.
One change in the EM&V process has been to solicit customer feedback sooner in order to
help improve program design.
Overall, no major changes in the structure and philosophy surrounding EM&V.

A-26
The role of the third party administrator in working with state and federal agencies
regarding the delivery of EE programs:
Energy Trust has been successful in partnering with the U.S. Department of Agriculture to
leverage renewable energy funds. Less has been done in terms of EE partnerships.
The Oregon State Department of Energy elected to funnel federal stimulus money to public
entities only, consistent with their adopted state energy plan. As a result, Energy Trust
expects to provide matching funds for some eligible public projects.
Opinions regarding partnerships with other organizations:
Energy Trust works most often with utilities to reach customers, increase awareness of no-
cost and low-cost energy saving actions, promote Energy Trust products and services, and
encourage customer participation.
Energy Trust also works with many other organizations, including the Oregon Department of
Energy, the Oregon Department of Housing and Community Services, the NW Energy
Efficiency Alliance, the NW Energy Efficiency Task Force and many non-profit and trade
groups, cities and counties who share a similar interest and mission.
The organization is vendor-driven, relying upon over 1200 independent contractors to
implement efficiency programs.
Forecasted savings due to EE programs:
To date, Energy Trust has invested $320 million resulting in customer energy savings of over
$440 million.
NEW YORK STATE ENERGY RESEARCH & DEVELOPMENT AUTHORITY
The role of the third-party administrator in the delivery of EE programs and the role of
IOUs:
Currently, NYSERDA directly administers all EE programs in the State, although the New
York Public Service Commission (PSC) recently approved $166 million in funding for
utility-administered EE programs, a decision that included most of the state‘s major electric
and gas utilities.
Programs are administered by NYSERDA staff with third-party contractors when needed.
The ―Clean Energy Strategy‖ for New York, called the ―15 by 15 Plan‖ calls for a 15%
reduction in the currently forecasted level of electricity consumption in the state by the year
2015. NYSERDA is engaged with utilities in a proceeding with the PSC to develop an
aggregated approach toward reaching ―15 by 15.‖

A-27
Opinions regarding which programs are best suited for delivery by third parties and
which are better suited to delivery by IOUs:
Both NYSERDA and utilities are well suited to deliver efficiency programs.
NYSERDA expects to continue in its program administrator capacity at least through the
current funding period ending in 2011
Over the years, NYSERDA has developed strength in offering more comprehensive EE
programs.
The costs related to EM&V and opinions regarding future changes in the EM&V
process:
NYSERDA‘s EM&V budget was recently increased from 2% to 5% of program funding.
This increase occurred in response to an order in the Energy Efficiency Portfolio Standard
(EEPS) case discussing the need for a high level of rigor around the impact of energy savings
to meet the ―15 by 15‖ goal.
The 5% budget in the EEPS case set a precedent as the new level for evaluation funding for
many programs.
The funding increase provides more opportunity for larger baseline usage studies.
The role of the third party administrator in working with state and federal agencies
regarding the delivery of EE programs:
NYSERDA and the utilities have experience offering energy efficiency programs in New
York.
Organizations like NYSERDA might be better suited to administering statewide programs
versus utilities that have more limited geographic boundaries within New York State. Third-
party administration of such programs might be mechanically more efficient, as third parties
are not bound by service territories. But, that does necessarily mean third-party
administration is ―better.‖
Another benefit of third-party administration is better communication with associations or
groups that cover areas across service territories, such as retail associations. Under the third-
party model, participating organizations only have to contact one group for comprehensive
program information rather than six different utilities.
Opinions regarding partnerships with other organizations:
NYSERDA has applications in for ARRA-funded energy efficiency block grants. These
applications are pending.
NYSERDA has received funding from federal programs apart from the recent ARRA
funding and has worked very closely with the U.S. Department of the Energy.

A-28
CAIR (Clean Air Interstate Rule), which is essentially a federal cap-and-trade program to
mitigate ozone reduction, funds are paid directly to NYSERDA.
Regionally, NYSERDA works with the Mid-Atlantic and Northeastern states on the Regional
Greenhouse Gas Initiative, which aims to reduce CO2 emissions. Again, this is essentially a
cap and trade program, where proceeds from auctions for offsetting emissions also flow
through NYSERDA.
Currently, NYSERDA has pending proposals before the New York Department of State to
run Energy Code programs and before the Department of Labor for workforce development
programs. NYSERDA has also partnered with LIPA on programs in their service territory.
WISCONSIN FOCUS ON ENERGY
The role of the third-party administrator in the delivery of EE programs and the role of
IOUs:
Wisconsin Focus on Energy contracts with the Wisconsin Energy Corporation to manage
their industrial programs.
Focus on Energy helps identify solutions for energy efficiency and manages direct account
relationships with customers, maintaining a field staff of engineers that work directly with
customers, providing technical and application support.
The organization assists with the grant approval process, including determining grant
amounts, adjusting for eligibility and program limits, and ensuring that what is needed fits
within program parameters.
Wisconsin Focus on Energy takes on major industrial efforts through cluster initiatives, i.e.,
Focus on Energy targets five to six industries where their efforts can be produce the greatest
impact. These industries include pulp and paper, milk processing, metal casting, plastics,
printing, and a special cluster for water and wastewater that focuses on municipalities and
utilities.
Wisconsin Focus on Energy also has an energy management program in which a trainer visits
participating facilities to provide a program overview and calculation tools, helps develop
internal energy efficiency plans, and shepherds the projects through funding application and
approval processes.
Opinions regarding which programs are best suited for delivery by third parties and
which are better suited to delivery by IOUs:
Third-party administration might be better for custom programs because of greater
engineering expertise.
Energy management and training are core services provided by Focus on Energy.

A-29
The best roles for utilities would be connecting customers with independent resources,
supporting energy management with customers (partnering with a third-party administrators),
and supporting M&V activities. Utilities are best suited to M&V because customers want
assurance from the utility that the measures they implement capture verifiable energy
savings.
The costs related to EM&V and opinions regarding future changes in the EM&V
process:
Wisconsin Focus on Energy separates evaluation from monitoring & verification.
o Impact evaluation is between 5-10% of total budget.
o M&V is ―pretty small,‖ 1-2% of total budget at most.
The role of the third party administrator in working with state and federal agencies
regarding the delivery of EE programs:
Wisconsin Focus on Energy runs the state‘s EE programs and makes monthly reports to the
Wisconsin Energy Conservation Corporation (WECC) to discuss issues and progress.
The WECC approves program applications grants of $40,000-$100,000. Grants above
$100,000 require Public Utility Commission approval.
Wisconsin Focus on Energy works with the Department of Energy in an energy assessment
program. The Department of Energy identifies recommended efficiency projects for
customers to implement; Focus on Energy then follows up with incentives and technical
support to increase likelihood that these projects are completed.
Focus on Energy is currently completing a renegotiated bid for the Save Energy Now
program, which would take place over a three year period and include additional Department
of Energy training.
The organization is also responding to a Department of Energy funding opportunity related to
combined heat and power and general industrial efficiency, and plans to submit a multi-
million dollar proposal for ARRA funds.
Opinions regarding partnerships with other organizations:
Wisconsin Focus on Energy has a subsidiary called Clean Tech Partners that works to
commercialize emerging technology.
Focus on Energy also works with agencies such as the Compressed Air Challenge, a
voluntary collaboration of industrial users; manufacturers, distributors and their associations;
consultants; state research and development agencies; energy efficiency organizations; and
utilities.

A-30
Forecasted savings due to EE programs
In the last five years, Wisconsin Focus on Energy saved about 200 GWh or 22 million
therms.
VEIC
The role of the third-party administrator in the delivery of EE programs and the role of
IOUs:
VEIC was founded in 1986 with a mission to reduce the costs, both monetary and
environmental, of energy use.
VEIC works nationally and internationally with utilities, regulatory agencies, and energy
advocacy groups to design programs that reduce energy use through energy efficiency and
renewable energy.
Vermont Energy (VE) is a division of VEIC and is under a performance based contract with
state regulators to deliver 150 MW of demand reduction and energy savings at a defined cost.
VE has been the state‘s EE utility since 1999.
VE has a large staff (160 full-time employees) serving 330,000 electric customers in
Vermont.
VE has the authority to subcontract services to third-party organizations.
Opinions regarding which programs are best suited for delivery by third parties and
which are better suited to delivery by IOUs:
VE has a large and highly trained technical staff capable of implementing EE programs
across all customer sectors.
Growth in budgets and savings goals has required a large staff and the need for technical
expertise. These two characteristics make VE unique from other statewide entities and rival
the staff of experienced IOUs.
VE has taken an account management approach with large C&I customers and has
established close and lasting relationships with large end-users.
Statewide agencies are equally capable of implementing EE programs and servicing
customers as IOUs. In fact, if statewide agencies are well trained and customer-focused, they
may be better at delivering EE.
The costs related to EM&V and opinions regarding future changes in the EM&V
process:
Vermont Energy‘s EM&V budget is roughly 5% of total budgets.

A-31
Vermont‘s Department of Public Service reviews the EM&V results and typically hires its
own evaluation consultant.
VE‘s performance contract includes a financial incentive that is awarded at the end of the
contract period, requiring a rigorous impact verification which includes metering.
The role of the third party administrator in working with state and federal agencies
regarding the delivery of EE programs:
VEIC works with Vermont customers who are applying for federal grants and/or economic
stimulus money and advising customers on how to best use the funds.
VEIC also advises clients in other jurisdictions on this issue.
Opinions regarding partnerships with other organizations:
Partnering with organizations that have a specific knowledge or skill for a customer segment
(e.g., low income) makes sense.
Partnering with different fuel providers (such as gas utilities and electric utilities) provides a
more efficient delivery mechanism. A utility could take a ‗whole-building‘ approach and
implement EE measures across all fuels.
Forecasted savings due to EE programs:
VE expects to save 4.5% of XXXX in 2009, an increase from 1.75% in 2007.
VE‘s goal is to sustain annual savings of 2-3% over the next 10 years.
The organization expects EE savings to play an increasing role in the resource planning
process, particularly with respect to mitigating transmission and distribution constraints.

A-32
APPENDIX G: BLACK & VEATCH TASK DESCRIPTIONS
Task 1. Situation Analysis – Briefly characterize the landscape of EE delivery, summarizing the
numbers and types of entities in a tables and graphics. Identify candidate state EE agencies and
utilities for examination in the study. Briefly characterize the two types of models as to tenure,
types of programs delivered, size variables (market reach, budgets, etc.). Develop a set of
metrics to be used in the comparative review. The metrics will be based upon readily available
data from public sources. Metrics will include a set of variables characterizing the costs of
implementation as well as the benefits obtained from the programs. The programs will be ranked
and scored along this set of metrics/indices.9
Task 2. Case Studies – Review the literature and obtain reports and other materials to select a
subset of entities for in-depth examination in the study using a set of selection criteria mutually
agreed upon with IEE. We envision examining up to three IOUs and three state agencies,
depending upon the amount of data readily available.
Task 3. Key Person Interviews – The Black & Veatch team will develop a short list of topics
to guide interviews with a selection of key individuals from the IOU and state entities regarding
EE program costs and benefits. The purpose of the interviews will be to confirm our
understanding of published data, clarify any questions, and capture any additional factors that
affect differences in costs, benefits, and achievements of the two types of entities. We will also
seek to understand the respondents‘ views on appropriate roles going forward, best ways of
working together, and key success factors. There will be six interviews—three for each type of
entity selected
Task 4. Reporting – The Black & Veatch team will then summarize its findings, and prepare a
draft report covering all aspects of the investigation, references, and conclusions. Revisions will
be made incorporating comments from IEE and a review committee, and a final report prepared.
One review cycle is assumed. A final editorial review will be conducted prior to delivery. Upon
request, we will also prepare a summary presentation in PowerPoint appropriate for an IEE
membership meeting, to be determined.
9 ACEEE used a similar rating approach in its study references above. Other meta-evaluation studies have
employed similar techniques for comparing programs.
A-33
KEY SOURCES
Kushler, Martin, Dan York and Patti White, American Council for an Energy-Efficiency
Economy, Five Years In: An Examination of the First Half-Decade of Public Benefits Energy
Efficiency Policies, Report Number U042, April 2004.
Charles River Associates, Primer on Demand-Side Management, CRA Document D06090,
February 2005
Kushler, Martin, Dan York and Patti White, American Council for an Energy-Efficiency
Economy, Five Years In: An Examination of the First Half-Decade of Public Benefits Energy
Efficiency Policies, Report Number U042, April 2004.
Florida Public Service Commission, Florida Energy-Efficiency and Conservation Act, February
2006.
Oregon Public Utility Commission, Energy Trust of Oregon, Recommendation for 2008-2009
Performance Measurement Order 08-529, 2007


For more information contact:Institute for Electric Efficiency701 Pennsylvania Avenue, N.W.Washington, D.C. 20004-26961.202.508.5440www.edisonfoundation.net/iee