Embed Size (px)
Citation preview
University of Missouri, St. LouisIRL @ UMSL
Dissertations UMSL Graduate Works
8-23-2006
A COMPARISON OF ACHIEVEMENTLEVELS IN MATHEMATICS AND SCIENCE,AND CURRENT ATTITUDES, OFSECONDARY STUDENTS IN A SIX-PERIODDAILY SCHEDULE, WITH THOSE OFSTUDENTS IN A ROTATE-EIGHT BLOCKSCHEDULEBrad J. HegerUniversity of Missouri-St. Louis, [email protected]
Follow this and additional works at: https://irl.umsl.edu/dissertation
Part of the Education Commons
This Dissertation is brought to you for free and open access by the UMSL Graduate Works at IRL @ UMSL. It has been accepted for inclusion inDissertations by an authorized administrator of IRL @ UMSL. For more information, please contact [email protected].
Recommended CitationHeger, Brad J., "A COMPARISON OF ACHIEVEMENT LEVELS IN MATHEMATICS AND SCIENCE, AND CURRENTATTITUDES, OF SECONDARY STUDENTS IN A SIX-PERIOD DAILY SCHEDULE, WITH THOSE OF STUDENTS IN AROTATE-EIGHT BLOCK SCHEDULE" (2006). Dissertations. 593.https://irl.umsl.edu/dissertation/593

Heger, Brad, 2006, UMSL, p. i
A COMPARISON OF ACHIEVEMENT LEVELS IN MATHEMATICS AND
SCIENCE, AND CURRENT ATTITUDES, OF SECONDARY STUDENTS
IN A SIX-PERIOD DAILY SCHEDULE, WITH THOSE OF
STUDENTS IN A ROTATE-EIGHT BLOCK SCHEDULE
by
BRAD J. HEGER A.B. English, St. Louis University – St. Louis
M.Ed. Secondary Education, University of Missouri – St. Louis
A DISSERTATION
Submitted to the Graduate School of the
UNIVERSITY OF MISSOURI- ST. LOUIS In Partial Fulfillment of the Requirements for the Degree
DOCTOR OF EDUCATION
in
EDUCATIONAL ADMINISTRATION
August, 2006
Advisory Committee
Thomas Schnell, Ph.D. Chairperson Connie K. Koch, Ed.D. Carole Murphy, Ed.D.
Lloyd I. Richardson, Ph.D.

Heger, Brad, 2006, UMSL, p. ii
© Copyright 2006
by
Brad J. Heger
All Rights Reserved

Heger, Brad, 2006, UMSL, p. iii
Acknowledgements
In reaching this goal at last, I must acknowledge the assistance of more than a few
people over more than a few years. First, my committee members were absolutely wonderful.
Thank you all for the much needed direction, encouragement, and guidance. First and
foremost, Dr. Tom Schnell, my advisor and chairperson, was instrumental in getting me into
motion, and helped me explore paths I could never have negotiated on my own. To him I
owe most of the hope I was able to find upon reentering the program once my overly long
“hiatus” ended. Dr. Lloyd Richardson was invaluable in clarifying for an old English teacher
the mathematical mysteries of the statistician’s universe. His patient sense of humor and
good natured guidance helped me immensely; I hope there are some more Saturday morning
coffees down the road. Dr. Carole Murphy has never stopped believing in me and offering
encouragement, in spite of her inclination to tell everyone we meet embarrassing stories
about me in that first class. I am hoping this habit is a sign of her pride in a truly grateful
student. Dr. Connie Koch was another believer; thank you for so often going out of your way
for me. I know you had other matters that could have occupied the time you so generously
gave me and my work.
I would also like to thank Dr. Fred Bradley for his belief in me and for his early
attempts to guide me onto a path I apparently wasn’t quite ready to travel just then. And a
great big thank you to my good friend Chet Jankowski, self-described “computer geek,” who
always seemed to arrive with high interest, insightful questions, and offers of assistance at
just the right times.
To all my friends and colleagues, thank you for your continued support and
encouraging words. Dr. Renee Schuster provided statistical tools and other friendly support,
Heger, Brad, 2006, UMSL, p. iv
and allowed her assistant, Peggy Moser, to contribute time and energy on my behalf as well.
Thank you to Dr. Joseph Powers for his understanding, practical advice, and the loan of more
than one very helpful book. Maureen Guffey supplied encouragement and office support at
every turn. I also owe a huge debt to Sue Roy, “computer assistant extraordinaire,” already a
legend in our district.
Thank you to my mother for the talents and life-long example she has shared with my
siblings and me, and for her loving and always-biased belief in our ability to accomplish
anything we wanted. Thanks to my brothers and sisters for the serious, and sometimes not so
serious, support. In memory of my father, whose undying spirit and work ethic endure in his
children: thank you for all you did for each of us.
Particularly heartfelt and loving thanks go to each of my daughters. Bernie, thanks for
letting me borrow your (and Mark’s!) books and computer equipment, and for being such an
inspiration in your joyful pursuit of your own studies. Margo, thanks for the long-distance
help on the stats, and for helping me get perspective on the true worth of education by your
beautifully unselfish pursuit of veritas on behalf of others. Beth, thanks for your vivacious
spirit and modeling of what the best educators do and why they do it, and for being so
inspiring in your chosen profession. Shelly, thanks for your devoted steadfastness and
dedication to the most important things in this life and the next, and for your inspirational
hopes and efforts to make this world a better place.
Lastly, a humble thank you to my spouse and partner, Suzie, for putting up with so
much for so long, and for doing all that extra driving. You have taught me what is important
in life; thank you. This accomplishment very much belongs to you. I love you.

Heger, Brad, 2006, UMSL, p. v
Abstract
In part one of this study, secondary students’ mathematics and science achievement
levels in a Six-Period Daily (SPD) schedule were compared with those in a Rotate-Eight
Block (REB) schedule (eight macroperiods in a two day rotation). In part two, alumni were
surveyed to compare current opinions of the schedules’ effectiveness overall and on two
subscales.
Archival test data and demographic information were obtained on two graduated
classes in a selected suburban Midwestern high school, enrollment grades 9 to 12 of
approximately 1000 students. Stratified random samples of 50 students from each class were
selected based upon treatment, academic ability, ethnicity, and gender.
Grade Point Averages (GPAs) and Missouri Assessment Program (MAP) test scores
in mathematics and science were examined through univariate three-way analyses of
variance (ANOVA) of the differences in the post-treatment means. Where initial equivalence
was not found, ANOVA was used to study effects for subgroups. All main effects and
interactions were tested. Gender was taken into account by equalizing numbers across
subgroups to the extent possible.
No statistically significant results or trends based on treatment were discovered as
main effects or interactions in part one. The “achievement gap” between African-American
and Caucasian students was confirmed in all achievement measures except science GPA,
where only ability, not ethnicity or treatment, was found to be of significance as a main
effect. Though not of statistical significance, a pattern favoring low ability REB subgroups
and high ability SPD subgroups was noted.

Heger, Brad, 2006, UMSL, p. vi
Analysis of survey results indicated that groups and subgroups differed significantly
in scores for effectiveness of the schedules overall, and for the classroom activities subscale.
Groups and subgroups consistently rated the effectiveness of the SPD higher. On only one
measure did any subgroup rate the REB higher than the SPD: Caucasian males rated
effectiveness of classroom activities slightly higher in the REB. The largest opinion
differences were exhibited between African-American males and Caucasian males. African-
American males rated the SPD classroom activities higher than did any other subgroup, and
the REB lower (at exactly neutral) than did any other subgroup.

Heger, Brad, 2006, UMSL, p. vii
TABLE OF CONTENTS
ACKNOWLEDGEMENTS........................................................................................... iii ABSTRACT....................................................................................................................v TABLE OF CONTENTS...............................................................................................vii LIST OF TABLES ..........................................................................................................x CHAPTER 1: INTRODUCTION ...................................................................................1 Statement of the problem..........................................................................6 Hypotheses ...............................................................................................7 Importance of the study ..........................................................................10 Definition of terms .................................................................................12 Limitations of the study..........................................................................13 CHAPTER 2: REVIEW OF RELATED LITERATURE...............................................15 Overview................................................................................................15 United States and Canada .......................................................................15 North Carolina and Virginia ...................................................................17 Missouri .................................................................................................20 Summary................................................................................................31 CHAPTER 3: METHODOLOGY................................................................................ 33 Overview................................................................................................33 Design ....................................................................................................33 Samples..................................................................................................36 Analysis of MAP test results, and of math and science GPAs .................37 Surveys of graduates...............................................................................38 Analysis of survey results .......................................................................39 Summary................................................................................................39 CHAPTER 4: RESULTS..............................................................................................41 Overview................................................................................................41 Research and null hypotheses, part 1 of the study ...................................43 Equivalence of the experimental and comparison groups ........................45 Results of analyses of mathematics post-treatment measures ..................49 Results of analyses of science post-treatment measures...........................56 Research hypothesis and null hypothesis, part 2 of the study...................62 Survey results and analyses ....................................................................63 Summary................................................................................................75 CHAPTER 5: DISCUSSION........................................................................................77 Overview................................................................................................77
Heger, Brad, 2006, UMSL, p. viii
Purpose, hypotheses, and overall design of the study ..............................77 Summary of the findings ........................................................................81 Limitations of the study..........................................................................84 Discussion of the findings in mathematics and science achievement levels ..........................................................................................85 Discussion of the survey results ..............................................................87 Implications for further research .............................................................90 REFERENCES..............................................................................................................92 APPENDIXES . ............................................................................................................98 Appendix A............................................................................................98 District information.....................................................................99 District letter of interest ............................................................101 Population, Class of 2002..........................................................102 Population, Class of 2004..........................................................107 Appendix B ..........................................................................................113 Spring 1998 MAP data, disaggregated Missouri totals, mathematics grade 8 (H.S. Class of 2002)..........................................114 Spring 2000 MAP data, disaggregated Missouri totals, mathematics grade 8 (H.S. Class of 2004)..........................................116 Spring 2000 MAP data, disaggregated Missouri totals, mathematics grade 10 (H.S. Class of 2002)........................................118 Spring 2000 MAP data, disaggregated Missouri totals, science grade 10 (H.S. Class of 2002)........................................120 Spring 2002 MAP data, disaggregated Missouri totals, mathematics grade 10 (H.S. Class of 2004)........................................122 Spring 2002 MAP data, disaggregated Missouri totals, science grade 10 (H.S. Class of 2004)........................................124 REB (Class of 2004) sample .....................................................126 SPD (Class of 2002) sample......................................................127 Appendix C ..........................................................................................128 IRB informed consent form.......................................................129 Survey instrument ....................................................................130 Cover letter ...............................................................................131 Appendix D..........................................................................................132 Survey respondents ...................................................................133 Appendix E ..........................................................................................134 Individual survey responses ......................................................135 Appendix F...........................................................................................137 Table F1: Summary of internal consistency indices by treatment ...................................................................138 Table F2: Summary of internal consistency indices by ethnicity ....................................................................139 Table F3: Summary of internal consistency indices by gender .......................................................................140

Heger, Brad, 2006, UMSL, p. ix
Table F4: Summary of internal consistency indices by ethnicity subgroups for REB treatment ......................141 Table F5: Summary of internal consistency indices by ethnicity subgroups for SPD treatment.......................142 Table F6: Summary of internal consistency indices by gender subgroups for REB treatment .........................143 Table F7: Summary of internal consistency indices by gender subgroups for SPD treatment..........................144 Appendix G..........................................................................................145 Grade 10 MAP mathematics gains ............................................146 Table G1: Lower ability students’ improvements in the grade 10 MAP mathematics mean over the grade 8 MAP mathematics mean ...................................................148 Table G2: Higher ability students’ improvements in the grade 10 MAP mathematics mean over the grade 8 MAP mathematics mean ...................................................149

Heger, Brad, 2006, UMSL, p. x
LIST OF TABLES
Table Page 1 Means (m) and Standard Deviations (sd) of the Grade 8 MAP Mathematics (Pre-Treatment) Scores .................................................... 46 2 Analysis of Variance (Treatment x Ethnicity x Ability) of the Grade 8 MAP Mathematics (Pre-Treatment) Scores .......................................... 47 3 Means (m) and Standard Deviations (sd) of the Grade 10 MAP Mathematics (Post-Treatment) Scores................................................... 51 4 Analysis of Variance (Treatment x Ethnicity x Ability) of the Grade 10 MAP Mathematics (Post-Treatment) Scores ......................................... 52 5 Means (m) and Standard Deviations (sd) of the Grade 10 Mathematics (Post-Treatment) GPAs (GPAMA) ..................................... 54 6 Analysis of Variance (Treatment x Ethnicity x Ability) of the Grade 10 Mathematics (Post-Treatment) GPAs (GPAMA) ..................................... 55 7 Means (m) and Standard Deviations (sd) of the Grade 10 MAP Science (Post-Treatment) Scores .......................................................... 57 8 Analysis of Variance (Treatment x Ethnicity x Ability) of the Grade 10 MAP Science (Post-Treatment) Scores ................................................. 58 9 Means (m) and Standard Deviations (sd) of the Grade 10 Science (Post-Treatment) GPAs (GPASC)........................................................... 60 10 Analysis of Variance (Treatment x Ethnicity x Ability) of the Grade 10
Science (Post-Treatment) GPAs (GPASC).............................................. 61 11 Means (m) and Standard Deviations (sd) of Scores for the Overall
Effectiveness of the Treatment Schedules ............................................. 66 12 Analysis of Variance (Treatment x Ethnicity x Gender) of Scores for the Overall Effectiveness of the Treatment Schedules ................................ 67 13 Means (m) and Standard Deviations (sd) of Scores for the Effectiveness of the Student’s Own Participation Subscale......................................... 69 14 Analysis of Variance (Treatment x Ethnicity x Gender) of Scores for the Effectiveness of the Student’s Own Participation Subscale ................... 70

Heger, Brad, 2006, UMSL, p. xi
15 Means (m) and Standard Deviations (sd) of Scores for the Effectiveness of the Classroom Activities Subscale .................................................... 73 16 Analysis of Variance (Treatment x Ethnicity x Gender) of Scores for the Effectiveness of the Classroom Activities Subscale .............................. 74 F1 Summary of Internal Consistency Indices by Treatment .......................138 F2 Summary of Internal Consistency Indices by Ethnicity .........................139 F3 Summary of Internal Consistency Indices by Gender............................140 F4 Summary of Internal Consistency Indices by Ethnicity Subgroups for REB Treatment.....................................................................................141 F5 Summary of Internal Consistency Indices by Ethnicity Subgroups for SPD Treatment .....................................................................................142 F6 Summary of Internal Consistency Indices by Gender Subgroups for REB Treatment.....................................................................................143 F7 Summary of Internal Consistency Indices by Gender Subgroups for SPD Treatment .....................................................................................144 G1 Lower Ability Students’ Improvements in the Grade 10 MAP Mathematics Mean Over the Grade 8 MAP Mathematics Mean............148 G2 Higher Ability Students’ Improvements in the Grade 10 MAP Mathematics Mean Over the Grade 8 MAP Mathematics Mean............149

Heger, Brad, 2006, UMSL, p. 1
Chapter 1
Introduction
The medical and scientific communities continue to make inroads in mapping the
activities of the brain and the mysterious workings of human learning. Educators use this and
other information and theory concerning varying intelligences and learning styles to attempt
to build frameworks for student achievement. As more and more information comes to light,
educators grapple with the implications for structuring learning experiences. Do students
need class lessons of a particular length to match their attention spans? How should a
student’s day be structured to make the natural learning processes most effective? How much
time does one need to address each student’s learning style effectively? What should a
student’s daily schedule of classes look like if it is to be structured optimally for success and
compatibility with human learning needs? Knowledge in these areas “may translate into new
initiatives and teaching strategies that can help students reach higher levels of achievement”
(Sousa, 2003, p. 4).
In a very practical sense, these questions in the last several decades have translated
into a debate, often bitter, among educators. The release of A Nation At Risk in 1983 placed
considerable pressure on American educators. The widely-used Carnegie Unit, a seat-time
measure of standardizing credits and secondary school requirements, came under criticism as
being ineffective, and too restrictive, as a means of measuring mastery of a subject. Just over
a decade after the release of A Nation at Risk, the National Commission on Time and
Learning released its report, Prisoners of Time (1994). The Commission stated, “Learning in
America is a prisoner of time. For the past 150 years, American public schools have held
time constant and let learning vary” (p. 7). Educators in both the United States and Canada
Heger, Brad, 2006, UMSL, p. 2
engaged in strong dialogues through the 1980s, 1990s, and into the new century, defending
or attacking traditional and alternative scheduling models for the secondary schoolhouse.
The emergence of the Copernican Plan in 1983 represented one attempt to address
what was considered by some to be the impersonal and inefficient nature of secondary school
schedules brought about by the utilization of the Carnegie Unit. Under the Copernican Plan,
different means of awarding credits were proposed, along with other changes, including the
use of “macroperiods” of 90 minutes to two to four hours in length (Carroll, 1994a). By the
early 1990s, North Carolina and Virginia schools had taken the lead in providing schedules
that included “macroperiods” (Akins, 2000). In the Midwest, the emergence of the “Hillcrest
Plan” in Springfield, Missouri, which also utilized macroperiods, began to garner support
(Hillcrest High School, 2005).
Throughout the 1990s large numbers of school districts across the United States
adopted “alternative” models of secondary school schedules, devoting scarce resources and
finances to make the transition to a different model. In Missouri, growth of what has come to
be called nationally “block scheduling” went from three schools before 1990, to 163 schools
in the 1997 school year, with the 8-block system predominant, followed by the 10-block and
then the 4-block (Simpson, 1997). In addition, “modified” block schedules that combined
components of two or even three or more schedule types, though not as common, also
appeared. By the end of academic year 1999-2000, over 180 Missouri schools had moved to
one or another form of block schedule (Stewart, 2002, p. 71).
Districts moving away from traditional schedules risked significant expenditures of
time, money and other resources in the hope that their students’ learning needs would be
more effectively met by restructuring the school day. The goals stated for restructuring the

Heger, Brad, 2006, UMSL, p. 3
secondary school day often included making overall more effective use of teachers’ and
students’ academic time (Canady & Rettig, 1995; Schoenstein, 1995). Student achievement
would then presumably be improved. Sousa warns that such restructuring will fail to improve
student achievement if “not accompanied by a concrete plan to enhance instruction and
student learning. More of the same will not raise student achievement if ‘the same’ refers to
poor instruction, low motivation and minimal expectations” (2003, p. 234). Restructuring
was often done also in the hope of improving school climate, encouraging teacher
recognition of varying student learning styles to escape strictly lecture-based instruction,
and/or improving students’ levels of achievement (Benton-Kupper, 1999; Black, 1998;
Canady & Rettig, 1995, 1996, 2003; Carroll, 1994a, 1994b; Hottenstein, 1998, 1999;
Hottenstein & Malatesta, 1993; Queen, 2000; Schoenstein, 1995). In 1994 Cawelti surveyed
high school principals and teachers across the United States to explore which restructuring
efforts were most utilized, or were likely to be in the near future. Figures from his High
School Restructuring: A National Study, indicated that 25% of the nation’s high schools
either had block scheduling in place in some form, or expected to have it in place (up to
40%), by 1997 (Brown, 1997; Zhang, 2001). In North Carolina, secondary schools that used
block scheduling went “from 6 schools (1.6% of all high schools) in the 1992-93 school year
to 288 schools (71.8%) in the 1999-2000 school year” (Zhang, 2001, p. 1).
Canady and Rettig identified three major types of block schedules that seemed to be
emerging in the early 1990s, all of which made use of macroperiods in some way: the Four
By Four (4x4) Block, the A/B Block, and the Trimester Block (Canady & Rettig, 1995). By
2003 they recognized that few districts had adopted the trimester, and identified two major
types as predominant, the 4x4 Block and the A/B Block, along with various hybrids of each

Heger, Brad, 2006, UMSL, p. 4
(Canady & Rettig, 2003). They noted that the 4x4 seldom appeared in its pure form, but was
nearly always modified in some way, usually to accommodate standardized testing reviews.
One of the most commonly recurring alternative models adopted was the “A/B
Block” schedule. This model derives its name from the A-day, B-day format used. Three,
four or five periods meet every other day in an alternating, or rotating, format for up to six,
eight or even ten secondary school course credits (Carnegie units). Canady & Rettig (2003)
note that by the late 1990s the A/B also seldom appeared in its pure form. Instead, hybrid
forms of some sort, designed to meet a school’s specific needs and circumstances, were the
rule rather than the exception. This seemed to be true particularly among schools where
students and staff considered their schedules to be successful (Canady & Rettig, 2003).
The most popular of the A/B formats is the “Rotate-Eight Block,” closely associated
with the Hillcrest scheduling model developed at Hillcrest High School in Springfield,
Missouri (Hillcrest High School, 2005). In the Rotate-Eight model, eight subjects, or in many
instances seven subjects and one study period (often known by such names as “Academic
Period,” “Networking Period,” or “Seminar”) carry through traditional quarters, semesters
and academic years. With only four periods meeting each day, proponents claim improved
school climate as evidenced in more efficient use of time, reduced stress for teachers and for
students, and better learning environments, than in the traditional six or seven period day, as
well as fewer discipline problems (Carroll, 1994b; Schoenstein, 1995; Jenkins, Queen &
Algozzine, 2002). With the loss of instructional minutes limited to only three “passing times”
between the four classes, and only four “start-ups” and “shut downs” claiming time from
class, more minutes are routinely reclaimed for instructional time, and fewer minutes
therefore lost for the non-instructional “housekeeping” chores required of each teacher
Heger, Brad, 2006, UMSL, p. 5
(Hottenstein, 1999). In addition, claims are also made that better depth of learning can be
achieved in the 90 minutes or so allotted to each period, as compared to the typical 45 to 55
minute periods in traditional schedules. In theory, 90 minute periods allow learners to
process information in their own learning style – provided, of course, that teachers are
honoring those styles in the additional time available by actually teaching to their students’
styles (Canady & Rettig, 1996; Sousa, 2003).
The debate over what sort of schedule best meets the needs of learners has been
confused by the multitude of schedules that can be labeled “block” schedules, and in
particular by the surface similarity of the two most popular types of block schedules, the
Rotate-Eight Block (REB) Schedule and the Four by Four (4x4) Block Schedule. Like the
Rotate-Eight, the 4x4 also meets in four macroperiods, generally of 80 to 95 minutes each,
per day. Unlike the Rotate-Eight, however, the 4x4 does not rotate with an A and B day
format; rather, in the 4x4 the same four classes meet every day. In this way, students in the
4x4 complete one traditional semester’s work in a quarter, and a traditional year’s work in
one semester. Considerable criticism of this style of schedule results from the complications
that arise from finishing an entire year of sequential courses in 18 weeks (Howard, 1998;
Kramer, 1997a, 1997b; Lindsay, 2004; Miles & Blocher, 1996; Thomas, 2001). Many
performing arts, mathematics, and modern language teachers in particular have been vocal in
decrying the detrimental effects they perceive in the complications inherent in the 4x4
schedule (Lindsay, 2004). Researchers often have noted the extended macroperiods of
meeting time in each schedule, and treated the types of block schedules as equivalent, based
on the use of the extended “macroperiods” for classes (Akins, 2000; Gordon, 1997;
Hottenstein, 1998; Simpson, 1997).

Heger, Brad, 2006, UMSL, p. 6
In addition, focus in recent years on the “achievement gaps” experienced by African-
American and other student groups has led to numerous efforts to address and improve the
educational experiences of these students (Sousa, 2003; Williams, 2005). The federal
government has raised the stakes in public school districts across the country with the
passage of what is popularly termed the “No Child Left Behind” (NCLB) Act of 2002. The
NCLB Act requires states to administer National Assessment of Educational Progress
(NAEP) tests in alternate years in reading and in mathematics to all fourth and eighth
graders. A report by Education Trust (2005), Stalled in Secondary: A Look at Student
Achievement Since the No Child Left Behind Act, is part of a growing body of studies
examining the achievement levels of students on state assessments as a result of NCLB, some
calling for comparable mandatory testing at the secondary level in all states. While NCLB
and the NAEP tests continue to be controversial (Sousa, 2003; Williams, 2005), more access
for researchers to states’ data allows more opportunities than ever before for analysis of
students’ achievement levels on statewide standardized assessments. In the context of
reporting effects of the 4x4 schedule in North Carolina, Zhang states that, in general, “Block
scheduling is still fairly new in the United States, although it has spread rapidly. Block
scheduling may take years to show real effects (good or bad). Quantitative research about the
impact of the high school schedule is badly needed…” (Zhang, 2001, p. 11).
Statement of the Problem
The purpose of this study was to compare the effects of Rotate-Eight Block (REB)
scheduling with traditional Six-Period Daily (SPD) scheduling on a selected Midwestern
suburban secondary school’s students’ achievement in mathematics and science, and to
examine the current attitudes of graduates concerning the instruction they received in those

Heger, Brad, 2006, UMSL, p. 7
schedules. The instruments used were the Missouri Assessment Process (MAP) tests in
mathematics and science given to all tenth grade students in Missouri annually, and
mathematics and science grade point averages (GPAMA and GPASC). The Class of 2004 at a
selected Midwestern suburban high school received instruction in the format of a Rotate-
Eight Block (REB) schedule for the two high school years (2000-2002) leading to their grade
10 MAP mathematics and science tests. The Class of 2002 received instruction in the format
of a Six-Period Daily (SPD) schedule in the two high school years (1998-2000) leading to
their grade 10 MAP mathematics and science tests. A stratified random sample of each class
was selected based on ethnicity and ability level. Gender was also taken into account.
Equivalency of the groups, the Class of 2004 and the Class of 2002, was determined on the
basis of the MAP scores obtained in grade 8 mathematics. In addition, a survey mailed to
alumni of the Classes of 2002 and 2004 was used to compare the groups’ current opinions
about the effectiveness of each schedule. Subgroups examined within the treatments were
based on ethnicity and gender.
Hypotheses
The independent variables for the study were type of schedule (Six-Period Daily /
Rotate-Eight Block), ethnicity (African-American / Caucasian), and general academic ability
(higher / lower). The dependent variables were achievement level on the mathematics portion
of the MAP, achievement level on the science portion of the MAP, and current opinions as
expressed in a survey.
The main hypotheses to be tested and their corresponding null hypotheses were as
follows.

Heger, Brad, 2006, UMSL, p. 8
H1 There is a statistically significant difference in the scores obtained on the mathematics
portion of the MAP by students in a suburban Midwestern high school who experienced a
Rotate-Eight Block schedule format (experimental group) compared to the scores obtained
by students who experienced a Six-Period Daily schedule format (comparison group),
regardless of ethnicity or ability level.
H10 There is no statistically significant difference in the scores obtained on the
mathematics portion of the MAP by students in a suburban Midwestern high school who
received instruction in a Rotate-Eight Block schedule format (experimental group) compared
to the scores obtained by students who received instruction in a Six-Period Daily schedule
format (comparison group) regardless of ethnicity or ability level.
H2 There is a statistically significant difference in the mathematics grade point averages
(GPAMA) obtained by students in a suburban Midwestern high school who experienced a
Rotate-Eight Block schedule format (experimental group) compared to the mathematics
grade point averages (GPAMA) obtained by students who experienced a Six-Period Daily
schedule format (comparison group), regardless of ethnicity or ability level.
H20 There is no statistically significant difference in the mathematics grade point averages
(GPAMA) obtained by students in a suburban Midwestern high school who experienced a
Rotate-Eight Block schedule format (experimental group) compared to the mathematics
grade point averages (GPAMA) obtained by students who experienced a Six-Period Daily
schedule format (comparison group), regardless of ethnicity or ability level.
H3 There is a statistically significant difference in the scores obtained on the science
portion of the MAP by students in a suburban Midwestern high school who experienced a
Rotate-Eight Block schedule format (experimental group) compared to the scores obtained

Heger, Brad, 2006, UMSL, p. 9
by students who experienced a Six-Period Daily schedule format (comparison group),
regardless of ethnicity or ability level.
H30 There is no statistically significant difference in the scores obtained on the science
portion of the MAP by students in a suburban Midwestern high school who received
instruction in a Rotate-Eight Block schedule format (experimental group) compared to the
scores obtained by students who received instruction in a Six-Period Daily schedule format
(comparison group), regardless of ethnicity or ability level.
H4 There is a statistically significant difference in the science grade point averages
(GPASC) obtained by students in a suburban Midwestern high school who experienced a
Rotate-Eight Block schedule format (experimental group) compared to the science grade
point averages (GPASC) obtained by students who experienced a Six-Period Daily schedule
format (comparison group), regardless of ethnicity or ability level.
H40 There is no statistically significant difference in the science grade point averages
(GPASC) obtained by students in a suburban Midwestern high school who experienced a
Rotate-Eight Block schedule format (experimental group) compared to the science grade
point averages (GPASC) obtained by students who experienced a Six-Period Daily schedule
format (comparison group), regardless of ethnicity or ability level.
H5 There is a statistically significant difference in the survey scores obtained from
graduates of a suburban Midwestern high school who experienced a Rotate-Eight Block
schedule format (experimental group) compared to the survey scores obtained from graduates
who experienced a Six-Period Daily schedule format (comparison group), regardless of
ethnicity or gender.
Heger, Brad, 2006, UMSL, p. 10
H50 There is no statistically significant difference in the survey scores obtained from
graduates of a suburban Midwestern high school who experienced a Rotate-Eight Block
schedule format (experimental group) compared to the survey scores obtained from graduates
who experienced a Six-Period Daily schedule format (comparison group), regardless of
ethnicity or gender.
Importance of the Study
A schedule change of the magnitude considered when a school determines it will
move from a traditional to an alternative schedule is necessarily an expensive endeavor.
Initial study, discussion, training, implementation, monitoring and evaluation must all be
included in accounting the economic costs of such a schedule change, to say nothing of the
inevitable emotional strain brought about by any systemic change (Canady & Rettig, 1995;
Howard, 1997, 1998; Lindsay, 2004; Miles & Blocher, 1996). Such change requires careful
planning if it is to be effective and successful (Hottenstein, 1999; Schoenstein, 1995; Shortt
& Thayer, 1997). In addition, most block schedules require additional (and therefore more
expensive) staffing to support the same class sizes as were kept in the traditional six or seven
period daily schedules. School districts cannot afford to expend resources on programs of
unsure consequence.
Hottenstein (1999) identifies three key areas typically used to measure the success of
a scheduling model: school climate, teacher-student interaction/performance in the
classroom, and quantitative student achievement results. Of these three factors, efforts to
measure quantitatively student achievement by schedule type have been less numerous and
are much more recent. In this age of NCLB and NAEP, analysis of standardized test results at
the secondary level is a logical step in monitoring these education programs’ effectiveness.

Heger, Brad, 2006, UMSL, p. 11
Past studies often focused on the similar length of the individual class periods used
within the differing types of schedules, and the A/B and 4x4 types of block schedules, along
with hybrids of each, were considered a single type for the purposes of many of those studies.
Previous studies often reported attendance, discipline, and graduation rates; perceptions of
how the programs were implemented; and perceived advantages and disadvantages, typically
through Likert scale opinionaires (Finley, 2000; Hamdy & Urich, 1998; Wilson & Stokes,
1999; Wronkovich & Hess, 1998; Zhang, 2001). This study of the effectiveness of the
Rotate-Eight Block (REB) schedule differentiated the Rotate-Eight Block from other types of
block schedules, and utilized standardized test data and grade point averages, along with
graduates’ reported opinions.
Three major questions were explored.
• Do students in a REB schedule have different achievement levels in mathematics
compared to levels achieved by students in an SPD schedule?
• Do students in a REB schedule have different achievement levels in science
compared to levels achieved by students in an SPD schedule?
• Do graduates who had a REB schedule currently hold different opinions toward
their experience in that schedule, compared to opinions currently held by
graduates who had an SPD schedule?
A study of the effectiveness of this particular type of A/B block schedule on student
achievement also could be an important aspect of determining whether specific student
groups benefit from such a schedule, and perhaps on whether a district should dedicate funds
to changing to, or maintaining, such a schedule.

Heger, Brad, 2006, UMSL, p. 12
As time goes on, more and more quantitative data will become available so that more
schools can take advantage of a more extensive research base. More studies of the
effectiveness of schedule types have begun to focus on data from standardized testing. If in
fact a particular type of schedule correlates positively with increased achievement in a
particular student population, the findings could be useful in helping address the closing of
achievement gaps. Ultimately, the importance of the study is the importance of trying to find
the best possible conditions under which students achieve success in learning.
Definition of terms
For the purposes of this study, certain terms were defined as described below.
Achievement level in mathematics. Two measures were used to define achievement
level in mathematics: the score reported on the Grade 10 MAP test in mathematics, and the
student’s mathematics grade point average derived from all mathematics classes taken in
grades 9 and 10.
Achievement level in science. Two measures were used to define achievement level
in science: the score reported on the Grade 10 MAP test in science, and the student’s science
grade point average derived from all science classes taken in grades 9 and 10.
Demonstrated general academic ability. The class rank of the student in grade 10
based on overall grade point averages computed from all courses completed in grades 9 and
10 was used to define demonstrated general academic ability. Students in the upper half of
their class were considered “higher level” demonstrated general academic ability, and
students in the lower half of their class were considered “lower level” demonstrated general
academic ability.

Heger, Brad, 2006, UMSL, p. 13
Rotate-eight block (REB) schedule. A schedule in which students typically take seven
classes at a time, accompanied by an eighth period designated as an “academic lab,”
“networking,” or “seminar” period, on an A-day/B-day rotation of four 90-minute periods
each day. Traditional semesters are maintained in the school year calendar.
Six-period daily (SPD) schedule. A schedule in which students typically take six
classes at a time, each class meeting in 55-minute periods each day. Traditional semesters are
maintained in the school year calendar.
Limitations of the study
A limitation on the study was that the focus was narrow, including stratified random
samples from two tenth grade classes at one selected Midwestern suburban school district
with one high school of approximately 1000 students.
Another limitation on the study was the history of the participation of this suburban
district in the St. Louis Voluntary Desegregation Plan. For the duration of this plan and as it
began to phase out, up to approximately one half of the African-American students attending
district schools lived outside the school district limits in the City of St. Louis, and so were
not resident students in this suburban school district. Their presence and participation in the
study greatly enriched the data available, but requires an understanding that, in spite of the
school’s geographic position in the suburbs of St. Louis, the data analyzed were not wholly
obtained from the suburban setting.
Another limitation was that the achievement data were taken from each student’s
sophomore year, so that even though the state MAP tests were administered to all students
under the same conditions, the students had experienced only two years of the schedules
under study at the time of the testing.

Heger, Brad, 2006, UMSL, p. 14
While the teaching staff remained generally the same with very little turnover from
the Class of 2002 to the Class of 2004, the vast majority of that teaching staff had no direct
previous experience in teaching in a block schedule, as opposed to the school’s long tradition
in a six-period daily schedule. Teachers were provided training for teaching in the extended
periods of the block schedule, but direct experience in block teaching was limited to a
handful of teachers who piloted a limited number of block-style classes with volunteer
student participants from the Class of 2001. A few newcomers to the teaching staff (after
2000) had also taught in block-style schedules at their previous schools.
A final limitation of the study is that the surveys were conducted three years after
graduation and five years after completion of grade 10 for the Class of 2002, and one year
after graduation and three years after completion of grade 10 for the Class of 2004, so that
memory must be acknowledged as a possible confounding factor.

Heger, Brad, 2006, UMSL, p. 15
Chapter 2
Review of Related Literature
Overview
Chapter 2 provides a review of literature pertaining to block scheduling of various
types, including the Rotate-Eight Block schedule. The review is separated into three major
sections. The first covers related literature from the United States and Canada. The second
focuses more specifically on literature from the states of North Carolina and Virginia, states
where advocates of block scheduling actively promoted its utilization in those states, and
then across the country. The third section focuses most specifically on studies conducted in
Missouri and the region near St. Louis.
United States and Canada
While there has been much written about block schedules, both positive and negative,
some of the earliest and most clearly negative results were those found in the Bateson studies
of 1990. These studies were conducted in Canada and compared the test results of students
on a standardized science test of 40 questions. Bateson found that students in 4x4 scheduling
configurations scored significantly lower on this test than students in “single period” (six or
seven periods daily) configurations (Bateson, 1990). The students in the single period
configurations were tested at the end of the course at the end of the academic year; the
students in the block configurations were tested at the end of the academic year, not
necessarily the time they finished the course (since the 4x4 year-long courses are
“semesterized”). While the 4x4 results may have some significance for students’ learning in
longer daily blocks of time, the 4x4 differs significantly from the Rotate-Eight Block
schedule in that the Rotate-Eight Block allows students to take a year to complete what in a

Heger, Brad, 2006, UMSL, p. 16
traditional schedule is a year-long course, and a semester to complete what in a traditional
schedule is a semester-long course. Critics are quick to point out that merely having twice as
much time in a class period does not in any way guarantee twice the learning (Howard, 1998;
Kramer, 1997a, 1997b; Lindsay, 2004).
In a 1993 study, Hottenstein and Malatesta found an advantage of the 4x4 style
schedule in that failure rates in 4x4 schedules declined (Hottenstein & Malatesta, 1993).
Similarly, Schoenstein (1995) found that both teachers and students reported that the school
environment became less stressful for them with implementation of the 4x4 style block
schedule, once teachers learned to plan and teach in longer blocks of time.
Howard followed one experienced Advanced Placement calculus and physics teacher
(“R.”) through a change from a more traditional Six-Period day into an A/B block schedule
of seven 90-minute for credit periods, and one “Choice Learning” period, a voluntary course
in which there were no grades and no enrollment taken, in the last Wednesday and Friday
slots of the schedule (1997). This change of schedule in R.’s school included little or no
training in teaching in longer periods, and was characterized as a “surprise” to many of the
teaching staff. The schedule was changed the following year so that the “Choice Learning”
period became “Enrichment,” and rotated between the first and second periods, again without
assessments and built on extra credit activities. The following year R.’s school went to an
eight-credit Rotate-Eight Block schedule. Among Howard’s conclusions was that staff
development was absolutely essential for a successful change to a block schedule. R.
reported resentment in having to volunteer additional teaching time on Saturdays, early
mornings, lunch periods and other “free time” to bring his class’ scores on the AP exams
close to where they were before the change to the new block schedules, and that the number

Heger, Brad, 2006, UMSL, p. 17
of “5” scores among his students dropped immediately by one third in the change to a block
schedule (Howard, 1997). The same study reports that the block schedule was found to be
popular among students and parents (Howard, 1997), reflecting a criticism commonly made
by opponents to block scheduling that proponents of block schedules rely too little on
quantifiable results and too much on popularity (Lindsay, 2004). Often, the results appear
inconclusive or contradictory.
Trenta and Newman reported that while many measures they attempted were not
significant, all of those that were significant, supported block scheduling. The results of this
study were based on data collected on grade point averages, attendance rates, and ACT
scores for 500 students who had been in 4x4 block schedules for one to three years (2002).
While types of block schedules were differentiated, only the 4x4 schedule used in a selected
Ohio secondary school was the focus of the study. The staff and students had reported
satisfaction with the 4x4 schedule in earlier surveys, and the Trenta and Newman study was
stated by the researchers to be an attempt to obtain “’hard data,’ data not derived from
opinions or attitudes of either supporters or critics but rather data that was a measure of
achievement” (Trenta & Newman, 2002, p. 56).
North Carolina and Virginia
Studies in 1996 and 1997 were conducted by the North Carolina Department of
Public Instruction (NCDPI) and published in 1998. These were statewide summaries of
scores on the state’s standardized “End of Course” (EOC) tests in five required subjects.
These scores, “when adjusted for parent education level and performance before moving to a
block schedule, show few statistically significant differences between block and non-blocked
schools” (NCDPI, 1998). It is also important to note that in North Carolina, 65% of 254 high

Heger, Brad, 2006, UMSL, p. 18
schools had gone to 4x4 block scheduling by the 1996-1997 academic year (NCDPI, 1998).
Trends in the length of time a school was on a block schedule were found to be statistically
significant only on the English II EOC Test. For that test, length of time in block scheduling
correlated positively with improved scores. Also, Algebra I, biology, and U.S. History
showed possible trends in which the longer students experienced block scheduling, the better
those students’ performance on EOC Tests (NCDPI, 1998). Most North Carolina high
schools on block schedules initiated implementation of the 4x4 schedule in the three
academic years from 1995-1998 (Zhang, 2001). A study completed for the North Carolina
State Board of Education in 1999 of the EOC test results for the class of 1999 (grade 12)
through the class of 2003 (grade 8) indicated that “4x4 scheduling has significant positive
impact on student achievement with Algebra I and ELPs [Economic, Legal, and Political
systems]. English I also is impacted positively, but Biology and U.S. History are not
significantly affected” (NCDPI, 2000).
Lawrence and McPherson found that students who had been in 4x4 block schedules at
two North Carolina high schools in 1996-1998 were outperformed in all four EOC areas by
students at the same two schools who had been in traditional schedules in 1994-1996, but
were not adjusted for parent education levels. Mean scores in Algebra I, Biology, English I
and U.S. History all favored the traditional schedule (2000). The authors suggested that use
of classroom grades as an indicator may not be borne out by research based on standardized
tests (Lawrence & McPherson, 2000, p. 181). Shortt and Thayer suggested that the length of
time in the block schedule could be a factor in students’ performance, as teachers needed
time to adjust to the new lengthened periods and overall lessened time in class per semester
(1997). These findings were similar to the findings of Skrobarcek et al. as reported by
Heger, Brad, 2006, UMSL, p. 19
Lawrence and McPherson, who found that high school students in 4x4 block classes in
Algebra I consistently performed below students in traditional schedules in Algebra I
(Lawrence & McPherson, 2000).
A longitudinal study covering the academic years 1992-1993 through 1999-2000 by
Zhang for the North Carolina Department of Public Instruction indicated North Carolina high
school students in 4x4 schedules outperformed students in traditional schedules on most End
of Course tests, after adjusting for “concomitant variables…. The mean percentage of
minority students (Pct_MS), mean percentage of students with free reduced-price lunch
(Pct_FRL), and mean percentage of students whose parents’ education level is at high school
diploma or lower (Pct_Low-PEL) from 1997 to 2000 are concomitant variables that can be
obtained from the state testing database. These are very important variables that strongly
relate to student academic performance” (Zhang, 2001, p. 3). ANCOVA analysis of the mean
scores, after controlling for the above concomitant variables, indicated that for Algebra I
“Students in the 4x4 schools significantly outperformed students in the traditional schools
across four years from 1997 to 2000 (Zhang, 2001, p. 8). For English I, Biology, ELP and
U.S. History EOC tests, “The 4x4 might have some positive effect on student performance”
(Zhang, 2001, p.10), but the differences found were statistically insignificant. Zhang notes
that while some previous findings were confirmed, others were not, confirming that results of
attempts to determine correlations between block schedules and student achievement
continue to be mixed and inconclusive: “Some findings of the study support previous studies
in certain areas, such as U.S. History in the study of Hess et al. (1998) and English in the
study of Veal & Schrieber (2000). Other findings are contrary to previous studies, such as
Algebra I in the studies of Wronkovich et al. (1997), Cobb et al. (1999), and Veal &

Heger, Brad, 2006, UMSL, p. 20
Schrieber (2000), Biology in the study of Hess et al. (1998), and English I in the study of
Cobb et al. (1999) and Veal & Schreiber (2000)” (Zhang, 2001, p.11).
Studies by the Virginia Department of Education (1999) examined not only the length
of time schools had been on some form of block scheduling, but also included the A/B block
format as distinguished from the 4x4 block format, and from the traditional “single period”
format. In addition, the Virginia study distinguished between secondary schools in urban,
suburban and rural districts. In Virginia in 1998-1999, 106 schools were reported on the
single period traditional schedule, 95 schools on the A/B block schedule, and 86 schools on
the 4x4 block schedule (Virginia Department of Education, 1999). Results on the Stanford
Nine (used as part of the Virginia State Assessment program) indicated that students in the
A/B format scored highest, followed by students in the 4x4 format, followed by students in
the single period format in reading and in mathematics. Students in the A/B were found to
lead in the Virginia Standards of Learning (SOL) Tests in English, history, mathematics and
science as compared to students in the 4x4 or the single period format (Virginia Department
of Education, 1999).
Missouri
Reed (1995) examined block scheduling as a portion of his study on restructuring
initiatives in Missouri. In the context of Reed’s study, block scheduling was not further
differentiated beyond Cawelti’s (1994) definition in the 1994 national survey of high schools
supported by the Education Research Service. Block scheduling was defined on the survey
instrument as “At least part of the daily schedule is organized into larger blocks of time
(more than 60 minutes, for example) to allow flexibility for varied instructional activities”
(Reed, 1995). It appeared as one of “thirty-six restructuring initiatives [organized] under the

Heger, Brad, 2006, UMSL, p. 21
following five headings: school organization, curriculum/teaching, community outreach,
monetary incentives, and technology” (Reed, 1995). Reed utilized surveys of Missouri high
school principals to uncover how closely plans for restructuring initiatives in Missouri
followed the pattern of results found in the national survey. Types of block scheduling were
not specifically differentiated from one another, but “block scheduling” was mentioned by
28.8% of the principals surveyed as the restructuring initiative “most frequently being
considered for implementation during the next school year” (Reed, 1995). The next closest
considerations for implementation were reported as “teacher team responsibility (16.7%), and
teacher-advisee system (16.7%)” (Reed, 1995). Block scheduling was reported as already
“fully implemented” in 1995 by 16.7% of the respondents in the Missouri study, and already
“partially implemented” in 1995 by another 3.0% of those respondents (Reed, 1995).
Also in Missouri, building on research by Gordon (1997) and Simpson (1997), Akins
researched four factors related to climate (Akins, 2000). Akins’ longitudinal study produced
similar results to those found by Gordon and Simpson (Akins, 2000). No significant
differences in cumulative grade point average, discipline referrals, or discipline suspensions
between 221 senior students in 15 schools in block schedules, as compared to 198 senior
students in 13 schools in more traditional schedules, were found (Akins, 2000). Significant
differences in the rates of absenteeism were found, however, with the students in block
schedules being absent at a higher rate. No significant difference had been found in Gordon’s
1997 study, and no long term trend of statistical significance was found when longitudinal
data were examined (Akins, 2000).
Akins’ study (2000) also examined quantifiable student achievement data in the core
areas of science, mathematics, and language arts based on standardized testing. Scores

Heger, Brad, 2006, UMSL, p. 22
reported on the ACT and the PSAT were examined, revealing no significant differences in
achievement between students in block versus traditional schedules, except in the area of
writing. In the area of writing, students attending schools with a traditional schedule
outperformed students attending schools with a block schedule, with both 4x4 and Rotate-
Eight schedules included as “block schedule” schools. While Akins noted the differences
between the 4x4 and the Rotate-Eight Block schedules, he did not further differentiate any of
the data obtained on the basis of the two types of schedules, nor did Gordon or Simpson in
the earlier studies.
Baker also undertook a study in Missouri of quantifiable student academic
achievement, reported in 2001. He looked at ACT scores along with average daily attendance
rates, number of disciplinary referrals, and dropout rates before and after the implementation
of block scheduling, as well as survey results from principals. He drew his data from five
southwest Missouri high schools in close proximity to one another, all of which had adopted
Rotate-Eight Block schedules that included a Seminar Period. Baker acknowledged that he
made no attempt to adjust for levels of student ability, levels of teacher in-service or levels of
teachers’ teaching abilities (Baker, 2001, p. 41). He identifies four basic types of block
schedules. He terms the Rotate-Eight the “traditional block schedule” and identifies the
“modified block schedule” as one “closely aligned to the traditional block schedule except
for a schedule change on a specific day of the week, such as Friday. Known also as the
Hillcrest Plan, this plan allowed for students to attend four classes on Monday and
Wednesday and four different classes on Tuesday and Thursday. Friday was considered
closure day as students attended all eight classes for approximately 43 minutes” (Baker,
2001, p. 42). The third type is identified as the “intensified block schedule,” which has also

Heger, Brad, 2006, UMSL, p. 23
been called the “4x4” or the “semester block schedule.” The fourth is the “flexible block
schedule,” a term attached to the flexible scheduling typically found in middle schools to
allow team teaching in core subjects. In flexible scheduling, core teachers on a team
determine how long their portion of the lesson will be, while the remainder of the day
remains organized in 45 or 50 minute segments.
Baker found that the mean ACT scores obtained at the five participating high schools
in his study showed a positive change in over half the years after implementation of Rotate-
Eight Block schedules, but that the changes were not statistically significant (Baker, 2001).
He found also that the number of disciplinary referrals assigned at the participating high
schools was not statistically significant, but that the number of referrals “actually increased
after implementing” the Rotate-Eight Block schedules (Baker, 2001, p. 122). This increase in
disciplinary referrals would generally be surprising to advocates of block scheduling, as
decreases in discipline problems have often been reported in the past (Carroll, 1994b;
Jenkins, Queen & Algozzine, 2002; Schoenstein, 1995). Lastly, the dropout rates
significantly decreased for the participating high schools, as the “average dropout rate
decreased 2.192 percent for the three years after eight-block scheduling when compared to
the three years previous to eight-block scheduling” (Baker, 2001, p. 122). Baker’s
recommendations for continued study included studies of the possible relationships between
eight-block scheduling and gender, special education students, minority groups, different
standardized tests, and different regions of Missouri.
In another Missouri regional study, Brown investigated mathematics and science
achievement results in 1997 in Missouri and Illinois, based on an analysis of the effects of
“extended block scheduling” on high school seniors’ ACT average mathematics and science

Heger, Brad, 2006, UMSL, p. 24
scores. Her study compared the ACT averages of students at selected high schools that had
been on a block schedule for a minimum of three years, compared to ACT averages for
seniors at those same high schools before the change to the block schedule was effected, and
after the new enhanced version of the ACT was initiated in 1989-1990. No individual
student’s scores were used; rather, a mean for the school was compared to the mean score for
the comparable class at the school. The assumption was acknowledged that “the independent
variable of scheduling was the main difference between the groups, as they had shared the
same teachers, curriculum, and other aspects of the school environment” (Brown, 1997, p.
49). Brown identified “8-block,” “trimester block,” and “4x4” block schedules, analyzing
data from the block schools collectively under the term “extended block scheduling,” which
she considered “synonymous” with “block scheduling” for the purposes of her study (Brown,
1997, p. 12). “Extended block scheduling” was defined as “A type of school scheduling
which reduces the amount of classes per day to no more than five, and which increases the
amount of time per class to 75-100 minutes” (Brown, 1997, p. 12). Increases favoring block
schedules were found both in mathematics and in science, with those in science being larger,
though “the size of the increases in the mean scores in this study were found to be
statistically explained as being only due to chance” (Brown, 1997, p. 60). The largest
increases found, though not statistically significant, were those favoring girls in block
schedules for science (Brown, 1997).
In 1999, Anderson reported use of a survey instrument that explored the effects of
block scheduling on teaching strategies in Missouri high schools. The data obtained were
differentiated and analyzed by four categories of schedules, including three types of block
schedules in addition to the “traditional 6 or 7 hour class schedule (non-block)”: “10 block or
Heger, Brad, 2006, UMSL, p. 25
10 block modified / 8 block or 8 block modified schedule / other block schedule models (4
block, etc.)” (p. 9). High school teachers in 50 Missouri schools were surveyed as to the use
of certain instructional strategies. Twenty-five of the schools were categorized as “non-
blocked,” while the other 25 were categorized as one or another of the three identified types
of “blocked” school. The instructional strategies included in the survey questions were listed
for participants as “community service projects, computer aided instruction, cooperative
teaching techniques, discussions, experimental learning, group work, individual assignments,
labs, lecture, research projects, self-reflection activities, interdisciplinary teaming, field trips,
student journaling, and writing across the curriculum” (Anderson, 1999, p. 9). Analysis of the
data revealed statistically significant differences in the teachers’ reported use of the strategies
in four of the individual comparisons. Traditional schedule teachers reported significantly
more use of the research project than either the 10-block schedule teachers or the 8-block
schedule teachers. In addition, the 10-block teachers reported significantly more use of
discussions than the traditional schedule teachers or the 8-block schedule teachers (Anderson,
1999, p. 72-73). These “mixed” results are not what proponents of block scheduling might
expect, since one claim for advantages of block scheduling is that the additional time
available in a block period allows more extensive use of varied teaching strategies (Black,
1998; Canady & Rettig, 1995; Carroll, 1994a; Hottenstein, 1999; Jenkins, Queen &
Algozzine, 2002; Queen, 2000; Rettig & Canady, 1999; Stokes & Wilson, 2000).
In another 1999 study of Missouri schools, Holschen, utilizing qualitative study
methods, limited his focus to examine only the teaching of mathematics. He examined the
methods used at two St. Louis, Missouri, Lutheran high schools after those schools had
moved to a Rotate-Eight Block schedule. If indeed the longer periods are available, do

Heger, Brad, 2006, UMSL, p. 26
teachers, in this case specifically mathematics teachers, in fact use them to vary teaching
strategies? Two different data sources (mathematics teachers and mathematics students) and
four different data collection methods (interviews, surveys, essays, and classroom
observations) were used. Holschen explored changes in teaching methods, in coverage of
material, and in teachers’ attitudes. At the time of the study, both schools had moved from a
more traditional Six-Period Daily schedule to a Rotate-Eight Block schedule, one four years
previous, and the other just two years previous. Using eight quality criteria applied to eleven
different inquiry areas, Holschen was able to state in his findings that at the school that had
been in the block schedule for four years, mathematics teachers “have made some of the
needed adjustments in their teaching to take advantage of the longer periods which the
schedule provides” (Holschen, 1999, p. 159). He goes on to identify larger percentages of
class periods dedicated to student-centered activities, regular use of cooperative learning, less
teacher lecture than in the traditional format, and “attitudes of teachers and students towards
teaching and learning mathematics in the block schedule” that were very positive (Holschen,
1999, p. 160). He was able to state the experience there “mirrored what the available
literature suggests about teaching in the block schedule. The longer blocks of time can be an
improvement over the traditional schedule if teachers are willing to change from a lecture
approach to a student-centered participatory approach to teaching” (Holschen, 1999, p. 160).
At the school that had been in block scheduling for only two years, the conclusions
reached were different. The teachers there were “using few student-centered participatory
activities in their lessons,” and were “very concerned about having less total time for
instruction in a year.” Yet at the same time, some teachers allowed “a large portion of
classroom time for study time” while other teachers attempted “to cover all of the content

Heger, Brad, 2006, UMSL, p. 27
that was covered in the traditional schedule by teaching two lessons in one 90-minute period.
This usually means the teacher has to use even more teacher-centered, direct instruction
which defeats the intent of the block schedule” (Holschen, 1999, p. 160-1). He summarized
this part of his findings by stating that teachers at the second school were overall “not as
happy with the block schedule [as those at the first school],” and that it was “likely that
teachers’ attitudes toward teaching mathematics in the block schedule will gradually improve
as they gradually change the way in which they teach mathematics” (Holschen, 1999, p.
161). Holschen recommended further research to examine whether students “who have
learned mathematics under the block schedule, still achieve at or above the same level as
students who learned mathematics in the six-period day” (Holschen, 1999, p. 164).
A Missouri case study completed in 2000 by Finley also found that teaching had
changed after a “modified block schedule” was implemented. “Modified” block schedules
were defined in the study as combinations of traditional, A/B, and or 4x4 schedules. Finley
gives the example of “a school that chooses to have a traditional seven-period schedule three
days a week and an alternate block schedule the other two days” (Finley, 2000, p. 15). Finley
conducted the case study at a large suburban high school implementing such a schedule in
Missouri. While containing components of various schedules, and while strictly not classified
as any of them, this case study examined issues often associated with the more widespread
A/B and 4x4 block schedules: implementation issues, delivery of instruction issues, learning
opportunity issues, and school climate issues. Among Finley’s conclusions was the statement
that “While it was clear that instruction had changed, the impact on student learning was not
as clearly determined” (Finley, 2000, p. 73). Interview and survey data supported the notion
that the “change of routine” was welcome, and that positive feelings expressed were due at
Heger, Brad, 2006, UMSL, p. 28
least in part to a strong feeling of staff ownership. Implementation was such that interview
and survey data also bore out a statement by a mathematics teacher, who “when asked if his
positive feelings regarding the modified block scheduling could be attributed to faculty
involvement from the beginning, the mathematics teacher responded, ‘there’s no doubt about
it, because we didn’t have to go for it’” (Finley, 2000, p. 78). Much of the supportive
literature for block scheduling in general emphasizes the need for effective implementation,
including the feeling of ownership by staff (Canady & Rettig, 1995; Hamdy & Urich, 1998;
Hottenstein, 1998, 1999; Hottenstein & Malatesta, 1993; Jenkins, Queen & Algozzine, 2002;
Queen, 2000; Shortt & Thayer, 1995).
In addition, Finley reported three themes that emerged from the data that seem
important for schools interested in block scheduling to examine. The first involved the
Academic Improvement Minutes (AIM) period, which “was created with the purpose of
every student being assigned to a homeroom with the availability to do a variety of activities
that would help them academically. These activities were to include opportunities for
students to go to another teacher’s classroom to retake or make up tests, work on homework,
study for tests, or get additional help from that teacher” among other more structured and
some unstructured activities (Finley, 2000, p. 84). In spite of the many positive uses of the
AIM period that were identified, so were many “non-productive and/or negative uses of time
[which] included students sleeping, playing cards, wandering the halls, listening to radios,
and leaving school to eat breakfast or lunch” (Finley, 2000, p. 87). Schools in the A/B
rotating block schedule format that use “Seminar” or “Academic Lab” as one of the periods
share many of these concerns, as well as the advantages.

Heger, Brad, 2006, UMSL, p. 29
A second theme that Finley identified was the recurring mention of lack of a planning
period one day a week for each teacher, especially as a “fatigue factor on those days” (Finley,
2000, p. 93). Finley noted that “Although teachers were clearly speaking from differing
perspectives, data suggested that this [lack of a planning period once a week] was a major
concern for some and a minor inconvenience for others,” as 71 percent agreed they had been
able to adapt to not having a planning period, while 15 percent responded that they “strongly
disagreed” that they had been able to adapt to not having a planning period (Finley, 2000, p.
94-95).
The third theme reported to emerge was the differing benefits received from the
modified block schedule for high achieving students and low achieving students. An ideal
view would be that all students would benefit, but the reality seemed to be different. Finley
noted that teachers felt “lower achieving students were more difficult to motivate, gave up on
things easier, and were frustrated more easily. These characteristics were compounded in the
90-minute period” (Finley, 2000, p.96). The teachers also suggested that a solution “was to
prepare to vary the learning activities to meet their [the lower achieving students’] needs. As
the mathematics teacher stated, ‘you do have to vary what you are doing depending on the
level of students that you’re teaching’” (Finley, 2000, p. 96-97). On the other hand, “the wise
use of time by higher achieving students was also observed during the AIM period. The art
teacher was particularly fond of the block days when discussing his advanced students. He
said, ‘they (advanced kids) love it. They really flourish in that kind of situation. It’s very
beneficial’” (Finley, 2000, p. 97). While these sorts of concerns over AIM / Seminar /
Academic Lab periods do not specifically arise in a 4x4 configuration, they are particularly
relevant to schools that utilize Rotate-Eight Block schedules that include such a period.

Heger, Brad, 2006, UMSL, p. 30
A 2002 Missouri study “did not take into consideration the different formats of block
scheduling” other than the “delivery system with classes meeting for 75-90 minutes a day”
(Stewart, 2002, p. 72). Stewart’s study did, however, take into consideration the length of
time the schools had participated in block scheduling, requiring for inclusion in the study a
minimum of three years participation by the completion of the 2001 school year. A second
consideration was the size of the school by enrollment, comparing indicators of academic
achievement in selected Missouri high schools with student enrollment under 1084, and those
over 1084. Ten schools were used, and comparisons were drawn on graduation percentages,
ACT test scores, and dropout rates. Findings indicated that graduation rates improved with
block scheduling, but were not statistically significant. Similarly, the ACT test scores showed
no statistically significant difference. Dropout rates improved with block schedules at a
statistically significant level. These results held true for both larger and smaller schools
(Stewart, 2002).
In 2001 Spencer completed a study of the possible influence of block scheduling on
African-American students in a large suburban high school in west St. Louis County,
Missouri. She identified five types of scheduling designs according to the definitions first
presented by Canady and Rettig (1995), including as one of those five “single-period
schedules, consisting of six, seven, or eight daily classes, varying between 40 to 60 minutes
in length” (Spencer, 2001, p. 30). She notes also Canady and Rettig’s 1995 classifications of
block schedules into the “A/B rollover,” the “Four By Four semester plan (Accelerated
plan),” the “Trimester” plan (a “quarter-on, quarter-off model” in which “students can take
two core courses and related subjects over a 60-day period”), and their catch-all hybrid
category of “a variety of 180-day combinations with short and long periods of instruction,

Heger, Brad, 2006, UMSL, p. 31
remediation, enrichment, and staff development days for teachers” (Spencer, 2001, p. 30).
Spencer focused on four academic years of archival data (1996 through 2000) for all African-
American students in the school to determine whether length of time in an A/B block
schedule reflected statistically significant differences in the grade point averages, transfer-out
rates, and dropout rates among African-American students. She found no statistically
significant relationship in transfer or in dropout rates, but found a significant difference in the
area of grade point averages. Her analysis found a significant difference in “lower failure
rates after 2 or 3 years with a block schedule than [African-American students] had with zero
or one year. The relationship is not perfectly linear in that failure rates tended to be a little
higher in year four than they had been in year three” (Spencer, 2001, p. 57).
In addition, because the high school at which the study occurred was a participant in
the St. Louis Voluntary Desegregation Transfer Program, Spencer was able to disaggregate
data by resident and non-resident African-American students, as well as by gender. A
significant difference was found in the dropout rates for resident and non-resident African
American students, with resident students more likely to remain in school, though the rates
for both groups were noted to be low (Spencer, 2001, p. 43). No significant relationship was
found for transfer out rates among these populations, nor were any differences found in the
subgroups pertaining to the findings that indicated improvement in failure rates, with one
exception. The failure rate for non-resident students, while improved at a significant rate, was
significantly less improved than the failure rate for resident students (Spencer, 2001, p. 57).
Summary
In summary, a review of related literature reveals that the types of block schedules
have most often been studied in the aggregate, based on the longer classroom sessions of 80
Heger, Brad, 2006, UMSL, p. 32
to 90 minutes common to each type. Fewer studies focus on the differences between any one
particular type of block schedule and another. Of studies that focus on a particular type, the
4x4 type of block schedule is most often the subject. More recent studies have begun to make
use of quantifiable data from standardized testing, with earlier efforts utilizing mostly survey
instruments and opinion surveys. The results of these efforts have been mixed.
Heger, Brad, 2006, UMSL, p. 33
Chapter 3
Methodology
Overview
This study was designed in two parts. The first part compared the mathematics and
science achievement levels of students in a Six-Period Daily (SPD) schedule with those of
students in a Rotate-Eight Block (REB) schedule in a selected suburban Midwestern U.S.
high school. Stratified random samples were selected based upon the treatment (schedule
type), demonstrated general academic ability, ethnicity, and gender. Grade Point Averages
(GPAs) and Missouri Assessment Program (MAP) test scores in mathematics and science
were used as dependent measures in the comparisons. In the second part of the study, a
survey of graduated students from each type of schedule was conducted to compare current
post-graduate opinions of the experiences in each schedule.
The designs of the two parts of the study, the sample selection, and statistical analyses
of the data are described in the following sections.
Design
Test data and demographic information were obtained from archival information on
two graduated classes in a selected suburban Midwestern high school with an annual
enrollment, grades 9 to 12, of approximately 1000 students. The school district in which the
school is located expressed an interest in the results of the study at the time the study was
proposed, and provided extensive support in providing access to demographic information
and test data from archival sources. (See Appendix A.) Both groups of students took the
MAP tests in mathematics in grade 8, and the MAP tests in mathematics and in science in
grade 10. MAP test information can be found in Appendix B.
Heger, Brad, 2006, UMSL, p. 34
The research design for the first part of the study was quasi-experimental in nature. A
pretest-posttest comparison-group design was used in comparing MAP scores by means of a
three-way analysis of variance. Also included in the achievement comparisons were
univariate three-way analyses of variance (ANOVA) of the differences in post-treatment
means of GPAs in mathematics and in science. All main effects and interactions were tested.
Where initial equivalence of the subgroups was not found, a three-way analysis of variance
was used to study the effects of the treatment on achievement for subgroups. All main effects
and interactions were tested for these subgroups.
A stratified random sample of 50 students from each of the two classes was selected
to conduct the first portion of the study. Demographic information about the subjects is found
in Appendix B.
Equivalence of the comparison and treatment groups and subgroups was determined
by a series of univariate analyses of variance of the MAP scores reported on the mathematics
test taken in grade 8. A three-way analysis of variance of the posttest means was conducted
to investigate the main effects and interactions. Where initial equivalence could not be
established between groups, subgroups of interest were further analyzed in a three-way
analysis of variance. All interactions and main effects were tested.
Mathematics achievement was defined by two measures. The first was the score
reported on the grade 10 MAP test in mathematics. The second was a mathematics grade
point average (GPAMA) obtained from an examination of each student’s transcripted grades.
Grades in mathematics classes taken in the first four high school semesters (freshman and
sophomore years) were separated from all other grades, and used to calculate a mathematics
GPA separate from the overall cumulative GPA. Each mathematics semester grade of A was
Heger, Brad, 2006, UMSL, p. 35
valued at 4.0, each B at 3.0, each C at 2.0, each D at 1.0, and each F at 0.0 to determine a
mathematics grade point average. In those instances in which transcripts indicated credits of
one quarter rather than one semester, the credit points were pro-rated to one half the weight
of semester credit points.
Science achievement was similarly defined. The first measure was the score reported
on the grade 10 MAP test in science. The second was a science grade point average (GPASC)
obtained from an examination of each student’s transcripted grades. Grades in science classes
taken in the freshman and sophomore years were separated from all other grades and used to
calculate a separate science GPA, in similar fashion to the calculation of the mathematics
GPA.
For the second portion of the study, survey information was gathered through an
original survey of graduates concerning their current opinions about the schedules they
experienced in high school. A copy of the survey administered is found in Appendix C. The
subjects were students who graduated with the Class of 2002 and with the Class of 2004.
While there was some turnover in teaching staff during the intervening two years
between the groups, there is no reason to assume the quality of the instructors for each group
was not equivalent. Nearly all instructors at the site in the 2001 and 2002 school years were
thoroughly familiar with the Six-Period Day schedule format of 55-minute periods, which
had been in place for many years. Nearly all instructors at the site in the 2003 and 2004
school years were new to the Rotate-Eight Block schedule format of 90-minute periods. All,
however, had received school district sponsored training in the prior two years on
implementing longer class periods, and a few had taught in longer periods as part of a pilot
study.

Heger, Brad, 2006, UMSL, p. 36
MAP testing conditions can also be assumed to have been equivalent for the groups,
as the MAP tests are conducted in the same controlled fashion annually at the site and across
the state. There is no reason to assume any extraneous variables were unequal across the
groups, because the stratified selection of the subjects was random to control bias in the
composition of the groups.
Samples
For the first portion of the study, stratified random samples were selected. The
samples were stratified random rather than merely random in order to better represent the
characteristics of the populations studied. The first (comparison) group was comprised of
students who experienced a Six-Period Day (SPD) schedule, and the second group
(experimental) was comprised of students who experienced a Rotate-Eight Block (REB)
schedule. The stratified random selection process was designed to take into account general
academic ability, ethnicity and gender.
General academic ability was determined by class rank based on cumulative grade
point average on all courses taken through the first four semesters of high school. Those
students with class ranks in the upper half of the population in grade 10, based on cumulative
grade point average in all subject areas, were defined to be of higher demonstrated general
academic ability, and those students with class ranks in the lower half of the population,
based on cumulative grade point average in all subject areas, were defined to be of lower
demonstrated general academic ability. Fifty percent of the students selected for the stratified
random sample were of upper general academic ability, and 50% were of lower general
academic ability.
Heger, Brad, 2006, UMSL, p. 37
Ethnic identity and gender were taken from MAP test demographic data, as self-
reported by each student at the time the test was taken. Students who identified themselves as
other than Caucasian or African-American on their grade 10 MAP tests were not included in
the study. Caucasian and African-American students who entered the class after grade 8, or
whose records were otherwise incomplete for the purposes of the study, were not included in
the sample selection process.
The total population of African-American students included in the SPD schedule
(comparison) sample selection was 67 (31%), and the population of Caucasian students
included in the sample selection was 149 (69%), so that NSPD = 216. Of the 50 students
included in the SPD schedule sample, 25 are male and 25 female, and 25 are of upper general
academic ability and 25 of lower general academic ability. Fourteen identify themselves as
African-American (28%) and 36 identify themselves as Caucasian (72%), so that nSPD = 50.
See Appendix B.
The total population of African-American students included in the REB schedule
(experimental) sample selection was 62 (26%), and the population of Caucasian-American
students included in the sample selection was 179 (74%), so that NREB = 241. Of the 50
students included in the experimental sample, 25 are male and 25 female, and 25 are of upper
general academic ability and 25 of lower general academic ability. Fourteen identify
themselves as African-American (28%) and 36 identify themselves as Caucasian-American
(72%), so that nREB = 50. See Appendix B.
Analysis of MAP test results, and of math and science GPAs
Equivalence of the comparison and experimental samples was determined through
analysis of the scores reported on the MAP mathematics tests taken in grade 8. Univariate

Heger, Brad, 2006, UMSL, p. 38
analyses of variance (ANOVA) were used to establish equivalence of the groups. Analysis
was based on schedule type, ethnicity, and general academic ability. Gender was also taken
into account. The software package SPSS 14.0 was used for all descriptive statistics and
analyses. Significance was set at the .05 level.
Achievement levels in mathematics and in science were calculated and analyzed on
the basis of scores reported on the MAP tests in mathematics and science in grade 10, and
also on the basis of the mathematics grade point average and the science grade point average
in grade 10. A three-way analysis of variance (ANOVA) was used on each post-treatment
achievement measure to study the main effects and interactions of treatment, ethnicity, and
ability level. The first independent variable tested was type of schedule, which was divided
into two levels, SPD schedule as experienced by the Class of 2002, and REB schedule as
experienced by the Class of 2004. The second independent variable tested was ethnicity,
examined at two levels: African-American and Caucasian. The third independent variable
tested was ability level, examined at two levels: higher academic ability, and lower academic
ability. All interactions and main effects were tested. Gender was also taken into account.
The general linear model in the statistics software package SPSS 14.0 for Windows (2005)
was used for all statistical computations.
Surveys of graduates
Surveys were mailed to random samples of 75 members of each of the two graduated
classes, stratified by gender and ethnicity. All students who graduated with the classes of
2002 and 2004 were included in the random selection process for the receipt of surveys, so
that N2002 = 232, and N2004 = 253. (See Appendix D.) Additional mailings and follow-up

Heger, Brad, 2006, UMSL, p. 39
phone calls and e-mails were used to increase the rate of participation. All the graduates
surveyed had reached 18 years of age.
A total of nine survey items required responses on a 5-point Likert-type scale from
“Strongly Agree” to “Strongly Disagree” (Appendix C). The nine items surveyed divide into
three areas: questions regarding graduates’ current perceptions of their own personal
participation in the schedule experienced (items 6 through 9), questions regarding graduates’
current perceptions of the effectiveness of classroom activities in the schedule experienced
(items 1 through 5), and the overall effectiveness of the schedules (all items, 1 through 9).
All IRB requirements and guidelines were observed. (See Appendix C.)
Analysis of survey results
Demographic data on respondents is included in Appendix D. Individual responses
and descriptive results of the responses to each survey item are included in Appendix E.
Reliability of the original survey and its subscales was measured by calculation of
Cronbach’s alpha, adjusted by the Spearman-Brown formula, as discussed in Chapter 4 and
reported in Appendix F. Responses were numerically scaled from 5 (“strongly agree”) to 1
“strongly disagree.” Four of the nine items (Items 2, 4, 6, and 8) were reverse-scored. A 2 x 2
x 2 three-way analysis of variance (ANOVA) was used to analyze the survey scores. The first
level of the analysis was treatment (schedule type, Six-Period Day or Rotate-Eight Block).
The second level was ethnicity, African-American or Caucasian. The third level was by
gender. All interactions and main effects were tested. Results are reported in Chapter 4.
Summary
The first part of this study was designed to compare the mathematics and science
achievement levels of students in a Six-Period Daily (SPD) schedule with those of students in
Heger, Brad, 2006, UMSL, p. 40
a Rotate-Eight Block (REB) schedule in a selected suburban Midwestern high school.
Stratified random samples were selected from the population based upon treatment (SPD or
REB), demonstrated general academic ability (upper or lower), ethnicity (African-American
or Caucasian), and gender (female or male). MAP grade 8 mathematics test scores were used
to establish equivalence of groups and subgroups. MAP grade 10 test scores and GPAs in
mathematics and science were used in the comparisons of the achievement levels.
In the second part of this study, graduates of each type of schedule were surveyed in
order to compare their current opinions regarding the perceived effectiveness of the
schedules.
Heger, Brad, 2006, UMSL, p. 41
Chapter 4
Results
Overview
This chapter presents the findings of the study. The purpose of this study was
twofold. The first part of the study compared the effects of the treatments on a selected
Midwestern suburban secondary school’s students’ achievement in mathematics and science.
The experimental treatment consisted of Rotate-Eight Block (REB) scheduling in grades 9
and 10, and the comparison treatment consisted of Six-Period Daily (SPD) scheduling in
grades 9 and 10. The second part of the study utilized an original survey to examine the
current opinions of graduates concerning those schedules.
Three major research questions were examined overall. In the first part of the study
two major questions were investigated:
• Do students in a REB schedule (experimental group) have different achievement
levels in mathematics compared to levels achieved by students in an SPD
schedule (comparison group)?
• Do students in a REB schedule (experimental group) have different achievement
levels in science compared to levels achieved by students in an SPD schedule
(comparison group)?
These questions were investigated by means of mathematics and science MAP tests, along
with mathematics and science grade point averages (GPAs). Students were grouped by
treatment (REB and SPD schedules), ethnicity (African-American and Caucasian), and
ability level (higher and lower). The effects of gender were also taken into account.

Heger, Brad, 2006, UMSL, p. 42
Univariate analyses of variance (ANOVA) were used to analyze the data. To
determine the significance of treatment effects, the null hypotheses were tested for the
significance of the effects of the individual factors and for the significance of the effects of
interactions. All main effects and interactions were tested. A 2 x 2 x 2 three-factor univariate
analysis of variance, treatment by ethnicity by ability, was used. The general linear model in
SPSS for Windows, version 14.0 (2005) was employed to conduct all analyses. Significance
was set at the .05 level.
Part two of the study investigated the third research question, as measured by an
original survey:
• Do graduates who had a REB schedule (experimental group) currently report
different opinions toward their experience in that schedule, compared to opinions
currently reported by graduates who had an SPD schedule (comparison group)?
Univariate analyses of variance (ANOVA) were used to analyze the data obtained from the
survey. The research hypothesis was tested by attempting to reject its null hypothesis. The
null hypothesis was analyzed for the effects of treatment, ethnicity, and gender, and for the
effects of interactions between the factors. A 2 x 2 x 2 three-factor analysis of variance,
treatment by ethnicity by gender, was used. The first factor, treatment, was examined at two
levels of schedule type, REB (experimental) and SPD (comparison). The second factor,
ethnicity, was examined at two levels, African-American and Caucasian. The third factor was
gender. All main effects and interactions were tested. Reliability of the survey was tested by
calculation of Cronbach’s alpha (index of internal consistency). The general linear model in
the statistics package SPSS for Windows, version 14.0 (2005) was used for all calculations
and analyses. A significance level of .05 was employed throughout.
Heger, Brad, 2006, UMSL, p. 43
The following sections describe
• the research hypotheses and the corresponding null hypotheses used to test initial
equivalence of the treatment groups and subgroups on the pre-treatment measure
and to test statistical significance of results on the post-treatment measures,
• the results of the statistical analyses performed on the pre-treatment measure to
establish equivalence of the experimental and comparison groups, and
• the results of the statistical analyses performed on the post-treatment measures in
part 1 and in part 2 of the study.
Research and null hypotheses, part 1 of the study
Four hypotheses and their corresponding null hypotheses were used in investigating
the first two research questions. Those were as follows.
H1 There is a statistically significant difference in the scores obtained on the mathematics
portion of the MAP by students in a suburban Midwestern high school who experienced a
Rotate-Eight Block schedule format (experimental group) compared to the scores obtained
by students who experienced a Six-Period Daily schedule format (comparison group),
regardless of ethnicity or ability level.
H10 There is no statistically significant difference in the scores obtained on the
mathematics portion of the MAP by students in a suburban Midwestern high school who
received instruction in a Rotate-Eight Block schedule format (experimental group) compared
to the scores obtained by students who received instruction in a Six-Period Daily schedule
format (comparison group), regardless of ethnicity or ability level.
H2 There is a statistically significant difference in the mathematics grade point averages
(GPAMA) obtained by students in a suburban Midwestern high school who experienced a
Heger, Brad, 2006, UMSL, p. 44
Rotate-Eight Block schedule format (experimental group) compared to the mathematics
grade point averages (GPAMA) obtained by students who experienced a Six-Period Daily
schedule format (comparison group), regardless of ethnicity or ability level.
H20 There is no statistically significant difference in the mathematics grade point averages
(GPAMA) obtained by students in a suburban Midwestern high school who experienced a
Rotate-Eight Block schedule format (experimental group) compared to the mathematics
grade point averages (GPAMA) obtained by students who experienced a Six-Period Daily
schedule format (comparison group), regardless of ethnicity or ability level.
H3 There is a statistically significant difference in the scores obtained on the science
portion of the MAP by students in a suburban Midwestern high school who experienced a
Rotate-Eight Block schedule format (experimental group) compared to the scores obtained
by students who experienced a Six-Period Daily schedule format (comparison group),
regardless of ethnicity or ability level.
H30 There is no statistically significant difference in the scores obtained on the science
portion of the MAP by students in a suburban Midwestern high school who received
instruction in a Rotate-Eight Block schedule format (experimental group) compared to the
scores obtained by students who received instruction in a Six-Period Daily schedule format
(comparison group), regardless of ethnicity or ability level.
H4 There is a statistically significant difference in the science grade point averages
(GPASC) obtained by students in a suburban Midwestern high school who experienced a
Rotate-Eight Block schedule format (experimental group) compared to the science grade
point averages (GPASC) obtained by students who experienced a Six-Period Daily schedule
format (comparison group), regardless of ethnicity or ability level.

Heger, Brad, 2006, UMSL, p. 45
H40 There is no statistically significant difference in the science grade point averages
(GPASC) obtained by students in a suburban Midwestern high school who experienced a
Rotate-Eight Block schedule format (experimental group) compared to the science grade
point averages (GPASC) obtained by students who experienced a Six-Period Daily schedule
format (comparison group), regardless of ethnicity or ability level.
Equivalence of the experimental and comparison groups
The means (m) and standard deviations (sd) of the scores on the grade 8 MAP
mathematics examinations for the comparison group (SPD schedule, Class of 2002) and for
the experimental group (REB schedule, Class of 2004) are shown in Table 1, along with
those for ethnicity groups and ability level groups within each treatment group.
Univariate analyses of variance (ANOVA) were conducted to test pre-treatment
equivalency of all groups. The pre-treatment measure was the grade 8 MAP mathematics
score. The factors of treatment, ethnicity, and ability level were analyzed for
main effects and for interactions. A three-factor (2 x 2 x 2) univariate analysis of variance
(ANOVA) was used. All main effects and interactions were investigated. Results are shown
in summary Table 2.

Heger, Brad, 2006, UMSL, p. 46
Table 1
Means (m) and Standard Deviations (sd) of the Grade 8 MAP
Mathematics (Pre-Treatment) Scores
REB
SPD All
Ethnicity
N m sd N m sd
N m sd
Ability
African-American
Higher
3 734.00 9.17 4 707.00 23.31
7 718.57 22.54
Lower
11 681.45 37.27 10 690.90 29.64
21 685.95 33.37
Subtotal
14 692.71 39.78 14 695.50 28.12
28 694.11 33.83
Caucasian
Higher
22 758.86 25.02 21 755.52 28.86
43 757.23 26.69
Lower
14 704.14 40.10 15 719.60 30.36
29 712.14 35.63
Subtotal
36 737.58 41.29 36 740.00 34.16
72 739.07 37.66
Total
50 725.02 45.30 50 727.94 38.22
100 726.48 41.72
Higher
25 755.88 24.96 25 747.76 33.04 50 751.82 29.27
Lower
25 694.16 39.77 25 708.12 32.76 50 701.14 36.75
REB = Rotate-Eight Block Schedule (Experimental Treatment Group) SPD = Six-Period Day Schedule (Comparison Treatment Group)
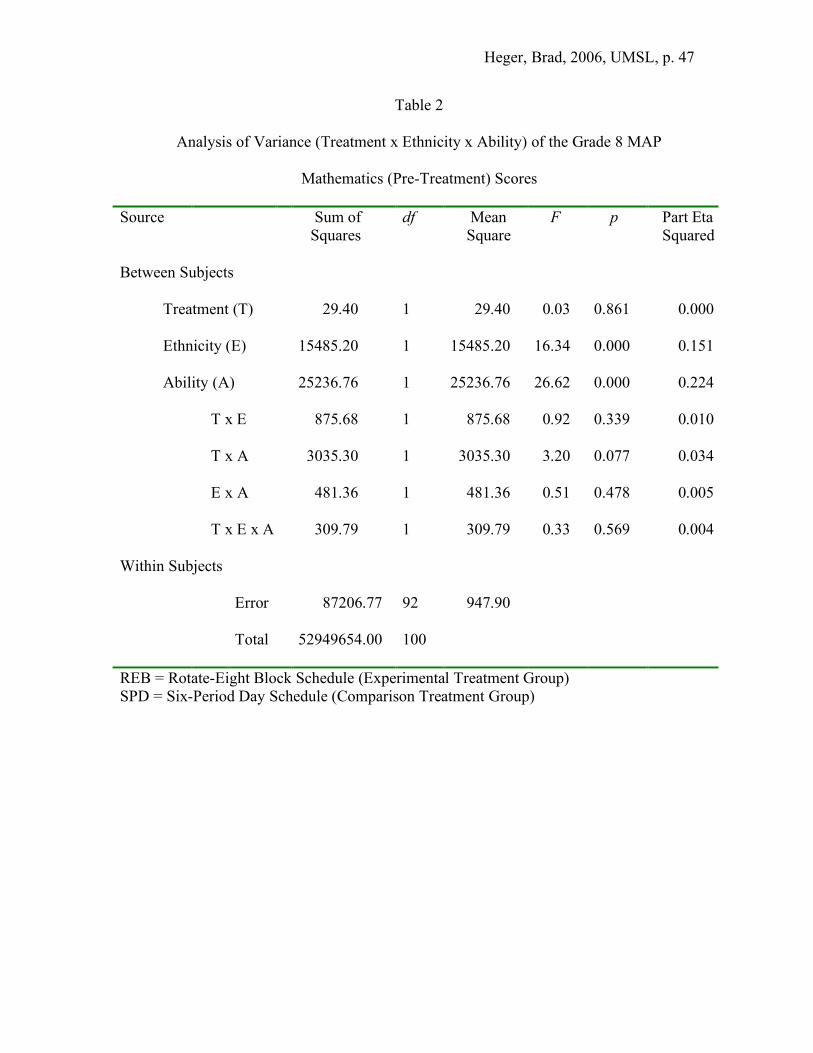
Heger, Brad, 2006, UMSL, p. 47
Table 2
Analysis of Variance (Treatment x Ethnicity x Ability) of the Grade 8 MAP
Mathematics (Pre-Treatment) Scores
Source
Sum of Squares
df Mean Square
F p Part Eta Squared
Between Subjects
Treatment (T)
29.40 1 29.40 0.03 0.861 0.000
Ethnicity (E)
15485.20 1 15485.20 16.34 0.000 0.151
Ability (A)
25236.76 1 25236.76 26.62 0.000 0.224
T x E
875.68 1 875.68 0.92 0.339 0.010
T x A
3035.30 1 3035.30 3.20 0.077 0.034
E x A
481.36 1 481.36 0.51 0.478 0.005
T x E x A
309.79 1 309.79 0.33 0.569 0.004
Within Subjects
Error
87206.77 92 947.90
Total
52949654.00 100
REB = Rotate-Eight Block Schedule (Experimental Treatment Group) SPD = Six-Period Day Schedule (Comparison Treatment Group)
Heger, Brad, 2006, UMSL, p. 48
As presented in summary Table 2, the results of the univariate analyses of variance
(ANOVA) of the means obtained on the grade 8 mathematics MAP test revealed
• no significant treatment effects.
• a significant ethnicity effect (p < .001). Caucasian students outperformed African-
American students in both treatment groups.
• a significant ability effect (p < .001). High-ability students outperformed low-
ability students in both treatment groups.
• no significant interaction effects.
The results presented in Table 2 established overall initial equivalence of the experimental
and comparison treatment groups based on lack of statistical significance found in the
differences of the means of the grade 8 MAP mathematics (pre-treatment) scores for students
in the SPD schedule, as compared to pre-treatment differences of the means for students in
the REB schedule. (See Table 2.)
Groups based on ethnicity did not exhibit equivalence on the pre-treatment measure.
Ethnicity was found to be statistically significant as a main effect influencing grade 8 MAP
mathematics (pre-treatment) scores (p < .001), so that initial equivalency of the Caucasian
and African-American groups was not established. (See Table 2.) Caucasian students as a
group scored significantly higher on the pre-treatment measure than did African-American
students as a group.
Groups based on ability level were not equivalent on the pre-treatment measure.
Ability level was found to be statistically significant as a main effect influencing grade 8
MAP mathematics (pre-treatment) scores (p < 0.001), so that initial equivalency of the
higher-ability and lower-ability groups was not established. (See Table 2.) Higher-ability

Heger, Brad, 2006, UMSL, p. 49
students as a group scored significantly higher on the pre-treatment measure than did lower-
ability students as a group.
No interaction effects of any order were found to be statistically significant at the .05
level. On the basis of no significant interaction effects discovered, ethnicity and ability level
subgroups were found to be equivalent across the treatments; that is, students of the same
ethnicity and the same ability level were found to have no significant differences in the
means of scores obtained on the pre-treatment measure (the grade 8 MAP mathematics test)
regardless of treatment group.
In summary, overall sample groups based on treatment (REB schedule or SPD
schedule) were found to be initially equivalent, on the basis of no statistically significant
differences found between the means of the scores obtained by the experimental treatment
group (REB schedule) and the comparison treatment group (SPD schedule) on the pre-
treatment measure, the grade 8 mathematics MAP test. Subgroups within ability-level and
ethnicity groups were found to be initially equivalent across treatments on the basis of no
statistically significant differences found in interactions.
Results of analyses of mathematics post-treatment measures
The post-treatment instrument used in testing research hypothesis 1 and its null
hypothesis (H1, H10) was the Missouri Assessment Program (MAP) test in mathematics
administered to all tenth grade students in Missouri annually. The post-treatment instrument
used to test research hypothesis 2 and its null hypothesis (H2, H20) was grade point average
in mathematics (GPAMA) as accumulated in the four high school semesters leading up to the
MAP tests. All analyses were performed using the general linear model in the statistics
package SPSS, version 14.0 for Windows (2005).

Heger, Brad, 2006, UMSL, p. 50
Research hypothesis 1 (H1) was tested by attempting to reject its null hypothesis
(H10) for the first post-treatment measure in mathematics. To examine statistical significance
for the effects of treatment, ethnicity, and ability level, analyses of variance were performed.
A three-factor (2 x 2 x 2) univariate analysis of variance (ANOVA) was used. Gender was
also taken into account by equalizing gender across subgroups to the extent possible.
Research hypothesis 2 (H2) was tested by attempting to reject its null hypothesis (H20) for
the second post-treatment measure in mathematics, grade 10 mathematics grade point
averages (GPAMA). Tables 3 and 5 present the means and standard deviations on the grade 10
mathematics MAP test measure, and on the grade 10 mathematics grade point averages
(GPAMA) measure, respectively. Summary Tables 4 and 6 present the overall results of the
analyses of variance performed on the respective measures.
As presented in Table 4, the results of the univariate analyses of variance (ANOVA)
of the means obtained on the grade 10 mathematics MAP scores indicated
• no significant treatment effects.
• a significant effect for ethnicity (p < .001). Caucasian students outperformed
African-American students within both treatment groups.
• a significant ability effect (p < .001). High-ability students outperformed low-
ability students within both treatment groups.
• no significant interaction effects.
No significant effects or interactions were found on the basis of treatment (schedule
type) for the first mathematics post-treatment measure, grade 10 mathematics MAP tests,
therefore the null hypothesis could not be rejected for these groups. The research hypothesis
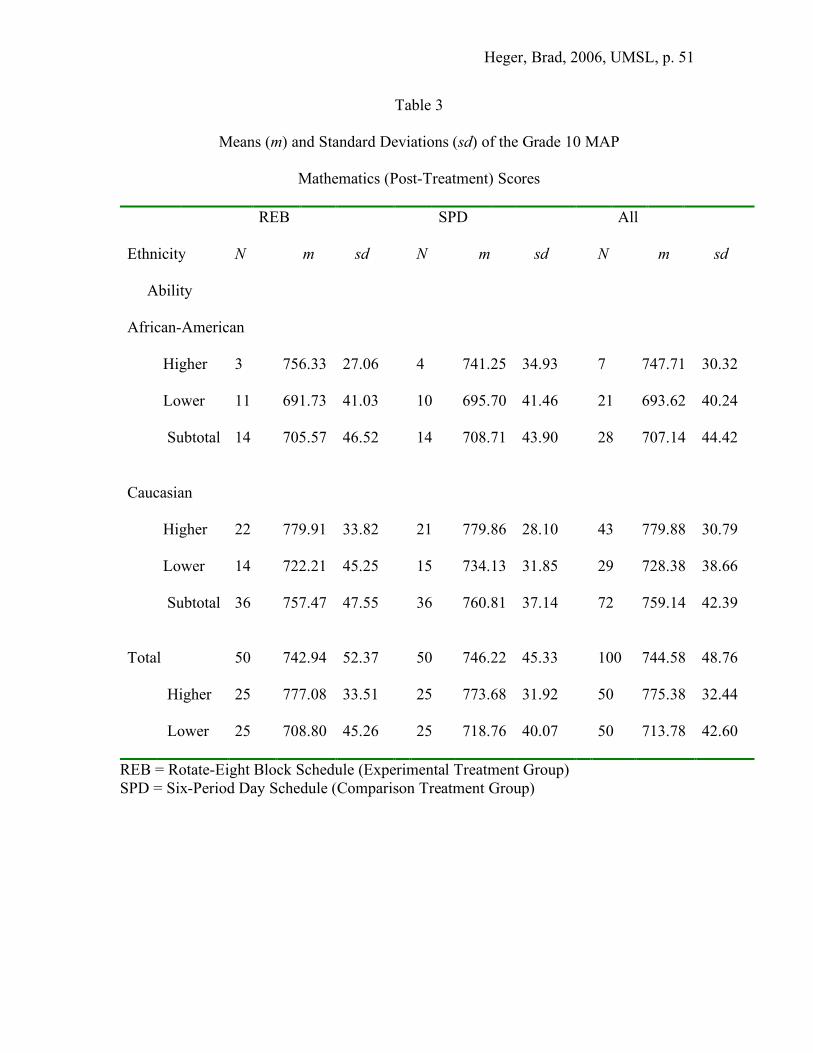
Heger, Brad, 2006, UMSL, p. 51
Table 3
Means (m) and Standard Deviations (sd) of the Grade 10 MAP
Mathematics (Post-Treatment) Scores
REB
SPD All
Ethnicity
N m sd N m sd
N m sd
Ability
African-American
Higher
3 756.33 27.06 4 741.25 34.93 7 747.71 30.32
Lower
11 691.73 41.03 10 695.70 41.46 21 693.62 40.24
Subtotal
14 705.57 46.52 14 708.71 43.90 28 707.14 44.42
Caucasian
Higher
22 779.91 33.82 21 779.86 28.10 43 779.88 30.79
Lower
14 722.21 45.25 15 734.13 31.85 29 728.38 38.66
Subtotal
36 757.47 47.55 36 760.81 37.14 72 759.14 42.39
Total
50 742.94 52.37 50 746.22 45.33 100 744.58 48.76
Higher
25 777.08 33.51 25 773.68 31.92 50 775.38 32.44
Lower
25 708.80 45.26 25 718.76 40.07 50 713.78 42.60
REB = Rotate-Eight Block Schedule (Experimental Treatment Group) SPD = Six-Period Day Schedule (Comparison Treatment Group)

Heger, Brad, 2006, UMSL, p. 52
Table 4
Analysis of Variance (Treatment x Ethnicity x Ability) of the Grade 10
MAP Mathematics (Post-Treatment) Scores
Source
Sum of Squares
df Mean Square
F p Part Eta Squared
Between Subjects
Treatment (T)
.57 1 .57 .00 .983 .000
Ethnicity (E)
17095.55 1 17095.55 13.32 .000 .126
Ability (A)
45368.64 1 45368.64 35.36 .000 .278
T x E
525.13 1 525.13 .41 .524 .004
T x A
957.50 1 957.50 .75 .390 .008
E x A
45.15 1 45.15 .04 .852 .000
T x E x A
49.93 1 49.93 .04 .844 .000
Within Subjects
Error
118054.18 92 1283.20
Total
55675304.00 100
REB = Rotate-Eight Block Schedule (Experimental Treatment Group) SPD = Six-Period Day Schedule (Comparison Treatment Group)

Heger, Brad, 2006, UMSL, p. 53
could therefore not be accepted on the basis of the first measure for mathematics
achievement.
Table 5 presents the means and standard deviations on the second measure for
mathematics achievement, grade 10 mathematics grade point average (GPAMA).
As presented in Table 6, the results of the univariate analyses of variance (ANOVA)
of the means obtained on the grade 10 mathematics grade point average (GPAMA) indicated
• no significant treatment effects.
• a significant effect for ethnicity (p = .002). Caucasian students outperformed
African-American students within both treatment groups.
• a significant ability effect (p < .001). High-ability students outperformed low-
ability students within both treatment groups.
• no significant interaction effects.
No significant effects or interactions were found on the basis of treatment (schedule
type) for the second mathematics post-treatment measure, grade 10 mathematics grade point
averages (GPAMA); therefore, the null hypothesis could not be rejected for these groups. The
research hypothesis could therefore not be accepted on the basis of the second measure for
mathematics achievement.
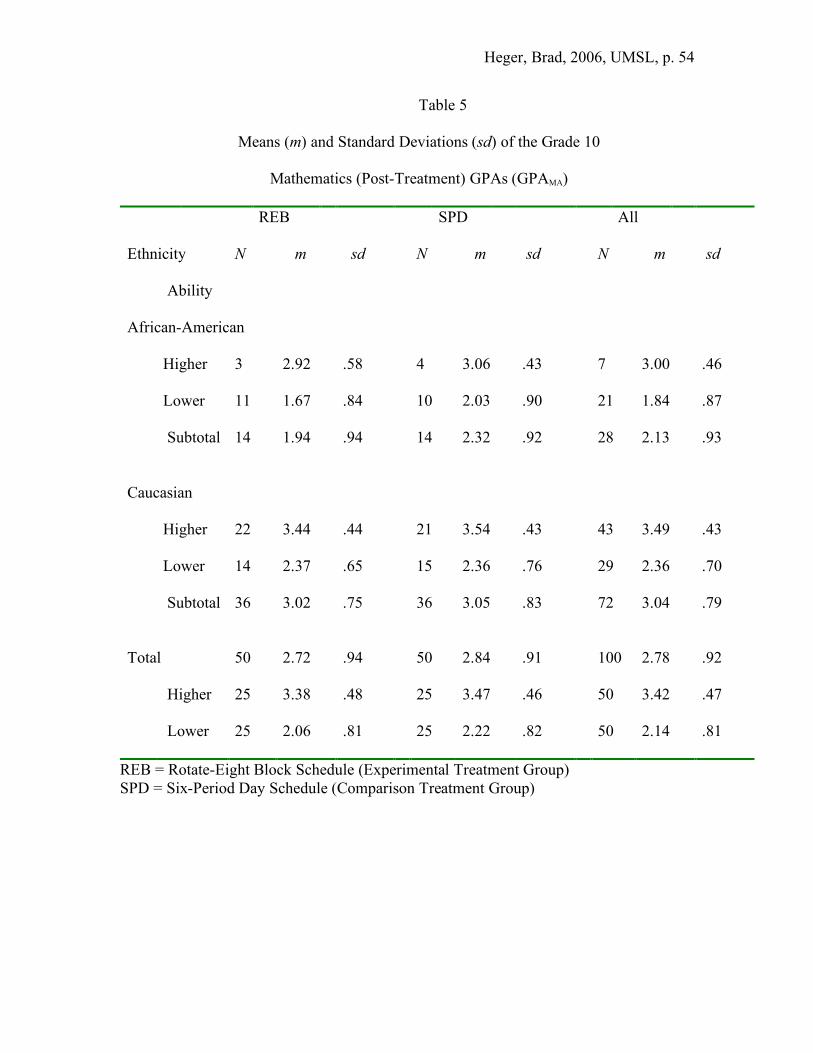
Heger, Brad, 2006, UMSL, p. 54
Table 5
Means (m) and Standard Deviations (sd) of the Grade 10
Mathematics (Post-Treatment) GPAs (GPAMA)
REB
SPD All
Ethnicity
N m sd N m sd
N m sd
Ability
African-American
Higher
3 2.92 .58 4 3.06 .43 7 3.00 .46
Lower
11 1.67 .84 10 2.03 .90 21 1.84 .87
Subtotal
14 1.94 .94 14 2.32 .92 28 2.13 .93
Caucasian
Higher
22 3.44 .44 21 3.54 .43 43 3.49 .43
Lower
14 2.37 .65 15 2.36 .76 29 2.36 .70
Subtotal
36 3.02 .75 36 3.05 .83 72 3.04 .79
Total
50 2.72 .94 50 2.84 .91 100 2.78 .92
Higher
25 3.38 .48 25 3.47 .46 50 3.42 .47
Lower
25 2.06 .81 25 2.22 .82 50 2.14 .81
REB = Rotate-Eight Block Schedule (Experimental Treatment Group) SPD = Six-Period Day Schedule (Comparison Treatment Group)

Heger, Brad, 2006, UMSL, p. 55
Table 6
Analysis of Variance (Treatment x Ethnicity x Ability) of the Grade 10
Mathematics (Post-Treatment) GPAs (GPAMA)
Source
Sum of Squares
df Mean Square
F p Part Eta Squared
Between Subjects
Treatment (T)
.35 1 .35 .86 .356 .009
Ethnicity (E)
4.12 1 4.12 10.20 .002 .100
Ability (A)
20.59 1 20.59 50.97 .000 .356
T x E
.17 1 .17 .42 .518 .005
T x A
.01 1 .01 .03 .875 .000
E x A
.00 1 .00 .00 .973 .000
T x E x A
.10 1 .10 .26 .615 .003
Within Subjects
Error
37.17 92 .40
Total
857.85 100
REB = Rotate-Eight Block Schedule (Experimental Treatment Group) SPD = Six-Period Day Schedule (Comparison Treatment Group)
Heger, Brad, 2006, UMSL, p. 56
Results of analyses of science post-treatment measures
The post-treatment instrument used in testing research hypothesis 3 and its null
hypothesis (H3, H30) was the Missouri Assessment Program (MAP) test in science
administered to all tenth grade students in Missouri annually. The post-treatment instrument
used to test research hypothesis 4 and its null hypothesis (H4, H40) was grade point average
in science (GPASC) as accumulated in the four high school semesters leading up to the MAP
tests. All analyses were performed using the general linear model in the statistics package
SPSS, version 14.0 for Windows (2005).
Research hypothesis 3 (H3) was tested by attempting to reject its null hypothesis
(H30) for the first post-treatment measure in science, grade 10 science MAP test scores. To
examine statistical significance for the effects of treatment, ethnicity, and ability level,
analyses of variance were performed. A three-factor (2 x 2 x 2) univariate analysis of
variance (ANOVA) was used. Gender was also taken into account by equalizing gender
across subgroups to the extent possible. Research hypothesis 4 (H4) was tested by attempting
to reject its null hypothesis (H40) for the second post-treatment measure in science, grade 10
science grade point averages (GPASC). Tables 7 and 9 present the means and standard
deviations on the grade 10 science MAP test measure, and on the grade 10 science GPA
(GPASC) measure, respectively. Summary Tables 8 and 10 present the overall results of the
analyses of variance performed on the respective measures.

Heger, Brad, 2006, UMSL, p. 57
Table 7
Means (m) and Standard Deviations (sd) of the Grade 10
MAP Science (Post-Treatment) Scores
REB
SPD All
Ethnicity
N m sd N m sd
N m
sd
Ability
African-American
Higher
3 730.33 27.54 4 725.00 25.31 7 727.29 24.11
Lower
11 681.18 32.47 10 698.40 33.34 21 689.38 33.24
Subtotal
14 691.71 36.95 14 706.00 32.76 28 698.86 35.03
Caucasian
Higher
22 743.55 19.08 21 752.29 28.25 43 747.81 24.12
Lower
14 702.43 34.14 15 709.73 28.19 29 706.21 30.86
Subtotal
36 727.56 32.63 36 734.56 35.03 72 731.06 33.79
Total
50 717.52 37.24 50 726.56 36.45 100 722.04 36.94
Higher
25 741.96 20.02 25 747.92 29.15 50 744.94 24.93
Lower
25 693.08 34.44 25 705.20 30.21 50 699.14 32.64
REB = Rotate-Eight Block Schedule (Experimental Treatment Group) SPD = Six-Period Day Schedule (Comparison Treatment Group)
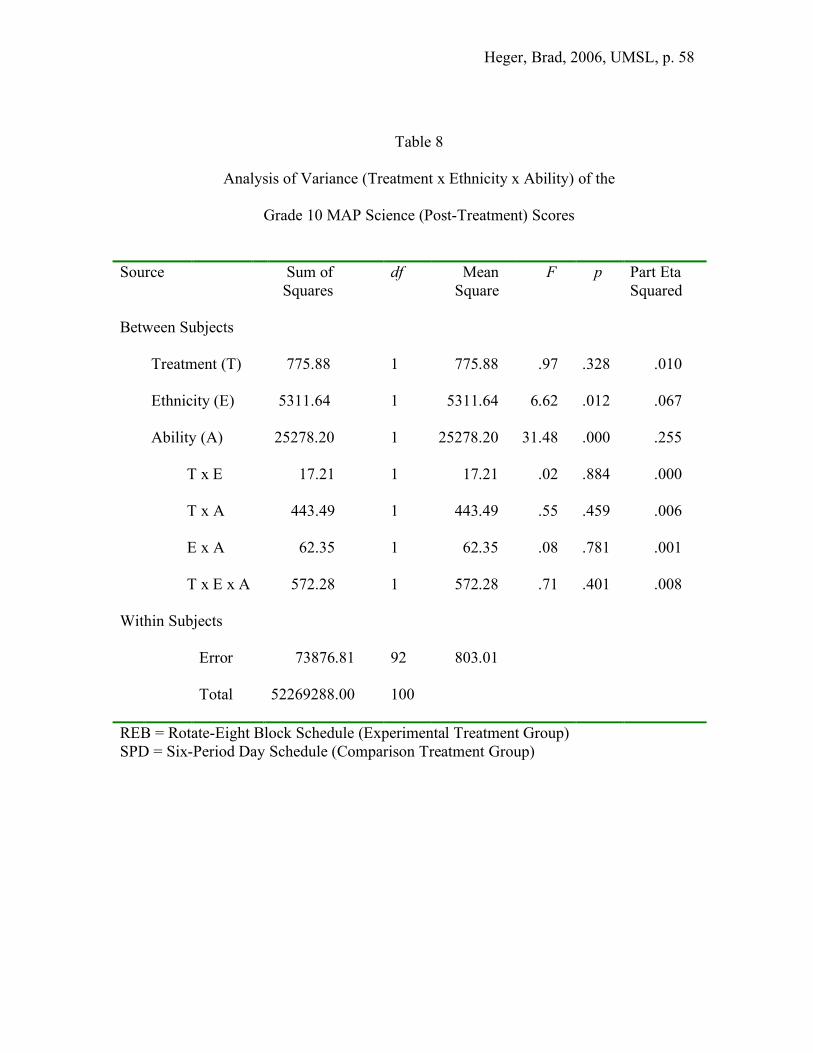
Heger, Brad, 2006, UMSL, p. 58
Table 8
Analysis of Variance (Treatment x Ethnicity x Ability) of the
Grade 10 MAP Science (Post-Treatment) Scores
Source
Sum of Squares
df Mean Square
F p Part Eta Squared
Between Subjects
Treatment (T)
775.88 1 775.88 .97 .328 .010
Ethnicity (E)
5311.64 1 5311.64 6.62 .012 .067
Ability (A)
25278.20 1 25278.20 31.48 .000 .255
T x E
17.21 1 17.21 .02 .884 .000
T x A
443.49 1 443.49 .55 .459 .006
E x A
62.35 1 62.35 .08 .781 .001
T x E x A
572.28 1 572.28 .71 .401 .008
Within Subjects
Error
73876.81 92 803.01
Total
52269288.00 100
REB = Rotate-Eight Block Schedule (Experimental Treatment Group) SPD = Six-Period Day Schedule (Comparison Treatment Group)
Heger, Brad, 2006, UMSL, p. 59
As presented in Table 8, the results of the univariate analyses of variance (ANOVA)
of the means obtained on the grade 10 science MAP scores indicated
• no significant treatment effects.
• a significant effect for ethnicity (p = .012). Caucasian students outperformed
African-American students within both treatment groups.
• a significant ability effect (p < .001). High-ability students outperformed low-
ability students within both treatment groups.
• no significant interaction effects.
No significant effects or interactions were found on the basis of treatment (schedule
type) for the first science post-treatment measure, grade 10 science MAP tests, therefore the
null hypothesis could not be rejected for these groups. The research hypothesis could
therefore not be accepted on the basis of the first post-treatment measure for science
achievement, grade 10 science MAP tests.
Table 9 presents the means and standard deviations on the second post-treatment
measure for science achievement, grade 10 science grade point average (GPASC).

Heger, Brad, 2006, UMSL, p. 60
Table 9
Means (m) and Standard Deviations (sd) of the Grade 10
Science (Post-Treatment) GPAs (GPASC)
REB
SPD All
Ethnicity
N m sd N m sd
N m sd
Ability
African-American
Higher
3 3.08 .14 4 3.06 .63 7 3.07 .45
Lower
11 1.68 .53 10 1.58 .65 21 1.63 .57
Subtotal
14 1.98 .76 14 2.00 .93 28 1.99 .83
Caucasian
Higher
22 3.18 .58 21 3.41 .44 43 3.29 .53
Lower
14 1.71 .63 15 1.80 .56 29 1.76 .58
Subtotal
36 2.61 .94 36 2.74 .94 72 2.67 .93
Total
50 2.44 .93 50 2.53 .99 100 2.48 .95
Higher
25 3.17 .55 25 3.35 .48 50 3.26 .52
Lower
25 1.70 .57 25 1.71 .59 50 1.71 .58
REB = Rotate-Eight Block Schedule (Experimental Treatment Group) SPD = Six-Period Day Schedule (Comparison Treatment Group)

Heger, Brad, 2006, UMSL, p. 61
Table 10
Analysis of Variance (Treatment x Ethnicity x Ability) of the Grade 10
Science (Post-Treatment) GPAs (GPASC)
Source
Sum of Squares
df Mean Square
F p Part Eta Squared
Between Subjects
Treatment (T)
.03 1 .03 .11 .746 .001
Ethnicity (E)
.49 1 .49 1.58 .213 .017
Ability (A)
35.35 1 35.35 114.82 .000 .555
T x E
.19 1 .19 .62 .435 .007
T x A
.05 1 .05 .16 .689 .002
E x A
.03 1 .03 .11 .743 .001
T x E x A
.003 1 .003 .008 .927 .000
Within Subjects
Error
28.32 92 .31
Total
706.19 100
REB = Rotate-Eight Block Schedule (Experimental Treatment Group) SPD = Six-Period Day Schedule (Comparison Treatment Group)

Heger, Brad, 2006, UMSL, p. 62
As presented in Table 10, the results of the univariate analyses of variance (ANOVA)
of the means obtained on the grade 10 science grade point average (GPASC) indicated
• no significant treatment effects.
• no significant effect for ethnicity.
• a significant ability effect (p < .001). High-ability students outperformed low-
ability students within both treatment groups.
• no significant interaction effects.
No significant effects or interactions were found on the basis of treatment (schedule
type) for the second science post-treatment measure, grade 10 science grade point averages,
therefore the null hypothesis could not be rejected for these groups. The research hypothesis
could therefore not be accepted on the basis of the second post-treatment measure for science
achievement.
In summary, no statistically significant results or trends were discovered in part 1 of
the study based upon treatment. None of the null hypotheses in part 1 (H10 through H40)
could be rejected, and therefore none of the research hypotheses (H1 through H4) could be
accepted.
Research hypothesis and null hypothesis, part 2 of the study
Part two of the study investigated the third research question, as measured by an
original survey:
• Do graduates who had a REB schedule (experimental group) currently report
different opinions toward their experience in that schedule, compared to opinions
currently reported by graduates who had an SPD schedule (comparison group)?

Heger, Brad, 2006, UMSL, p. 63
In addition to investigating graduates’ current opinions of the effectiveness of the
treatment (schedule type) overall, subscales within the survey were designed to investigate
the effectiveness of the student’s own participation in the treatment (four survey items), and
the effectiveness of the classroom activities in the treatment (five survey items).
The research hypothesis and its corresponding null hypothesis (H5, H50), were as
follows.
H5 There is a statistically significant difference in the survey scores obtained from
graduates of a suburban Midwestern high school who experienced a Rotate-Eight Block
schedule format (experimental group) compared to the survey scores obtained from graduates
who experienced a Six-Period Daily schedule format (comparison group), regardless of
ethnicity or gender.
H50 There is no statistically significant difference in the survey scores obtained from
graduates of a suburban Midwestern high school who experienced a Rotate-Eight Block
schedule format (experimental group) compared to the survey scores obtained from graduates
who experienced a Six-Period Daily schedule format (comparison group), regardless of
ethnicity or gender.
Survey results and analyses
Groups and subgroups examined were based on treatment (REB schedule and SPD
schedule), ethnicity (African-American and Caucasian), and gender (female and male).
Graduates’ individual responses are reported in Appendix E. Scores were computed based on
the effectiveness of the treatment overall (survey items 1-9), on subscale items related to the
effectiveness of the classroom activities in the treatment (survey items 1-5), and on subscale
Heger, Brad, 2006, UMSL, p. 64
items related to the effectiveness of the subject’s own participation in the treatment (survey
items 6-9). Four of the items were reverse-scored (survey items 2, 4, 6, and 8).
Reliability of the survey was measured through computation of Cronbach’s index of
internal consistency (Cronbach’s alpha) on the basis of treatment, ethnicity and gender. The
Spearman-Brown formula was applied to account for the small number of items. For the
purposes of basic research, the survey was found to be reliable overall, and in both subscales,
for all groups and subgroups. Results for treatment, ethnicity, and gender groups are reported
in their entirety in Appendix F, summary Tables F1 through F3 respectively, and are
followed by results for ethnicity and gender subgroups within the treatments (summary
Tables F4 through F7).
Univariate analyses of variance (ANOVA) were used to analyze the data obtained
from the survey. The research hypothesis was tested by attempting to reject its null
hypothesis for the overall survey results and for each of the two subscales. To determine the
significance of treatment effects, the null hypothesis was tested for the significance of the
effects of the individual factors and for the significance of the effects of interactions. All
main effects and interactions were tested. A 2 x 2 x 2 three-factor univariate analysis of
variance, treatment by ethnicity by gender, was used. The general linear model in SPSS for
Windows, version 14.0 (2005) was employed to conduct all analyses. Significance was set at
the .05 level.
Table 11 presents the means and standard deviations of the scores for the overall
effectiveness of the treatment schedules (9 items). The possible score for each of the items
ranged from 1 (most negative response) to 5 (most positive response). Items 2, 4, 6 and 8
were reverse-scored. The minimum score possible for each treatment was 9 (completely

Heger, Brad, 2006, UMSL, p. 65
negative), and the maximum score possible was 45 (completely positive). A neutral response
(3) on every item would have resulted in an overall score of 27.
As presented in summary Table 12, the results of the univariate analyses of variance
(ANOVA) of the means obtained for the scores on overall effectiveness of the treatment
schedules indicated
• a significant treatment effect (p = .009). Participants’ scores for the overall
effectiveness of each treatment differed significantly by treatment. Graduates of
the SPD (comparison) schedule rated the overall effectiveness of the schedule
higher (SPD mean = 34.43) than did graduates of the REB (experimental)
schedule (REB mean = 32.12).
• no significant effect for ethnicity.
• no significant effect for gender.
• no significant interaction effects of any order.
• a trend in the interaction effect of treatment and ethnicity (p = .056).
Based on these findings of a significant treatment effect, the null hypothesis can be
rejected for the treatment groups, and therefore the research hypothesis can be accepted.
Graduates who experienced the REB schedule differed significantly in their opinions of the
overall effectiveness of the schedule from graduates who experienced the SPD schedule
(REB mean = 32.12, SPD mean = 34.43). A trend was also noted in the interaction of
treatment and ethnicity. African-Americans’ mean scores for the treatments’ overall
effectiveness more strongly favored the SPD over the REB schedule than did Caucasians’
mean scores (African-Americans’ SPD mean = 35.80, REB mean = 29.86; Caucasians’ SPD
mean = 33.88, REB mean = 32.73).

Heger, Brad, 2006, UMSL, p. 66
Table 11
Means (m) and Standard Deviations (sd) of Scores for the
Overall Effectiveness of the Treatment Schedules
REB
SPD All
Ethnicity
N m sd N m sd
N m sd
Gender
African-American
F
4 32.50 2.38 5 34.40 8.33 9 33.56 6.15
M
3 26.33 2.52 5 37.20 7.19 8 33.13 7.94
Subtotal
7 29.86 3.98 10 35.80 7.48 17 33.35 6.82
Caucasian
F
11 33.36 5.84 13 34.31 3.77 24 33.88 4.74
M
15 32.27 3.39 12 33.42 4.25 27 32.78 3.77
Subtotal
26 32.73 4.51 25 33.88 3.95 51 33.29 4.24
Total
33 32.12 4.51 35 34.43 5.16 68 33.31 4.95
F
15 33.13 5.07 18 34.33 5.13 33 33.79 5.06
M
18 31.28 3.92 17 34.53 5.34 35 32.86 4.88
REB = Rotate-Eight Block Schedule (Experimental Treatment Group) SPD = Six-Period Day Schedule (Comparison Treatment Group)

Heger, Brad, 2006, UMSL, p. 67
Table 12
Analysis of Variance (Treatment x Ethnicity x Gender) of Scores for the
Overall Effectiveness of the Treatment Schedules
Source
Sum of Squares
df Mean Square
F p Part Eta Squared
Between Subjects
Treatment (T)
169.73 1 169.73 7.35 .009 .109
Ethnicity (E)
6.56 1 6.56 .28 .596 .005
Gender (G)
22.04 1 22.04 .96 .332 .016
T x E
87.54 1 87.54 3.79 .056 .059
T x G
64.66 1 64.66 2.80 .099 .045
E x G
1.46 1 1.46 .06 .802 .001
T x E x G
58.99 1 58.99 2.56 .115 .041
Within Subjects
Error
1384.83 60 23.08
Total
77089.00 68

Heger, Brad, 2006, UMSL, p. 68
Table 13 presents the means and standard deviations of the scores for the
effectiveness of the student’s own participation in each treatment (items 6 – 9). Items 6 and 8
were reverse-scored. The possible score for each of the items ranged from 1 (most negative
response) to 3 (neutral response) to 5 (most positive response), allowing a minimum score of
4 (completely negative) on the personal participation subscale, and a maximum of 20
(completely positive). A neutral response on every item would have resulted in a score of 12
for the subscale.
As presented in summary Table 14, the results of the univariate analyses of variance
(ANOVA) of the means obtained on scores on the personal participation subscale in each
treatment (items 6 – 9) indicated
• no significant effect for treatment.
• no significant effect for ethnicity.
• no significant effect for gender.
• no significant interaction effects of any order.
Based on these findings of no significant treatment or interaction effects, the null
hypothesis can not be rejected for these groups, and so the research hypothesis can not be
accepted for the personal participation subscale. Graduates of the two types of schedules did
not differ significantly in their opinions on the personal participation subscale.

Heger, Brad, 2006, UMSL, p. 69
Table 13
Means (m) and Standard Deviations (sd) of Scores for the Effectiveness of the
Student’s Own Participation Subscale
REB
SPD All
Ethnicity
N m
sd N m sd
N m sd
Gender
African-American
F
4 15.00 2.94 5 15.20 3.19 9 15.11 2.89
M
3 11.33 4.04 5 15.40 4.56 8 13.88 4.58
Subtotal
7 13.43 3.69 10 15.30 3.71 17 14.53 3.71
Caucasian
F
11 15.09 3.30 13 15.31 2.81 24 15.21 2.98
M
15 13.60 2.41 12 15.25 2.01 27 14.33 2.35
Subtotal
26 14.23 2.86 25 15.28 2.41 51 14.75 2.68
Total
33 14.06 3.01 35 15.29 2.78 68 14.69 2.94
F
15 15.07 3.11 18 15.28 2.82 33 15.18 2.91
M
18 13.22 2.73 17 15.29 2.83 35 14.23 2.93
REB = Rotate-Eight Block Schedule (Experimental Treatment Group) SPD = Six-Period Day Schedule (Comparison Treatment Group)

Heger, Brad, 2006, UMSL, p. 70
Table 14
Analysis of Variance (Treatment x Ethnicity x Gender) of Scores for the
Effectiveness of the Student’s Own Participation Subscale
Source
Sum of Squares
df Mean Square
F p Part Eta Squared
Between Subjects
Treatment (T)
28.91 1 28.91 3.39 .071 .053
Ethnicity (E)
4.12 1 4.12 .48 .490 .008
Gender (G)
19.33 1 19.33 2.26 .138 .036
T x E
4.43 1 4.43 .52 .474 .009
T x G
21.59 1 21.59 2.53 .117 .040
E x G
2.83 1 2.83 .33 .567 .005
T x E x G
4.55 1 4.55 .53 .468 .009
Within Subjects
Error
512.20 60 8.54
Total
15255.00 68

Heger, Brad, 2006, UMSL, p. 71
Table 15 presents the means and standard deviations of the scores for the
effectiveness of classroom activities subscale in each treatment (survey items 1 – 5). The
possible score for each of the items ranged from 1 (most negative response) to 5 (most
positive response), allowing a minimum score of 5 (most negative) on the classroom
activities subscale, and a maximum of 25 (most positive). A neutral response on every item
in the subscale would have resulted in a score of 15 for the subscale.
As presented in summary Table 16, the results of the univariate analyses of variance
(ANOVA) of the means obtained on scores for the classroom activities subscale in each
treatment (survey items 1 - 5) indicated
• a significant treatment effect (p = .010). Graduates’ scores differed significantly
for the classroom activities subscale by treatment. Graduates of the SPD
(comparison) schedule rated the effectiveness of classroom activities significantly
higher (SPD mean = 19.14) than did graduates of the REB (experimental)
schedule (REB mean = 18.06).
• no significant effect for ethnicity.
• no significant effect for gender.
• a significant interaction effect of treatment by ethnicity (p = .021). In general
graduates of the SPD schedule rated the effectiveness of classroom activities
significantly higher than did graduates of the REB schedule, while African-
American and Caucasian graduates’ scores differed significantly. African-
American graduates’ opinions of the SPD schedule classroom activities were
considerably higher than those expressed by African-American graduates in the
REB (experimental) schedule (African-Americans’ SPD mean = 20.50, REB

Heger, Brad, 2006, UMSL, p. 72
mean = 16.43), while Caucasian graduates of the SPD schedule rated the
effectiveness of the classroom activities much closer to the level they rated the
REB classroom activities (Caucasians’ SPD mean = 18.60, REB mean = 18.50).
Caucasian males scored the effectiveness of the classroom activities slightly
higher in the REB schedule than in the SPD schedule (REB mean = 18.67, SPD
mean = 18.17), but other subgroups did not. Caucasian females scored the
classroom activities higher in the SPD schedule than in the REB schedule (REB
mean = 18.27, SPD mean = 19.00), as did African-American females and males.
African-American females’ mean scores on the classroom activities subscale
indicated more difference between treatments than did Caucasian females’ mean
scores, but not so much difference between treatments as found in African-
American males’ mean scores (African-American females’ REB mean = 17.50,
SPD mean = 19.20; African-American males’ REB mean = 15.00, SPD mean =
21.80).
• no other significant interaction effects of any order.
Based on these findings, the null hypothesis can be rejected for these groups and
subgroups, and the research hypothesis therefore can be accepted for the classroom activities
subscale. Graduates differed significantly by treatment and ethnicity in their opinions of the
effectiveness of the classroom activities in each schedule.
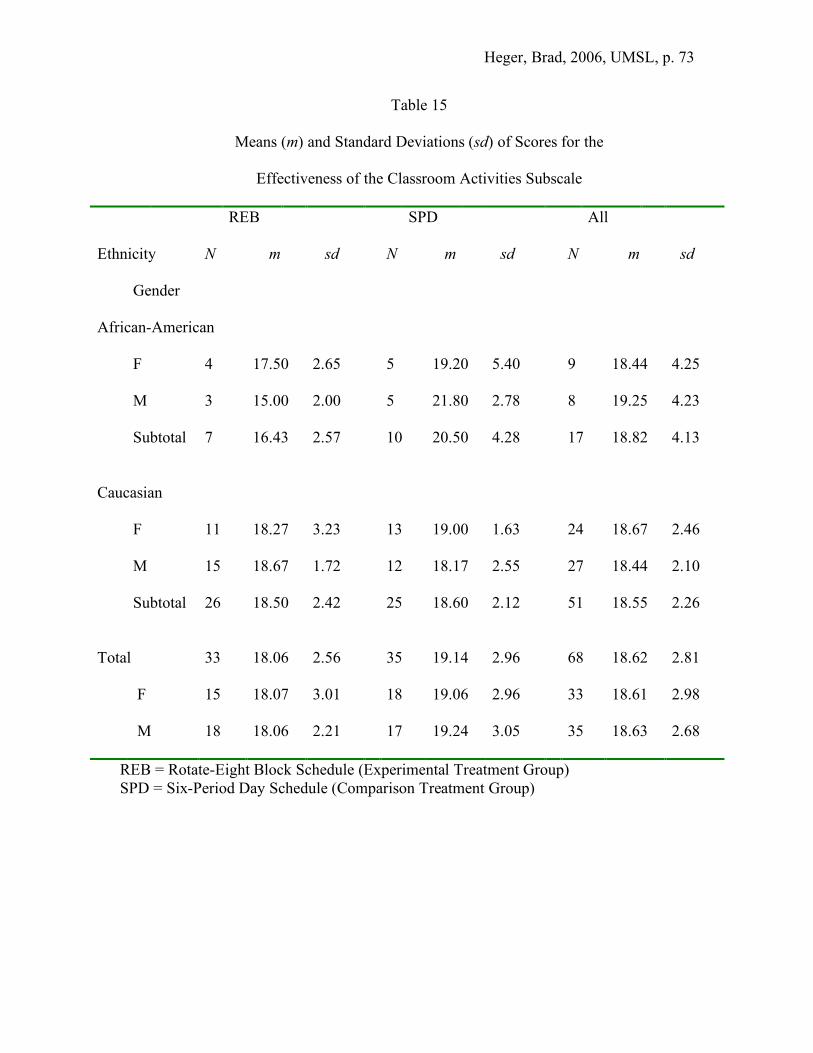
Heger, Brad, 2006, UMSL, p. 73
Table 15
Means (m) and Standard Deviations (sd) of Scores for the
Effectiveness of the Classroom Activities Subscale
REB
SPD All
Ethnicity
N m
sd N m sd
N m sd
Gender
African-American
F
4 17.50 2.65 5 19.20 5.40 9 18.44 4.25
M
3 15.00 2.00 5 21.80 2.78 8 19.25 4.23
Subtotal
7 16.43 2.57 10 20.50 4.28 17 18.82 4.13
Caucasian
F
11 18.27 3.23 13 19.00 1.63 24 18.67 2.46
M
15 18.67 1.72 12 18.17 2.55 27 18.44 2.10
Subtotal
26 18.50 2.42 25 18.60 2.12 51 18.55 2.26
Total
33 18.06 2.56 35 19.14 2.96 68 18.62 2.81
F
15 18.07 3.01 18 19.06 2.96 33 18.61 2.98
M
18 18.06 2.21 17 19.24 3.05 35 18.63 2.68
REB = Rotate-Eight Block Schedule (Experimental Treatment Group) SPD = Six-Period Day Schedule (Comparison Treatment Group)

Heger, Brad, 2006, UMSL, p. 74
Table 16
Analysis of Variance (Treatment x Ethnicity x Gender) of the
Effectiveness of the Classroom Activities Subscale
Source
Sum of Squares
df Mean Square
F p Part Eta Squared
Between Subjects
Treatment (T)
49.52 1 49.52 6.99 .010 .104
Ethnicity (E)
.73 1 .73 .10 .750 .002
Gender (G)
3.16 1 3.16 .45 .507 .007
T x E
39.54 1 39.54 5.58 .021 .085
T x G
6.79 1 6.79 .96 .332 .016
E x G
2.99 1 2.99 .42 .518 .007
T x E x G
19.42 1 19.42 2.74 .103 .044
Within Subjects
Error
425.18 60 7.09
Total
24267.00 68

Heger, Brad, 2006, UMSL, p. 75
Summary
In this chapter the results of the two parts of the study were presented. MAP scores in
mathematics and science, along with GPAs in mathematics and science, were used to test
whether there was a significant difference in the mathematics and science achievement levels
of students who experienced a REB schedule (experimental treatment) compared to the
achievement levels of students who experienced an SPD schedule (comparison treatment).
Four research hypotheses were tested by attempting to reject their corresponding null
hypotheses. Univariate analyses of variance (ANOVA) were conducted using a three-way,
2 x 2 x 2 design, to check for the influences of treatment (REB or SPD schedule), ethnicity
(African-American or Caucasian) and ability level (higher or lower). Gender was taken into
account by equalizing numbers across subgroups to the extent possible. The findings
indicated that none of the null hypotheses could be rejected, and therefore none of the
research hypotheses in part 1 of the study could be accepted. Students in the two types of
schedules did not differ significantly in their mathematics and science achievement levels by
any of the measures utilized.
Part 2 of the study utilized an original survey to investigate whether the graduates
who experienced the two treatments hold opinions today that differ significantly. Overall
effectiveness of the treatment schedule (all nine questions), a subscale on the effectiveness of
the student’s own participation (four questions), and a subscale on the effectiveness of the
classroom activities (five questions) were examined. Internal reliability of the survey was
found to be adequate for basic research purposes based on calculation of Cronbach’s alpha,
adjusted by the Spearman-Brown formula. Three-way, 2 x 2 x 2 (treatment by ethnicity by
Heger, Brad, 2006, UMSL, p. 76
gender) univariate analyses (ANOVA) were used to test the scores obtained from the survey
overall and on each of the two subscales.
Analysis of the scores obtained from the survey overall indicated that opinions of the
overall effectiveness of the schedule from graduates who experienced the SPD schedule
differed significantly from opinions expressed by graduates who experienced the REB
schedule. Based on these findings of a significant treatment effect, the null hypothesis can be
rejected for the treatment groups, and therefore the research hypothesis can be accepted.
Graduates who experienced the REB schedule differed significantly in their opinions of the
overall effectiveness of the schedule from graduates who experienced the SPD schedule. A
trend was also noted in the interaction of treatment by ethnicity. African-Americans’ mean
scores for the treatments’ overall effectiveness more strongly favored the SPD over the REB
schedule than did Caucasians’ mean scores.
Analysis of the results from the personal participation subscale indicated that the null
hypothesis could not be rejected, and so the research hypothesis could not be accepted.
Graduates of the two types of schedules did not differ significantly in their opinions on the
personal participation subscale.
Analysis of the results from the classroom activities subscale indicated that the null
hypothesis could be rejected on the basis of treatment (p = .010). An interaction effect of
treatment and ethnicity was also found (p = .021). Based on these findings, the research
hypothesis therefore can be accepted for the classroom activities subscale. The graduates
expressed opinions that differed significantly by treatment and ethnicity concerning the
effectiveness of the classroom activities in each schedule. Further discussion of these
findings and the implications follows in Chapter 5.

Heger, Brad, 2006, UMSL, p. 77
Chapter 5
Discussion
Overview
This chapter presents a summary of the study and of its findings. The limitations of
the study, discussion of the findings, and implications for further research are included.
Purpose, hypotheses, and overall design of the study
The purpose of the first part of the study was to compare the effects of two types of
secondary school schedules on achievement in mathematics and science. Test data and
demographic information were obtained from archival information on two graduated classes
in a selected suburban Midwestern high school with an annual enrollment, grades 9 to 12, of
approximately 1000 students. The school district in which the school is located expressed an
interest in the results of the study at the time the study was proposed, and provided extensive
support in providing access to demographic information and test data from archival sources.
The experimental treatment consisted of Rotate-Eight Block (REB) scheduling in grades 9
and 10, and the comparison treatment consisted of traditional Six-Period Daily (SPD)
scheduling in grades 9 and 10.
Stratified random samples were selected based on treatment, ethnicity, ability level
and gender. Grade Point Averages (GPAs) and Missouri Assessment Program (MAP) test
scores in mathematics and science were used as dependent measures to test whether there
was a significant difference in the mathematics and science achievement levels of students
who experienced a REB schedule (experimental treatment) compared to the achievement
levels of students who experienced an SPD schedule (comparison treatment). Research
hypotheses 1 through 4 were tested by attempting to reject their corresponding null

Heger, Brad, 2006, UMSL, p. 78
hypotheses. Those research hypotheses and their corresponding null hypotheses, as reported
earlier in chapters 1 and 4, were as follows.
H1 There is a statistically significant difference in the scores obtained on the
mathematics portion of the MAP by students in a suburban Midwestern high school
who experienced a Rotate-Eight Block schedule format (experimental group)
compared to the scores obtained by students who experienced a Six-Period Daily
schedule format (comparison group), regardless of ethnicity or ability level.
H10 There is no statistically significant difference in the scores obtained on the
mathematics portion of the MAP by students in a suburban Midwestern high school
who received instruction in a Rotate-Eight Block schedule format (experimental
group) compared to the scores obtained by students who received instruction in a Six-
Period Daily schedule format (comparison group) regardless of ethnicity or ability
level.
H2 There is a statistically significant difference in the mathematics grade point
averages (GPAMA) obtained by students in a suburban Midwestern high school who
experienced a Rotate-Eight Block schedule format (experimental group) compared to
the mathematics grade point averages (GPAMA) obtained by students who experienced
a Six-Period Daily schedule format (comparison group), regardless of ethnicity or
ability level.
H20 There is no statistically significant difference in the mathematics grade point
averages (GPAMA) obtained by students in a suburban Midwestern high school who
experienced a Rotate-Eight Block schedule format (experimental group) compared to
the mathematics grade point averages (GPAMA) obtained by students who experienced
Heger, Brad, 2006, UMSL, p. 79
a Six-Period Daily schedule format (comparison group), regardless of ethnicity or
ability level.
H3 There is a statistically significant difference in the scores obtained on the
science portion of the MAP by students in a suburban Midwestern high school who
experienced a Rotate-Eight Block schedule format (experimental group) compared to
the scores obtained by students who experienced a Six-Period Daily schedule format
(comparison group), regardless of ethnicity or ability level.
H30 There is no statistically significant difference in the scores obtained on the
science portion of the MAP by students in a suburban Midwestern high school who
received instruction in a Rotate-Eight Block schedule format (experimental group)
compared to the scores obtained by students who received instruction in a Six-Period
Daily schedule format (comparison group), regardless of ethnicity or ability level.
H4 There is a statistically significant difference in the science grade point
averages (GPASC) obtained by students in a suburban Midwestern high school who
experienced a Rotate-Eight Block schedule format (experimental group) compared to
the science grade point averages (GPASC) obtained by students who experienced a
Six-Period Daily schedule format (comparison group), regardless of ethnicity or
ability level.
H40 There is no statistically significant difference in the science grade point
averages (GPASC) obtained by students in a suburban Midwestern high school who
experienced a Rotate-Eight Block schedule format (experimental group) compared to
the science grade point averages (GPASC) obtained by students who experienced a

Heger, Brad, 2006, UMSL, p. 80
Six-Period Daily schedule format (comparison group), regardless of ethnicity or
ability level.
Univariate analyses of variance (ANOVA) were conducted in a three-way,
2 x 2 x 2 design, to check for the influences of treatment (REB or SPD schedule), ethnicity
(African-American or Caucasian), and ability level (higher or lower). Gender was taken into
account by equalizing numbers across subgroups to the extent possible.
Part 2 of the study utilized an original survey to examine whether the graduates who
experienced the two treatments hold opinions today that differ significantly. Likert-style
surveys were mailed to samples stratified by treatment, ethnicity and gender. The research
hypothesis was tested by attempting to reject its corresponding null hypothesis for the survey
overall and for two subscales. Research hypothesis 5 and its corresponding null hypothesis,
as reported earlier in chapters 1 and 4, were as follows.
H5 There is a statistically significant difference in the survey scores obtained
from graduates of a suburban Midwestern high school who experienced a Rotate-
Eight Block schedule format (experimental group) compared to the survey scores
obtained from graduates who experienced a Six-Period Daily schedule format
(comparison group), regardless of ethnicity or gender.
H50 There is no statistically significant difference in the survey scores obtained
from graduates of a suburban Midwestern high school who experienced a Rotate-
Eight Block schedule format (experimental group) compared to the survey scores
obtained from graduates who experienced a Six-Period Daily schedule format
(comparison group), regardless of ethnicity or gender.
Heger, Brad, 2006, UMSL, p. 81
Three-way, 2 x 2 x 2 (treatment by ethnicity by gender) univariate analyses
(ANOVA) were utilized to test the scores obtained from the survey. The survey measured
graduates’ opinions concerning effectiveness of the treatment schedule overall (nine items)
and two subscales: one concerning effectiveness of the classroom activities in the treatment
(five items), and another concerning effectiveness of the student’s own participation (four
items). Computations of internal consistency for the survey overall and for each subscale
were conducted by calculating Cronbach’s alpha for each group and subgroup, as adjusted by
the Spearman-Brown formula.
Summary of the findings
The findings of the study were as follows.
Higher ability groups and subgroups outperformed lower ability groups and
subgroups within treatments at a significant level on every academic measure, including the
pre-treatment measure, as would be expected by the definition of higher and lower general
academic ability.
Caucasian groups and subgroups outperformed African-American groups and
subgroups at a significant level on every measure, including the pre-treatment measure, with
one exception. There was no significant difference found as a main effect for ethnicity on the
science grade point average measure. The only significant main effect found on the science
grade point average measure was ability. There were no significant interaction effects.
There were no significant main effects found for treatment (schedule type) in the
investigation of any of the hypotheses regarding science and mathematics achievement levels
(H1 – H4, H10 – H40), nor were there any significant interaction effects found.

Heger, Brad, 2006, UMSL, p. 82
Scores from the surveys revealed significant differences by treatment for the overall
effectiveness of the schedule type. Graduates of the SPD schedule rated the overall
effectiveness of the schedule significantly higher than did graduates of the REB schedule. A
summed score of 27 on the nine items was an exactly neutral score; although the mean scores
differed significantly, both group means were above neutral. While the REB group mean
was 32.12, the SPD group mean was 34.43. An interaction was found with the discovery of a
strong tendency (p = .056) in the interaction of treatment by ethnicity.
The interaction of treatment by ethnicity indicated that African-Americans’ mean
scores for the treatments’ overall effectiveness more strongly favored the SPD over the REB
schedule than did Caucasians’ mean scores. In the REB schedule, the mean for African-
Americans was only 2.86 points above exactly neutral at 29.86, while in the SPD schedule
the mean was 35.80, 5.94 points higher than the REB mean for this subgroup, and a full 8.80
points higher than the exactly neutral mark (27.00). For Caucasians, the REB schedule mean
rating was within 1.15 points of the SPD mean score (REB mean = 32.73, SPD mean =
33.88).
Scores from the survey subscale on effectiveness of the participant’s personal
participation in the schedule indicated no statistically significant main effects or interactions
at the .05 level.
Scores from the survey subscale on effectiveness of classroom activities revealed
significant differences by treatment (p = .010). An exactly neutral summed score for the five
items on the classroom activities subscale was 15. Graduates of the SPD schedule scored the
effectiveness of classroom activities significantly higher (SPD mean = 19.14) than did
Heger, Brad, 2006, UMSL, p. 83
graduates of the REB schedule (REB mean = 18.06). A significant interaction of treatment by
ethnicity (p = .021) was also discovered.
The interaction effect of treatment by ethnicity indicated that while these subgroups
generally rated both schedules above neutral for effectiveness of classroom activities,
African-American and Caucasian graduates’ scores differed significantly in the schedules.
African-American graduates’ opinions of the effectiveness of the SPD schedule classroom
activities were considerably higher than those expressed by African-American graduates in
the REB schedule (African-Americans’ SPD mean = 20.50, REB mean = 16.43), while
Caucasian graduates of the SPD schedule rated the effectiveness of the classroom activities
much closer to the level they rated the REB classroom activities (Caucasians’ SPD mean =
18.60, REB mean = 18.50). While Caucasian males rated the effectiveness of the classroom
activities slightly higher in the REB schedule than in the SPD schedule (REB mean = 18.67,
SPD mean = 18.17), other subgroups did not. Caucasian females rated the classroom
activities higher in the SPD schedule than in the REB schedule (REB mean = 18.27, SPD
mean = 19.00), as did African-American females and males. African-American females’
mean scores on the subscale (REB mean = 17.50, SPD mean = 19.20) revealed more
difference between treatments (1.70) than did Caucasian females’ mean scores (0.73), but
none showed nearly the difference between treatments (6.80) discovered in the mean scores
for the African-American males subgroups (REB mean = 15.00, SPD mean = 21.80). Of all
the subgroups’ mean scores obtained on the subscale, only those of the REB African-
American males’ were as low as exactly neutral (15.00); all other subgroups scored both the
REB and the SPD schedules above neutral in effectiveness in classroom activities.

Heger, Brad, 2006, UMSL, p. 84
Limitations of the study
The limitations of the study, as stated in Chapter 1, were as follows.
A limitation on the study was that the focus was narrow, including stratified random
samples from two tenth grade classes at one selected Midwestern suburban school district
with one high school of approximately 1000 students.
Another limitation on the study was the history of the participation of this suburban
district in the St. Louis Voluntary Desegregation Plan. For the duration of this plan and as it
began to phase out, up to approximately one half of the African-American students attending
district schools lived in the City of St. Louis, which is outside the school district limits, and
so were not resident students in this suburban school district. Their presence and participation
in the study greatly enriched the data available, but requires an understanding that, in spite of
the school’s geographic position in the suburbs of St. Louis, the data analyzed were not
wholly obtained from the suburban setting.
Another limitation was that the achievement data were taken from each student’s
sophomore year, so that even though the MAP tests were administered to all students under
the same conditions, the students had experienced only two years of the schedules under
study at the time of the testing.
While the teaching staff remained generally the same with very little turnover from
the Class of 2002 to the Class of 2004, the vast majority of that teaching staff had no direct
previous experience in teaching in a block schedule, as opposed to the school’s long tradition
in a six-period daily schedule. Teachers were provided training for teaching in the extended
periods of the block schedule, but direct experience in block teaching was limited to a
handful of teachers who piloted a limited number of block-style classes with volunteer
Heger, Brad, 2006, UMSL, p. 85
student participants from the Class of 2001. A few newcomers to the teaching staff (after
2000) had also taught in block-style schedules at their previous schools.
A final limitation of the study is that the surveys were conducted three years after
graduation and five years after completion of grade 10 for the Class of 2002, and one year
after graduation and three years after completion of grade 10 for the Class of 2004, so that
memory must be acknowledged as a possible confounding factor.
Discussion of the findings in mathematics and science achievement levels
Students of higher ability can be expected by definition to outscore students of lower
ability on academic measures. This reality was confirmed by the results of part one of the
study, in which significant differences were found between the means of the scores obtained
on every academic measure for groups based on ability in both treatments, not only in post-
treatment measures, but also on the pre-treatment measure. In other words, students of higher
ability started and ended at higher levels of achievement than did students of lower ability,
regardless of treatment condition.
Also confirmed in part one of the study is the existence in this population of the well-
publicized “achievement gap” between Caucasian and African-American students.
Significant differences were found between the means of the scores obtained on every
measure for groups based on ethnicity in both treatments, not only in post-treatment
measures, but also on the pre-treatment measure, with one exception: science grade point
average. In other words, African-American students started and ended at significantly lower
levels of achievement than did Caucasian students, regardless of treatment group, with the
one exception of grade point average in science classes (GPAsc). This measure revealed no
significant difference at the .05 level by ethnicity. There were no significant interaction

Heger, Brad, 2006, UMSL, p. 86
effects. The only significant difference found on this measure was for the main effect of
ability. It is encouraging that at least on this one measure for this limited population, in the
context of the small sample sizes that could be employed, no “achievement gap” could be
found.
There were no significant main effects found for treatment (schedule type) in the
investigation of any of the hypotheses regarding science and mathematics achievement
levels, nor were there any significant interaction effects found. None of the null hypotheses
(H10 – H40), could be rejected, and so therefore none of the research hypotheses in part one
of the study (H1 – H4) could be accepted. The mathematics and science achievement levels
of these student groups and subgroups did not vary by treatment (schedule type) beyond
differences that can be attributed to chance.
An interesting finding, however, was that even though statistically the differences
discovered could be attributed to chance, the pattern of differences in the mean
improvements scored on the post-treatment measure grade 10 mathematics MAP tests
consistently favored certain groups and subgroups. (See Appendix G.) The gains in the
means for the grade 10 mathematics MAP test consistently favored lower ability groups and
subgroups in the experimental (REB) schedule, as detailed in Appendix G, Table G1.
Conversely, the gains in the means consistently favored higher ability groups and subgroups
in the comparison (SPD) schedule, as detailed in Appendix G, Table G2.
Analyses revealed these figures statistically can be explained by chance; however,
had larger sample sizes been possible, it is conceivable statistically significant results may
have been achieved. It is possible the experimental (REB) schedule had some positive effects
on performance for lower ability students, and conversely, the comparison (SPD) schedule

Heger, Brad, 2006, UMSL, p. 87
may have had some positive effects for higher ability students. Such results would support at
least one claim often made by proponents of block scheduling: macroperiods of instructional
time allow teachers to connect more effectively with students’ preferred learning styles and
interests, translating into higher levels of achievement. In this view, lower ability students
would presumably have had more and better opportunities to work within their preferred
styles in the REB schedule. On the other hand, it is feasible that higher ability students would
have found themselves less often working in their preferred learning styles in the REB
schedule. Higher ability students would presumably have to adjust in the REB schedule to
working with fewer opportunities within their preferred styles.
One might expect these patterns to translate into survey results in which higher ability
students scored the SPD schedule as more effective, and lower ability students scored the
REB schedule as more effective. These patterns did not, however, so simply transfer into
easily interpreted survey results, as discussed in the following section.
Discussion of the survey results
The analyses of the survey conducted in part two of the study indicated that the
opinions held today by certain groups and subgroups about the effectiveness of the treatment
schedules differed significantly on two of the three measures. One opinion that did not differ
significantly between the groups was on the subscale of effectiveness of the student’s own
participation: while the REB group rated the effectiveness of their personal participation
lower (14.06) than did the SPD group (15.29), both were well above the neutral mark of
12.00 for this subscale, and any differences noted between groups or subgroups can be
attributed to chance.

Heger, Brad, 2006, UMSL, p. 88
It is important to note that in nearly every case in which a difference was found at the
.05 level, both schedules were scored above neutral; that is, for all statistically significant
main effects and interactions, both treatment schedules received above the “exactly neutral”
summed score with the exception of one subgroup in the REB schedule. At 26.33 (standard
deviation = 2.00), the African-American male REB subgroup mean for overall effectiveness
of the treatment schedule was 0.67 below 27.00, the exactly neutral score for the nine-item
scale. While it is true that this same subgroup’s mean (11.33, standard deviation = 4.04) was
0.67 below 12.00 (exactly neutral for the four-item subscale) for effectiveness of personal
participation, differences for this subscale were not statistically significant at the .05 level. In
no other cases did any subgroup mean score fall below exactly neutral, however slightly, on
any of the three measures.
Only one instance was discovered of any group or subgroup scoring the REB
schedule above the SPD on any of the three measures: Caucasian males scored the
effectiveness of the classroom activities in the REB slightly higher than those in the SPD.
The REB mean was not higher than the SPD mean for any group or subgroup on any other
measure. The widest difference of opinions was found on this measure between African-
Americans and Caucasians, and more specifically, between African-American males and
Caucasian males. While the mean for the Caucasian male subgroup was slightly higher for
the REB (a difference of 0.50, with standard deviations of 1.72 and 2.55), African-American
males’ mean scores favored the SPD by a difference of 6.80 (SPD 21.80, standard deviation
2.78; REB 15.00, standard deviation 2.00).
This wide difference of opinion by ethnicity was reflected also in the nine-item
measure, overall effectiveness of the treatment schedule. While all subgroups’ means favored

Heger, Brad, 2006, UMSL, p. 89
the SPD on this measure, only one subgroup mean was below the exactly neutral mark
(27.00) for the REB: African-American males’. African-American males also rated the SPD
higher than did any other subgroup, thus expressing the strongest preference for the SPD that
was expressed on the survey (SPD 37.20, standard deviation 7.19; REB 26.33, standard
deviation 2.52).
It should not be surprising that in a population in which an academic achievement gap
has been found, the groups’ opinions about their academic experiences would differ. Nor
should it be surprising that African-American males might hold the lowest opinions of
academic experiences in general, given the lack of academic success that has been generally
attributed to African-American males in the past. It is noteworthy that the opinions expressed
concerning the experimental (REB) schedule did not fall much below neutral, or into clearly
and indisputably negative opinions, merely lower than other subgroups’ opinions.
Of interest is the finding that the highest ratings for the traditional (comparison, SPD)
schedule were awarded by African-American males; this is not a schedule which is known
for the academic success of its African-American students. Also of interest in this instance is
that it is the lower ability groups (in which African-Americans, and especially African-
American males, are disproportionately represented in the population at large), who were
found to have made the largest gains in the REB schedule. It seems plausible that those
students who are least comfortable in an academic environment will be even more
uncomfortable in a new and “experimental” academic environment, especially one of the
magnitude of a schedule change, where all “the rules” have to be re-learned. In such a case, it
may matter little whether that schedule is designed to support all students, especially those
not previously experiencing academic success, as has been theorized by block schedule and

Heger, Brad, 2006, UMSL, p. 90
REB proponents. A key consideration may well be students’ familiarity and comfort with the
schedule, perhaps as related to the length of time a school has been in a particular schedule,
or perhaps as related to factors of school culture and climate.
Regardless of any possible differences in the academic gains (which statistically were
not significant), these students rated the SPD schedule as more effective than the REB
schedule on all three measures. While in no group or subgroup was the REB schedule rated
as clearly negative, the SPD was consistently rated higher. This finding is at odds with the
findings in many other studies in which students (as well as faculty, administration, and
parents) expressed opinions favoring block schedules of various types. While not the case in
this study, those results of higher satisfaction with block schedules were sometimes found in
spite of lower academic scores.
Implications for further research
A review of related scholarly literature found a lack of research based exclusively on
this particular configuration of block schedule. While the Rotate Eight Block configuration
has often been the object of research, it has most often been included with other kinds of
superficially similar schedules, based on the length of the individual instructional
macroperiods utilized. In addition, relatively few research efforts have focused on particular
ethnicity groups or on special needs students within the REB schedule, and while more
studies are beginning to utilize more quantitative data from standardized tests, most in the
past have exclusively employed surveys and Likert-type instruments. Further research
focused exclusively on the REB configuration, and based on the quantitative results of
various standardized tests, is recommended. In addition, further research focusing on the
achievements of particular ethnicity groups as well as special needs groups in the REB is

Heger, Brad, 2006, UMSL, p. 91
recommended. Rates of attendance, pass and fail rates, graduation and drop out rates are all
areas needing further examination.
Further research to investigate whether the Caucasian / African-American
achievement gap may be lessened for science GPA based upon these schedule types is
recommended.
Further research built upon larger sample sizes could clarify the possibility that lower
ability students, whether Caucasian or African-American, may benefit from the REB
schedule, for whatever reason. Similarly, continued research built upon larger sample sizes
could clarify the possibility that higher ability students, whether Caucasian or African-
American, may benefit from the SPD schedule.
Further research to investigate the relationship of student efficacy to achievement
within the REB schedule is recommended. In light of the results found in the survey portion
of this study, it would seem continued research investigating student, staff and parent
opinions is advisable, perhaps most importantly in the area of students’ own effective efforts.
Without full engagement, students cannot be expected to achieve at their highest level of
challenge. To find whether a particular schedule configuration contributes to that effective
effort is a valuable and worthwhile endeavor.

Heger, Brad, 2006, UMSL, p. 92
References
Akins, J.G. (2000). High school block scheduling and selected student outcomes: A
longitudinal approach. (Doctoral dissertation, University of Missouri-Columbia, 2000).
Dissertation Abstracts International, 61-05 A, 1683.
Anderson, N. (1999). Block scheduling: Effects on instructional strategies. (Doctoral
dissertation, University of Missouri-Columbia, 1999). Dissertation Abstracts
International, 60-09 A, 3251.
Baker, M.W. (2001). The relationship between eight-block scheduling and specific student
behaviors and academic achievement in selected southwest Missouri high schools.
(Doctoral dissertation, Saint Louis University, 2001). Dissertation Abstracts
International, 62-05 A, 1642.
Bateson, D.J. (1990). Science achievement in semester and all-year courses. Journal of
Research in Science Education, 27 (3), 233-240.
Benton-Kupper, J. (1999). Can less be more? The quantity versus quality issue of curriculum
in a block schedule. Journal of Research and Development in Education, 32 (3), 168-177.
Black, S. (1998). Learning on the block. The American School Board Journal, 185, 32-34.
Brown, E. (1997). The effects of extended block scheduling on math and science
achievement in Missouri and Illinois high schools. (Doctoral dissertation, Saint Louis
University, 1997). Dissertation Abstracts International, 58-08 A, 3075.
Canady, R.L., & Rettig, M.D. (1995). Block scheduling: A catalyst for change in high
schools. Princeton, NJ: Eye on Education.
Canady, R.L., & Rettig, M.D. (Eds.) (1996). Teaching in the block: Strategies for engaging
active learners. Princeton, NJ: Eye on Education.
Heger, Brad, 2006, UMSL, p. 93
Carroll, J.M. (1994a). Organizing time to support learning: Author of Copernican Plan says
“Macro Scheduling” brings time-tested benefits to student growth. The School
Administrator, 51 (3), 26-33.
Carroll, J.M. (1994b). The Copernican Plan evaluated: The evolution of a revolution. Phi
Delta Kappan, 76 (2), 105-113.
Cawelti, G. (1994). High school restructuring: A national study. Arlington, VA: Educational
Research Service.
Education Trust (2005), Stalled in Secondary: A Look at Student Achievement Since the No
Child Left Behind Act. Education Trust Website. Retrieved February 4, 2005 from
http://www.edtrust.org.html
Finley, J.R. (2000). Modified block scheduling: A case study. Unpublished doctoral
dissertation, University of Missouri, Columbia.
Gordon, W.D. (1997). High school block scheduling and selected student variables.
(Doctoral dissertation, University of Missouri-Columbia, 1997). Dissertation Abstracts
International, 59-07 A, 2267.
Hamdy, M. & Urich, T. (1998). Principals’ perceptions of block scheduling. [Online
version]. American Secondary Education, 26 (3), 8-12.
Hillcrest High School (Springfield, MO). Hillcrest: Historical background. Retrieved April 9,
2005 from http://sps.k12.mo.us/hhs/past.html
Holschen, C. (1999). The impact of the block schedule on high school mathematics
instruction. (Doctoral dissertation, Saint Louis University, 1999). Dissertation Abstracts
International,60-08 A, 2782.

Heger, Brad, 2006, UMSL, p. 94
Hottenstein, D. (1998). An “unobjective” look at “objective” math research involving block
scheduling. NASSP Bulletin, 82 (597), 117-119.
Hottenstein, D. (1999). Block scheduling’s success formula. The School Administrator, 56
(3), 23-26.
Hottenstein, D., & Malatesta, C. (1993). Putting a school in gear with intensive scheduling.
High School Magazine, 1 (2), 28-29.
Howard, E. (1997). Block scheduling and advanced placement mathematics: When tradition
and reform collide. American Secondary Education, 26, 13-16.
Howard, E. (1998). The trouble with block. The American School Board Journal, 185, 35-36.
Jenkins, E., Queen, A., & Algozzine, B. (2002). To block or not to block: That’s not the
question. The Journal of Educational Research, 95 (4), 196-202.
Kramer, S.L. (1997a). What we know about block scheduling and its effects on math
instruction, Part I. NASSP Bulletin, 81 (585), 18-42.
Kramer, S.L. (1997b). What we know about block scheduling and its effects on math
instruction, Part II. NASSP Bulletin, 81 (586), 69-82.
Lawrence, W. & McPherson, D. (2000). A comparative study of block scheduling and
traditional scheduling on academic achievement. [Electronic version]. Journal of
Instructional Psychology, 27 (3), 178-182.
Lindsay, J. (2004). The problem with block scheduling. Retrieved February 4, 2005 from
http://www.JeffLindsay.com/Block5.shtml
Miles, R.B., & Blocher, L.R. (1996). Block scheduling: Implications for music education.
Springfield, IL: Focus on Excellence, Inc.

Heger, Brad, 2006, UMSL, p. 95
National Commission on Excellence in Education. (1983). A nation at risk: The imperative
for educational reform. Washington, DC: U.S. Government Printing Office.
National Commission on Time and Learning. (1994). Prisoners of time. Washington, D.C.:
U.S. Government Printing Office.
North Carolina Department of Public Instruction (1998). Blocked scheduled high school
achievement: Comparison of 1996 and 1997 end-of-course tests for blocked and non-
blocked high schools (research brief). Raleigh, NC: North Carolina Department of Public
Instruction.
North Carolina Department of Public Instruction (2000). Report of student performance on
the North Carolina Competency Standards. Raleigh, NC: North Carolina Public Schools.
Retrieved April 16, 2005 from
http://www.ncpublicschools.org/docs/accountability/testing/competency/reports/98-
99.pdf
Queen, J.A. (2000). Block scheduling revisited. Phi Delta Kappan, 82 (3), 214-222.
Reed, L. D. (1995). Restructuring initiatives in Missouri high (Doctoral dissertation,
University of Missouri-Columbia, 1995). Dissertation Abstracts International, 57-09 A,
3771.
Rettig, M.D. & Canady, R.L. (1999). The effects of block scheduling. The School
Administrator, 56 (3), 23-26.
Schoenstein, R. (1995). Making block scheduling work. The Education Digest, 60 (6), 15-
19.
Shortt, T. & Thayer, Y.V. (1995). What can we expect to see in the next generation of block
scheduling? NASSP Bulletin, 79, 53-62.
Heger, Brad, 2006, UMSL, p. 96
Shortt, T. & Thayer, Y.V. (1997). A vision for block scheduling: Where are we now? Where
are we going? NASSP Bulletin, 81 (595), 1-15.
Simpson, J.B. (1997). High school block-scheduling and selected school variables. (Doctoral
dissertation, University of Missouri-Columbia, 1997). Dissertation Abstracts
International, 59-07 A, 2286.
Spencer, D. (2001). Block scheduling: The influence on African-American students.
(Doctoral dissertation, Saint Louis University, 2001). Dissertation Abstracts
International, 63-05 A, 1697.
Stewart, E. (2002). Block scheduling: The catalyst for change in Missouri public secondary
schools. (Doctoral dissertation, Saint Louis University, 2002). Dissertation Abstracts
International, 63-07 A, 2430.
Stokes, L.C. & Wilson, J.W. (2000). A longitudinal study of teachers’ perceptions of the
effectiveness of block versus traditional scheduling. NASSP Bulletin, 84 (619), 90-95.
Thomas, C. (2001). What is wrong with block scheduling? NASSP Bulletin, 85 (628), 74-77.
Trenta, L., & Newman, I. (2002). Effects of high school block scheduling program on
students: A four-year longitudinal study of the effects of block scheduling on student
outcome variables. American Secondary Education, 31 (1), 54-72.
Virginia Department of Education. (1999). Superintendent’s annual report for Virginia.
Richmond, VA: Author.
Williams, B. (2005, April). Closing the achievement gap: The reform agenda reframed. Paper
presented at a conference sponsored by Cooperating School Districts, St. Louis, MO.
Heger, Brad, 2006, UMSL, p. 97
Wilson, J.W. & Stokes, L.C. (1999). A study of teacher perceptions of the effectiveness and
critical factors in implementing and maintaining block scheduling. The High School
Journal, 83 (1), 44-54.
Wronkovich, M., Hess, C.A., & Robinson, J.E. (1998). Block scheduling: Real reform or
another flawed educational fad? American Secondary Education, 26 (4), 1-6.
Zhang, G. (2001). Academic performance differences between students in block and
traditionally scheduled high schools 1993-2000 (research brief). Raleigh, North Carolina:
North Carolina Department of Public Instruction, Office for Curriculum and School
Reform Services. Paper presented at the annual meeting of the American Educational
Research Association, April, 2001. Retrieved April 30, 2005 from
http://www.ncpublicschools.org/docs/accountability/testing/competency/reports/1993-
2001.

Heger, Brad, 2006, UMSL, p.98
Appendix A
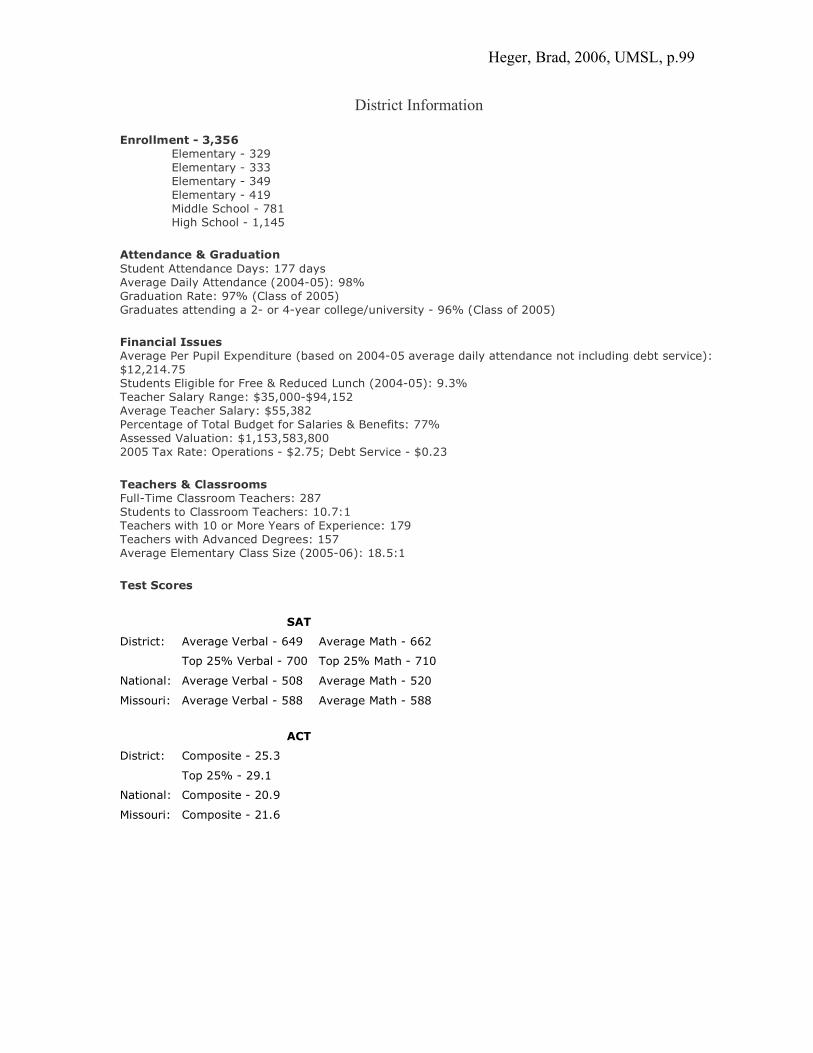
Heger, Brad, 2006, UMSL, p.99
District Information
Enrollment - 3,356 Elementary - 329 Elementary - 333 Elementary - 349 Elementary - 419 Middle School - 781 High School - 1,145
Attendance & Graduation Student Attendance Days: 177 days Average Daily Attendance (2004-05): 98% Graduation Rate: 97% (Class of 2005) Graduates attending a 2- or 4-year college/university - 96% (Class of 2005)
Financial Issues Average Per Pupil Expenditure (based on 2004-05 average daily attendance not including debt service): $12,214.75 Students Eligible for Free & Reduced Lunch (2004-05): 9.3% Teacher Salary Range: $35,000-$94,152 Average Teacher Salary: $55,382 Percentage of Total Budget for Salaries & Benefits: 77% Assessed Valuation: $1,153,583,800 2005 Tax Rate: Operations - $2.75; Debt Service - $0.23
Teachers & Classrooms Full-Time Classroom Teachers: 287 Students to Classroom Teachers: 10.7:1 Teachers with 10 or More Years of Experience: 179 Teachers with Advanced Degrees: 157 Average Elementary Class Size (2005-06): 18.5:1
Test Scores
SAT
District: Average Verbal - 649 Average Math - 662
Top 25% Verbal - 700 Top 25% Math - 710
National: Average Verbal - 508 Average Math - 520
Missouri: Average Verbal - 588 Average Math - 588
ACT
District: Composite - 25.3
Top 25% - 29.1
National: Composite - 20.9
Missouri: Composite - 21.6

Heger, Brad, 2006, UMSL, p.100
An Exceptional District The Schools are comprised all or part of ten self-governed communities in St. Louis County, Missouri, and encompasses approximately 18 square miles with a population of more than 27,000 residents. The student body is a socio-economically diverse group. The 2004-05 graduation rate was 97 percent with 96 percent of the graduating seniors continuing on to college. The district prides itself on its outstanding teachers and staff. The district’s commitment to its teachers is reflected in its unique incentive pay system, now in its 51st year, which rewards outstanding performance. The parents and community residents are highly active in the schools and serve as members of strategic planning initiatives and curriculum committees. The district has a budget of $46.7 million for the 2005-06 fiscal year, deriving 95 percent of its revenue from local sources. The district’s seven school buildings, all of brick construction, average approximately 50 years in age. A $40.9 million bond issue passed by the voters in 2001 has resulted in six of the seven buildings having modern heating, ventilation and air conditioning (HVAC) systems. The bond issue also resulted in major library/media centers, classroom and athletic facility improvements to the buildings.
National and Regional Recognitions The district is considered one of the premier public school districts in the nation. It has received a variety of national and regional recognitions.
• For the past 20 years, approximately 10 percent of the members of each graduating class have been recognized by the National Merit Program as a finalist, semifinalist or commended student.
• A 2003 review of public high schools in Newsweek ranked High School in the top 1.7 percent of all high schools in the nation.
• The district has earned the prestigious “Distinction in Performance” Award from the Department of Elementary and Secondary Education (DESE) following the state’s annual performance review for the fourth time in the four years the award has been given.
• The district has four Blue Ribbon Schools and two Gold Star Schools.

Heger, Brad, 2006, UMSL, p.101
9703 Conway Road • St. Louis, MO 63124 • Phone 314-994-7080 • Fax: 314-994-0441
Student Instructional Resources Renée Schuster, Director
DATE: November 18, 2003 TO: Brad Heger FROM: Renée Schuster RE: Dissertation Your dissertation proposal entitled, A Comparison of Achievement and Attendance Levels of High School Students in a Traditional Six-Period Daily Schedule With Those of Students in a Rotate-Eight Block Schedule is of interest to School District. It will be of assistance in providing data for our program evaluation process. You have permission to use student demographic, MAP, PLAN, and attendance data. You also have permission to survey graduates. We would like to coordinate your survey with the follow-up surveys we are conducting of our graduates this year. My office can assist you in obtaining the coded student data you will need for your study.

Heger, Brad, 2006, UMSL, p.102
Population, Class of 2002 (N = 216)
Above Coded CUM /Below Identifier GPA Median Gender Ethnicity 72153 4.000 Above F Caucasian 111153 4.000 Above F Caucasian 111953 4.000 Above M Caucasian 121853 4.000 Above F Caucasian 11754 4.000 Above F Caucasian 13354 4.000 Above M Caucasian 30854 4.000 Above M Caucasian 61953 4.000 Above F Caucasian 31354 4.000 Above M Caucasian 81553 4.000 Above F Caucasian 102653 4.000 Above F Caucasian 23054 3.983 Above F Caucasian 91753 3.980 Above F Caucasian 50954 3.966 Above F Caucasian 31753 3.964 Above M Caucasian 60654 3.963 Above M Caucasian 10654 3.954 Above M Caucasian 62854 3.900 Above F Caucasian 101353 3.896 Above M Caucasian 82254 3.889 Above M Caucasian 80453 3.875 Above F Caucasian 71153 3.875 Above M Caucasian 21554 3.860 Above M Caucasian 30554 3.860 Above F Caucasian 52354 3.851 Above M Caucasian 51954 3.833 Above F Caucasian 61854 3.816 Above F Caucasian 62754 3.813 Above F Caucasian 62054 3.813 Above M Caucasian 91454 3.808 Above M African-American 12754 3.796 Above M Caucasian 60754 3.788 Above M Caucasian 10454 3.787 Above M Caucasian 22954 3.774 Above F Caucasian 12254 3.760 Above F Caucasian 101253 3.750 Above F Caucasian 31153 3.731 Above M Caucasian 93053 3.714 Above M Caucasian 41053 3.712 Above M Caucasian 102353 3.708 Above F Caucasian 121753 3.689 Above M Caucasian 111753 3.686 Above F Caucasian

Heger, Brad, 2006, UMSL, p.103
122853 3.681 Above F Caucasian 83153 3.654 Above F Caucasian 111053 3.647 Above F Caucasian 100953 3.641 Above F Caucasian 121153 3.638 Above F Caucasian 31754 3.635 Above F Caucasian 71153 3.604 Above M Caucasian 60754 3.604 Above F Caucasian 30354 3.596 Above F Caucasian 52454 3.585 Above M Caucasian 40854 3.577 Above M Caucasian 10854 3.577 Above F African-American 121853 3.559 Above M Caucasian 42054 3.527 Above F African-American 43254 3.519 Above M Caucasian 102753 3.500 Above M Caucasian 42454 3.489 Above F Caucasian 121053 3.489 Above F Caucasian 71254 3.479 Above M African-American 21154 3.469 Above F Caucasian 51054 3.469 Above M Caucasian 83153 3.458 Above F Caucasian 53053 3.456 Above F Caucasian 122553 3.451 Above F Caucasian 62754 3.451 Above F Caucasian 91253 3.442 Above F Caucasian 40654 3.417 Above M Caucasian 32154 3.413 Above F Caucasian 73354 3.360 Above M Caucasian 31754 3.345 Above F African-American 122853 3.339 Above F Caucasian 110954 3.333 Above F African-American 122053 3.319 Above M Caucasian 81754 3.315 Above M Caucasian 21934 3.313 Above M African-American 60853 3.308 Above M Caucasian 80953 3.300 Above M Caucasian 42053 3.286 Above M Caucasian 92953 3.283 Above M Caucasian 52254 3.277 Above F Caucasian 11253 3.267 Above M Caucasian 33254 3.235 Above F Caucasian 71753 3.234 Above M Caucasian 40554 3.216 Above F Caucasian 111353 3.213 Above M Caucasian 32854 3.212 Above F Caucasian 82854 3.212 Above F African-American
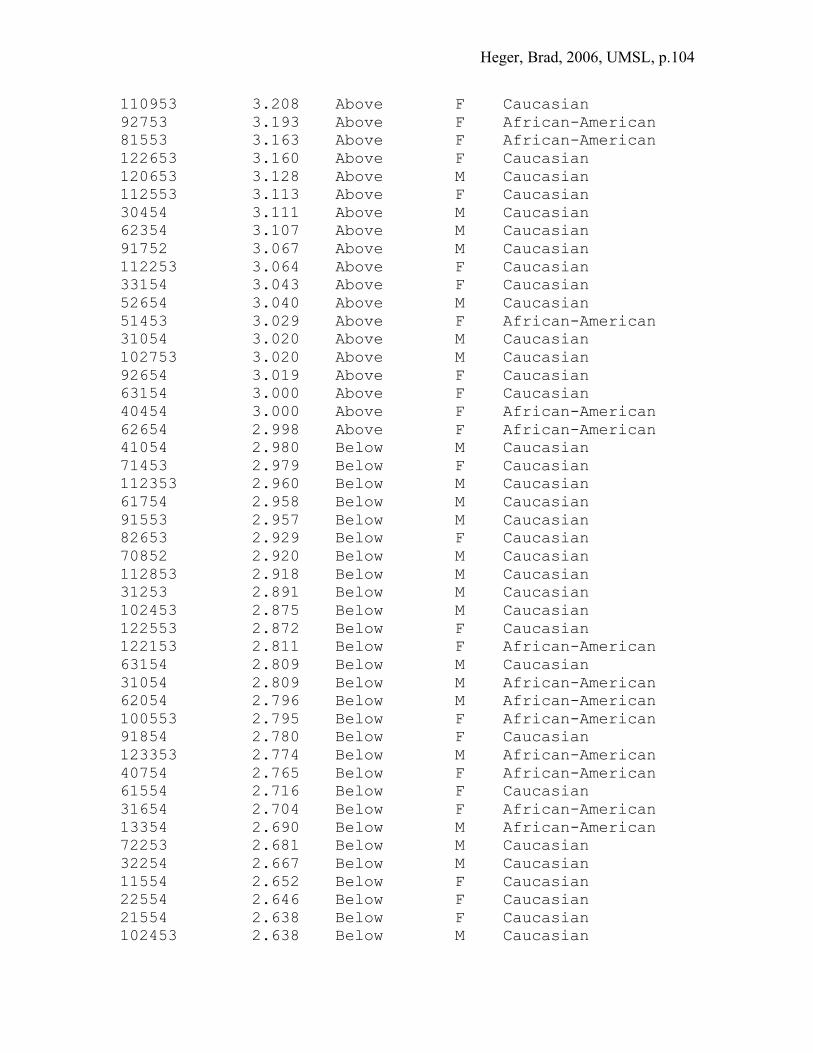
Heger, Brad, 2006, UMSL, p.104
110953 3.208 Above F Caucasian 92753 3.193 Above F African-American 81553 3.163 Above F African-American 122653 3.160 Above F Caucasian 120653 3.128 Above M Caucasian 112553 3.113 Above F Caucasian 30454 3.111 Above M Caucasian 62354 3.107 Above M Caucasian 91752 3.067 Above M Caucasian 112253 3.064 Above F Caucasian 33154 3.043 Above F Caucasian 52654 3.040 Above M Caucasian 51453 3.029 Above F African-American 31054 3.020 Above M Caucasian 102753 3.020 Above M Caucasian 92654 3.019 Above F Caucasian 63154 3.000 Above F Caucasian 40454 3.000 Above F African-American 62654 2.998 Above F African-American 41054 2.980 Below M Caucasian 71453 2.979 Below F Caucasian 112353 2.960 Below M Caucasian 61754 2.958 Below M Caucasian 91553 2.957 Below M Caucasian 82653 2.929 Below F Caucasian 70852 2.920 Below M Caucasian 112853 2.918 Below M Caucasian 31253 2.891 Below M Caucasian 102453 2.875 Below M Caucasian 122553 2.872 Below F Caucasian 122153 2.811 Below F African-American 63154 2.809 Below M Caucasian 31054 2.809 Below M African-American 62054 2.796 Below M African-American 100553 2.795 Below F African-American 91854 2.780 Below F Caucasian 123353 2.774 Below M African-American 40754 2.765 Below F African-American 61554 2.716 Below F Caucasian 31654 2.704 Below F African-American 13354 2.690 Below M African-American 72253 2.681 Below M Caucasian 32254 2.667 Below M Caucasian 11554 2.652 Below F Caucasian 22554 2.646 Below F Caucasian 21554 2.638 Below F Caucasian 102453 2.638 Below M Caucasian

Heger, Brad, 2006, UMSL, p.105
52554 2.600 Below F Caucasian 82854 2.591 Below M African-American 92154 2.583 Below F Caucasian 100553 2.571 Below F African-American 92354 2.557 Below F African-American 30354 2.542 Below M African-American 121753 2.535 Below M African-American 21054 2.500 Below M Caucasian 31154 2.500 Below F Caucasian 52453 2.455 Below M African-American 111953 2.417 Below M Caucasian 31154 2.406 Below F Caucasian 33154 2.404 Below F Caucasian 91353 2.383 Below M African-American 52454 2.367 Below M Caucasian 102353 2.357 Below M Caucasian 92953 2.354 Below F African-American 31254 2.353 Below F African-American 112152 2.341 Below M African-American 111653 2.333 Below F African-American 52154 2.318 Below M African-American 101453 2.308 Below M Caucasian 101953 2.304 Below M Caucasian 42954 2.296 Below M Caucasian 61054 2.281 Below M African-American 22654 2.278 Below M African-American 92853 2.271 Below M Caucasian 61952 2.268 Below F African-American 73054 2.267 Below M African-American 52453 2.261 Below M Caucasian 91654 2.250 Below M Caucasian 123153 2.238 Below M Caucasian 31853 2.222 Below M Caucasian 10854 2.189 Below F African-American 110553 2.152 Below M Caucasian 90353 2.140 Below M African-American 121453 2.130 Below M African-American 92353 2.125 Below M Caucasian 42154 2.120 Below M Caucasian 81154 2.098 Below M African-American 110353 2.066 Below F African-American 31754 2.064 Below M African-American 122653 2.058 Below M African-American 122153 2.039 Below F African-American 42754 2.010 Below M African-American 72854 2.000 Below M Caucasian 72853 1.980 Below F African-American

Heger, Brad, 2006, UMSL, p.106
21153 1.980 Below F African-American 22054 1.917 Below F Caucasian 82854 1.917 Below M Caucasian 112654 1.815 Below F African-American 73053 1.792 Below M Caucasian 122452 1.780 Below M African-American 80954 1.756 Below M Caucasian 91854 1.731 Below M African-American 61953 1.704 Below F African-American 30454 1.694 Below M African-American 82654 1.688 Below M Caucasian 21854 1.654 Below F Caucasian 40854 1.604 Below M African-American 40754 1.596 Below M African-American 71453 1.560 Below M Caucasian 91953 1.521 Below M African-American 43153 1.511 Below F African-American 73053 1.489 Below M Caucasian 22654 1.489 Below M African-American 123352 1.422 Below M Caucasian 12954 1.348 Below F Caucasian 20654 1.333 Below M African-American 42753 1.319 Below F African-American 112452 1.300 Below M African-American 102353 1.286 Below F African-American 10454 1.279 Below F African-American 92054 1.250 Below M African-American 90754 1.250 Below F African-American 52653 1.234 Below F Caucasian 22154 1.146 Below F Caucasian 111453 1.133 Below M Caucasian 110453 1.118 Below F African-American 101453 1.039 Below F African-American

Heger, Brad, 2006, UMSL, p.107
Population, Class of 2004 (N = 241) Above Coded CUM /Below Identifier GPA Median Gender Ethnicity 10536 4.000 Above F Caucasian 92535 4.000 Above F Caucasian 40736 4.000 Above F Caucasian 11536 4.000 Above F Caucasian 43136 4.000 Above M Caucasian 122135 4.000 Above M Caucasian 51636 4.000 Above F Caucasian 103135 4.000 Above F Caucasian 80936 4.000 Above F Caucasian 83435 4.000 Above F Caucasian 80935 4.000 Above F Caucasian 71935 4.000 Above F Caucasian 90836 3.992 Above F Caucasian 42636 3.990 Above M Caucasian 20636 3.989 Above F Caucasian 51636 3.981 Above M Caucasian 22636 3.979 Above F Caucasian 51735 3.979 Above F Caucasian 21236 3.978 Above M African-American 92035 3.976 Above M Caucasian 122835 3.974 Above F Caucasian 51636 3.973 Above M Caucasian 40936 3.966 Above M Caucasian 93335 3.957 Above F Caucasian 111335 3.954 Above F Caucasian 60936 3.948 Above F Caucasian 72635 3.943 Above M Caucasian 120535 3.941 Above M Caucasian 90435 3.939 Above F Caucasian 91735 3.934 Above M Caucasian 62435 3.926 Above M Caucasian 91136 3.904 Above F Caucasian 41036 3.904 Above F Caucasian 71135 3.897 Above M Caucasian 21636 3.893 Above M Caucasian 91535 3.890 Above F Caucasian 111235 3.889 Above F Caucasian 82935 3.867 Above F Caucasian 50436 3.866 Above M Caucasian 122335 3.853 Above F Caucasian 20536 3.852 Above M Caucasian 111035 3.852 Above M Caucasian

Heger, Brad, 2006, UMSL, p.108
92935 3.846 Above F Caucasian 120835 3.844 Above M Caucasian 90835 3.843 Above F Caucasian 62236 3.841 Above M Caucasian 11836 3.830 Above M Caucasian 50636 3.826 Above F Caucasian 82935 3.826 Above F Caucasian 122335 3.822 Above F Caucasian 11736 3.809 Above F Caucasian 50436 3.808 Above M Caucasian 102635 3.807 Above F Caucasian 110736 3.790 Above F African-American 92335 3.786 Above M Caucasian 123135 3.775 Above M Caucasian 11336 3.773 Above F Caucasian 21436 3.767 Above M Caucasian 32037 3.758 Above F Caucasian 80735 3.734 Above M Caucasian 51035 3.729 Above M Caucasian 20836 3.728 Above F Caucasian 70635 3.725 Above F Caucasian 32836 3.725 Above F Caucasian 10936 3.724 Above F Caucasian 42636 3.711 Above M Caucasian 90936 3.709 Above M African-American 121735 3.686 Above F Caucasian 100436 3.684 Above F Caucasian 22336 3.680 Above M Caucasian 80836 3.679 Above F Caucasian 73335 3.675 Above F Caucasian 62136 3.668 Above M Caucasian 60636 3.659 Above F Caucasian 53036 3.655 Above M Caucasian 53136 3.644 Above M Caucasian 10536 3.644 Above F Caucasian 110935 3.643 Above F Caucasian 111035 3.641 Above M Caucasian 42336 3.641 Above M Caucasian 91436 3.639 Above F Caucasian 62135 3.636 Above M Caucasian 61236 3.629 Above F African-American 122835 3.629 Above M Caucasian 13036 3.604 Above F Caucasian 60536 3.604 Above F Caucasian 60835 3.590 Above F Caucasian 122235 3.589 Above M Caucasian 80535 3.559 Above M Caucasian

Heger, Brad, 2006, UMSL, p.109
32136 3.558 Above M Caucasian 91335 3.528 Above F African-American 52035 3.526 Above M Caucasian 60836 3.513 Above F Caucasian 111235 3.503 Above F Caucasian 73336 3.500 Above F Caucasian 101835 3.493 Above M Caucasian 71635 3.484 Above F Caucasian 53135 3.467 Above F Caucasian 61136 3.462 Above F Caucasian 120535 3.452 Above M Caucasian 111635 3.450 Above M Caucasian 52736 3.411 Above M Caucasian 72935 3.411 Above M Caucasian 12336 3.403 Above F Caucasian 51336 3.381 Above F Caucasian 21536 3.367 Above M Caucasian 121935 3.354 Above F Caucasian 82735 3.346 Above F Caucasian 31136 3.322 Above F Caucasian 50536 3.322 Above F Caucasian 33436 3.311 Above F African-American 62835 3.311 Above F Caucasian 61635 3.281 Above F Caucasian 61236 3.272 Above F Caucasian 52036 3.245 Above M African-American 12636 3.244 Above M Caucasian 121735 3.241 Above M Caucasian 22636 3.214 Above F Caucasian 72936 3.204 Above M African-American 71035 3.186 Above F Caucasian 22036 3.180 at median M Caucasian 52436 3.159 Below M African-American 31036 3.158 Below M Caucasian 71235 3.157 Below F Caucasian 122435 3.146 Below F Caucasian 92235 3.143 Below F Caucasian 82836 3.142 Below F African-American 41236 3.107 Below M Caucasian 100535 3.100 Below F African-American 71436 3.100 Below F Caucasian 83435 3.085 Below M African-American 110735 3.068 Below M Caucasian 53336 3.043 Below F African-American 61835 3.016 Below F Caucasian 13336 3.008 Below F Caucasian 93035 3.007 Below M Caucasian

Heger, Brad, 2006, UMSL, p.110
93035 3.000 Below M Caucasian 43036 2.986 Below M Caucasian 81535 2.936 Below M Caucasian 31836 2.929 Below F Caucasian 22036 2.904 Below M Caucasian 102835 2.900 Below M Caucasian 82435 2.890 Below M Caucasian 42436 2.890 Below M Caucasian 71335 2.889 Below M Caucasian 51335 2.878 Below M Caucasian 72536 2.876 Below F Caucasian 21536 2.869 Below F African-American 52135 2.863 Below M Caucasian 92736 2.857 Below F African-American 62136 2.857 Below M Caucasian 13436 2.850 Below F Caucasian 12636 2.846 Below F Caucasian 12136 2.843 Below F African-American 101835 2.841 Below M Caucasian 21436 2.838 Below M Caucasian 101335 2.829 Below M Caucasian 100536 2.808 Below F Caucasian 31736 2.807 Below F Caucasian 20636 2.804 Below F African-American 31736 2.796 Below M Caucasian 32735 2.763 Below F African-American 62335 2.750 Below M African-American 111535 2.742 Below F Caucasian 60536 2.722 Below F African-American 101135 2.721 Below M Caucasian 30936 2.718 Below M Caucasian 40536 2.712 Below M Caucasian 60935 2.681 Below M Caucasian 12436 2.667 Below M Caucasian 50436 2.659 Below F Caucasian 91036 2.658 Below F African-American 110335 2.658 Below M Caucasian 50836 2.657 Below M Caucasian 52135 2.642 Below M Caucasian 102636 2.630 Below F African-American 52235 2.613 Below F African-American 122435 2.607 Below F Caucasian 80435 2.607 Below F Caucasian 61736 2.566 Below F African-American 62635 2.559 Below M African-American 32736 2.552 Below M Caucasian 60836 2.539 Below M Caucasian
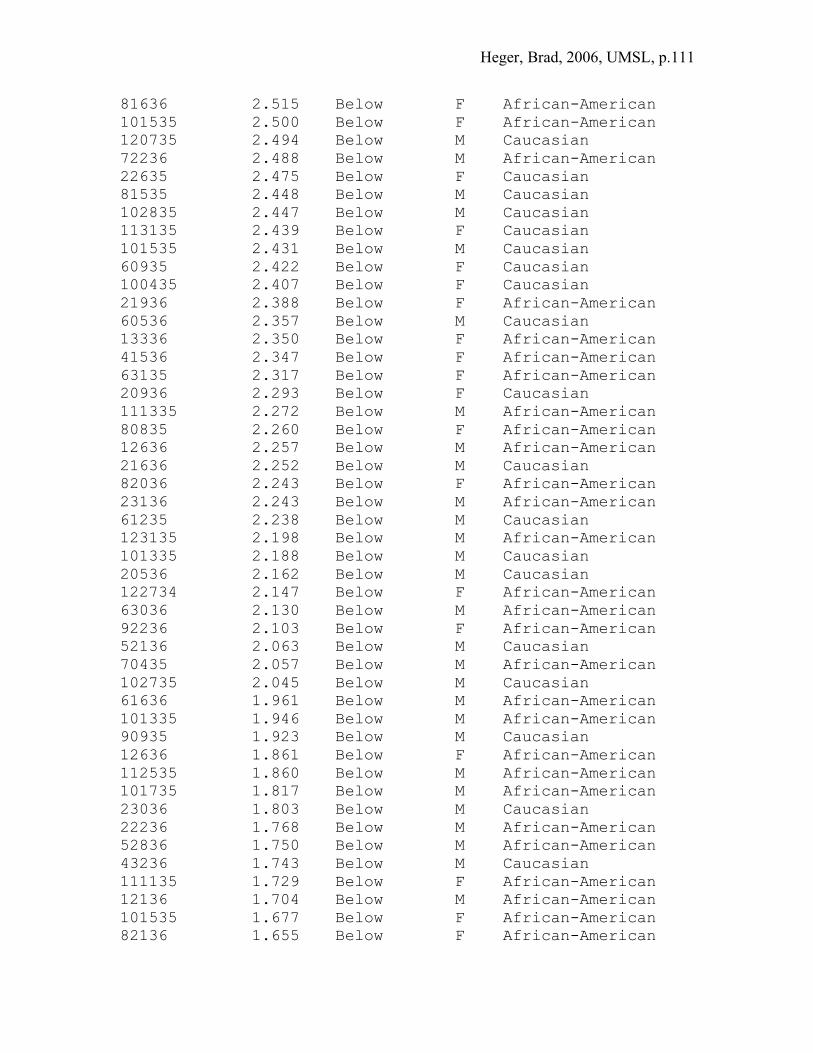
Heger, Brad, 2006, UMSL, p.111
81636 2.515 Below F African-American 101535 2.500 Below F African-American 120735 2.494 Below M Caucasian 72236 2.488 Below M African-American 22635 2.475 Below F Caucasian 81535 2.448 Below M Caucasian 102835 2.447 Below M Caucasian 113135 2.439 Below F Caucasian 101535 2.431 Below M Caucasian 60935 2.422 Below F Caucasian 100435 2.407 Below F Caucasian 21936 2.388 Below F African-American 60536 2.357 Below M Caucasian 13336 2.350 Below F African-American 41536 2.347 Below F African-American 63135 2.317 Below F African-American 20936 2.293 Below F Caucasian 111335 2.272 Below M African-American 80835 2.260 Below F African-American 12636 2.257 Below M African-American 21636 2.252 Below M Caucasian 82036 2.243 Below F African-American 23136 2.243 Below M African-American 61235 2.238 Below M Caucasian 123135 2.198 Below M African-American 101335 2.188 Below M Caucasian 20536 2.162 Below M Caucasian 122734 2.147 Below F African-American 63036 2.130 Below M African-American 92236 2.103 Below F African-American 52136 2.063 Below M Caucasian 70435 2.057 Below M African-American 102735 2.045 Below M Caucasian 61636 1.961 Below M African-American 101335 1.946 Below M African-American 90935 1.923 Below M Caucasian 12636 1.861 Below F African-American 112535 1.860 Below M African-American 101735 1.817 Below M African-American 23036 1.803 Below M Caucasian 22236 1.768 Below M African-American 52836 1.750 Below M African-American 43236 1.743 Below M Caucasian 111135 1.729 Below F African-American 12136 1.704 Below M African-American 101535 1.677 Below F African-American 82136 1.655 Below F African-American

Heger, Brad, 2006, UMSL, p.112
50936 1.587 Below M Caucasian 101435 1.480 Below F African-American 81836 1.452 Below M African-American 12336 1.394 Below M African-American 63136 1.366 Below M African-American 42835 1.284 Below M African-American 42136 1.249 Below M African-American 111135 1.162 Below M African-American 111835 1.128 Below F Caucasian 41736 0.713 Below M African-American 103135 0.515 Below F African-American

Heger, Brad, 2006, UMSL, p.113
Appendix B

Heger, Brad, 2006, UMSL, p.114
Spring 1998 MAP Data -- Disaggregated -- Missouri Totals
Mathematics Grade 8 (H.S. Class of 2002)
Disag Report Step1 Step1 Prog Prog Near Near Prof Prof Adv Adv MEAN MEDIAN LEVEL NOT gregate able # % # % Prof Prof # % # % DETERMINED # % # % Female 30285 7009 23.1 11112 36.7 8640 28.5 3232 10.7 292 1 696 698 1567 4.9 Male 30258 7605 25.1 10308 34.1 8198 27.1 3779 12.5 368 1.2 695.4 697 2422 7.4 No Response 2409 661 27.4 843 35 650 27 233 9.7 22 0.9 691.8 693 383 13.7 American Indian or Alaska Native 503 163 32.4 200 39.8 120 23.9 20 4 0 0 680.8 683 37 6.9 Asian 601 88 14.6 147 24.5 191 31.8 147 24.5 28 4.7 715.8 721 33 5.2 Asian/ Pacific Islander 733 119 16.2 200 27.3 225 30.7 158 21.6 31 4.2 711.8 714 42 5.4 Black(not Hispanic) 8417 4685 55.7 2773 32.9 821 9.8 134 1.6 4 0 661 662 1233 12.8 Hispanic 993 361 36.4 364 36.7 201 20.2 62 6.2 5 0.5 681.6 682 121 10.9 No Response 1559 538 34.5 540 34.6 339 21.7 130 8.3 12 0.8 683.8 686 342 18 Other 1419 405 28.5 554 39 338 23.8 103 7.3 19 1.3 689.6 690 84 5.6 Pacific Islander 132 31 23.5 53 40.2 34 25.8 11 8.3 3 2.3 693.5 692 9 6.4

Heger, Brad, 2006, UMSL, p.115
White(not Hispanic) 49328 9004 18.3 17632 35.7 15444 31.3 6637 13.5 611 1.2 702.2 704 2513 4.8 Gifted 2422 55 2.3 165 6.8 660 27.3 1315 54.3 227 9.4 749.5 753 37 1.5 IAP_student 172 41 23.8 86 50 32 18.6 13 7.6 0 0 688.6 688.5 23 11.8 IEP_student 6412 4287 66.9 1670 26 399 6.2 55 0.9 1 0 648.6 651 1603 20 In Bldg <1 year 3639 1247 34.3 1334 36.7 785 21.6 257 7.1 16 0.4 682.6 684 487 11.8 In Dist <1 year 2825 916 32.4 1105 39.1 613 21.7 179 6.3 12 0.4 683.7 685 298 9.5 LEP Stdnts 345 193 55.9 95 27.5 38 11 18 5.2 1 0.3 659.7 661 96 21.8 Map Free& Reduced 7427 2999 40.4 2812 37.9 1300 17.5 302 4.1 14 0.2 676.2 677 769 9.4 Migrant 88 56 63.6 19 21.6 9 10.2 4 4.5 0 0 659.8 659 17 16.2 Modified Admin 2550 1861 73 563 22.1 114 4.5 12 0.5 0 0 641.4 644 478 15.8 Non Free& Reduced 55525 12276 22.1 19451 35 16188 29.2 6942 12.5 668 1.2 698.2 700 3603 6.1 Non IEP 56540 10988 19.4 20593 36.4 17089 30.2 7189 12.7 681 1.2 700.9 702 2769 4.7 Title I 5458 2410 44.2 1979 36.3 838 15.4 218 4 13 0.2 673.2 673 708 11.5 Total 62952 15275 24.3 22263 35.4 17488 27.8 7244 11.5 682 1.1 695.6 697 4372 6.5

Heger, Brad, 2006, UMSL, p.116
Spring 2000 MAP Data – Disaggregated
Missouri Totals - Mathematics Grade 8 (HS Class of 2004)
Near Near Disaggregate Reportable Adv Adv Prof Prof Prof Prof Prog Prog Step1 Step1 # % # % # % # % # % Female 32,835 334 1.02 3,948 12.02 9,487 28.89 11,514 35.07 7,552 23 Male 34,295 493 1.44 4,667 13.61 9,890 28.84 11,402 33.25 7,843 22.87 No Response 380 7 1.84 39 10.26 94 24.74 126 33.16 114 30 American Indian 470 2 0.43 30 6.38 125 26.6 184 39.15 129 27.45 Asian 671 50 7.45 187 27.87 207 30.85 162 24.14 65 9.69 Pacific Islander 114 5 4.39 23 20.18 34 29.82 38 33.33 14 12.28 Black (not Hispanic) 9,926 4 0.04 199 2.00 1,120 11.28 3,226 32.5 5,377 54.17 Hispanic 1,170 8 0.68 79 6.75 273 23.33 435 37.18 375 32.05 White (not Hispanic) 52,535 746 1.42 7,867 14.97 16,961 32.29 18,058 34.37 8,903 16.95 Other 858 3 0.35 79 9.21 250 29.14 306 35.66 220 25.64 No Response 1,766 16 0.91 190 10.76 501 28.37 633 35.84 426 24.12 IEP 8,741 8 0.09 95 1.09 740 8.47 2,563 29.32 5,335 61.03 IAP (504) 187 0 0 5 2.67 51 27.27 91 48.66 40 21.39

Heger, Brad, 2006, UMSL, p.117
LEP Students 382 3 0.79 23 6.02 52 13.61 119 31.15 185 48.43 Gifted 2,760 330 11.96 1,533 55.54 748 27.1 129 4.67 20 0.72 Modified Admin 3,514 4 0.11 14 0.4 228 6.49 1,005 28.6 2,263 64.4 Migrant 70 0 0 0 0 5 7.14 26 37.14 39 55.71 Title I 8,158 28 0.34 420 5.15 1,441 17.66 2,845 34.87 3,424 41.97 In building < 1 year 4,327 42 0.97 337 7.79 864 19.97 1,513 34.97 1,571 36.31 In district < 1 year 3,376 14 0.41 232 6.87 747 22.13 1,273 37.71 1,110 32.88 Free/Reduced 11,807 23 0.19 479 4.06 2,085 17.66 4,238 35.89 4,982 42.2

Heger, Brad, 2006, UMSL, p.118
Spring 2000 MAP Data – Disaggregated
Missouri Totals - Mathematics Grade 10 (HS Class of 2002)
Near Near Disaggregate Reportable Adv Adv Prof Prof Prof Prof Prog Prog Step1 Step1 # % # % # % # % # % Female 29,613 112 0.38 2,629 8.88 8,787 29.67 10,457 35.31 7,628 25.76 Male 29,767 141 0.47 3,283 11.03 8,841 29.7 9,560 32.12 7,942 26.68 No Response 597 1 0.17 38 6.37 140 23.45 193 32.33 225 37.69 American Indian 365 1 0.27 17 4.66 84 23.01 144 39.45 119 32.6 Asian 684 14 2.05 158 23.1 242 35.38 161 23.54 109 15.94 Pacific Islander 149 3 2.01 8 5.37 47 31.54 57 38.26 34 22.82 Black (not Hispanic) 7,651 2 0.03 86 1.12 823 10.76 2,220 29.02 4,520 59.08 Hispanic 868 3 0.35 52 5.99 185 21.31 291 33.53 337 38.82 White (not Hispanic) 46,741 219 0.47 5,340 11.42 15,380 32.9 16,140 34.53 9,662 20.67 Other 871 5 0.57 51 5.86 228 26.18 322 36.97 265 30.42 No Response 2,648 7 0.26 238 8.99 779 29.42 875 33.04 749 28.29 IEP 5,821 0 0 34 0.58 347 5.96 1,303 22.38 4,137 71.07 IAP (504) 147 1 0.68 6 4.08 37 25.17 56 38.1 47 31.97 LEP Students 284 0 0 11 3.87 46 16.2 96 33.8 131 46.13

Heger, Brad, 2006, UMSL, p.119
Gifted 1,349 38 2.82 591 43.81 527 39.07 137 10.16 56 4.15 Modified Admin 1,723 0 0 5 0.29 80 4.64 349 20.26 1,289 74.81 Migrant 35 0 0 3 8.57 3 8.57 12 34.29 17 48.57 Title I 3,476 6 0.17 124 3.57 649 18.67 1,143 32.88 1,554 44.71 In building < 1 year 2,296 4 0.17 86 3.75 467 20.34 745 32.45 994 43.29 In district < 1 year 2,024 3 0.15 89 4.4 432 21.34 703 34.73 797 39.38 Free/Reduced 6,239 5 0.08 213 3.41 1,046 16.77 2,098 33.63 2,877 46.11
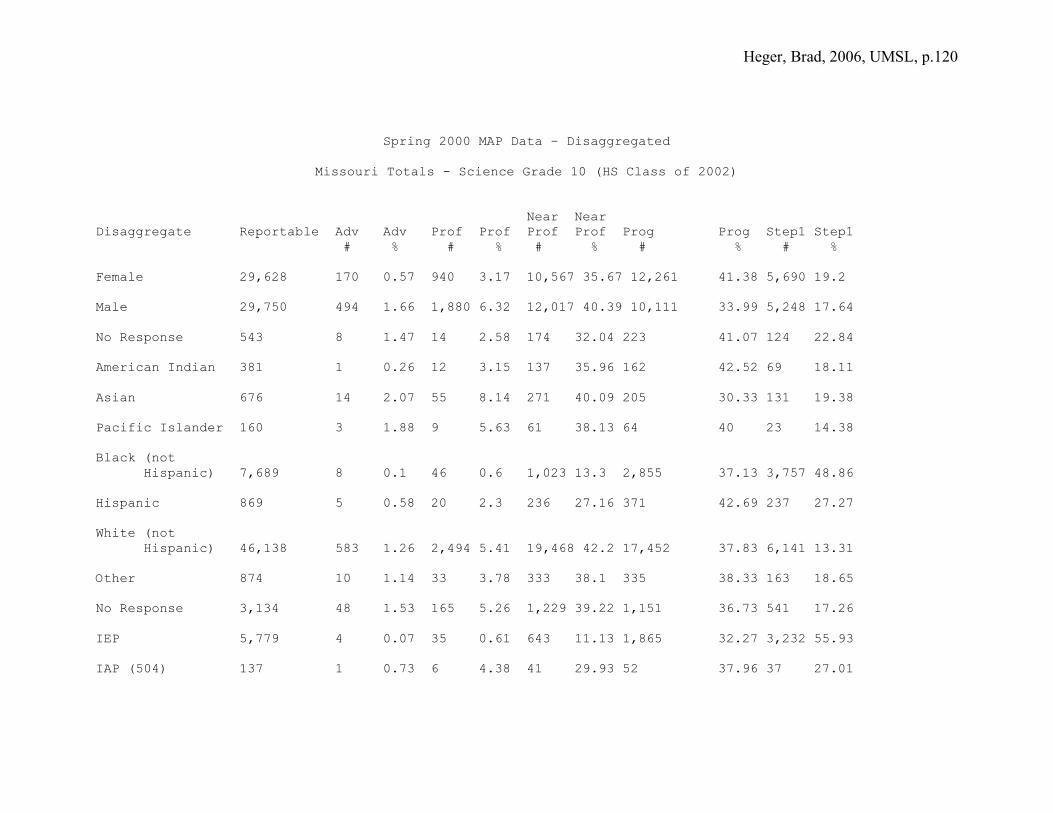
Heger, Brad, 2006, UMSL, p.120
Spring 2000 MAP Data – Disaggregated
Missouri Totals - Science Grade 10 (HS Class of 2002)
Near Near Disaggregate Reportable Adv Adv Prof Prof Prof Prof Prog Prog Step1 Step1 # % # % # % # % # % Female 29,628 170 0.57 940 3.17 10,567 35.67 12,261 41.38 5,690 19.2 Male 29,750 494 1.66 1,880 6.32 12,017 40.39 10,111 33.99 5,248 17.64 No Response 543 8 1.47 14 2.58 174 32.04 223 41.07 124 22.84 American Indian 381 1 0.26 12 3.15 137 35.96 162 42.52 69 18.11 Asian 676 14 2.07 55 8.14 271 40.09 205 30.33 131 19.38 Pacific Islander 160 3 1.88 9 5.63 61 38.13 64 40 23 14.38 Black (not Hispanic) 7,689 8 0.1 46 0.6 1,023 13.3 2,855 37.13 3,757 48.86 Hispanic 869 5 0.58 20 2.3 236 27.16 371 42.69 237 27.27 White (not Hispanic) 46,138 583 1.26 2,494 5.41 19,468 42.2 17,452 37.83 6,141 13.31 Other 874 10 1.14 33 3.78 333 38.1 335 38.33 163 18.65 No Response 3,134 48 1.53 165 5.26 1,229 39.22 1,151 36.73 541 17.26 IEP 5,779 4 0.07 35 0.61 643 11.13 1,865 32.27 3,232 55.93 IAP (504) 137 1 0.73 6 4.38 41 29.93 52 37.96 37 27.01
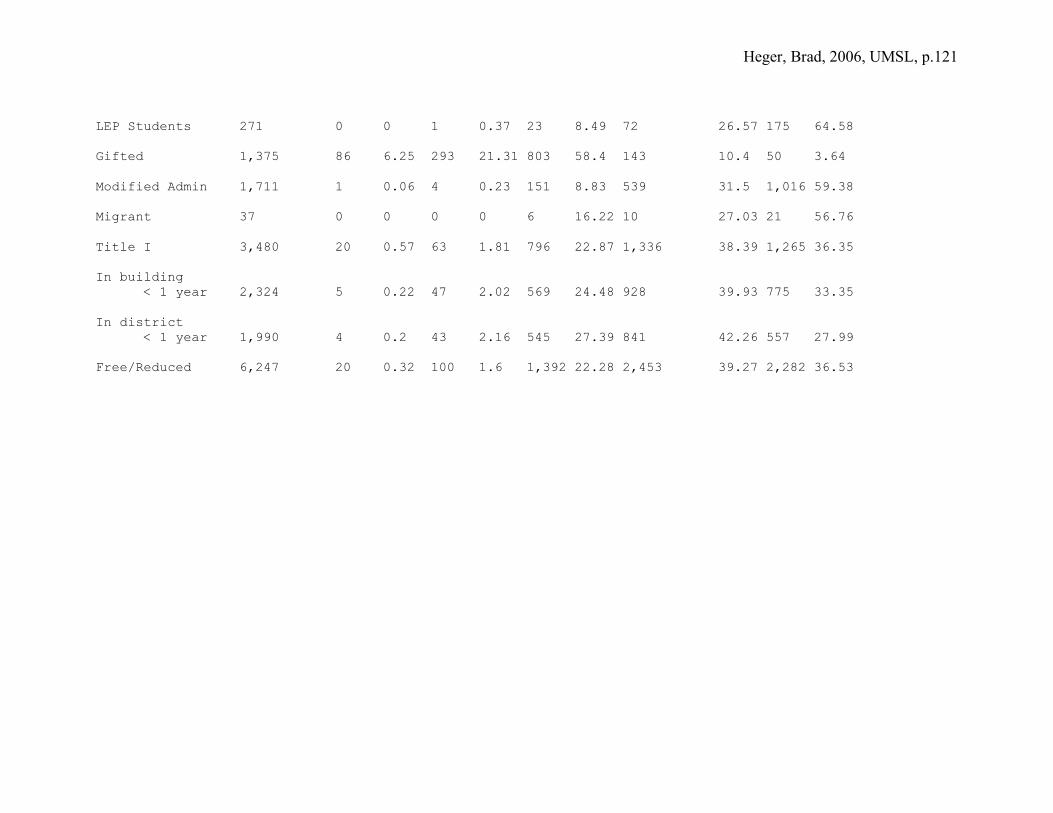
Heger, Brad, 2006, UMSL, p.121
LEP Students 271 0 0 1 0.37 23 8.49 72 26.57 175 64.58 Gifted 1,375 86 6.25 293 21.31 803 58.4 143 10.4 50 3.64 Modified Admin 1,711 1 0.06 4 0.23 151 8.83 539 31.5 1,016 59.38 Migrant 37 0 0 0 0 6 16.22 10 27.03 21 56.76 Title I 3,480 20 0.57 63 1.81 796 22.87 1,336 38.39 1,265 36.35 In building < 1 year 2,324 5 0.22 47 2.02 569 24.48 928 39.93 775 33.35 In district < 1 year 1,990 4 0.2 43 2.16 545 27.39 841 42.26 557 27.99 Free/Reduced 6,247 20 0.32 100 1.6 1,392 22.28 2,453 39.27 2,282 36.53

Heger, Brad, 2006, UMSL, p.122
Spring 2002 MAP Data – Disaggregated
Missouri Totals - Mathematics Grade 10 (HS Class of 2004) Near Near Disaggregate Reportable Adv Adv Prof Prof Prof Prof Prog Prog Step1 Step1 # % # % # % # % # % Female 31,246 188 0.6 2,743 8.8 9,178 29.4 11,183 35.8 7,954 25.5 Male 31,794 323 1.0 3,490 11.0 9,886 31.1 10,359 32.6 7,736 24.3 No Response 715 6 0.8 81 11.3 222 31.0 235 32.9 171 23.9 Amer. Indian or Alaska Native 358 1 0.3 23 6.4 108 30.2 135 37.7 91 25.4 Asian 740 32 4.3 171 23.1 245 33.1 177 23.9 115 15.5 Black(not Hispanic) 8,677 1 0.0 103 1.2 890 10.3 2,548 29.4 5,135 59.2 Hispanic 1,192 4 0.3 66 5.5 271 22.7 411 34.5 440 36.9 No Response 1,421 14 1.0 146 10.3 404 28.4 482 33.9 375 26.4 Other 901 3 0.3 54 6.0 254 28.2 325 36.1 265 29.4 Pacific Islander 145 0 0.0 12 8.3 50 34.5 54 37.2 29 20.0 White(not Hispanic) 50,321 462 0.9 5,739 11.4 17,064 33.9 17,645 35.1 9,411 18.7 Gifted 2,052 163 7.9 967 47.1 762 37.1 138 6.7 22 1.1 High School Vocational 9,146 42 0.5 733 8.0 2,780 30.4 3,369 36.8 2,222 24.3

Heger, Brad, 2006, UMSL, p.123
IAP(504) 226 2 0.9 9 4.0 50 22.1 105 46.5 60 26.5 IEP Students 7,367 2 0.0 60 0.8 586 8.0 1,914 26.0 4,805 65.2 In Building < 1 year 4,527 28 0.6 294 6.5 1,118 24.7 1,549 34.2 1,538 34.0 In District < 1 year 4,273 26 0.6 306 7.2 1,123 26.3 1,523 35.6 1,295 30.3 In District < 18 months 4,024 27 0.7 349 8.7 1,149 28.6 1,394 34.6 1,105 27.5 LEP 2nd/3rd yr 255 1 0.4 6 2.4 25 9.8 69 27.1 154 60.4 LEP Students 447 0 0.0 6 1.3 47 10.5 132 29.5 262 58.6 Map Free&Reduced 9,629 18 0.2 300 3.1 1,755 18.2 3,353 34.8 4,203 43.6 Migrant 64 0 0.0 2 3.1 23 35.9 16 25.0 23 35.9 Non Free&Reduced 54,126 499 0.9 6,014 11.1 17,531 32.4 18,424 34.0 11,658 21.5 Non IEP Students 56,388 515 0.9 6,254 11.1 18,700 33.2 19,863 35.2 11,056 19.6 Title I 5,186 11 0.2 180 3.5 818 15.8 1,597 30.8 2,580 49.7 Vocational Concentrator 1,394 7 0.5 111 8.0 408 29.3 513 36.8 355 25.5

Heger, Brad, 2006, UMSL, p.124
Spring 2002 MAP Data – Disaggregated
Missouri Totals - Science Grade 10 (HS Class of 2004) Near Near Disaggregate Reportable Adv Adv Prof Prof Prof Prof Prog Prog Step1 Step1 # % # % # % # % # % Female 31,056 121 0.4 1,005 3.2 11,292 36.4 12,292 39.6 6,346 20.4 Male 31,571 315 1.0 1,795 5.7 13,116 41.5 10,543 33.4 5,802 18.4 No Response 818 9 1.1 55 6.7 321 39.2 294 35.9 139 17.0 Amer. Indian or Alaska Native 351 2 0.6 13 3.7 142 40.5 130 37.0 64 18.2 Asian 729 21 2.9 73 10.0 295 40.5 210 28.8 130 17.8 Black(not Hispanic) 8,581 4 0.0 45 0.5 1,011 11.8 3,019 35.2 4,502 52.5 Hispanic 1,176 3 0.3 27 2.3 298 25.3 461 39.2 387 32.9 No Response 1,399 10 0.7 59 4.2 526 37.6 516 36.9 288 20.6 Other 952 1 0.1 31 3.3 347 36.4 381 40.0 192 20.2 Pacific Islander 154 0 0.0 15 9.7 68 44.2 53 34.4 18 11.7 White(not Hispanic) 50,103 404 0.8 2,592 5.2 22,042 44.0 18,359 36.6 6,706 13.4 Gifted 2,083 124 6.0 540 25.9 1,238 59.4 155 7.4 26 1.2 High School Vocational 9,035 57 0.6 333 3.7 3,365 37.2 3,585 39.7 1,695 18.8

Heger, Brad, 2006, UMSL, p.125
IAP(504)Students 228 0 0.0 11 4.8 73 32.0 95 41.7 49 21.5 IEP Students 7,269 3 0.0 42 0.6 831 11.4 2,384 32.8 4,009 55.2 In Building < 1 year 4,462 15 0.3 123 2.8 1,472 33.0 1,656 37.1 1,196 26.8 In District < 1 year 4,139 13 0.3 120 2.9 1,443 34.9 1,625 39.3 938 22.7 In District < 18 months 4,033 21 0.5 131 3.2 1,479 36.7 1,548 38.4 854 21.2 LEP 2nd/3rd yr 246 1 0.4 0 0.0 16 6.5 43 17.5 186 75.6 LEP Students 434 0 0.0 2 0.5 28 6.5 93 21.4 311 71.7 Map Free&Reduced 9,651 13 0.1 162 1.7 2,183 22.6 3,730 38.6 3,563 36.9 Migrant 70 0 0.0 2 2.9 15 21.4 20 28.6 33 47.1 Non Free&Reduced 53,794 432 0.8 2,693 5.0 22,546 41.9 19,399 36.1 8,724 16.2 Non IEP Students 56,176 442 0.8 2,813 5.0 23,898 42.5 20,745 36.9 8,278 14.7 Title I 5,308 10 0.2 108 2.0 998 18.8 1,790 33.7 2,402 45.3 Vocational Concentrator 1,348 7 0.5 38 2.8 508 37.7 522 38.7 273 20.3

Heger, Brad, 2006, UMSL, p.126
REB (Class of 2004) Sample (n = 50) Code SPD CUM Above Ethni Gen Gr08 Gr10 Gr10 Gr10 Gr10 # /REB GPA /Below city der MAP MAP MAP Math Sci 9&10 Median Math Math Sci GPA GPA 90686 REB 3.709 Above Afr-Am M 742 765 762 3.250 3.250 4877 REB 3.311 Above Afr-Am F 724 778 717 3.250 3.000 4872 REB 3.204 Above Afr-Am M 736 726 712 2.250 3.000 4240 REB 3.142 Below Afr-Am F 666 720 704 2.250 2.250 4885 REB 2.843 Below Afr-Am F 670 700 656 2.500 2.000 4252 REB 2.763 Below Afr-Am F 666 667 676 1.500 2.250 4187 REB 2.317 Below Afr-Am F 649 635 630 2.000 2.250 4896 REB 2.272 Below Afr-Am M 683 705 708 1.750 2.000 410312 REB 2.257 Below Afr-Am M 725 716 703 3.000 1.500 4229 REB 2.243 Below Afr-Am M 725 734 727 2.250 1.500 4837 REB 2.198 Below Afr-Am M 671 691 707 1.000 1.750 415561 REB 1.961 Below Afr-Am M 671 650 634 0.600 1.250 4247 REB 1.861 Below Afr-Am F 749 758 689 1.250 1.000 4254 REB 1.677 Below Afr-Am F 621 633 659 0.250 0.750 4217 REB 4.000 Above Cauc F 774 819 780 4.000 4.000 4832 REB 4.000 Above Cauc F 786 809 777 4.000 4.000 415651 REB 4.000 Above Cauc F 779 872 766 4.000 4.000 4810 REB 3.989 Above Cauc F 770 795 759 4.000 4.000 4124 REB 3.974 Above Cauc F 815 807 749 4.000 3.750 4864 REB 3.954 Above Cauc F 750 790 751 4.000 3.750 4870 REB 3.948 Above Cauc F 746 764 739 3.750 3.750 4847 REB 3.852 Above Cauc M 772 794 739 3.750 3.500 4231 REB 3.844 Above Cauc M 810 790 766 3.500 3.000 4159 REB 3.841 Above Cauc M 769 790 754 3.250 3.500 492650 REB 3.826 Above Cauc F 753 765 728 3.500 3.000 4207 REB 3.680 Above Cauc M 767 780 758 3.250 3.250 4158 REB 3.668 Above Cauc M 735 780 744 3.250 3.000 4866 REB 3.659 Above Cauc F 735 747 723 2.750 2.500 415960 REB 3.590 Above Cauc F 726 737 722 3.500 2.750 4865 REB 3.526 Above Cauc M 761 769 730 3.250 2.750 4488 REB 3.493 Above Cauc M 743 765 739 3.000 2.750 4212 REB 3.484 Above Cauc F 740 765 730 2.750 2.750 4126 REB 3.452 Above Cauc M 758 762 729 3.250 2.750 4168 REB 3.411 Above Cauc M 743 778 742 3.000 2.500 495312 REB 3.354 Above Cauc F 750 786 729 3.250 2.250 4148 REB 3.272 Above Cauc F 713 694 704 2.750 2.500 4218 REB 3.146 Below Cauc F 699 727 669 3.000 2.500 4814 REB 3.143 Below Cauc F 711 740 694 2.250 2.750 4222 REB 2.900 Below Cauc M 765 815 768 3.500 2.000 4146 REB 2.889 Below Cauc M 742 755 730 2.750 1.750 4151 REB 2.876 Below Cauc F 732 732 708 2.830 2.000 4250 REB 2.841 Below Cauc M 611 653 719 2.500 2.000 4874 REB 2.742 Below Cauc F 682 642 675 2.000 1.500 4197 REB 2.718 Below Cauc M 721 749 732 2.000 1.250 4086 REB 2.712 Below Cauc M 670 695 710 1.250 2.500 4257 REB 2.422 Below Cauc F 717 730 693 2.750 1.250 4121 REB 2.357 Below Cauc M 749 767 746 2.800 1.750 4256 REB 2.045 Below Cauc M 669 685 651 1.750 1.250 4887 REB 1.803 Below Cauc M 676 717 662 1.250 0.750 4188 REB 1.743 Below Cauc M 714 704 677 2.500 0.750
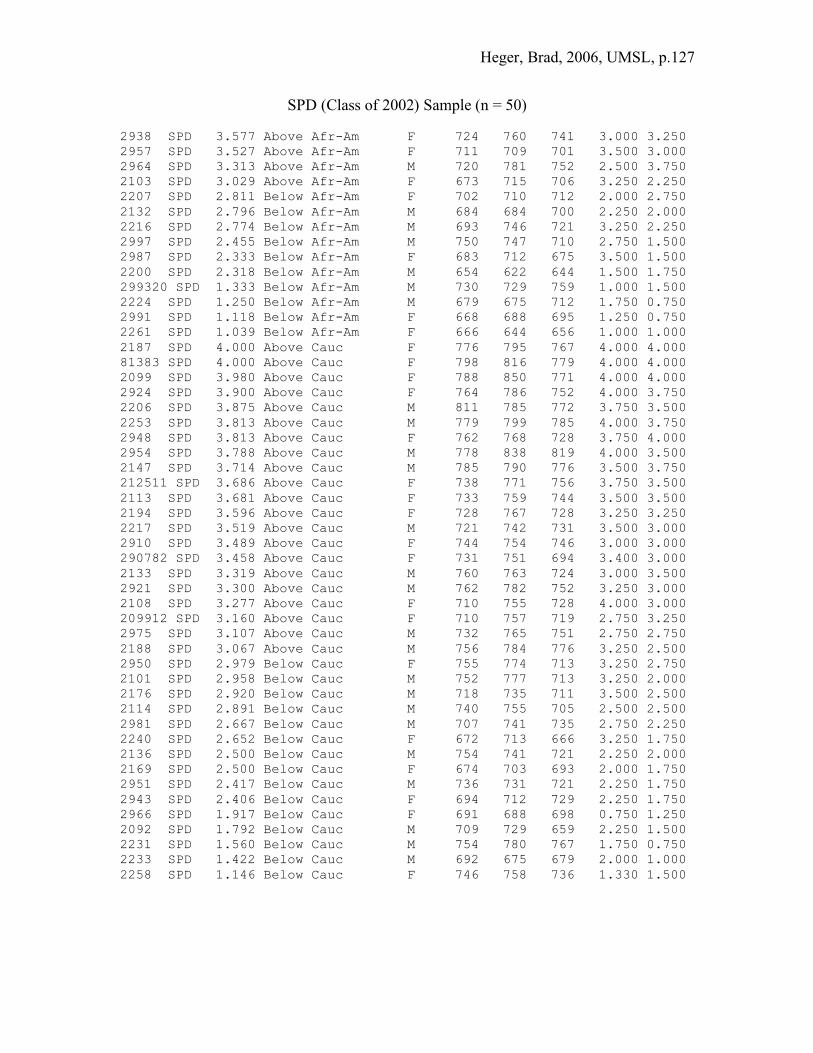
Heger, Brad, 2006, UMSL, p.127
SPD (Class of 2002) Sample (n = 50) 2938 SPD 3.577 Above Afr-Am F 724 760 741 3.000 3.250 2957 SPD 3.527 Above Afr-Am F 711 709 701 3.500 3.000 2964 SPD 3.313 Above Afr-Am M 720 781 752 2.500 3.750 2103 SPD 3.029 Above Afr-Am F 673 715 706 3.250 2.250 2207 SPD 2.811 Below Afr-Am F 702 710 712 2.000 2.750 2132 SPD 2.796 Below Afr-Am M 684 684 700 2.250 2.000 2216 SPD 2.774 Below Afr-Am M 693 746 721 3.250 2.250 2997 SPD 2.455 Below Afr-Am M 750 747 710 2.750 1.500 2987 SPD 2.333 Below Afr-Am F 683 712 675 3.500 1.500 2200 SPD 2.318 Below Afr-Am M 654 622 644 1.500 1.750 299320 SPD 1.333 Below Afr-Am M 730 729 759 1.000 1.500 2224 SPD 1.250 Below Afr-Am M 679 675 712 1.750 0.750 2991 SPD 1.118 Below Afr-Am F 668 688 695 1.250 0.750 2261 SPD 1.039 Below Afr-Am F 666 644 656 1.000 1.000 2187 SPD 4.000 Above Cauc F 776 795 767 4.000 4.000 81383 SPD 4.000 Above Cauc F 798 816 779 4.000 4.000 2099 SPD 3.980 Above Cauc F 788 850 771 4.000 4.000 2924 SPD 3.900 Above Cauc F 764 786 752 4.000 3.750 2206 SPD 3.875 Above Cauc M 811 785 772 3.750 3.500 2253 SPD 3.813 Above Cauc M 779 799 785 4.000 3.750 2948 SPD 3.813 Above Cauc F 762 768 728 3.750 4.000 2954 SPD 3.788 Above Cauc M 778 838 819 4.000 3.500 2147 SPD 3.714 Above Cauc M 785 790 776 3.500 3.750 212511 SPD 3.686 Above Cauc F 738 771 756 3.750 3.500 2113 SPD 3.681 Above Cauc F 733 759 744 3.500 3.500 2194 SPD 3.596 Above Cauc F 728 767 728 3.250 3.250 2217 SPD 3.519 Above Cauc M 721 742 731 3.500 3.000 2910 SPD 3.489 Above Cauc F 744 754 746 3.000 3.000 290782 SPD 3.458 Above Cauc F 731 751 694 3.400 3.000 2133 SPD 3.319 Above Cauc M 760 763 724 3.000 3.500 2921 SPD 3.300 Above Cauc M 762 782 752 3.250 3.000 2108 SPD 3.277 Above Cauc F 710 755 728 4.000 3.000 209912 SPD 3.160 Above Cauc F 710 757 719 2.750 3.250 2975 SPD 3.107 Above Cauc M 732 765 751 2.750 2.750 2188 SPD 3.067 Above Cauc M 756 784 776 3.250 2.500 2950 SPD 2.979 Below Cauc F 755 774 713 3.250 2.750 2101 SPD 2.958 Below Cauc M 752 777 713 3.250 2.000 2176 SPD 2.920 Below Cauc M 718 735 711 3.500 2.500 2114 SPD 2.891 Below Cauc M 740 755 705 2.500 2.500 2981 SPD 2.667 Below Cauc M 707 741 735 2.750 2.250 2240 SPD 2.652 Below Cauc F 672 713 666 3.250 1.750 2136 SPD 2.500 Below Cauc M 754 741 721 2.250 2.000 2169 SPD 2.500 Below Cauc F 674 703 693 2.000 1.750 2951 SPD 2.417 Below Cauc M 736 731 721 2.250 1.750 2943 SPD 2.406 Below Cauc F 694 712 729 2.250 1.750 2966 SPD 1.917 Below Cauc F 691 688 698 0.750 1.250 2092 SPD 1.792 Below Cauc M 709 729 659 2.250 1.500 2231 SPD 1.560 Below Cauc M 754 780 767 1.750 0.750 2233 SPD 1.422 Below Cauc M 692 675 679 2.000 1.000 2258 SPD 1.146 Below Cauc F 746 758 736 1.330 1.500

Heger, Brad, 2006, UMSL, p.128
Appendix C

Heger, Brad, 2006, UMSL, p.129
College Of Education 8001 Natural Bridge Road
St. Louis, Missouri 63121-4499 Telephone: 314-516-4378
E-mail: [email protected]
“Achievement Levels in Schedules” Informed Consent Form
I freely and voluntarily consent to be a participant in this research project. I understand that the purpose of this research is to determine whether there is a statistical difference in the test scores (achievement levels) for students who experienced the rotate-eight block schedule as compared to the six-period daily schedule, and in the students’ current attitudes toward certain aspects of the high school experience in those different kinds of schedules. I understand that I am being invited to participate because as a member of the High School Class of 2002 or 2004 I experienced the six-period daily schedule or the rotate-eight block schedule in high school. Approximately 150 participants may be involved in this research. I understand the risks, discomforts and inconveniences involved are minimal. I understand that I will not be paid for my participation, and that I cannot expect any direct benefit from my participation. I understand my participation involves completing a survey of nine questions and authorizing use of my demographic registration information, my MAP test scores (math and science), and attendance records in analyses. No Public Health Information (PHI) will be used. I understand that all data and information will be safeguarded and locked up in a separate geographic location from identifying codes to prevent access by unauthorized personnel. I understand that only the principal investigator will have access to the raw data and to the code numbers protecting my identity. I also understand that any information obtained will be kept fully confidential and only the principal investigator and his academic advisors will have access to it, and that all identifying information and raw data will be destroyed at the completion of the study by shredding. If any other uses are later contemplated, separate consent will be obtained. I understand that I can refuse to participate or discontinue my participation at any time during the study without penalty. I understand that I may refuse to answer any questions I do not want to answer and still remain in the study. The investigator may withdraw me from this research if circumstances arise which warrant doing so. If I decide to discontinue my participation in this study, I will complete the withdrawal letter found at http://www.umsl.edu/services/ora/IRB.html, or request the investigator send me a copy of the withdrawal letter. I understand that the data will be analyzed in the aggregate without any names, and findings will be reported in the aggregate without any names, so that confidentiality will be protected. No participants will be identified in the study. At the completion of the study, School District will be provided a summary of the findings. If I request a summary, it will be provided. I understand that I am free to ask the principal investigator, his academic advisors, and the chair of the Human Subjects Review Committee questions about the procedure and my rights as a research participant. I know I can contact the principal investigator, Brad Heger, at (314) 983-5406 or at bjheger@ .k12.mo.us. I know I can contact his dissertation study advisor, Dr. Thomas Schnell, at (314) 516-4378. I know I can contact the Chairperson of the Institutional Review Board at (314) 516-5897. My participation in this research is voluntary. The decision whether to participate will not affect current or future relations with the University of Missouri – St. Louis or the School District. If I decide to participate, I am free to withdraw at any time without affecting those relationships. I have read and understood the above information and I have been offered a copy of this form. _______________________________ ____________________ Participant’s Signature Date _______________________________ Participant’s Printed Name I have offered an explanation of the research procedure in which the participant has agreed to participate, and have offered the participant a copy of this form. _______________________________ ____________________ Principal Investigator’s Signature Date _______________________________ Principal Investigator’s Printed Name

Heger, Brad, 2006, UMSL, p.130
Class of 02: Respond to each statement by placing an X in the box that reflects your feelings about the statement regarding the six period day schedule you followed freshman and sophomore years. Class of 04: Respond to each statement by placing an X in the box that reflects your feelings about the statement regarding the rotate eight block schedule you followed. Please do not respond if you are not yet 18 years of age.
Strongly Strongly Statement Agree Agree Neutral Disagree Disagree Teachers generally used a variety of instructional activities within individual class periods. Students in class generally were not on task. Teachers generally used a variety of assessment techniques. Teachers did not emphasize critical thinking skills. Teachers interacted positively with me. I did not look forward to going to school. I received individualized instruction. I did not complete my homework. I learned to plan my time well.
CODE #____________________________________ Brad Heger (733658)

Heger, Brad, 2006, UMSL, p.131
Dear High School alumna/alumnus, I am currently a doctoral candidate in the College of Education at the University of Missouri – St. Louis. I am requesting your assistance in completing a portion of my dissertation study. The study is entitled “A Comparison of Achievement Levels in Mathematics and Science of Secondary Students in a Six-Period Daily Schedule with Those of Students in a Rotate-Eight Block Schedule.” Enclosed is a short survey asking you for your recollection of your experiences at . Please complete the survey and return it (with the consent form) to me sealed in the postage-paid envelope provided. Or, if you prefer, you may return it (with the consent form) to my advisor, Dr. Thomas Schnell, at UMSL / RCEW Suite 11 / 8001 Natural Bridge / St. Louis, MO 63121-4499. Please also complete the consent forms, and return one with the survey. Keep the other copy for your records. With your consent, I will be accessing your registration materials for demographic information, attendance records, and MAP (Missouri Assessment Program) scores in grade 8 and grade 10. As the researcher, only I will have access to the raw data and to the code numbers protecting your identity. The raw data and identifying codes will be kept only until the study is completed, and will then be destroyed by shredding. The data will be analyzed in the aggregate without any names, and findings will be reported in the aggregate without any names, so that confidentiality will be protected. No participants will be identified in the study. At the completion of the study, School District will be provided a summary of the findings. If you request a summary, it will be provided. IF YOU ARE NOT YET 18 YEARS OF AGE, PLEASE DO NOT PARTICIPATE. Please do not hesitate to contact me at (314) 983-5406, or my advisor Dr. Thomas Schnell at (314) 516-4378, if you have any questions regarding this study. Sincerely, Brad J. Heger, A.B., M.Ed. Doctoral Candidate University of Missouri – St. Louis

Heger, Brad, 2006, UMSL, p.132
Appendix D

Heger, Brad, 2006, UMSL, p.133
Survey Respondents
Class of 2004 (n = 33) Class of 2002 (n = 35) CODE SPD GEN CODE SPD GEN # /REB DER ETHNICITY # /REB DER ETHNICITY 4106 REB F Caucasian 2094 SPD F Caucasian 4136 REB F African-American 2099 SPD F Caucasian 4143 REB M Caucasian 2102 SPD M African-American 4144 REB M Caucasian 2107 SPD F Caucasian 4153 REB M Caucasian 2110 SPD M Caucasian 4155 REB F African-American 2111 SPD F African-American 4168 REB M Caucasian 2114 SPD M Caucasian 4176 REB M Caucasian 2143 SPD F Caucasian 4179 REB F Caucasian 2146 SPD M African-American 4181 REB M Caucasian 2152 SPD F African-American 4205 REB M Caucasian 2155 SPD F African-American 4207 REB M Caucasian 2157 SPD F African-American 4211 REB F Caucasian 2162 SPD F Caucasian 4219 REB F Caucasian 2172 SPD F Caucasian 4221 REB F Caucasian 2174 SPD F Caucasian 4224 REB M Caucasian 2193 SPD M Caucasian 4226 REB F African-American 2203 SPD F Caucasian 4231 REB M Caucasian 2204 SPD M Caucasian 4236 REB M Caucasian 2212 SPD M Caucasian 4243 REB F African-American 2215 SPD M Caucasian 4829 REB F Caucasian 2216 SPD M African-American 4832 REB F Caucasian 2223 SPD M Caucasian 4838 REB M Caucasian 2915 SPD M Caucasian 4847 REB M Caucasian 2934 SPD F Caucasian 4850 REB F Caucasian 2940 SPD M African-American 4853 REB M African-American 2943 SPD F Caucasian 4854 REB F Caucasian 2945 SPD M Caucasian 4862 REB F Caucasian 2946 SPD M African-American 4867 REB M Caucasian 2950 SPD F Caucasian 4872 REB M African-American 2953 SPD F Caucasian 4882 REB F Caucasian 2958 SPD F Caucasian 4896 REB M African-American 2978 SPD M Caucasian 4898 REB M Caucasian 2985 SPD M Caucasian 2987 SPD F African-American 2996 SPD M Caucasian

Heger, Brad, 2006, UMSL, p.134
Appendix E

Heger, Brad, 2006, UMSL, p.135
Survey Responses
Tchrs [not] Var [not] Tchrs Clsrm [not] Recd [not] Learn Pers Ovrll CODE TREAT GEN Varied On Asses Crit Inter Activ Look Indiv Cmpl Plan Partic Effec # MENT DER ETHN Activ Task sment Think act Subsc Fwd Instr HW Time Subsc tive 2111 SPD F Af-Am 4 4 3 4 4 19 3 2 4 4 13 32 2152 SPD F Af-Am 3 2 2 2 1 10 2 2 3 4 11 21 2155 SPD F Af-Am 5 4 5 5 4 23 4 3 5 4 16 39 2157 SPD F Af-Am 5 4 4 5 5 23 5 5 4 5 19 42 2987 SPD F Af-Am 5 4 4 3 5 21 5 4 3 5 17 38 2102 SPD M Af-Am 4 3 4 3 3 17 2 2 2 2 8 25 2146 SPD M Af-Am 5 4 3 5 5 22 4 4 5 5 18 40 2216 SPD M Af-Am 5 4 5 4 5 23 2 4 5 4 15 38 2940 SPD M Af-Am 5 4 5 4 5 23 3 5 4 4 16 39 2946 SPD M Af-Am 5 5 5 5 4 24 5 5 5 5 20 44 2094 SPD F Cauc 3 4 4 4 5 20 5 4 5 4 18 38 2099 SPD F Cauc 4 5 4 4 5 22 3 2 5 3 13 35 2107 SPD F Cauc 2 4 4 3 5 18 5 3 5 5 18 36 2143 SPD F Cauc 5 3 3 4 5 20 4 3 5 4 16 36 2162 SPD F Cauc 4 4 2 3 4 17 4 4 5 3 16 33 2172 SPD F Cauc 3 5 4 4 5 21 5 5 5 4 19 40 2174 SPD F Cauc 2 3 4 4 5 18 4 4 2 3 13 31 2203 SPD F Cauc 4 2 3 4 5 18 2 4 5 4 15 33 2934 SPD F Cauc 4 4 3 5 5 21 4 4 5 5 18 39 2943 SPD F Cauc 4 4 3 4 4 19 4 4 4 4 16 35 2950 SPD F Cauc 4 4 2 3 4 17 3 3 2 2 10 27 2953 SPD F Cauc 3 2 4 4 5 18 2 4 1 4 11 29 2958 SPD F Cauc 2 4 3 4 5 18 3 4 5 4 16 34 2110 SPD M Cauc 3 4 3 4 5 19 4 1 5 4 14 33 2114 SPD M Cauc 4 2 4 4 4 18 2 5 4 3 14 32 2193 SPD M Cauc 2 4 2 4 4 16 4 4 4 4 16 32 2204 SPD M Cauc 4 2 3 4 4 17 4 3 4 2 13 30 2212 SPD M Cauc 2 2 2 4 2 12 2 3 2 4 11 23 2215 SPD M Cauc 4 4 3 4 4 19 5 4 4 5 18 37 2223 SPD M Cauc 4 2 4 4 4 18 5 4 2 4 15 33 2915 SPD M Cauc 4 4 4 5 5 22 5 2 5 5 17 39 2945 SPD M Cauc 4 4 2 4 4 18 4 4 4 3 15 33
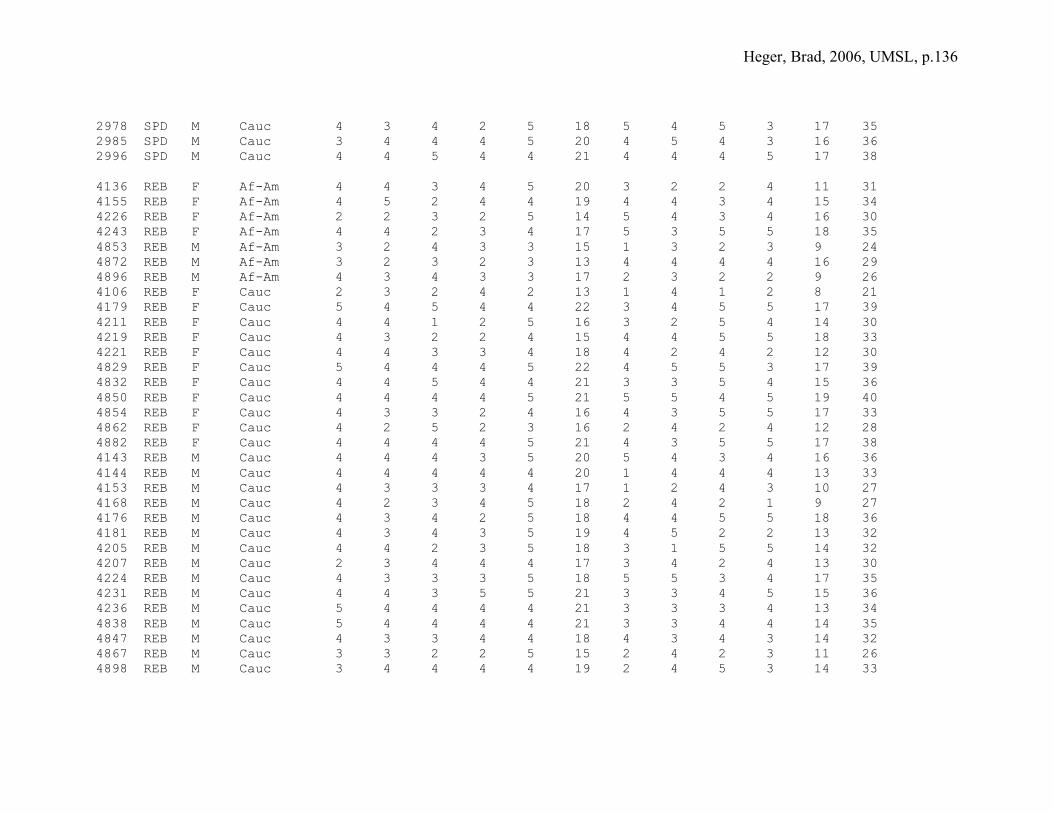
Heger, Brad, 2006, UMSL, p.136
2978 SPD M Cauc 4 3 4 2 5 18 5 4 5 3 17 35 2985 SPD M Cauc 3 4 4 4 5 20 4 5 4 3 16 36 2996 SPD M Cauc 4 4 5 4 4 21 4 4 4 5 17 38 4136 REB F Af-Am 4 4 3 4 5 20 3 2 2 4 11 31 4155 REB F Af-Am 4 5 2 4 4 19 4 4 3 4 15 34 4226 REB F Af-Am 2 2 3 2 5 14 5 4 3 4 16 30 4243 REB F Af-Am 4 4 2 3 4 17 5 3 5 5 18 35 4853 REB M Af-Am 3 2 4 3 3 15 1 3 2 3 9 24 4872 REB M Af-Am 3 2 3 2 3 13 4 4 4 4 16 29 4896 REB M Af-Am 4 3 4 3 3 17 2 3 2 2 9 26 4106 REB F Cauc 2 3 2 4 2 13 1 4 1 2 8 21 4179 REB F Cauc 5 4 5 4 4 22 3 4 5 5 17 39 4211 REB F Cauc 4 4 1 2 5 16 3 2 5 4 14 30 4219 REB F Cauc 4 3 2 2 4 15 4 4 5 5 18 33 4221 REB F Cauc 4 4 3 3 4 18 4 2 4 2 12 30 4829 REB F Cauc 5 4 4 4 5 22 4 5 5 3 17 39 4832 REB F Cauc 4 4 5 4 4 21 3 3 5 4 15 36 4850 REB F Cauc 4 4 4 4 5 21 5 5 4 5 19 40 4854 REB F Cauc 4 3 3 2 4 16 4 3 5 5 17 33 4862 REB F Cauc 4 2 5 2 3 16 2 4 2 4 12 28 4882 REB F Cauc 4 4 4 4 5 21 4 3 5 5 17 38 4143 REB M Cauc 4 4 4 3 5 20 5 4 3 4 16 36 4144 REB M Cauc 4 4 4 4 4 20 1 4 4 4 13 33 4153 REB M Cauc 4 3 3 3 4 17 1 2 4 3 10 27 4168 REB M Cauc 4 2 3 4 5 18 2 4 2 1 9 27 4176 REB M Cauc 4 3 4 2 5 18 4 4 5 5 18 36 4181 REB M Cauc 4 3 4 3 5 19 4 5 2 2 13 32 4205 REB M Cauc 4 4 2 3 5 18 3 1 5 5 14 32 4207 REB M Cauc 2 3 4 4 4 17 3 4 2 4 13 30 4224 REB M Cauc 4 3 3 3 5 18 5 5 3 4 17 35 4231 REB M Cauc 4 4 3 5 5 21 3 3 4 5 15 36 4236 REB M Cauc 5 4 4 4 4 21 3 3 3 4 13 34 4838 REB M Cauc 5 4 4 4 4 21 3 3 4 4 14 35 4847 REB M Cauc 4 3 3 4 4 18 4 3 4 3 14 32 4867 REB M Cauc 3 3 2 2 5 15 2 4 2 3 11 26 4898 REB M Cauc 3 4 4 4 4 19 2 4 5 3 14 33

Heger, Brad, 2006, UMSL, p.137
Appendix F
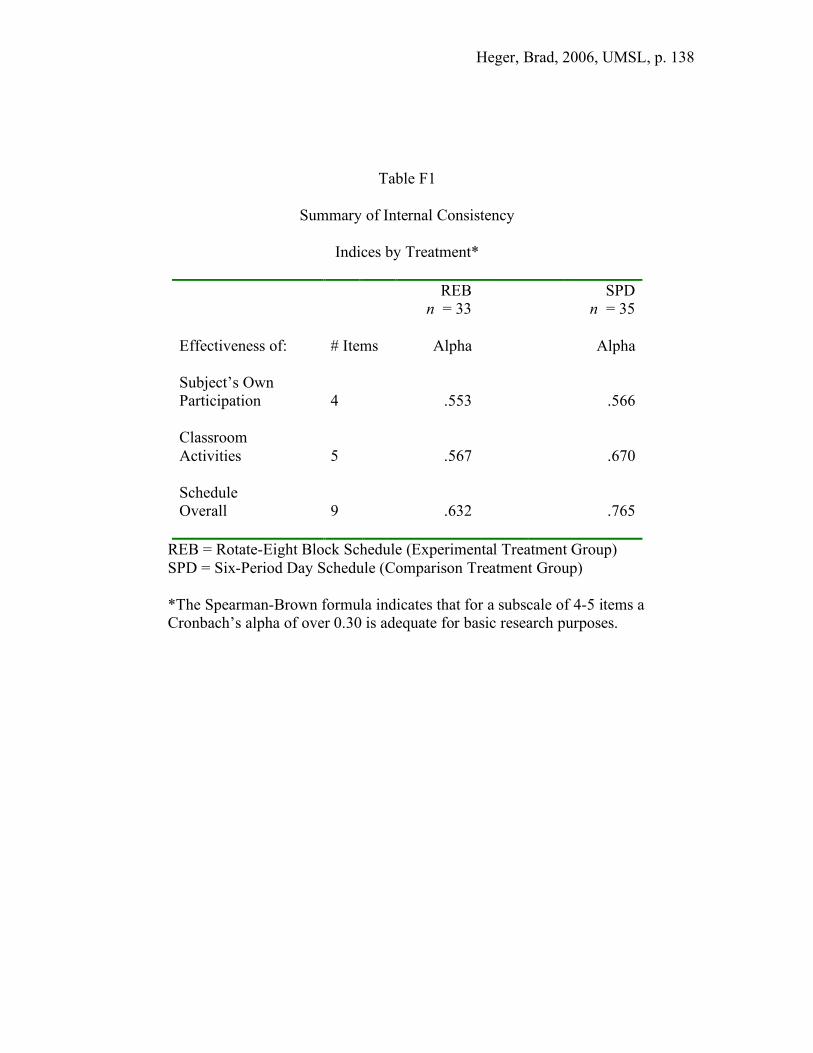
Heger, Brad, 2006, UMSL, p. 138
Table F1
Summary of Internal Consistency
Indices by Treatment*
REB n = 33
SPD n = 35
Effectiveness of: # Items Alpha
Alpha
Subject’s Own Participation
4
.553
.566
Classroom Activities
5
.567
.670
Schedule Overall
9
.632
.765
REB = Rotate-Eight Block Schedule (Experimental Treatment Group) SPD = Six-Period Day Schedule (Comparison Treatment Group) *The Spearman-Brown formula indicates that for a subscale of 4-5 items a Cronbach’s alpha of over 0.30 is adequate for basic research purposes.
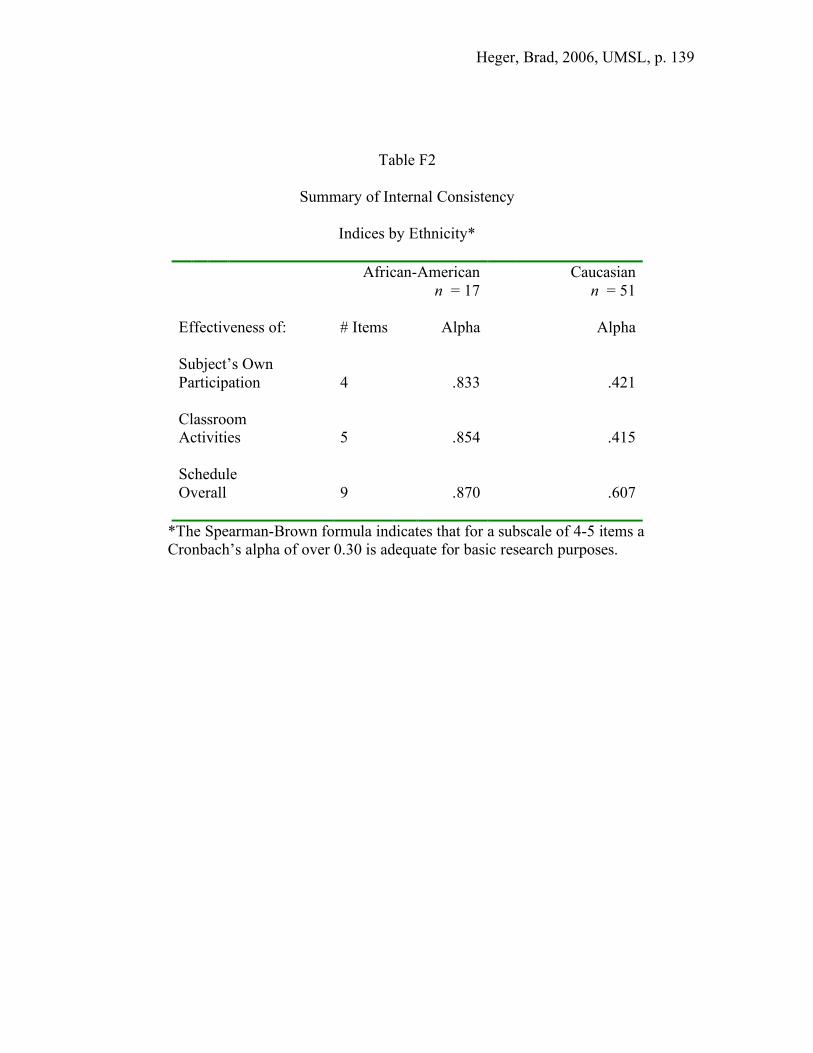
Heger, Brad, 2006, UMSL, p. 139
Table F2
Summary of Internal Consistency
Indices by Ethnicity*
African-American n = 17
Caucasian n = 51
Effectiveness of: # Items Alpha
Alpha
Subject’s Own Participation
4
.833
.421
Classroom Activities
5
.854
.415
Schedule Overall
9
.870
.607
*The Spearman-Brown formula indicates that for a subscale of 4-5 items a Cronbach’s alpha of over 0.30 is adequate for basic research purposes.

Heger, Brad, 2006, UMSL, p. 140
Table F3
Summary of Internal Consistency
Indices by Gender*
Female n = 33
Male n = 35
Effectiveness of: # Items Alpha
Alpha
Subject’s Own Participation
4
.607
.531
Classroom Activities
5
.631
.645
Schedule Overall
9
.730
.717
*The Spearman-Brown formula indicates that for a subscale of 4-5 items a Cronbach’s alpha of over 0.30 is adequate for basic research purposes.

Heger, Brad, 2006, UMSL, p. 141
Table F4
Summary of Internal Consistency Indices by
Ethnicity Subgroups for REB Treatment*
REB N = 33
African-American n = 7
Caucasian n = 26
Effectiveness of: # Items Alpha
Alpha
Subject’s Own Participation
4
.834
.453
Classroom Activities
5
.450
.530
Schedule Overall
9
.461
.640
REB = Rotate-Eight Block Schedule (Experimental Treatment Group) *The Spearman-Brown formula indicates that for a subscale of 4-5 items a Cronbach’s alpha of over 0.30 is adequate for basic research purposes.

Heger, Brad, 2006, UMSL, p. 142
Table F5
Summary of Internal Consistency Indices by
Ethnicity Subgroups for SPD Treatment*
SPD N = 35
African-American n = 10
Caucasian n = 25
Effectiveness of: # Items Alpha
Alpha
Subject’s Own Participation
4
.834
.349
Classroom Activities
5
.909
.339
Schedule Overall
9
.921
.580
SPD = Six-Period Day Schedule (Comparison Treatment Group) *The Spearman-Brown formula indicates that for a subscale of 4-5 items a Cronbach’s alpha of over 0.30 is adequate for basic research purposes.
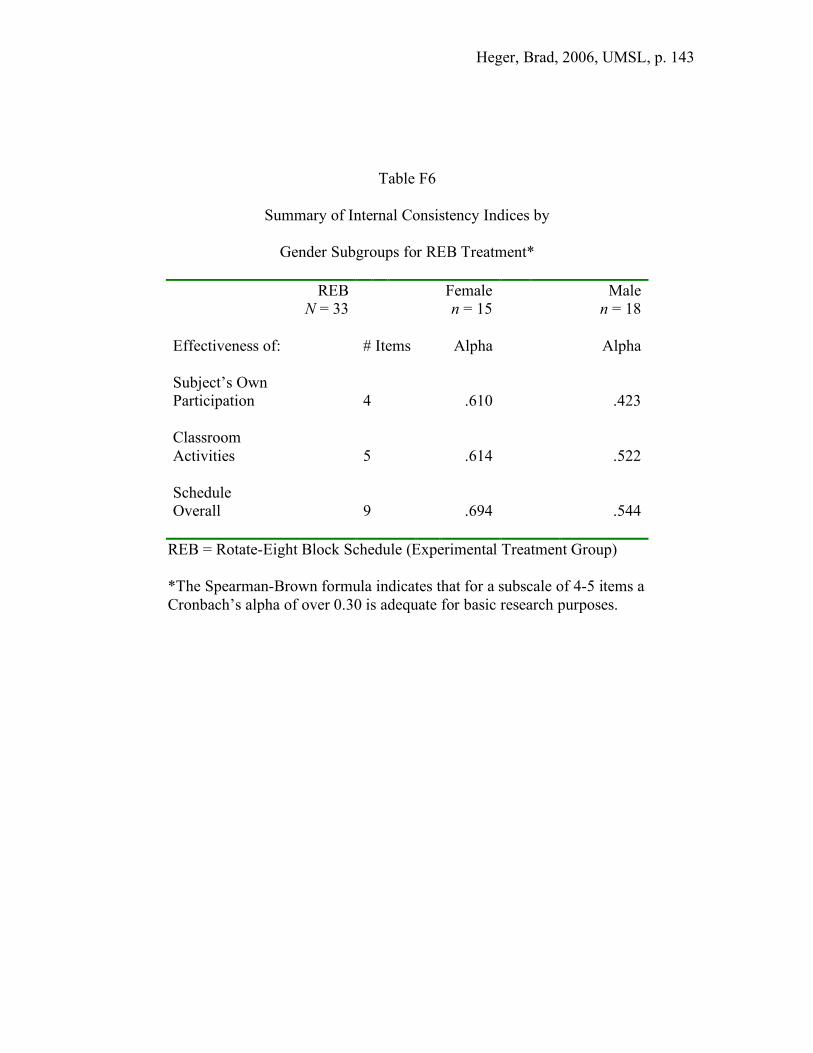
Heger, Brad, 2006, UMSL, p. 143
Table F6
Summary of Internal Consistency Indices by
Gender Subgroups for REB Treatment*
REB N = 33
Female n = 15
Male n = 18
Effectiveness of: # Items Alpha
Alpha
Subject’s Own Participation
4
.610
.423
Classroom Activities
5
.614
.522
Schedule Overall
9
.694
.544
REB = Rotate-Eight Block Schedule (Experimental Treatment Group) *The Spearman-Brown formula indicates that for a subscale of 4-5 items a Cronbach’s alpha of over 0.30 is adequate for basic research purposes.

Heger, Brad, 2006, UMSL, p. 144
Table F7
Summary of Internal Consistency Indices by
Gender Subgroups for SPD Treatment*
SPD N = 35
Female n = 18
Male n = 17
Effectiveness of: # Items Alpha
Alpha
Subject’s Own Participation
4
.606
.528
Classroom Activities
5
.652
.705
Schedule Overall
9
.760
.775
SPD = Six-Period Day Schedule (Comparison Treatment Group) *The Spearman-Brown formula indicates that for a subscale of 4-5 items a Cronbach’s alpha of over 0.30 is adequate for basic research purposes.

Heger, Brad, 2006, UMSL, p. 145
Appendix G

Heger, Brad, 2006, UMSL, p. 146
Grade 10 MAP mathematics gains
Regarding the grade 10 post-treatment MAP mathematics test, an interesting
pattern of gains was discovered, though statistically attributable to chance. The lower
ability REB group improved its mean score by +14.64, and the lower ability SPD group
improved its mean score by +10.64, figures favoring the REB group by +4.00. The
Caucasian lower ability subgroup improved +18.07 in the REB schedule, while the
comparable subgroup improved +14.53 in the SPD schedule: the REB Caucasian lower
ability subgroup gained +3.54 mean points over the SPD Caucasian lower ability
subgroup’s gain. Even though scores for African-American lower ability students
remained significantly below those of Caucasian lower ability students, the REB African-
American lower ability subgroup showed the larger gain over its comparable SPD
subgroup, with +10.28 in the REB schedule, and +4.80 in the SPD schedule, gains
favoring the REB subgroup by +5.48. These differences are summarized in Table G1.
At the other end of the spectrum, the higher ability groups’ and subgroups’ mean
improvements consistently favored the SPD schedule, though again statistically the
differences in the scores were attributable to chance. The higher ability SPD group
improved its mean score by +25.92, and the higher ability REB group improved its mean
score by +21.20. The Caucasian higher ability subgroup improved by +24.34 in the SPD
schedule, while the experimental subgroup improved +21.05 in the REB schedule. The
African-American higher ability subgroup improved its mean score by the largest margin,
+34.25, in the SPD schedule, while that subgroup improved +22.33 in the REB schedule.
While their total scores were still significantly lower in both schedules than those of
Caucasian higher ability students, African-American higher ability students improved
Heger, Brad, 2006, UMSL, p. 147
their mean scores slightly more than did higher ability Caucasian students in the REB
schedule, +1.28, compared to a larger improvement margin of +9.91 in the SPD schedule.
These differences are summarized in Table G2.
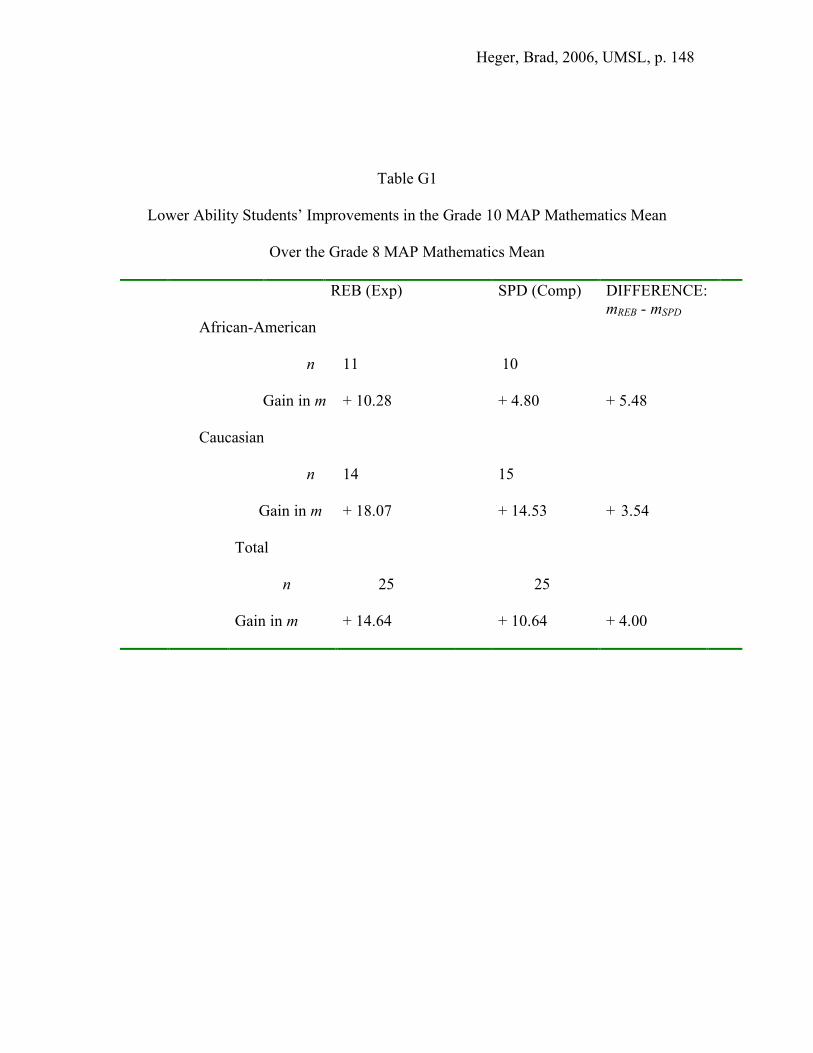
Heger, Brad, 2006, UMSL, p. 148
Table G1
Lower Ability Students’ Improvements in the Grade 10 MAP Mathematics Mean
Over the Grade 8 MAP Mathematics Mean
REB (Exp)
SPD (Comp) DIFFERENCE: mREB - mSPD
African-American
n 11 10
Gain in m + 10.28 + 4.80
+ 5.48
Caucasian
n 14 15
Gain in m + 18.07 + 14.53
+ 3.54
Total
n 25 25
Gain in m + 14.64 + 10.64 + 4.00
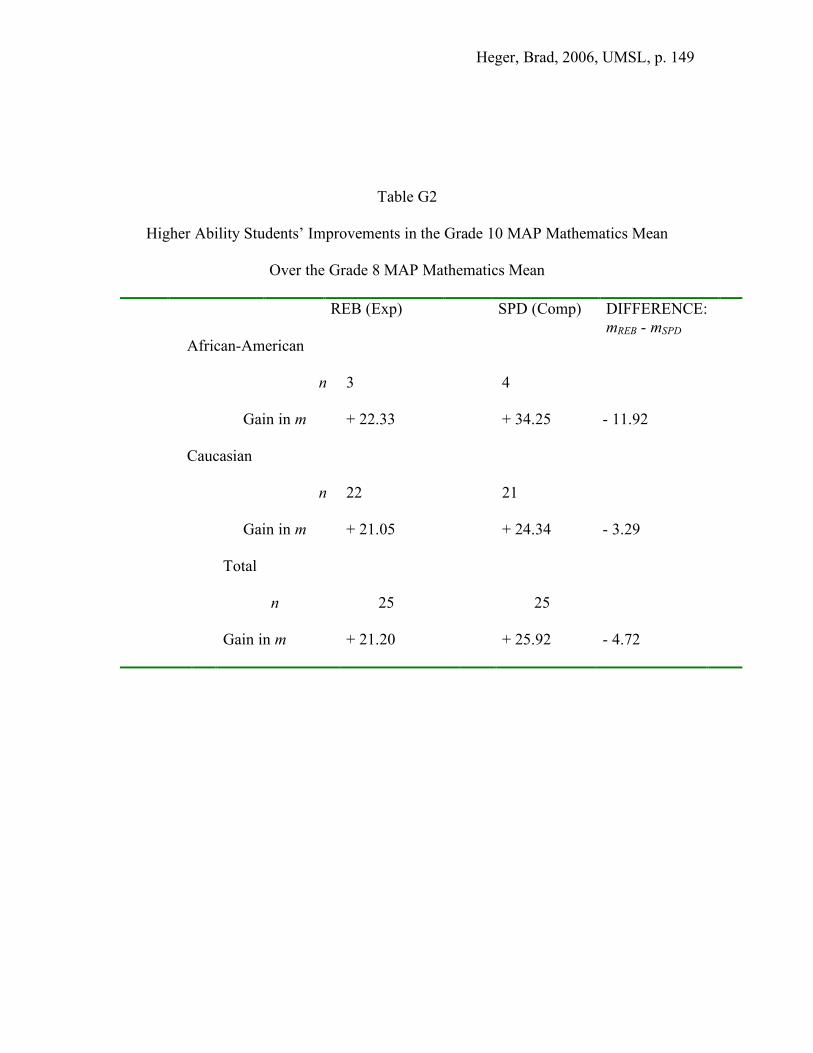
Heger, Brad, 2006, UMSL, p. 149
Table G2
Higher Ability Students’ Improvements in the Grade 10 MAP Mathematics Mean
Over the Grade 8 MAP Mathematics Mean
REB (Exp)
SPD (Comp) DIFFERENCE: mREB - mSPD
African-American
n 3 4
Gain in m + 22.33 + 34.25
- 11.92
Caucasian
n 22 21
Gain in m + 21.05 + 24.34
- 3.29
Total
n 25 25
Gain in m + 21.20 + 25.92
- 4.72


![Submission 5 - Levels of Achievement [V2] - Blues Harmonica](https://img.pdfslide.us/doc/110x75/6170732b17f4c37a1d32ad5b/submission-5-levels-of-achievement-v2-blues-harmonica.jpg)