Embed Size (px)
Citation preview
HAL Id: insu-01521676https://hal-insu.archives-ouvertes.fr/insu-01521676
Submitted on 12 May 2017
HAL is a multi-disciplinary open accessarchive for the deposit and dissemination of sci-entific research documents, whether they are pub-lished or not. The documents may come fromteaching and research institutions in France orabroad, or from public or private research centers.
L’archive ouverte pluridisciplinaire HAL, estdestinée au dépôt et à la diffusion de documentsscientifiques de niveau recherche, publiés ou non,émanant des établissements d’enseignement et derecherche français ou étrangers, des laboratoirespublics ou privés.
A comparative study on the pore-size and filter typeeffect on the molecular composition of soil and stream
dissolved organic matterMarie Denis, Laurent Jeanneau, Anne-Catherine Pierson-Wickmann,Guillaume Humbert, Patrice Petitjean, Anne Jaffrézic, Gérard Gruau
To cite this version:Marie Denis, Laurent Jeanneau, Anne-Catherine Pierson-Wickmann, Guillaume Humbert, PatricePetitjean, et al.. A comparative study on the pore-size and filter type effect on the molecular com-position of soil and stream dissolved organic matter. Organic Geochemistry, Elsevier, 2017, 110,pp.36-44. �10.1016/j.orggeochem.2017.05.002�. �insu-01521676�
Accepted Manuscript
A comparative study on the pore-size and filter type effect on the molecular
composition of soil and stream dissolved organic matter
Marie Denis, Laurent Jeanneau, Anne-Catherine Pierson-Wickman, Guillaume
Humbert, Patrice Petitjean, Anne Jaffrézic, Gérard Gruau
PII: S0146-6380(17)30061-X
DOI: http://dx.doi.org/10.1016/j.orggeochem.2017.05.002
Reference: OG 3546
To appear in: Organic Geochemistry
Received Date: 31 January 2017
Revised Date: 28 April 2017
Accepted Date: 3 May 2017
Please cite this article as: Denis, M., Jeanneau, L., Pierson-Wickman, A-C., Humbert, G., Petitjean, P., Jaffrézic,
A., Gruau, G., A comparative study on the pore-size and filter type effect on the molecular composition of soil and
stream dissolved organic matter, Organic Geochemistry (2017), doi: http://dx.doi.org/10.1016/j.orggeochem.
2017.05.002
This is a PDF file of an unedited manuscript that has been accepted for publication. As a service to our customers
we are providing this early version of the manuscript. The manuscript will undergo copyediting, typesetting, and
review of the resulting proof before it is published in its final form. Please note that during the production process
errors may be discovered which could affect the content, and all legal disclaimers that apply to the journal pertain.
1
A comparative study on the pore-size and filter type effect on the molecular composition of
soil and stream dissolved organic matter
Marie Denis a*
, Laurent Jeanneau a, Anne-Catherine Pierson-Wickman
a, Guillaume Humbert
b,c, Patrice Petitjean
a, Anne Jaffrézic
b,c, Gérard Gruau
a
a OSUR, UMR 6118 Géosciences Rennes, Université de Rennes 1 – CNRS, Rennes, France
b Agrocampus Ouest, UMR 1069, Rennes, France
c INRA, UMR 1069 Sol Agro et hydrosystèmes Spatialisation, Rennes, France
*Corresponding author:
Université de Rennes 1, OSUR, UMR 6118 Géosciences Rennes., Campus de Beaulieu, 263
rue du Général Leclerc, 35042 Rennes Cedex, France.
e-mail: [email protected]
2
1. Introduction
Dissolved organic matter (DOM) is a dynamic and important part of the carbon cycle
and essential for the understanding of soil properties and functioning (Kalbitz et al., 2000).
Due to its properties of complexation, DOM acts as a carrier phase, being involved in the
mobility, degradation and bioavailability of micropollutants at the landscape scale (Neale et
al., 2011). At the catchment scale, the main contributors to the transfer from soils to rivers are
the headwater areas (Ågren et al., 2007), in which DOM comes mainly from riparian wetlands
connected to streams by water tables (Morel et al., 2009). As a consequence, it is necessary to
investigate both stream and soil DOM to understand transfers along the soil-river continuum.
However, despite the fact that DOM has been studied for a long-time, its physical definition
remains unclear.
The term “dissolved” does not refer to its chemical state since DOM is operationally
defined by the filter pore-size used to isolate it from the particulate phase. This may result in
concentration and compositional shifts since different filter pore-size, namely 0.2, 0.45 and
0.7 μm, are used in DOM studies. The filtration at 0.45 μm was initially selected because it
corresponds roughly to the upper limit size of viruses and the lower limit of bacteria. But
However, some prokaryotes can be smaller than 0.45 μm and so filtration at 0.2 μm was
recommended for studies where all microbiota have to be removed from samples (Krieg,
2005). However, a drawback of 0.45 and 0.2 μm filters is that they are made of organic
material such as cellulose acetate, which can induce contamination problems, leading a part of
the DOM research community to use 0.7 μm glass fibre filters. Moreover, the boundaries
between particulate, colloidal and dissolved fractions remain unclear. The international union
of pure and applied chemistry (IUPAC) defines colloids as “molecules or polymolecular
3
particles dispersed in a medium which have at least in one direction a dimension roughly
between 1 nm and 1 µm”. As with the isolation of the dissolved phase, colloids are
operationally defined, and the fraction of colloids in the dissolved fraction depends on the
filter pore-size. Since colloids are complex supramolecular architectures bounded by weak
forces and composed of mineral and metallic phases, natural organic matter, cations and
anions (Gu et al., 1994), their occurrence in the dissolved phase may modify the concentration
and the composition of DOM. Consequently, the possibility to compare results from studies
using different filter pore-sizes is uncertain.
This problem has been explored by Nimptsch et al. (2014) who compared the
influence of filter type and porosity on freshwater DOM composition using spectroscopic
analyses. They observed a small but significant effect on chromophoric DOM composition
between samples filtered with 0.7 μm and 0.2 μm filters and interpreted it as a filter type
effect. However, this difference did not seem to be systematic. On the other hand, Zsolnay
(2003) found no differences in dissolved organic carbon (DOC), UV absorption or
fluorescence emission between samples from hydrosphere, soil extracts and leachates filtered
at 0.4 μm and 0.6 μm. Gandois et al. (2010) also compared concentration and UV
spectroscopic data for throughfall samples filtered at 1.2 μm and 0.2 μm and found no
significant differences.
Sanderman et al. (2008) compared samples filtered at 0.7 μm and 0.45 μm, and found
no differences for DOC concentration, δ13
C and ∆14
C. Therefore, it seems that the filter pore-
size has no effect on DOC concentration, bulk scale descriptors and DOM composition
determined by optical properties. However, to our knowledge, no study has yet investigated
the potential effect of filter pore-size on the analysis of the DOM molecular composition
using THM-GC–MS.

4
In contrast with the above bulk descriptors and DOM optical properties, molecular
tools allow one to target specific compounds, often representing only a very small proportion
of the total DOM and whose removal or non-removal during filtration could profoundly
change the measured molecular composition of DOM. Moreover, because of this low
proportion, some of these molecular compounds could be also more sensitive to filter
contamination than bulk DOM descriptors. As suggested by McDowell (2003), the use of
molecular tool to investigate DOM is increasingly used to develop detailed characterization of
DOM constituents as for investigation of DOM composition at the seasonal and event scales
(Jeanneau et al., 2014, 2015) or in different ecosystems (Frazier et al., 2003). For all these
reasons, it is important to ensure that the potential effect of filter pore-size and filter
composition had essentially no effect on the DOM molecular composition.
Given that filter type and porosity can introduce a bias in molecular DOM
characterization, this may affect the comparability between studies that used different
filtration parameters. Considering this problem, our study investigated two different filtrations
using different filter types (cellulose acetate and glass fiber) and porosity (0.2 µm and 0.7
µm). DOM was quantitatively characterized by the DOC concentration and qualitatively by
spectroscopic and isotopic bulk-scale descriptors (specific UV absorbance at 254 and 280 nm
and δ13
C). The molecular composition was investigated by thermally assisted hydrolysis and
methylation (THM) with tetramethylammonium hydroxide (TMAH) coupled to gas
chromatography (GC) and mass spectrometry (MS).
2. Material and methods
2.1. Sampling and sample preparation

5
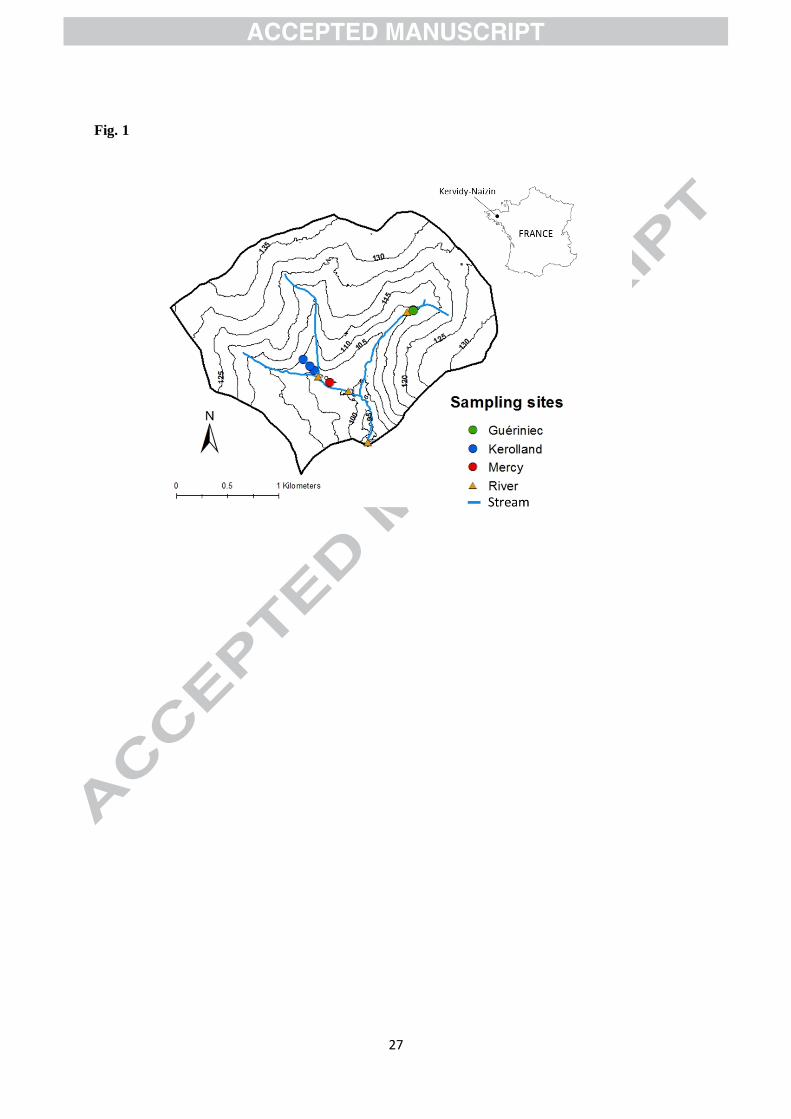
Samples were collected in the Kervidy-Naizin catchment (Fig. 1). This 4.9 km²
lowland catchment is located in central Brittany, western France. It belongs to the French
Environmental Research Observatory (ORE) AgrHyS that is the place of a long-term
monitoring research program aimed at understanding the impact of agricultural intensification
and climate change on hydrologic processes and water quality. This catchment benefits from a
well-known hydrologic and biogeochemical context and has already been the subject of
numerous investigations of the sources and dynamics of both soil and stream DOM (Morel et
al., 2009; Lambert et al., 2011, 2013, 2014; Aubert et al., 2013; Jeanneau et al., 2014, 2015).
The samples were collected during hydrological year 2013/2014 from October to
December 2013 at different locations on the catchment. The dataset is composed of stream
waters and soil solutions to cover the soil-river continuum. Stream waters were sampled
manually at four distinct locations and stored in 1 L glass bottles. Soil solutions were
collected at three distinct locations in the catchment: (i) Kerolland transect; upslope, midslope
and downslope; from 15 to 100 cm depth (ii) Gueriniec transect; upslope and downslope;
from 15 to 50 cm depth (iii) Mercy wetland; from 10 to 55 cm depth (Supplementary Table
S1). A pumping system applied to zero-tension lysimeters and piezometers allowed us to
collect soil solutions which were stored in 1 L glass bottles and transported to the laboratory
in the dark before filtration within 24 h after sampling. Since samples were highly
concentrated in suspended matter, a first filtration was performed using 0.7 µm glass fiber
filters (Sartorius, Germany). Then, an aliquot of the filtrate was further filtered using 0.2 μm
cellulose acetate filter (Sartorius, Germany). Both fractions came from the same sample.
Since 0.2 μm filters are made of cellulose acetate, they were rinsed with 0.5 L of ultrapure
water to prevent any release of carbon. This volume was previously determined to reach
analytical blank values for DOC measurements.
6
Additionally, soil solutions and stream waters were collected once a week during
hydrological year 2013/2014 for a long-time monitoring program. The samples collected from
October to December 2013 have been used to calculate background levels of DOC and UV
measurements in order to identify outliers.
2.2. Analytical methods
Specific UV absorbance at 254 nm, 280 nm and DOC concentration were investigated
on a dataset composed of 42 samples (17 soil solutions and 25 stream waters). The number of
samples used to compare the molecular and isotopic compositions was constrained by the
amount of matter necessary to perform these analyses (1.5 mg of organic carbon) and the
available volume. Molecular and isotopic analyses were performed on 18 samples (4 soil
solutions and 14 stream waters) (Supplementary Table S1).
2.2.1. DOC concentration and UV-visible spectroscopic data
DOC concentrations were determined using a Shimadzu TOC-5050A total carbon
analyser. Ultra-violet absorbance measurements were performed at the two commonly
investigated wavelengths: 254 nm and 280 nm (Weishaar et al., 2003; Scheel et al., 2008; Bu
et al., 2010). These absorbance values (Abs254; Abs280) are used to calculate Specific UV
absorbance (SUVA), which corresponds to the UV absorbance of a water sample at a given
wavelength normalized for DOC concentration, denoted hereafter as SUVA254 or SUVA280
and expressed in L/mgCm. The precision of DOC and SUVA measurements is estimated to
be < ± 5 based on the repeated analyses of sample and standard solutions.
7
2.2.2. Isotopic data
Carbon isotopic analyses (δ13
) were performed at the Stable Isotope Laboratory of the
PEGASE Join Research Unit of the INRA in Saint-Gilles, France, on sample solutions first
acidified with 1 mL/L of 1N HCl to remove dissolved inorganic carbon and then freeze-dried.
Carbon isotopic measurements were determined using an elemental analyser (EA-CE 1500
NA, Carlo Erba) interfaced with an isotope ratio mass spectrometer (VG Isoprime). The δ13
C
values correspond to the relative variation between the measured 13
C/12
C ratio and the 13
C/12
C
ratio of the internal standard Vienna Pee Dee Belemnite (PDB).
2.2.3. Molecular data
For molecular analyses, samples were prepared as follows. Approximately 2 mg of
lyophilisate and 10 mg of tetramethylammonium hydroxide (TMAH) are introduced in a
reactor and placed in a vertical microfurnace pyrolyser PZ-2020D (Frontier Laboratories). To
allow TMAH reaction, pyrolysis was made at 400 °C for 1 min. Gases produced were injected
directly into a GC-2010 (Shimadzu, Japan) equipped with an SLB 5MS capillarity column (60
m, 0.25 mm i.d., 0.25 μm film thickness) with a split mode (set between 10 and 15). The
temperature of the transfer line was 321 °C, and the temperature of the injection port was 310
°C. The oven temperature started at 50 °C (held during 2 min) and rose to 150 °C at 15
°C/min, then from 150 °C to 310 °C (held for 14 min) at 3 °C/min. Helium was used as carrier
gas with a flow rate of 1.0 mL/min. After separation by GC, compounds were detected by a
mass spectrometer QP2010+MS (Shimadzu, Japan) operating in the full-scan mode from m/z
50 to m/z 600. The transfer line was set at 280 °C and molecules were ionized by electron
impact using an energy of 70 eV, and an ionization source temperature set at 200 °C.
8
Molecules were identified by comparison of their full-scan mass spectra with the National
Institute of Sciences and Technology (NIST) library and published papers (Nierop and
Verstraten, 2004; Grasset et al., 2009).
The target molecular compounds in this study were lignin markers (LIG), fatty acids
(FA) and carbohydrates markers (CAR). Qualitative measurements were performed using the
appropriate m/z for each compound and by integrating and correcting peak area by a mass
spectra factor (MSF) (Supplementary Table S2) which correspond to the reciprocal of the
proportion of the fragment used for integration and the entire fragmentogram of the NIST
library. Using THM-GC-MS implies that it is necessary to assume that ionization efficiency is
independent from matrix effects for all analysed compounds.
Three samples were analysed in triplicate to quantify the reproducibility of the
analysis. The mean relative standard deviation express in percentage (%RSD) based on these
three analyses were calculated for each molecular parameter. The global uncertainty is ± 20%
and corresponds to the mean of the %RSD obtained for each molecular parameter.
Semi-quantitative analyses were performed by adding 10 μL of a solution of
hydrocinnamic acid d9 (Sigma-Aldrich) in methanol (25 μg/mL). This molecule was used as
an internal standard for LIG thank to its similar chemical structure. Using MSF corrected
areas of internal standard and assuming similar analytical efficiency for all target compounds,
an approximation of the concentrations of the analysed markers was proposed. Since the
chemical structure of CAR and FA are different from the internal standard, their
concentrations must be considered as rough estimations.
2.3. Data treatment and statistical analyses

9
In this study, parameters usually used in molecular analyses were investigated to test if
different pore-sizes and filter types can result in shifts in the molecular fingerprints of soil and
stream DOM. Lignin markers (LIG) are classified in three main groups: vanillic (V) units
(vanillic acid, vanillaldehyde and acetovanillone), syringic (S) units (syringic acid,
syringaldehyde and acetosyringeone) and coumaric (C) units (coumaric acid and ferulic acid).
Their relative proportions were investigated using the ratio of coumaric to vanillic units
(C/V), and of syringic to vanillic units (S/V) which can be used to determine plant sources
(Hedges and Mann, 1979) or lignin degradation state (Kögel, 1986). Among the fatty acids
(FA) detected with THM-GC–MS, some are from microbial inputs (C13:0; C14:0; iso and
anteiso C15:0; C15:0 ; brC16:0; C16:1; iso and anteiso C17:0; C18:1). FA with more than 19 C atoms
are mainly plant-derived (Matsuda and Koyama, 1977; Frostegard et al., 1993), while C16:0
and C18:0 can derived from both microbial and plant origins (Jeanneau et al., 2014). Using this
procedure, the percentage of microbial fatty acids (%FAmic) was estimated (Jeanneau et al.,
2015) and can be used as an indicator of microbial activity. Three pairs of permethylated
deoxy aldonic acids were produced during the THM of polysaccharides and free
monosaccharides (Fabbri and Helleur, 1999), and those CAR were classified into three main
classes: pentose (C5), hexose (C6) and deoxyhexoses (deoxyC6). For the samples analysed in
this study, deoxyhexoses could not be analysed due to contamination of samples by the
bactericide used during the industrial process for manufacturing aluminium trays used for the
freeze-drying step. The CAR distribution was investigated using the C6/C5 ratio which is
used as an indicator for microbial or plant origin (Rumpel and Dignac, 2006). Relative
percentages of each molecular classes (%LIG; %FA; %CAR) were measured by dividing the
sum of the MSF-corrected peak area of the compounds in this class by the sum of peak area of
all the classes.
10
Potential outliers were identified using the box plot representation performed using
XLSTAT 2013 (Addinsoft). Samples were considered as potential outliers if they are out of
the interval defied by [Q1-2*(Q3-Q1); Q3+2*(Q3-Q1)] where Q1 is the value of the first
quartile and Q3 is the value of the third quartile. If potential outliers were detected, values
obtained for < 0.2 µm and < 0.7 µm fractions were compared to the weekly sampling dataset
when this extended dataset could be used. When comparison to the weekly dataset allowed us
to confirm the presence of an outlier, this sample was removed to perform the next statistical
analysis.
Statistical analyses were performed using the software R 2.15.3 (R Core Team). Given
that paired differences followed normal distributions (significant level at 0.05), the difference
between the two filtration modes was tested by performing a paired t-test with a confident
level of 95%. Firstly, differences between values measured on samples filtered at 0.2 and 0.7
µm were determined. Then, if the 95% confident interval defined around the mean of the
differences contain 0, the two datasets were not considered as statistically different. This is
quantified by the p-value which indicates no significant differences between the two filtration
modes if > 0.05.
3. Results
3.1. Bulk DOM descriptors (DOC, SUVA, δ13
C)
Among the 42 analyzed samples (17 soil solutions and 25 stream waters), the
concentrations of DOC ranged from 2.2 to 44.4 and 1.6 to 15.7 mg/L in soil solutions and
stream waters respectively (Table 1). The mean of the differences was –0.39 mg/L (Fig. 2A).
Four samples (number 3, 4, 12 and 13, Supplementary Table S1) were identified as potential

11
outliers by the box plot representation. By comparison with the weekly sampling dataset from
October to December 2013, only sample 12 is confirmed to be an outlier as the concentration
of the < 0.7 µm fraction (13.4 mg/L) was greatly higher than the concentration usually
observed (2.1 to 4.2 mg/L), probably due to analytical bias. Consequently, this sample was
removed from the dataset for the next statistical analysis. The p-value of the paired t-test was
> 0.05 (Table 1) indicating no significant differences between the two filter types.
In the present study, SUVA254 ranged from 1.7 to 5.2 L/mgCm and 2.4 to 5.0 L/mgCm
for soil solutions and stream waters, respectively (Table 1). The mean of the differences was
0.07 L/mgCm (Fig. 2B). SUVA280 ranged from 1.3 to 4.3 L/mgCm and 1.8 to 4.1 L/mgCm
for soil solutions and stream waters, respectively (Table 1). The mean of the differences was
0.05 L/mgCm (Fig. 2C). One sample (number 30, Supplementary Table S1) for SUVA254 and
two samples (numbers 30 and 39, Supplementary Table S1) for SUVA280 were identified as
potential outliers by the box plot representation. By comparison with the weekly sampling
dataset from October to December 2013, sample number 30 for SUVA254 and both sample
numbers 30 and 39 for SUVA280 were confirmed to be outliers as values measured for the <
0.7 µm fractions were higher than the values usually measured, probably due to analytical
bias. Consequently, these samples were removed from the dataset for the next statistical
analysis. The p-values of the paired t-tests performed for SUVA254 and SUVA280 were > 0.05
(Table 1) indicating no significant differences between the two filter types.
Values of carbon isotopic data (δ13
C) ranged from –29.2 to –26.7‰ (Table 1). The
mean of the differences was 0.04‰ (Fig. 2D). No outliers were identified in the dataset. The
p-value of the paired t-test (Table 1) indicates no significant differences between the two filter
types.
3.2. Molecular data
12
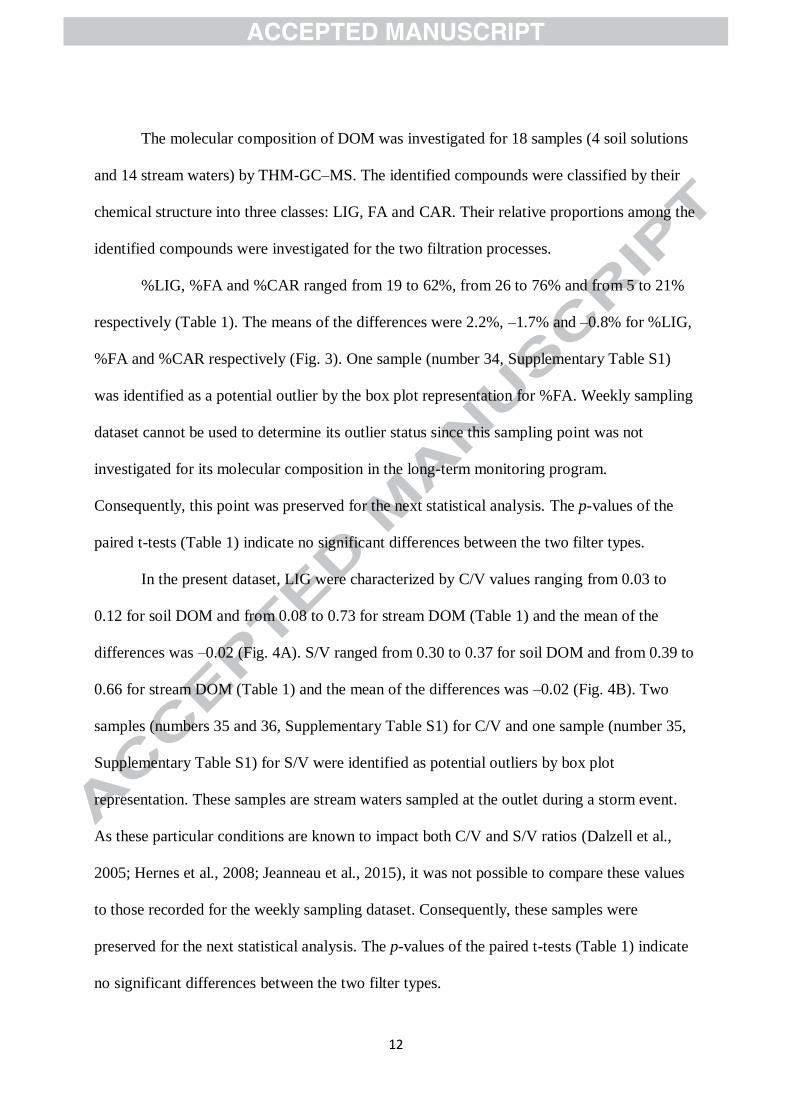
The molecular composition of DOM was investigated for 18 samples (4 soil solutions
and 14 stream waters) by THM-GC–MS. The identified compounds were classified by their
chemical structure into three classes: LIG, FA and CAR. Their relative proportions among the
identified compounds were investigated for the two filtration processes.
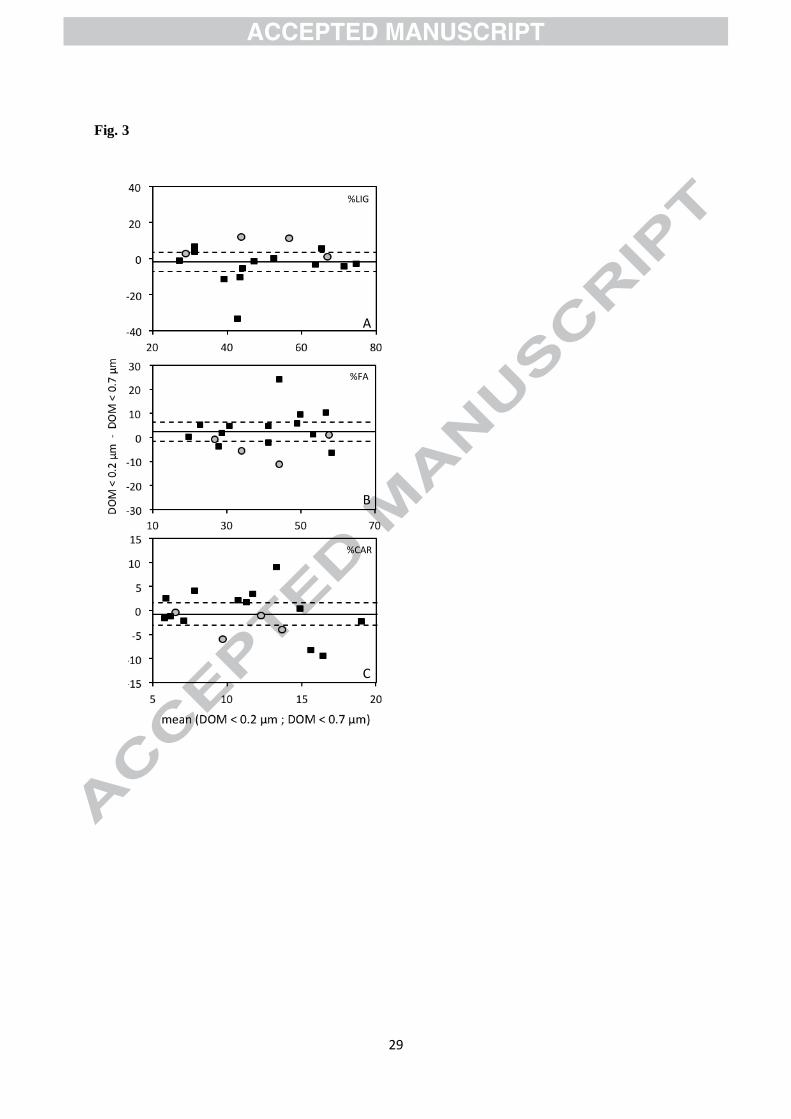
%LIG, %FA and %CAR ranged from 19 to 62%, from 26 to 76% and from 5 to 21%
respectively (Table 1). The means of the differences were 2.2%, –1.7% and –0.8% for %LIG,
%FA and %CAR respectively (Fig. 3). One sample (number 34, Supplementary Table S1)
was identified as a potential outlier by the box plot representation for %FA. Weekly sampling
dataset cannot be used to determine its outlier status since this sampling point was not
investigated for its molecular composition in the long-term monitoring program.
Consequently, this point was preserved for the next statistical analysis. The p-values of the
paired t-tests (Table 1) indicate no significant differences between the two filter types.
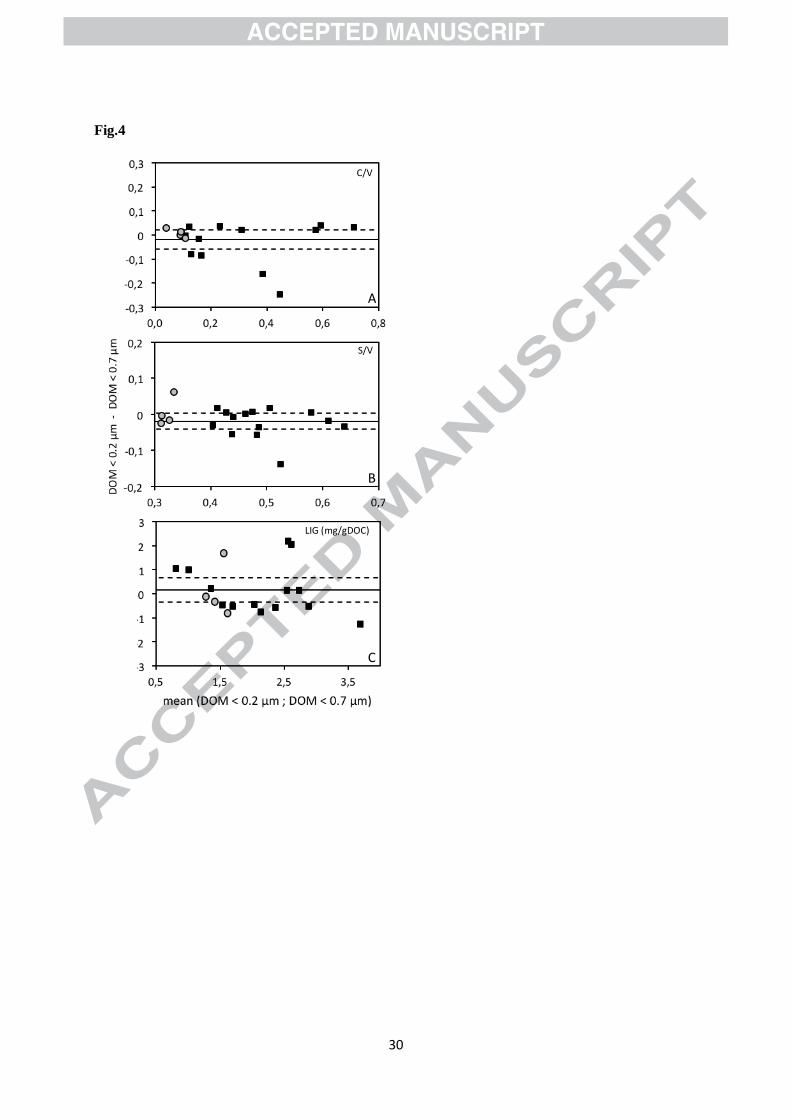
In the present dataset, LIG were characterized by C/V values ranging from 0.03 to
0.12 for soil DOM and from 0.08 to 0.73 for stream DOM (Table 1) and the mean of the
differences was –0.02 (Fig. 4A). S/V ranged from 0.30 to 0.37 for soil DOM and from 0.39 to
0.66 for stream DOM (Table 1) and the mean of the differences was –0.02 (Fig. 4B). Two
samples (numbers 35 and 36, Supplementary Table S1) for C/V and one sample (number 35,
Supplementary Table S1) for S/V were identified as potential outliers by box plot
representation. These samples are stream waters sampled at the outlet during a storm event.
As these particular conditions are known to impact both C/V and S/V ratios (Dalzell et al.,
2005; Hernes et al., 2008; Jeanneau et al., 2015), it was not possible to compare these values
to those recorded for the weekly sampling dataset. Consequently, these samples were
preserved for the next statistical analysis. The p-values of the paired t-tests (Table 1) indicate
no significant differences between the two filter types.
13
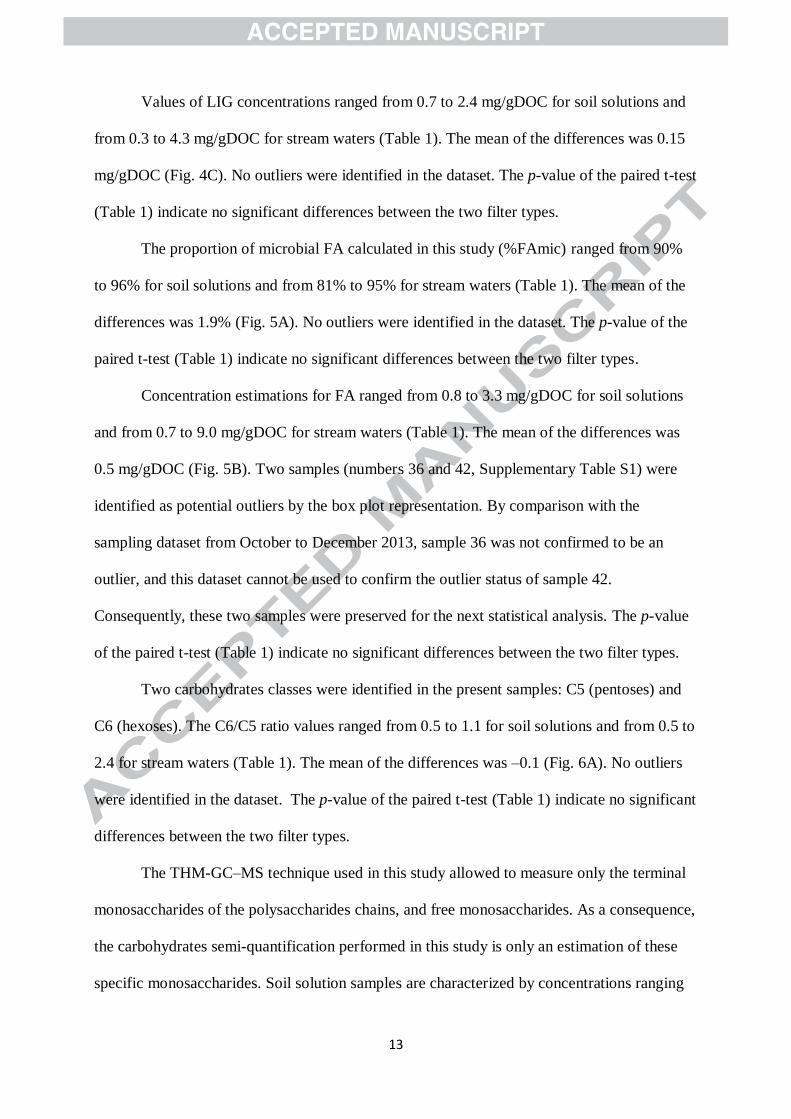
Values of LIG concentrations ranged from 0.7 to 2.4 mg/gDOC for soil solutions and
from 0.3 to 4.3 mg/gDOC for stream waters (Table 1). The mean of the differences was 0.15
mg/gDOC (Fig. 4C). No outliers were identified in the dataset. The p-value of the paired t-test
(Table 1) indicate no significant differences between the two filter types.
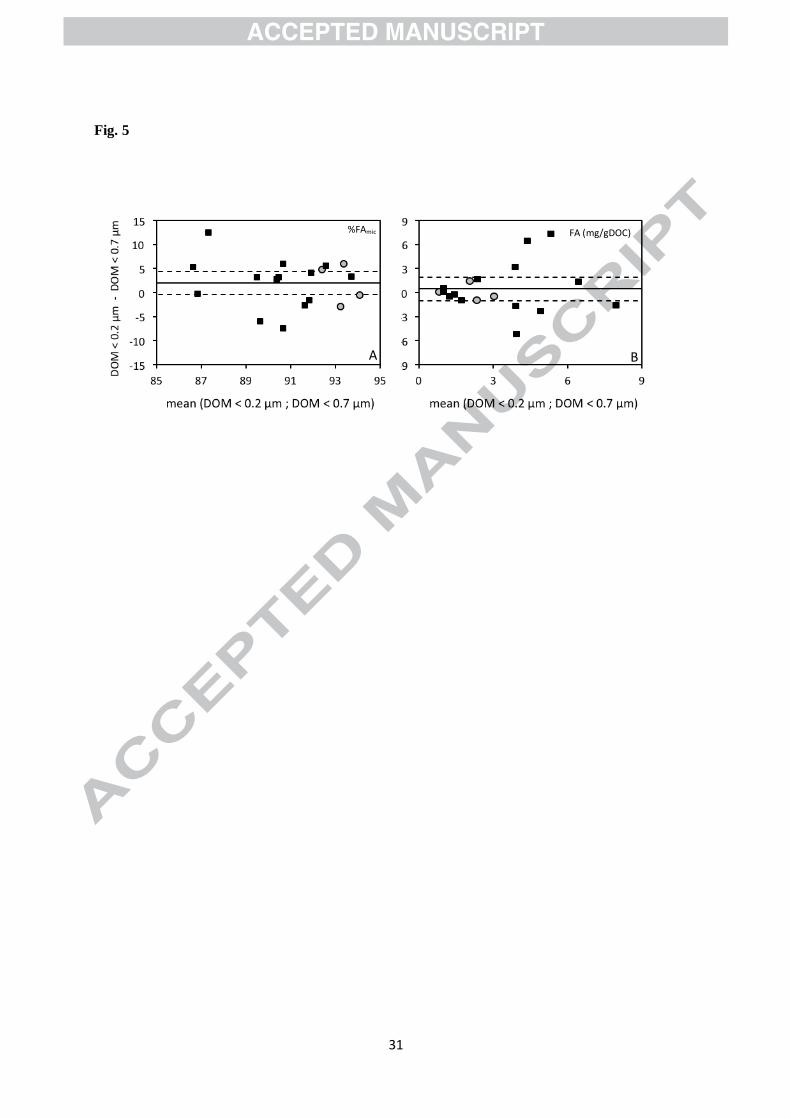
The proportion of microbial FA calculated in this study (%FAmic) ranged from 90%
to 96% for soil solutions and from 81% to 95% for stream waters (Table 1). The mean of the
differences was 1.9% (Fig. 5A). No outliers were identified in the dataset. The p-value of the
paired t-test (Table 1) indicate no significant differences between the two filter types.
Concentration estimations for FA ranged from 0.8 to 3.3 mg/gDOC for soil solutions
and from 0.7 to 9.0 mg/gDOC for stream waters (Table 1). The mean of the differences was
0.5 mg/gDOC (Fig. 5B). Two samples (numbers 36 and 42, Supplementary Table S1) were
identified as potential outliers by the box plot representation. By comparison with the
sampling dataset from October to December 2013, sample 36 was not confirmed to be an
outlier, and this dataset cannot be used to confirm the outlier status of sample 42.
Consequently, these two samples were preserved for the next statistical analysis. The p-value
of the paired t-test (Table 1) indicate no significant differences between the two filter types.
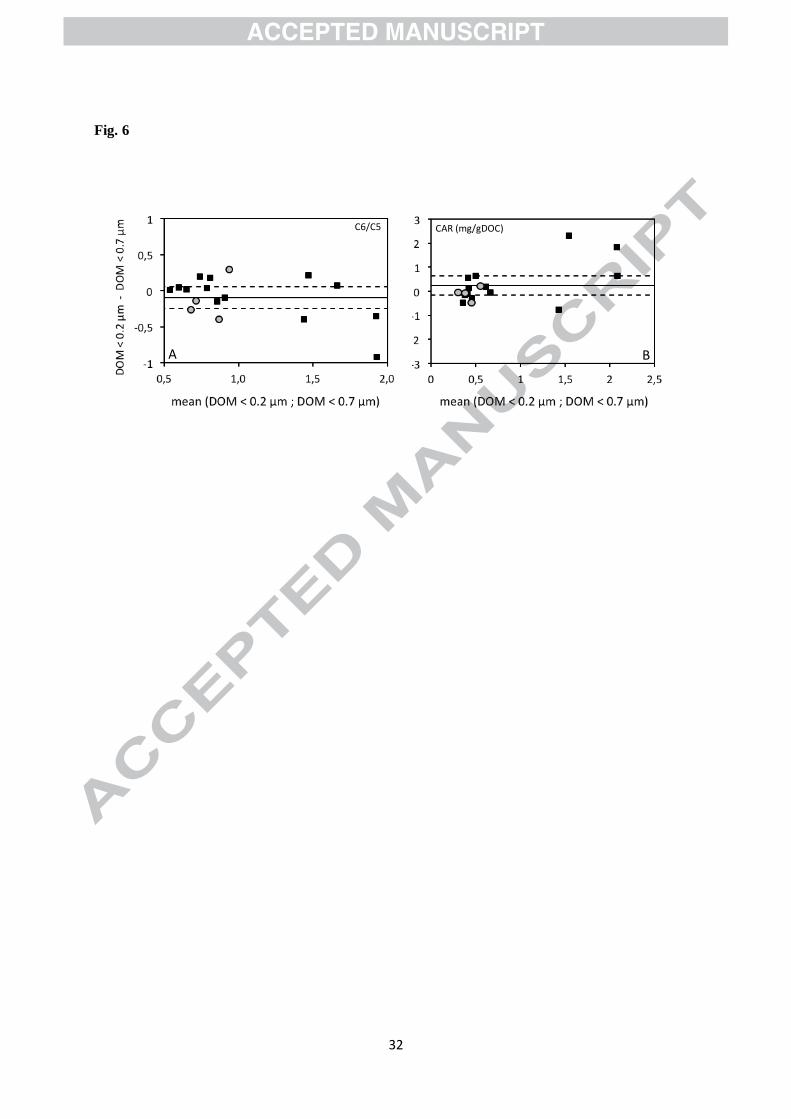
Two carbohydrates classes were identified in the present samples: C5 (pentoses) and
C6 (hexoses). The C6/C5 ratio values ranged from 0.5 to 1.1 for soil solutions and from 0.5 to
2.4 for stream waters (Table 1). The mean of the differences was –0.1 (Fig. 6A). No outliers
were identified in the dataset. The p-value of the paired t-test (Table 1) indicate no significant
differences between the two filter types.
The THM-GC–MS technique used in this study allowed to measure only the terminal
monosaccharides of the polysaccharides chains, and free monosaccharides. As a consequence,
the carbohydrates semi-quantification performed in this study is only an estimation of these
specific monosaccharides. Soil solution samples are characterized by concentrations ranging
14
from 0.2 to 0.7 mg/gDOC, and concentration of stream water samples range from 0.1 to 3.0
mg/gDOC (Table 1). The mean of the differences was 0.2 mg/gDOC (Fig. 6B). One sample
(number 42, Supplementary Table S1) was identified as a potential outlier by the box plot
representation. This sample was a stream water sampled in Kerolland river. The weekly
sampling dataset cannot be used to determine outliers since this sampling point was not
investigated for its molecular composition in the long-term monitoring program.
Consequently, this point was preserved for the next statistical analysis. The p-value of the
paired t-test (Table 1) indicate no significant differences between the two filter types.
4. Discussion
4.1. Is there a filter effect on bulk-scale descriptors?
The question of the influence of filter type and pore-size on bulk-scale descriptors
have been previously investigated for DOC concentration (Zsolnay, 2003; Gandois et al.,
2010), and spectroscopic (Nimptsch et al., 2014) and isotopic parameters (Sanderman et al.,
2008). These studies reached the same conclusion of no significant effect, or significant but
small filtration effect. This point was also investigated in the present study to confirm these
observations before analyzing DOM at the molecular scale. The range of values obtained for
these parameters are in accordance with values previously measured in soil and stream waters
for the studied catchment (Morel et al., 2009; Lambert et al., 2011, 2013, 2014; Jeanneau et
al., 2014, 2015) and similar catchments worldwide (Sanderman et al., 2008).
Results on bulk-scale descriptors show no significant effect of the pore-size or
composition of filters, with the exception of one sample for DOC concentration and two
samples for SUVA values (Fig. 2). However, these samples were not the same for DOC and
15
SUVA measurements. Moreover, by comparison with data from the same sites and sampled
during the same hydrological period those points were defined as outliers. Consequently, the
absence of a filtration effect on bulk-scale descriptors allowed us to investigate the potential
filtration effect on DOM molecular analysis by THM-GC–MS.
4.2. Is there a filter effect on molecular composition?
Present-day challenges in DOM biogeochemistry include a better understanding of
their sources and sinks (Nguyen and Hur, 2011). The development of molecular tools to probe
the composition of DOM allows the determination of thousands of individual formulae by
FT-ICR–MS (Koch et al., 2005) or the identification of individual compounds implied in
natural macromolecules such as lignins, carbohydrates and fatty acids by THM-GC–MS
(Challinor, 2001). Those analyses lead to a mine of information. However, since those
compounds are at trace levels, the use of molecular tools requires more attention to potential
contamination. It is necessary to determine the absence of filtration effects to allow the
comparison of different studies.
In the present study, the distribution of 43 target compounds was investigated through
the relative proportion of three classes of compounds (LIG, FA and CAR) and molecular
ratios. As revealed by the paired t-tests, filter type and porosity had no significant effect on
the distribution of the three classes of compounds and molecular ratios analyzed in this study.
Pseudo-quantitative analysis was performed by the addition of hydrocinnamic acid d9
as an internal standard allowing the estimation of the concentration of each individual
compound. In order to test the potential effect of filter type and porosity on this pseudo-
quantitative analysis, the concentration of the three classes of compounds (LIG, FA, CAR)
was investigated. For those three classes, the mean of the differences are slightly higher than
16
0 (Fig. 4A, 5B, 6B), which implies that concentrations measured on samples filtered at 0.2 µm
were higher than those measured in the same sample filtered at 0.7 µm. Since 0.2 μm filters
are made of organic material, a hypothesis to explain those differences could be the
contamination of the samples by the filters. However, 0.2 μm filters are made of cellulose
acetate, and cellulose is a polymer of glucose (i.e. a hexose). Such a contamination would
increase: (i) the concentration of CAR, (ii) the C6/C5 ratio and (iii) the %CAR. However,
higher concentrations in the < 0.2 µm fraction were also recorded for LIG and FA. No
significant variations of the C6/C5 ratio were recorded (Fig. 5A), and the distributions
between %LIG, %FA and %CAR (Fig. 3) were not affected by the different filtration modes.
Moreover, the samples that present the most important differences between the two filtration
modes were not the same for each quantitative parameter. All these observations allow us to
invalidate the hypothesis of a contamination by cellulose acetate filters rinsed with 500 mL of
ultrapure water.
A second hypothesis that could explain the difference in terms of concentration
between the two filtration modes could be an analytical bias due to the sorption of organic
molecules on mineral surfaces. This interaction between organic matter and mineral surfaces,
called the shield effect, is known to impact the analytical efficiency of lignin phenols by the
alkaline CuO oxidation (Hernes et al., 2013). In samples filtered at 0.2 μm, a larger fraction
of the mineral phases was removed compared to samples filtered at 0.7 μm. Thus, the ratio
OM to mineral phases increased, which could induce a slightly higher analytical efficiency.
The use of filters with different composition or porosity does not significantly affect
the distribution of the different target molecules analyzed by THM-GC–MS, and only slightly
impact the estimation of their concentrations. As a consequence, it seems reasonable to prefer
the use of 0.7 μm glass fiber filters to prevent any contamination. Moreover, the realization of
one single filtration step at 0.7 μm instead of two successive filtration steps allows one to
17
reduce analytical cost and environmental impact due to the saving of 500 mL of ultrapure
water required to pre-wash 0.2 μm filters.
4.3. A gap in the POM–DOM continuum?
In the POM–DOM continuum (Verdugo et al., 2004), the transition between POM and
DOM was operationally defined at 0.45 μm. At this cutoff threshold, OM is implied to be
present as colloids. According to this idea of a continuum, there should be a decrease in DOC
concentrations between the < 0.7 µm and the < 0.2 µm fractions. However, no significant
differences were observed for DOC concentrations (Fig. 2A), which is commonly described
(Zsolnay, 2003; Sanderman et al., 2008). Two hypothesis could be considered: (i) the absence
of colloids between 0.2 and 0.7 μm or (ii) the absence of OM in the colloids occurring in this
size range. Filella and Buffle (1993) or Atteia and Kozel (1997) report that colloids have been
identified in this range in surface waters (river, lake) and groundwaters by different analytical
techniques. Moreover, in this present study, the coloration of 0.2 µm filters after the filtration
step suggested the retention of material larger than 0.2 μm (data not shown). As a
consequence, the colloids retained by the 0.2 µm filters did not contain OM, which would
represent a gap in the POM–DOM continuum between 0.7 and 0.2 µm. How can this apparent
gap be explained?
This apparent lack of OM between 0.2 and 0.7 µm could be due to the nature and
dynamics of supramolecular associations building up colloids. Colloids are composed of a
combination of inorganic matter (e.g., metal oxyhydroxides, clays, calcium carbonates) and
organic matter (e.g., lignins, tannins, fatty acids, polysaccharides, proteins etc) (Gaillardet et
al., 2003) bound together by weak interactions (Kleber and Johnson, 2010). Colloids are
characterized by high specific surface areas and a strong sorption capacity, which made them
18
highly reactive (Stumm, 1993). Their size distributions depend on the nature of the sample,
and could change over time, especially after sampling, when samples are transferred from an
open and natural system to a closed one (e.g., sampling bottles) (Buffle and Leppard, 1995).
The smallest particles coagulate to form larger ones and the largest settle down, resulting in a
narrowing of the distribution of colloids (Filella and Buffle, 1993). However the cohesive
forces that build up larger colloids can easily be broken by manual shaking (Esfahani et al.,
2015). During the filtration process, the behaviour of weakly aggregating colloids depends on
the equilibrium between cohesive and disruptive forces (Wolthers, 1996) and especially shear
forces (Tolpekin et al., 2004). The shear forces occurring during the normal filtration at 0.2
µm may have resulted in the breakup of colloids. Then during the second filtration step,
colloids < 0.2 µm passed through the filter, while colloids > 0.2 µm were broken up by shear
forces and passed through the filter. The retentate was composed of mineral matter > 0.2 µm.
As a consequence, OM may occur in the fraction between 0.2 and 0.7 µm, but apparently in
colloids whose cohesive forces are not strong enough to resist the normal filtration process.
Tangential filtration, by decreasing shear forces, could minimize the breakup of colloids and
could be more appropriate to investigate the fate of OM along the POM–DOM continuum.
5. Conclusions
The potential impact of two different filter types (cellulose acetate or glass fiber) and
filter pore-size (0.2 μm or 0.7 μm) used for DOM extraction have been studied for stream
waters and soil solution samples. As found in previous studies, the choice of filter has no
significant effect on qualitative and quantitative bulk-scale descriptors along the soil–river
continuum.
19
Since looking at the molecular composition of DOM may be very fruitful for
biogeochemical and ecological studies, and since DOM compounds are more vulnerable to
potential contamination, it was necessary to ensure that the molecular composition of DOM
was not affected by the filter type and filter porosity used for the filtration step.
Molecular characterization by THM-GC–MS highlights no significant filtration effect
on the distribution of the 43 target compounds that cover the investigation of polysaccharides,
fatty acids, lignins and tannins in DOM. Results of pseudo-quantification of the three classes
of compounds (LIG, FA and CAR) highlight higher concentrations for samples filtered at 0.2
μm compared to 0.7 μm, which were attributed to an analytical bias due to the sorption of
organic molecules on mineral surfaces, resulting in a shield effect during the
thermochemolysis step. Then it seems more efficient to perform one single filtration step,
using 0.7 µm glass fiber filters allowing the reduction of analytical cost and environmental
impact.
From a conceptual point of view, this apparent similarity between < 0.7 and < 0.2 µm
DOM, interpreted in the framework of the POM–DOM continuum would signify a lack of
DOM between those two thresholds. Considering the colloidal forms of DOM at this size
range, built up by weak forces, this apparent lack of DOM has been interpreted as the result of
the breakup of colloids caused by shear forces applied during filtration.
Acknowledgments
This research was supported by the French National Research Agency through the MOSAIC
project and the French Ministry of Scientific Research. The long-term monitoring program on
the Kervidy-Naizin watershed is supported by the ORE AgrHyS. We thank all the technical
staff from Géosciences Rennes and INRA who helped with field and laboratory work.
20
Associate Editor–Ingrid Kögel-Knabner
References
Ågren, A., Buffam, I., Jansson, M., Laudon, H., 2007. Importance of seasonality and small
streams for the landscape regulation of dissolved organic carbon export. Journal of
Geophysical Research 112. DOI: 10.1029/2006JG000381
Atteia, O., Kozel, R., 1997. Particle size distributions in waters from a karstic aquifer: from
particles to colloids. Journal of Hydrology 201, 102–119.
Aubert, A.H., Gascuel-Odoux, C., Gruau, G., Akkal, N., Faucheux, M., Fauvel, Y., Grimaldi,
C., Hamon, Y., Jaffrézic, A., Lecoz-Boutnik, M., Molénat, J., Petitjean, P., Ruiz, L.,
Merot, P., 2013. Solute transport dynamics in small, shallow groundwater-dominated
agricultural catchments: insights from a high-frequency, multisolute 10 yr-long
monitoring study. Hydrology and Earth System Sciences 17, 1379–1391.
Bu, X., Wang, L., Ma, W., Yu, X., McDowell, W.H., Ruan, H., 2010. Spectroscopic
characterization of hot-water extractable organic matter from soils under four different
vegetation types along an elevation gradient in the Wuyi Mountains. Geoderma 159,
139–146.
Buffle, J., Leppard, G.G., 1995. Characterization of aquatic colloids and macromolecules. 1.
Structure and behavior of colloidal material. Environmental Science & Technology
29, 2169–2175.
Challinor, J.M., 2001. Review: the development and applications of thermally assisted
hydrolysis and methylation reactions. Journal of Analytical and Applied Pyrolysis 61,
3–34.
21
Dalzell, B.J., Filley, T.R., Harbor, J.M., 2005. Flood pulse influences on terrestrial organic
matter export from an agricultural watershed. Journal of Geophysical Research 110.
DOI: 10.1029/2005JG000043
Esfahani, M.R., Stretz, H.A., Wells, M.J.M., 2015. Abiotic reversible self-assembly of fulvic
and humic acid aggregates in low electrolytic conductivity solutions by dynamic light
scattering and zeta potential investigation. Science of The Total Environment 537, 81–
92.
Fabbri, D., Helleur, R., 1999. Characterization of the tetramethylammonium hydroxide
thermochemolysis products of carbohydrates. Journal of Analytical and Applied
Pyrolysis 49, 277–293.
Filella, M., Buffle, J., 1993. Factors controlling the stability of submicron colloids in natural
waters. Journal of Colloids and Surfaces 73, 255–273.
Frazier, S.W., Nowack, K.O., Goins, K.M., Cannon, F.S., Kaplan, L.A., Hatcher, P.G., 2003.
Characterization of organic matter from natural waters using tetramethylammonium
hydroxide thermochemolysis GC–MS. Journal of Analytical and Applied Pyrolysis
70, 99–128.
Frostegard, A., Tunlid, A., Baath, E., 1993. Phospholipid fatty acid composition, biomass, and
activity of microbial communities from two soil types experimentally exposed to
different heavy metals. Applied and Environmental Microbiology 59, 3605–3617.
Gaillardet, J., Viers, J., Dupré, B., 2003. Trace elements in river waters. In: Treatise on
Geochemistry. Elsevier, pp. 225–272.
Gandois, L., Tipping, E., Dumat, C., Probst, A., 2010. Canopy influence on trace metal
atmospheric inputs on forest ecosystems: Speciation in throughfall. Atmospheric
Environment 44, 824–833.
22
Grasset, L., Rovira, P., Amblès, A., 2009. TMAH-preparative thermochemolysis for the
characterization of organic matter in densimetric fractions of a Mediterranean forest
soil. Journal of Analytical and Applied Pyrolysis 85, 435–441.
Gu, B., Schmitt, J., Chen, Z., Liang, L., McCarthy, J.F., 1994. Adsorption and desorption of
natural organic matter on iron oxide: mechanisms and models. Environmental Science
& Technology 28, 38–46.
Hedges, J.I., Mann, D.C., 1979. The characterization of plant tissues by their lignin oxidation
products. Geochimica et Cosmochimica Acta 43, 1803–1807.
Hernes, P.J., Kaiser, K., Dyda, R.Y., Cerli, C., 2013. Molecular trickery in soil organic
matter: hidden lignin. Environmental Science & Technology 47, 9077–9085.
Hernes, P.J., Spencer, R.G.M., Dyda, R.Y., Pellerin, B.A., Bachand, P.A.M., Bergamaschi,
B.A., 2008. The role of hydrologic regimes on dissolved organic carbon composition
in an agricultural watershed. Geochimica et Cosmochimica Acta 72, 5266–5277.
Jeanneau, L., Denis, M., Pierson-Wickmann, A.-C., Gruau, G., Lambert, T., Petitjean, P.,
2015. Sources of dissolved organic matter during storm and inter-storm conditions in a
lowland headwater catchment: constraints from high-frequency molecular data.
Biogeosciences 12, 4333–4343.
Jeanneau, L., Jaffrezic, A., Pierson-Wickmann, A.-C., Gruau, G., Lambert, T., Petitjean, P.,
2014. Constraints on the sources and production mechanisms of dissolved organic
matter in soils from molecular biomarkers. Vadose Zone Journal 13, 1–9.
Kalbitz, K., Solinger, S., Park, J.-H., Michalzik, B., Matzner, E., 2000. Controls on the
dynamics of dissolved organic matter in soils: a review. Soil Science 165, 277–304.
Kleber, M., Johnson, M.G., 2010. Advances in Understanding the Molecular Structure of Soil
Organic Matter. In: Advances in Agronomy. Elsevier, pp. 77–142.
23
Koch, B.P., Witt, M., Engbrodt, R., Dittmar, T., Kattner, G., 2005. Molecular formulae of
marine and terrigenous dissolved organic matter detected by electrospray ionization
Fourier transform ion cyclotron resonance mass spectrometry. Geochimica et
Cosmochimica Acta 69, 3299–3308.
Kögel, I., 1986. Estimation and decomposition pattern of the lignin component in forest
humus layer. Soil Biology and Biochemistry 18, 589–594.
Krieg, N.R., 2005. Procaryotic domains. In: Bergey’s Manual of Systematic Bacteriology.
Springer, pp. 21–26.
Lambert, T., Pierson-Wickmann, A.-C., Gruau, G., Jaffrezic, A., Petitjean, P., Thibault, J.N.,
Jeanneau, L., 2014. DOC sources and DOC transport pathways in a small headwater
catchment as revealed by carbon isotope fluctuation during storm events.
Biogeosciences 11, 3043–3056.
Lambert, T., Pierson-Wickmann, A.-C., Gruau, G., Jaffrezic, A., Petitjean, P., Thibault, J.-N.,
Jeanneau, L., 2013. Hydrologically driven seasonal changes in the sources and
production mechanisms of dissolved organic carbon in a small lowland catchment:
Seasonal changes in DOC dynamics. Water Resources Research 49, 5792–5803.
Lambert, T., Pierson-Wickmann, A.-C., Gruau, G., Thibault, J.-N., Jaffrezic, A., 2011.
Carbon isotopes as tracers of dissolved organic carbon sources and water pathways in
headwater catchments. Journal of Hydrology 402, 228–238.
Matsuda, H., Koyama, K., 1977. Early diagenesis of fatty acids in lacustrine sediments: II. A
statistical approach to changes in fatty acid composition from recent sediments and
some source materials. Geochimica et Cosmochimica Acta 41, 1825–1834.
McDowell, W.H., 2003. Dissolved organic matter in soils—future directions and unanswered
questions. Geoderma 113, 179–186.
24
Morel, B., Durand, P., Jaffrezic, A., Gruau, G., Molenat, J., 2009. Sources of dissolved
organic carbon during stormflow in a headwater agricultural catchment. Hydrological
Processes 23, 2888–2901.
Neale, P.A., Antony, A., Gernjak, W., Leslie, G., Escher, B.I., 2011. Natural versus
wastewater derived dissolved organic carbon: Implications for the environmental fate
of organic micropollutants. Water Research 45, 4227–4237.
Nguyen, H.V.-M., Hur, J., 2011. Tracing the sources of refractory dissolved organic matter in
a large artificial lake using multiple analytical tools. Chemosphere 85, 782–789.
Nierop, K.G.J., Verstraten, J.M., 2004. Rapid molecular assessment of the bioturbation extent
in sandy soil horizons under pine using ester-bound lipids by on-line thermally
assisted hydrolysis and methylation-gas chromatography/mass spectrometry. Rapid
Communications in Mass Spectrometry 18, 1081–1088.
Nimptsch, J., Woelfl, S., Kronvang, B., Giesecke, R., González, H.E., Caputo, L., Gelbrecht,
J., von Tuempling, W., Graeber, D., 2014. Does filter type and pore size influence
spectroscopic analysis of freshwater chromophoric DOM composition? Limnologica -
Ecology and Management of Inland Waters 48, 57–64.
Rumpel, C., Dignac, M.-F., 2006. Gas chromatographic analysis of monosaccharides in a
forest soil profile: Analysis by gas chromatography after trifluoroacetic acid
hydrolysis and reduction–acetylation. Soil Biology and Biochemistry 38, 1478–1481.
Sanderman, J., Baldock, J.A., Amundson, R., 2008. Dissolved organic carbon chemistry and
dynamics in contrasting forest and grassland soils. Biogeochemistry 89, 181–198.
Scheel, T., Haumaier, L., Ellerbrock, R.H., Rühlmann, J., Kalbitz, K., 2008. Properties of
organic matter precipitated from acidic forest soil solutions. Organic Geochemistry 39,
1439–1453.
25
Stumm, W., 1993. Aquatic colloids as chemical reactants: surface structure and reactivity.
Colloids and Surfaces A: Physicochemical and Engineering Aspects 73, 1–18.
Tolpekin, V.A., Duits, M.H.G., van den Ende, D., Mellema, J., 2004. Aggregation and
breakup of colloidal particle aggregates in shear flow, studied with video microscopy.
Langmuir 20, 2614–2627.
Verdugo, P., Alldredge, A.L., Azam, F., Kirchman, D.L., Passow, U., Santschi, P.H., 2004.
The oceanic gel phase: a bridge in the DOM–POM continuum. Marine Chemistry 92,
67–85.
Weishaar, J.L., Aiken, G.R., Bergamaschi, B.A., Fram, M.S., Fujii, R., Mopper, K., 2003.
Evaluation of specific ultraviolet absorbance as an indicator of the chemical
composition and reactivity of dissolved organic carbon. Environmental Science &
Technology 37, 4702–4708.
Wolthers, W., 1996. The viscosity and sedimentation of aggregating colloidal dispersions in a
Couette flow. Journal of Rheology 40, 55–67.
Zsolnay, Á., 2003. Dissolved organic matter: artefacts, definitions, and functions. Geoderma
113, 187–209.
26
Fig. 1: Map of the Kervidy-Naizin catchment (Brittany, France) and location of the sampling sites
Fig. 2: Graphical representation of the difference between DOM < 0.2 µm and DOM < 0.7 µm as a
function of their mean for DOC concentration, spectroscopic and isotopic parameter, and for soil
solutions (grey dots) and stream waters (black squares). For each parameter, the full line represents the
mean of the differences and dashed lines define the 95% confident interval around the mean.
* indicate values defined as outliers and excluded from the dataset used to perform the paired t-tests.
Fig. 3: Graphical representation of the difference between DOM < 0.2 µm and DOM < 0.7 µm as a
function of their mean for %LIG, %FA and %CAR, and for soil solutions (grey dots) and stream
waters (black squares). For each parameter, the full line represents the mean of the differences and
dashed lines define the 95% confident interval around the mean.
Fig. 4: Graphical representation of the difference between DOM < 0.2 µm and DOM < 0.7 µm as a
function of their mean for C/V, S/V and LIG concentration, and for soil solutions (grey dots) and
stream waters (black squares). For each parameter, the full line represents the mean of the differences
and dashed lines define the 95% confident interval around the mean.
Fig. 5: Graphical representation of the difference between DOM < 0.2 µm and DOM < 0.7 µm as a
function of their mean for %FAmic and FA concentration, and for soil solutions (grey dots) and stream
waters (black squares). For each parameter, the full line represents the mean of the differences and
dashed lines define the 95% confident interval around the mean.
Fig. 6: Graphical representation of the difference between DOM < 0.2 µm and DOM < 0.7 µm as a
function of their mean for C6/C5 and CAR concentration, and for soil solutions (grey dots) and stream
waters (black squares). For each parameter, the full line represents the mean of the differences and
dashed lines define the 95% confident interval around the mean.
27
Fig. 1

28
D
DOC (mg/L) SUVA254
A B
SUVA280
δ13
C (‰)
C
*
*
* *
Fig. 2
29
%LIG
%FA
A
B
%CAR
C
Fig. 3
30
Fig.4
C/V
A
S/V
B
LIG (mg/gDOC)
C
31
Fig. 5
%FAmic FA (mg/gDOC)
A B
32
Fig. 6
B
CAR (mg/gDOC) C6/C5
A
33
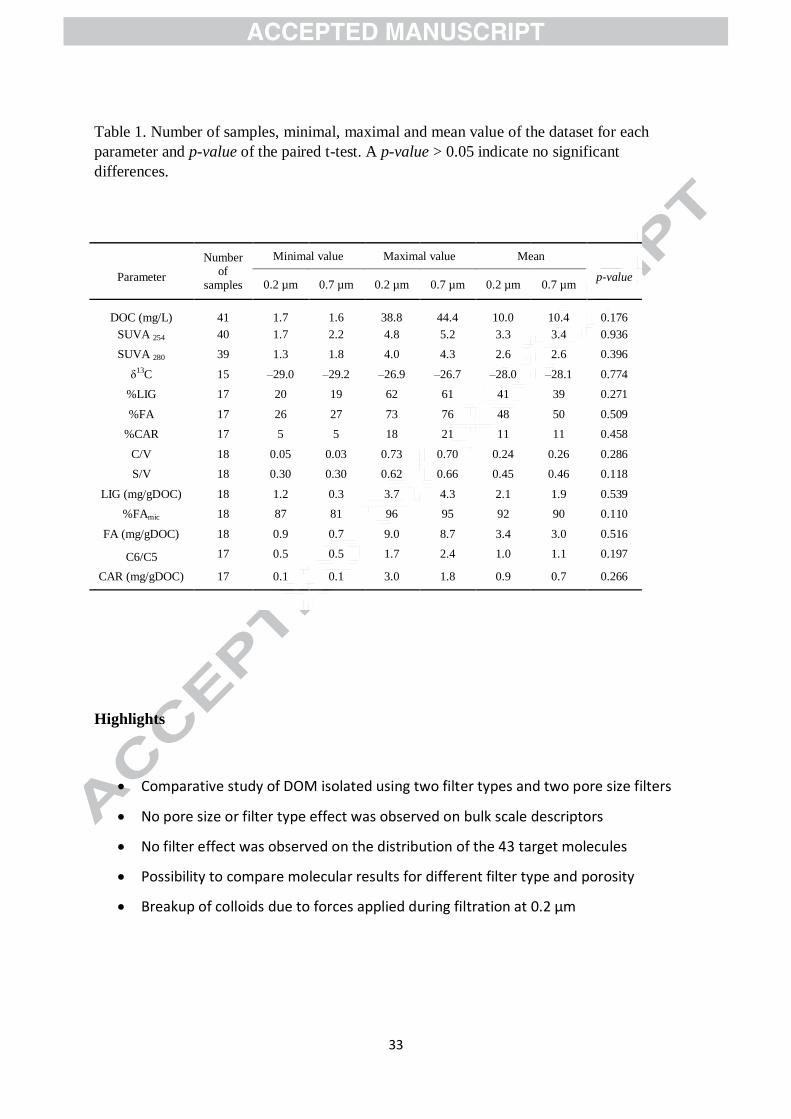
Table 1. Number of samples, minimal, maximal and mean value of the dataset for each
parameter and p-value of the paired t-test. A p-value > 0.05 indicate no significant
differences.
Highlights
Comparative study of DOM isolated using two filter types and two pore size filters
No pore size or filter type effect was observed on bulk scale descriptors
No filter effect was observed on the distribution of the 43 target molecules
Possibility to compare molecular results for different filter type and porosity
Breakup of colloids due to forces applied during filtration at 0.2 µm
Number of
samples
Minimal value Maximal value Mean
Parameter 0.2 µm 0.7 µm 0.2 µm 0.7 µm 0.2 µm 0.7 µm
p-value
DOC (mg/L) 41 1.7 1.6 38.8 44.4 10.0 10.4 0.176
SUVA 254 40 1.7 2.2 4.8 5.2 3.3 3.4 0.936
SUVA 280 39 1.3 1.8 4.0 4.3 2.6 2.6 0.396
δ13C 15 –29.0 –29.2 –26.9 –26.7 –28.0 –28.1 0.774
%LIG 17 20 19 62 61 41 39 0.271
%FA 17 26 27 73 76 48 50 0.509
%CAR 17 5 5 18 21 11 11 0.458
C/V 18 0.05 0.03 0.73 0.70 0.24 0.26 0.286
S/V 18 0.30 0.30 0.62 0.66 0.45 0.46 0.118
LIG (mg/gDOC) 18 1.2 0.3 3.7 4.3 2.1 1.9 0.539
%FAmic 18 87 81 96 95 92 90 0.110
FA (mg/gDOC) 18 0.9 0.7 9.0 8.7 3.4 3.0 0.516
C6/C5 17 0.5 0.5 1.7 2.4 1.0 1.1 0.197
CAR (mg/gDOC) 17 0.1 0.1 3.0 1.8 0.9 0.7 0.266
34
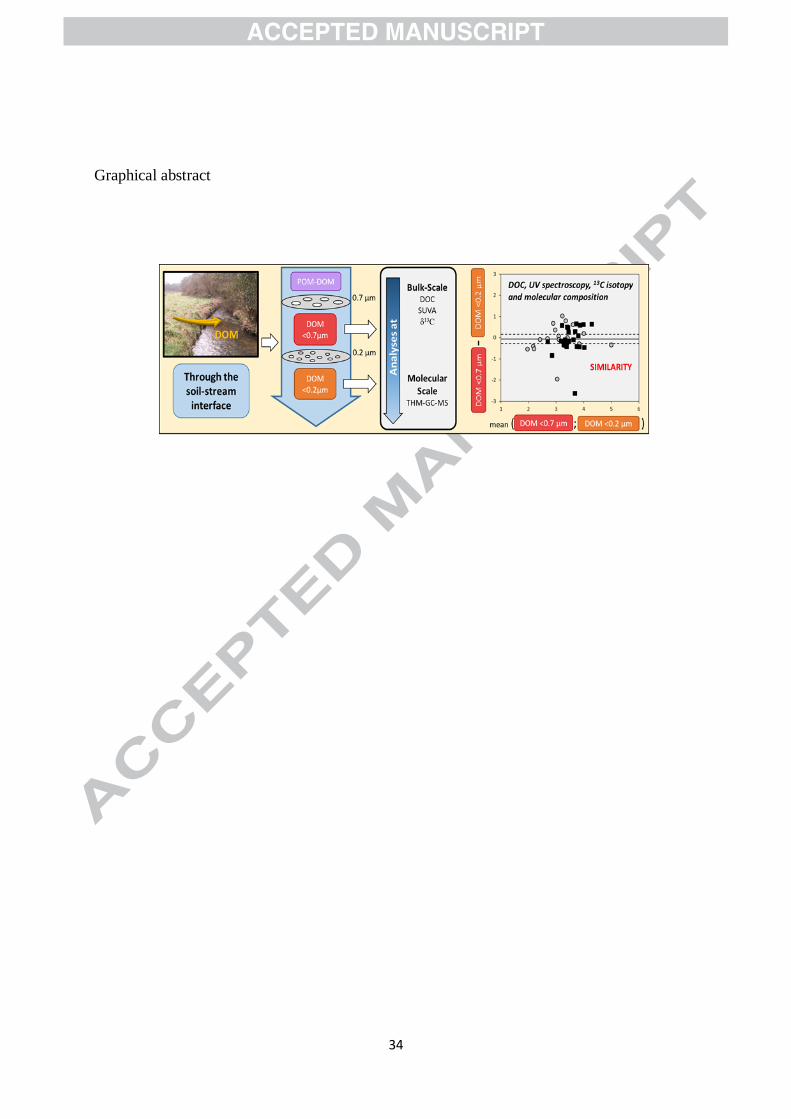
Graphical abstract