Embed Size (px)
Citation preview
Environmental Footprint of Ecofiltro Water FilterComparative Analysis of Filtered, Bottled, & Boiled Water*
Study for the winner of SBIO 2012 - by PRé
Date: May 28, 2013
Version: 1.0
Commissioned by: Ecofiltro
Prepared by: PRé North America
Main authors: Vee Subramanian, Paula Bernstein
*This study has not been critically reviewed at time of publication.
This report has been prepared by PRé North America Inc., the U.S. branch of PRé Consultants bv. PRé puts the metrics behind sustainability,
and provides decision makers with the tools, knowledge, and network to make products and services more sustainable.
For more than 20 years PRé has been at the forefront of life cycle thinking, and has built on its knowledge and experience in
sustainability metrics and impact assessments to provide state-of-the-art methods, consultancy, and software tools. Internationally,
leading organizations work with PRé to integrate sustainability into their product development procedures in order to create business
growth and business value. PRé has offices in the United States and the Netherlands, plus a global partner network to support large
international or multi-client projects.
This report has been prepared by the U.S. office of PRé. Please direct all questions regarding this report to PRé North America.
PRé North America Inc.
20 F Street NW
7th Floor
Washington, DC 20001
USA
Phone: +1 202 507 6231
www.pre-sustainability.com
i
ii
Table of Contents
List of Acronyms iii
1 Introduction 4
1.1 Life Cycle Assessment Background 4
2 Goals & Scope 5
2.1 Goals 5
2.2 Product System and Functional Unit 5
2.3 System Boundaries 6
3 Modeling and Assumptions 7
3.1 Ecofiltro Water Filter 7
3.2 Bottled Water 10
3.3 Boiled Water 11
4 Life Cycle Inventory Analysis and Impact Assessment 11
4.1 Global Warming Potential (GWP) 12
4.2 Cumulative Energy Demand 13
4.3 Water Use 14
4.4 Human Toxicity Potential 15
4.5 Summary 16
5 Interpretation 17
6 References 18
7 Appendix 19
7.1 Summary of Assumptions 19
7.2 Glossary 21

iii
List of Acronyms
Acronyms
Btu British thermal units
CED Cumulative Energy Demand
CO2 Carbon Dioxide
CTUh Comparative Toxic Units
GWP Global Warming Potential
HDPE High-density Polyethylene
IPCC Intergovernmental Panel on Climate Change
kW Kilowatt
kWh Kilowatt hour
LCA Life Cycle Assessment
LCIA Life Cycle Impact Assessment
LDPE Low-density Polyethylene
MJ Mega Joules
WHO World Health Organization

4
1 IntroductionGuatemala-based start-up Ecofiltro has developed a simple water filter that can provide clean drinking water. This filter, shown below,
is manufactured using local artisans and potters at a low cost, thereby providing socio-economic benefits along with health benefits.
Ecofiltro is interested in understanding the environmental impacts of its product as well as the two other competing technologies in
Guatemala, so that it can better position itself to apply for grants from various funding organizations.
For placing first at the Sustainable Brands Innovation Open (SBIO) competition held at the Sustainable Brands
’12 Conference (San Diego, CA) in June 2012, Ecofiltro was offered the services of PRé North America to
conduct a life cycle assessment (LCA) of its product. Following initial conversations with Ecofiltro staff, the
LCA was expanded to include comparisons to two alternative methods of water purification (bottled water
and boiled water).
This study assesses the environmental impacts of the three water purification methods, but does not examine
the effectiveness of water purification and its related human-health impacts. The scope of the study is “cradle
to delivery,” which includes raw material extraction through delivery to the consumer.
1.1 Life Cycle Assessment Background
LCA is a tool used to evaluate potential environmental impacts of a product during its entire life cycle, from the extraction of raw
materials through disposal and recycling. The life cycle stages of a product are classified into six general categories: raw material
extraction, manufacturing, distribution, retail, consumer use, and end-of-life. The exact nomenclature used to describe these stages can
vary based on the goal of the LCA and the product system under consideration.
LCA is an iterative process, wherein the model and the results are continually reviewed and refined during the study in order to improve
the overall quality of the conclusions.
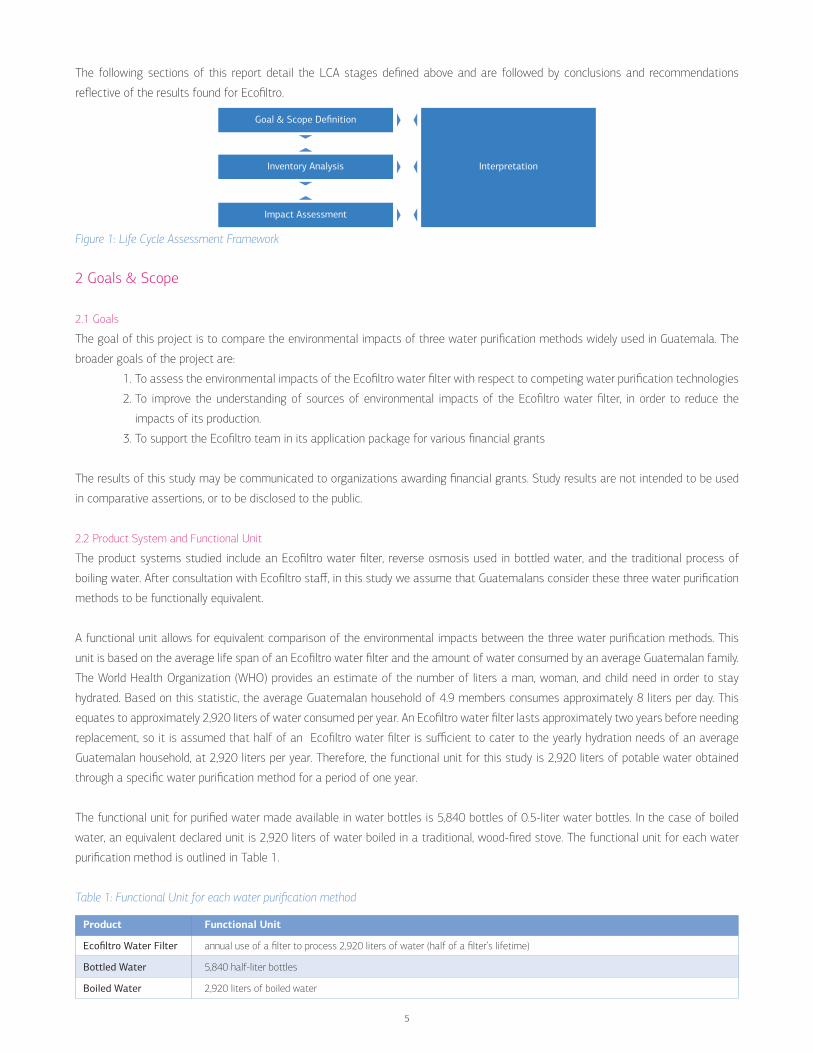
The process for conducting an LCA is illustrated in Figure 1, beginning with goal and scope definition. This is arguably the most
important phase of the LCA, as it sets the stage for how the LCA is designed, conducted, and eventually used. This phase involves
establishing the objectives of the LCA, defining and describing the product value chain, establishing the boundaries of the project, and
establishing the impact categories to be studied.
Data from primary and secondary sources are then gathered during the inventory analysis phase. In this phase, an inventory of raw
materials and energy flowing into and out of the product system is assembled and calculated.
The life cycle impact assessment phase (LCIA) follows the inventory analysis phase. The assembled inventory is then converted into
impacts based on the impact categories determined during the goal and scope phase. Characterization factors are used to convert and
combine life cycle inventory into representative impact indicators of human and ecological health.
In the final interpretation phase the results are used to determine the most beneficial opportunities for improvement in the product
value chain. Here the most significant environmental impacts at each life cycle stage are described. This phase concludes the study and
points to the most effective starting points to reduce a product’s environmental impact.
5
The following sections of this report detail the LCA stages defined above and are followed by conclusions and recommendations
reflective of the results found for Ecofiltro.
Figure 1: Life Cycle Assessment Framework
2 Goals & Scope
2.1 Goals
The goal of this project is to compare the environmental impacts of three water purification methods widely used in Guatemala. The
broader goals of the project are:
1. To assess the environmental impacts of the Ecofiltro water filter with respect to competing water purification technologies
2. To improve the understanding of sources of environmental impacts of the Ecofiltro water filter, in order to reduce the
impacts of its production.
3. To support the Ecofiltro team in its application package for various financial grants
The results of this study may be communicated to organizations awarding financial grants. Study results are not intended to be used
in comparative assertions, or to be disclosed to the public.
2.2 Product System and Functional Unit
The product systems studied include an Ecofiltro water filter, reverse osmosis used in bottled water, and the traditional process of
boiling water. After consultation with Ecofiltro staff, in this study we assume that Guatemalans consider these three water purification
methods to be functionally equivalent.
A functional unit allows for equivalent comparison of the environmental impacts between the three water purification methods. This
unit is based on the average life span of an Ecofiltro water filter and the amount of water consumed by an average Guatemalan family.
The World Health Organization (WHO) provides an estimate of the number of liters a man, woman, and child need in order to stay
hydrated. Based on this statistic, the average Guatemalan household of 4.9 members consumes approximately 8 liters per day. This
equates to approximately 2,920 liters of water consumed per year. An Ecofiltro water filter lasts approximately two years before needing
replacement, so it is assumed that half of an Ecofiltro water filter is sufficient to cater to the yearly hydration needs of an average
Guatemalan household, at 2,920 liters per year. Therefore, the functional unit for this study is 2,920 liters of potable water obtained
through a specific water purification method for a period of one year.
The functional unit for purified water made available in water bottles is 5,840 bottles of 0.5-liter water bottles. In the case of boiled
water, an equivalent declared unit is 2,920 liters of water boiled in a traditional, wood-fired stove. The functional unit for each water
purification method is outlined in Table 1.
Table 1: Functional Unit for each water purification method
Goal & Scope Definition
Inventory Analysis Interpretation
Impact Assessment
Product Functional Unit
Ecofiltro Water Filter annual use of a filter to process 2,920 liters of water (half of a filter’s lifetime)
Bottled Water 5,840 half-liter bottles
Boiled Water 2,920 liters of boiled water

6
2.3 System Boundaries
Boundary conditions serve to limit the scope of the analysis by defining both the inventory’s breadth and depth. This analysis of water
purification methods begins with the production of raw materials and ends with the delivery to the consumer. The blue boxes in
Figure 2 signify the boundaries of the analysis, as this study examines raw materials extraction, manufacturing, and distribution, but
excludes use and end of life. The use and the end-of-life phases are excluded from the assessment, as they not relevant to the analysis.
The actual water that is filtered using any of the three water purification methods is excluded from the analysis, as it pertains to use
and falls outside the scope of this analysis. However, the impacts associated with the transportation of the purified water (applicable to
the bottled water scenario, only) are included within the analysis. Capital goods and infrastructure are also excluded from the analysis.
Figure 2 displays the life cycle phases involved in each of the three water purification methods. The inputs for each of the systems are
listed on the left while the outputs to the environment are listed on the right.
Figure 2: System boundary diagram of the three water purification methods
End of Life
Use
Distribution
Energy & Raw materials
Emissions to air, water & soil
Manufacturing of Filter, Bucket, and
Secondary Packaging
Filter
End of Life
Use
Distribution
Manufacturing of Bottle and Secondary
Packaging
Bottled Water
End of Life
Use
Distribution
Manufacturing of Aluminum Pot
Boiled Water
Inputs to product systems Outputs from product systems

7
3 Modeling and AssumptionsPRé used the ecoinvent database to build the life cycle model of the three water purification methods. Primary data on Ecofiltro’s
production activities was used when available, and assumptions were made otherwise. Secondary data was predominantly sourced
from the ecoinvent 2.2 database and supplemented by information from relevant literature. All assumptions utilized in this study are
summarized in Appendix 7.1. The following sections summarize the data sources and assumptions utilized in the life cycle modeling of
the three water purification methods.
3.1 Ecofiltro Water Filter
The manufacturing facility of the Ecofiltro water filter is located in Antigua, Guatemala. All raw materials required for the manufacture
of the filter are sourced locally. Primary data was collected from a combination of sources, including direct communication with the
Ecofiltro team, a report by Elmore et al., (2009) titled “Ecofiltro’s Ceramic Pot Filter Experience in Guatemala,” and videos of Ecofiltro’s
production process. Secondary data was sourced from other reports regarding ceramic pot filter manufacturing in other parts of the
world (for example, Cambodia and Ghana). The process flow map for the production of an Ecofiltro filter is shown in Figure 3. The
material inputs required for the manufacture of one Ecofiltro water filter is outlined in Table 2 below.
Figure 3: Process flow diagram of Ecofiltro water filter
Table 2: Materials required to manufacturer one Ecofiltro water filter
Material/ Component/ Product Material Weight Units
Clay 4.5 kg
Sawdust 0.45 kg
Water 1.5 kg
Colloidal Silver 200 mL
Packaging (cardboard, Styrofoam, plastic bag) 0.283 kg
HDPE plastic bucket, lid, spigot 1.305 kg
Clay
Grinding
Sawdust
Extruding & Pressing
Packaging
Mixing
Applying C. Silver
Use End of Life
Baking
Distribution
Water Colloidal Silver Secondary Packaging HDPE Plastic
Injection Molding
Bucket, Lid, and Spigot
Raw Materials
Manufacturing
Packaging
Plastic bucket
Distribution
Not Included
in this Analysis
8
3.1.1 Raw Materials
Clay and Sawdust: The ratio of fine clay (27 kg), sawdust (2.7 kg) and water (9 liters) for one manufacturing batch of filters
was adopted from Elmore et al. (2009). It is assumed that each manufacturing batch of clay produces 6 filters. The clay is sourced from
a clay pit in the town of Rabinal Baja Verapaz by truck. The transportation distance between the clay pit and the manufacturing facility
was estimated to be 118 kilometers. Sawdust is sourced from Purulhá and La Cumbre en las Verapaces and trucked to Antigua. The
transportation distance between the source of sawdust and the manufacturing facility was estimated to be 141 kilometers, calculated
by averaging the distances from the two sawdust sources to Antigua.
Colloidal Silver: Based on the limited information available on the production of colloidal silver, a simple process of mixing
silver and water to produce colloidal silver was adopted. As the concentration of silver in Ecofiltro’s colloidal silver solution was unknown,
2,000 micrograms of silver in the 200 mL of colloidal silver was used. The colloidal silver is sourced from the Peten region in Northern
Guatemala.
3.1.2 Manufacturing of the Clay Filter
The manufacturing process of the Ecofiltro water filter was modeled based on the “Creating an Ecofiltro” video provided by Ecofiltro, as
well as various other publications about ceramic filter production in other parts of the world. A 35 percent failure rate of filters during
the quality control check was incorporated into the model, based on filter production information in Elmore et al. (2009). In other words,
it takes 1.54 filters to successfully produce one filter.
Machines: It was assumed that all machinery in the manufacturing facility runs on electricity, excluding the kiln, which
is fueled by propane gas. The life cycle inventory of Guatemalan electricity was modeled using the Guatemalan electricity mix and
carbon dioxide emissions of individual fuel sources for electricity production from various countries. For example, the Guatemalan CO2
emissions per kWh from electricity generation using coal was most similar to those of Italy, and the Guatemalan CO2 emissions per
Kwh from electricity generation using biomass was most similar to those of Brazil. Thereby, using the Guatemalan electricity mix, the
life cycle data for each of the fuel sources used in electricity generation in Guatemala was assembled into the Guatemalan electricity
model.
Table 3 outlines the assumptions on the energy used by the machines in the manufacturing facility. There are three electricity-powered
machines in the manufacturing facility. The hammer mill has a capacity of 3.7 kilowatts (kW) and is used for 1 minute, a mortar mixer
has a capacity of 1.5 horsepower and is used for 8 minutes, and an extruder has a capacity of 11 kW and is used for 1 minute.
Table 3: Energy required to manufacturer one Ecofiltro water filter
Machine Energy Unit
Hammer Mill 0.062 kWh
Clay Mixer 0.025 kWh
Extruder 0.183 kWh
Kiln 67,656 Btu

9
The kiln holds 240 filters at once. The energy used at the kiln was estimated by using the kiln energy consumption in ceramic filter
manufacturing facilities in Ghana (Adjorlolo and Kaza 2007). Filter production from Ghana required 200 kg of wood to heat a kiln that
holds 50 filters, and from this data the kiln energy required to produce one filter was calculated. This amount of energy was then used
in the Ecofiltro kiln, but natural gas was used instead of wood, because the Ecofiltro kiln is gas-fired.
Plastic Bag: During the shaping of the filter, Ecofiltro uses a black plastic bag to ensure that the clay does not stick to
the machinery (filter press). The plastic bag is made from low-density polyethylene (LDPE) and is 0.0015 inches thick. Transportation
distance of the bag from its production facility to the filter manufacturing facility was estimated to be 50 km.
Water: The water supply used at the manufacturing facility was modeled as tap water, as it was assumed that Ecofiltro is
using municipally-treated water at the facility.
3.1.3 Packaging
A distance of 50 kilometers was used to model transportation impacts associated with filter packaging. Secondary packaging includes a
plastic bag, a cardboard box, and an expanded polystyrene foam (i.e. Styrofoam) board. The cardboard box weighs 0.227 kg. The plastic
bags used for packaging are modeled as the same as those used during manufacturing (as discussed in Section 3.1.2). The weight and
dimensions of the expanded polystyrene foam board were estimated based on the dimensions of the cardboard box.
3.1.4 Plastic Bucket
Every new Ecofiltro user receives not only a water filter, but also a plastic bucket in which to retain the purified water. Therefore, the
production of a 20-liter, high-density polyethylene (HDPE) plastic bucket, along with a lid and spigot were included within the scope of
the product system. However, it is understood that consumers reuse the bucket for several years while replacing the ceramic filters every
two years; the bucket is estimated to last five years. The weight of this bucket was estimated based on weights of buckets with similar
characteristics. A 50 kilometer transportation distance from the bucket supplier to the manufacturing facility was used.
3.1.5 Transportation and Distribution
Ecofiltro delivers water filters to communities based on established need. The average distance filters are transported is estimated
by identifying the communities from Ecofiltro’s website who have received water filters from Ecofiltro in the past, and averaging their
distances to Antigua.
10
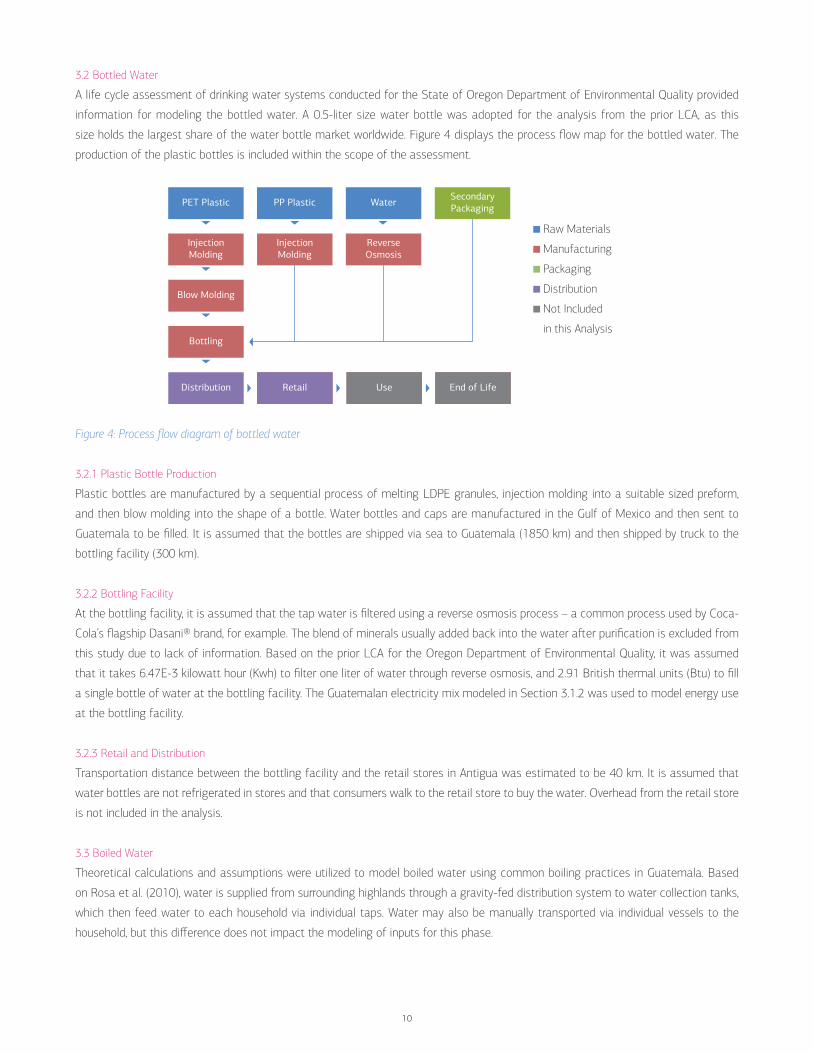
3.2 Bottled Water
A life cycle assessment of drinking water systems conducted for the State of Oregon Department of Environmental Quality provided
information for modeling the bottled water. A 0.5-liter size water bottle was adopted for the analysis from the prior LCA, as this
size holds the largest share of the water bottle market worldwide. Figure 4 displays the process flow map for the bottled water. The
production of the plastic bottles is included within the scope of the assessment.
Figure 4: Process flow diagram of bottled water
3.2.1 Plastic Bottle Production
Plastic bottles are manufactured by a sequential process of melting LDPE granules, injection molding into a suitable sized preform,
and then blow molding into the shape of a bottle. Water bottles and caps are manufactured in the Gulf of Mexico and then sent to
Guatemala to be filled. It is assumed that the bottles are shipped via sea to Guatemala (1850 km) and then shipped by truck to the
bottling facility (300 km).
3.2.2 Bottling Facility
At the bottling facility, it is assumed that the tap water is filtered using a reverse osmosis process – a common process used by Coca-
Cola’s flagship Dasani® brand, for example. The blend of minerals usually added back into the water after purification is excluded from
this study due to lack of information. Based on the prior LCA for the Oregon Department of Environmental Quality, it was assumed
that it takes 6.47E-3 kilowatt hour (Kwh) to filter one liter of water through reverse osmosis, and 2.91 British thermal units (Btu) to fill
a single bottle of water at the bottling facility. The Guatemalan electricity mix modeled in Section 3.1.2 was used to model energy use
at the bottling facility.
3.2.3 Retail and Distribution
Transportation distance between the bottling facility and the retail stores in Antigua was estimated to be 40 km. It is assumed that
water bottles are not refrigerated in stores and that consumers walk to the retail store to buy the water. Overhead from the retail store
is not included in the analysis.
3.3 Boiled Water
Theoretical calculations and assumptions were utilized to model boiled water using common boiling practices in Guatemala. Based
on Rosa et al. (2010), water is supplied from surrounding highlands through a gravity-fed distribution system to water collection tanks,
which then feed water to each household via individual taps. Water may also be manually transported via individual vessels to the
household, but this difference does not impact the modeling of inputs for this phase.
Raw Materials
Manufacturing
Packaging
Distribution
Not Included
in this Analysis
PET Plastic
Injection Molding
Injection Molding
Reverse Osmosis
PP Plastic
Bottling
Blow Molding
Retail Use End of LifeDistribution
Water Secondary Packaging
11
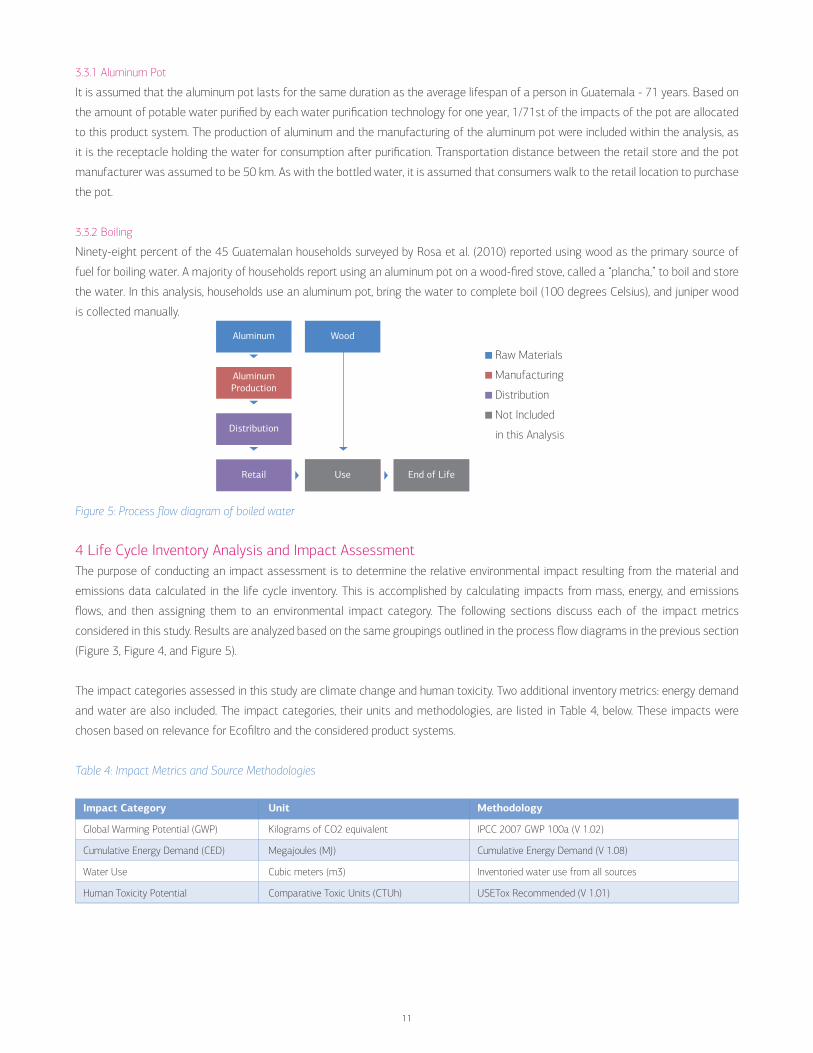
3.3.1 Aluminum Pot
It is assumed that the aluminum pot lasts for the same duration as the average lifespan of a person in Guatemala - 71 years. Based on
the amount of potable water purified by each water purification technology for one year, 1/71st of the impacts of the pot are allocated
to this product system. The production of aluminum and the manufacturing of the aluminum pot were included within the analysis, as
it is the receptacle holding the water for consumption after purification. Transportation distance between the retail store and the pot
manufacturer was assumed to be 50 km. As with the bottled water, it is assumed that consumers walk to the retail location to purchase
the pot.
3.3.2 Boiling
Ninety-eight percent of the 45 Guatemalan households surveyed by Rosa et al. (2010) reported using wood as the primary source of
fuel for boiling water. A majority of households report using an aluminum pot on a wood-fired stove, called a “plancha,” to boil and store
the water. In this analysis, households use an aluminum pot, bring the water to complete boil (100 degrees Celsius), and juniper wood
is collected manually.
Figure 5: Process flow diagram of boiled water
4 Life Cycle Inventory Analysis and Impact AssessmentThe purpose of conducting an impact assessment is to determine the relative environmental impact resulting from the material and
emissions data calculated in the life cycle inventory. This is accomplished by calculating impacts from mass, energy, and emissions
flows, and then assigning them to an environmental impact category. The following sections discuss each of the impact metrics
considered in this study. Results are analyzed based on the same groupings outlined in the process flow diagrams in the previous section
(Figure 3, Figure 4, and Figure 5).
The impact categories assessed in this study are climate change and human toxicity. Two additional inventory metrics: energy demand
and water are also included. The impact categories, their units and methodologies, are listed in Table 4, below. These impacts were
chosen based on relevance for Ecofiltro and the considered product systems.
Table 4: Impact Metrics and Source Methodologies
Impact Category Unit Methodology
Global Warming Potential (GWP) Kilograms of CO2 equivalent IPCC 2007 GWP 100a (V 1.02)
Cumulative Energy Demand (CED) Megajoules (MJ) Cumulative Energy Demand (V 1.08)
Water Use Cubic meters (m3) Inventoried water use from all sources
Human Toxicity Potential Comparative Toxic Units (CTUh) USETox Recommended (V 1.01)
Raw Materials
Manufacturing
Distribution
Not Included
in this Analysis
Aluminum Wood
Distribution
AluminumProduction
Use End of LifeRetail
12
4.1 Global Warming Potential (GWP)
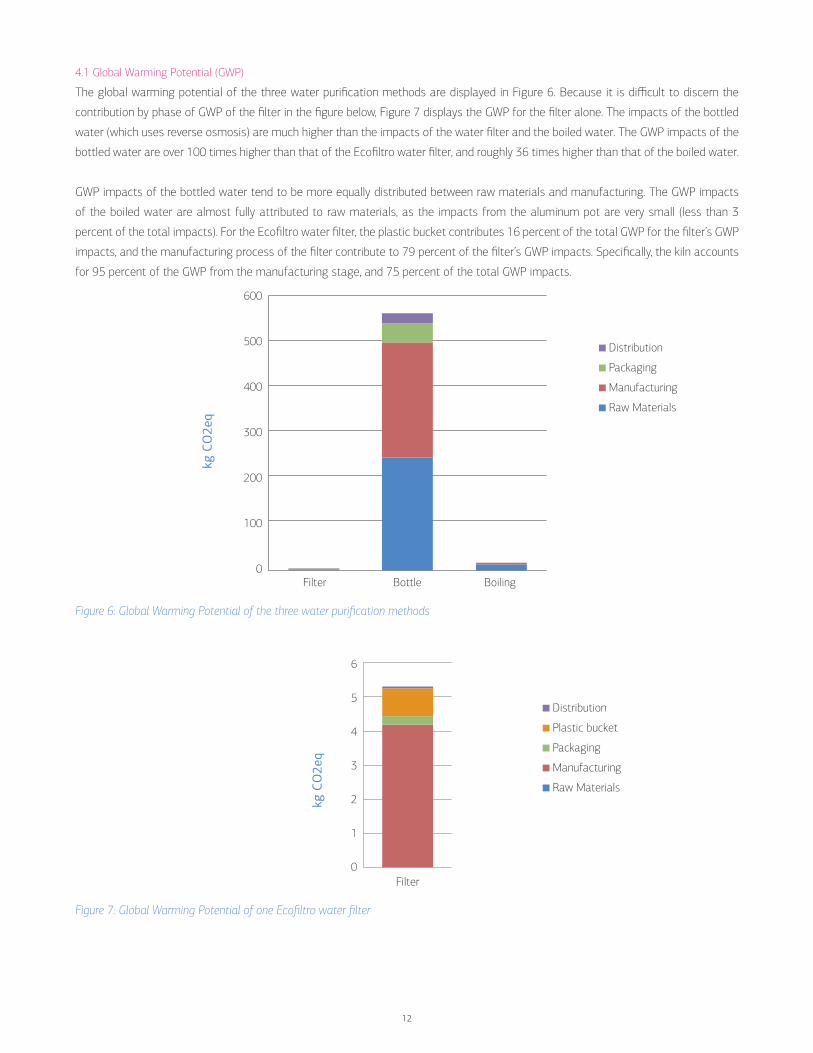
The global warming potential of the three water purification methods are displayed in Figure 6. Because it is difficult to discern the
contribution by phase of GWP of the filter in the figure below, Figure 7 displays the GWP for the filter alone. The impacts of the bottled
water (which uses reverse osmosis) are much higher than the impacts of the water filter and the boiled water. The GWP impacts of the
bottled water are over 100 times higher than that of the Ecofiltro water filter, and roughly 36 times higher than that of the boiled water.
GWP impacts of the bottled water tend to be more equally distributed between raw materials and manufacturing. The GWP impacts
of the boiled water are almost fully attributed to raw materials, as the impacts from the aluminum pot are very small (less than 3
percent of the total impacts). For the Ecofiltro water filter, the plastic bucket contributes 16 percent of the total GWP for the filter’s GWP
impacts, and the manufacturing process of the filter contribute to 79 percent of the filter’s GWP impacts. Specifically, the kiln accounts
for 95 percent of the GWP from the manufacturing stage, and 75 percent of the total GWP impacts.
Figure 6: Global Warming Potential of the three water purification methods
Figure 7: Global Warming Potential of one Ecofiltro water filter
Distribution
Packaging
Manufacturing
Raw Materials
600
500
400
300
200
100
0Filter Bottle Boiling
6
5
4
3
2
1
0Filter
Distribution
Plastic bucket
Packaging
Manufacturing
Raw Materials
kg C
O2e
q
kg C
O2e
q
13
4.2 Cumulative Energy Demand
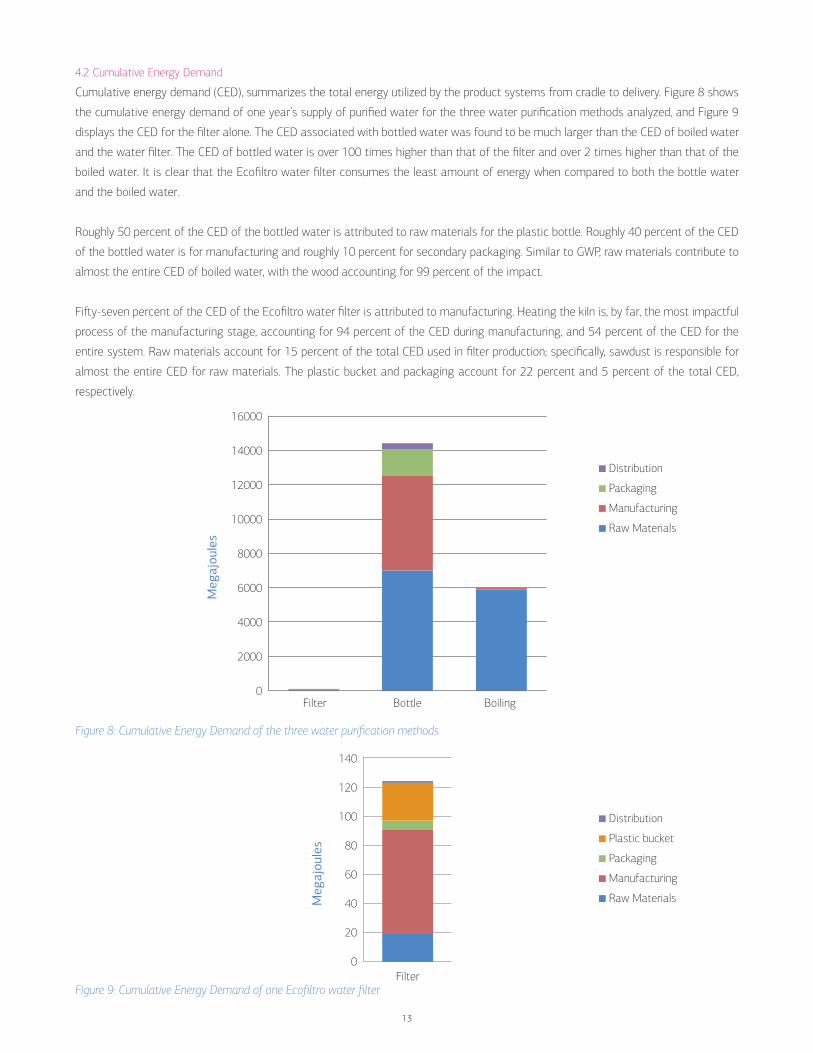
Cumulative energy demand (CED), summarizes the total energy utilized by the product systems from cradle to delivery. Figure 8 shows
the cumulative energy demand of one year’s supply of purified water for the three water purification methods analyzed, and Figure 9
displays the CED for the filter alone. The CED associated with bottled water was found to be much larger than the CED of boiled water
and the water filter. The CED of bottled water is over 100 times higher than that of the filter and over 2 times higher than that of the
boiled water. It is clear that the Ecofiltro water filter consumes the least amount of energy when compared to both the bottle water
and the boiled water.
Roughly 50 percent of the CED of the bottled water is attributed to raw materials for the plastic bottle. Roughly 40 percent of the CED
of the bottled water is for manufacturing and roughly 10 percent for secondary packaging. Similar to GWP, raw materials contribute to
almost the entire CED of boiled water, with the wood accounting for 99 percent of the impact.
Fifty-seven percent of the CED of the Ecofiltro water filter is attributed to manufacturing. Heating the kiln is, by far, the most impactful
process of the manufacturing stage, accounting for 94 percent of the CED during manufacturing, and 54 percent of the CED for the
entire system. Raw materials account for 15 percent of the total CED used in filter production; specifically, sawdust is responsible for
almost the entire CED for raw materials. The plastic bucket and packaging account for 22 percent and 5 percent of the total CED,
respectively.
Figure 8: Cumulative Energy Demand of the three water purification methods
Figure 9: Cumulative Energy Demand of one Ecofiltro water filter
Distribution
Plastic bucket
Packaging
Manufacturing
Raw Materials
Distribution
Packaging
Manufacturing
Raw Materials
16000
14000
12000
10000
8000
6000
4000
2000
0Filter Bottle Boiling
140
120
100
80
60
40
20
0Filter
Meg
ajou
les
Meg
ajou
les

14
4.3 Water Use
Water use accounts for all water consumed by the product systems, with the exception of the purified water that is to be consumed by
the consumer – as stated in Section 2.3. Figure 10 compares the total water use associated with one year’s supply of purified water
using the three water purification methods; water use for the Ecofiltro water filter can be seen in Figure 11.
As with cumulative energy demand and GWP, the amount of water used for the production of the bottled water is much higher than the
results of both the Ecofiltro water filter and boiled water. The majority (65 percent) of the water used in the cradle-to-delivery study
of the bottled water is attributed to manufacturing, followed by raw materials (35 percent) and secondary packaging (4 percent). The
amount of water used in the production of bottled water was found to be 500 times higher than an Ecofiltro water filter and 185 times
higher than boiled water.
Water use from producing boiled water was found to be roughly twice that of the Ecofiltro water filter. While almost all of the water
consumption from boiled water is attributed to the raw material aluminum, the Ecofiltro water filter has very little water use related to
raw materials. As displayed in Figure 11, roughly 40 percent of water use for the water filter is attributed to manufacturing. Specifically,
roughly half of the water used during manufacturing is associated with the electricity use at the filter manufacturing facility. Forty
percent of the total water use is associated with the plastic bucket, and 11 percent is from secondary packaging.
Figure 10: Water Use in production of the three water purification methods
Figure 11: Water Use for one Ecofiltro water filter
Distribution
Plastic bucket
Packaging
Manufacturing
Raw Materials
Distribution
Packaging
Manufacturing
Raw Materials
2500
2000
1500
1000
500
0Filter Bottle Boiling
4,5
4
3,5
3
2,5
2
1,5
1
0,5
0Filter
Wat
er (m
3)
Wat
er (m
3)
15
4.4 Human Toxicity Potential
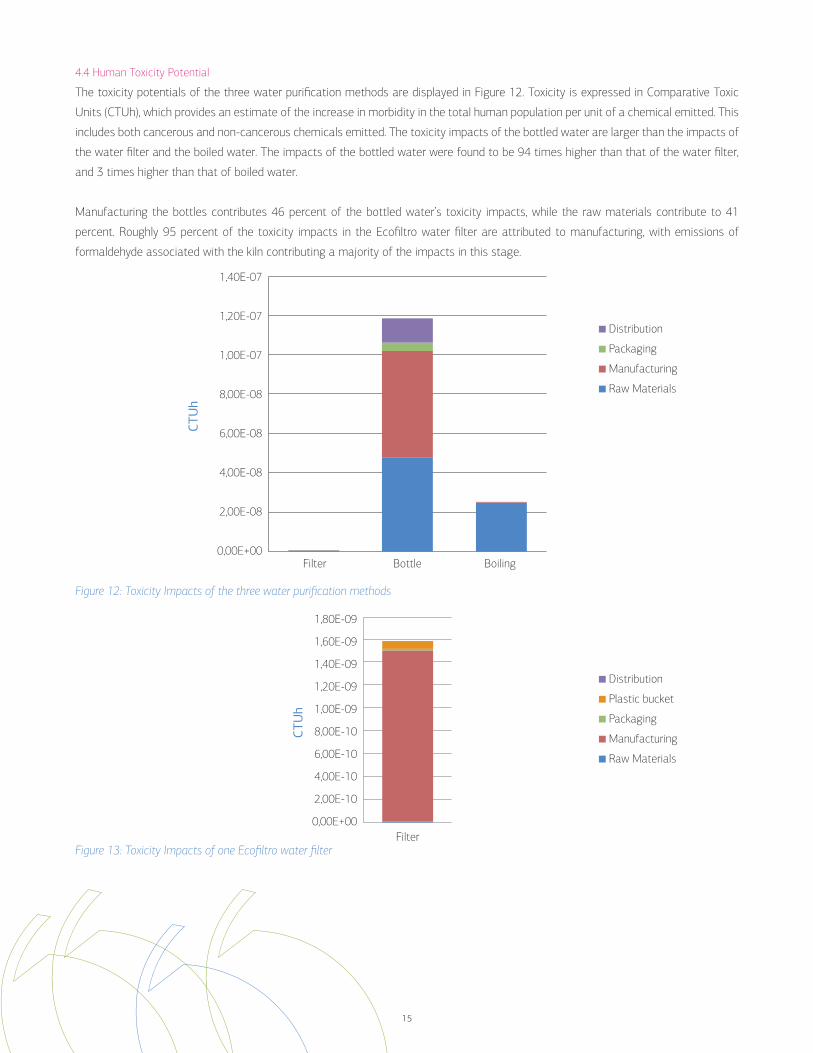
The toxicity potentials of the three water purification methods are displayed in Figure 12. Toxicity is expressed in Comparative Toxic
Units (CTUh), which provides an estimate of the increase in morbidity in the total human population per unit of a chemical emitted. This
includes both cancerous and non-cancerous chemicals emitted. The toxicity impacts of the bottled water are larger than the impacts of
the water filter and the boiled water. The impacts of the bottled water were found to be 94 times higher than that of the water filter,
and 3 times higher than that of boiled water.
Manufacturing the bottles contributes 46 percent of the bottled water’s toxicity impacts, while the raw materials contribute to 41
percent. Roughly 95 percent of the toxicity impacts in the Ecofiltro water filter are attributed to manufacturing, with emissions of
formaldehyde associated with the kiln contributing a majority of the impacts in this stage.
Figure 12: Toxicity Impacts of the three water purification methods
Figure 13: Toxicity Impacts of one Ecofiltro water filter
Distribution
Plastic bucket
Packaging
Manufacturing
Raw Materials
Distribution
Packaging
Manufacturing
Raw Materials
1,40E-07
1,20E-07
1,00E-07
8,00E-08
6,00E-08
4,00E-08
2,00E-08
0,00E+00Filter Bottle Boiling
1,80E-09
1,60E-09
1,40E-09
1,20E-09
1,00E-09
8,00E-10
6,00E-10
4,00E-10
2,00E-10
0,00E+00Filter
CTU
h
CTU
h
16
4.5 Summary
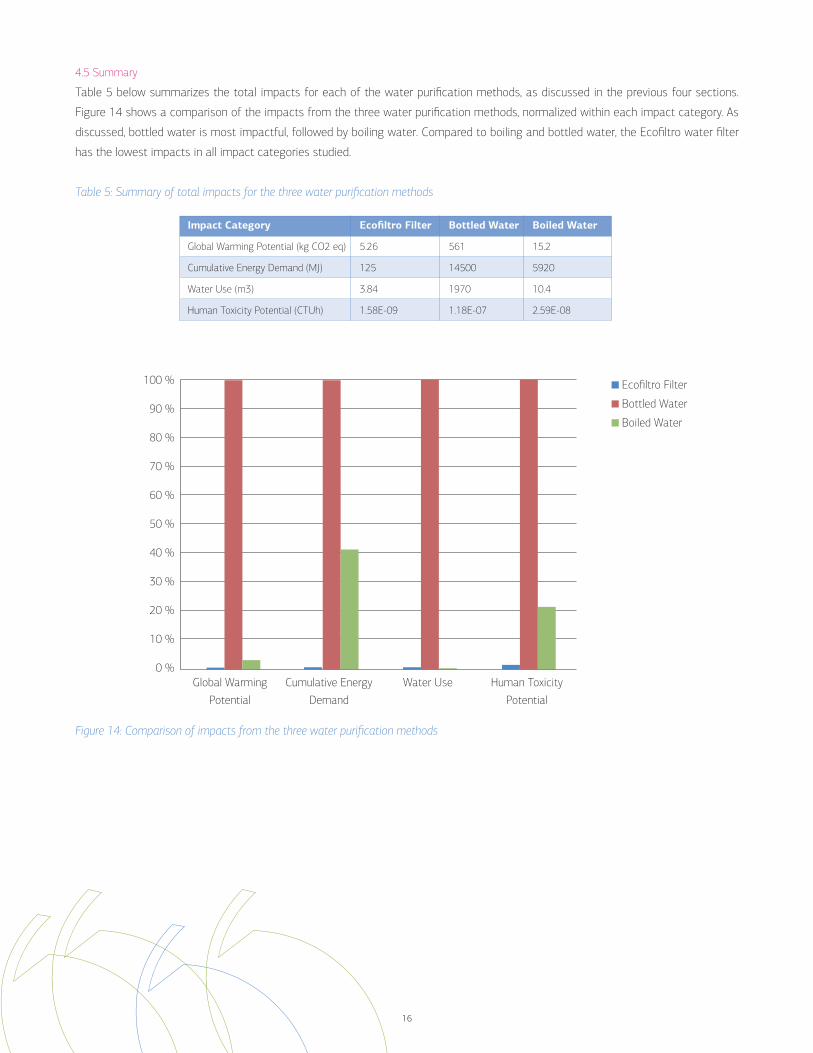
Table 5 below summarizes the total impacts for each of the water purification methods, as discussed in the previous four sections.
Figure 14 shows a comparison of the impacts from the three water purification methods, normalized within each impact category. As
discussed, bottled water is most impactful, followed by boiling water. Compared to boiling and bottled water, the Ecofiltro water filter
has the lowest impacts in all impact categories studied.
Table 5: Summary of total impacts for the three water purification methods
Figure 14: Comparison of impacts from the three water purification methods
Impact Category Ecofiltro Filter Bottled Water Boiled Water
Global Warming Potential (kg CO2 eq) 5.26 561 15.2
Cumulative Energy Demand (MJ) 125 14500 5920
Water Use (m3) 3.84 1970 10.4
Human Toxicity Potential (CTUh) 1.58E-09 1.18E-07 2.59E-08
Ecofiltro Filter
Bottled Water
Boiled Water
100 %
90 %
80 %
70 %
60 %
50 %
40 %
30 %
20 %
10 %
0 %Global Warming
Potential
Cumulative Energy
Demand
Water Use Human Toxicity
Potential

17
5 InterpretationA cradle-to-delivery life cycle assessment was performed to compare the environmental impacts of three water purification technologies
in Guatemala. The cradle-to-delivery environmental impacts of bottled water dominate the impacts of the water filter and boiled water,
both individually and combined. The results clearly indicate that the Ecofiltro water filter has the least amount of environmental impacts,
when compared to the bottled and boiled water.
The manufacturing of the Ecofiltro water filter is the major contributor to the aforementioned impacts and inventory indicators because
of the energy consumed during the manufacturing process. The plastic bucket is also evident as a contributor to global warming
potential, cumulative energy demand, and water use. While the environmental impacts of Ecofiltro’s water filter are minimal compared
to its alternatives, there are various measures that Ecofiltro can undertake to further reduce its environmental impacts. For example,
the use of renewable energy, especially solar energy, during the manufacturing process, as well as an improvement in the current failure
rate (35 percent) of the filters could help to achieve this goal.
The kiln used to bake the filter is a significant source of environmental impacts to the product system, relative to the other production
stages. Ecofiltro has recently switched from a wood-fired kiln to a kiln fueled by propane gas. While this update increased the overall
carbon emissions associated with the production of one filter, this analysis does not take into consideration other benefits of making
this update, such as preservation of forests and other land use impacts associated with harvesting wood. In order to decrease the
impacts such as global warming potential and cumulative energy demand from the updated propane kiln system, improving the kiln’s
heating efficiency should be explored. However, it is important to keep in mind that the total impacts of the filter are very small overall.
Additionally, the use of bio-plastics as an alternative to the petroleum-based plastics now used has a potential to reduce impacts
associated with global warming potential, cumulative energy demand, and water use.
Overall, the Ecofiltro water filter has the lowest environmental impacts when compared to other water purification methods such as
bottled water and boiled water. Even so, there are several opportunities for Ecofiltro to further reduce its environmental impacts and
to maintain its sustainability advantage.
18
6 References
Adjorlolo, Eric and Silpa Kaza (2007). Design of Fuel Efficient Brick Kiln for Ceramic Water Filter Firing in Ghana.
California Energy Commission. Consumer Energy Center. Firewood. <http://www.consumerenergycenter.org/home/heating_cooling/
firewood.html>
The Ceramics Manufacturing Working Group (2011). Best Practice Recommendations for Local Manufacturing of Ceramic Pot Filters
for Household Water Treatment, Ed. 1. Atlanta, GA, USA: CDC.
CIA World Factbook. Guatemala. Last updated 13 February 2013. Accessed 18 March 2013. <https://www.cia.gov/library/publications/
the-world-factbook/geos/gt.html>
Elmore, Andrew Curtis et al. (2009). Ecofiltro’s Ceramic Pot Filter Experience in Guatemala. WEF Disinfection 2009.
Franklin Associates for the State of Oregon Department of Environmental Quality (2009). Life Cycle Assessment of Drinking Water
Systems: Bottle Water, Tap Water, and Home/Office Delivery Water.
Hagan, J.M., Harley, N., Pointing, D., Sampson, M., Smith, K., and Soam, V. 2009, Resource Development International - Cambodia Ceramic
Water Filter Handbook - Version 1.1, Phnom Penh, Cambodia.
Howard, Guy (2003). Domestic Water Quantity, Service, Level, and Health. World Health Organization.<http://www.who.int/water_
sanitation_health/diseases/WSH03.02.pdf>
Insituto Nacional de Estadistica, Guatemala, C.A. (2011). Pobreza y Desarrollo: Un Enfoque Departamental. <http://www.ine.gob.gt/np/
encovi/documentos/Pobreza%20y%20Desarrollo%202011.pdf>
International Energy Agency. Electricity/Heat in Guatemala in 2009. <http://www.iea.org/stats/electricitydata.asp?COUNTRY_CODE=GT>
My Spring Water. Leading Water Brands. So, what are you drinking? <http://www.myspringwater.com/SpringWaterInformation/
LeadingWaterBrands.aspx>
Nardo, Richard (2005). Factory Startup Manual: For the Production of Ceramic Water Filters.
Oyanedel-Craver, Vinka A and James A Smith (2008). Sustainable Colloidal-Silver-Impregnated Ceramic Fiilter for Point-Of-Use Water
Treatment. Environmental Science & Technology, 44 (3): 927-933.
Rayer, Justine (2009). Current Practices in Manufacturing of Ceramic Pot Filters for Water Treatment.
Rosa, Ghislaine, Laura Miller, and Thomas Clasen (2010). Microbiological Effectiveness of Disinfecting Water by Boiling in Rural
Guatemala. American Journal Tropical Medicine and Hygiene 82(3) 473-477.
Veblen, Thomas T. Guatemalan conifers. FAO Corporate Document Repository. <http://www.fao.org/docrep/l2015e/l2015e05.htm_>
19
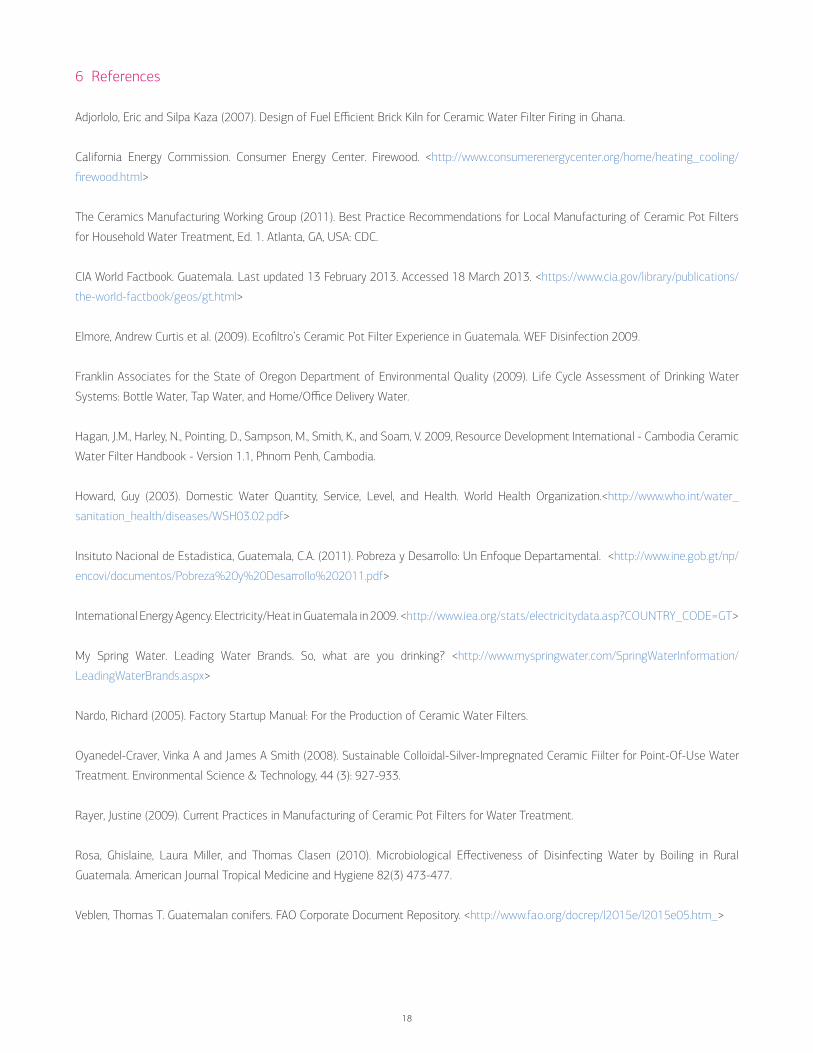
7 Appendix
7.1 Summary of Assumptions
Material/Process/Product Assumption
One Ecofiltro water filter
Raw Materials
Clay 4.5 kg clay
Sourced from Rabinal Baja Verapaz (118 km transport distance)
Sawdust 0.54 kg sawdust
Sourced from Purulhá and La Cumbre en las Verapaces (average 141 km transport distance)
Density of the sawdust is 210 kg/m3
Colloidal silver Sourced from the Peten region in Northern Guatemala
Contains 0.002 grams of silver and 200 mL of water
Water 1.8 liters water
Manufacturing
Hammer mill 3.7 kw hammer mill used to grind clay
Clay mixer 1.5 horsepower mortar mixer used for 8 minutes for 1 batch of clay
Extruder 11 kw extruder used for 1 minute
Filter Press Manually operated
Kiln Gas fired kiln, heat required per filter is 67,656 btu
Plastic Bag 1.5 mil (0.0015 inch) LDPE plastic bag used
Plastic bag weighs 0.031 kg
Packaging 50 km transport distance for all packaging
0.025 kg of Styrofoam
Same size plastic bag used in manufacturing is also used for packaging
Water 10 liters of water used for flow rate testing
Plastic Bucket
Bucket, lid, spigot 20 liter HDPE plastic bucket is 1000 grams, lid is 260 grams, spigot is 45 grams, all manufactured through injection moulding
All parts last for 5 years
50 km transport distance
20
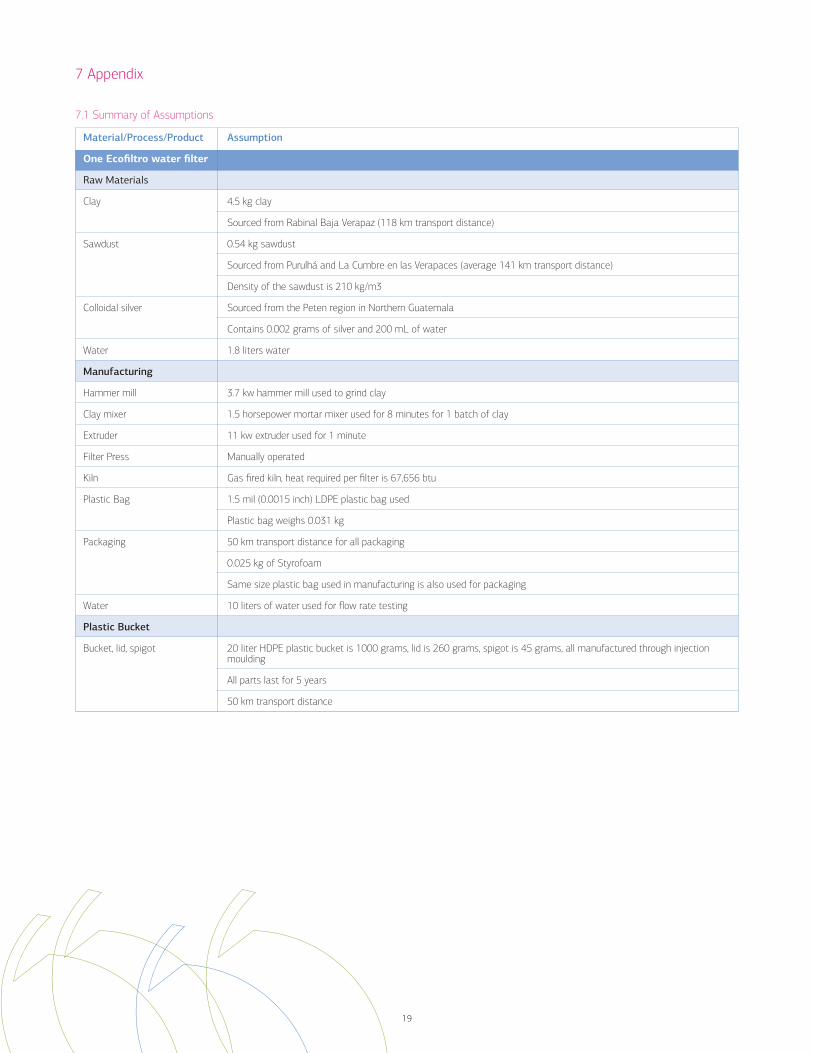
Material/Process/Product Assumption
One half-liter bottle of water
Materials Manufacturing
Bottles 13.3 grams PET plastic
Blow moulded, then injection moulded
Shipped from Gulf to Guatemala in 2.01 grams of cardboard per 1 bottle
Cap 1.6 grams polypropylene plastic
Injection moulded
Bottling Facility
Filling bottles 2.91 btus used to fill bottle
Packaging 1.41 grams LDPE film overwrap
2.01 grams cardboard
Water 500 grams of treated water
0.0064 kwh energy used for reverse osmosis
Retail/Distribution
Transport Full bottles are transported from bottling facility to Antigua, Guatemala by truck (40 km)
Energy Not refrigerated at retail phase
Consumers walk to retailer and do not refrigerate water
Boiled water
Boiling Wood for fuel is collected on foot
1404 KJ of heat from wood used to boil 1 liter of water at a 25% heating efficiency rate
Aluminum pot 1.80 kg 10 quart pot used for boiling
Transport from manufacturer to retail is 50 km
Consumers walk to retailer
Pot is used for 71 years (life expectancy in Guatemala)
21
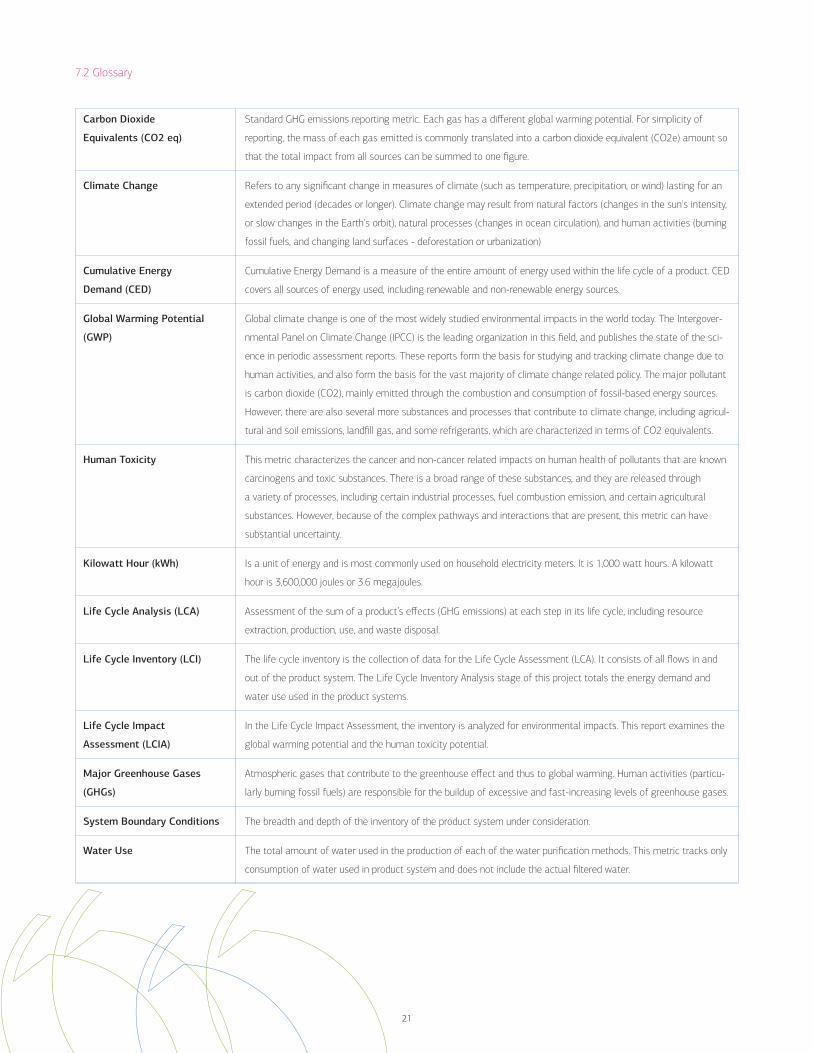
7.2 Glossary
Carbon Dioxide
Equivalents (CO2 eq)
Climate Change
Cumulative Energy
Demand (CED)
Global Warming Potential
(GWP)
Human Toxicity
Kilowatt Hour (kWh)
Life Cycle Analysis (LCA)
Life Cycle Inventory (LCI)
Life Cycle Impact
Assessment (LCIA)
Major Greenhouse Gases
(GHGs)
System Boundary Conditions
Water Use
Standard GHG emissions reporting metric. Each gas has a different global warming potential. For simplicity of
reporting, the mass of each gas emitted is commonly translated into a carbon dioxide equivalent (CO2e) amount so
that the total impact from all sources can be summed to one figure.
Refers to any significant change in measures of climate (such as temperature, precipitation, or wind) lasting for an
extended period (decades or longer). Climate change may result from natural factors (changes in the sun's intensity,
or slow changes in the Earth's orbit), natural processes (changes in ocean circulation), and human activities (burning
fossil fuels, and changing land surfaces - deforestation or urbanization)
Cumulative Energy Demand is a measure of the entire amount of energy used within the life cycle of a product. CED
covers all sources of energy used, including renewable and non-renewable energy sources.
Global climate change is one of the most widely studied environmental impacts in the world today. The Intergover-
nmental Panel on Climate Change (IPCC) is the leading organization in this field, and publishes the state of the sci-
ence in periodic assessment reports. These reports form the basis for studying and tracking climate change due to
human activities, and also form the basis for the vast majority of climate change related policy. The major pollutant
is carbon dioxide (CO2), mainly emitted through the combustion and consumption of fossil-based energy sources.
However, there are also several more substances and processes that contribute to climate change, including agricul-
tural and soil emissions, landfill gas, and some refrigerants, which are characterized in terms of CO2 equivalents.
This metric characterizes the cancer and non-cancer related impacts on human health of pollutants that are known
carcinogens and toxic substances. There is a broad range of these substances, and they are released through
a variety of processes, including certain industrial processes, fuel combustion emission, and certain agricultural
substances. However, because of the complex pathways and interactions that are present, this metric can have
substantial uncertainty.
Is a unit of energy and is most commonly used on household electricity meters. It is 1,000 watt hours. A kilowatt
hour is 3,600,000 joules or 3.6 megajoules.
Assessment of the sum of a product’s effects (GHG emissions) at each step in its life cycle, including resource
extraction, production, use, and waste disposal.
The life cycle inventory is the collection of data for the Life Cycle Assessment (LCA). It consists of all flows in and
out of the product system. The Life Cycle Inventory Analysis stage of this project totals the energy demand and
water use used in the product systems.
In the Life Cycle Impact Assessment, the inventory is analyzed for environmental impacts. This report examines the
global warming potential and the human toxicity potential.
Atmospheric gases that contribute to the greenhouse effect and thus to global warming. Human activities (particu-
larly burning fossil fuels) are responsible for the buildup of excessive and fast-increasing levels of greenhouse gases.
The breadth and depth of the inventory of the product system under consideration.
The total amount of water used in the production of each of the water purification methods. This metric tracks only
consumption of water used in product system and does not include the actual filtered water.

Please contact us for further information:
United StatesPRé North America Inc.20 F Street NW7th FloorWashington, DC 20001USA
Phone: +1 202 507 [email protected]
The NetherlandsPRé Consultants bvPrinterweg 183821 AD AmersfoortThe Netherlands
Phone: +31 33 4540 [email protected]
We look forward to being your partner in putting the metrics behind sustainability.
pre-sustainability.com
The PRé Portfolio — Tools for Actionable Sustainability PRé has led the way in the sustainability arena for more than two decades, contributing greatly
to the field of product and supply chain sustainability. PRé is a leader and innovator in conducting
comprehensive sustainability analyses founded on measureable and meaningful metrics.
PRé offers a variety of services to guide you on the road to sustainability, from landscaping
workshops and stakeholder engagement to sector trend analyses relevant to your industry.
Depending on your needs, PRé can provide you with life cycle studies, from brief screening Life
Cycle Assessments (LCA) to comprehensive and ISO compliant LCAs, supply chain impact scans,
and product footprinting analyses.
PRé’s team has extensive experience in the development of industry standards and initiatives
such as the Greenhouse Gas Protocol, The Sustainability Consortium, ISO standards for carbon
and water footprinting, United Nations Environment Programme (UNEP), and the Global Reporting
Initiative (GRI). With our industry-specific knowledge, we provide our clients with the relevant
metrics and tools to map out a clear path to success.
PRé is the developer of SimaPro, the world’s leading LCA software. We also offer the product
evaluation web tool SimaPro Easy, which provides quick insight into your product sustainability
performance and can be deployed across teams and locations.
Internationally, leading businesses work with PRé to integrate sustainability into their product
development procedures in order to create business value. PRé has offices in the United States and
the Netherlands, plus a global partner network to support large international or multiclient projects.
Get in Touch with PRéWould you like to discuss your sustainability challenges with us? In the U.S., please contact us
at +1 202 507 6231 or via email at [email protected]. Outside the U.S., contact us
at +31 33 450 4010 or email [email protected].
Find out more about what we can do for your organization at pre-sustainability.com