Embed Size (px)
Citation preview
A COMPARATIVE STUDY OF ISSUES AND
CHALLENGES IN REDUCING NON REVENUE
WATER RATES IN PULAU PINANG AND
PERLIS, MALAYSIA
LAI CHEE HUI
UNIVERSITI SAINS MALAYSIA
2016
A COMPARATIVE STUDY OF ISSUES AND
CHALLENGES IN REDUCING NON REVENUE
WATER RATES IN PULAU PINANG AND
PERLIS, MALAYSIA
by
LAI CHEE HUI
Thesis submitted in fulfilment of the requirements
for the degree of
Master of Arts
September 2016
ii
ACKNOWLEDGEMENT
Many people have contributed in many ways towards the completion of this thesis. I
owe my gratitude to all who have made this thesis possible and who have made my study
experience one that I will cherish forever.
I would like to express my sincere gratitude to my supervisor, Professor Dr. Chan
Ngai Weng for his patience, motivation, enthusiasm, and valuable guidance throughout my
graduate programme. His teaching and guidance helped me overcome many problems
throughout my study period. I hope that one day I would become a good supervisor and
mentor to my students as he has been to me.
My gratitude also goes to Dr. Ranjan Roy, Dr. Hong Chern Wern, Phang Wai Leng,
Ong Ke Shin, and other friends and schoolmates from Universiti Sains Malaysia for their
suggestions, assistance, and for all the fun we have had together in the last three years. It
would have been a lonely university life without all of them.
Many other friends have also helped me stay sane through these difficult years.
Their support and care helped me overcome setbacks and stay focused on my graduate study.
I greatly value their friendship and I deeply appreciate their belief in me.
Most of all, none of this would have been possible without the love, patience and
support of my family. Every member of my family has been a constant source of love,
concern, support and strength all these years. I would like to express my heart-felt gratitude
to my family for their endless love and unfailing support in pursuing my pursuit of the
master degree in Universiti Sains Malaysia.
iii
TABLE OF CONTENTS
Page
Acknowledgement ii
Table of Contents iii
List of Tables vii
List of Figures viii
List of Abbreviations x
Abstrak xii
Abstract xiv
CHAPTER ONE INTRODUCTION
1.1 Research Background 1
1.2 Problem Statement 3
1.3 Research Questions 4
1.4 Research Aim 5
1.5 Research Objectives 5
1.6 Significance of the Study 5
1.7 Scope of the Study 6
1.8 Organisation of Thesis Chapters 7
CHAPTER TWO LITERATURE REVIEW
2.1 Non- Revenue Water and its Components 8
2.2 Benefits of Low Non- Revenue Water 10
2.3 Factors Influencing Non- Revenue Water 10
2.3.1 The Phnom Penh Experience, Cambodia 12
2.3.2 The Manila Experience, Philippines 13
iv
2.3.3 Summary of the Factors Influencing NRW Reduction 14
2.4 Non- Revenue Reduction Strategy 16
2.4.1 Real Loss Reduction Strategy 16
2.4.2 Active Leakage Control 18
2.4.3 Apparent Loss Reduction Strategy 19
2.5 Malaysia’s Non-Revenue Water Management 21
2.5.1 History of Malaysia’s Non-Revenue Water Management 21
2.5.2 Water Reforms Restructuring in Malaysia 22
2.5.3 Malaysia’s Non-Revenue Water Management after Water
Restructuring
23
2.6 Stakeholders Involvement in Non-Revenue Water Management 24
2.6.1 Stakeholders’ Partnership of NRW Reduction Programme in Kenya 26
2.7 Public Participation in Non-Revenue Water Management 26
2.7.1 Model of Water-Related Behaviour 27
2.7.2 Public Perception on Non-Revenue Water Management 28
2.8 Conceptual Framework 29
CHAPTER THREE METHODOLOGY
3.1 A Mixed Methodology of Study 32
3.2 Study Areas 33
3.3 Water Service Providers of Study Areas 33
3.4 Secondary Data 34
3.5 Field Observations 35
3.6 In-depth Qualitative Interview 35
3.7 Questionnaire Survey 36
3.8 Data Collection and Sampling Size 37
3.9 Data Analysis Method 39
v
3.9.1 Quantitative Data 39
3.9.2 Qualitative Data 40
3.10 Summary 40
CHAPTER FOUR RESULTS AND DISCUSSION
4.1 Malaysia’s NRW Management, Issues and Challenges 42
4.1.1 NRW Reduction in Malaysia 42
4.1.2 Causes of High NRW Rates in Malaysia 44
4.1.3 Results of In-depth Interviews on Major Factors of High NRW in
Malaysia
48
4.1.3(a) Financial Capacity in Reducing NRW 48
4.1.3(b) Performance of the Main Water Stakeholder (the Water
Service Provider) in Reducing NRW
50
4.1.3(c) Public Participation in Reducing NRW 52
4.1.3(d) Other Factors that Affect Malaysia’s NRW Reduction 54
4.1.4 Discussion on the Reasons for High NRW Rate in Malaysia 55
4.2 Comparison of Non-Revenue Water Management in Pulau Pinang and Perlis 58
4.2.1 Water Balance and Elements of NRW in Pulau Pinang and Perlis 58
4.2.2 Non-Revenue Water Reduction Strategies in Pulau Pinang and Perlis
State
61
4.2.3 Operation and Financial Performance Indicators of PBAPP and Water
Supply Department of JKR Perlis
68
4.2.4 Discussion of the Non- Revenue Water Management in Pulau Pinang
and Perlis
72
4.2.4(a) NRW Causes in Pulau Pinang and Perlis 72
4.2.4(b) NRW Reduction Strategy in Pulau Pinang and Perlis 73
4.2.4(c) Operation and Financial Performance of PBAPP and Water 76
vi
Supply Department of JKR Perlis
4.3 Public Perception of Non- Revenue Water Management in Pulau Pinang and
Perlis
78
4.3.1 Respondent’s profile 78
4.3.2 Public Awareness of the Non-Revenue Water Issue 79
4.3.3 Public Perception of Non-Revenue Water Reduction 83
4.3.4 Public Concern and Action towards Non-Revenue Water Reduction 85
4.3.5 Discussion of Results on Public Perception of Non-Revenue Water
Issue in Malaysia
90
4.3.6 Summary of Results on Public Involvement in Malaysia’s NRW
Management
92
CHAPTER FIVE CONCLUSION
5.1 Conclusion on NRW Situation in Malaysia 94
5.2 Conclusion on NRW Reduction Strategies in Pulau Pinang and Perlis State 95
5.3 Conclusion on Public Involvement in NRW Reduction 96
5.4 Developing a Comprehensive Non-Revenue Water Management Framework 97
5.5 Limitations and Recommendations of the Study 100
5.6 Overall Conclusions and the Way Forward 102
REFERENCES 105
APPENDIX 1 Questionnaire 113
APPENDIX 2 Questions for Qualitative Interview with Water Stakeholders 116
APPENDIX 3 Checklist for Identifying NRW Reduction Strategies
Implemented by WSP
117
APPENDIX 4 Results of Chi-square Test 118
LIST OF PUBLICATIONS 126
vii
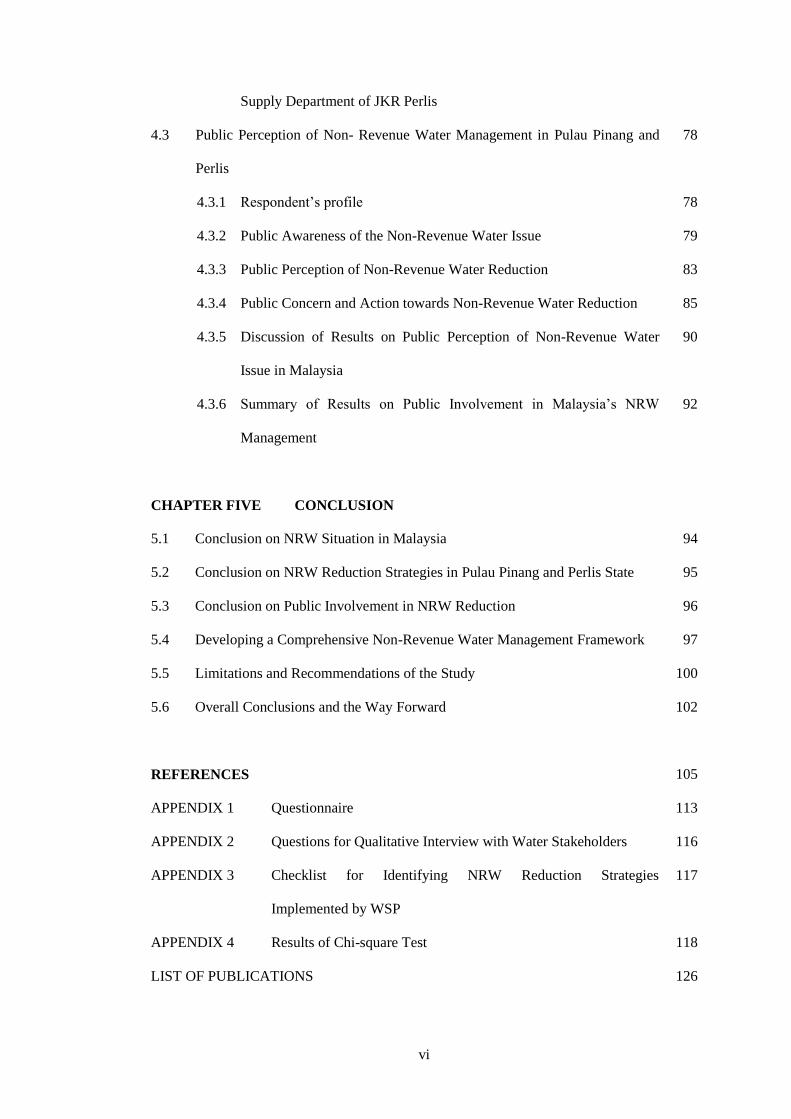
LIST OF TABLES
Page
Table 2.1 States that signed water restructuring agreement with signed year
22
Table 3.1 List of interviewees
36
Table 4.1 Malaysia’s NRW rates, total pipe length, proportion of AC pipe,
number of meter and the proportion of meter older than seven years
from 2001 to 2013
43
Table 4.2 Detailed NRW Rates of all the states in 2013
45
Table 4.3 General Water Statistic of Pulau Pinang and Perlis
59
Table 4.4 NRW-Related Key Performance Indicators in 2013 in Pulau Pinang
and Perlis
61
Table 4.5 Findings of Real Loss Reduction Strategy in Pulau Pinang and Perlis
63
Table 4.6 Findings of the Apparent Loss Reduction Strategy in Pulau Pinang
and Perlis
67
Table 4.7 Operation Performance Indicators of PBAPP and Water Supply
Department of JKR Perlis
69
Table 4.8 Financial Performance Indicators of PBAPP and Water Supply
Department of JKR Perlis in 2013
71
Table 4.9 Respondent’s Profile
79
Table 4.10 Perception of the major water issues in Malaysia
81
Table 4.11 Public perception of the stakeholder’s responsibility in reducing
water loss
85
viii
LIST OF FIGURES
Page
Figure 2.1 International Water Association (IWA) Standard International
Water Balance and Terminology
9
Figure 2.2 Factors influencing NRW reduction
15
Figure 2.3 NRW reduction strategies and its’ indicators
21
Figure 2.4 Conceptual model for water-related behaviours
28
Figure 2.5 Factors influencing public participation in reducing NRW
29
Figure 2.6 Conceptual framework of developing a NRW management
framework
31
Figure 3.1
Selected sampling locations for George Town, Pulau Pinang 38
Figure 3.2
Selected sampling locations for Kangar, Perlis. 39
Figure 3.3 Research flow chart
41
Figure 4.1 Proportion of the state’s NRW volume in Malaysia’s total volume
of NRW in 2013
47
Figure 4.2 NRW Rates of all Malaysia’s States in 2006 and 2013
47
Figure 4.3 NRW Rates in Malaysia’s States in 2013
58
Figure 4.4 NRW Rates in Perlis and Pulau Pinang from 2006 to 2013
60
Figure 4.5 Volume of NRW in Pulau Pinang and Perlis State in 2013
60
Figure 4.6 Leak detection activity is conducted by NRW reduction unit of
PBAPP to detect underground leak at George Town, Pulau Pinang
64
Figure 4.7 PBAPP’s repairing team operated in the early morning to repair a
reported pipe leak issue at George Town, Pulau Pinang
65
Figure 4.8 A paper placed in the customer service desk of Water Supply
Department of JKR Perlis shows “any request about new
installation and replacement of meter is not permitted at this
moment because meter is currently not available”
68
Figure 4.9 Public responses regarding the knowledge of NRW
80
Figure 4.10 Public perception of the seriousness of water loss issue in Malaysia
82
Figure 4.11 Public perception of the seriousness of water loss issue in
respondents’ own living state
82
Figure 4.12 Public preference of the solution in solving Malaysia’s water supply 83
ix
issue
Figure 4.13 Self-responsibility towards water loss issue
84
Figure 4.14 Public concern of the pipe leaking and pipe burst issue
86
Figure 4.15 Public concern of the meter inaccuracy issue
86
Figure 4.16 Public concern of the illegal water use issue
87
Figure 4.17 Public experience of seeing pipe leaking or pipe burst by the road
88
Figure 4.18 Public behaviour towards pipe leaking or pipe burst issue
88
Figure 4.19 Percentage of respondents that saved phone number of water
service provider in their mobile phone
89
Figure 4.20 Action towards pipe leaking or pipe burst issue
89
Figure 5.1 NRW Management Framework for Improving WSP’s Performance
in Reducing NRW
100
x
LIST OF ABBREVIATIONS
AC Asbestos Cement
ALC Active Leakage Control
ALR Awareness, Location, and Repair
AWER Association of Water and Energy Research Malaysia
CAPEX Capital Expenditure
DMA District Metering Area
GIS Geographic Information System
IWA International Water Association
IWRM Integrated Water Resource Management
JKR Jabatan Kerja Raya
KETTHA Kementerian Tenaga, Teknologi Hijau dan Air
KPI Key Performance Indicator
MLD Million Litre per Day
MWA Malaysian Water Association
MWIG Malaysia Water Industry Guide
NGO Non-Governmental Organisation
NRW Non-Revenue Water
OPEX Operation Expenditure
PAAB Pengurusan Aset Air Berhad
PBAPP Perbadanan Bekalan Air Pulau Pinang
PLC Passive Leakage Control
PPWSA Phnom Penh Water Supply Authority
PRV Pressure Reducing Valve
SPAN Suruhanjaya Perkhidmatan Air Negara
SPSS Statistical Package for the Social Sciences

xi
SYABAS Syarikat Bekalan Air Selangor Sdn Bhd
WSIA Water Service Industry Act
WSP Water Service Provider
xii
KAJIAN PERBANDINGAN ISU DAN CABARAN DALAM PENGURANGAN
KADAR AIR TIDAK BERHASIL DI PULAU PINANG DAN PERLIS, MALAYSIA
ABSTRAK
Di Malaysia, ketidakupayaan negeri-negeri dalam pengurangan kadar Air Tidak
Berhasil (NRW) telah memberi kesan negatif terhadap negara dalam pengurusan air. Tujuan
kajian adalah untuk mengenal pasti isu-isu dan cabaran yang dihadapi oleh pembekal
perkhidmatan air (PPA) di Malaysia dalam pengurangan kadar NRW di negeri masing-
masing. Satu penyelesaian yang mempertimbangkan pelbagai faktor-faktor dalam
pengurangan NRW telah dicipata dalam kajian ini. Kaedah campuran yang mengabungkan
kaedah kualitatif dan kaedah kuantitatif telah digunakan dalam kajian ini. Kedua-dua faktor
dalaman dan luaran yang mempengaruhi prestasi PPA dalam proses pengurangan NRW telah
dikaji dengan membandingkan pengurusan NRW di Pulau Pinang (kadar NRW yang
terendah) dan Perlis (kadar NRW yang tertinggi) melalui temubual kualitatif dan
pemerhatian. Persepsi orang awam dan penglibatan mereka dalam pengurangan NRW juga
dikaji melalui soal selidik. Keputusan menunjukkan bahawa kehilangan fizikal (real loss)
dan kehilangan komersil (apparent loss) merupakan dua elemen utama yang menyebabkan
kadar NRW tinggi di banyak negeri di Malaysia. Minat unit pengurusan, sumber manusia,
kemampuan kewangan, dan kapasiti teknikal sesuatu PPA dalam pengurangan NRW telah
dikenali sebagai faktor-faktor dalaman yang mempengaruhi sesuatu PPA dalam
mengurangkan NRW. Bagi faktor luaran, penglibatan pihak berkepentingan, penglibatan
orang awam, dan dasar pengurangan NRW yang komprehensif dikenalpasti sebagai faktor
penting. Dalam perbandingan pengurangan NRW di Pulau Pinang dan Perlis, strategi
pengurangan NRW di Pulau Pinang telah meliputi kedua-dua strategi pencegahan
(preventive) dan asas (basic) yang boleh mengelakkan kerugian NRW. Sebaliknya, strategi
pengurangan NRW yang digunakan oleh Perlis hanya strategi asas yang boleh
menyelesaikan isu-isu NRW apabila ia dijumpai dan dilaporkan. Di samping itu, kajian ini
xiii
juga mendapati bahawa penglibatan orang awam dalam pengurangan NRW di Pulau Pinang
dan Perlis masih rendah dan perlu ditingkatkan. Ini adalah sebab kebanyakan responden dari
kedua-dua negeri itu tidak mempunyai pengetahuan, kesedaran, dan persepsi yang baik
mengenai isu NRW. Kedua-dua Pulau Pinang dan Perlis masih perlu melakukan banyak
kerja supaya orang awam boleh dilibatkan dalam mengurangkan NRW. Berdasarkan
keputusan kajian, cadangan untuk memperbaiki pengurusan NRW di kedua-dua negeri Pulau
Pinang dan Perlis telah dibuat. Akhir sekali, kajian ini menyimpulkan bahawa pengurangan
NRW memerlukan sumbangan daripada semua pihak yang berkaitan. Satu rangka kerja
pengurusan NRW yang menyeluruh akhirnya telah dicadangkan sebagai penyelesaian bagi
PPA dalam mengurangkan NRW. Rangka kerja ini membekalkan suatu strategi pengurusan
komprehensif yang lebih baik mengenai bagaimana prestasi PPA dalam mengurangkan
NRW boleh ditingkatkan melalui pengurusan faktor dalaman dan faktor luaran.
xiv
A COMPARATIVE STUDY OF ISSUES AND CHALLENGES IN REDUCING NON
REVENUE WATER RATES IN PULAU PINANG AND PERLIS, MALAYSIA
ABSTRACT
In Malaysia, the states’ inability to curb Non-Revenue Water (NRW) losses has
negatively impacted the country’s progress in reducing NRW rates. This research attempts to
identify the issues and challenges faced by Malaysia’s water service providers (WSPs) in
reducing NRW rates in different states in order to contribute towards developing a
comprehensive solution for NRW reduction. A mixed methodology combining both
qualitative and quantitative methodologies is adopted to provide a comprehensive analysis.
In this study, both internal and external factors influencing a WSP’s performance in NRW
management were studied by comparing NRW reduction in Pulau Pinang (lowest NRW rate)
and Perlis (highest NRW rate) via qualitative interview and field observation. Public
perception of and involvement in NRW reduction was also studied via quantitative
questionnaire survey. Results show that real and apparent losses were the two major
elements contributing high NRW rates in many states. The level of interest of the
management unit, human resources, financial capacity, and technical capacity of a WSP
were found to be the internal factors influencing a WSP’s progress in reducing NRW. For
the external factors, stakeholder involvement, public engagement, and a comprehensive
NRW reduction policy were identified as important factors. In the comparison of NRW
reduction in Pulau Pinang and Perlis, NRW reduction strategies adopted by Pulau Pinang’s
WSP covered both preventive and basic strategies which can prevent the occurrence of NRW
losses. In contrast, NRW reduction strategies adopted by Perlis’s WSP were only the basic
strategy that can solve the NRW issues when seen and reported. In addition, the study also
found that public involvement in NRW reduction in both Pulau Pinang and Perlis is low and
still has plenty of room for improvement. This is because most respondents from both states
did not have good knowledge, awareness, and perception on NRW issue. Both Pulau Pinang
xv
and Perlis’s WSPs still have much to do to effectively engage their public in reducing NRW.
Based on the research findings, suggestions to improve NRW management of both states
were made at the end of the study. Finally, this study concludes that reducing NRW requires
contributions from all relevant water stakeholders. A comprehensive NRW management
framework was finally developed as a solution for WSP in reducing NRW. This framework
provides a comprehensive management strategy on how a WSP’s performance in reducing
NRW can be improved via internal factors and external factors.
1
CHAPTER ONE
INTRODUCTION
1.1 Research background
Water has become one of the most important global issues in the twenty-first century,
both in terms of development and environmental conservation (Chan, 2002a). However,
only a few understand how water is actually managed. Managing water well requires
appropriate water governance that covers water resources, water service and water trade-off
management (Connor et. al., 2012). Today, one of the major challenges faced by the water
management sector in many Asian cities is the high rates of non-revenue water (NRW).
Maintaining water sustainability can become very difficult if large volumes of treated water
are lost from a water supply system. Furthermore, heavy losses in the water distribution
system will hinder the water utilities when trying to keep water tariffs at an affordable rates
(Frauendorfer & Liemberger, 2010).
NRW represents the difference between the volume of supplied water and the
volume of billed water in a water supply system. NRW can be caused by water loss through
theft, pipe leakage, pipe burst, meter inaccuracy, and other uncountable losses once treated
water leaves the water treatment plant (Lambert & Hirner, 2000). For a water utility, NRW
is a good performance indicator, as high NRW rate indicates poor water management. A
study conducted by the Asian Development Bank in 2010 indicated that, NRW rates of the
countries in South East Asia were recorded at an average rate of 35 percent, ranging from 4
percent to 65 percent amongst the countries. Consequently, huge challenges are faced by
most water utilities in Asia in managing NRW rates (Frauendorfer & Liemberger, 2010).
Malaysia is considered a water-rich country. With more than 3,000 mm of average
annual rainfall, it has more than 556 billion cubic metre (m3) of annual renewable surface
2
water (Abdullah & Mohamed, 1998). However, this huge amount of water resources does
not make the country free from water problems, as Malaysia is still facing serious water
problems that have threaten current and future water security (Chan, 2002b; Ithnin &
Baharom, 2014). And much of these Malaysia’s water problems are largely caused by human
(Chan, 2009a). Chan (2004) has documented the major water issues in Malaysia,
highlighting water wastage as one of the most important. One of the contentious water issues
is NRW. In 2013, Malaysia’s national NRW average rate was recorded at 36.6 percent.
According to the statistic provided by the Suruhanjaya Perkhidmatan Air Negara(SPAN), in
2013, Pulau Pinang recorded the lowest NRW rate at 18.2 percent, whereas Perlis state
recorded the country’s highest NRW rate of 62.4 percent.
Pulau Pinang is one of 13 states in Malaysia. It is located near the north-western
coast of Peninsular Malaysia with a population of 1.5 million in 2010, and it is also one of
the most developed states in Malaysia (Pulau Pinang State Government, 2010). Perbadanan
Bekalan Air Pulau Pinang Sdn Bhd (PBAPP) is a privatised water company that served as
the licensed water operator in Pulau Pinang since 1999, and is currently owned by Pulau
Pinang State Government to protect public interest (Maidinsa, 2011). In Malaysia, PBAPP is
considered as one of the most successful privatised water companies in the region (Chan,
2007b). As a holistic and integrated water service provider, PBAPP’s responsibilities include
extraction of raw water, treatment of raw water, distribution and supply of treated water, and
billing for water supply service in Pulau Pinang. However, Pulau Pinang is a water-stress
state with 80 percent of its water supply sourced from the Muda River which has its origins
in Kedah State (Chan, 2005). Water consumption of 809 million litres per day necessitates
Pulau Pinang to look for alternative water resources (SPAN, 2014). It triggered PBAPP to
introduce NRW reduction programme which focuses to reduce water loss (Maidinsa, 2011).
As the result of the implementation of the NRW reduction programme, PBAPP has managed
to keep Pulau Pinang’s NRW rates below 20 percent in the last few years (Lai et. al., 2013) .
On the other hand, Perlis’s NRW rates have always been the country’s highest in
recent years. From 2011 to 2013, Perlis’s NRW rates were 59.8 percent in 2011, 66.4 percent
3
in 2012, and 62.4 percent in 2013 (SPAN, 2014). With the state’s surface area of 812 km2,
Perlis is the smallest state in Malaysia. It is also located at the northern part of Peninsular
Malaysia and shares its borders with Thailand. In comparison to Pulau Pinang’s privatised
water service, Perlis’s water service is provided by a state government department, which is
the Water Supply Department under the Jabatan Kerja Raya (JKR) Perlis. JKR Perlis is a
state government department officially formed in 1970, and water supply department is one
of the departments of JKR Perlis (JKR Negeri Perlis, 2014). Before the privatization of
public utilities emerged in Malaysia, JKR used to be the water service providers of many
states in the country, but nowadays, Perlis is the only state in Peninsular Malaysia with water
services provided by JKR.
1.2 Problem Statement
According to a study conducted by Chan in 2004, NRW is one of the major water
issues which has been threatening Malaysia’s water sustainability for more than a decade. In
the country’s history, there were 57 water treatment plants with a total capacity of 3.8
million cubic metre per day in the year 1996 (McIntosh, 2003). However, this huge amount
of water produced did not benefit the people at all due to high rate of NRW losses. In 1997,
Malaysia experienced a serious water crisis caused by the El Nino weather phenomenon.
This crisis then triggered the Malaysian government to start dealing with the issue of NRW
which had been threatening the country’s water supply for many years (Kingdom et. al.,
2006).
Referring to the Eighth (2001), Ninth (2006) and Tenth Malaysia Plan (2010), the
Malaysian government had spent RM 2.5 billion from 1996 to 2010 for reducing the
country’s NRW rate. Nevertheless, the country’s NRW rates still remain very high amongst
the states, ranging from 20 to 60 % with the national average of 36.8 % from year 2000 to
year 2010. A study was conducted by Malaysian Association of Water and Energy Research
(AWER) and it was found out that, from 2008 to 2013, NRW losses cost about RM 10
billion of revenue loss in the country’s water sector (AWER, 2014). By referring to the data
4
provided by Suruhanjaya Perkhidmatan Air Negara(SPAN), the latest water statistics in
2013 showed that five of the 13 states in the country recorded NRW rates greater than 50
percent. This is not a good sign as it showed that the government’s investment on the NRW
reduction programme did not bear fruit. Such high rates of NRW have severely jeopardized
the country’s water security. Coupled with population growth, agricultural intensification
and industrial expansion, amongst others, it has exacerbated Malaysia’s water problems.
No business is sustainable if it loses a significant portion of its marketable product, but
that is exactly what is happening in Malaysia now with NRW. The states’ inability to curb
NRW losses has negatively impacted upon water resources. Water consumers are now
demanding that the states and water service providers must reduce their NRW rates to save
water before they can start revising water tariff. It appears futile if water consumers were to
save water and such a large amount of water is lost through NRW by the water service
providers. Based on such high rates of NRW, water management is not sustainable, and the
expenses for the NRW reduction program are not cost-efficient. This will jeopardize
Malaysia’s water security leading to negative effects on population and economic growth.
Without water sustainability, the New Economic Model will collapse and Malaysia will also
not achieve its 2020 vision (Chan, 2011).
1.3 Research Question
a) What is the current NRW water loss situation in Malaysia and what are the reasons
leading to this situation?
b) What are the existing strategies for tackling NRW in Pulau Pinang (Lowest NRW rate)
and Perlis (Highest NRW rate)?
c) How does the public perceive NRW and its reduction, and how can the public get
involved in NRW management?
d) What is/are the current framework/s of NRW management used by water service
providers in Malaysia, and how effective are they?
5
1.4 Research Aim
The aim of this research is to develop a holistic NRW management framework and identify
the strategies that can be carried out to reduce the NRW loss situation of Malaysia’s water
supply system, and to address the challenges and barriers of implementing these strategies in
the Malaysia water sector, especially for states with high rates of NRW.
1.5 Research Objectives
a) To identify current NRW situation in Malaysia and the reasons leading to this situation.
b) To study and examine the existing strategies for tackling NRW issue in Pulau Pinang
(Lowest NRW rate) and Perlis (Highest NRW rate).
c) To investigate public perception of NRW issue and its reduction, especially in Pulau
Pinang and Perlis states.
d) To develop a sustainable framework of NRW management that can improve water
service provider’s performance in reducing NRW rate.
1.6 Significance of the Study
When NRW issue is not well managed, it means water conservation and water demand
management are not implemented effectively (McIntosh, 2003). Besides, high rates of NRW
may lead to unnecessarily high water tariff in the long run (Frauendorfer & Liemberger,
2010). As NRW rates in Malaysia still remain high at rates well over 30 percent, it can be
concluded that existing NRW reduction programme is ineffective in reducing NRW rate in
many states. As such, the main challenge for Malaysia’s water sector is to reduce the NRW
rates, especially for states with high rates of NRW.
Furthermore, according to Chan (2010), to solve the water loss issue in Malaysia is to
understand and address the human aspects of NRW, especially in engaging and mobilizing
water consumers and the community in helping to manage NRW losses in Malaysia. As part
of this research, investigation of human aspects of NRW in Malaysia is important to
understand the perception and the knowledge of NRW among the communities. It is helpful
6
for the government and water service providers to develop a plan to increase the knowledge
and awareness as well as provide education of NRW reduction for the community in order to
help Malaysia’s water sector to reduce NRW water loss.
This research attempts to identify the obstructions and problems faced by Malaysia’s
water service providers for reducing NRW rates in different states in order to contribute
towards developing a better solution for NRW reduction. In addition, this research
investigates the factors contributing to the high NRW rates that had threatened Malaysia’s
water security for many years. This research aims to develop a NRW management
framework at the end of the research via involvement of all stakeholders to increase the
efficiency of water service providers in managing NRW in Malaysia.
1.7 Scope of the Study
To study the water loss situation in Malaysia, the research focuses on studying the
components that contribute towards high rate of NRW in Malaysia. The components include
real loss, apparent loss, and unbilled authorized water consumption discussed in chapter two.
In addition, the research identifies the states that contribute to high rate of NRW based on the
latest water statistics.
An in-depth comparative study on NRW reduction strategies was conducted in Pulau
Pinang and Perlis State. Hence, this research is a comparative study aimed at developing a
better NRW management framework by comparing Pulau Pinang (the lowest rate of NRW)
with Perlis State (the highest rate of NRW). Water service providers which are responsible
for reducing NRW rate in both states were selected as the key respondents of study. In order
to evaluate the efficiency of NRW management in the states, this research focused on
evaluating the performance of selected water service providers in solving NRW-related
issues. Besides, this research targeted more in examining the real loss and apparent loss
management in Pulau Pinang and Perlis State, as real and apparent losses are commonly
known as the major components of NRW in many countries (Frauendorfer & Liemberger,
2010).
7
The study on public perception of NRW reduction was only conducted in the capital
city of Pulau Pinang (George Town) and Perlis State (Kangar). The data provided by water
service providers and SPAN regarding the pilferages of water, reported and unreported pipe
burst/ leaking were also studied to investigate the perception of NRW reduction in the
community.
1.8 Organisation of Thesis Chapters
This research is divided into five chapters. The structure of the thesis is as follow:
Chapter 1 presents the introduction to the thesis. It provides a brief background of
the study, problem statement, research questions, objective of the study, scope of study, as
well as the organisation of the study.
Chapter 2 presents a comprehensive literature review of the NRW management and
other related water issues via examination of journal articles, book chapters, reports and
other published materials related to this research. In addition, the elaboration of the
conceptual framework is presented in this chapter.
Chapter 3 addresses the study area and also presents the methodology of the
research, description of the research design, measurements, methods of data collection and
statistic tests used in the study.
Chapter 4 discusses the analysis and the results. The results are then summarised.
Chapter 5 summarises the findings of the research, and presents the research
outcome, as well as some recommendations for future research. A NRW management
framework is developed in this chapter as the final outcome of the research. The conclusion
of this study is presented at the end of the chapter.
8
CHAPTER TWO
LITERATURE REVIEW
This chapter reviews the literature of this thesis. It presents the theories, concepts, and
variables of this study related to NRW management as well as related water resources issues.
A conceptual framework is discussed and formulated in this chapter.
2.1 Non- Revenue Water and its Components
In the early 1990s, the term “unaccounted- for water” (UFW) was widely used by
many water utilities to evaluate their performance in managing water loss. During that time,
there was no standardized definition of UFW, and the performance of water utilities could
not be compared. In the early 2000s, a Water Loss Task Force was created by the
International Water Association (IWA) to develop appropriate performance indicators
related to water loss management (Frauendorfer & Liemberger, 2010). An article by Lambart
and Hirner (2000) introduced a standard terminology and appropriate performance indicators
for managing water loss. The term “Non- Revenue Water” (NRW) was first introduced as a
performance indicator to measure the annual volume and percentage of unbilled water
(unbilled authorised consumption and water loss) to the annual system input volume of a
water supply network. A recommendation was then made to use the term of “non- revenue
water” as a primary indicator of water loss management instead of using “unaccounted-for
water”, the term UFW was discontinue due to its unstandardized definition (Alegre et. al.,
2000; Lambert, 2003).
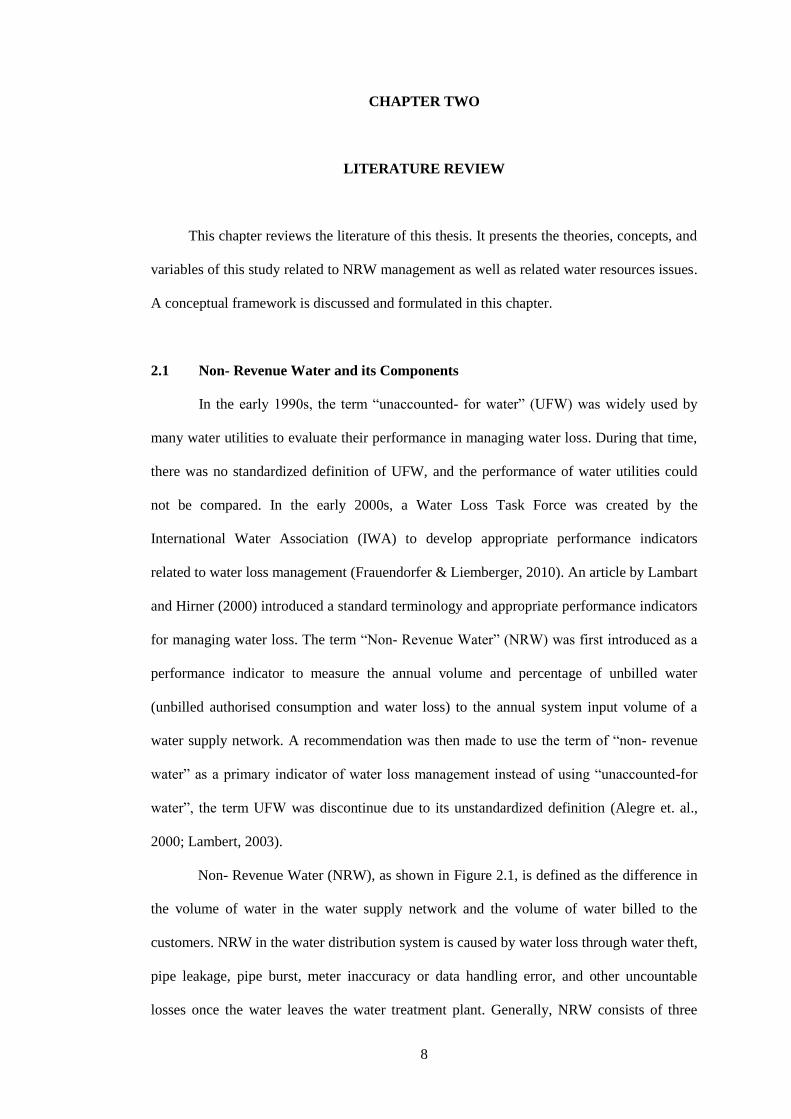
Non- Revenue Water (NRW), as shown in Figure 2.1, is defined as the difference in
the volume of water in the water supply network and the volume of water billed to the
customers. NRW in the water distribution system is caused by water loss through water theft,
pipe leakage, pipe burst, meter inaccuracy or data handling error, and other uncountable
losses once the water leaves the water treatment plant. Generally, NRW consists of three
9
components: real loss, apparent loss and unbilled authorised consumption (Lambert & Hirner,
2000).
System
Input
Volume
Authorized
Consumption
m3/ year
Billed
Authorized
Consumption
m3/ year
Billed Metered Consumption
(including water exported) Revenue
Water
m3/ year Billed Unmetered Consumption
Unbilled
Authorized
Consumtion
m3/ year
Unbilled Metered Consumption
Non-
Revenue
Water
m3/ year
Unbilled Unmetered
Consumption
Water
Losses
m3/ year
Apparent
Losses
m3/ year
Unauthorized Consumption
Metered Inaccuracies
Real Losses
m3/ year
Leakage on Transmission and/
or Distribution Mains
Leakage and Overflow at
Utility’s Storage Tanks
Leakage on Service Connections
up to the point of Customer
Metering
Figure 2.1: International Water Association (IWA) Standard International Water Balance and
Terminology (Lambert & Hirner, 2000).
System input volume is defined as the annual input volume of water into a defined
part of the water supply network. Real loss is defined as the annual volume of physical water
loss from the water supply network, including all types of leaks, bursts, and overflows in
service reservoirs, mains, and service connection pipes up to the point of customer metering
(Fanner, 2004). Apparent loss consists of unauthorized consumption and meter inaccuracy,
for example illegal water connection and water theft, and all types of meter inaccuracy
reading at the customer meter and production meter, for example meter under registration
and data handling errors. Whereas unbilled authorised consumption includes the water used
by the water utilities for operation purpose (e.g.: flushing and cleaning), water used for
firefighting, and water provided free to certain consumer groups (Frauendorfer &
Liemberger, 2010; Lambert & Hirner, 2000).
10
2.2 Benefits of Low Non- Revenue Water
In developing countries, NRW is one of the most severe issues threatening water
security of the country (Kingdom et .al., 2006). Indeed, water management would not be
sustainable if a country has high NRW. High rates of NRW cause significant volume to be
lost before reaching the consumer. Consequently, additional investments to produce more
treated water is needed to cover the loss, plus the problem of revenue loss caused by
apparent losses, the operation of the water utility would collapse in the long run if the NRW
problems are left unresolved (Frauendorfer & Liemberger, 2010). Conversely, a low NRW
rate indicates a sustainable management of water supply in a country.
By reducing NRW to lower rates, more treated water could be available to reach
water consumers, and more revenue would be gained and the water production cost (e.g.:
energy, chemical, and operating cost) would be lower (Giustolisi et.al., 2013). At the same
time, the investment for upgrading the capacity of water supply networks can be postponed
as more water is available in the system, and water consumers can enjoy reasonable tariff
and efficient water services. In addition, establishing NRW reduction strategies create
another business opportunity and this indirectly lead to positive economic growth. Besides,
the water utility can have a better understanding of the water consumption as the water
consumption pattern with minimized NRW rate can be more reliably to be analysed and
projected (Frauendorfer & Liemberger, 2010; Kingdom et al., 2006; Mclntosh, 2003).
Today, many countries are still facing the problem of high NRW. Despite the benefits of
NRW reduction are well-known, many water service providers still suffer from high NRW
rates because reducing NRW is a complicated and long process. NRW management not only
covers technical solution which requires huge financial input, but also includes non-
technical solutions which require participation from other stakeholders.
2.3 Factors Influencing Non- Revenue Water
In general, NRW reduction strategies are recognized as the direct factor to determine
the NRW rate in a city, as these strategies serve as the solutions to reduce each NRW’s
11
components: real loss, apparent loss and unbilled authorized consumption (Lambert, 2002).
These strategies, technically, are the most influential factors in determining the NRW rate,
and majority of these strategies advocate technology and engineering solutions to reduce
NRW. Many perceive that solving water problems depends highly on engineering solutions,
but in fact, apart from the technical factors which is discussed in detail in a later section,
other factors from the aspect of human behaviour, management and governance could play a
significant role in NRW reduction. In addition, other than the water utility, stakeholders such
as the public, the government, private company, contractor, consultant, and politician each
has its impacts to the outcomes of NRW reduction activities.
Furthermore, the type and number of NRW reduction activities in a city depend on
the financial capacity of the water utility. This is linked to the water tariff, the types of water
utility (public, private, or public-private), the governance of the water utility, and the funding
that provided by the government for NRW reduction (González et.al., 2012). Higher water
tariffs make the water utility financially more capable in investing in NRW programmes.
Financial capability of a private water company is claimed to be better than a public water
utility. Interest of the water utility’s management unit in NRW reduction could make the
water managers invest more time and resources in reducing NRW. Politicians and policy
makers are the key persons to determine the water tariff and governments’ funding for NRW,
and they are also the responsible parties to raise public concern and awareness on NRW
which could indirectly affect the number and outcome of NRW reduction activities
(González et.al., 2011; Gumbo & van der Zaag, 2002).
Moreover, Gonzalez et. al., (2012) found out that population growth could influence
NRW rate of a city. This is because the increased number of water consumer will increase
the complexity of water infrastructures. For example, extra piping is required to be laid to
meet increased water demand, as well as more meters are required to be installed. These
would increase the complexity of NRW management because the WSP would have to handle
more accounts as well as manage a large network of pipe mains. Besides, there are other
factors that can affect the outcomes of the NRW reduction strategies. Public involvement in
12
NRW reduction activities such as reporting pipe leakage and illegal water use could improve
a water utility’s efficiency in reducing NRW (Farley et al., 2008). Staff’s discipline,
competency, capacity, and motivation in reducing NRW are definitely the direct factors that
drive the outcomes in NRW reduction. A knowledgeable, responsible, and honest water
manager definitely executes good implementation of the NRW reduction activities
(González et al., 2011). Moreover, collaboration is needed in between the water utility,
contractor, private company and governments to draw up a comprehensive and appropriate
planning for reducing NRW in a city (González et al., 2012; Kanakoudis & Tsitsifli, 2012).
2.3.1 The Phnom Penh Experience, Cambodia
In Phnom Penh, the NRW was about 70 percent in the early 1990s. Poor governance
of Phnom Penh Water Supply Authority (PPWSA) was attributed to be the cause of high
NRW. Issues such as lack of capacity, corruption, and poor working culture of the staff of
PPWSA made the city suffer from high NRW. Most of the staff were underpaid, with
average monthly salary of only 20 US Dollar. Hence, the staff had low discipline, poor
morale, lack of motivation, and were inefficient. The top management of PPWSA only
worked for self-interest, and nepotism was common within the company. Illegal water use
was common because connections of formal water supply through PPWSA were difficult.
Ironically, the person who provided the service of illegal pipe connection actually had a good
relationship with the top management of PPWSA. Due to the poor billing system, PPWSA
did not have enough financial capacity to carry out pipe replacement programme as well as
to repair leaking pipes which caused high real loss in Phnom Penh (E. S. Chan, 2009).
However, Phnom Penh’s NRW has now been lowered to an acceptable rate after the
above issues had been solved through a water service reform which was initiated by the
Cambodian Government with the help from several developed countries and international
development organizations (Biswas & Tortajada, 2010). Since the PPWSA reformed in
1993 and it practices a new work culture as an ‘Educating, Motivating and Disciplining’
water authority. Top management of PPWSA was restructured by including more young
13
people with higher educational and professional qualifications. By giving more
responsibility to these young managers, they would also be paid with higher salary and
bonus if they give good performance. Whereas staff with poor performance or found guilty
of malpractices would be penalized. All the staff including top management and the
technical staff were given a serious warning on not to abuse their power, especially not to get
involved in illegal pipe connections. The local communities are advised use proper pipe
connections through PPWSA, and incentives would be given if one reports on illegal
connections. In addition, the public is also advised to report pipe leakage (Biswas &
Tortajada, 2009; E. S. Chan, 2009).
Several NRW reduction strategies has been introduced after the restructuring of
PPWSA, with a team was introduced to inspect and disconnect the illegal connections. A 24-
hour repair team was also formed and is responsible for inspecting and repairing pipe
leakages in the city. A pipe replacement programme was started with funds given by several
donors. Today, as a result of all these reforms, NRW in Phnom Penh is lower than 10 percent.
Furthermore, water supply in Phnom Penh city is now covering about 90 percent of the total
population (Biswas & Tortajada, 2010).
2.3.2 The Manila Experience, Philippines
In Manila, the west and east parts of this metropolitan city are served by two
different private water companies because of political influence (Wu & Malaluan, 2008).
Some time ago, privatization was recognised as the solution to address high NRW, but today
NRW rate in East Manila has been reduced to a very low rate (below than 10 %), whereas
West Manila still experiences high NRW rate (more than 50 percent) (Asian Development
Bank, 2010). This has proven that privatisation is not the best solution to address high NRW;
at least it is not enough to reduce NRW to a lower rate by just privatising NRW reduction
activities.
The failure of West Manila’s water company in reducing NRW was alleged to be
due to the mismanagement of its staff in carrying out NRW reduction activities, as its
14
management unit did not have a clear direction in reducing NRW (Dimaano, 2012). Another
major reason was its ineffective strategies in engaging the public in reducing NRW. It is a
different scenario in East Manila, each of its staff was motivated and had a clear
responsibility in NRW reduction activities, and its community water management
programme succeeded in engaging the public who reported pipe leakage and illegal water
use (Wu & Malaluan, 2008).
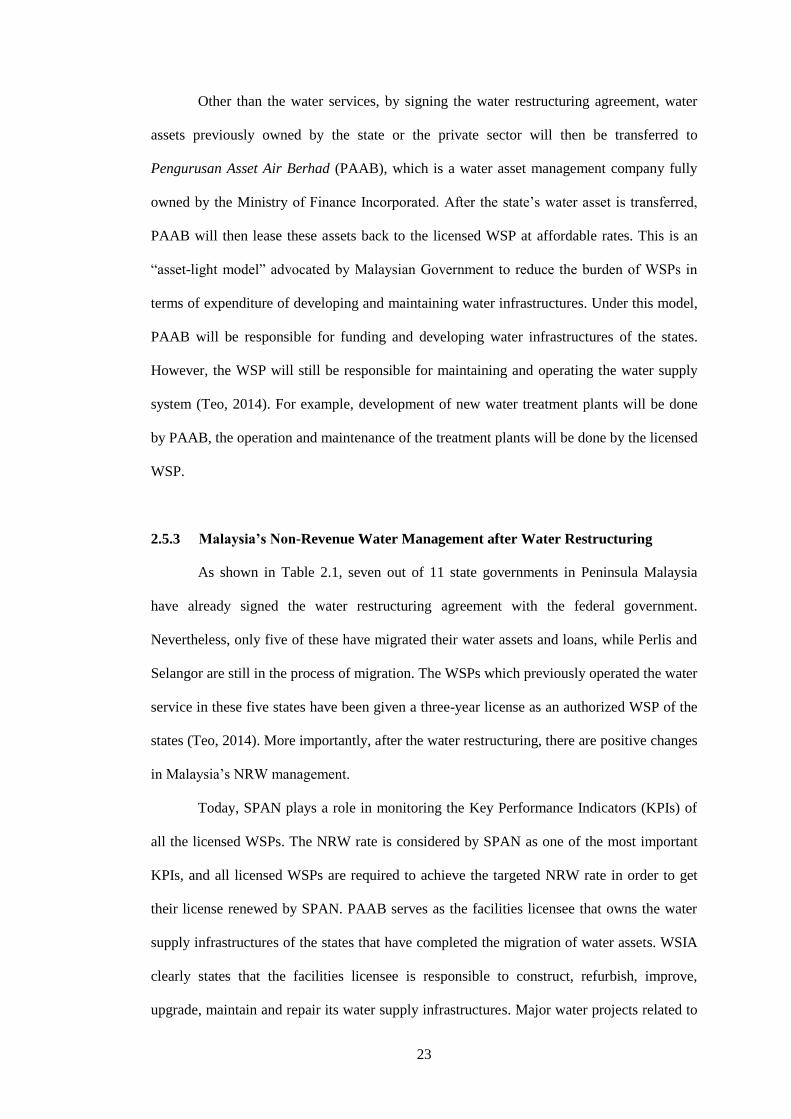
2.3.3 Summary of the Factors Influencing NRW Reduction
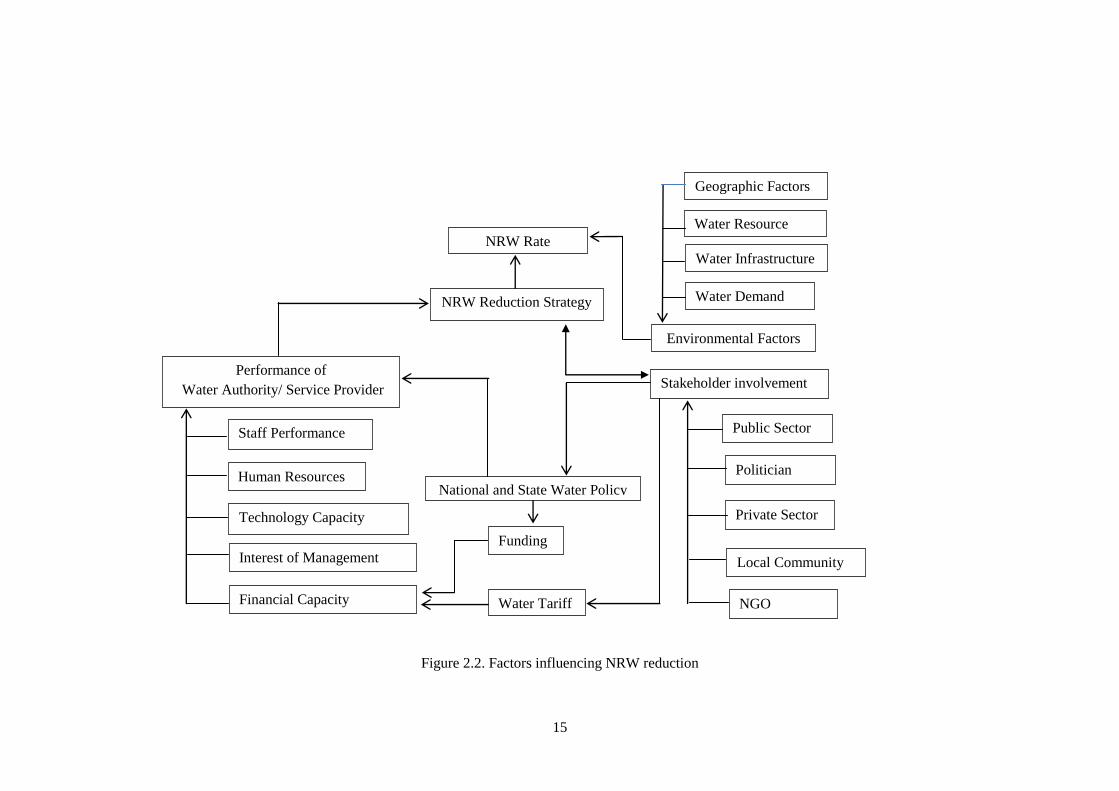
Figure 2.2 summarizes the factors influencing NRW reduction. Factors such as staff
performance, human resources, technology capacity, interest of management unit, and
financial capacity affect the performance of a WSP in conducting NRW reduction activities,
which directly affect the outcomes of the NRW reduction strategies. Financial capacity of a
WSP in reducing NRW is largely dependent on two factors, which are the revenue from
water sales and funding provided by the government. Stakeholders also play a crucial role in
setting water tariffs for sustainable cost recovery of WSP in reducing NRW, and they can
make contribution to the outcomes of NRW reduction strategies by cooperating with WSP,
such as reporting pipe leakage and illegal pipe connection. In addition, there are also the
other factors such as water demand, geographic factors, water infrastructure, and availability
of water resources which could indirectly affect NRW situation in a city. For example,
limited water resources and high water demand in a city leave the WSP in the city with no
choice but to reduce NRW rate in order to sustain water supply in the city. Above all, NRW
is a complex issue involving many factors. It has to involve all the stakeholders along the
process of reducing NRW. The NRW rate cannot be reduced effectively through the
implementation of NRW reduction activities alone. Hence, managing all factors that
contribute to the NRW reduction activities is necessary.
15
Figure 2.2. Factors influencing NRW reduction
NRW Rate
NRW Reduction Strategy
Performance of
Water Authority/ Service Provider
Staff Performance
Human Resources
Technology Capacity
Interest of Management
Unit
Financial Capacity
Stakeholder involvement
Environmental Factors
National and State Water Policy
Funding
Water Tariff
Public Sector
Politician
Private Sector
NGO
Local Community
Water Demand
Water Infrastructure
Water Resource
Geographic Factors
16
2.4 Non- Revenue Reduction Strategy
To reduce NRW rate, its components: real loss, apparent loss, and unbilled
authorised consumption have to be reduced. As reducing NRW is a complicated and long
process which require different strategies and different performance indicators to deal with
different NRW’s components, this section highlights the NRW reduction strategies and
performance indicators for reducing NRW’s components.
2.4.1 Real Loss Reduction Strategy
Real loss is always the major component that builds up the NRW rate in many cities.
There are four methods to reduce real loss: speed and quality of repair, leakage control
(active and passive), pressure management, and pipeline and assets management (Fanner,
2004). Speed and quality of repair and leakage control are the methods to reduce the volume
of real loss by reducing the time needed for detection and repair of pipe leakage. Leakage
control is divided into passive and active leakage control (Puust et al., 2010). Passive leakage
control (PLC) is the most basic method of leakage control. By adopting this method, the
water utility will take action to repair pipe only if the leak or burst is seen and reported by
the public or its own staff. This method is widely used by the water utilities in developing
countries (Frauendorfer & Liemberger, 2010). Whereas active leakage control (ALC) is an
advanced method for detecting and locating the pipe leakage before it is reported. The water
utility plays an active role in detecting and locating leaks by using some tools and equipment
(Pilcher, 2003). The details of how active leakage control is implemented will be discussed
later. Leakage control strategy can be very influential to the outcome of speed and quality of
repair. The concept of Awareness, Location, and Repair (ALR) has been introduced to
measure the performance of speed and quality of repair. Speed and quality of repair
determines the volume of leak- or burst- caused real loss, and ALR refers to the time taken to
be aware, locate and repair the leaked pipe (Liemberger & Farley, 2004). This means that the
quicker the leak is detected, located, and repaired with good quality material and work, the
more water will be saved. Basically, speed and quality of repair and leakage control are the
17
short-term strategies which aim to reduce the volume of real loss after the leak occurs. There
are strategies aimed at avoiding pipe leakage.
Pressure management is a useful method to reduce the frequency of leaks in a water
supply network. As high pressure in the water supply networks will cause pipes to crack
leading to leakage opening, it is important to manage the water supply pressure to protect the
water supply networks, especially the piping system (Cassa et. al., 2010). Pressure reduction
is a method of pressure management and it is commonly used by water utilities to prevent
leakage (Thornon, 2003). A pressure reducing valve (PRV) has to be installed to control the
water flow pressure. This PRV control the water flow pressure within certain zones to ensure
it is not too high to cause pipe cracking and not too low to cause low water supply pressure
at the consumer point. For example, if the incoming water flow pressure is too high and tend
to cause pipe cracking, the PRV serve as a watchman as it reduces the water flow pressure
before the water passes through it (Farley et al., 2008). This method usually comes with the
District Metering Area (DMA) which is discussed in section 2.4.2. Generally, PRV is known
as a cost-effective method to reduce the frequency of leak compared to pipeline and asset
management which usually require high investment (Mutikanga et al., 2012).
Pipeline and asset management is the most effective method in reducing the
frequency of pipe leaks. But this method is also the most expensive method to be
implemented. In most countries, water utilities’ pipe replacement programme is carried out
to rehabilitate or replace the pipes that are prone to leak, viz. usually the aging pipes. There
are factors to determine which pipeline should be replaced or rehabilitated first; such factors
are frequency of burst or leak (leak and burst record), pipe age, health concern, etc (Hu et. al.,
2009). Different countries have different consideration when deciding which pipe should be
replaced first, as the factors that cause pipe failure in each country are different. In Malaysia,
the pipeline rehabilitation and replacement programme is focused on replacing asbestos
cement (AC) pipes, mainly because AC has been proven as a material that could cause
negative impacts to human health (Lambert, 2002). Moreover, AC pipe indicates an old
water infrastructure in Malaysia, as AC pipes were the main piping material used to build
18
water infrastructures between the 1950s and 1980s, and this aging piping could be the
reason for high frequency of pipe leakage (Hu et al., 2009; Rampal & Lim, 2002).
2.4.2 Active Leakage Control
As mentioned above, active leakage control (ALC) is an advanced method in
controlling leak. By implementing ALC, water utility will play an active role in controlling
leak. To establish ALC in a water utility, DMA must be introduced for leak awareness
purpose. DMA is a discrete zone in which the water supply network is isolated. The creation
of DMA is to enable flow monitoring in the discrete zone. With DMA, water consumption,
and water flow in and out from this zone will be measured in detail. With this crucial data,
the water utility will be able to detect unreported or underground leak by calculating the
volume of water loss in this particular area (Farley & Liemberger, 2005; Morrison, 2004).
When a DMA has high volume of water loss, leak detection activities will be prioritised to
be focused in this area, and these activities can minimise the time taken to detect and locate
the leaks.
Once a DMA is targeted, leak detection and leak localisation activities will be
carried out in that area. The leak localisation activity often begins with leak localising,
whereby an activity is carried out to narrow down the suspected leak location before the
exact leak location can be found by another activity. Leak localising can be done by step test,
correlator survey, acoustic logger survey, ground motion sensors and ground penetrating
radars (Puust et al., 2010). Once a suspected area is localised, the water piping will be
pinpointed to locate the leak precisely by using leak detection equipment. The leak detection
equipment commonly used are ground microphones, leak noise correlators, noise loggers,
and sounding sticks (Farley et al., 2008; Pilcher, 2003). After the leak location is found, the
water utility will proceed to repair the leaked pipe.
19
2.4.3 Apparent Loss Reduction Strategy
Apparent loss can be reduced by managing meter inaccuracy, data transfer error
(meter reading error), data analysis error and unauthorized consumption (Rizzio et al., 2004).
Meter inaccuracy is among the most common element that caused apparent loss in many
cities. The reason for meter inaccuracy causing apparent loss is inaccurate meter reading as
this could cause under-registration of water consumption, leading to revenue loss of water
utility due to certain amount of the consumed water not registered and billed (Farley et al.,
2008). Factors that cause meter inaccuracy are complex, as meter accuracy is determined by
the interaction of several factors, and a lot of assessment have to be done to identify the
factors contributing to meter inaccuracy (Mutikanga et al., 2011). Such factors are meter
type, unfavourable water consumption pattern, bad water quality, environmental conditions,
meter position, water tempering, water supply pressure, and installation of storage tank
(Arregui et al., 2006; Fontanazza et al., 2014). This could explain why aging meter tends to
be inaccurate, as time slowly deteriorates the mechanism of meter in recording water
consumption. To reduce the problem of meter inaccuracy, old meters need to be changed
from time to time while other factors have to be managed. Suspended solids in the supplied
water also have to be reduced. Besides, meter has to be installed with proper position and
proper meter type. In addition, intermittent water supply has to be avoided, water supply
pressure has to be optimised, and water consumption pattern of the consumer has to be
monitored. Furthermore, meter has to be maintained and replaced regularly by water utility,
and meter policy has to be introduced.
The other problem that could cause apparent loss is meter reading and data analysis
errors. Meter reading error usually refers to the error that happens when the meter reader
wrongly records the reading (Frauendorfer & Liemberger, 2010). For example, meter reader
could simply place the decimal in a wrong place due to negligence. Meter reader could also
record a wrong meter reading because of accepting a bribe from owner. Meter reading error
could lead to data analysis error. Data analysis error happens in the process of data handling
and billing. In a water utility, data handling and billing involve different processes and
20
different persons are in charge and this usually involves the meter reading department and
billing department. Error could happen in the process of meter reader in taking meter reading
up until the meter reader hands the recorded reading to the billing department. The other
error that could happen is when the staff in billing department is calculating the water bill.
To deal with these problems, staff of the meter reading department and billing department
have to be specifically trained and motivated. Highly accurate tools and equipment have to
be used in recording meters and calculating water bill. For example, the use of electronic
recording machine should replace traditional hand written method, and the latest billing
software has to be introduced to the billing department. Routine reading verification activity
is suggested to be carried out to check the reading submitted by meter readers (Farley et al.,
2008).
Unauthorised consumption is largely caused by societal problem rather than
technical problem. Unauthorized consumption is not common in developed country, but in
many developing countries, apparent loss is built up by high rate of unauthorised
consumption (Mclntosh, 2003). Unauthorized consumption refers to illegal use of treated
water, for example connecting pipe illegally, modifying water pipe to bypass meter, and
illegal use of water from hydrant. Society problems such as low income, corruption and
dishonest water consumers are among the causes of unauthorized consumption. To deal with
the problem of unauthorized consumption, the public must be involved as part of the solution,
and water awareness campaigns have to be conducted to educate the public regarding the
issues related to NRW. Staff that work for water authority must be trained and educated, as
they are the direct persons who inspect the illegal water use. For example, the East Manila’s
water utility introduced community NRW management programme to engage the local
community to be the street leaders who help water utility in investigating unauthorised
consumption and reporting suspected leak. Today, East Manila enjoys low NRW rate and
this programme has been proven to be effective in solving unauthorized consumption
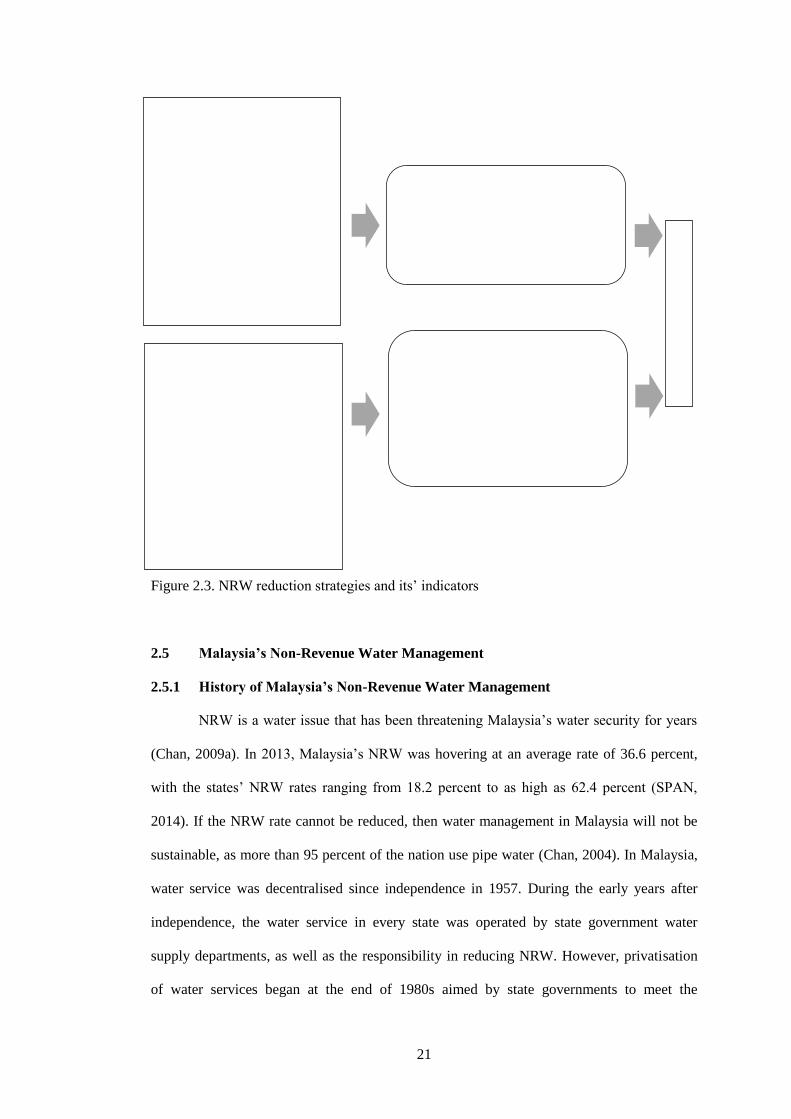
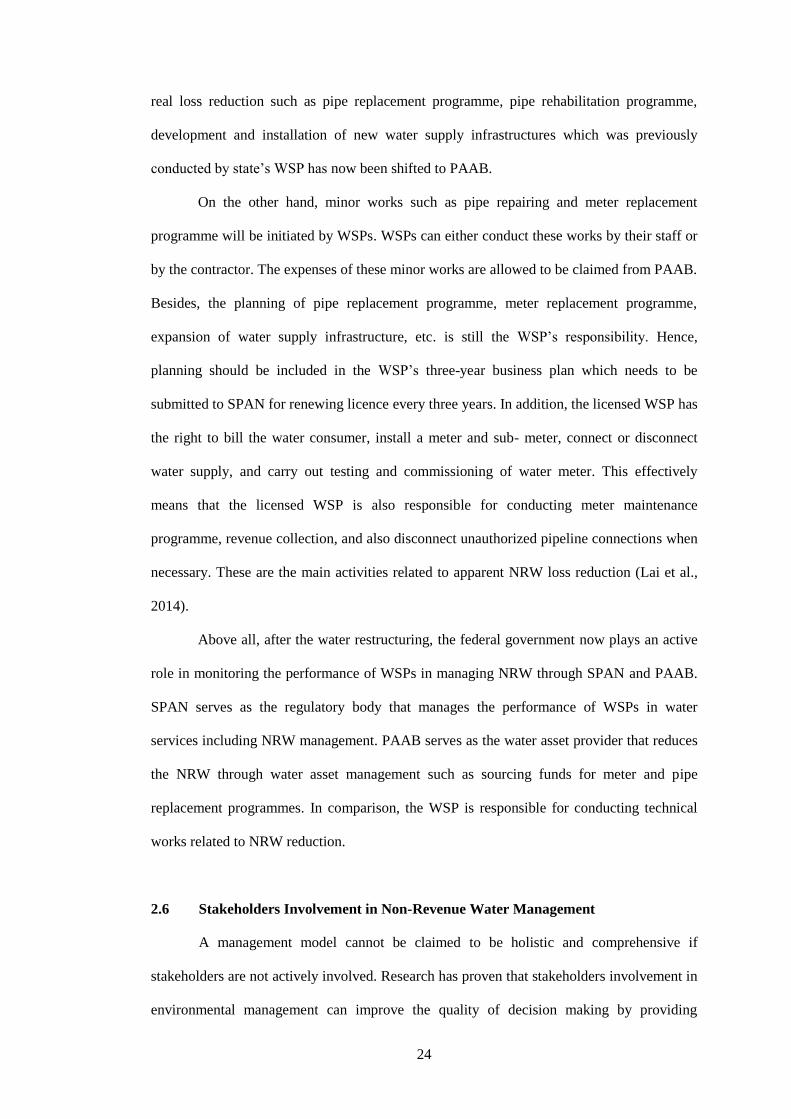
(Frauendorfer & Liemberger, 2010). Figure 2.3 summarizes the indicators of NRW reduction
strategies that discussed above.
21
Figure 2.3. NRW reduction strategies and its’ indicators
2.5 Malaysia’s Non-Revenue Water Management
2.5.1 History of Malaysia’s Non-Revenue Water Management
NRW is a water issue that has been threatening Malaysia’s water security for years
(Chan, 2009a). In 2013, Malaysia’s NRW was hovering at an average rate of 36.6 percent,
with the states’ NRW rates ranging from 18.2 percent to as high as 62.4 percent (SPAN,
2014). If the NRW rate cannot be reduced, then water management in Malaysia will not be
sustainable, as more than 95 percent of the nation use pipe water (Chan, 2004). In Malaysia,
water service was decentralised since independence in 1957. During the early years after
independence, the water service in every state was operated by state government water
supply departments, as well as the responsibility in reducing NRW. However, privatisation
of water services began at the end of 1980s aimed by state governments to meet the
N
R
W
Re
du
cti
on
St
rat
eg
y
Real loss reduction strategy
Pipeline and asset management
Pressure management
Active leakage control
Speed and quality of repair
Apparent loss reduction strategy
Reducing meter reading error
Reducing data handling and
billing error
Reducing meter inaccuracy
Reducing unauthorized
consumption
INDICATORS
Percentage of old piping
Material of piping
Number of PRVs
Number of DMAs
Leak detection equipment
Leak monitoring software
Leak inspection strategy
24-hour call center
Time taken for repairing
Cases of pipe burst/ leak
INDICATORS
Percentage of aging meter
Type of meter
Cases of meter and billing
error
Cases of illegal water use
Capacity of meter reader
Billed percentage
Meter reading equipment
Data handling software
Billing equipment
22
increased water demand and to improve water service efficiency (Chan, 2009a).
Nevertheless, some of the states’ water utilities chose to be partly privatised (corporatised)
and are still under state government ownership (Tan, 2012). Consequently, most of the
country’s states water utilities have been either fully privatised or partly privatised
(corporatised), and this placed the responsibility of NRW reduction on the state’s water
service providers (WSPs).
2.5.2 Water Reforms Restructuring in Malaysia
Recently, the Malaysian federal government has initiated the reformation of its water
sector with a new water policy put in place in 2006. State water legislations that were
previously implemented were replaced by two acts, viz. Water Service Industry Act (WSIA)
2006 and National Water Services Industry Act (SPAN Act) 2006. With these two new acts,
water services will be renationalised, whereby the responsibility of the regulation of water
services will be moved to the federal government. However, water resource, catchment and
river basin will remain under state government control. To govern the water service sector,
the federal government has formed the Suruhanjaya Perkhidmatan Air Negara(SPAN) in
2007 to enforce the WSIA. Today, SPAN plays an important role in advising the federal
government on the national water policy. The water supply service which was previously
regulated by the state government will be moved to SPAN after the water reforming
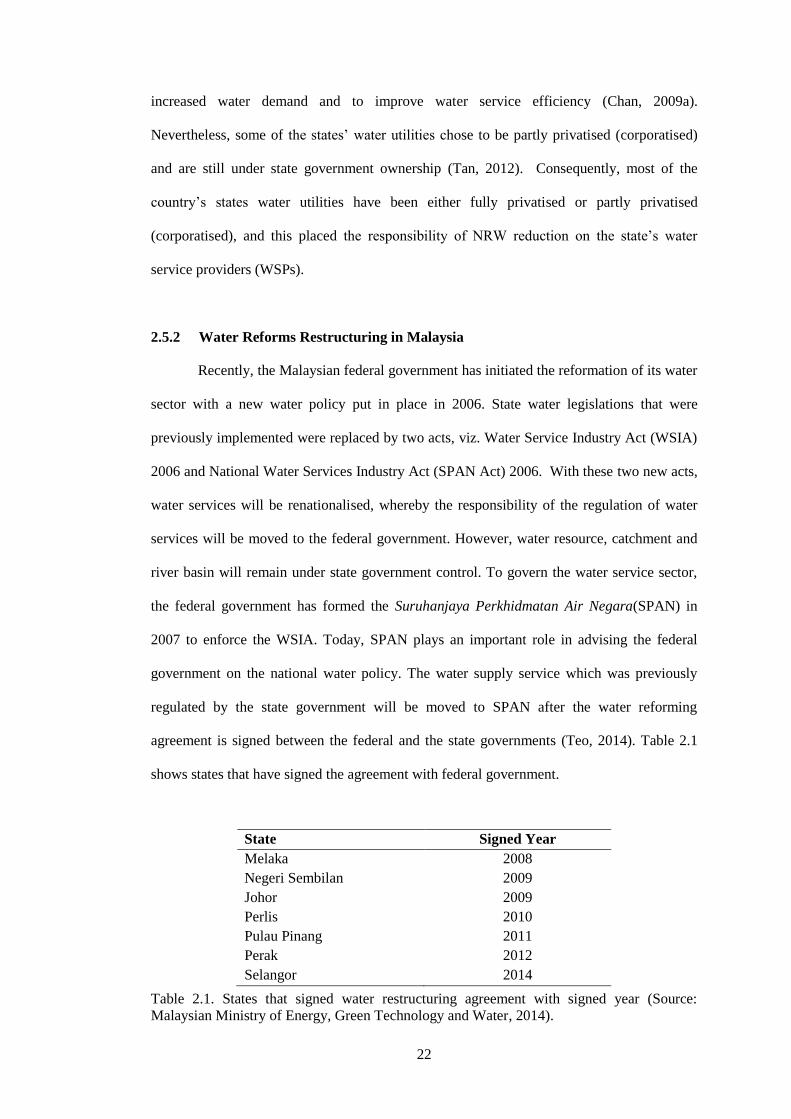
agreement is signed between the federal and the state governments (Teo, 2014). Table 2.1
shows states that have signed the agreement with federal government.
State Signed Year
Melaka 2008
Negeri Sembilan 2009
Johor 2009
Perlis 2010
Pulau Pinang 2011
Perak 2012
Selangor 2014
Table 2.1. States that signed water restructuring agreement with signed year (Source:
Malaysian Ministry of Energy, Green Technology and Water, 2014).
23
Other than the water services, by signing the water restructuring agreement, water
assets previously owned by the state or the private sector will then be transferred to
Pengurusan Asset Air Berhad (PAAB), which is a water asset management company fully
owned by the Ministry of Finance Incorporated. After the state’s water asset is transferred,
PAAB will then lease these assets back to the licensed WSP at affordable rates. This is an
“asset-light model” advocated by Malaysian Government to reduce the burden of WSPs in
terms of expenditure of developing and maintaining water infrastructures. Under this model,
PAAB will be responsible for funding and developing water infrastructures of the states.
However, the WSP will still be responsible for maintaining and operating the water supply
system (Teo, 2014). For example, development of new water treatment plants will be done
by PAAB, the operation and maintenance of the treatment plants will be done by the licensed
WSP.
2.5.3 Malaysia’s Non-Revenue Water Management after Water Restructuring
As shown in Table 2.1, seven out of 11 state governments in Peninsula Malaysia
have already signed the water restructuring agreement with the federal government.
Nevertheless, only five of these have migrated their water assets and loans, while Perlis and
Selangor are still in the process of migration. The WSPs which previously operated the water
service in these five states have been given a three-year license as an authorized WSP of the
states (Teo, 2014). More importantly, after the water restructuring, there are positive changes
in Malaysia’s NRW management.
Today, SPAN plays a role in monitoring the Key Performance Indicators (KPIs) of
all the licensed WSPs. The NRW rate is considered by SPAN as one of the most important
KPIs, and all licensed WSPs are required to achieve the targeted NRW rate in order to get
their license renewed by SPAN. PAAB serves as the facilities licensee that owns the water
supply infrastructures of the states that have completed the migration of water assets. WSIA
clearly states that the facilities licensee is responsible to construct, refurbish, improve,
upgrade, maintain and repair its water supply infrastructures. Major water projects related to
24
real loss reduction such as pipe replacement programme, pipe rehabilitation programme,
development and installation of new water supply infrastructures which was previously
conducted by state’s WSP has now been shifted to PAAB.
On the other hand, minor works such as pipe repairing and meter replacement
programme will be initiated by WSPs. WSPs can either conduct these works by their staff or
by the contractor. The expenses of these minor works are allowed to be claimed from PAAB.
Besides, the planning of pipe replacement programme, meter replacement programme,
expansion of water supply infrastructure, etc. is still the WSP’s responsibility. Hence,
planning should be included in the WSP’s three-year business plan which needs to be
submitted to SPAN for renewing licence every three years. In addition, the licensed WSP has
the right to bill the water consumer, install a meter and sub- meter, connect or disconnect
water supply, and carry out testing and commissioning of water meter. This effectively
means that the licensed WSP is also responsible for conducting meter maintenance
programme, revenue collection, and also disconnect unauthorized pipeline connections when
necessary. These are the main activities related to apparent NRW loss reduction (Lai et al.,
2014).
Above all, after the water restructuring, the federal government now plays an active
role in monitoring the performance of WSPs in managing NRW through SPAN and PAAB.
SPAN serves as the regulatory body that manages the performance of WSPs in water
services including NRW management. PAAB serves as the water asset provider that reduces
the NRW through water asset management such as sourcing funds for meter and pipe
replacement programmes. In comparison, the WSP is responsible for conducting technical
works related to NRW reduction.
2.6 Stakeholders Involvement in Non-Revenue Water Management
A management model cannot be claimed to be holistic and comprehensive if
stakeholders are not actively involved. Research has proven that stakeholders involvement in
environmental management can improve the quality of decision making by providing