Embed Size (px)
Citation preview
Abstract—Traditional process control models suppose
certain input control parameters, which are not pragmatic.
They cannot support uncertainty of an industrial process,
which has multifactor involved. Then, the responses of
industrial process are inconsistent. So, a method that can
handle uncertainty should be applied to such problems. Design
of experiment (DOE) is one of the most efficient methods for
multifactor experiments. Another method, called fuzzy logic is
nowadays a capable methodology in many applications with
unpredictability. So, these approaches were proposed for a case
study factory. 2k design of experiments (DOE) was studied and
used to find the suitable process control parameters. Fuzzy
Inference System (FIS) was considered and represented by
linguistic terms. Then, the generated fuzzy rules were utilized
to extract the fuzzy process control parameters continuously.
The process control parameters were corrected depending on
the FIS system. In this research, both approaches were
compared with the existing process parameters. The results
indicated that the proposed FIS model achieved better
performance than DOE model for this application.
Index Terms—design of experiment (DOE), fuzzy inference
system (FIS), process control parameters
I. INTRODUCTION
ROCESS control means the methods that are applied to
control process variables when producing a product and
maintain the output of a particular process within a required
range. Process control can be classified as manual or
automatic. Normally, this classification refers to the amount
of human effort needed to accomplish a common function.
Manual control consists of open-loop and feed-forward
control which involve a lot of physical adjustments by
operators. Automatic control consists of closed-loop and
feedback control, which use a feedback path that samples the
output to control the process automatically [1]. Automatic
feedback control is the most common form of control. The
methods to deal with process control consist of classical and
modern methods. The classical control methods such as on-
off control, proportional integral derivative (PID) control,
Manuscript received March 21, 2017; revised April 02, 2017.
Prasert Aengchuan is with School of Manufacturing Engineering,
Institute of Engineering, Suranaree University of Technology, Nakhon
Ratchasima, 30000 Thailand (+66-81641-5235; fax: +6644-224494; e-
mail: [email protected]).
Busaba Phruksaphanrat is with Department of Industrial Engineering,
Faculty of Engineering, Thammasat University, Rangsit Campus, Pathum
Thani, 12120 Thailand (e-mail: [email protected]).
etc. are mostly concerned with mathematical and constant
variables. Design of experiment (DOE) method is a critically
important engineering tool for improving a manufacturing
process [2]. Application of DOE in process control will
produce information that can lead to process improvement.
Reference [3] applied a design of experiment (DOE) to
predict product and process parameters for a spray dried
vaccine. The modern control method such as artificial
intelligence (AI) is also developed for highly complex
processes and random variables. Process control is widely
used in industry such as power plants, petrochemical plants,
cement plants, and many others. Process control empowers
automation and AI methods such as fuzzy logic by which a
few operators can control a complex process from a central
control room. During the last decade a number of
researchers have contributed their innovations in this
category. Reference [4] presented the consistency
stipulations and controller design for structural and
mechanical systems expressed by fuzzy models. The
application of support vector regression, FIS and adaptive
neuro-fuzzy inference system (ANFIS) for cement fineness
online monitoring has presented [5]. The application of FIS
inventory system design has presented [6]. Reference [7]
presented the comparison of FIS, FIS with artificial neural
networks and FIS with adaptive neuro-fuzzy inference
system for inventory control.
Many researches apply simulation for the main study, but
there are very few publications regarding comparative
studies, especially the comparison of DOE and FIS for the
plaster process control. So, this research proposes the
comparison of the methodologies of DOE and FIS models
for predicting the target setting of process control variables
and establishing the model of the pragmatic problem with
the fuzzy inputs for the process control manufacturing
system. The process control problem of a construction
material company in Thailand was selected as a
manufacturing system case study. The plasterboard
production process consists of various control parameters
and is quite complicated to control, so requires highly
experienced operators.
II. SYSTEM DESCRIPTION AND APPLICATION
A. System Description
The case study company is a make-to-stock manufacturer
that produces two types of standard size plasterboard
A Comparative Study of Design of Experiments
and Fuzzy Inference System for Plaster Process
Control
P. Aengchuan, and B. Phruksaphanrat, Member, IAENG
P
Proceedings of the World Congress on Engineering 2017 Vol I WCE 2017, July 5-7, 2017, London, U.K.
ISBN: 978-988-14047-4-9 ISSN: 2078-0958 (Print); ISSN: 2078-0966 (Online)
WCE 2017
products, recessed edge and square edge. In the production
process, the main material is plaster powder, which is
generally produced by the calcining process. Gypsum
(CaSO4 2H2O) is the oldest inorganic substance that has
been extensively used in construction and buildings. Plaster
or hemi-hydrate (CaSO4 0.5H2O) is produced by grinding
and heating gypsum at 150 degree Celsius to remove 75% of
its combined water from 2 molecules of water to 0.5
molecules of water.
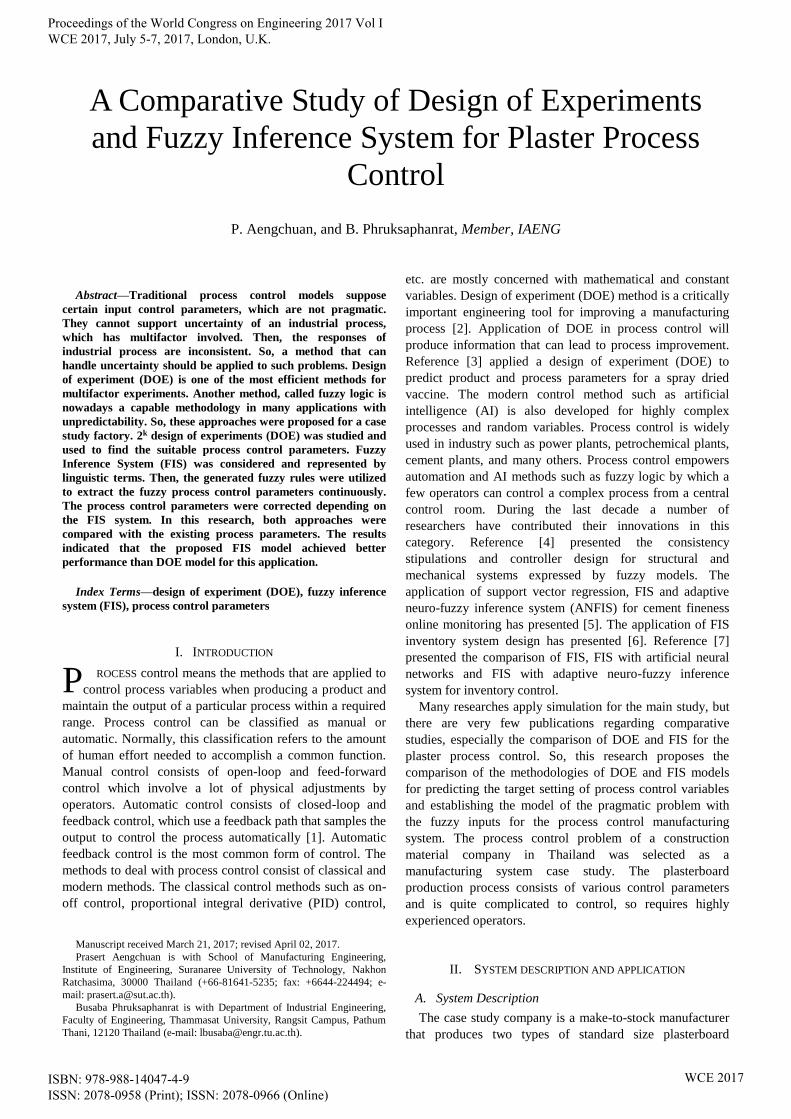
The flow diagram of the plaster manufacturing process
is illustrated in Fig 1. In this process, the natural gypsum is
crushed and fed into a vertical roller mill (VRM). The
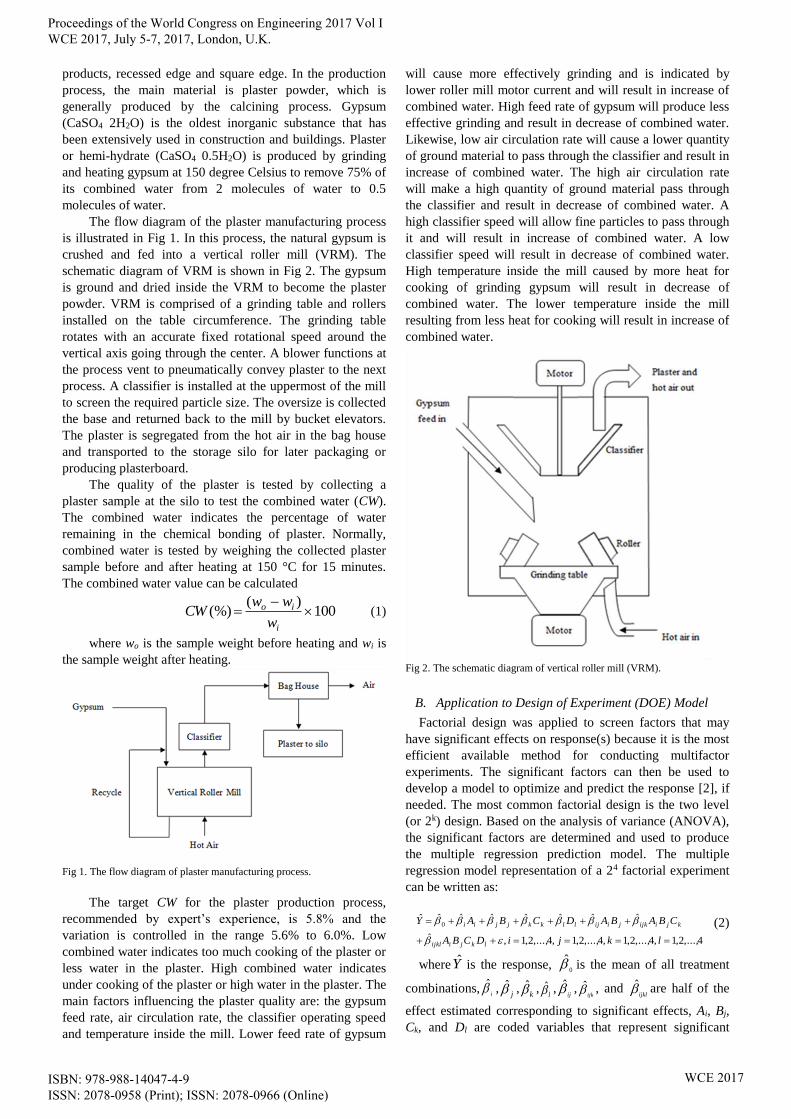
schematic diagram of VRM is shown in Fig 2. The gypsum
is ground and dried inside the VRM to become the plaster
powder. VRM is comprised of a grinding table and rollers
installed on the table circumference. The grinding table
rotates with an accurate fixed rotational speed around the
vertical axis going through the center. A blower functions at
the process vent to pneumatically convey plaster to the next
process. A classifier is installed at the uppermost of the mill
to screen the required particle size. The oversize is collected
the base and returned back to the mill by bucket elevators.
The plaster is segregated from the hot air in the bag house
and transported to the storage silo for later packaging or
producing plasterboard.
The quality of the plaster is tested by collecting a
plaster sample at the silo to test the combined water (CW).
The combined water indicates the percentage of water
remaining in the chemical bonding of plaster. Normally,
combined water is tested by weighing the collected plaster
sample before and after heating at 150 °C for 15 minutes.
The combined water value can be calculated
100)(
(%)
i
io
w
wwCW (1)
where wo is the sample weight before heating and wi is
the sample weight after heating.
Fig 1. The flow diagram of plaster manufacturing process.
The target CW for the plaster production process,
recommended by expert’s experience, is 5.8% and the
variation is controlled in the range 5.6% to 6.0%. Low
combined water indicates too much cooking of the plaster or
less water in the plaster. High combined water indicates
under cooking of the plaster or high water in the plaster. The
main factors influencing the plaster quality are: the gypsum
feed rate, air circulation rate, the classifier operating speed
and temperature inside the mill. Lower feed rate of gypsum
will cause more effectively grinding and is indicated by
lower roller mill motor current and will result in increase of
combined water. High feed rate of gypsum will produce less
effective grinding and result in decrease of combined water.
Likewise, low air circulation rate will cause a lower quantity
of ground material to pass through the classifier and result in
increase of combined water. The high air circulation rate
will make a high quantity of ground material pass through
the classifier and result in decrease of combined water. A
high classifier speed will allow fine particles to pass through
it and will result in increase of combined water. A low
classifier speed will result in decrease of combined water.
High temperature inside the mill caused by more heat for
cooking of grinding gypsum will result in decrease of
combined water. The lower temperature inside the mill
resulting from less heat for cooking will result in increase of
combined water.
Fig 2. The schematic diagram of vertical roller mill (VRM).
B. Application to Design of Experiment (DOE) Model
Factorial design was applied to screen factors that may
have significant effects on response(s) because it is the most
efficient available method for conducting multifactor
experiments. The significant factors can then be used to
develop a model to optimize and predict the response [2], if
needed. The most common factorial design is the two level
(or 2k) design. Based on the analysis of variance (ANOVA),
the significant factors are determined and used to produce
the multiple regression prediction model. The multiple
regression model representation of a 24 factorial experiment
can be written as:
4,...,2,1,4,...,2,1,4,...,2,1,4,...,2,1,ˆ
ˆˆˆˆˆˆˆˆ0
lkjiDCBA
CBABADCBAY
lkjiijkl
kjiijkjiijllkkjjii
(2)
where Y is the response, 0
is the mean of all treatment
combinations,i
,j ,
k ,l ,
ij ,
ijk , and
ijkl are half of the
effect estimated corresponding to significant effects, Ai, Bj,
Ck, and Dl are coded variables that represent significant
Proceedings of the World Congress on Engineering 2017 Vol I WCE 2017, July 5-7, 2017, London, U.K.
ISBN: 978-988-14047-4-9 ISSN: 2078-0958 (Print); ISSN: 2078-0966 (Online)
WCE 2017
effects and take on values between -1 and +1, and is a
random error term. The random error terms are assumed to
have a normal distribution, a constant variance, and are
independent [8].
C. Application to Fuzzy Inference System (FIS) Model
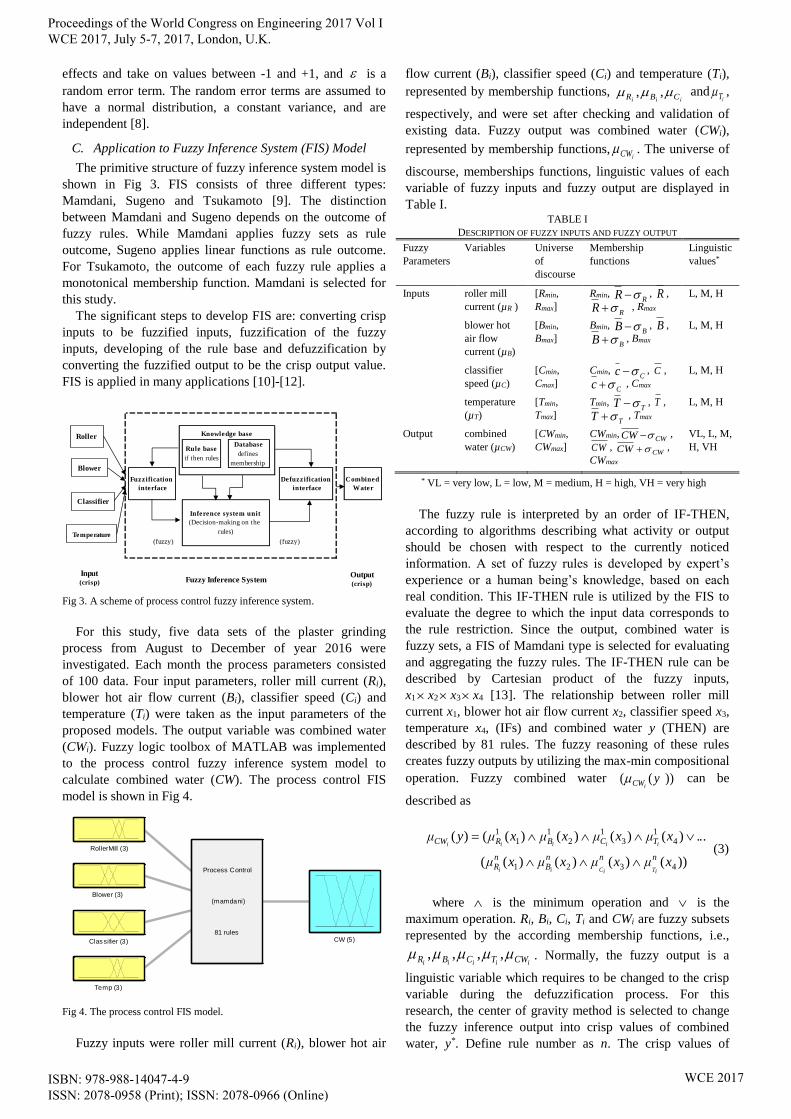
The primitive structure of fuzzy inference system model is
shown in Fig 3. FIS consists of three different types:
Mamdani, Sugeno and Tsukamoto [9]. The distinction
between Mamdani and Sugeno depends on the outcome of
fuzzy rules. While Mamdani applies fuzzy sets as rule
outcome, Sugeno applies linear functions as rule outcome.
For Tsukamoto, the outcome of each fuzzy rule applies a
monotonical membership function. Mamdani is selected for
this study.
The significant steps to develop FIS are: converting crisp
inputs to be fuzzified inputs, fuzzification of the fuzzy
inputs, developing of the rule base and defuzzification by
converting the fuzzified output to be the crisp output value.
FIS is applied in many applications [10]-[12].
Database
defines
membership
Combined
Water
Inference system unit
(Decision-making on the
rules)
(fuzzy) (fuzzy)
Fuzzy Inference System
Knowledge base
Rule base
if then rules
Fuzzification
interface
Defuzzification
interface
Input(crisp)
Output(crisp)
Roller
Blower
Classifier
Temperature
Fig 3. A scheme of process control fuzzy inference system.
For this study, five data sets of the plaster grinding
process from August to December of year 2016 were
investigated. Each month the process parameters consisted
of 100 data. Four input parameters, roller mill current (Ri),
blower hot air flow current (Bi), classifier speed (Ci) and
temperature (Ti) were taken as the input parameters of the
proposed models. The output variable was combined water
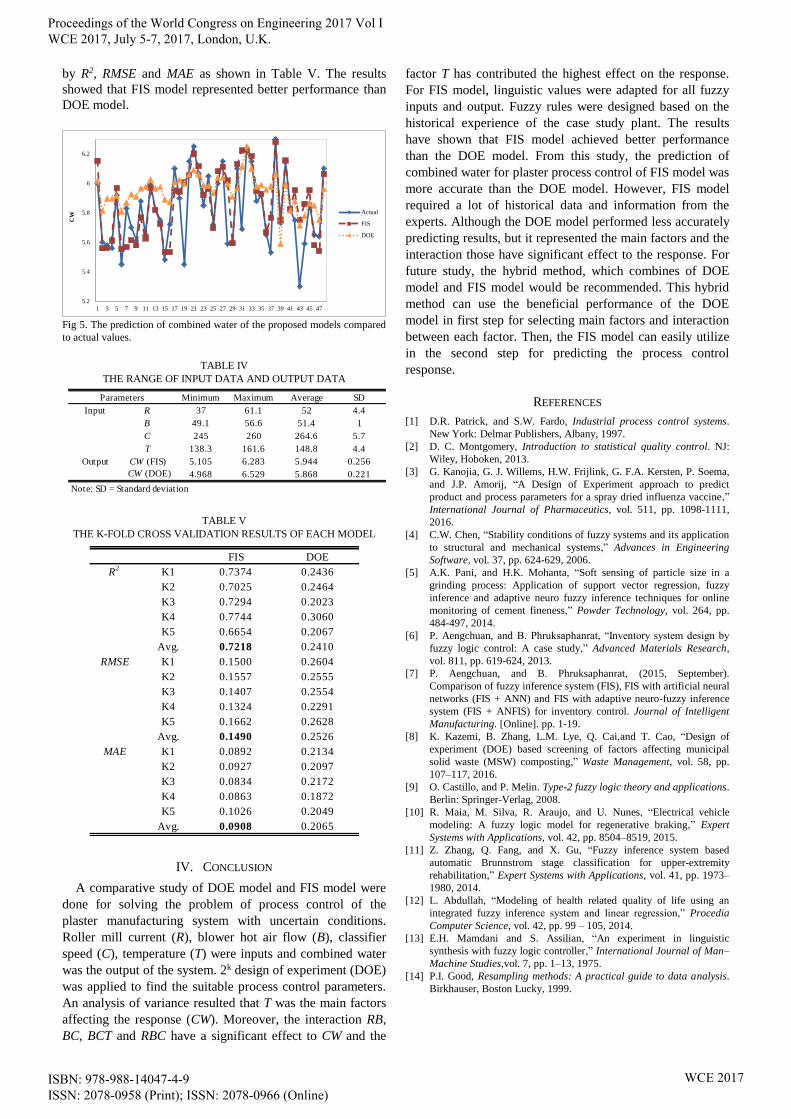
(CWi). Fuzzy logic toolbox of MATLAB was implemented
to the process control fuzzy inference system model to
calculate combined water (CW). The process control FIS
model is shown in Fig 4.
System Process Control: 4 inputs , 1 outputs, 81 rules
RollerMill (3)
Blower (3)
Classifier (3)
Temp (3)
CW (5)
Process Control
(mamdani)
81 rules
Fig 4. The process control FIS model.
Fuzzy inputs were roller mill current (Ri), blower hot air
flow current (Bi), classifier speed (Ci) and temperature (Ti),
represented by membership functions, iii CBR ,, and
iT ,
respectively, and were set after checking and validation of
existing data. Fuzzy output was combined water (CWi),
represented by membership functions,iCW . The universe of
discourse, memberships functions, linguistic values of each
variable of fuzzy inputs and fuzzy output are displayed in
Table I. TABLE I
DESCRIPTION OF FUZZY INPUTS AND FUZZY OUTPUT
Fuzzy
Parameters
Variables Universe
of
discourse
Membership
functions
Linguistic
values*
Inputs roller mill
current (µR )
[Rmin,
Rmax]
Rmin, RR , R ,
RR , Rmax
L, M, H
blower hot
air flow
current (µB)
[Bmin,
Bmax]
Bmin, BB , B ,
BB , Bmax
L, M, H
classifier
speed (µC)
[Cmin,
Cmax]
Cmin, Cc , C ,
Cc , Cmax
L, M, H
temperature
(µT)
[Tmin,
Tmax]
Tmin, TT , T ,
TT , Tmax
L, M, H
Output combined
water (µCW)
[CWmin,
CWmax]
CWmin, CWCW ,
CW , CWCW ,
CWmax
VL, L, M,
H, VH
* VL = very low, L = low, M = medium, H = high, VH = very high
The fuzzy rule is interpreted by an order of IF-THEN,
according to algorithms describing what activity or output
should be chosen with respect to the currently noticed
information. A set of fuzzy rules is developed by expert’s
experience or a human being’s knowledge, based on each
real condition. This IF-THEN rule is utilized by the FIS to
evaluate the degree to which the input data corresponds to
the rule restriction. Since the output, combined water is
fuzzy sets, a FIS of Mamdani type is selected for evaluating
and aggregating the fuzzy rules. The IF-THEN rule can be
described by Cartesian product of the fuzzy inputs,
x1 x2 x3 x4 [13]. The relationship between roller mill
current x1, blower hot air flow current x2, classifier speed x3,
temperature x4, (IFs) and combined water y (THEN) are
described by 81 rules. The fuzzy reasoning of these rules
creates fuzzy outputs by utilizing the max-min compositional
operation. Fuzzy combined water ))(( yiCW can be
described as
))()()()((
.)()()()(()(
4321
41
31
21
11
xμxμxμxμ
..xμxμxμxμyμ
nnnB
nR
TCBRCW
iTiCii
iiiii
(3)
where is the minimum operation and is the
maximum operation. Ri, Bi, Ci, Ti and CWi are fuzzy subsets
represented by the according membership functions, i.e.,
iiiii CWTCBR ,,,, . Normally, the fuzzy output is a
linguistic variable which requires to be changed to the crisp
variable during the defuzzification process. For this
research, the center of gravity method is selected to change
the fuzzy inference output into crisp values of combined
water, y*. Define rule number as n. The crisp values of
Proceedings of the World Congress on Engineering 2017 Vol I WCE 2017, July 5-7, 2017, London, U.K.
ISBN: 978-988-14047-4-9 ISSN: 2078-0958 (Print); ISSN: 2078-0966 (Online)
WCE 2017

combined water are computed as
81
1
81
1*
)(
))((
n
nCW
n
n
y
yy
y
i
iCW
for i = 1, 2, ..., n (4)
D. Performance Parameters
The models can be evaluated with the statistical
parameters: the coefficient of determination (R2), the root
mean squared error (RMSE) and the mean absolute error
(MAE) as represented in equations (5), (6) and (7).
n
i
i
n
i
ii
iyy
yy
R
1
2
1
2
2 1 (5)
n
yy
RMSE
n
i
ii
1
2
(6)
n
yy
MAE
n
i
ii
1 , (7)
where iy is the actual output.
iy is the predicted model
output. iy is the average of actual output. n is the total
number of samples.
Actually R2 has a value between zero and one and
represents the gap between dependent variables and
independent variables which interprets the variability of the
prediction. A value for R2 approaching one implies a good
fit of predicting model and a value approaching zero implies
a poor fit. MAE would disclose if the results suffer from a
bias between the predicted and actual datasets. RMSE is a
measure adapted to calculate the error between predicted
values and the actual values. RMSE and MAE are positive
numbers with no upper limit.
III. RESULTS AND DISCUSSION
In this study, statistically significant factors that affect the
performance of process control were screened based on the
DOE technique. A 2k full factorial design was applied to
study the effects of four factors, roller mill current (R),
blower hot air flow current (B), classifier speed (C) and
temperature (T). In addition, combined water (CW) was also
used as responses to evaluate process performance. For four
factors, the design requires 16 runs with 3 replicates which
are totally 48 runs as shown in Table II.
The analysis of variance of experimental design shows
that T are the main factors affecting the response (CW).
Moreover, the results also show that the interaction RB, BC,
BCT and RBC have a significant effect to CW and the factor
T has contributed the highest effect on the response.
The regression model of experiment has been formulated
as the follow and used to predict the results for comparing
with FIS model. TABLE II
24 EXPERIMENTAL DESIGN
Run R B C T 1 2 3
1 50 50 245 146 6.26 6.16 6.19
2 60 50 245 146 6.21 5.99 6.20
3 50 61 245 146 6.19 5.98 6.05
4 60 61 245 146 6.20 6.13 5.95
5 50 50 260 146 6.00 5.65 5.74
6 60 50 260 146 6.16 6.22 6.15
7 50 61 260 146 6.20 6.16 6.14
8 60 61 260 146 6.05 5.83 6.17
9 50 50 245 156 5.10 5.25 5.30
10 60 50 245 156 5.41 5.27 5.73
11 50 61 245 156 5.65 5.70 5.72
12 60 61 245 156 5.70 5.54 5.73
13 50 50 260 156 5.72 5.83 5.60
14 60 50 260 156 5.92 6.10 5.75
15 50 61 260 156 5.50 5.89 5.10
16 60 61 260 156 5.18 5.16 5.34
CW(Replicates)
TABLE III
THE COMPARISON OF STATISTICAL VALUES OF 5 DATA SETS
Data set FIS DOE
R2 1 0.8045 0.1223
2 0.6939 0.0415
3 0.5502 0.0026
4 0.9898 0.3429
5 0.5768 0.1584
Avg. 0.7230 0.1335
RMSE 1 0.1211 0.3366
2 0.1804 0.3718
3 0.2013 0.4019
4 0.0251 0.3639
5 0.1476 0.2781
Avg. 0.1351 0.3505
MAE 1 0.0698 0.3537
2 0.1083 0.2946
3 0.0950 0.4793
4 0.0253 0.5055
5 0.0825 0.2611
Avg. 0.0762 0.3788
RBCBCRB
BCTTY
05062.07479.007521.0
12229.026646.0816042.5ˆ
(8)
The FIS process control model of the plaster
manufacturing system has been modeled systematically as
well as with DOE approach. The prediction of combined
water of both models compared to actual values represented
that the FIS model outperformed the DOE model (as shown
in Fig 5). The comparison of statistical values of 5 data sets
for each model is displayed in Table III.
The results have validated with K-fold cross validation
[14] which was utilized for further evaluation of the
proposed models efficiency. In this study, the total 5 data
sets were divided into 5 even groups, and then the training
model was executed 5 times by leaving one group out at
each time for checking the model generality. The range of
input data and output data for each variable is shown in
Table IV. The average accuracy of the models was described
Proceedings of the World Congress on Engineering 2017 Vol I WCE 2017, July 5-7, 2017, London, U.K.
ISBN: 978-988-14047-4-9 ISSN: 2078-0958 (Print); ISSN: 2078-0966 (Online)
WCE 2017
by R2, RMSE and MAE as shown in Table V. The results
showed that FIS model represented better performance than
DOE model.
5.2
5.4
5.6
5.8
6
6.2
1 3 5 7 9 11 13 15 17 19 21 23 25 27 29 31 33 35 37 39 41 43 45 47
CW
Actual
FIS
DOE
Fig 5. The prediction of combined water of the proposed models compared
to actual values.
TABLE IV
THE RANGE OF INPUT DATA AND OUTPUT DATA
Minimum Maximum Average SD
Input R 37 61.1 52 4.4
B 49.1 56.6 51.4 1
C 245 260 264.6 5.7
T 138.3 161.6 148.8 4.4
Output CW (FIS) 5.105 6.283 5.944 0.256
CW (DOE) 4.968 6.529 5.868 0.221
Note: SD = Standard deviation
Parameters
TABLE V
THE K-FOLD CROSS VALIDATION RESULTS OF EACH MODEL
FIS DOE
R2
K1 0.7374 0.2436
K2 0.7025 0.2464
K3 0.7294 0.2023
K4 0.7744 0.3060
K5 0.6654 0.2067
Avg. 0.7218 0.2410
RMSE K1 0.1500 0.2604
K2 0.1557 0.2555
K3 0.1407 0.2554
K4 0.1324 0.2291
K5 0.1662 0.2628
Avg. 0.1490 0.2526
MAE K1 0.0892 0.2134
K2 0.0927 0.2097
K3 0.0834 0.2172
K4 0.0863 0.1872
K5 0.1026 0.2049
Avg. 0.0908 0.2065
IV. CONCLUSION
A comparative study of DOE model and FIS model were
done for solving the problem of process control of the
plaster manufacturing system with uncertain conditions.
Roller mill current (R), blower hot air flow (B), classifier
speed (C), temperature (T) were inputs and combined water
was the output of the system. 2k design of experiment (DOE)
was applied to find the suitable process control parameters.
An analysis of variance resulted that T was the main factors
affecting the response (CW). Moreover, the interaction RB,
BC, BCT and RBC have a significant effect to CW and the
factor T has contributed the highest effect on the response.
For FIS model, linguistic values were adapted for all fuzzy
inputs and output. Fuzzy rules were designed based on the
historical experience of the case study plant. The results
have shown that FIS model achieved better performance
than the DOE model. From this study, the prediction of
combined water for plaster process control of FIS model was
more accurate than the DOE model. However, FIS model
required a lot of historical data and information from the
experts. Although the DOE model performed less accurately
predicting results, but it represented the main factors and the
interaction those have significant effect to the response. For
future study, the hybrid method, which combines of DOE
model and FIS model would be recommended. This hybrid
method can use the beneficial performance of the DOE
model in first step for selecting main factors and interaction
between each factor. Then, the FIS model can easily utilize
in the second step for predicting the process control
response.
REFERENCES
[1] D.R. Patrick, and S.W. Fardo, Industrial process control systems.
New York: Delmar Publishers, Albany, 1997.
[2] D. C. Montgomery, Introduction to statistical quality control. NJ:
Wiley, Hoboken, 2013.
[3] G. Kanojia, G. J. Willems, H.W. Frijlink, G. F.A. Kersten, P. Soema,
and J.P. Amorij, “A Design of Experiment approach to predict
product and process parameters for a spray dried influenza vaccine,”
International Journal of Pharmaceutics, vol. 511, pp. 1098-1111,
2016.
[4] C.W. Chen, “Stability conditions of fuzzy systems and its application
to structural and mechanical systems,” Advances in Engineering
Software, vol. 37, pp. 624-629, 2006.
[5] A.K. Pani, and H.K. Mohanta, “Soft sensing of particle size in a
grinding process: Application of support vector regression, fuzzy
inference and adaptive neuro fuzzy inference techniques for online
monitoring of cement fineness,” Powder Technology, vol. 264, pp.
484-497, 2014.
[6] P. Aengchuan, and B. Phruksaphanrat, “Inventory system design by
fuzzy logic control: A case study,” Advanced Materials Research,
vol. 811, pp. 619-624, 2013.
[7] P. Aengchuan, and B. Phruksaphanrat, (2015, September).
Comparison of fuzzy inference system (FIS), FIS with artificial neural
networks (FIS + ANN) and FIS with adaptive neuro-fuzzy inference
system (FIS + ANFIS) for inventory control. Journal of Intelligent
Manufacturing. [Online]. pp. 1-19.
[8] K. Kazemi, B. Zhang, L.M. Lye, Q. Cai,and T. Cao, “Design of
experiment (DOE) based screening of factors affecting municipal
solid waste (MSW) composting,” Waste Management, vol. 58, pp.
107–117, 2016.
[9] O. Castillo, and P. Melin. Type-2 fuzzy logic theory and applications.
Berlin: Springer-Verlag, 2008.
[10] R. Maia, M. Silva, R. Araujo, and U. Nunes, “Electrical vehicle
modeling: A fuzzy logic model for regenerative braking,” Expert
Systems with Applications, vol. 42, pp. 8504–8519, 2015.
[11] Z. Zhang, Q. Fang, and X. Gu, “Fuzzy inference system based
automatic Brunnstrom stage classification for upper-extremity
rehabilitation,” Expert Systems with Applications, vol. 41, pp. 1973–
1980, 2014.
[12] L. Abdullah, “Modeling of health related quality of life using an
integrated fuzzy inference system and linear regression,” Procedia
Computer Science, vol. 42, pp. 99 – 105, 2014.
[13] E.H. Mamdani and S. Assilian, “An experiment in linguistic
synthesis with fuzzy logic controller,” International Journal of Man–
Machine Studies,vol. 7, pp. 1–13, 1975.
[14] P.I. Good, Resampling methods: A practical guide to data analysis.
Birkhauser, Boston Lucky, 1999.
Proceedings of the World Congress on Engineering 2017 Vol I WCE 2017, July 5-7, 2017, London, U.K.
ISBN: 978-988-14047-4-9 ISSN: 2078-0958 (Print); ISSN: 2078-0966 (Online)
WCE 2017