Embed Size (px)
Citation preview
Western Michigan University Western Michigan University
ScholarWorks at WMU ScholarWorks at WMU
Dissertations Graduate College
8-1981
A Comparative Analysis of the Skills and Satisfaction of A Comparative Analysis of the Skills and Satisfaction of
Teenagers Taught Decision-Making Models Teenagers Taught Decision-Making Models
John T. Chapman Western Michigan University
Follow this and additional works at: https://scholarworks.wmich.edu/dissertations
Part of the Student Counseling and Personnel Services Commons
Recommended Citation Recommended Citation Chapman, John T., "A Comparative Analysis of the Skills and Satisfaction of Teenagers Taught Decision-Making Models" (1981). Dissertations. 2547. https://scholarworks.wmich.edu/dissertations/2547
This Dissertation-Open Access is brought to you for free and open access by the Graduate College at ScholarWorks at WMU. It has been accepted for inclusion in Dissertations by an authorized administrator of ScholarWorks at WMU. For more information, please contact [email protected].
A COMPARATIVE ANALYSIS OP THE SKILLS AND SATISFACTION OF
TEENAGERS TAUGHT DECISION-MAKING MODELS
byJohn T. Chapman
A Dissertation Submitted to the
Faculty of The Graduate College in partial fulfillment of the
requirements for the Degree of Doctor of Education
Department of Counseling and Personnel
Western Michigan University Kalamazoo, Michigan
August 1981
Reproduced with permission of the copyright owner. Further reproduction prohibited without permission.
A COMPARATIVE ANALYSIS OP THE SKILLS AND SATISFACTION OF TEENAGERS TAUGHT DECISION-MAKING MODELS
John T. Chapman, Ed.D.Western Michigan University, 1981
This study was designed to measure the effectiveness of two generic types of decision-making models currently used to teach high school students decision-making.
Models that were used in this study were a deductive and an inductive model. Deductive decision-making is the philosophical process, that is a generalization of personal values to specific choice items. Induction is the scientific process; students consider a series of specific items and generalize a decision from the examinations.
Effectiveness in this study was defined as the process skills and student satisfaction with the methods. Individual student differences that were considered in the study were grades, decision-maturity, gender, and cognitive style. There were 32 hypotheses generated comparing the skills and satisfaction of students, with individual differences, using the two different models.
Students who were sampled in the study came from eleven different high schools in Van Buren County in southwestern Michigan. The 124- students in this study attend the Van Buren Skills Center. Students from seven representative vocational programs filled out a researcher
Reproduced with permission of the copyright owner. Further reproduction prohibited without permission.
designed questionnaire that was developed to identify individual student differences. Students were then invited to attend one of the two treatment groups. One of the groups was taught a deductive decision-making process. The other group was taught an inductive decisionmaking process. Both groups were taught by the researcher.
Following the lesson, students in both groups were asked to make five decisions. Decisions the students were asked to make concerned: menu items, dates, cars, houses, and presidential candidates.
A one-factor analysis of variance was used to compare the skills; a chi-square analysis was used to compare satisfaction. a £<.05 level of confidence was set for the study.
The results of the study by individual difference groups were:
Grades1. Students with high grades were more satisfied
with the deductive model than with the inductive model at the £<»05 level of confidence.
2. Students with low grades were more satisfiedwith the inductive model at the £<.05 level of confidence.
3- Students with high grades had higher skillscores using the deductive model at the £<.05 level.
Reproduced with permission of the copyright owner. Further reproduction prohibited without permission.
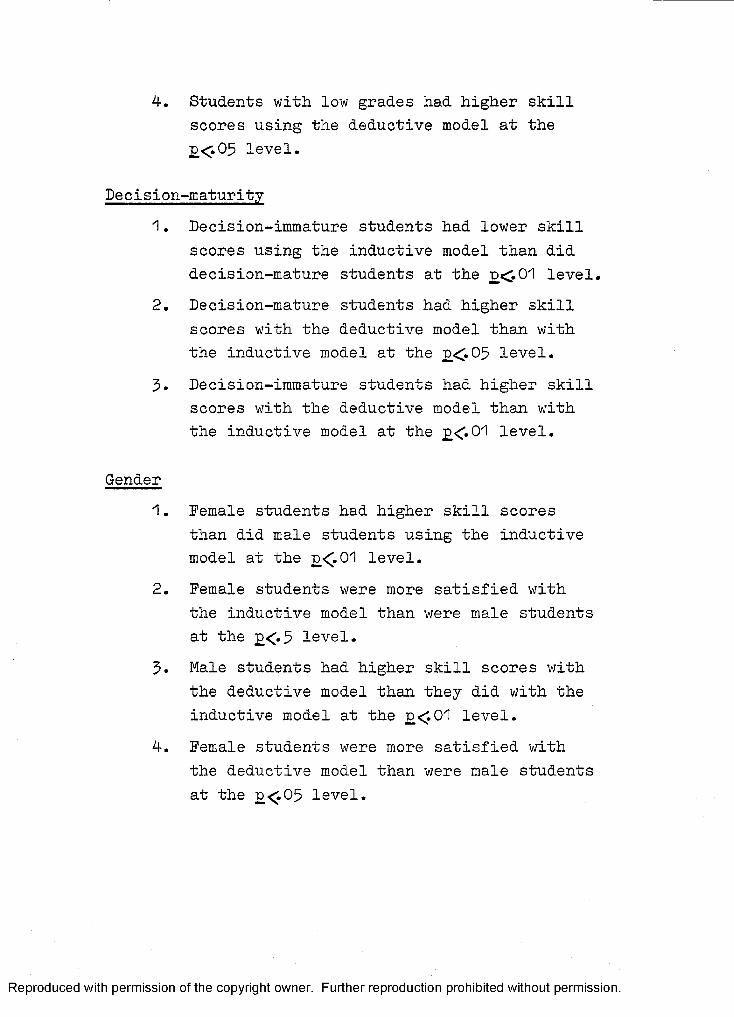
4. Students with, low grades had higher skill scores using the deductive model at the £<•05 level.
Decision-maturity1. Decision-immature students had lower skill
scores using the inductive model than did decision-mature students at the £<.01 level.
2. Decision-mature students had higher skill scores with the deductive model than with the inductive model at the £<.05 level.
3. Decision-immature students had higher skill scores with the deductive model than with the inductive model at the £<.01 level.
Gender1. Female students had higher skill scores
than did male students using the inductive model at the £<.01 level.
2. Female students were more satisfied with the inductive model than were male students at the £<-5 level.
3. Male students had higher skill scores with the deductive model than they did with the inductive model at the £<.01 level.
4. Female students were more satisfied with the deductive model than were male students at the £<.05 level.
Reproduced with permission of the copyright owner. Further reproduction prohibited without permission.
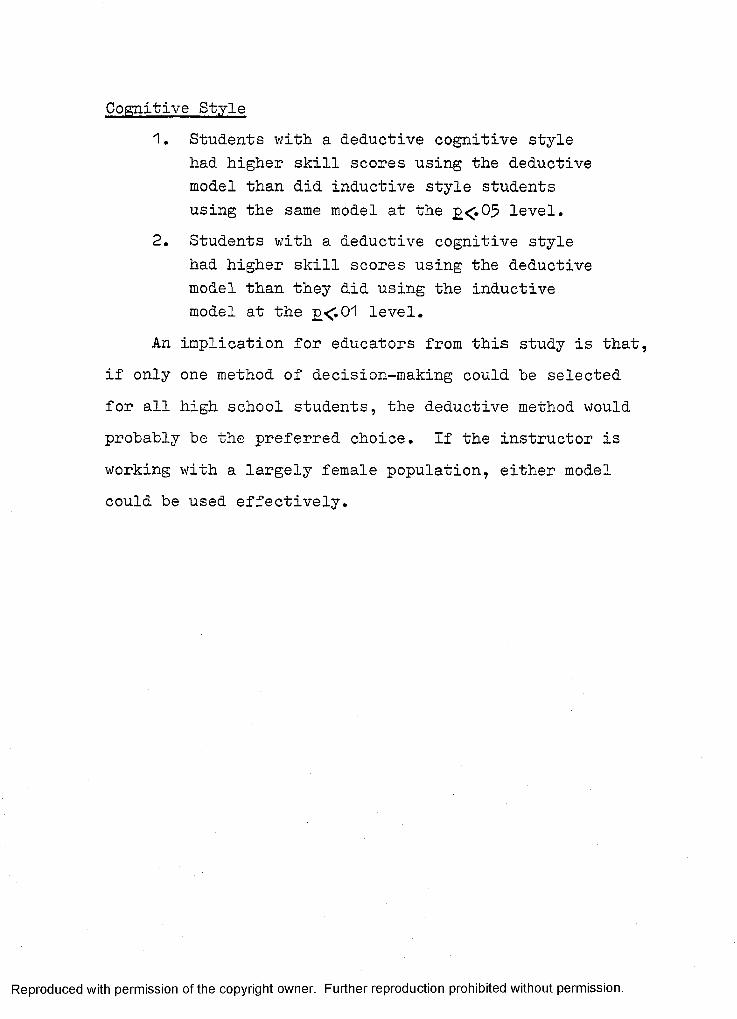
Cognitive Style1. Students with a deductive cognitive style
had higher skill scores using the deductive model than did inductive style students using the same model at the £<.05 level.
2. Students with a deductive cognitive style had higher skill scores using the deductive model than they did using the inductive model at the £<.01 level.
An implication for educators from this study is that, if only one method of decision-making could be selected for all high school students, the deductive method would probably be the preferred choice. If the instructor is working with a largely female population, either model could be used effectively.
Reproduced with permission of the copyright owner. Further reproduction prohibited without permission.
ACKNOWLEDGEMENTS
This study on decision-making is gratefully dedicated to the people whose decisions have had such a major impact on my life and direction.
ACADEMICALLY
PROFESSIONALLY
PERSONALLY
ROMANTICALLY
Thelma Urbick Robert BrashearGilbert Mazer Chris KoronakosBill Martinson Tom CoyneA. L. Sebaly Bill Buys
Harry Miller
Murdoch Chapman Doris Chapman
Peggy Chapman
John T. Chapman
ii
Reproduced with permission of the copyright owner. Further reproduction prohibited without permission.

DID YOU EVER HAVE 10 FINALLY DECIDE AND SAY AS 10 ONE AND LET THE OTHER ONE SLIDE?
IT'S NOT ALWAYS EASY, IT'S NOT OFTEN KIND, DID YOU EVER HAVE TO MAKE UP YOUR MIND?
John Sebastian
111
Reproduced with permission of the copyright owner. Further reproduction prohibited without permission.

INFORMATION TO USERS
This was produced from a copy of a document sent to us for microfilming. While the most advanced technological means to photograph and reproduce this document have been used, the quality is heavily dependent upon the quality of the material submitted.
The following explanation of techniques is provided to help you understand markings or notations which may appear on this reproduction.
1. The sign or "target” for pages apparently lacking from the document photographed is “Missing Page(s)” . If it was possible to obtain the missing page(s) or section, they are spliced into the film along with adjacent pages. This may have necessitated cutting through an image and duplicating adjacent pages to assure you of complete continuity.
2. When an image on the film is obliterated with a round black mark it is an indication that the film inspector noticed either blurred copy because of movement during exposure, or duplicate copy. Unless we meant to delete copyrighted materials that should not have been filmed, you will find a good image of the page in the adjacent frame. If copyrighted materials were deleted you will find a target note listing the pages in the adjacent frame.
3. When a map, drawing or chart, etc., is part of the material being photographed the photographer has followed a definite method in “sectioning” the material. It is customary to begin filming at the upper left hand corner of a large sheet and to continue from left to right in equal sections with small overlaps. If necessary, sectioning is continued again—beginning below the first row and continuing on until complete.
4. For any illustrations that cannot be reproduced satisfactorily by xerography, photographic prints can be purchased at additional cost and tipped into your xerographic copy. Requests can be made to our Dissertations Customer Services Department.
5. Some pages in any document may have indistinct print. In all cases we have filmed the best available copy.
UniversityMicrofilms
International300 N. ZEEB RD., ANN ARBOR, Ml 48106
Reproduced with permission of the copyright owner. Further reproduction prohibited without permission.
8126604
CHAPMAN, JOHN THOMAS
A COMPARATIVE ANALYSIS OF THE SKILLS AND SATISFACTION OF TEENAGERS TAUGHT DECISION-MAKING MODELS
Western Michigan University Ed.D. 1981
UniversityMicrofilms
International 300 N. Zeeb Road, Ann Arbor, M I 48106
Reproduced with permission of the copyright owner. Further reproduction prohibited without permission.

PLEASE NOTE:
In all cases this material has been filmed in the best possible way from the available copy. Problems encountered with this document have been identified here with a check mark V .
1. Glossy photographs or pages_____
2. Colored illustrations, paper or print_____
3. Photographs with dark background_____
4. Illustrations are poor copy______
5. Pages with black marks, not original copy______
6. Print shows through as there is text on both sides of page______
7. Indistinct, broken or small print on several pages ^
8. Print exceeds margin requirements_____
9. Tightly bound copy with print lost in spine_____
10. Computer printout pages with indistinct print______
11. Page(s)___________ lacking when material received, and not available from school orauthor.
12. Page(s)___________ seem to be missing in numbering only as text follows.
13. Two pages numbered___________. Text follows.
14. Curling and wrinkled pages_____
15. Other___________________________________________________________________
UniversityMicrofilms
International
Reproduced with permission of the copyright owner. Further reproduction prohibited without permission.
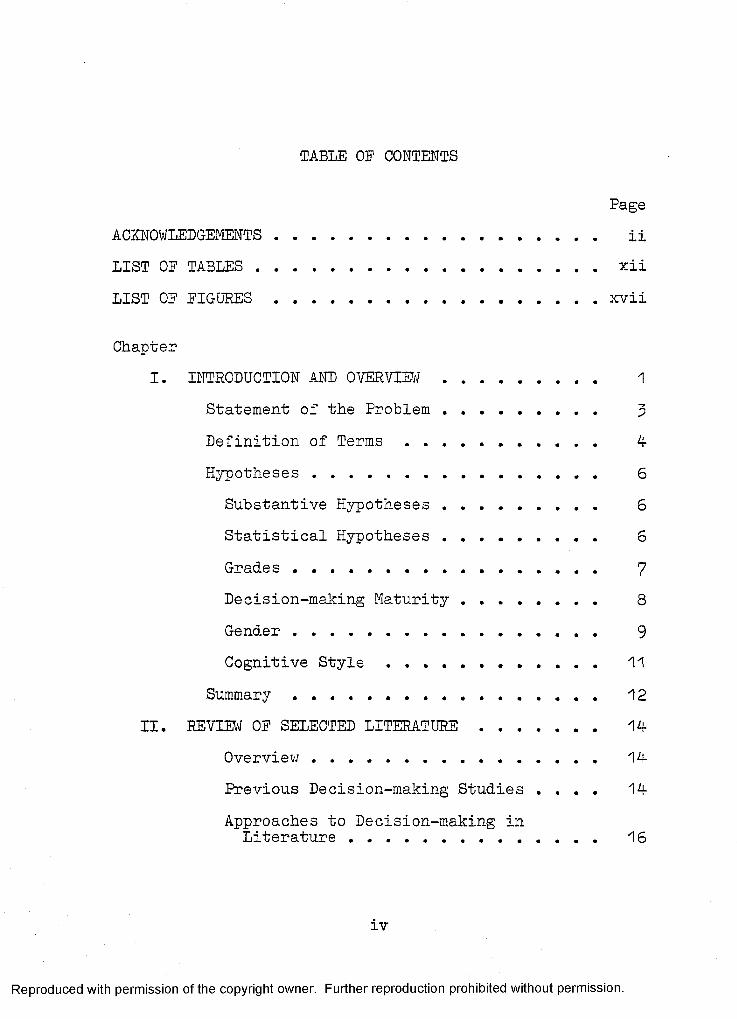
TABLE OF CONTENTS
PageACKNOWLEDGEMENTS ............................... iiLIST OF TABLES................................... xiiLIST OF FIGURES................................ xvii
ChapterI. INTRODUCTION AND OVERVIEW ............... 1
Statement of the Problem .............. 3Definition of Te r m s.................. 4-Hypotheses ........................... 6Substantive Hypotheses .............. 6Statistical Hypotheses .............. 6Grades ............................. 7Decision-making Maturity ............. 8Gender ............................. 9Cognitive Style .................... 11
Summary............................. 12II. REVIEW OF SELECTED LITERATURE........... 14-
Overview ........................... 14-Previous Decision-making Studies . . . . 14-Approaches to Decision-making inLiterature....................... 16
iv
Reproduced with permission of the copyright owner. Further reproduction prohibited without permission.
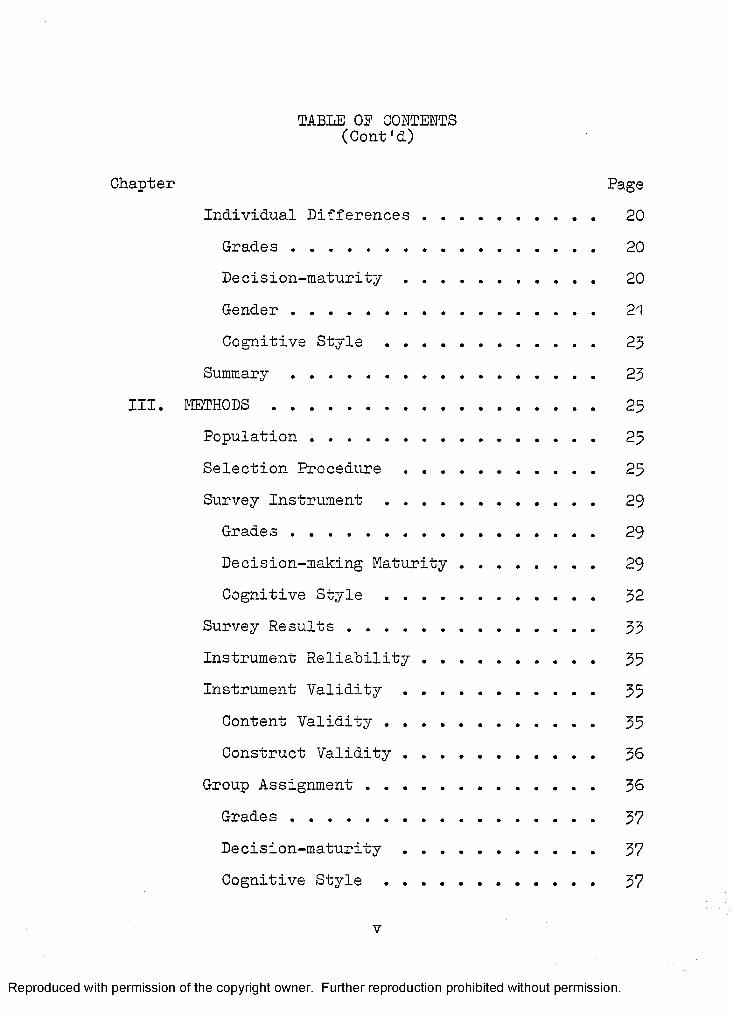
TABLE OE CONTENTS(Cont'd)
Chapter PageIndividual Differences ................ 20Grades............................. 20Decision-maturity.................... 20Gender....................... 21Cognitive Style .................... 23
Summary............................. 23III. METHODS............................... 25
Population........................... 25Selection Procedure ................. 25Survey Instrument .................... 29Grades............................. 29Decision-making Maturity ........... . 29Cognitive Style .................... 32
Survey Results ....................... 33Instrument Reliability ................ 35Instrument Validity . ................ 35Content Validity .................... 35Construct Validity . ................ 36
Group Assignment...................... 36Grades............................. 37Decision-maturity ................. 37Cognitive S t y l e ............ 37
v
Reproduced with permission of the copyright owner. Further reproduction prohibited without permission.
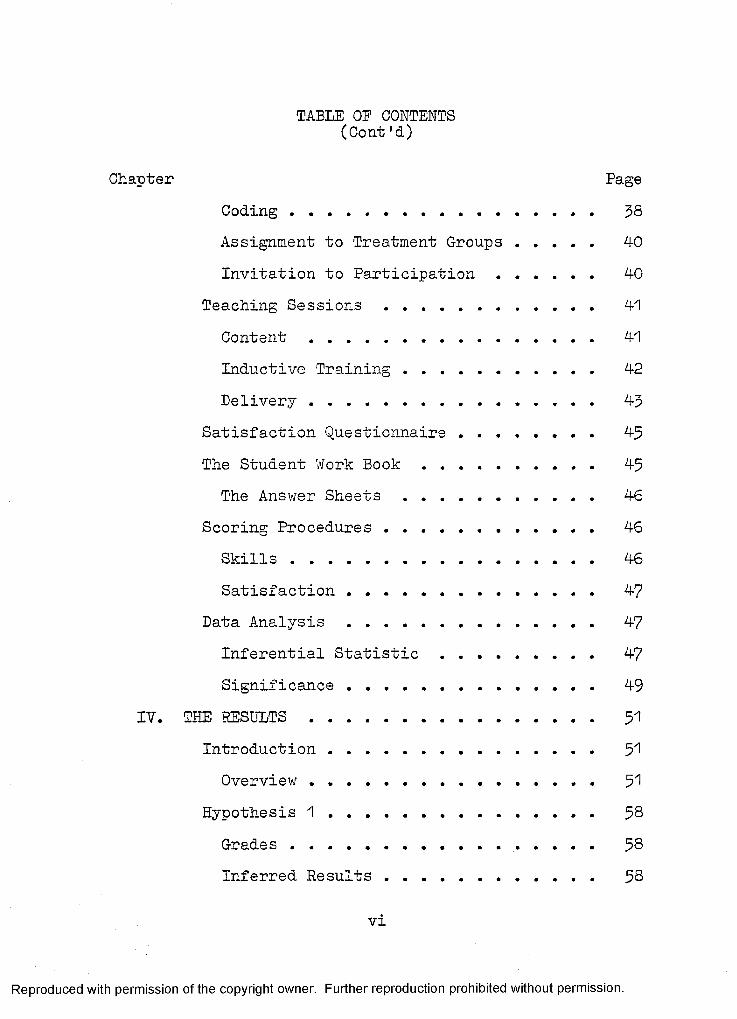
TABLE OF CONTENTS(Cont’d)
Chapter PageCoding............................. 38Assignment to Treatment Groups ....... 40Invitation to Participation ......... 40
Teaching Sessions .................... 41Content........................... 41Inductive Training .................. 42Delivery........................... 43
Satisfaction Questionnaire ............. 45The Student Work Book ......... 45The Answer Sheets.................. 46
Scoring Procedures .................... 46Skills............................. 46Satisfaction ....................... 47
Data Analysis....................... 47Inferential Statistic .............. 47Significance .............. . . . . . 49
IV. THE RESULTS........................... 51Introduction ......................... 51Overview........................... 51
Hypothesis 1 .............. 58Grades................ 58Inferred Results .................... 58
vi
Reproduced with permission of the copyright owner. Further reproduction prohibited without permission.
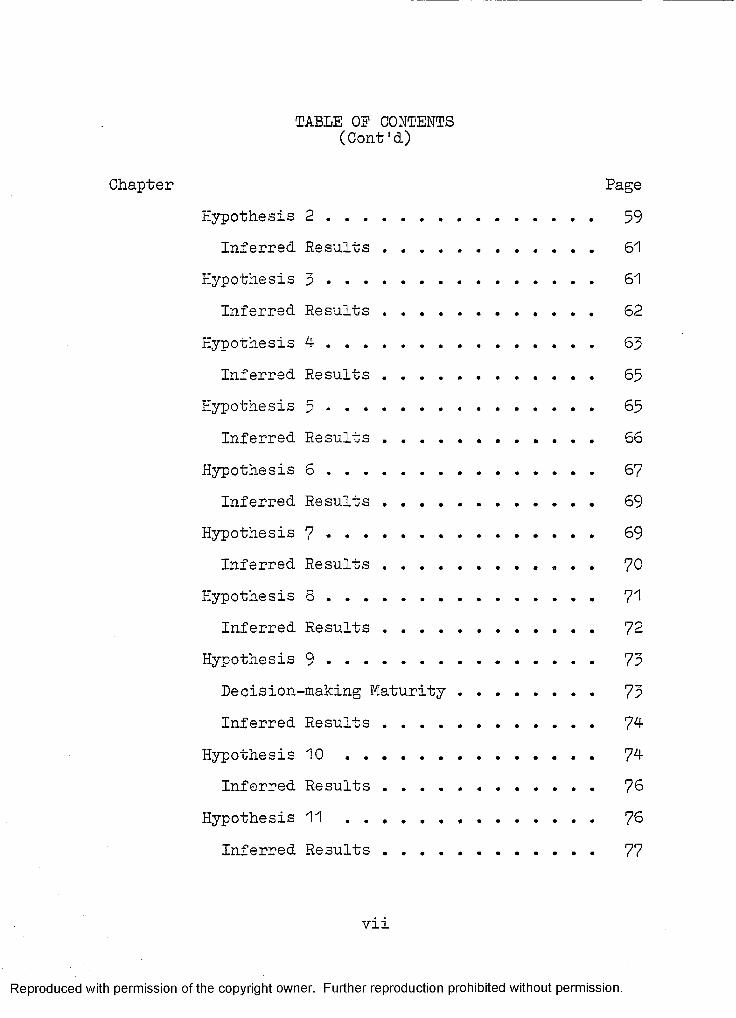
TABLE OP CONTENTS(Cont'd)
Chapter PageHypothesis 2 ......................... 59Inferred Results......... 61
Hypothesis 3 ......................... 61Inferred Results......... 62
Hypothesis 4 ......................... 63Inferred Results .................... 65
Hypothesis 5 ......................... 65Inferred Results .................... 66
Hypothesis 6 ......................... 67Inferred Results .................... 69
Hypothesis 7 ............ 69Inferred Results................» . . 70
Hypothesis 8 ..................... 71Inferred Results .................... 72
Hypothesis 9 ......................... 73Decision-making Maturity ............. 73Inferred Results .................... 74
Hypothesis 1 0 ....................... 74Inferred Results . . . . . ........... 76
Hypothesis 1 1 ................... 76Inferred Results .................... 77
vii
Reproduced with permission of the copyright owner. Further reproduction prohibited without permission.
TABLE OP CONTENTS(Cont'd)
Chapter PageHypothesis 1 2 ........................ 78Inferred Results ........ . . . . . . 80
Hypothesis 1 3 ....................... 80Inferred Results ................. 81
Hypothesis 14-............... 82Inferred Results.......... 84-
Hypothesis 1 5 ....................... 84-Inferred Results ................. 85
Hypothesis 1 6 ............. 85Inferred Results ................. 86
Hypothesis 1 7 ....................... 87Gender........................... 87Inferred Results ................. 87
Hypothesis 1 8 .......... 88Inferred Results ................. 90
Hypothesis 1 9 ....................... 91
Inferred Results ................. 91Hypothesis 2 0 ....................... 92Inferred Results................. 94-
Hypothesis 2 1 ....................... 94-Inf erred Results . . . . . ........ 95
Hypothesis 2 2 ....................... 96
viii
Reproduced with permission of the copyright owner. Further reproduction prohibited without permission.
TABLE 03? CONTENTS(Cont'd)
Chapter PageInferred Results .................. 97
Hypothesis 2 3 ...................... 98Inferred Results ......... . . . . . 99
Hypothesis 2 4 ................ 99Inferred Results .................. 100
Hypothesis 2 5 ...................... 101Cognitive Style .................... 101Inferred Results.............. 101
Hypothesis 2 6 ...................... 102Inferred Results .................. 104
Hypothesis 2 7 ................. 104Inferred Results.................. 105
Hypothesis 2 8 ...................... 105Inferred Results .................. 107
Hypothesis 2 9 ...................... 107Inferred Results .................. 108
Hypothesis 3 0 ...................... 109Inferred Results .................. 110
Hypothesis 3 1 ...................... 111Inferred Results .................. 112
Hypothesis 3 2 ...................... 112Inferred Results .................. 113
ix
Reproduced with permission of the copyright owner. Further reproduction prohibited without permission.
TABLE OP CONTENTS(Cont'd)
Chapter PageCompilation Summary.................. 114-Grad.es . ....................... 114-Decision-maturity .................. 115Gender........................... 115Cognitive Style.............. 116
V. SUMMARY, DISCUSSION, AND RECOMMENDATIONS . 117Introduction ....................... 117Grades............................. 117Summary ................... 117Discussion....................... 118Recommendations .................... 119
Decision-maturity......... 119Summary................... 119Discussion....................... 120Recommendations .................... 121
Gender............................. 121Summary................ .......... 121Discussion....................... 122Recommendations................ 123
Cognitive Style............ 123Summary........................... 123Discussion....................... 124-
x
Reproduced with permission of the copyright owner. Further reproduction prohibited without permission.
TABLE OF CONTENTS(Cont'd)
Chapter PageRecommendations .................... 125
Overall Summary, Discussion, andRecommendations .................... 125
APPENDIX A .................................. 129APPENDIX B .................................. 135APPENDIX C .................................. 143APPENDIX D .................................. 148APPENDIX E .................................. 157APPENDIX P .................................. 160APPENDIX G .................................. 162APPENDIX H .................................. 164BIBLIOGRAPHY................................. 166
xi
Reproduced with permission of the copyright owner. Further reproduction prohibited without permission.
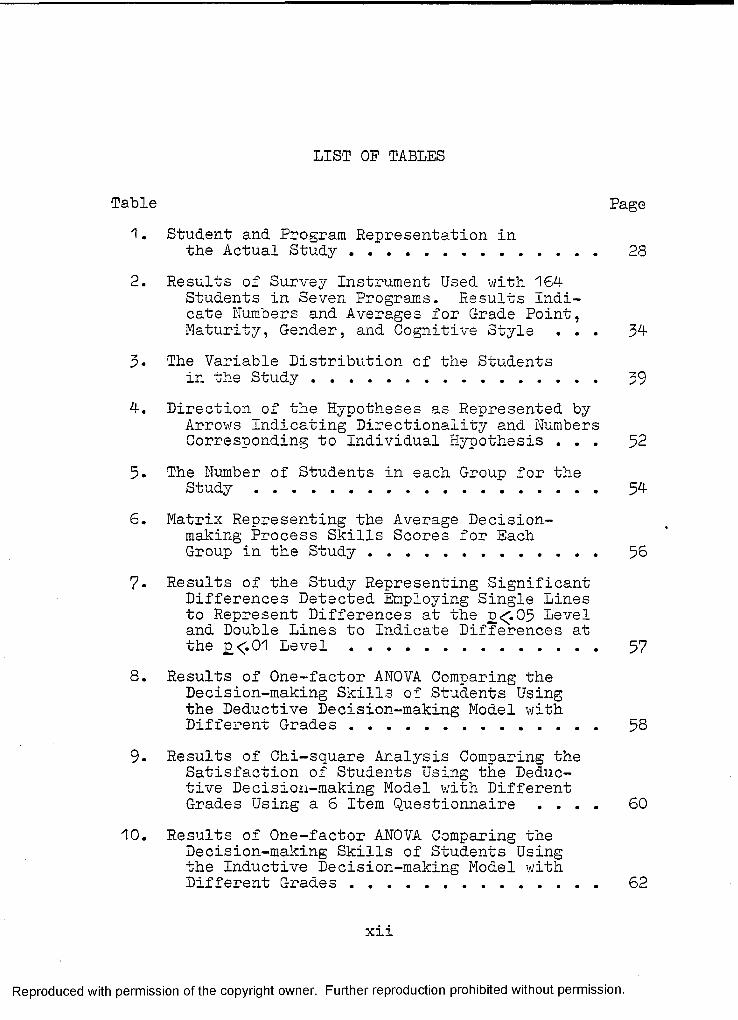
LIST OF TABLES
Table Page1. Student and Program Representation in
the Actual Study....................... 282. Results of Survey Instrument Used with 164-
Students in Seven Programs. Results Indicate Numbers and Averages for Grade Point, Maturity, Gender, and Cognitive Style . . . 34-
3. The Variable Distribution of the Studentsin the Study........................... 39
4-. Direction of the Hypotheses as Represented by Arrows Indicating Directionality and Numbers Corresponding to Individual Hypothesis . . . 52
5. The Number of Students in each Group for theS t u d y ................................. 54-
6. Matrix Representing the Average Decisionmaking Process Skills Scores for EachGroup in the Study...................... 56
7* Results of the Study Representing Significant Differences Detected Employing Single Lines to Represent Differences at the £<.05 Level and Double Lines to Indicate Differences at the £<.01 L e v e l ....................... 57
8. Results of One-factor ANOVA Comparing theDecision-making Skills of Students Using the Deductive Decision-making Model with Different Grades . . . . . .............. 58
9. Results of Chi-square Analysis Comparing theSatisfaction of Students Using the Deductive Decision-making Model with Different Grades Using a 6 Item Questionnaire . . . . 60
10. Results of One-factor ANOVA Comparing the Decision-making Skills of Students Using the Inductive Decision-making Model with Different Grades ....................... 62
xii
Reproduced with permission of the copyright owner. Further reproduction prohibited without permission.
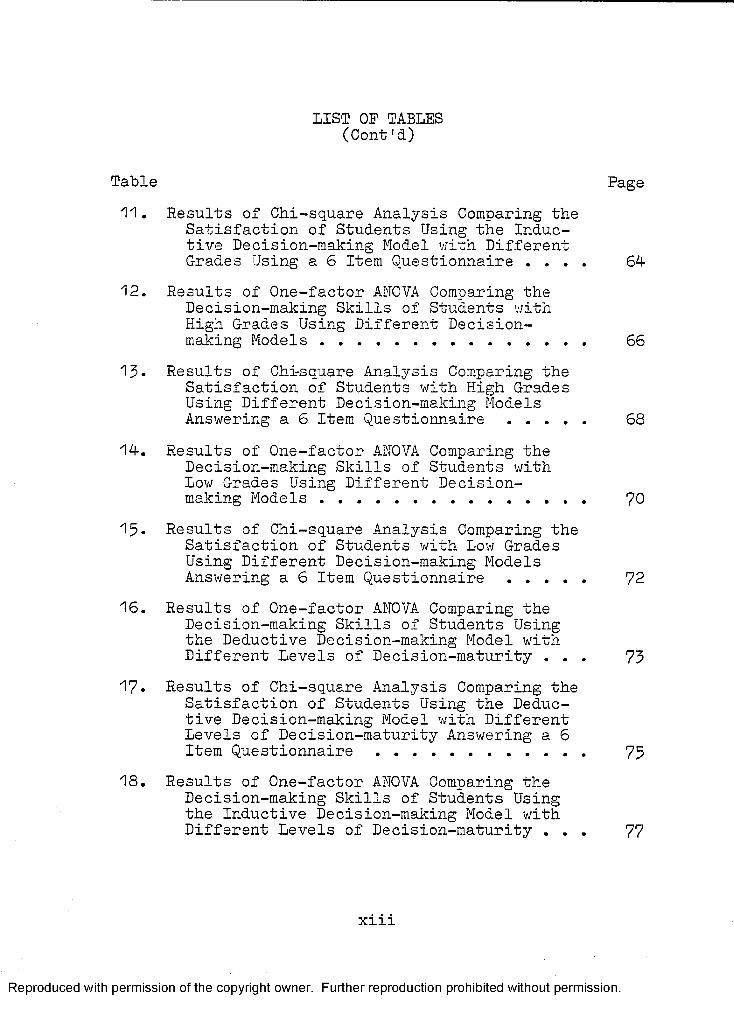
LIST OF TABLES(Cont'&)
Table Page11. Results of Chi-square Analysis Comparing the
Satisfaction of Students Using the Inductive Decision-making Model with Different Grades Using a 6 Item Questionnaire . . . . 64-
12. Results of One-factor ANOVA Comparing theDecision-making Skills of Students with High C-rades Using Different Decisionmaking Models......................... 66
13- Results of Chi-square Analysis Comparing theSatisfaction of Students with High Grades Using Different Decision-making Models Answering a 6 Item Questionnaire....... 68
14-. Results of One-factor ANOVA Comparing theDecision-making Skills of Students with Low Grades Using Different Decisionmaking Models......................... 70
15* Results of Chi-square Analysis Comparing the Satisfaction of Students with Low Grades Using Different Decision-making Models Answering a 6 Item Questionnaire....... 72
16. Results of One-factor ANOVA Comparing theDecision-making Skills of Students Using the Deductive Decision-making Model with Different Levels of Decision-maturity . . . 73
17. Results of Chi-square Analysis Comparing theSatisfaction of Students Using the Deductive Decision-making Model with Different Levels of Decision-maturity Answering a 6 Item Questionnaire.......... 75
18. Results of One-factor ANOVA Comparing theDecision-making Skills of Students Using the Inductive Decision-making Model with Different Levels of Decision-maturity . . . 77
xiii
Reproduced with permission of the copyright owner. Further reproduction prohibited without permission.
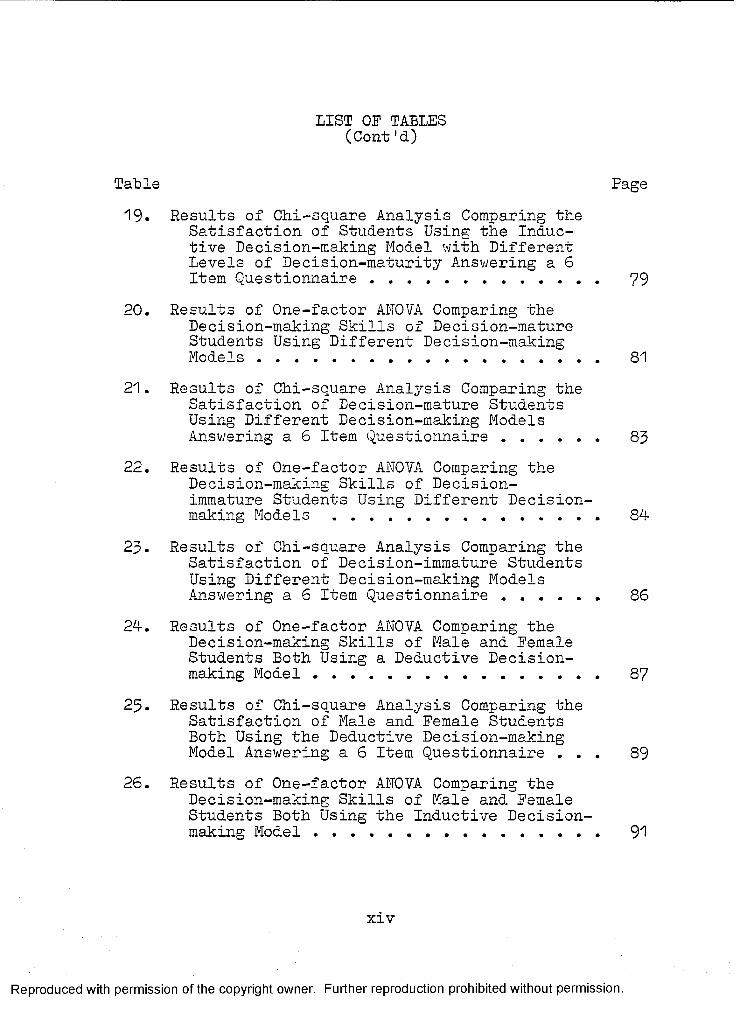
LIST OF TABLES(Cont'd)
Table Page19. Results of Chi-square Analysis Comparing the
Satisfaction of Students Using the Inductive Decision-making Model with Different Levels of Decision-maturity Answering a 6 Item Questionnaire...................... 79
20. Results of One-factor ANOVA Comparing theDecision-making Skills of Decision-mature Students Using Different Decision-making Models................................. 81
21. Results of Chi-square Analysis Comparing theSatisfaction of Decision-mature StudentsUsing Different Decision-making ModelsAnswering a 6 Item Questionnaire........ 83
22. Results of One-factor ANOVA Comparing theDecision-making Skills of Decision- immature Students Using Different Decisionmaking Models......................... 84-
23. Results of Chi-square Analysis Comparing theSatisfaction of Decision-immature Students Using Different Decision-making Models Answering a 6 Item Questionnaire........ 86
24-. Results of One-factor ANOVA Comparing theDecision-making Skills of Male and Female Students Both Using a Deductive Decisionmaking Model........................... 87
25. Results of Chi-square Analysis Comparing theSatisfaction of Male and Female Students Both Using the Deductive Decision-making Model Answering a 6 Item Questionnaire . . . 89
26. Results of One-factor ANOVA Comparing theDecision-making Skills of Male and Female Students Both Using the Inductive Decisionmaking Model........................... 91
xiv
Reproduced with permission of the copyright owner. Further reproduction prohibited without permission.
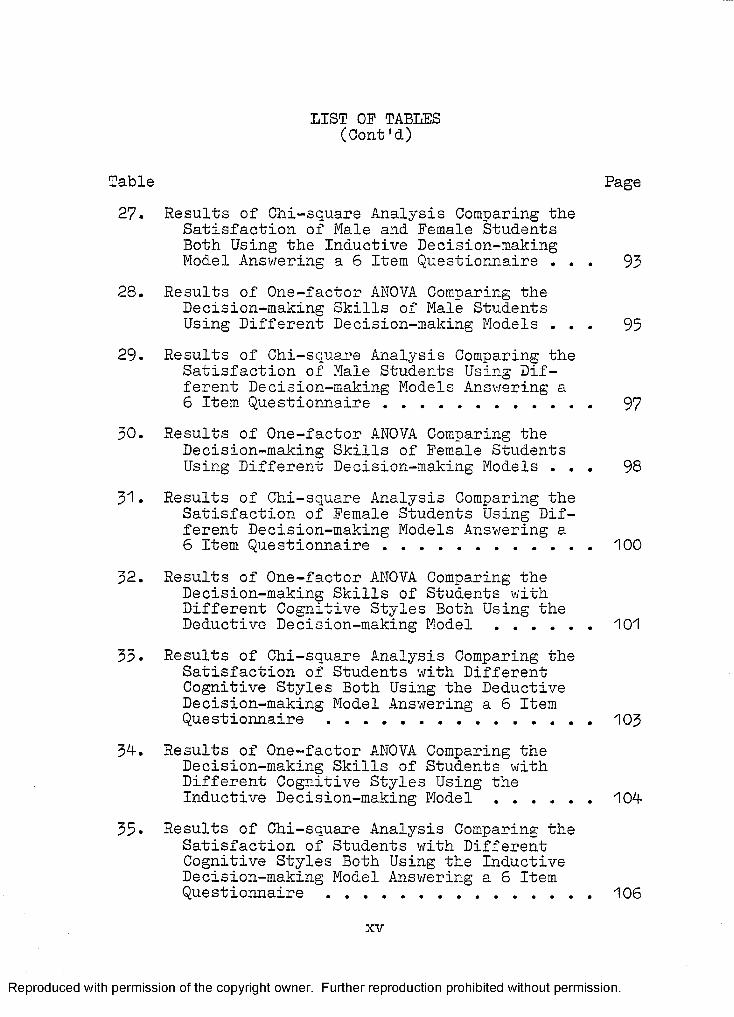
LIST OP TABLES(Cont'd)
Table27.
28.
29.
30.
31.
32.
33.
34-.
33.
PageResults of Chi-square Analysis Comparing the Satisfaction of Male and Female Students Both Using the Inductive Decision-making Model Answering a 6 Item Questionnaire . . . 93
Results of One-factor ANOVA Comparing the Decision-making Skills of Male Students Using Different Decision-making Models . . . 95
Results of Chi-square Analysis Comparing theSatisfaction of Male Students Using Different Decision-making Models Answering a 6 Item Questionnaire.................... 97
Results of One-factor ANOVA Comparing the Decision-making Skills of Female Students Using Different Decision-making Models . . . 98
Results of Chi-square Analysis Comparing theSatisfaction of Female Students Using Different Decision-making Models Answering a6 Item Questionnaire......................100
Results of One-factor ANOVA Comparing the Decision-making Skills of Students with Different Cognitive Styles Both Using the Deductive Decision-making Model ......... 101
Results of Chi-square Analysis Comparing the Satisfaction of Students with Different Cognitive Styles Both Using the Deductive Decision-making Model Answering a 6 ItemQuestionnaire ......................... 103
Results of One-factor ANOVA Comparing the Decision-making Skills of Students with Different Cognitive Styles Using the Inductive Decision-making Mo d e l ........... 104-
Results of Chi-square Analysis Comparing the Satisfaction of Students with Different Cognitive Styles Both Using the Inductive Decision-making Model Answering a 6 Item Questionnaire ......................... 106
xv
Reproduced with permission of the copyright owner. Further reproduction prohibited without permission.
LIST OP TABLES(Cont'd)
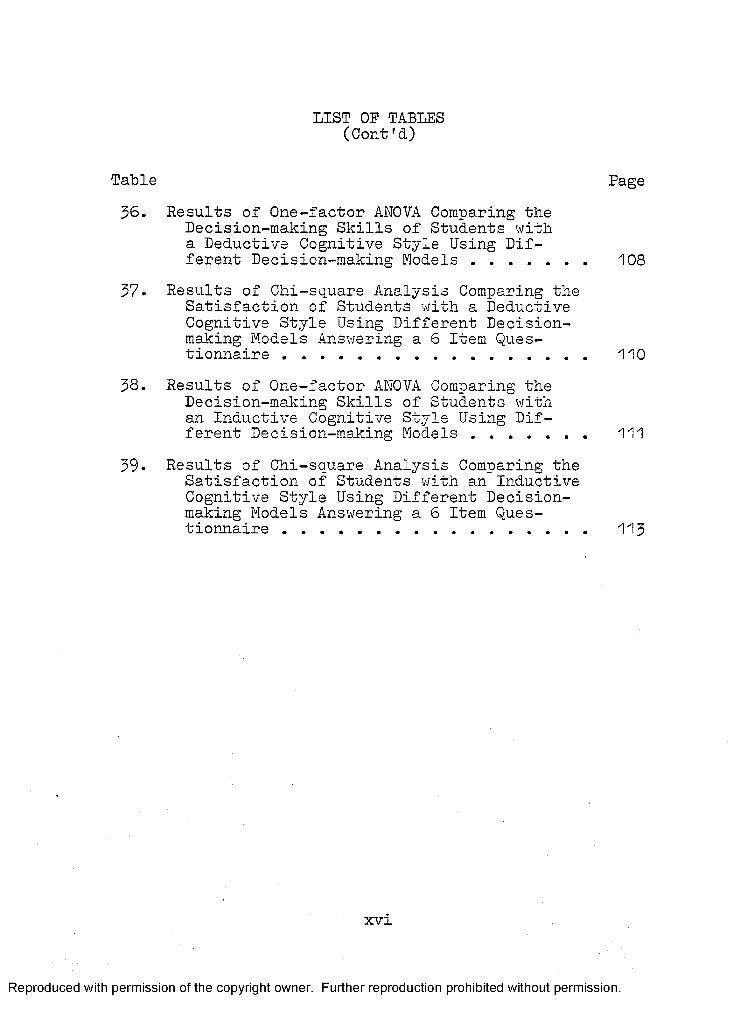
Table Page36. Results of One-factor ANOVA Comparing the
Decision-making Skills of Students with a Deductive Cognitive Style Using Different Decision-making Models ........... 108
37* Results of Chi-square Analysis Comparing the Satisfaction of Students with a Deductive Cognitive Style Using Different Decisionmaking Models Answering a 6 Item Questionnaire ............................. 110
38. Results of One-factor ANOVA Comparing theDecision-making Skills of Students with an Inductive Cognitive Style Using Different Decision-making Models ........... 111
39. Results of Chi-square Analysis Comparing theSatisfaction of Students with an Inductive Cognitive Style Using Different Decisionmaking Models Answering a 6 Item Questionnaire ............................. 113
xv i
Reproduced with permission of the copyright owner. Further reproduction prohibited without permission.
LIST OF FIGURES
Figure Page1. Schematic of inductive process ............ 172. Application of inductive process .......... 183. Flow chart overview of method process . . . . 274-. Example of student codes....................38
xvii
Reproduced with permission of the copyright owner. Further reproduction prohibited without permission.
CHAPTER I
INTRODUCTION AND OVERVIEW
Many individuals do not see clearly what is really important to them; consequently they are often unable to specify what they want to attain today, tomorrow, or in the more distant future (Gelatt, 1975? P« 5)* Decisionmaking skills a.re extremely important since they can affect the individual throughout the total life span. However, these skills are rarely taught formally in our school systems. Perhaps the skills are not taught because instructors are not sure about which models work, which models work best, and/or the individual student differences that affect the utility of the available models.
Students are faced with a multitude of daily decisions from homework to dating. Students are also faced with the long term decisions of training, job, marriage and family. The inability to decide brings these young people much sadness and regret; while impending decisions bring intense anxiety to the ill prepared decider. The regret and anxiety could be alleviated in many cases, if the student had some effective decision-making strategies.
As important as decision-making seems it is often overlooked in our educational system and society (Dinklage,
1
Reproduced with permission of the copyright owner. Further reproduction prohibited without permission.
1966; Kosuth and Miltenberger, 1972). Gelatt, in a 1962 article, suggested that decision-making may v/ell be the hope for the future for secondary guidance. Counselors are constantly faced with teaching decision-making to students: what class to take, what college to go to, 'whetheror not to stay in school.
There are probably very few arguments as to the importance of decision-making. Everyone can give several examples of the result of good or poor deciding in their own lives. Despite the fact that people use decision-making (from hunches to systematic models) more frequently than math, science or music, it is rarely taught formally in our school systems (Egner and Jackson, 1978).
In 1974 the Michigan Department of Education established some minimal decision-making goals for students.One of the objectives (11.3) states that for students in grades ten through adult given a situation ’where an individual must make a decision, they can:
1. List the alternatives2. Weigh the alternatives3. Make a systematic decision based on
identified informationThe objectives did not mention a specific decision-making program to implement those steps; they did stress the importance of the skills. Instructors charged with implementing the steps must be able to evaluate commercially prepared and locally developed programs to insure
Reproduced with permission of the copyright owner. Further reproduction prohibited without permission.
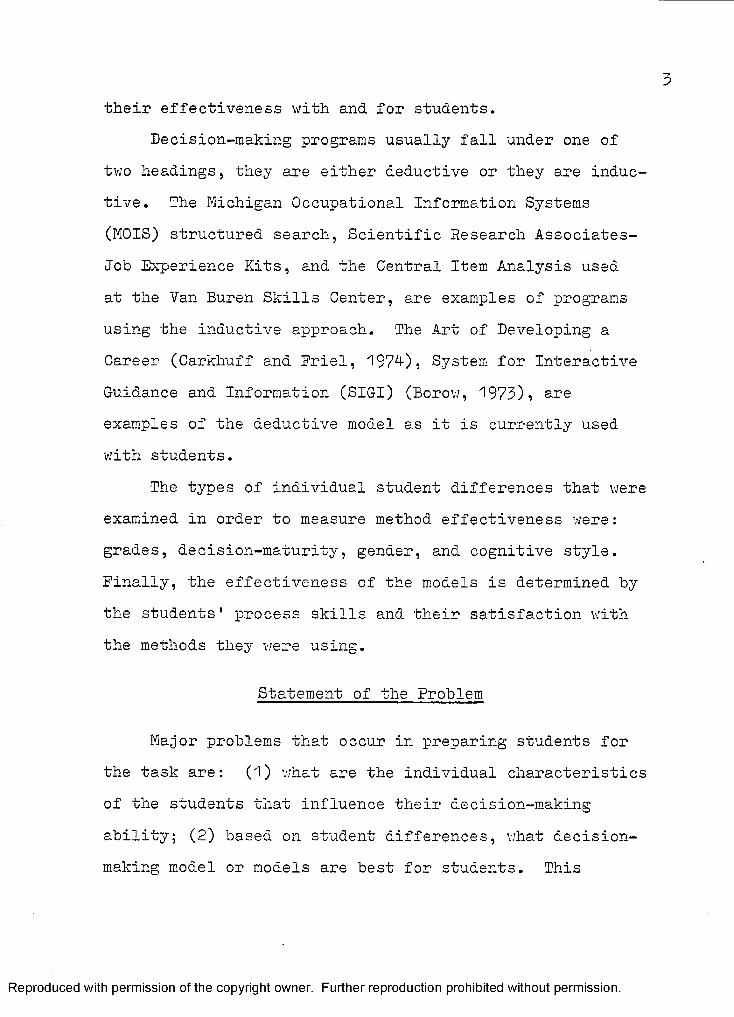
their effectiveness with and for students.Decision-making programs usually fall under one of
two headings, they are either deductive or they are inductive. The Michigan Occupational Information Systems (MOIS) structured search, Scientific Research Associates- Job Experience Kits, and the Central Item Analysis used at the Van Buren Skills Center, are examples of programs using the inductive approach. The Art of Developing a Career (Carkhuff and Friel, 1974-) , System for Interactive Guidance and Information (SIGI) (Borov;, 1973), are examples of the deductive model as it is currently used with students.
The types of individual student differences that were examined in order to measure method effectiveness were: grades, decision-maturity, gender, and cognitive style. Finally, the effectiveness of the models is determined by the students' process skills and their satisfaction with the methods they were using.
Statement of the Problem
Major problems that occur in preparing students for the task are: (1) what are the individual characteristicsof the students that influence their decision-making ability; (2) based on student differences, what decisionmaking model or models are best for students. This
Reproduced with permission of the copyright owner. Further reproduction prohibited without permission.
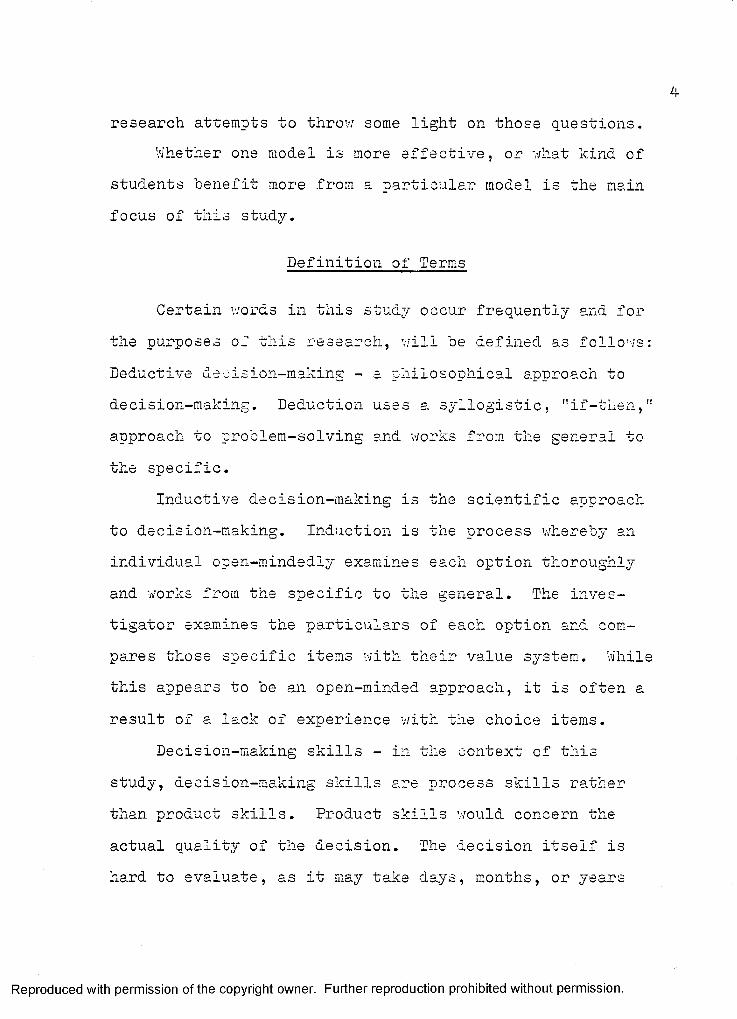
research attempts to throw some light on those questions.Whether one model is more effective, or what kind of
students benefit more from a particular model is the main focus of this study.
Definition of Terms
Certain words in this study occur frequently and for the purposes of this research, will be defined as follows Deductive decision-making - a philosophical approach to decision-making. Deduction uses a syllogistic, "if-then, approach to problem-solving and works from the general to the specific.
Inductive decision-making is the scientific approach to decision-making. Induction is the process whereby an individual open-mindedly examines each option thoroughly and works from the specific to the general. The investigator examines the particulars of each option and compares those specific items with their value system. Whil this appears to be an open-minded approach, it is often a result of a lack of experience with the choice items.
Decision-making skills - in the context of this study, decision-making skills are process skills rather than product skills. Product skills would concern the actual quality of the decision. The decision itself is hard to evaluate, as it may take days, months, or years
Reproduced with permission of the copyright owner. Further reproduction prohibited without permission.
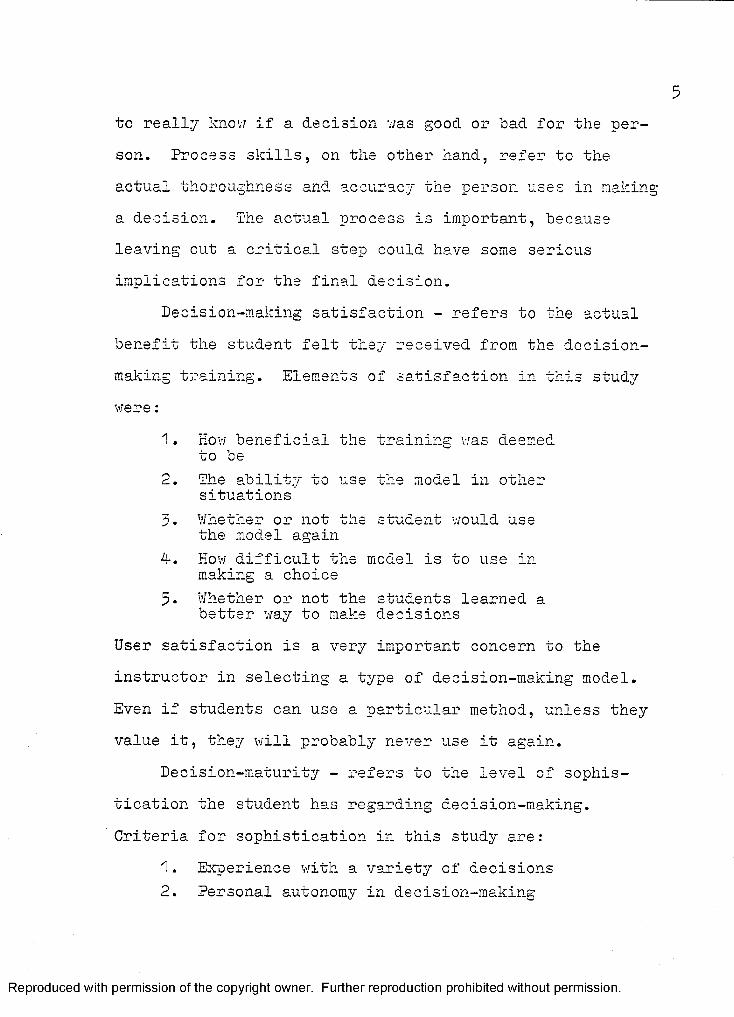
to really knov; if a decision was good or bad for the person. Process skills, on the other hand, refer to the actual thoroughness and accuracy the person uses in raakin a decision. The actual process is important, because leaving out a critical step could have some serious implications for the final decision.
Decision-making satisfaction - refers to the actual benefit the student felt they received from the decisionmaking training. Elements of satisfaction in this study were:
1. How beneficial the training was deemed to be
2. The ability to use the model in other situations
$. Whether or not the student would use the model again
4-. How difficult the model is to use in making a choice
5. Whether or not the students learned a better way to make decisions
User satisfaction is a very important concern to theinstructor in selecting a type of decision-making model.Even if students can use a particular method, unless theyvalue it, they will probably never use it again.
Decision-maturity - refers to the level of sophistication the student has regarding decision-making. Criteria for sophistication in this study are:
1. Experience with a variety of decisions2. Personal autonomy in decision-making
Reproduced with permission of the copyright owner. Further reproduction prohibited without permission.
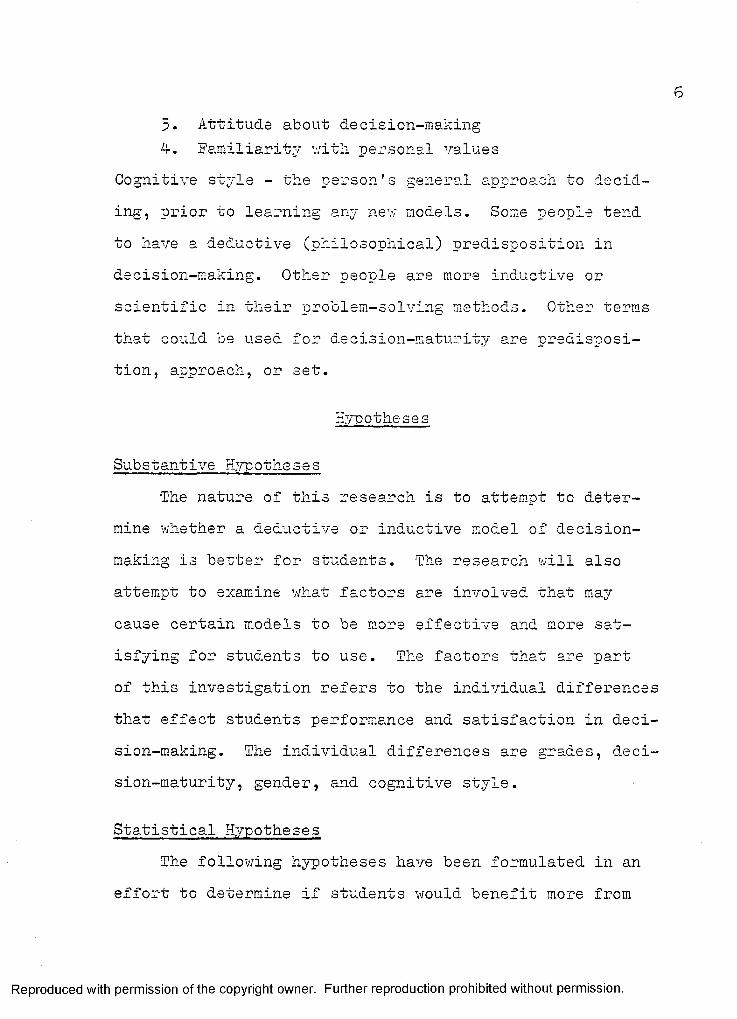
63. Attitude about decision-making4-. Familiarity with personal values
Cognitive style - the person's general approach to deciding, prior to learning any new models. Some people tend to have a deductive (philosophical) predisposition in decision-making. Other people are more inductive or scientific in their problem-solving methods. Other terms that could be used for decision-maturity are predisposition, approach, or set.
Hypotheses
Sub s t ant ive Hyp o t he s e sThe nature of this research is to attempt to deter
mine whether a deductive or inductive model of decisionmaking is better for students. The research will also attempt to examine what factors are involved that may cause certain models to be more effective and more satisfying for students to use. The factors that are part of this investigation refers to the individual differences that effect students performance and satisfaction in decision-making. The individual differences are grades, decision-maturity, gender, and cognitive style.
Statistical HypothesesThe following hypotheses have been formulated in an
effort to determine if students would benefit more from
Reproduced with permission of the copyright owner. Further reproduction prohibited without permission.
receiving training in one method or the other, to help the educator select suitable models, and to discover whether or not certain individual differences play a significant role in using various models.
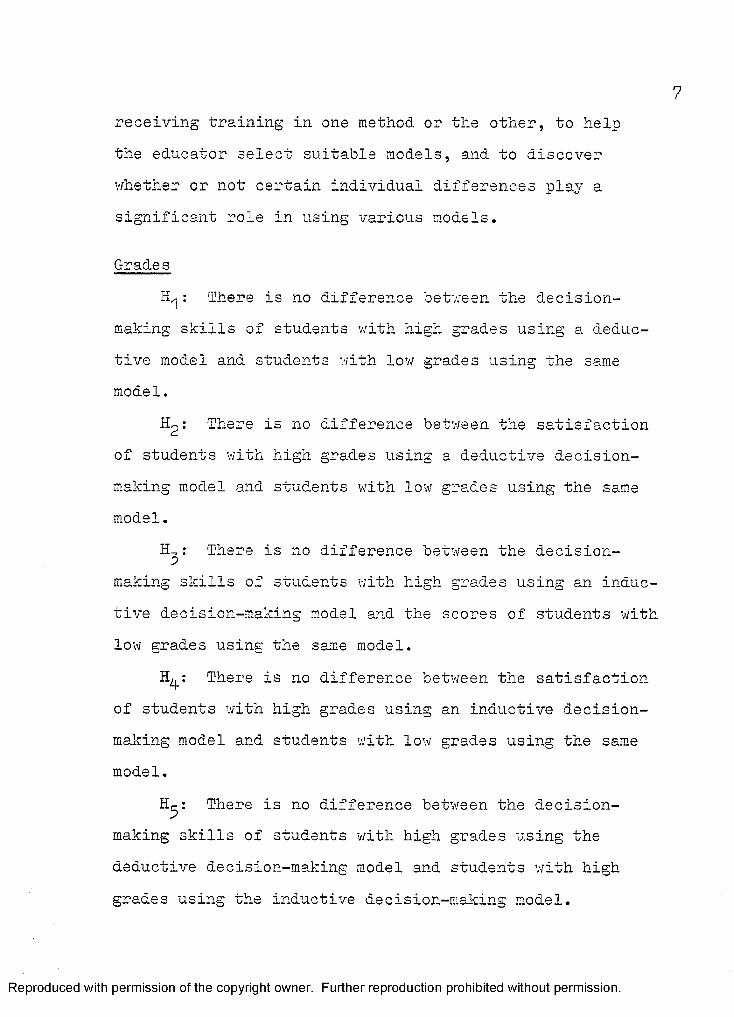
GradesEh-: 'There is no difference between the decision
making skills of students with high grades using a deductive model and students with low grades using the same model.
There is no difference between the satisfaction of students with high grades using a deductive decisionmaking model and students with low grades using the same model.
EL: There is no difference between the decision-omaking skills of students with high grades using an inductive decision-making model and the scores of students with low grades using the same model.
H : There is no difference between the satisfactionof students with high grades using an inductive decisionmaking model and students with low grades using the same model.
H : There is no difference between the decisionmaking skills of students with high grades using the deductive decision-making model and students with high grades using the inductive decision-making model.
Reproduced with permission of the copyright owner. Further reproduction prohibited without permission.
s
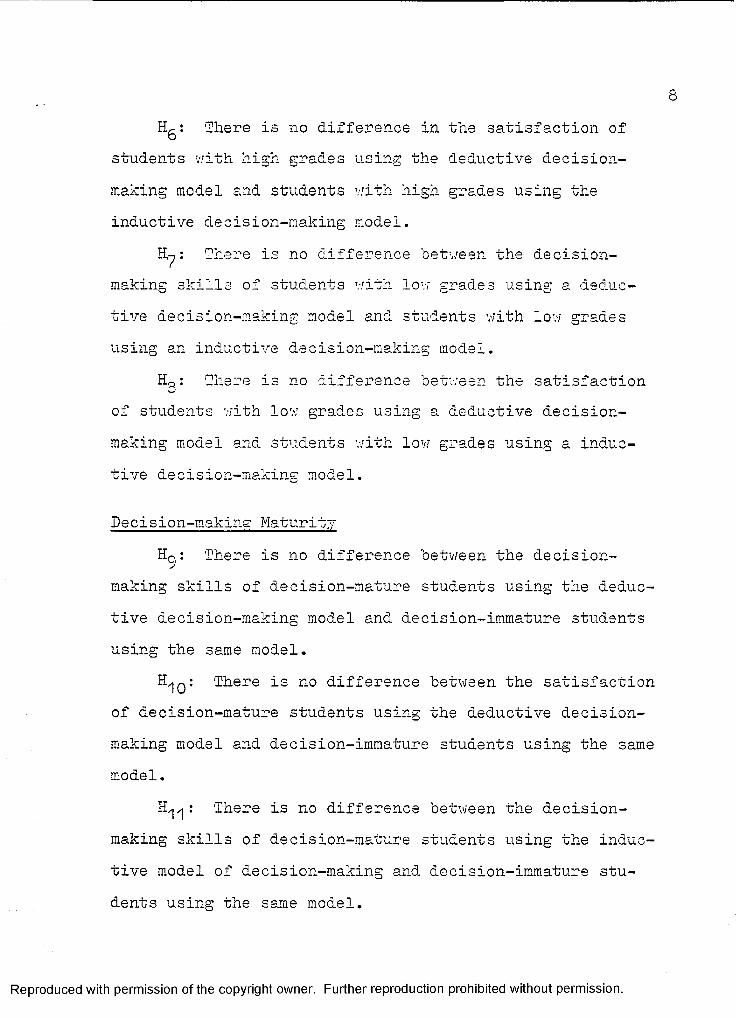
H : There is no difference in the satisfaction ofstudents with high grades using the deductive decisionmaking model and students v/ith high grades using the inductive decision-making model.
There is no difference between the decisionmaking skills of students v/ith low grades using a deductive decision-making model and students with low grades using an inductive decision-making model.
Hg: There is no difference between the satisfactionof students with low grades using a deductive decisionmaking model and students with low grades using a inductive decision-making model.
Decision-making MaturityH : There is no difference between the decision
making skills of decision-mature studen.ts using the deductive decision-making model and decision-immature students using the same model.
H^q : There is no difference between the satisfactionof decision-mature students using the deductive decisionmaking model and decision-immature students using the same model.
: There is no difference between the decisionmaking skills of decision-mature students using the inductive model of decision-making and decision-immature students using the same model.
Reproduced with permission of the copyright owner. Further reproduction prohibited without permission.
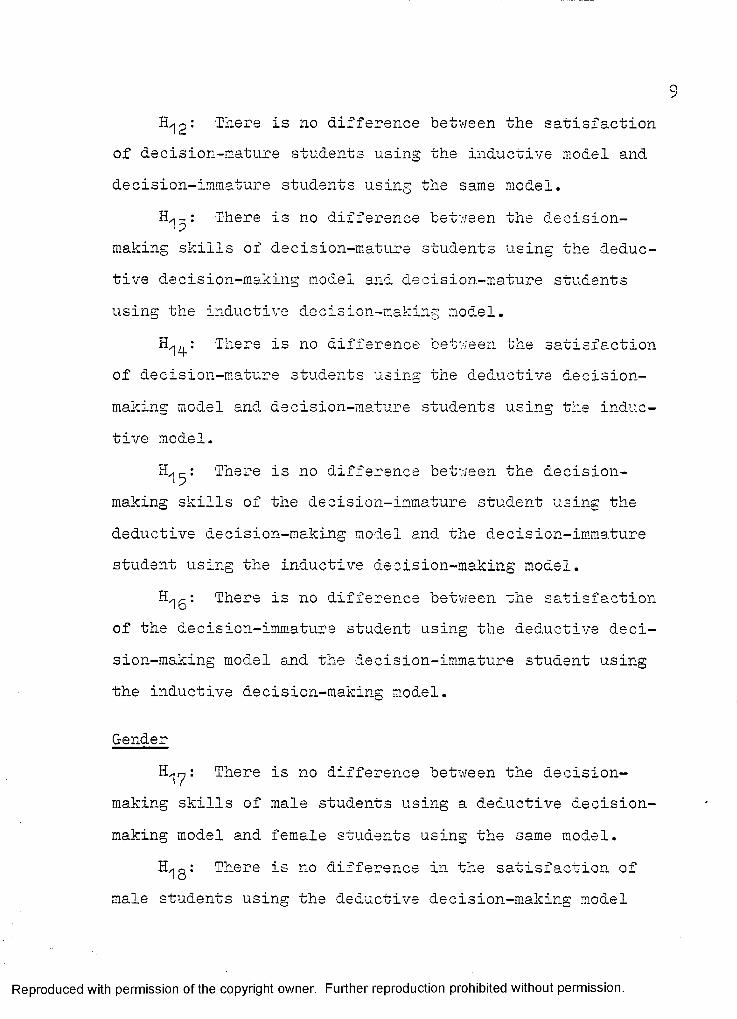
9H^2: There is no difference between the satisfaction
of decision-mature students using the inductive model and decision-immature students using the same model.
Ihj : There is no difference between the decisionmaking skills of decision-mature students using the deductive decision-making model and decision-mature students using the inductive decision-making model.
H^: There is no difference between the satisfactionof decision-mature students using the deductive decisionmaking model and decision-mature students using the inductive model.
There is no difference between the decisionmaking skills of the decision-immature student using the deductive decision-making model and the decision-immature student using the inductive decision-making model.
H,, : There is no difference between the satisfactioni oof the decision-immature student using the deductive decision-making model and the decision-immature student using the inductive decision-making model.
GenderH. : There is no difference between the decision
making skills of male students using a deductive decisionmaking model and female students using the same model.
H,|Q: There is no difference in the satisfaction ofmale students using the deductive decision-making model
Reproduced with permission of the copyright owner. Further reproduction prohibited without permission.
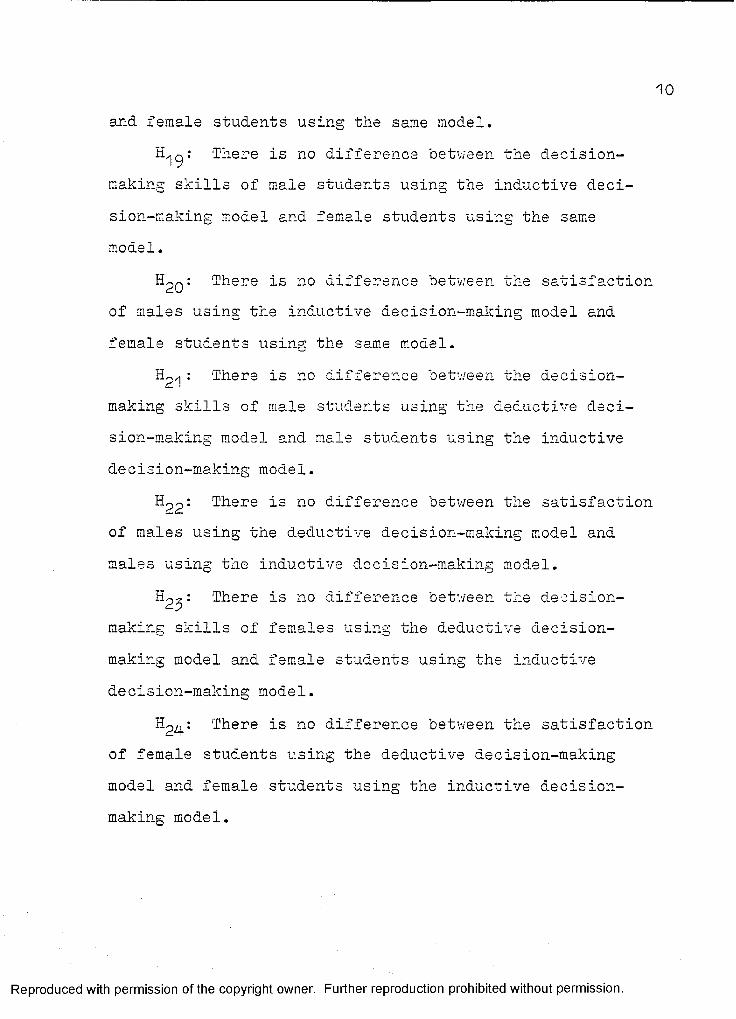
10and female students using the same model.
'There is no difference between the decisionmaking skills of male students using the inductive decision-making model and female students using the same model.
q '. There is no difference between the satisfaction of males using the inductive decision-making model and female students using the same model.
: There is no difference between the decisionmaking skills of male students using the deductive decision-making model and male students 'using the inductive decision-making model.
& 2 2 : T^8re i-3 n0 difference between the satisfactionof males using the deductive decision-making model and males using the inductive decision-making model.
There is no difference between the decisionmaking skills of females using the deductive decisionmaking model and female students using the inductive decision-making model.
There is no difference between the satisfaction of female students using the deductive decision-making model and female students using the inductive decisionmaking model.
Reproduced with permission of the copyright owner. Further reproduction prohibited without permission.
11Cognitive Style
: There is no difference between the decisionmaking skills of students with a deductive cognitive style using the deductive decision-making model and students with an inductive ■’ognitive style using the same model.
: There is no difference in the satisfaction ofstudents with a deductive cognitive stj/'le using the deductive decision-making model and students with an inductive cognitive style using the same model.
: There is no difference between the decisionmaking skills of students with a deductive cognitive style using the inductive decision-making model and students v/ith an inductive cognitive style using the same model.
Hgg.* There is no difference between the satisfaction of students v/ith a deductive cognitive style using an inductive decision-making model and students with a inductive cognitive style using the same model.
: There is no difference between the decisionmaking skills of students with a deductive cognitive style using the deductive decision-making model and students with the same cognitive style using the inductive decisionmaking model.
H^q : There is no difference between the satisfactionof students with a deductive cognitive style using a deductive decision-making model and students with the same
Reproduced with permission of the copyright owner. Further reproduction prohibited without permission.
12cognitive style using the inductive decision-making model.
H-,s,: There is no difference between the decision-making skills of students with an inductive cognitive style using the deductive decision-making model and students with the same cognitive style using the inductive decisionmaking model.
There is no difference in satisfaction between students with an inductive cognitive style using the deductive decision-making model and students 'with the same cognitive style using the inductive decision-making model.
Summary
Decision-making is an important set of skills for students to learn in school to prepare them for life.Despite the importance of these skills, they are rarely taught formally in our school systems.
The Michigan Department of Education (1974-) outlined specific skills all students should have. The problem then is which model or models should be used to implement that skill training. Individual student differences and how they effect student performance in decision-making is a very important concern in choosing models.
This study was an attempt to measure the effectiveness of two generic decision-making models, deductive and inductive, with a group of one hundred and twenty-five
Reproduced with permission of the copyright owner. Further reproduction prohibited without permission.

students. There were thirty-two hypotheses generated regarding the students' skills and satisfaction with the two models based on the individual differences of gender, decision-maturity, and cognitive style.
Reproduced with permission of the copyright owner. Further reproduction prohibited without permission.
CHAPTER II
REVIEW OF SELECTED LITERATURE
OverviewTills chapter reviews previous studies that have some
similarity to this study. The overall comparison is done in the first section of this chapter. The remainder of the chapter reviews previous work relative to: approachesto cognitive decision-making, both deductive and inductive; grades; maturity; gender and cognitive style in decision-making. Finally, this chapter has a summary section for review.
Previous Decision-making StudiesA literature search by Joan Roos Egner and Dorothy
Jackson (1978) reported no prior comprehensive research studies related to teaching decision-making skills.Their study found only articles and research dealing with selected variables, such as individual differences, effecting decision-making.
Egner and Jackson (1973) designed a study, however, that in many respects parallels the present study. They studied the influence of gender, grades, socio-economic status and intelligence on the dependent variables of career maturity and decision-making skills. The
14
Reproduced with permission of the copyright owner. Further reproduction prohibited without permission.
researchers pretested, and posttested students v/ith a Career Decision-making Questionnaire of their own design.
The second goal of their study was to determine the effectiveness of an experimenter designed decision-making model. The Jackson-Egner Decision-making Model was based on the Elau Model (1956). The Blau Model has eight stages(1) demand, (2) qualifications, (3) non-functional qualifications, (-4-) rewards, (5) information, (6) ability, (7) social rewards, and (8) value hierarchy, however, the Jaekson-Egner Model used only three stages: (1) values,(2) information, and (3) decision-making.
The researchers worked with 33 - eleventh grade students from four high schools. Two of the high schools were rural; and, two were urban. Students were taught decision-making in groups of from 10 to 18 over a ten week period.
An analysis of covariance was used to measure improve ment in career maturity and decision-making ability. The researchers selected .05 as the level of significance.
Results indicated that students in the program signif icantly improved in career maturity and decision-making, at the .01 level of significance. Other results indicated the following: (1) all students improved on the posttest,(2) students who were above average academically scored significantly higher than less nonacademically inclined students at the .001 level, (3) above average academic
Reproduced with permission of the copyright owner. Further reproduction prohibited without permission.
students also scored higher on career maturity, (4-) female scored higher on both dimensions, (.001 on career maturity and .02 on decision-making skills), (5) an interaction of IQ and academic ability contributed significantly at the .05 level to decision-making scores, (6) socio-economic status had no significant effect.
Egner and Jackson also used a satisfaction questionnaire and found that 62?u of the students rated their satisfaction from v;ell satisfied to fairly v;ell satisfied v/ith the decision-making program and used it to make future choices.
Some common points between the Jackson-Egner study and the study reported here include: a measurement ofdecision-making skills v/ith high school students, measurement of the students satisfaction v/ith the; decision-making program, evaluation of the effect gender has or_ decisionmaking and the effect grades have on decision-making. The difference is that instead of comparing pre and posttest scores v/ith the same decision-making model, this study com pared the results on two different models.
Approaches to Decision-making in LiteratureThe terms deductive and inductive for two styles of
decision-making is appropriate, and some references to these styles were found in the literature review. The American College Dictionary defines deductive as applying
Reproduced with permission of the copyright owner. Further reproduction prohibited without permission.
17an accepted general principle to an individual case. Inductive, on the other hand, is the scientific method of studying individual cases and forming a general principle from the observations.
Syllogisms are a good example of the deductive process: If all birds have feathers, and a v/oodpecker hasfeathers; then a woodpecker is a bird. Inductive learning on the other hand, is closer to the stimulus-response model. The subject has only to discriminate the positive stimulus from the negative stimuli before responding, according to a study done to describe cognitive processes through the Rule Learning Project in Tallahassee, Plorida (Fletcher, 1959).
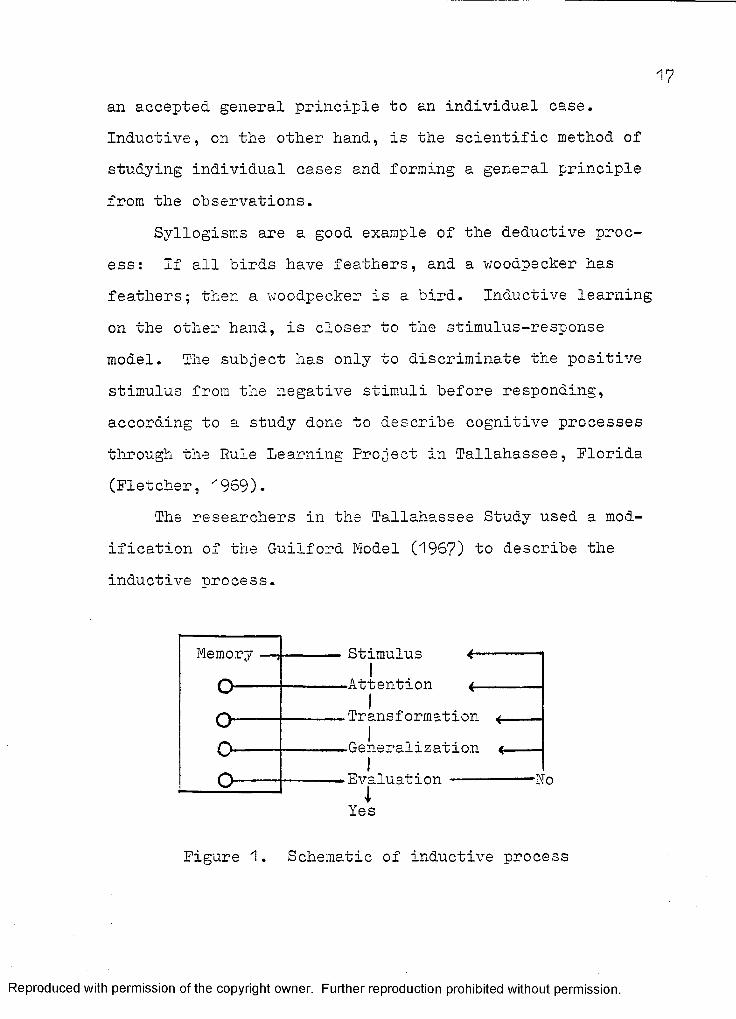
The researchers in the Tallahassee Study used a modification of the Guilford Model (1957) to describe the inductive process.
v j
AU
n
Gy
Stimulus
.Transformation <_ -Generalization «-Evaluation
IYes'No
Figure 1. Schematic of inductive process
Reproduced with permission of the copyright owner. Further reproduction prohibited without permission.
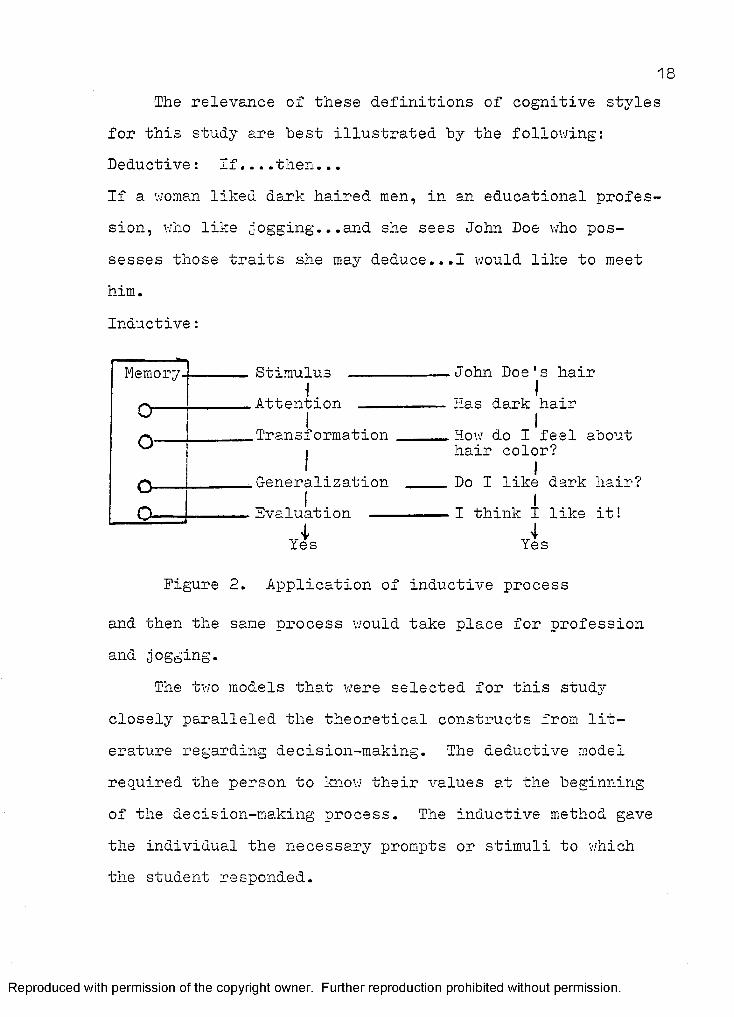
The relevance of these definitions of cognitive style for this study are best illustrated by the following: Deductive: If....then...If a woman liked dark haired men, in an educational profes sion, who like jogging...and she sees John Doe who possesses those traits she may deduce...I would like to meet him.Inductive:
Memorv-
oQ-
O ---:
Stimulus.AttentionTransformation
.GeneralizationIevaluation --'I'Yes
.John Doe's hairIHas dark hairIHow do I feel about
hair color?IDo I like dark hair? II think I like it!4Yes
Figure 2. Application of inductive process
and then the sane process would take place for profession and jogging.
The two models that were selected for this study closely paralleled the theoretical constructs from literature regarding decision-making. The deductive model required the person to know their values at the beginning of the decision-making process. The inductive method gave the individual the necessary prompts or stimuli to which the student responded.
Reproduced with permission of the copyright owner. Further reproduction prohibited without permission.
19Some alternate terms that are suggested in research
are proactive and reactive. Proactive was suggested as a cognitive style ty Guilford (1967) for the deductive process. Proactive implied a well understood base of comparison and an active examination of the different choices. Reactive approach suggests a "wait and see" examination of each item.
An earlier study that was done comparing these two methods of learning was conducted by Lloyd Murdock (197"0. Murdock defined the deductive method as "being told the rule" (p. 15)• Murdock defined the inductive method as "discovering the rule for yourself" (p. 16). The study checked the effects and interaction of three variables:(1) method of stimulus presentation, (2) learning process and (3) intellectual ability.
The study was conducted with 144 fourth graders. The students were divided into three groups of high, average and low intellectual ability.
The results of the teaching of concepts seemed to indicate that all three of the groups did better v.'ith the deductive model than the inductive, regardless of ability. The study also concluded that retention of concepts did not depend on how the concept was learned; but, rather how well it was learned. Stimulus presentation did not seem to have any influence on the results.
Reproduced with permission of the copyright owner. Further reproduction prohibited without permission.
Individual Differences20
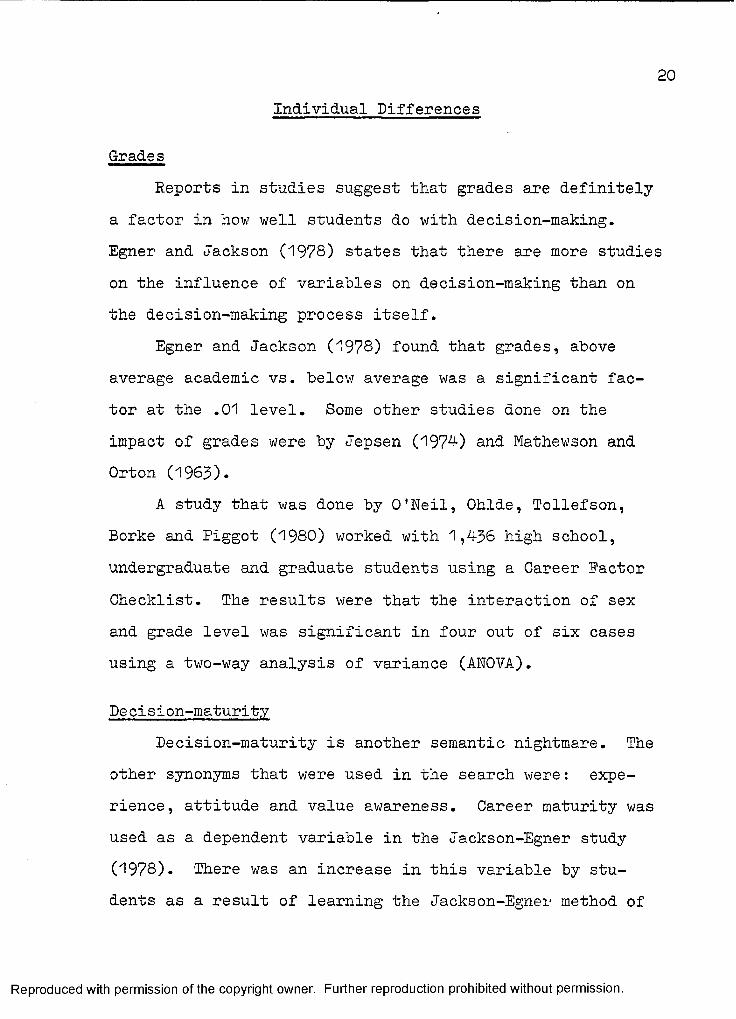
GradesReports in studies suggest that grades are definitely
a factor in how well students do with decision-making.Egner and Jackson (1978) states that there are more studies on the influence of variables on decision-making than on the decision-making process itself.
Egner and Jackson (1978) found that grades, above average academic vs. below average was a significant factor at the .01 level. Some other studies done on the impact of grades were by Jepsen (1974) and Mathewson and Orton (1963).
A study that was done by O'Neil, Ohlde, Tollefson, Borke and Piggot (1980) worked with 1,436 high school, undergraduate and graduate students using a Career Factor Checklist. The results were that the interaction of sex and grade level was significant in four out of six cases using a two-way analysis of variance (ANOVA).
De ci s i on-maturityDecision-maturity is another semantic nightmare. The
other synonyms that were used in the search were: experience, attitude and value awareness. Career maturity was used as a dependent variable in the Jackson-Egner study (1978). There was an increase in this variable by students as a result of learning the Jackson-Egner method of
Reproduced with permission of the copyright owner. Further reproduction prohibited without permission.
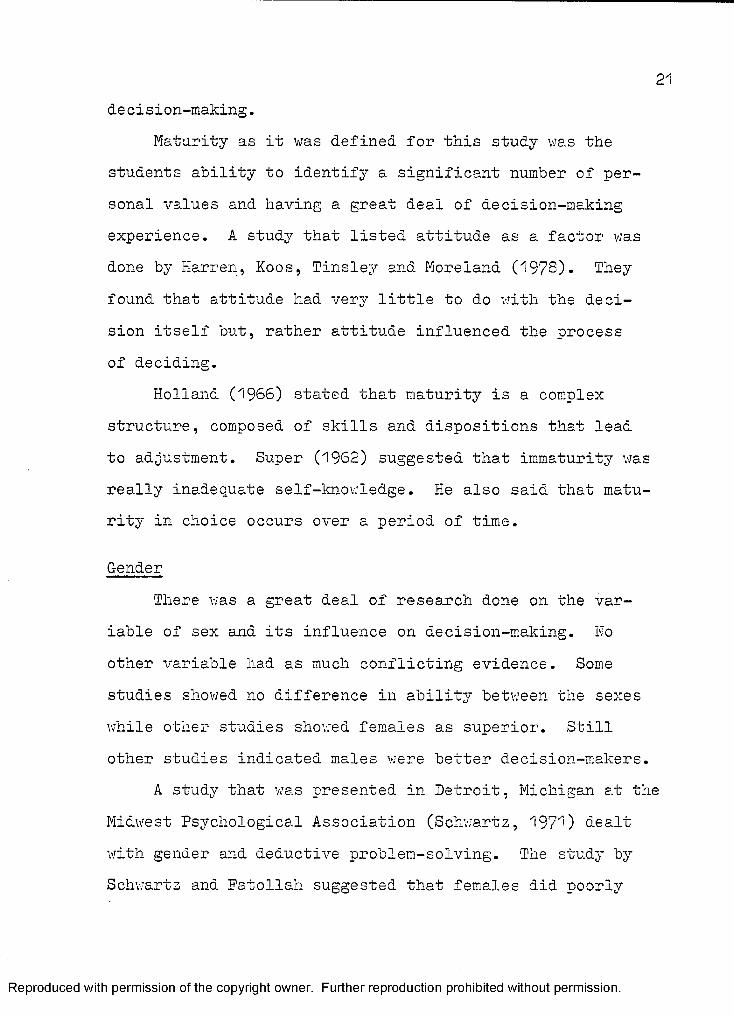
21de ci sion-making.
Maturity as it was defined for this study was the students ability to identify a significant number of personal values and having a great deal of decision-making experience. A study that listed attitude as a factor was done by Harren, Koos, Tinsley and Moreland (197S). They found that attitude had very little to do with the decision itself but, rather attitude influenced the process of deciding.
Holland (1966) stated that maturity is a complex structure, composed of skills and dispositions that lead to adjustment. Super (1962) suggested that immaturity was really inadequate self-knowledge. He also said that maturity in choice occurs over a period of time.
GenderThere was a great deal of research done on the var
iable of sex and its influence on decision-making. No other variable had as much conflicting evidence. Some studies showed no difference in ability between the sexes while other studies showed females as superior. Still other studies indicated males were better decision-makers.
A study that -was presented in Detroit, Michigan at the Midwest Psychological Association (Schwartz, 197'') dealt with gender and deductive problem-solving. The study by Schwarts and Patollah suggested that females did poorly
Reproduced with permission of the copyright owner. Further reproduction prohibited without permission.
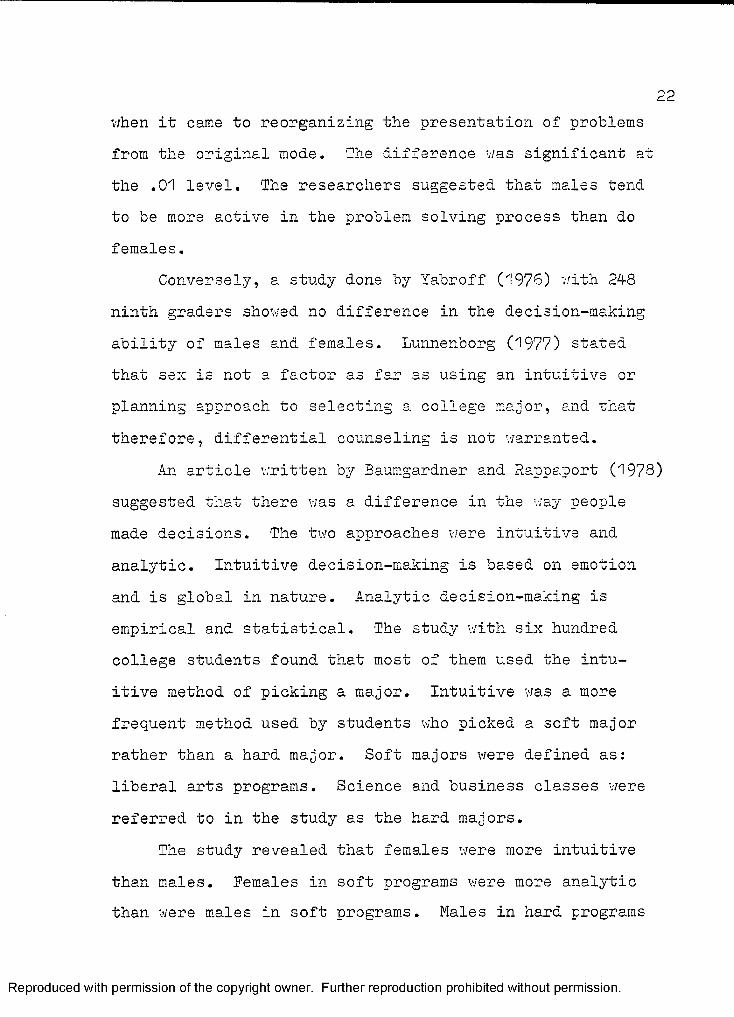
when it came to reorganizing the presentation of problems from the original mode. 'The difference v/as significant at the .01 level. The researchers suggested that males tend to be more active in the problem solving process than do females.
Conversely, a study done by Yabroff (1976) v/ith 24-8 ninth graders showed no difference in the decision-making ability of males and females. Lunnenborg (1977) stated that sex is not a factor as far as using an intuitive or planning approach to selecting a college major, and that therefore, differential counseling is not warranted.
An article v/ritten by Baumgardner and Rappaport (1973) suggested that there v/as a difference in the way people made decisions. The two approaches were intuitive and analytic. Intuitive decision-making is based on emotion and is global in nature. Analytic decision-making is empirical and statistical. The study v/ith six hundred college students found that most of them used the intuitive method of picking a major. Intuitive was a more frequent method used by students who picked a soft major rather than a hard major. Soft majors were defined as: liberal arts programs. Science and business classes were referred to in the study as the hard majors.
The study revealed that females were more intuitive than males. Females in soft programs were more analytic than were males in soft programs. Males in hard programs
Reproduced with permission of the copyright owner. Further reproduction prohibited without permission.
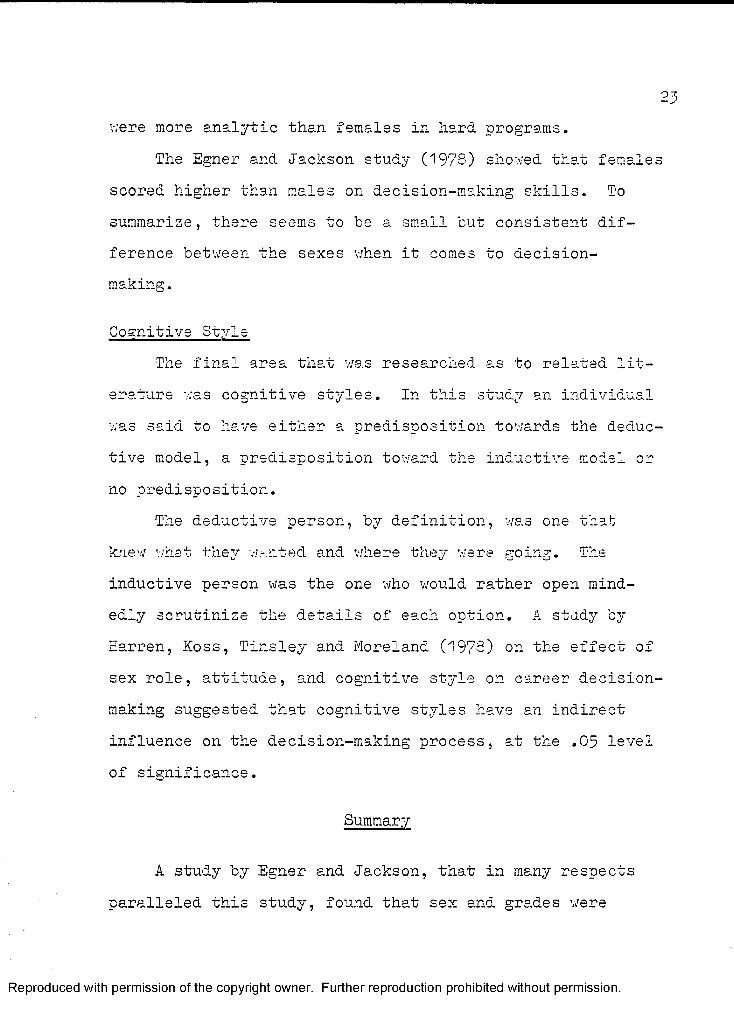
v;ere more analytic than females in hard programs.The Egner and Jackson study (1978) showed that females
scored higher than males on decision-making skills. To summarise, there seems to be a small but consistent difference between the sexes when it comes to decisionmaking.
Cognitive StyleThe final area that v/as researched as to related lit
erature was cognitive styles. In this study an individual was said to have either a predisposition towards the deductive model, a predisposition toward the inductive model or no predisposition.
The deductive person, by definition, v/as one that; knew what they wanted and where they were going. The inductive person was the one who would rather open mind- edly scrutinize the details of each option. A study by Earren, Koss, Tinsley and Moreland (1973) on the effect of sex role, attitude, and cognitive style on career decisionmaking suggested that cognitive styles have an indirect influence on the decision-making process, at the .05 level of significance.
Summary
A study by Egner and Jackson, that in many respects paralleled this study, found that sex and grs.des were
Reproduced with permission of the copyright owner. Further reproduction prohibited without permission.
24important variables in decision-making skill acquisition.
There seems to exist various cognitive approaches to decision-making. Tv;o models are the deductive and inductive processes. Some theorists referred to these models as proactive and reactive. One study that v/as located indicated that the deductive approach v/as superior to the inductive approach in teaching concepts.
The literature revealed evidence that grades v/ere influential on the decision-making process of students. Maturity is an influence on a person's decision-making as it deals v/ith the amount of self-knov/ledge the person possesses.
Gender v/as the most hotly debated variable. There v/as an abundance of conflicting reports.
Cognitive style had the least amount of research, what little there v/as, suggested that it has an indirect effect on decision-making.
The next chapter of this study deals v/ith the step by step methods that v/ere used in conducting this study.
Reproduced with permission of the copyright owner. Further reproduction prohibited without permission.

CHAPTER III
METHODS
Population.
Students from eleven nigh schools in Van Buren county in Michigan v/ere asked to participate in this study. The eleven high schools v/ere: Bangor, Bloomingdale, Covert,Decatur, Go ole s, Hartford, Lav/rence, Lav/ton, Mattav/an,Pav; Pav; and South Haven. Nine of these eleven high schools are rural villages. Pav/ Pav/ and South Haven are small cities. The students v.vko v/ere in this stud;/ v/ere also students in vocational programs at the Van Buren Skills Center and attend their local high school for half a day and attend the skills center for the remainder of the day.
The sample of students v/as drav/n from seven programs at the skills center. Programs that v/ere involved v;ere: Distributive Education, Electronics, Welding, Nurse Aide, Child Care, Secretarial and Building trades.
Selection Procedure
The programs v/ere chosen on the follov/ing basis: (1)The seven programs represent one third of the total number of programs at the Skills Center. (2) The3/ v/ere drav/n
25
Reproduced with permission of the copyright owner. Further reproduction prohibited without permission.

randomly from a list of tv/enty-tv:o programs. (3) The instructors v/ere v/illing to let tlieir students participate in the study and (4) the programs cover a v.'ide range of shill areas, from the highly technical and scientific Electronics program, to the people oriented v:orld of the health care program, Uurse Aide.
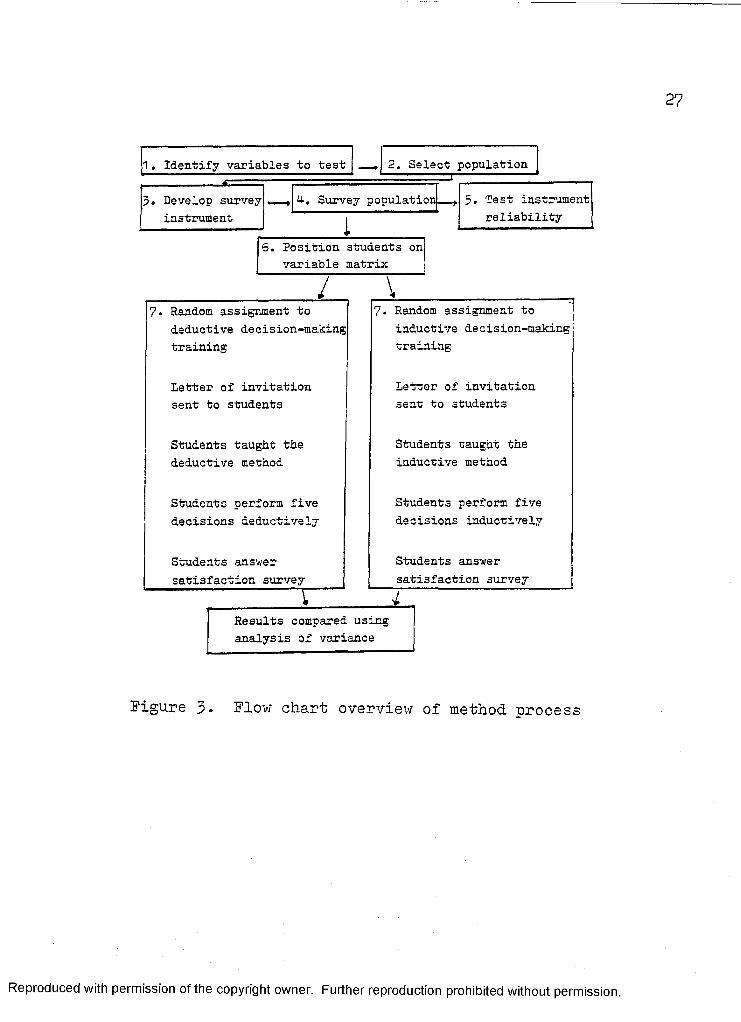
Figure 3 represents the step by step process utilized in the research study.
Reproduced with permission of the copyright owner. Further reproduction prohibited without permission.
7- Random assignment toinductive decision-making training
7. Random assignment todeductive decision-making training
Letter of invitation sent to students
Letter of invitation sent to students
Students taught the inductive method
Students taught the deductive method
Students perform five decisions inductively
Students perform five decisions deductively
Students answer satisfaction survey
Students answer satisfaction survey
h. Survey population
2. Select population
3. Develop survey instrument
1. Identify variables to test
6. Position students on variable matrix
5. Test instrument reliability
Results compared using analysis of variance
Figure 3* Flow chart overview of method process
Reproduced with permission of the copyright owner. Further reproduction prohibited without permission.
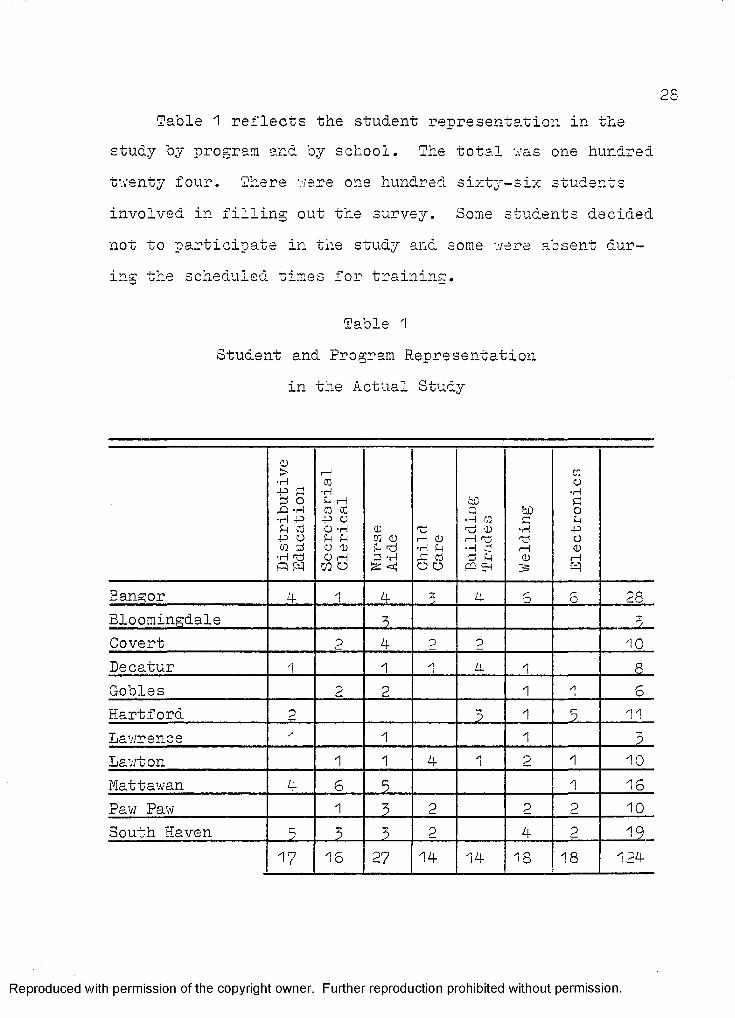
Table 1 reflects the student representation in the study by program and by school. The total was one hundred twenty four. There were one hundred sixty-six students involved in filling out the survey. Some students decided not to participate in the study and some were absent during the scheduled times for training.
Table 1Student and Program Representation
in the Actual Study
Distributive
Education
Secretarial
Clerical
om c F: d 3 -H S < Child
Care
Building
Trades
Welding
Electronics
Bangor 4 1 4 4 6 o 28Bloomingdale 3 2Covert 2 4 0 2 10Decatur i 1 ✓1 4 1 8Gobles 2 2 1 1 6Hartford 3 1 7 11Lawrence 'i 1 1 3Lawton 1 1 4 AI 2 1 10Mattawan 4 6 7 1 16Paw Paw 1 3 2 P 2 10South Haven 3 3 3 2 4 2 19
17 16 27 14 14 18 18 124
Reproduced with permission of the copyright owner. Further reproduction prohibited without permission.
29Survey Instrument
An experimenter designed instrument (Appendix A) was used to survey the population in order to classify students as to individual difference. An instrument was needed that could identify each student by grade, maturity, gender, and cognitive style.
There was no readily available instrument that would have evaluated students on those four factors. There were instruments available that considered one or two of the factors; but, not all of them at one time. The following is a description of the components of the instrument as they related to the factors of grades, maturity, gender and cognitive style.
GradesThe students were asked to identify their overall
grade point average: My grade average is: A 3 C D E(Circle one)
Decision-making MaturityMaturity in decision-making was a hard domain to
define and measure. Most students have had some experience in choosing clothes, movies, dates and jobs. For the purpose of this study, it was decided that the mature decider was someone who: (1) had experience making decisions, (2) had a method of making those decisions and
Reproduced with permission of the copyright owner. Further reproduction prohibited without permission.
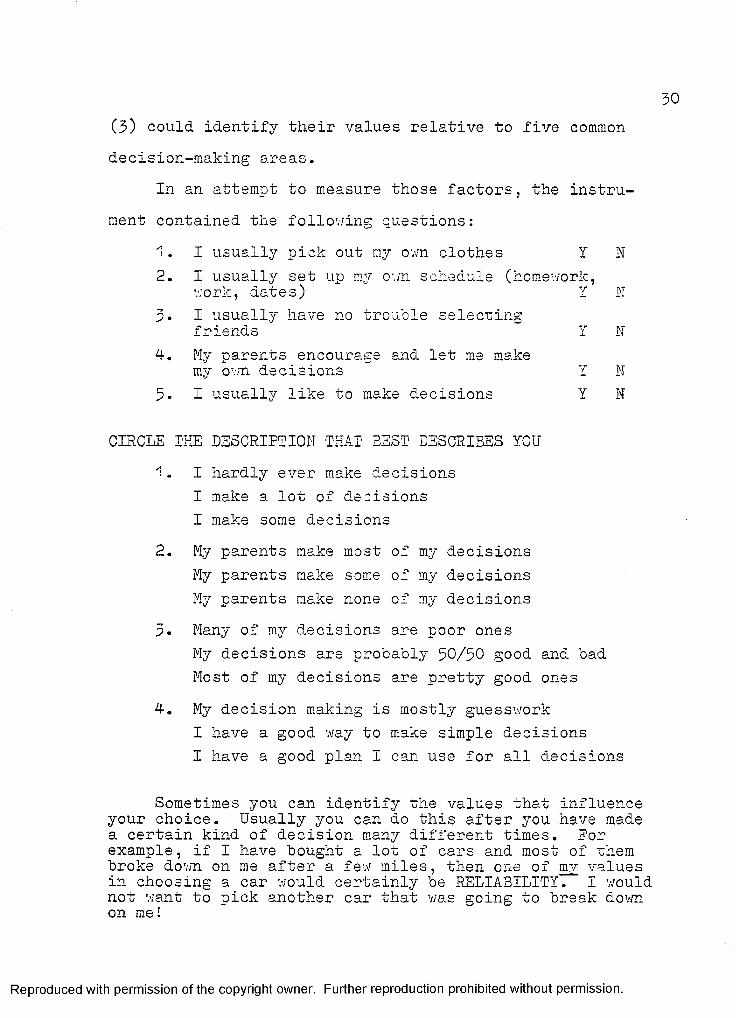
(3) could identify their values relative to five common decision-making areas.
In an attempt to measure those factors, the instrument contained the following questions:
1. I usually pick out my own clothes Y N2. I usually set up ray ov/n schedule (homework,
work, dates) Y N3. I usually have no trouble selecting
friends Y N4-. My parents encourage and let me make
my own decisions Y N5- I usually like to make decisions Y N
CIRCLE THE DESCRIPTION THAI BEST DESCRIBES YOU1. I hardly ever make decisions
I make a lot of decisionsI make some decisions
2. My parents make most of my decisionsMy parents make some of my decisionsMy parents make none of my decisions
5. Many of my decisions are poor onesMy decisions are probably 50/50 good and bad Most of my decisions are pretty good ones
4-. My decision making is mostly guessworkI have a good way to make simple decisionsI have a good plan I can use for all decisions
Sometimes you can identify the values that influence your choice. Usually you can do this after you have made a certain kind of decision many different times. Por example, if I have bought a lot of cars and most of them broke down on me after a few miles, then one of my values in choosing a car would certainly be RELIABILITY. I would not want to pick another car that was going to break down on me!
Reproduced with permission of the copyright owner. Further reproduction prohibited without permission.
31
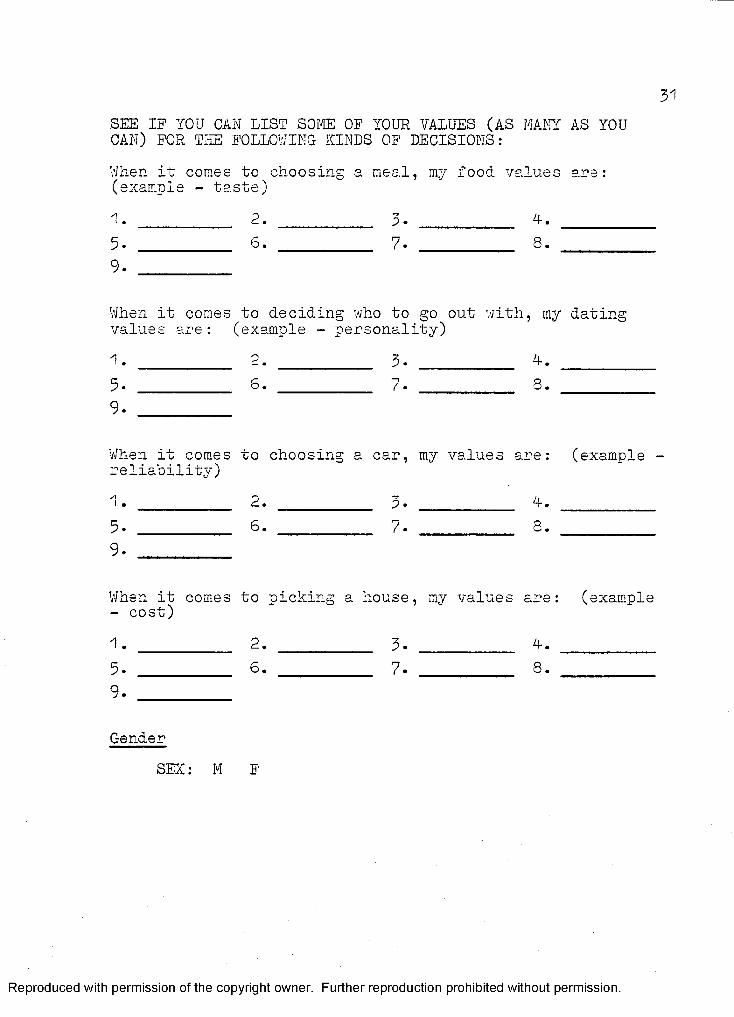
SEE IF YOU CAN LIST SOME OF YOUR VALUES (AS MANY AS YOU CAN) FOR THE FOLLOWING KINDS OF DECISIONS:V/hen it comes to choosing a meal, my food values are: (example - taste)1. _______ 2. ________ 3- 4. _______5. _________ 6. __________ 7. 8. _________9. _________
V/hen it comes to deciding who to go out with, my dating values are: (example - personality)1. ______ 2. _______ 3. 4.________5. _________ 6. __________ 7- S.___________9. _________
When it comes to choosing a car, my values are: (example -reliability)1. _______ 2. ________ 3- 4.________5. _________ 6. __________ 7- 3. __________9. _________
V/hen it comes to picking a house, my values are: (example- cost)1. ______ 2. _______ 3. 4.________5. 6. 7- 8. _________9. _________
GenderSEX: M F
Reproduced with permission of the copyright owner. Further reproduction prohibited without permission.

32
Cognitive StyleIn an effort to assess the students cognitive style
or predisposition towards a particular model of decisionmaking, two different descriptions of a way to make a choice were given to the students. The item to be purchased was a dress.
The following paragraphs are descriptions of how two different people go about making decisions. You may have never bought a dress; but if you did, which method sounds most like your approach to the problem?(A) Sarah had to choose between two outfits for school. She thought, "how much the clothes cost is important to me. The next most important factor is how stylish they are because I do not want to wear out-of-date clothes! Finally, I do not want colors that are too loud, because I do not want to stick out like a sore thumb." After she thought all this out, she went to the store and found an outfit that met her needs.(B) Mary was not exactly sure what she wanted, but as she looked at the two possibilities, she noticed one was red and the other yellow. She thought, "I prefer the color red to yellow."The yellow dress had buttons while the red dress had a zipper. Mary thought, "I really prefer buttons to a zipper." The yellow dress was five dollars cheaper. Mary thought to herself, "that does it; I will take the yellow dress."I MAKE DECISIONS MORE THE WAY SARAH DID A nMX,
OxiuOJjil/ Ull-LjI MAKE DECISIONS MORE THE WAY MARY DID B The survey instrument was administered to one hundred
and sixty-six students in the seven different programs at the Van Buren Skills Center.
Reproduced with permission of the copyright owner. Further reproduction prohibited without permission.
33
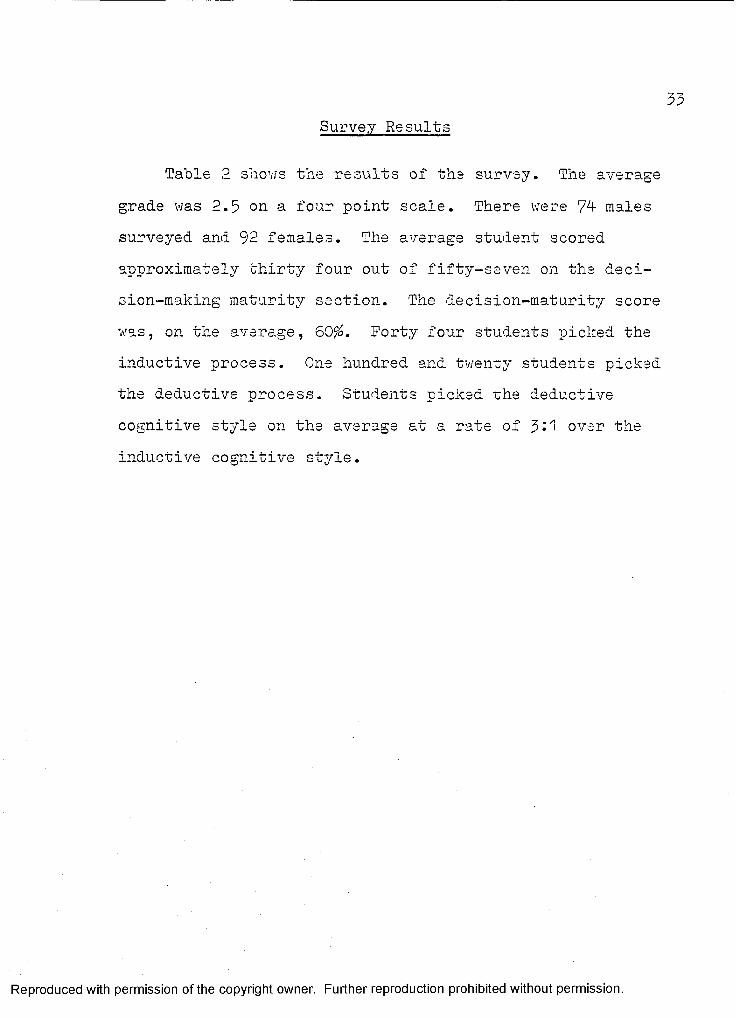
Survey Results
Table 2 shows the results of the survey. The average grade was 2.5 on a four point scale. There were 74- males surveyed and 92 females. The average student scored approximately thirty four out of fifty-seven on the decision-making maturity section. The decision-maturity score was, on the average, 60$. Forty four students picked the inductive process. One hundred and twenty students picked the deductive process. Students picked the deductive cognitive style on the average at a rate of 3-1 over the inductive cognitive style.
Reproduced with permission of the copyright owner. Further reproduction prohibited without permission.
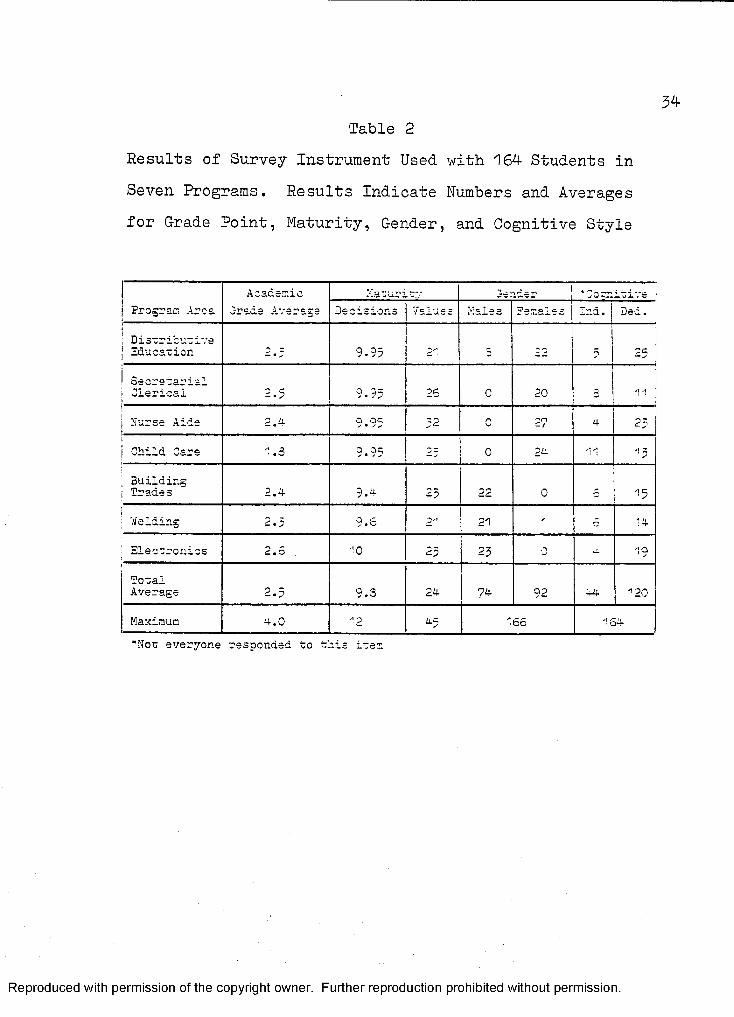
Table 2Results of Survey Instrument Used with 164 Students in Seven Programs. Results Indicate Numbers and Averages for Grade Point, Maturity, Gender, and Cognitive Style
Academic Matur:-t” ider itiueProgram Area Decisions Values Males £ Ind. Ded.
DisrriburiveEducation ~ ~ 9.95 I'1 5 22 n 2C
SecretarialClerical 2-5 0 3C ' • s S 26 0 20 li
Nurse Aids 2.4 O OC j • / > 52 0 -( a 23
Child Care 1.3 9.95 0 ” 0 oi±. 11
3uildingTrades 2.4 9.* ^«»
-0 22 0 *15
W elding 2 • b Q £ 2'’ 21 6 14
Electronics 2.5 10 23 23 *■ 19
TotalAverage 2.5 9.3 24 74 92 U4- *20
Maximum 4.0 12 ^5 166 164*'Not; everyone responded, to this ires;
Reproduced with permission of the copyright owner. Further reproduction prohibited without permission.
Instrument Reliability
Reliability refers to the consistency of scores obtained, by the same individual v/hen examined with the same test on different occasions (Anastasi, '1975). There are four different types of reliability: (1) test-retest,(2) Kuder-Richardson, (3) split-half, and (4) scorer reliability. For this study, test-retest was used.
Twenty students, randomly selected, were asked to fill out the survey one month after they had originally taken it. Twenty students represent approximately twelve percent of the population that was surveyed.
A comparison between the two surveys for the students revealed only a 5# change in the responses.
Instrument Validity
There are five basic types of validity: (1) face,(2) construct, (3) content, (4) predictive, and (5) concurrent (Anastasi, 1975). Content and construct validity were the two most important types of validity for this study.
Content ValidityContent validity insures that the domain measured has
been effectively sampled according to Anastasi (1976). Grades and gender were two rather obvious areas for content validation. Maturity and cognitive style are
Reproduced with permission of the copyright owner. Further reproduction prohibited without permission.
somewhat more difficult areas to sample. The question used for the cognitive styles did seem to follow the mod els. The area most open to scrutiny was decision-maturi Does a student v;ho can list many personal values really have decision-maturity?
Construct ValidityConstruct validity is the extent to 'which a test or
survey measures that which it is trying to measure. Two methods of measuring construct validity are correlations with other tests and factor ana-lysis. There were no oth tests available for a correlation study. A reliability check on the survey instrument with adults and seventh grade students seemed to validate cognitive style as an adequately sampled domain (reported on page 39).
Group Assignment
Before assigning students to treatment groups, the independent variables, grades, decision-maturity, gender and cognitive style were dichotomised. The dichotomy fo grades was high or low grades. The dichotomy for decision-maturity was mature or immature. The dichotomy for gender was male and female. The dichotomy for cognitive style was inductive or deductive.
Reproduced with permission of the copyright owner. Further reproduction prohibited without permission.
GradesThe decision of what constituted high grades or low
grades was made by examining the average score for the 166 students. The mean for grades was 2.5, this would correspond to a letter grade of C+. It was decided that for this study, a grade point of 2 or below would be considered Iovj. A grade of B or better would be considered high for grades.
De c is ion-maturityThe decision concerning maturity vs. immaturity v;as
made by an examination of the mean score on the survey. Students could have scored as high as 57 on this part of the survey. The mean was 9-3 (81$) for decision experience. The mean was 24 (53$) for identifying personal values. A combined score of 54 (60$) was established as the cutting score. A score of 34 or more placed a student in the decision-mature group. A score of thirty - three or less placed the student in the immature group.
Cognitive StyleIndividuals that selected method (A) of choosing a
dress on the survey were considered to have a deductive cognitive style. Students that selected method (B) as the way they would choose a dress were considered to have an inductive cognitive style.
Reproduced with permission of the copyright owner. Further reproduction prohibited without permission.
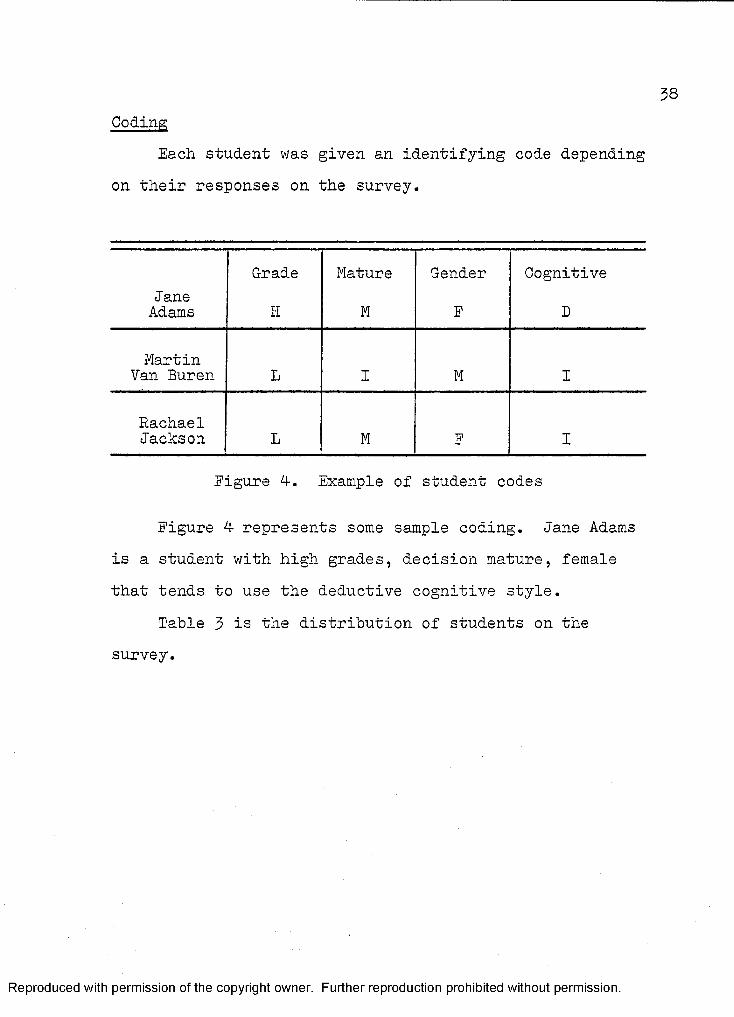
GodingEach, student was given an identifying code depending
on their responses on the survey.
JaneAdams
Grade
H
Mature
M
Gender
F
Cognitive
D
Martin Van Buren L I M I
Rachael Jackson L M F I
Figure 4. Example of student codes
Figure 4 represents some sample coding. Jane Adams is a student with high grades, decision mature, female that tends to use the deductive cognitive style.
Table 3 is the distribution of students on the survey.
Reproduced with permission of the copyright owner. Further reproduction prohibited without permission.
39
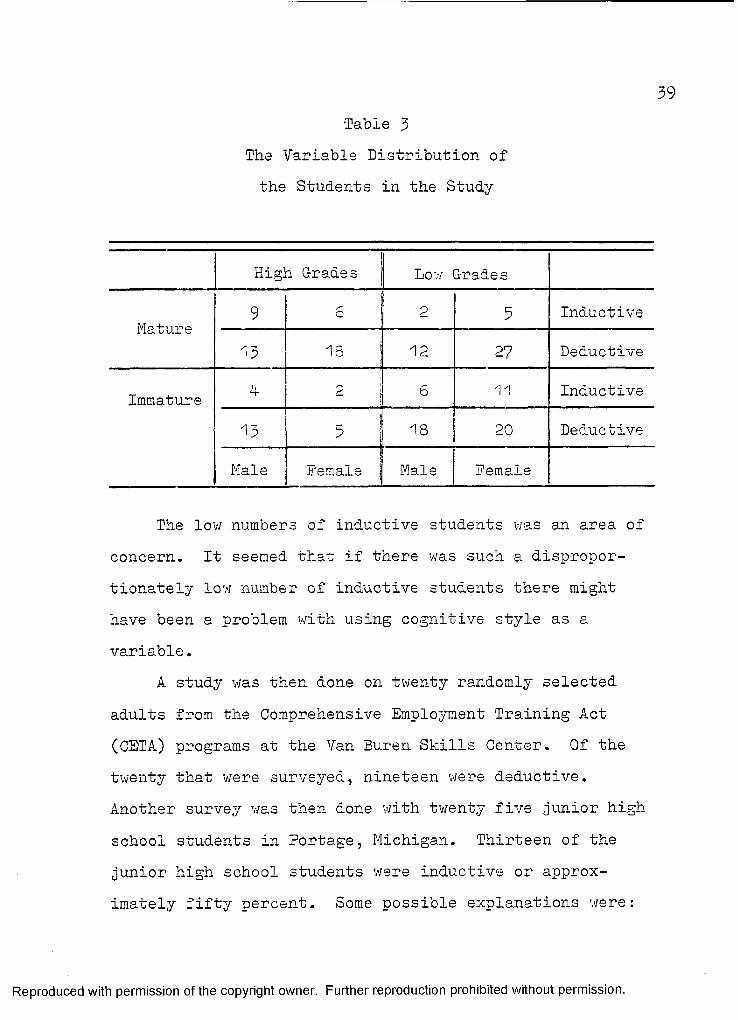
Table 3The Variable Distribution of the Students in the Study
High Grades Low Grades
Mature 9 6 j 2 5 Inductive
13 18 12 27 Deductive
Immature -r 2 6 11 Inductive
13 5 18 20 Deductive
Male Female I Male Female
The low numbers of inductive students was an area of concern. It seemed that if there was such a disproportionately low number of inductive students there might have been a problem with using cognitive style as a variable.
A study was then done on twenty randomly selected adults from the Comprehensive Employment Training Act (CETA) programs at the Van Buren Skills Center. Of the twenty that 'were surveyed, nineteen were deductive. Another survey was then done with twenty five junior high school students in Portage, Michigan. Thirteen of the junior high school students were inductive or approximately fifty percent. Some possible explanations were:
Reproduced with permission of the copyright owner. Further reproduction prohibited without permission.
40.younger students tend to be inductive until they have enough experience to generalize their values, cognitive style and decision-maturity.
The results from the two survejrs seemed to justify keeping cognitive style as a variable in this study. The deductive to inductive cognitive style ratio of 3:1 made selection of additional inductive students at the skills center impossible for this research.
Assignment to Treatment GroupsMembers of each cell on Table 5 were then randomly
placed in either a deductive or inductive decision-making training group.
Invitation to ParticipationA letter was sent to each student inviting participa
tion in the study (Appendix H). The students were invited to one of the four two hour training sessions. They were told nothing about the class other than that it was for decision-making. The students attended the class during their usual skill center period. Of the 166 that were originally surveyed, 124 were in the actual study.
Reproduced with permission of the copyright owner. Further reproduction prohibited without permission.
Teaching Sessions
Content
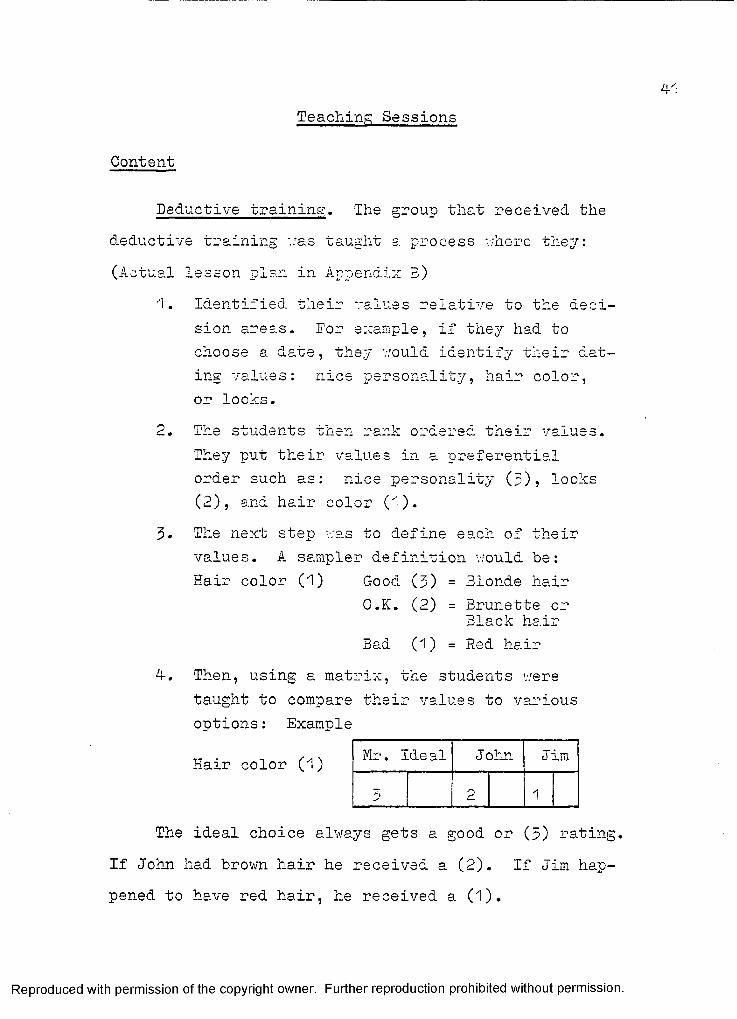
Deductive training. The group that received the deductive training './as taught a process v;here they: (Actual lesson plan in Appendix 3)
1
2.
3.
Identified their values relative to the decision areas. For example, if they had to choose a date, they would identify their dating values: nice personality, hair color,or looks.The students then rank ordered their values. They put their values in a. preferential order such as: nice personality (3)? looks(2), and hair color (1).The next step was to define each of theirvalues. A sampler definition v/ould be:Hair color (1) Good (3) = Blonde hair
O.K. (2) = Brunette or Black hair
Bad (1) = Red hairThen, using a matrix, the students were taught to compare their values to various options: Example
Hair color (1) Mr. lde al John Jim
2 1
The ideal choice always gets a good or (3) rating. If John had brown hair he received a (2). If Jim happened to have red hair, he received a (1).
Reproduced with permission of the copyright owner. Further reproduction prohibited without permission.
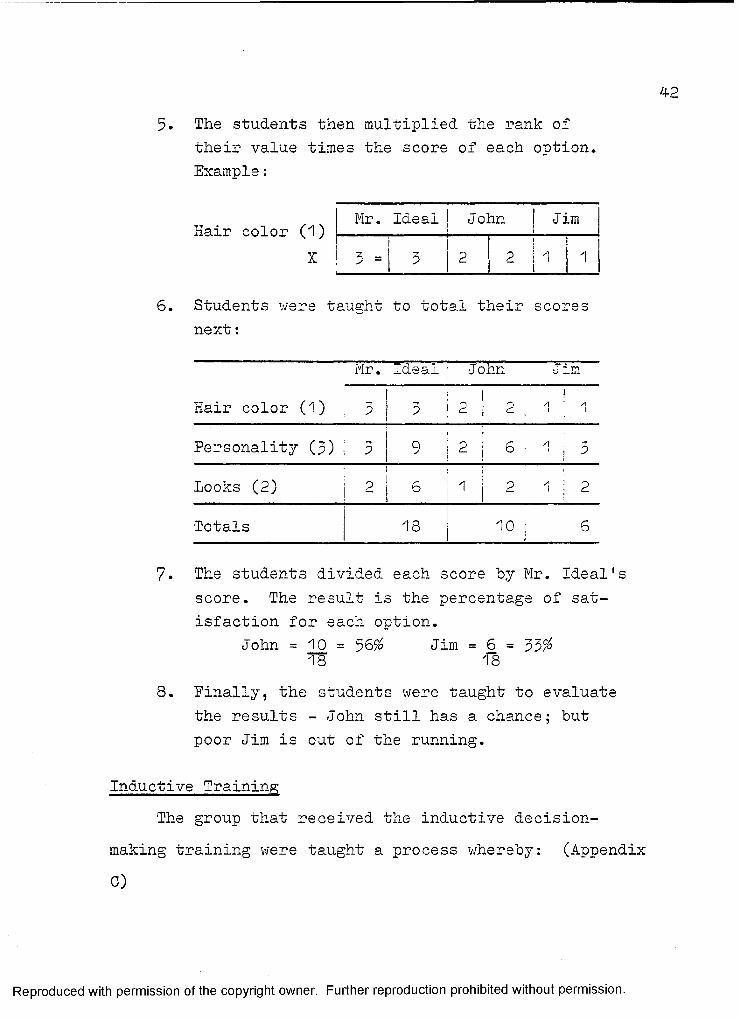
5. The students then multiplied the rank of their value times the score of each option. Example:
Hair color (1) X
Mr. Ideal John | Jim—7 —S ~ 3 2
pX
i 1 i 1
Students were taught next:
to total their scores
Mr. Ideal John c 1mHair color (1) 1
3 ! 3 I2 ! '*■1I--l •
t 1
Personality (5) i5 | 9 2 ; 6 • '1 * !1 3
Looks (2) 2 6 1 I 2 ■ 1 : 2
Totals 18 10 ; 6
7. The students divided each score by Mr. Ideal's score. The result is the percentage of satisfaction for each option.
John = 10 = 56$ Jim = 6 = 53$18 18
8. Finally, the students were taught to evaluate the results - John still has a chance; but poor Jim is out of the running.
Inductive TrainingThe group that received the inductive decision
making training were taught a process whereby: (AppendixC)
Reproduced with permission of the copyright owner. Further reproduction prohibited without permission.
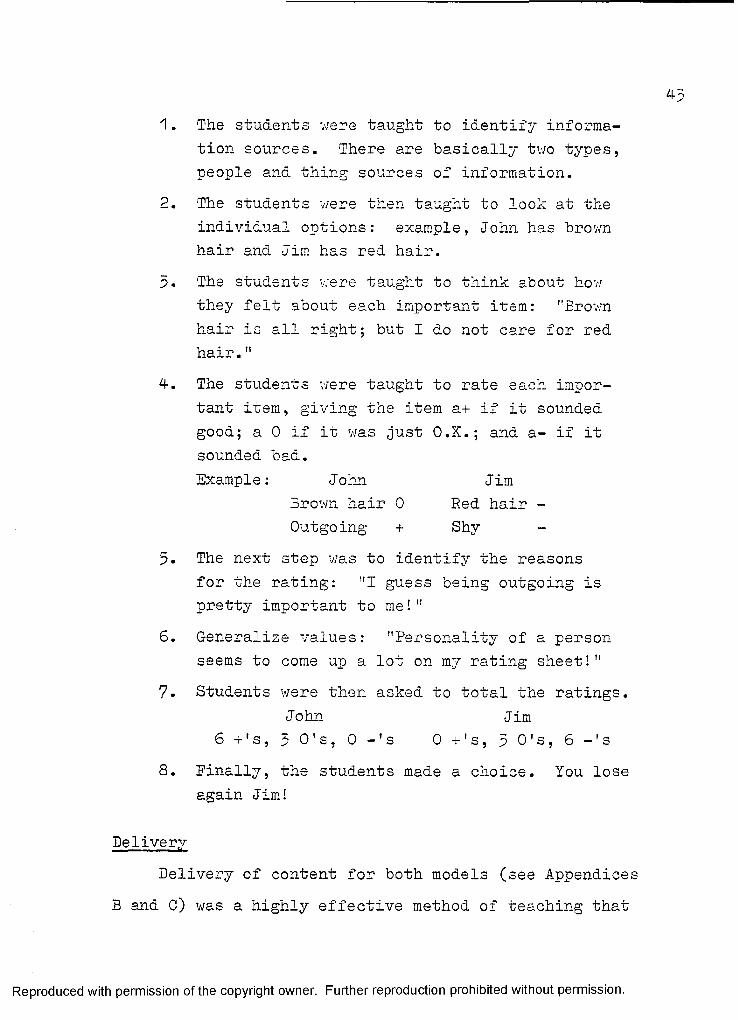
1. The students were taught to identify information sources. There are basically two types, people and thing sources of information.
2. The students were then taught to look at theindividual options: example, John has brownhair and Jim has red hair.
5. The students v;ere taught to think about howthey felt about each important item: "Brownhair is all right; but I do not care for red hair."
4-. The students were taught to rate each important item, giving the item a+ if it sounded good; a 0 if it was just O.K.; and a- if it sounded bad.Example: John Jim
Brovm hair 0 Red hair -Outgoing + Shy
5. The next step was to identify the reasonsfor the rating: "I guess being outgoing ispretty important to me!"
6. Generalize values: "Personality of a personseems to come up a lot on my rating sheet!"
7. Students were then asked to total the ratings.John Jim
6 +'s, 3 0's, 0 -'s 0 +'s, 3 0's, 6 -'s8. Finally, the students made a choice. You lose
again Jim!
DeliveryDelivery of content for both models (see Appendice
B and C) was a highly effective method of teaching that
Reproduced with permission of the copyright owner. Further reproduction prohibited without permission.
4-4-
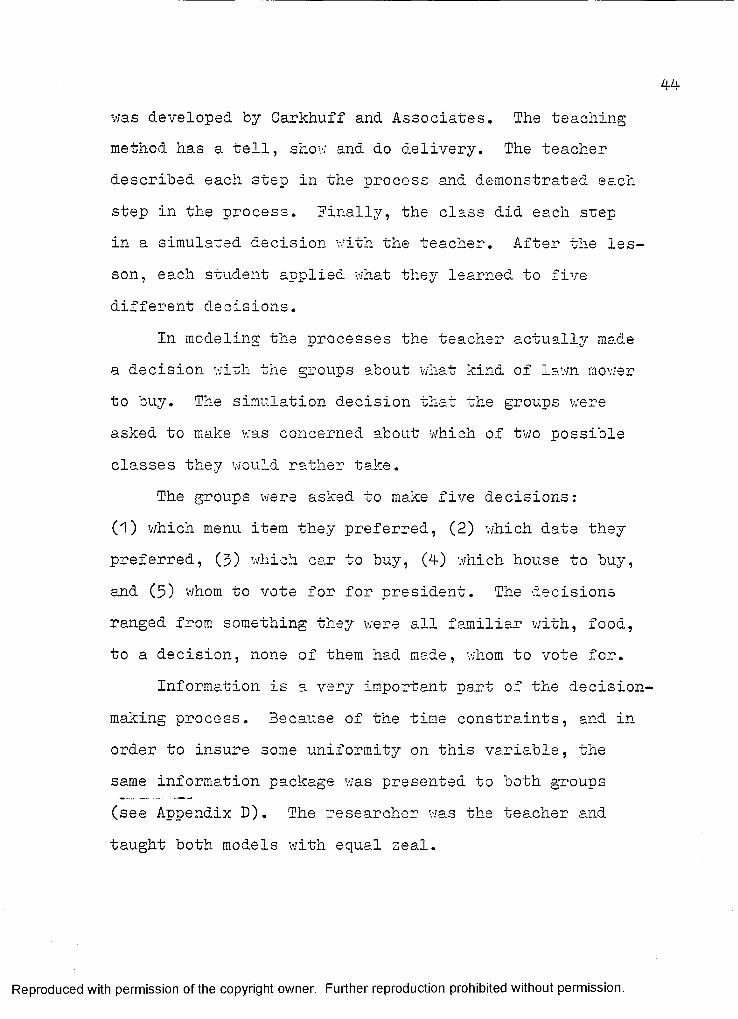
was developed by Carkhuff and Associates. The teaching method has a tell, shov; and do delivery. The teacher described each step in the process and demonstrated each step in the process. Finally, the class did each step in a simulated decision with the teacher. After the lesson, each student applied what they learned to five different decisions.
In modeling the processes the teacher actuallj/' made a decision with the groups about v/hat kind of lawn mower to buy. The simulation decision that the groups were asked to make was concerned about which of two possible classes they would rather take.
The groups were asked to make five decisions:(1) which menu item they preferred, (2) which date they preferred, (3) which car to buy, (4-) which house to buy, and (5) whom to vote for for president. The decisions ranged from something they were all familiar with, food, to a decision, none of them had made, whom to vote for.
Information is a very important part of the decisionmaking process. 3ecause of the time constraints, and in order to insure some uniformity on this variable, the same information package was presented to both groups (see Appendix D). The researcher was the teacher and taught both models with equal zeal.
Reproduced with permission of the copyright owner. Further reproduction prohibited without permission.
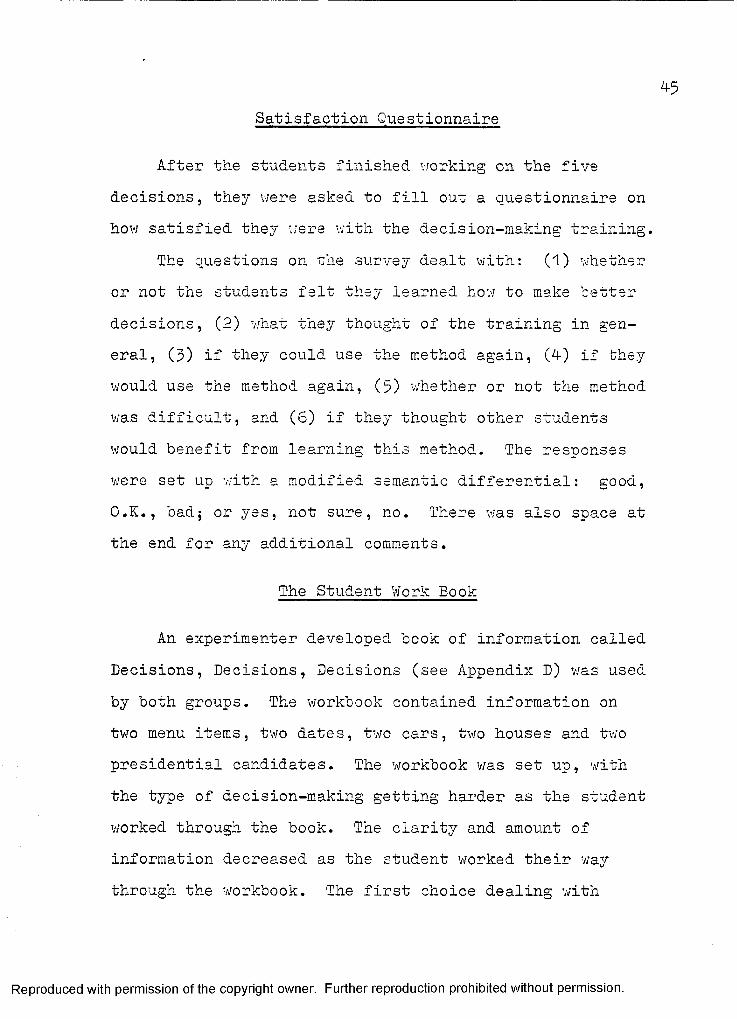
Satisfaction Questionnaire
After the students finished working on the five decisions, they were asked to fill out a questionnaire on how satisfied they were with the decision-making training.
The questions on the survey dealt with: (1) whetheror not the students felt they learned how to make better decisions, (2) what they thought of the training in general, (3) if they could use the method again, (i) if they would use the method again, (5) whether or not the method was difficult, and (6) if they thought other students would benefit from learning this method. The responses were set up with a modified semantic differential: good,O.K., bad; or yes, not sure, no. There was also space at the end for any additional comments.
The Student Work Book
An experimenter developed book of information called Decisions, Decisions, Decisions (see Appendix D) was used by both groups. The workbook contained information on two menu items, two dates, two cars, two houses and two presidential candidates. The workbook was set up, with the type of decision-making getting harder as the student worked through the book. The clarity and amount of information decreased as the student worked their way through the workbook. The first choice dealing with
Reproduced with permission of the copyright owner. Further reproduction prohibited without permission.
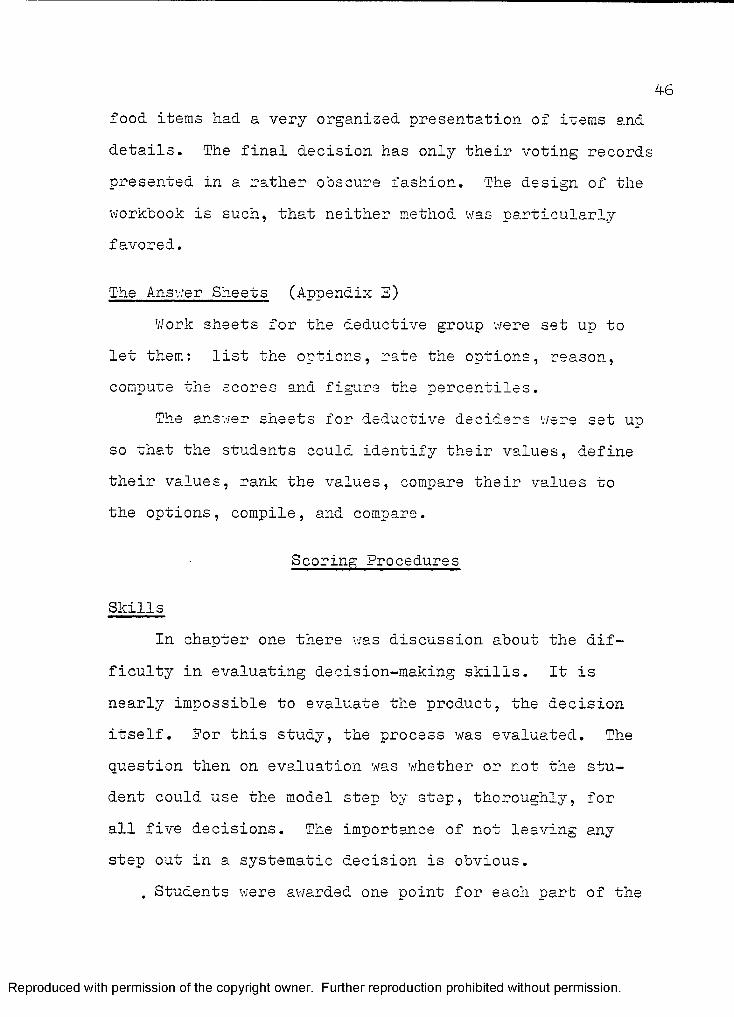
food items had a very organized presentation of items and details. The final decision has only their voting record presented in a rather obscure fashion. The design of the workbook is such, that neither method was particularly favored.
The Answer Sheets (Appendix E)Work sheets for the deductive group were set up to
let them: list the options, rate the options, reason,compute the scores and figure the percentiles.
The answer sheets for deductive deciders were set up so that the students could identify their values, define their values, rank the values, compare their values to the options, compile, and compare.
Scoring Procedures
SkillsIn chapter one there was discussion about the dif
ficulty in evaluating decision-making skills. It is nearly impossible to evaluate the product, the decision itself. For this study, the process was evaluated. The question then on evaluation was whether or not the student could use the model step by step, thoroughly, for all five decisions. The importance of not leaving any step out in a systematic decision is obvious.
. Students were awarded one point for each part of the
Reproduced with permission of the copyright owner. Further reproduction prohibited without permission.
4-7
decision-making process they did for each of the five decisions. The maximum points for a student using a deductive model was 300. The maximum points for a student using the inductive model was 360. The discrepancy between the two score totals v;as corrected by computing percentages for each score.
SatisfactionStudents' satisfaction with their decisions must also
be evaluated. There were 5 questions on the satisfaction survey (Appendix G) and students were evaluated on their response to each item. Students were rated: a 3 for anelevated response such as good; 2 for a neutral response like unsure; and 1 for a depressed response, for example bad. Each student had 6 scores for satisfaction.
Data Analysis
Inferential StatisticThe skill score and the satisfaction scores were then
added to the original code for each student. If the theoretical Jane Adams from earlier in the chapter had scored 260 on the process skills and 2, 3» 15 35 35 3 on the satisfaction survey, her code would now be:
Reproduced with permission of the copyright owner. Further reproduction prohibited without permission.
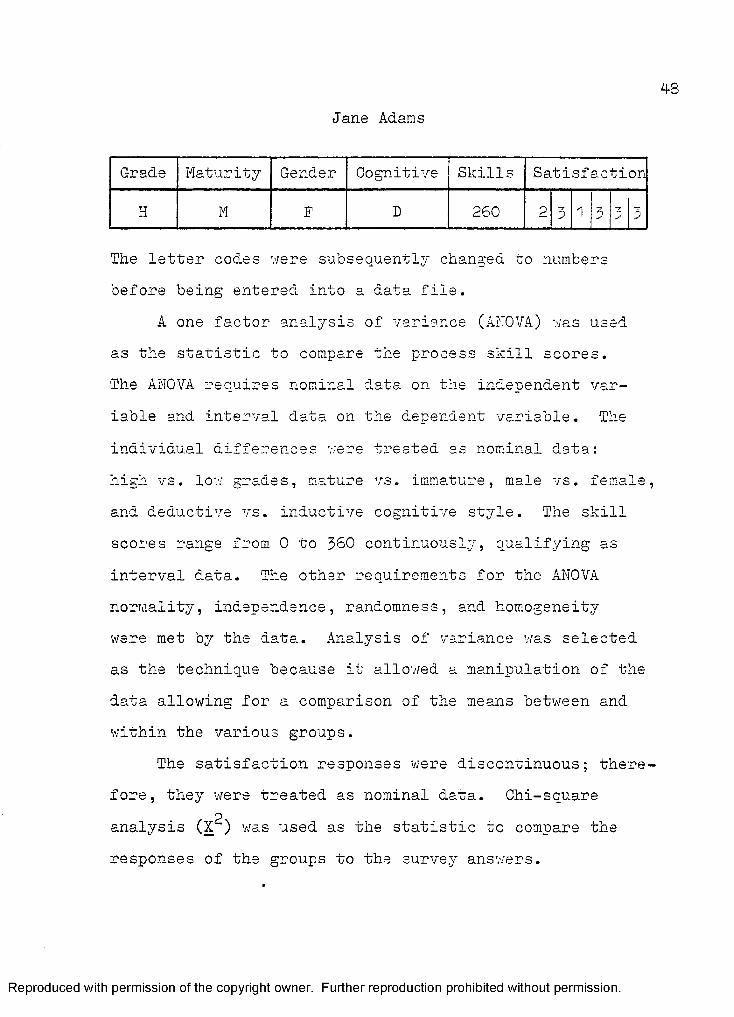
Jane Adams48
Grade Maturity Gender Cognitive Skills Satisf actionTJ.1 M F D 260 £ 3 1 > 3
The letter codes were subsequently changed to numbers before being entered into a data file.
A one factor analysis of variance (ANOVA) was used as the statistic to compare the process skill scores.The ANOVA requires nominal data on the independent variable and interval data on the dependent variable. The individual differences v;ere treated as nominal data: high vs. lo'.v grades, mature vs. immature, male vs. female, and deductive vs. inductive cognitive style. The skill scores range from 0 to 360 continuously, qualifying as interval data. The other requirements for the ANOVA normality, independence, randomness, and homogeneity were met by the data. Analysis of variance was selected as the technique because it allowed a manipulation of the data allowing for a comparison of the means between and within the various groups.
The satisfaction responses were discontinuous; therefore, they were treated as nominal data. Chi-square
panalysis (X ) was used as the statistic to compare the responses of the groups to the survey answers.
Reproduced with permission of the copyright owner. Further reproduction prohibited without permission.
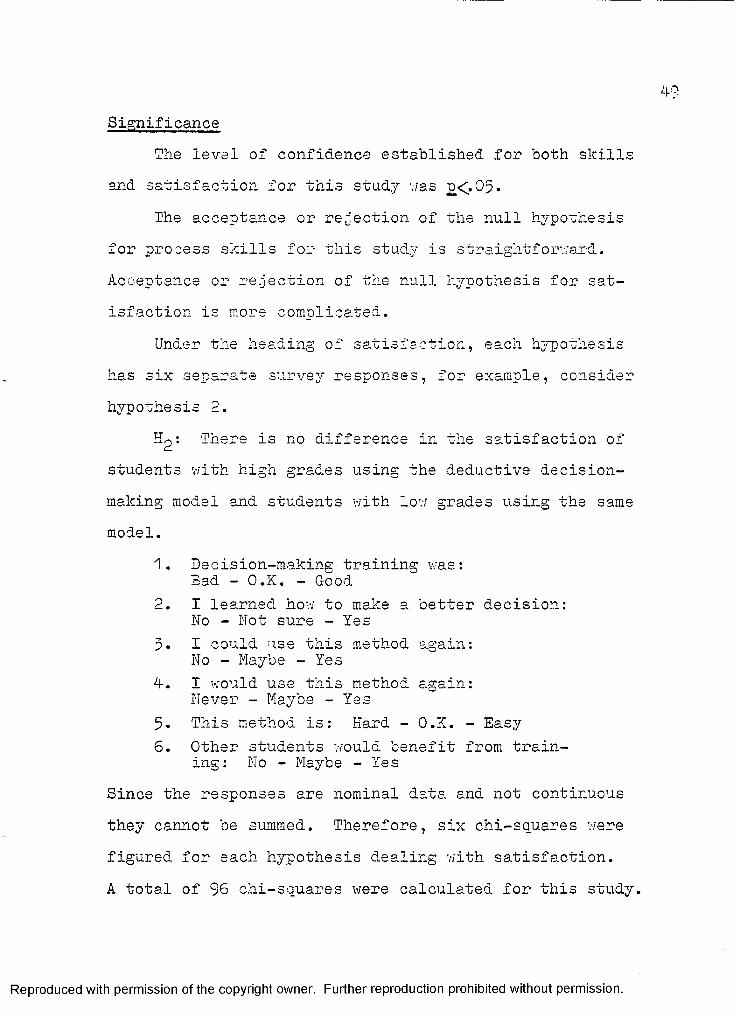
SignificanceThe level of confidence established for both skills
and satisfaction for this study was n<.05.The acceptance or rejection of the null hypothesis
for process skills for this study is straightforward. Acceptance or re.jection of the null hypothesis for satisfaction is more complicated.
Under the heading of satisfaction, each hypothesis has six separate survey responses, for example, consider hypothesis 2.
There is no difference in the satisfaction of students with high grades using the deductive decisionmaking model and students with low grades using the same model.
1. Decision-making training was:Bad - O.K. - Good
2. I learned how to make a better decision:No - Not sure - Yes
3. I could use this method again:No - Maybe - Yes
4. I would use this method a,gain:Never - Maybe - YesThis method is: Hard - O.K. - Easy
6. Other students would benefit from training: No - Maybe - Yes
Since the responses are nominal data, and not continuousthey cannot be summed. Therefore, six chi-squares werefigured for each hypothesis dealing with satisfaction.A total of 96 chi-squares were calculated for this study.
Reproduced with permission of the copyright owner. Further reproduction prohibited without permission.
For the purpose of this study, a rejection of the null hypothesis at the £<.05 level for any of the six items in a particular hypothesis will constitute rejection of that hypothesis in part, for the specific item. Following the earlier example, if there was a significant difference in the responses of students with high grades as compared to students with low grades on question 4, for example, the null hypothesis for would be rejected for item 4 only.
The alternative treatment for satisfaction was to treat each of the 96 chi-squares as a separate hypothesis. This idea was rejected as it would have resulted in an incomprehensible degree of specificity.
Reproduced with permission of the copyright owner. Further reproduction prohibited without permission.
CHAPTER IV
THE RESULTS
Introduction
This chapter contains an overview of the results of this study using a series of tables. Each of the 32 hypotheses is reported with: results, a statistical table,and inferred results tabulation for hypotheses concerning satisfaction will be replete with a 6 item response chi- square table.
Students were given the option of three responses to each item, for example: bad, O.K., good; no, maybe, yes.Since there was a variation in the answer format, the chi- square summary table utilizes low (L), medium (M), and high (H). Inasmuch as there were few low responses on the satisfaction survey, such as bad or no, the low cells were collapsed for statistical analysis. The actual frequency of response is still reported in the table.
OverviewTable 4 graphically depicts the direction of each
of the 32 hypotheses. The arrows indicate the direction between or within variable groups, for each of the numbered hypotheses.
51
Reproduced with permission of the copyright owner. Further reproduction prohibited without permission.
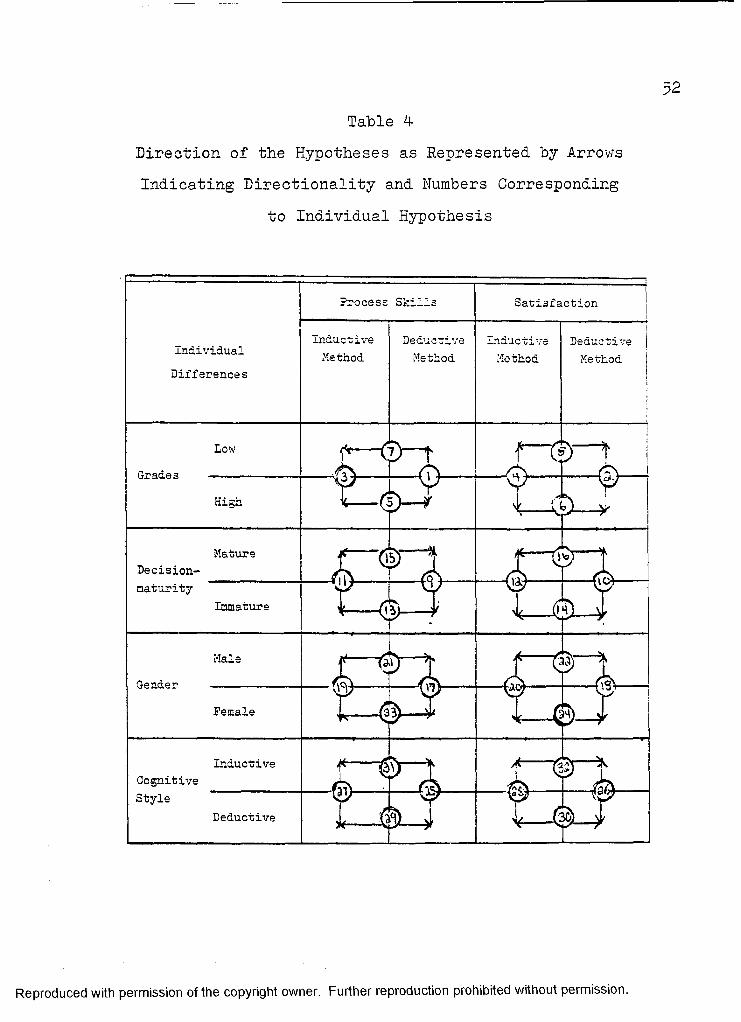
Table 4-Direction of the Hypotheses as Represented by Arrows Indicating Directionality and Numbers Corresponding
to Individual Hypothesis
Process Skills Satisfaction
InductiveMethod
inductiveMethodIndividual
Differences
LowGrades
High
Decision-maturity
Immature
MaleGender
Female
■©--^CognitiveStyle
Deductive
Reproduced with permission of the copyright owner. Further reproduction prohibited without permission.

Table 5 represents the actual number of students in each treatment group. The low numbers in the inductive cognitive group was discussed in Chapter III.Because of the size of the cells, the results of hypotheses 25, 25, 27, 28, 315 and 32 should be cautiously interpreted. Further study with a larger number of inductive cognitive style students is recommended.
Reproduced with permission of the copyright owner. Further reproduction prohibited without permission.
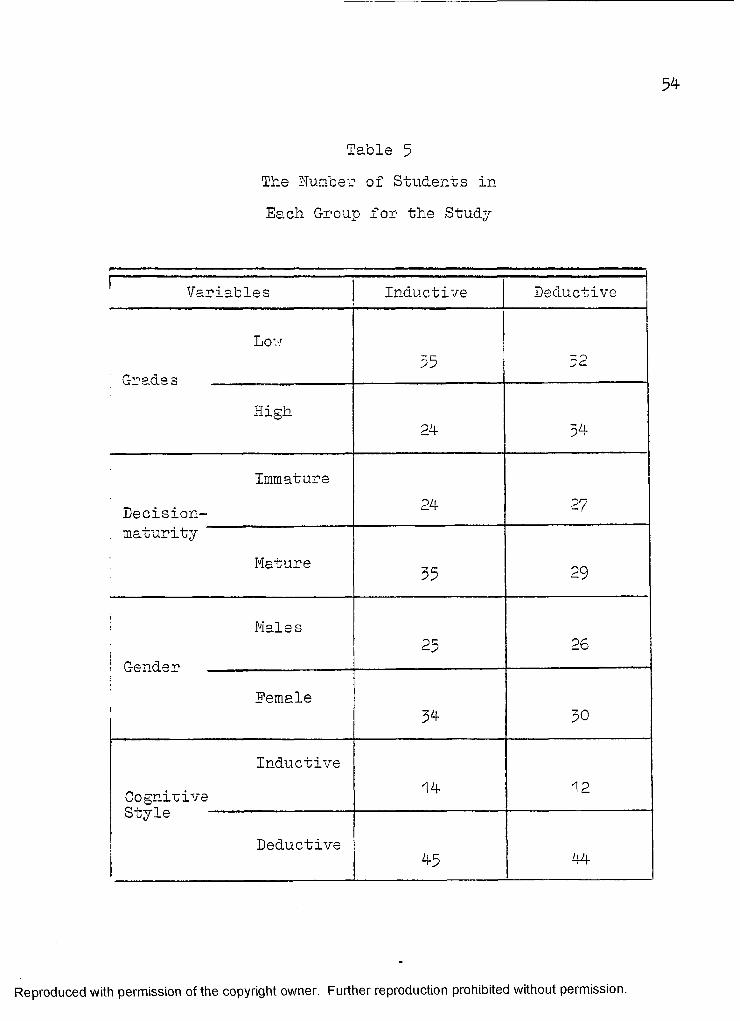
54
Table 5 The Number of Students in Each Group for the Study
Variables Inductive Deductive
Loupr| p 55 32
High24 54
ImmatureDecision- 24 27
, maturityMature 55 29
Males; flonr)o-p
25 26
Female1 34 30
InductiveCognitive 14 12otyle
Deductive45 44
Reproduced with permission of the copyright owner. Further reproduction prohibited without permission.
Table 6 indicates the average scores for each variable group. The mean is given for the process skill scores.
Table 7 overviews the significant differences between and among the different variable groups in this study.The different lines indicate at what level of confidence a significant difference was found. A single black line indicates that the null hypothesis was rejected at the £<•05 level of confidence. A double black line indicates the null hypothesis was rejected at the £<.01 level of confidence.
Reproduced with permission of the copyright owner. Further reproduction prohibited without permission.
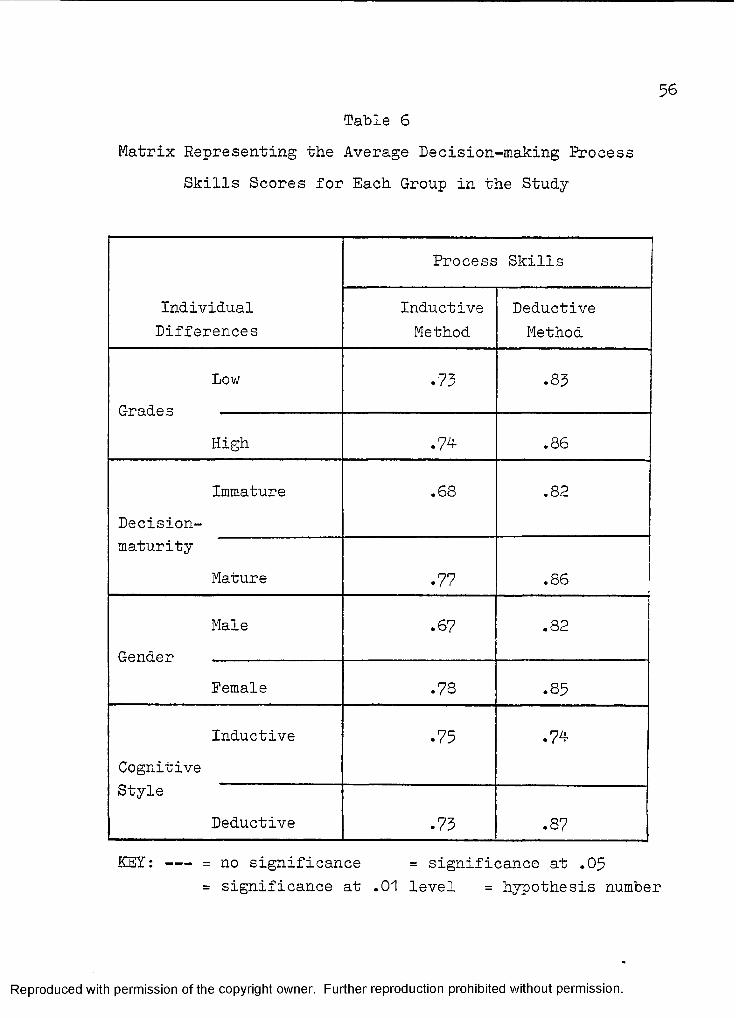
56Table 6
Matrix Representing the Average Decision-making Process Skills Scores for Each Group in the Study
IndividualDifferences
Process Skills
InductiveMethod
DeductiveMethod
Lowflriqf] pq _
• 73 .83
High • 74 .86
ImmatureDecision-
.68 .82
maturityMature .77 .86
MaleH-pnrip-p
.67 OJ00•
Female .73 .85
InductiveCognitive
• 75 .74
StyleDeductive .73 CO•
KEY: -- = no significance = significance at .05= significance at .01 level = hypothesis number
Reproduced with permission of the copyright owner. Further reproduction prohibited without permission.
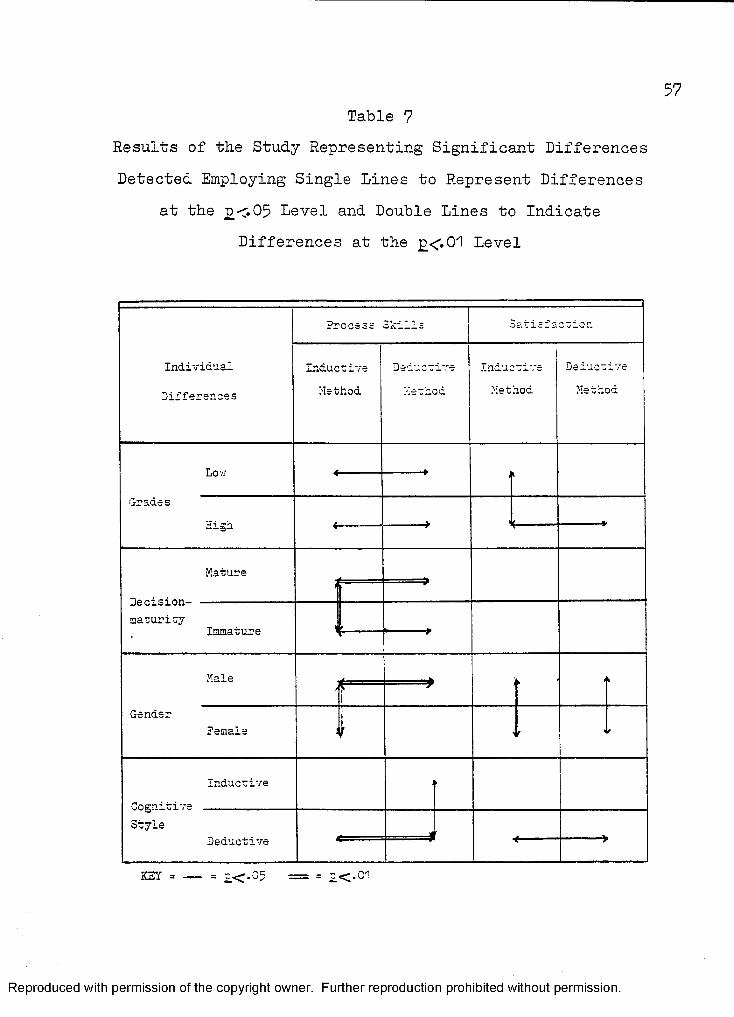
Table 7Results of the Study Representing Significant Differences Detected Employing Single Lines to Represent Differences
at the n<.05 Level and Double Lines to Indicate Differences at the £<.01 Level
Process Skills Satisi sccion
IndividualDifferences
inductiveMethod
Deductive Me"hod
InductiveMethod
Deduceive Method
Low «----- ■
GradesHigh <
Maturei --
Decision— ■ .. —maturity
Immature !-----
Male/ > 4
GenderFemale : f it
Inductiver.nfjyi r-i I
StyleDeductive J *
KEY = -- = £<-05 = = £<.C^
Reproduced with permission of the copyright owner. Further reproduction prohibited without permission.
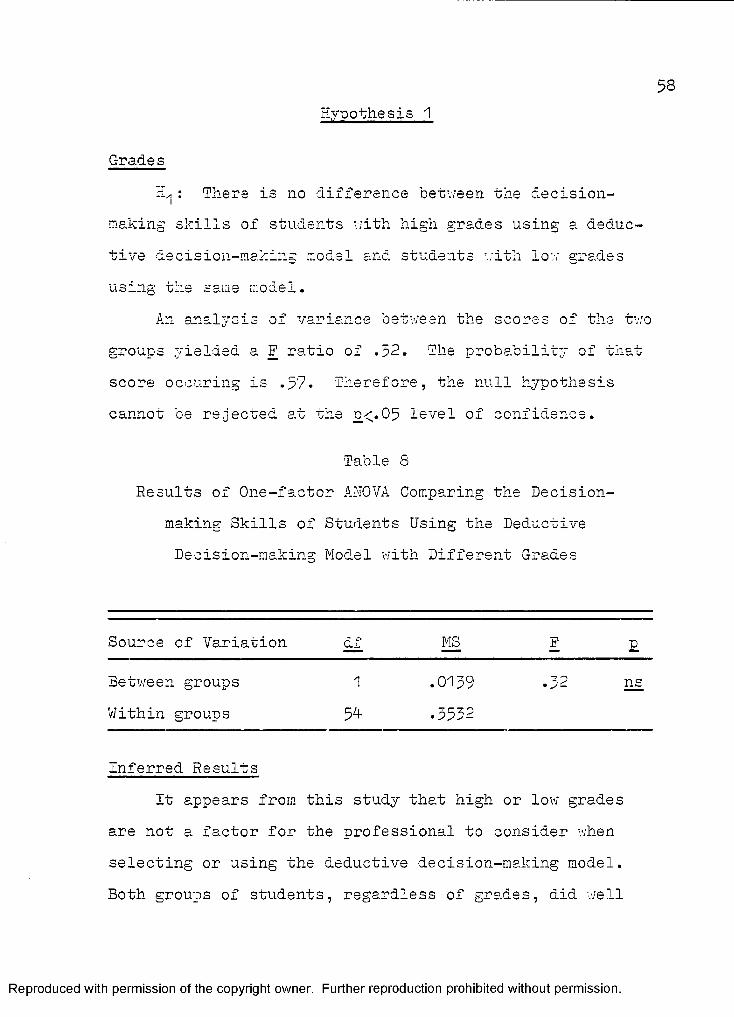
Hypothesis 158
Grades?!/] : There is no difference between the decision
making skills of students with high grades using a deductive decision-making model and students with low grades using the same model.
An analysis of variance between the scores of the two groups yielded a P ratio of .32. The probability of that score occuring is .57* Therefore, the null hypothesis cannot be rejected at the o<.05 level of confidence.
Table SResults of One-factor AITOVA Comparing the Decision
making Skills of Students Using the Deductive Decision-making Model with Different Grades
Source of Variation df MS P p
Between groups 1 Within groups 54-
.0139 • 3532
.32 ns
Inferred ResultsIt appears from this study that high or low grades
are not a factor for the professional to consider when selecting or using the deductive decision-making model. Both groups of students, regardless of grades, did well
Reproduced with permission of the copyright owner. Further reproduction prohibited without permission.
with this model, .83 for low grade students and .86 for high grade students. Therefore, it would appear that the deductive model would he a good model to use in a situation where there is a variety of academic abilities.
Hypothesis 2
H2: There is no difference between the satisfactionof students with high grades using the deductive decisionmaking model and students with low grades using the same model.
A chi-square analysis of the student responsesrevealed no significant differences on the questionnaire
oreported in Table 9. The highest obtained X was 2.978 on question d. The probability of that score occurring is £ (X2 2.978) = .08. Therefore, the null hypothesis cannot be rejected at the £<.05 level of confidence.
Reproduced with permission of the copyright owner. Further reproduction prohibited without permission.
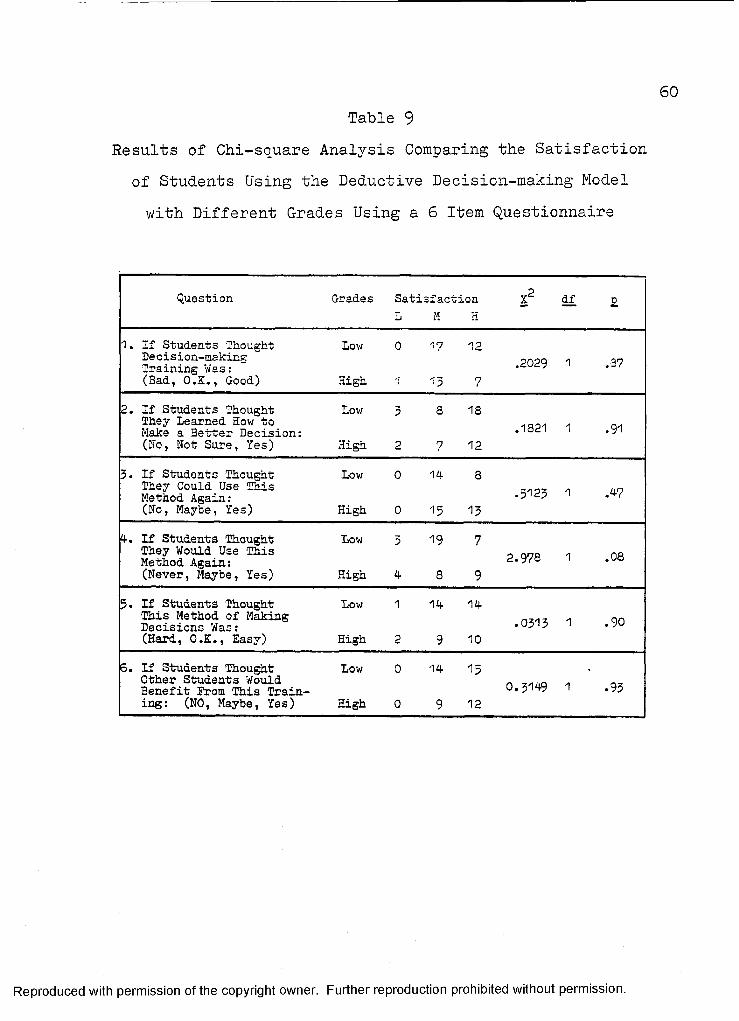
Table 9 Results of Chi-square Analysis Comparing the Satisfaction of Students Using the Deductive Decision-making Model with Different Grades Using a 6 Item Questionnaire
pQuestion Grades Satisfaction X dfL M H
1. If Students Thought Low 0 17 12Decision-making 0n0Q . -nTraining Was: .d'Jd'i .3/(Bad, O.K., Good) High 1 13 7
2. If Students Thought Low 3 3 18They Learned How to . Q„Make a Better Decision: *(Ho, Not Sure, Yes) High 2 7 12
3. If Students Thought Low 0 14- 8They Could Use This Method Again:(No, Maybe, Yes) High 0 15 13
.5123 -1 .4-7
4. If Students Thought Low 3 19 7They Would Use This a . nftMethod Again: 1 *oa(Never, Maybe, Yes) High 4 - 8 9
If Students Thought Low 1 14- 14-This Method of Making Decisions Was:(Hard, O.K., Easy) High 2 9 "10
6. If Students Thought Low 0 14- 15Other Students Would n aBenefit Prom This Train- 0.3149 1 .93ing: (NO, Maybe, Yes) High 0 9 12
Reproduced with permission of the copyright owner. Further reproduction prohibited without permission.
Inferred ResultsIf further research substantiated these findings, it
seems that there is scarcely any difference in how pleased students are with the deductive model, despite their grade point average. Both groups seemed modestly pleased.
Hypothesis 3
H : There is no difference between the decisionmaking skills of students with high grades using the inductive decision-making process and the skills of low grade students using the same model.
An analysis of variance between the scores of students with high grades and the scores of students with low grades, yielded an F ratio of 0.2208. The probability of that score occurring is .64. Therefore, the null hypothesis cannot be rejected at the p <*05 level of confidence.
Reproduced with permission of the copyright owner. Further reproduction prohibited without permission.
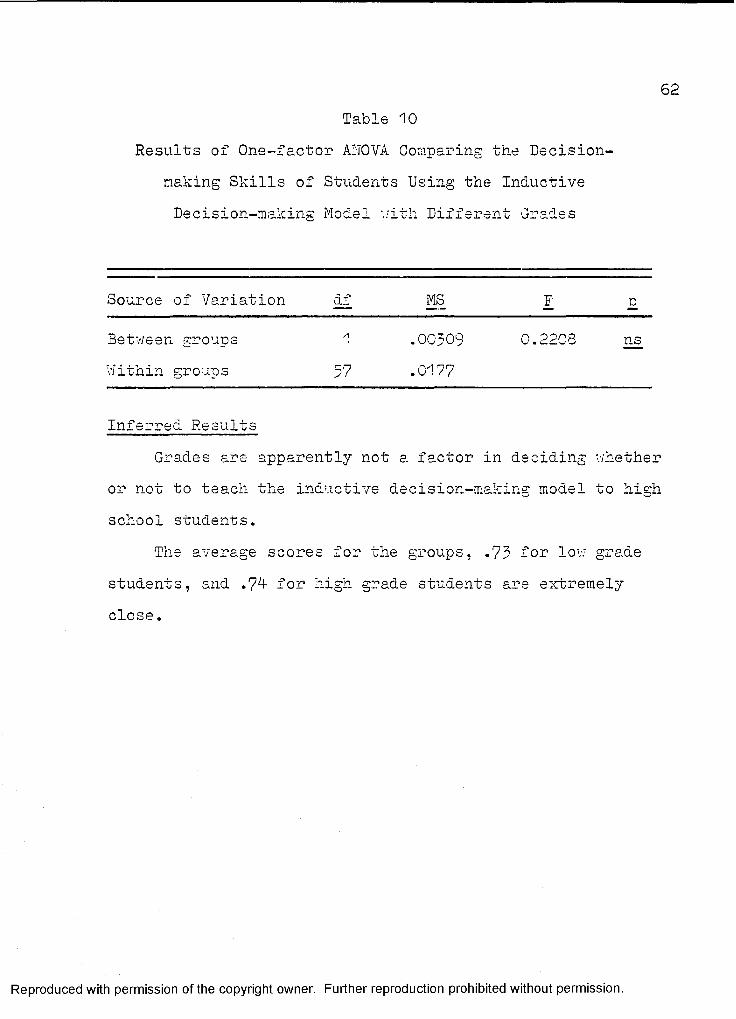
62Table 10
Results of One-factor ANOVA Comparing the Decisionmaking Skills of Students Using the InductiveDecision-making Model with Different Grades
Source of Variation of MS F 0Between groups Within groups 57
.00509
.01770.2208 ns
Inferred ResultsGrades are apparently not a factor in deciding v/hether
or not to teach the inductive decision-making model to high school students.
The average scores for the groups, .75 for low grade students, and .74 for high grade students are extremely close.
Reproduced with permission of the copyright owner. Further reproduction prohibited without permission.
Hypothesis 4
H : There is no difference between the satisfactionof students with high grades using the inductive decisionmaking model and students with low grades using the same model.
A chi-square analysis of the student responses indicated no significant difference on the questionnaire
preported in Table 11. The largest obtained X was 4.342 on question 4. The probability of that score occurring is p (X2 4.34-2) = .03. Therefore, the null hypothesis can be rejected at the £<05 level of confidence.
Reproduced with permission of the copyright owner. Further reproduction prohibited without permission.
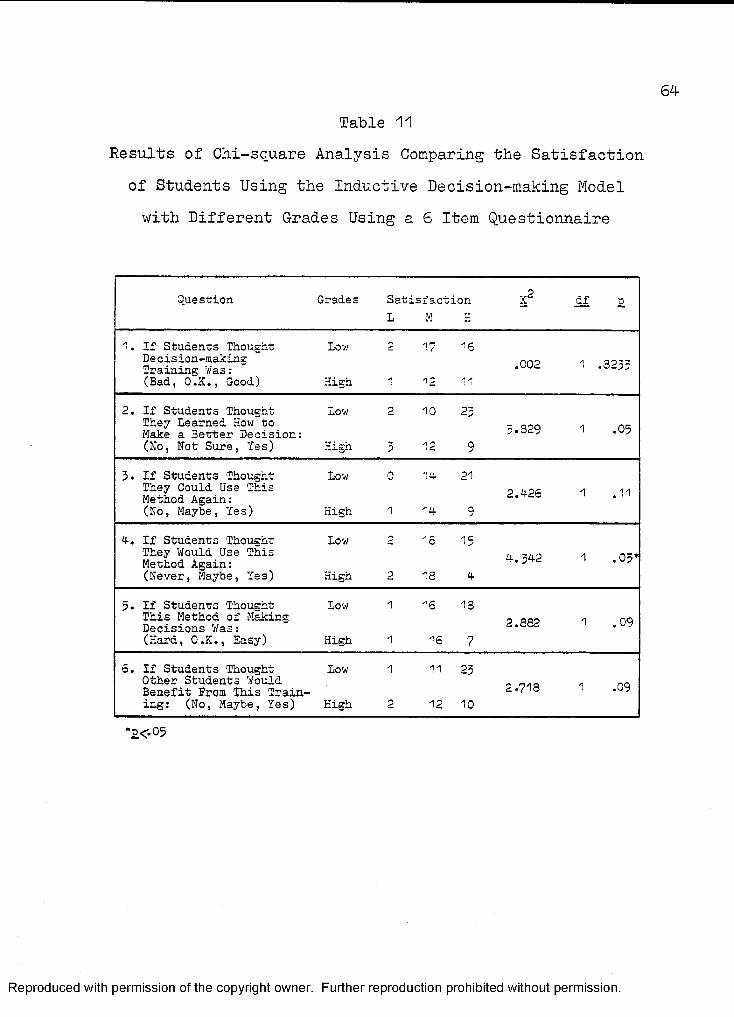
64-
Table 11 Results of Chi-square Analysis Comparing the Satisfaction of Students Using the Inductive Decision-making Model with Different Grades Using a 6 Item Questionnaire
2Question Grades Satisfaction X dfL M H
1. If Students Thought Low 2 17 16Decision-making ,,Training Was: *00‘- 1(Bad, O.K., Good) High 1 12 11
2. If Students Thought Low 2 10They Learned How-to Make a 3etter Decision:(No, Not Sure, Yes) High 5 12
.829 1 .05
3. If Students Thought Low 0 id 21They Could Use This 0 ^A — « * ~ . C .» u!‘ CJO I • ' 1Method Again:
(No, Maybe, Yes) High 1 Id
d. If Students Thought Low 2 18 15They Would Use This . ^Method Again: ,U7I(Never, Maybe, Yes) nigh 2 18
5. If Students Thought Low 1 16 13This Method of Making - i noDecisions Was: 2*882 1 *°9(Hard, O.K., Easy) High 1 16
5. If Students Thought Low 1 11 23Other Students WouldBenefit From This Training: (No, Maybe, Yes) High 2 12 10
2-718 1 .09
*£<.05
Reproduced with permission of the copyright owner. Further reproduction prohibited without permission.
Inferred ResultsA significant number of students v/ith low grades
thought they would use the model again Cv = *03). Forty- three percent of the students with lov; grades said they would use the model again. Only 16$ of high grade students thought they would use the inductive model again. Significance was approached on questions 2, 5? and 6, again with high responses from students with low grades.
Hypothesis 5
There is no difference between the decisionmaking skills of students v/ith high grades using the deduc tive decision-making model and students with high grades using the inductive decision-making model.
An analysis of variance between the scores of the two groups yielded an F ratio of 6.135. The probability of that score occurring is 0.0170. Therefore, the null hypothesis can be rejected at the £<.05 confidence level.
Reproduced with permission of the copyright owner. Further reproduction prohibited without permission.
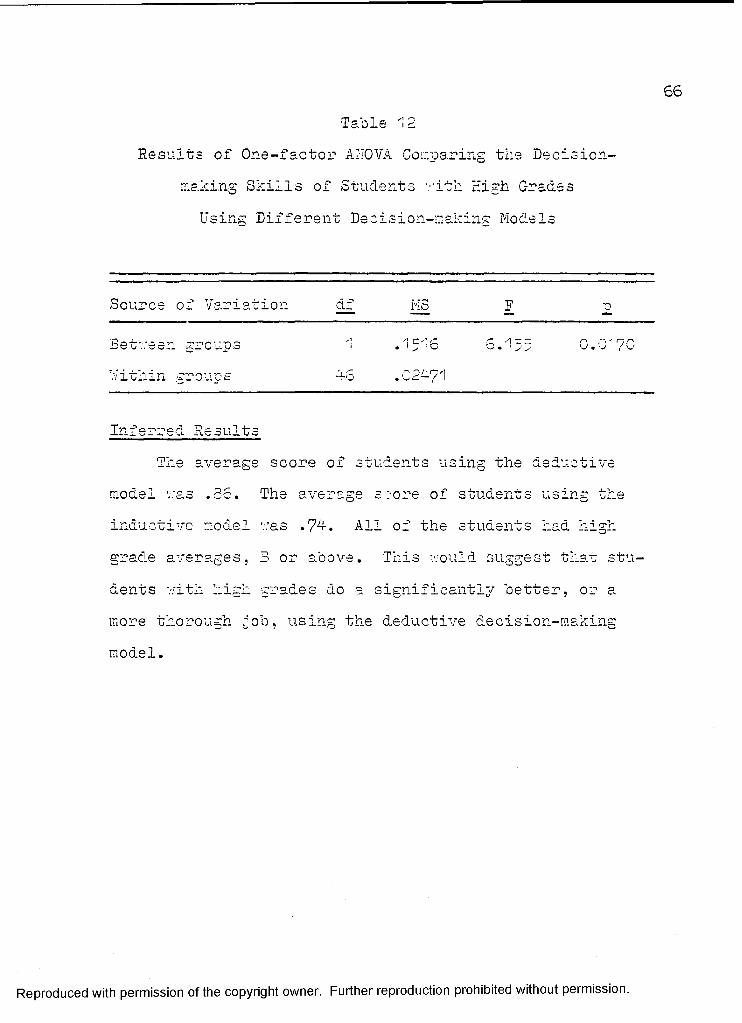
66Table 12
Results of One-factor AITOVA Comparing the Decisionmaking Skills of Students vrith High C-radesUsing Different Decision-making Models
Source of Variation df MS F ■Q
Betv/eer.. groups 1 .1516 6.135 0.0'70Within groups 46 .C2471
Inferred ResultsThe average score of students using the deductive
model v:as .35. The average s :ore of students using the inductive model v;as .7 . All of the students had high grade averages, B or above. This vould suggest that students v.'ith high grades do a significantly better, or a more thorough .job, using the deductive decision-making model.
Reproduced with permission of the copyright owner. Further reproduction prohibited without permission.
Hypothesis 6
H : There is no difference between the satisfactionof students with high grades using the deductive decision' making model and students v/ith high grades using the inductive decision-making model.
A chi-square analysis of the student responses indicated a significant difference on the questionnaire
2reported in Table 13* An X of 2-767 was obtained on question 4. The probability of that score occurring is £ (X 3*767) = .04. Therefore, the null hypothesis can be rejected at the £<.05 level of confidence for item 4.
Reproduced with permission of the copyright owner. Further reproduction prohibited without permission.
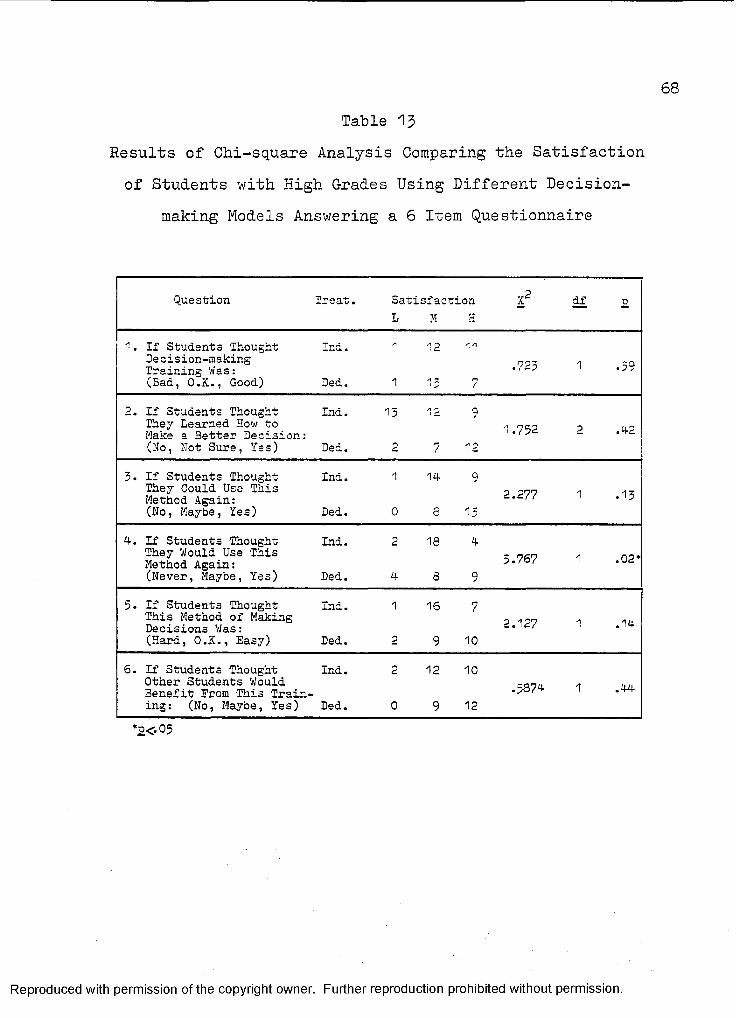
68
Table 13 Results of Chi-square Analysis Comparing the Satisfaction of Students with High Grades Using Different Decision
making Models Answering a 6 Item Questionnaire
PQuestion Treat. Satisfaction X df oL M H
1. If Students Thought Ind. 1 12 11Deoision-makingTraining Was: ■(Baa, O.K., Good) Ded. 1 1; 7
2. If Students Thought Ind. 15They Learned How to Make a Better Decision:(No, Mot Sure, Yes) Ded.They Learned How to . , 0Make a Better Decision: ~ “
5. If Students Thought Ind. 1 14 9They Could Use This 0Method Again: { ' •(No, Maybe, Yes) Ded. 0 S 15
4. If Students Thought Ind. 2 18They Would Use This Method Again:(Never, Maybe, Yes) Ded.They Would Use This _ nen « n0,Method Again: f •Ui=
5. If Students Thought Ind. 1 16 7This Method of Making _Decisions Was: — *■/ *4(Hard, O.K., Easy) Ded. 2 9 10
6. If Students Thought Ind. 2 12 10Other Students WouldBenefit From This Training: (No, Maybe, Yes) Ded. 0 9 12
.5874 1 .44
*£<■ °5
Reproduced with permission of the copyright owner. Further reproduction prohibited without permission.
69
Inferred ResultsThere was a significant difference detected between
the satisfaction of students with high grades using different models. Specifically, 75°/° of the students with high grades were unsure as to whether or not they would want to use the inductive model again. Conversely, 4-2$ of the students with high grades said they would be willing to use the deductive model again.
Hypothesis 7
Hy: There is no difference between the decisionmaking skills of students v/ith low grades using a deductive decision-making model and students with low grades using a inductive decision-making model.
An analysis of variance was used to compare the scores of the two groups. The ANOVA yielded an F ratio of 6.124-. The probability of that ratio occurring is 0.0160. Therefore, the null hypothesis can be rejected at the P<.05 level of confidence.
Reproduced with permission of the copyright owner. Further reproduction prohibited without permission.
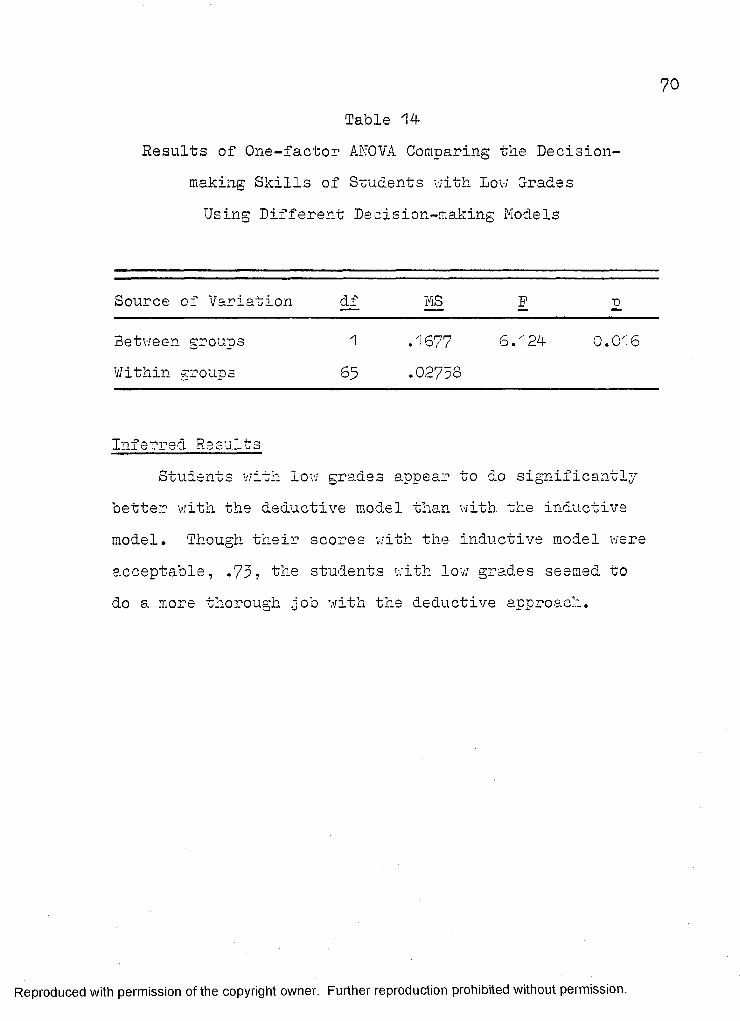
70
Table 14-Results of One-factor ANOVA Comparing the Decision
making Skills of Students with Low G-radesUsing Different Decision-making Models
Source of Variation df MS F TO
Between groups 1 .1677 6.124 0.016Within groups 65 .02758
Inferred ResultsStudents with low grades appear to do significantly
better with the deductive model than v/ith the inductive model. Though their scores with the inductive model were acceptable, .73, the students with low grades seemed to do a more thorough ;job with the deductive approach.
Reproduced with permission of the copyright owner. Further reproduction prohibited without permission.
Hypothesis 8
Hg: There is no difference in the satisfaction ofstudents v/ith low grades using a deductive decisionmaking model and students with low grades using an inductive decision-making model.
A chi-square analysis of the student responses indicated no significant difference on the questionnaire
preported in Table 15- The largest obtained X was 2.135 on question 4-. The probability of that score occurring is £ (X2 2.135) = .14-. Therefore, the null hypothesis cannot be rejected at the r<j05 level of confidence.
Reproduced with permission of the copyright owner. Further reproduction prohibited without permission.
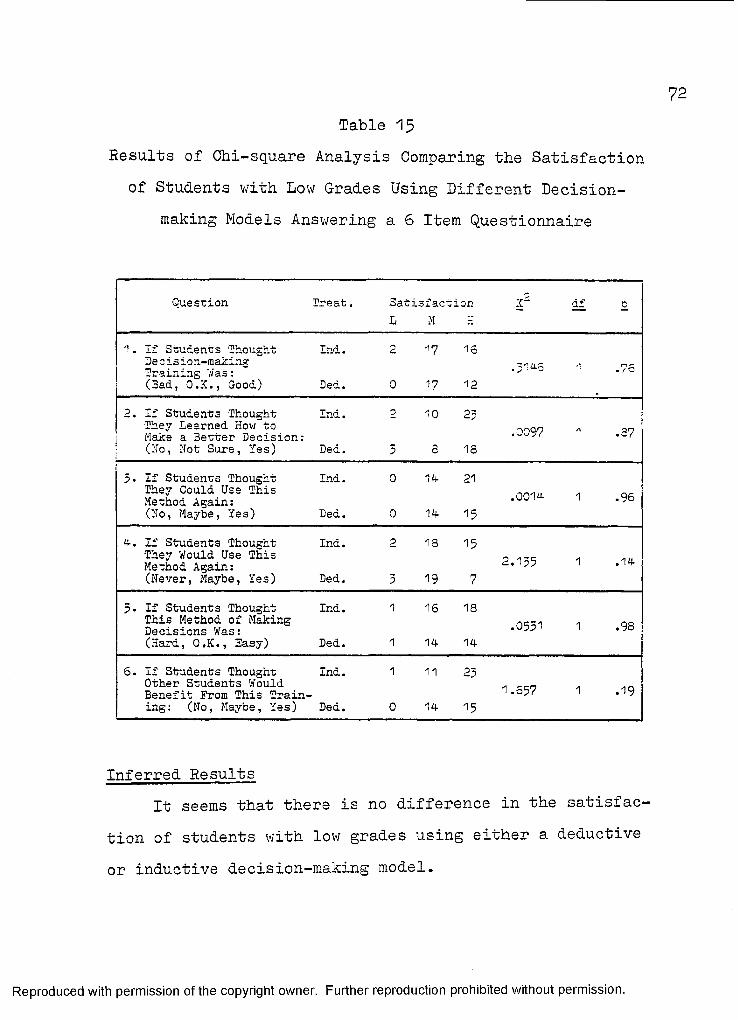
Table 15 Results of Chi-square Analysis Comparing the Satisfaction of Students v/ith Low Grades Using Different Decision
making Models Answering a 6 Item Questionnaire
Question Treat. Satisfaction K“ dfL M
1. If Students Thought Ind. 2 17 16De c is ion-making Training Was:(3ad, O.K., Good) Ded. 0 17 12
2. If Students Thought Ind. 2 10 23They learned How to onQ9 .Make a 3etter Decision:(Mo, Not Sure, Yes) Ded. 3 S 18
3- If Students Thought Ind. 0 Id 21They Could Use This nn<mMethod Again: •00111 1 *96(No, Maybe, Yes) Ded. 0 1d 15
d. If Students Thought Ind. 2 18 15They Would Use This - .Method Again: 135 ' *(Never, Maybe, Yes) Ded. 3 19 7
If Students Thought Ind. 1 16 18This Method of Making „ OQDecisions Was: '°5^ 1 *98(Hard, O.K., Easy) Ded. 1 1d 1d
6. If Students Thought Ind. 1 11 23Other Students Would Benefit Prom This Training: (No, Maybe, Yes) Ded. 0 1d 15
Inferred Results It seems that there is no difference in the satisfac
tion of students with low grades using either a deductive or inductive decision-making model.
Reproduced with permission of the copyright owner. Further reproduction prohibited without permission.

Hypothesis 9
Decision-making: MaturityH : There is no difference between the decision
making scores of decision-mature students using the deductive decision-making model and decision-immature students using the same model.
An analysis of variance between the scores of the twogroups yielded an F ratio of 0.4-34-7* The probability of that score occurring is 0.5125. Therefore, the nullhypothesis cannot be rejected at the n<'.05 level ofconfidence.
Table 16Results of One-factor ANOVA Comparing the Decision
making Skills of Students Using the Deductive Decision-making Model with Different
Levels of Decision-maturity
Source of Variation df MS F £Between groups Within groups
154
.0153
.05520.4347 ns
Reproduced with permission of the copyright owner. Further reproduction prohibited without permission.
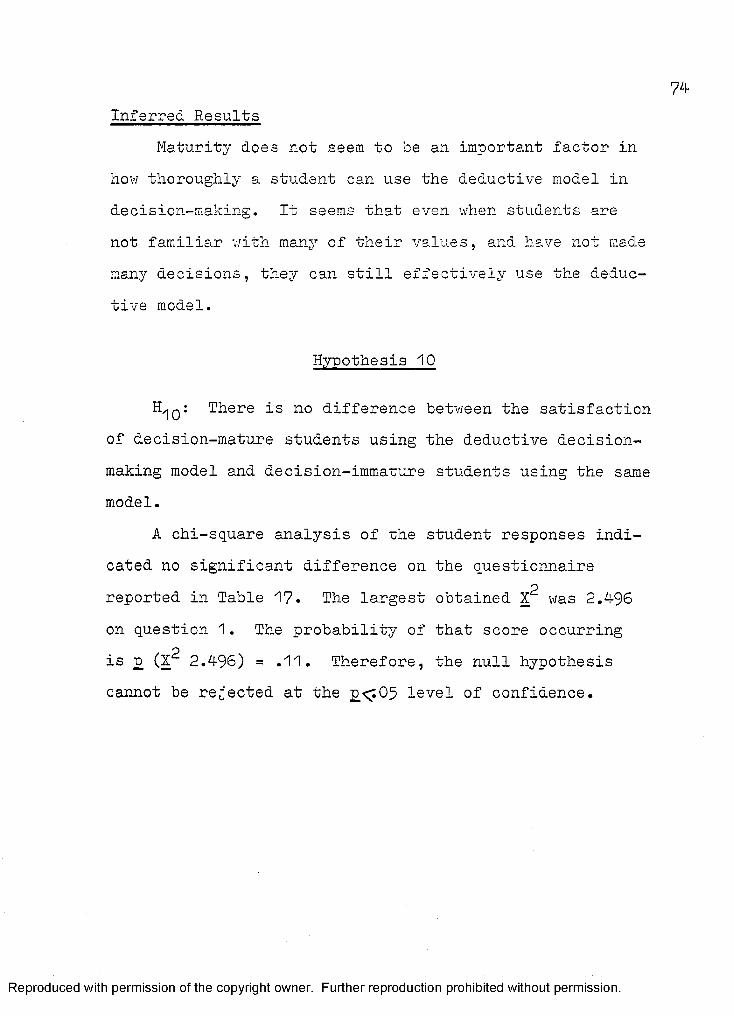
Inferred ResultsMaturity does not seem to be an important factor in
how t h o r o u g h l y a student can use the deductive model in decision-making. It seems that even when students are not familiar with many of their values, and have not made many decisions, they can still effectively use the deductive model.
Hypothesis 10
H^q : There is no difference between the satisfactionof decision-mature students using the deductive decisionmaking model and decision-immature students using the same model.
A chi-square analysis of the student responses indicated no significant difference on the questionnaire
preported in Table 17. The largest obtained X was 2.4-96 on question 1. The probability of that score occurring is £ (X2 2.4-96) = .11. Therefore, the null hypothesis cannot be rejected at the £<:05 level of confidence.
Reproduced with permission of the copyright owner. Further reproduction prohibited without permission.
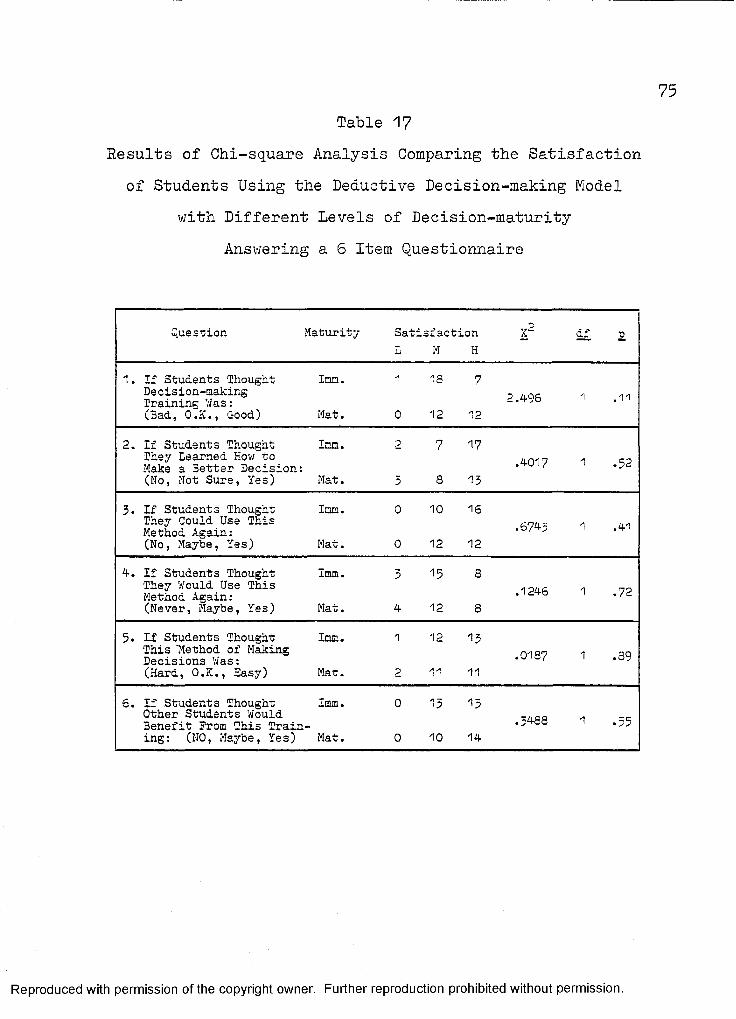
Table 17Results of Chi-square Analysis Comparing the Satisfaction of Students Using the Deductive Decision-making Model
with Different Levels of Decision-maturity Answering a 6 Item Questionnaire
Question Maturity Satisfaction dfL M H
If Students Thought Imm. 1Decision-making 5 ORTraininsr Was: ' '(Bad, O.K., Good) Mat. 0 12 12
2. If Students Thought Imm. 2 7 1?They Learned How to . __Make a Better Decision: " '(No, Not Sure, Yes) Mat. 5 8 13
3. If Students Thought Imm. 0 10 16They Could Use This Method Again:(No, Maybe, Yes) Mat. 0 12 12
4-. If Students Thought Imm. 3 15 3They Would Use This „ 0Method Again: * 1 */d(Never, Maybe, Yes) Mat. 4- 12
5. If Students Thought Imm. 1 12 15This "Method of Making . aQDecisions Was: 1 *ay(Hard, O.K., Sasy) Mat. 2 11 11
6. If Students Thought Imm. 0 13 15Other Students WouldBenefit Prom This Training: (NO, Maybe, Yes) Mat. 0 10 14-
.388 1 .55
Reproduced with permission of the copyright owner. Further reproduction prohibited without permission.
Inferred ResultsIt appears that there is no difference between the
satisfaction of students using the deductive model, regardless of whether or not they have had much experience with decision-making.
The findings would seem to defuse any fear about students not really in touch with their values being frustrated by a decision-making approach that begins with their values.
Hypothesis "11
Hxji : There is no difference between the decisionmaking skills of decision-mature students using the inductive decision-making model and decision-immature students using the same model.
An analysis of variance between the scores of the two groups yielded an 3? ratio of 7*34-9. The probability of that score occurring is 0.0089* Therefore, the null hypothesis can be rejected at the £< .01 level of confidence .
Reproduced with permission of the copyright owner. Further reproduction prohibited without permission.
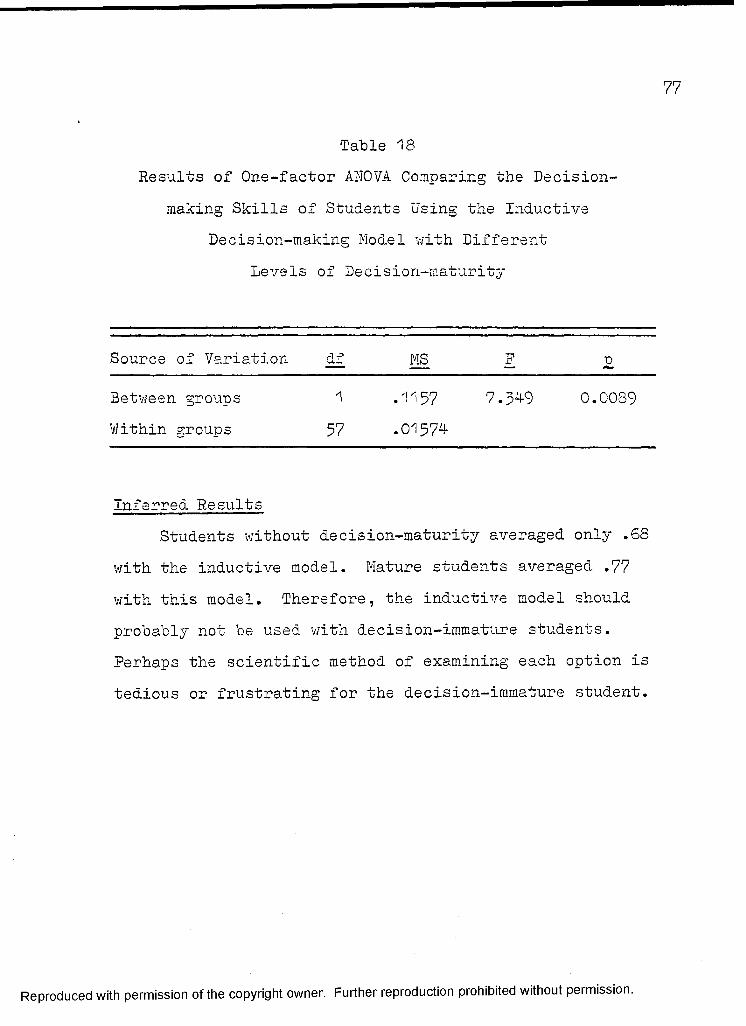
77
Table 18Results of One-factor AITOVA Comparing the Decision
making Skills of Students Using the Inductive Decision-making Model with Different
Levels of Decision-maturity
Source of Variation df MS F 0Between groups 1 .1157 7.549 0.0089Within groups 57 .01574
Inferred ResultsStudents without decision-maturity averaged only .68
with the inductive model. Mature students averaged .77 with this model. Therefore, the inductive model should probably not be used with decision-immature students. Perhaps the scientific method of examining each option is tedious or frustrating for the decision-immature student.
Reproduced with permission of the copyright owner. Further reproduction prohibited without permission.

Hypothesis 12
H^: There is no difference between the satisfactionof decision-mature students using the inductive model and decision-immature students using the same model.
A chi-square analysis of the student responses indicated no significant difference on the questionnaire reported in Table 19. The largest obtained X2 was 1.313 on question 2. The probability of that score occurring is p (X 1.318) = .38. Therefore, the null hypothesis cannot be rejected at the £.<.05 level of confidence.
Reproduced with permission of the copyright owner. Further reproduction prohibited without permission.
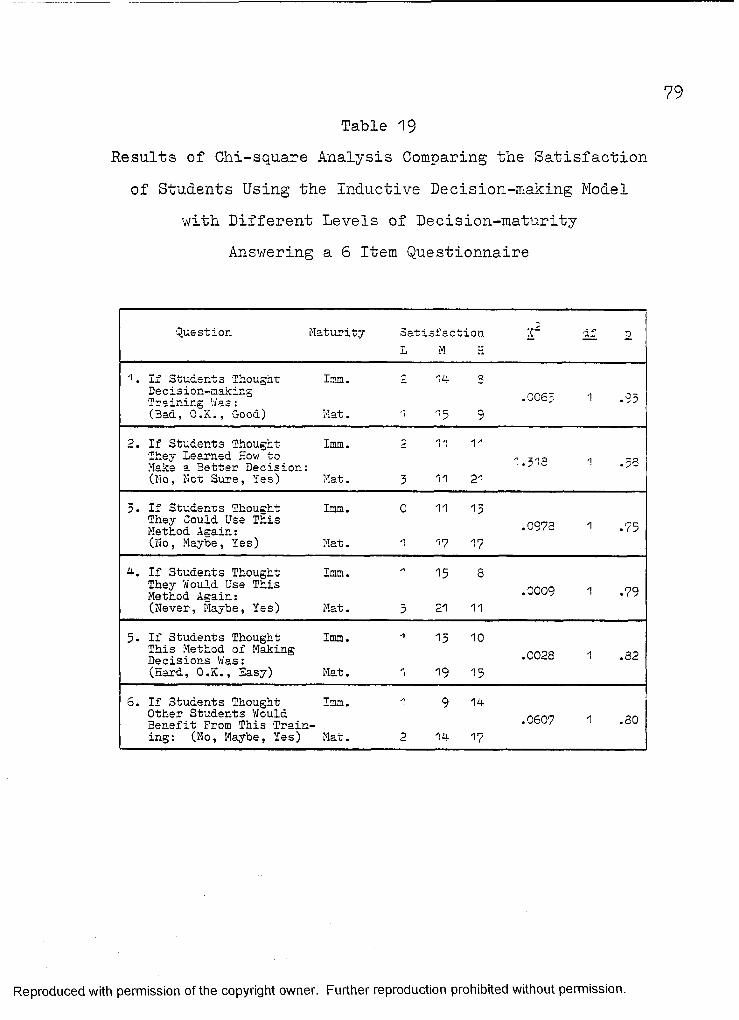
79
Table 19Results of Chi-square Analysis Comparing the Satisfaction of Students Using the Inductive Decision-making Model
with Different Levels of Decision-maturity Answering a 6 Item Questionnaire
Question Maturity SatisfactionL M H
1. If Students Thought Imm. £ 'Id 3Decision-making ~Training .vas: ^(Baa, O.K., Good) Mat. 1 15 9
2. If Students Thought Imm. 2 11 1"1They Learned How to „ „„a .Make a Better Decision: '(No, Not Sure, Yes) Mat. 3 21
3. If Student;s Thought Imm. 0 11 13They Could Use This nQr7_ . n^Method Again: ./5(No, Maybe, Yes) Mat. 1 1? 17
d. If Students Thought Imm. 1 15 8They Would Use This QQ qMethod Again: -JUUV n n(Never, Maybe, Yes) Mat. 3 21 11
5- If Students Thought Imm. 1 13 10This Method of Making rn0„ .Decisions Was: .0023 i .32(Hard, O.K., Sasy) Mat. 1 19 15
S. If Students Thought Imm. 1 9 Id-Other Students Would Benefit From This Training: (No, Maybe, Yes) Mat. 2 1d 1?
.0607 1 .80
Reproduced with permission of the copyright owner. Further reproduction prohibited without permission.
30
Inferred ResultsThere does not seem to be a difference in satisfac
tion based on maturity for students using the deductive model of decision-making.
Hypothesis 13
H.^: There is no difference between the decisionmaking skills of decision-mature students using the deductive decision-making model and decision-mature students using the inductive decision-making model.
An analysis of variar.ce between the two groups yielded an F ratio of 4.020. The probability of obtaining that score is 0.0493. Therefore, the null hypothesis can be rejected at the £<.05 level of confidence.
Reproduced with permission of the copyright owner. Further reproduction prohibited without permission.
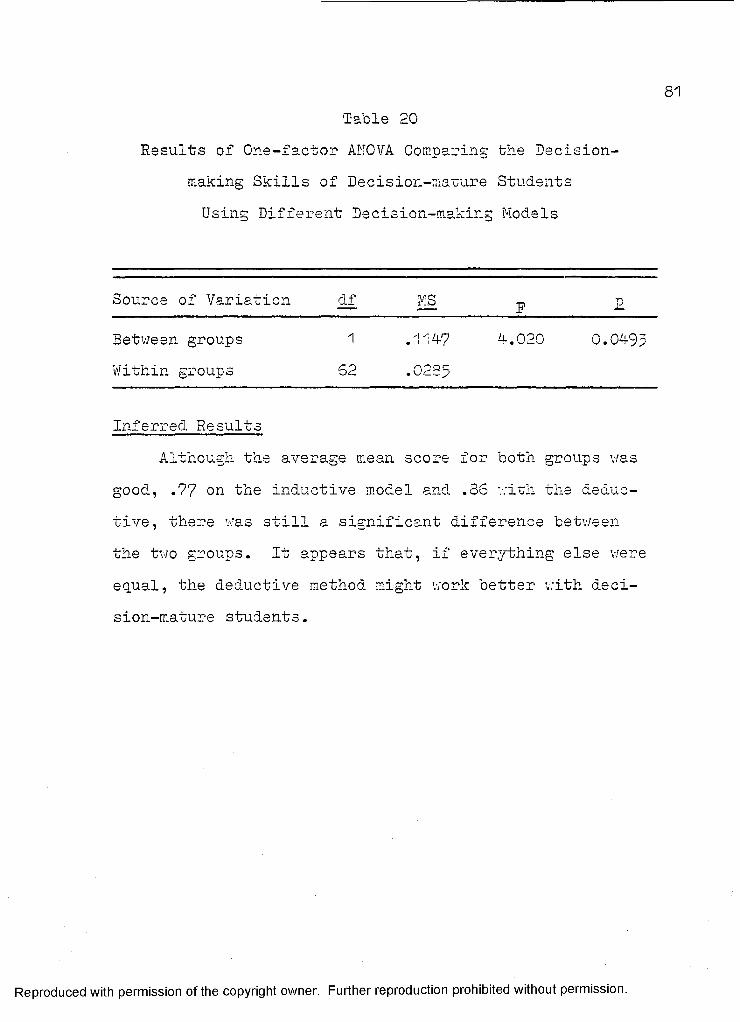
Table 20Results of One-factor ANOVA Comparing the Decision
making Skills of Decision-mature Students Using Different Decision-making Models
Source of Variation df MS F 2Between groups Within groups
162
.1147
.0235^.020 0.0493
Inferred ResultsAlthough the average mean score for both groups was
good, .77 on the inductive model and .36 v:ith the deductive, there was still a significant difference between the two groups. It appears that, if everything else were equal, the deductive method might work better with decision-mature students.
Reproduced with permission of the copyright owner. Further reproduction prohibited without permission.

Hypothesis 14-
There is no difference between the satisfaction of decision-mature students using the deductive decision-making model and decision-mature students using the inductive decision-making model.
A chi-square analysis of the student responses indicated no significant difference on the questionnaire
2reported in Table 21. The largest obtained X was .1956 on question 1. The probability of that score occurring is p (X2 .1956) = .65. Therefore, the null hypothesis cannot be rejected at the p <.05 level of confidence.
Reproduced with permission of the copyright owner. Further reproduction prohibited without permission.
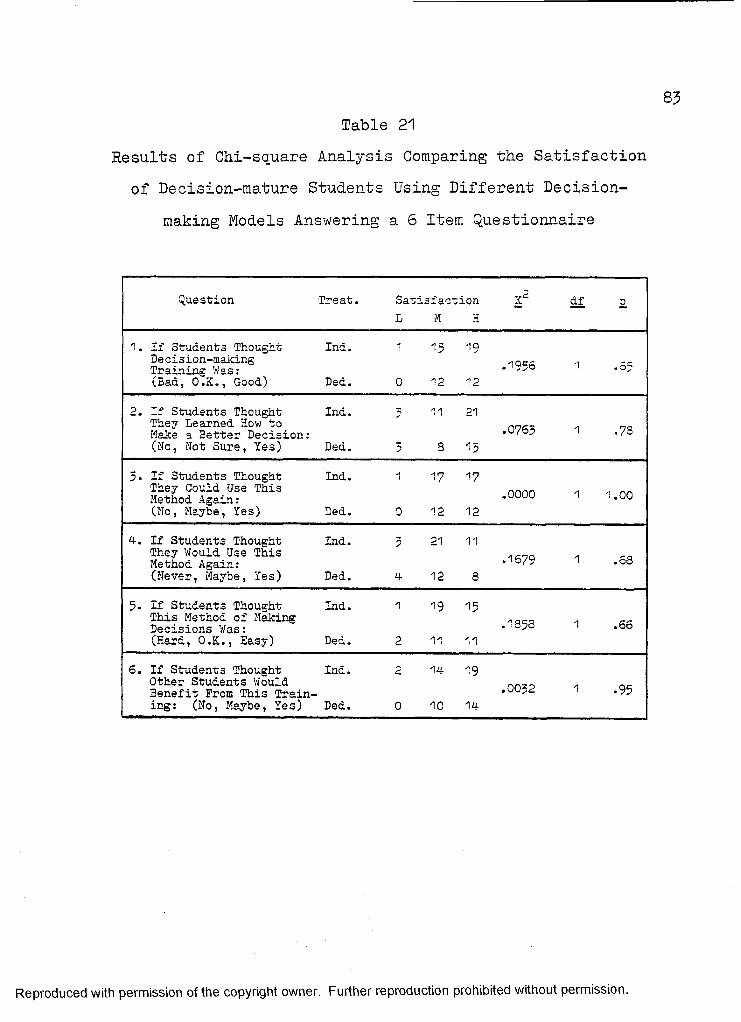
Table 21 Results of Chi-square Analysis Comparing the Satisfaction of Decision-mature Students Using Different Decision
making Models Answering a 6 Item Questionnaire
Question Treat. Satisfaction X2 dfL M H
1. If Students Thought Ind. 1 15 *9Decision-making «ac- -1Training Was: ■(Bad, O.K., Good) Ded. 0 'IB 12
2. If Students Thought Ind. 5 H 21They Learned How toMake a Better Decision:(No, Not Sure, Yes) Ded. 5 3 1$
3. If Students Thought Ind. 1 17 17They Could Use ThisMethod Again:(No, Maybe, Yes) Ded. 0 12 12
4-. If Students Thought Ind. 3 21 11They Would Use This Method Again:(Never, Maybe, Yes) Ded. 4- 12 8
.0763 1 .78
.0000 1 1.00
.1679 1 .68
.183S 1 .665. If Students Thought Ind. 1 19 15
This Method of Making Decisions Was:(Hard, O.K., Easy) Ded. 2 11 11
6. If Students Thought Ind. 2 14 19Other Students Would n_,0Benefit Prom This Train- i .93ing: (No, Maybe, Yes) Ded. 0 10 14
Reproduced with permission of the copyright owner. Further reproduction prohibited without permission.
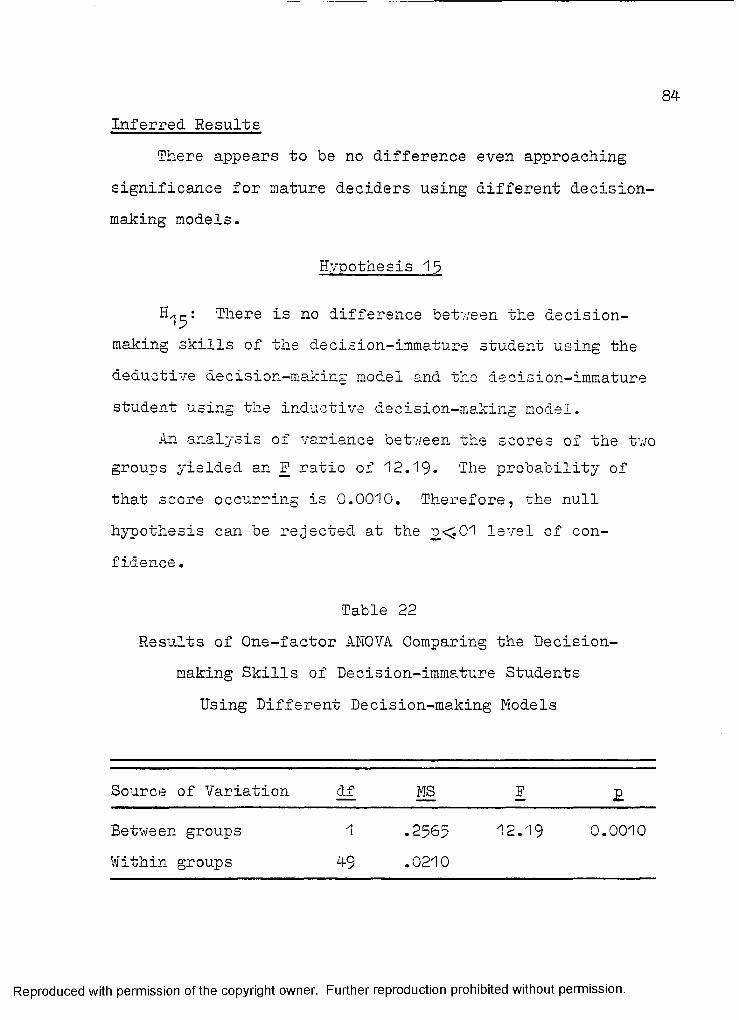
84Inferred Results
There appears to be no difference even approaching significance for mature deciders using different decisionmaking models.
Hypothesis 18
There is no difference between the decisionmaking skills of the decision-immature student using the deductive decision-making model and the decision-immature student using the inductive decision-making model.
An analysis of variance between the scores of the two groups yielded an F ratio of 12.19. The probability of that score occurring is 0.0010. Therefore, the null hypothesis can be rejected at the £<^01 level of confidence.
Table 22Results of One-factor AMOVA Comparing the Decision
making Skills of Decision-immature Students Using Different Decision-making Models
Source of Variation df MS I £Between groups Within groups
149
.2565
.021012.19 0.0010
Reproduced with permission of the copyright owner. Further reproduction prohibited without permission.
Inferred ResultsThere seems to he a very significant difference
between the scores the students received with the two models. On the deductive model, the average was .82, on the inductive .68. It appears that when working with decision-immature students, that the deductive model would be the best to use.
Hypothesis 16
H^g: There is no difference between the satisfactionof the decision-immature student using the deductive decision-making model and the decision-immature student using the inductive decision-making model.
A chi-square analysis of the student responses indicated no significant difference on the questionnaire
preported in Table 23- The largest obtained X was 2.091 on question 2. The probability of that score occurring is £ (X2 2.091) = .15* Therefore, the null hypothesis cannot be rejected at the £<05 level of confidence.
Reproduced with permission of the copyright owner. Further reproduction prohibited without permission.
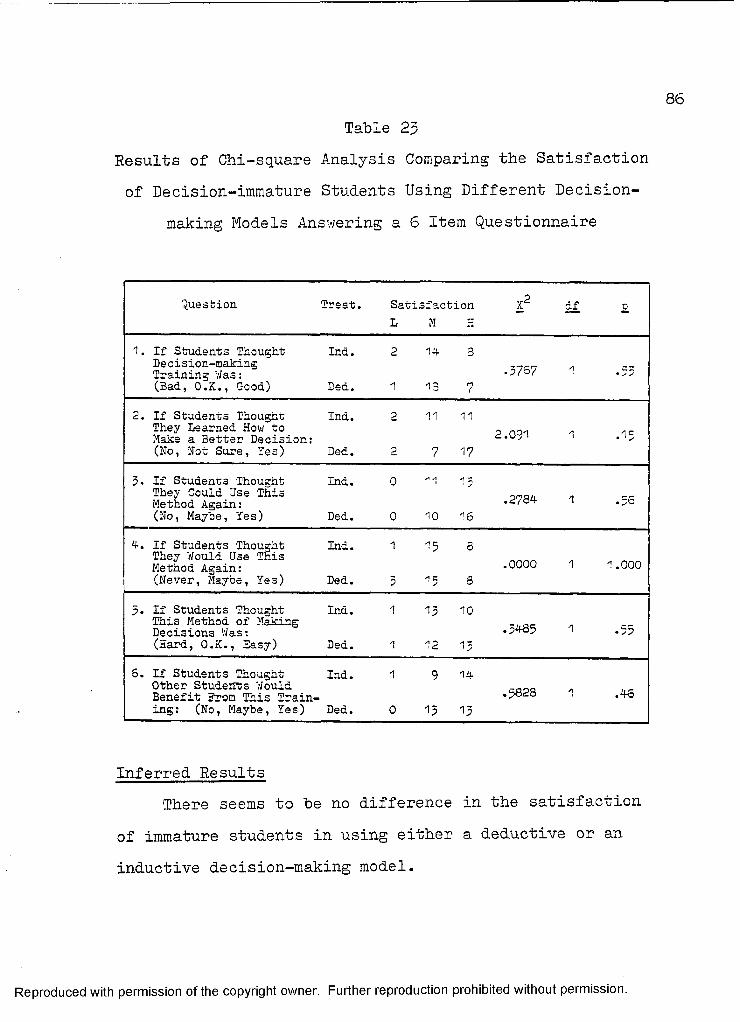
Table 23 Results of Chi-square Analysis Comparing the Satisfaction of Decision-immature Students Using Different Decision
making Models Answering a 6 Item Questionnaire
pQuestion Treat. Satisfaction X dfL M H
1. If Students Thought Ind. 2 14- 3Decision-making ,r7cr.Training Was: 0 /°/(Bad, O.K., C-ood) Ded. 1 13 7
2. If Students Thought Ind. 2 11 11They Learned How to Make a 3etter Decision:(No, Not Sure, Yes) Ded. 2 7 17
2.091 1 .15
3. If Students Thought Ind. 0 11 15They Could Use ThisMethod Again: .2/«4(No, Maybe, Yes) Ded. 0 10 16
4. If Students Thought Ind. 1 15They Would Use This Method Again:(Never, Maybe, Yes) Ded. 5 15
.0000 1 1.000
5. If Students Thought Ind. 1 13 10This Method of MakingDecisions Was: 0405 1 ,x5(Hard, O.K., Sasy) Ded. 1 12 15
6. If Students Thought Ind. 1 9 14Other Students Would no_Benefit From This Train- o o «;b i .46ing: (No, Maybe, Yes) Ded. 0 15 13
Inferred Results There seems to be no difference in the satisfaction
of immature students in using either a deductive or an inductive decision-making model.
Reproduced with permission of the copyright owner. Further reproduction prohibited without permission.
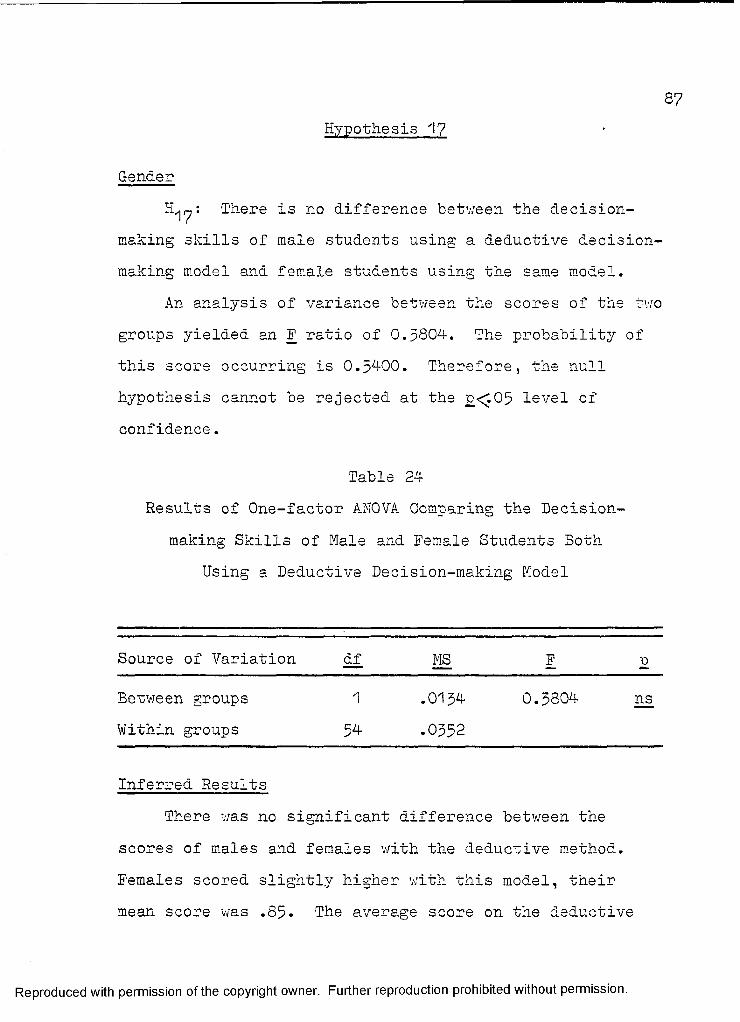
87Hypothesis 17
Gender'There is no difference between the decision
making skills of male students using a deductive decisionmaking model and female students using the same model.
An analysis of variance between the scores of the two groups yielded an F ratio of 0.3804. The probability of this score occurring is 0.54-00. Therefore, the null hypothesis cannot be rejected at the £< .05 level of confidence.
Table 24Results of One-factor ANOVA Comparing the Decision-
making Skills of Male Using a Deductive
and Female Students Both Decision-making Model
Source of Variation df MS F p
Between groups 1 .0134- 0.3804 nsWithin groups 54- .0352
Inferred ResultsThere was no significant difference between the
scores of males and females with the deductive method. Females scored slightly higher with this model, their mean score was .85- The average score on the deductive
Reproduced with permission of the copyright owner. Further reproduction prohibited without permission.
model for males was .32. It seems that an instructor could use the deductive model with both males and females without any hesitation.
Hypothesis 18
H g: There is no difference in the satisfaction ofmale students using the deductive decision-making model and female students using the same model.
A chi-square analysis of the student responses indicated no significant difference on the questionnaire
preported in Table 25. The largest obtained X was 4.777 on question 5 and 4.043 on question 4. The probability
pof those scores occurring is p (X 4.777) = *02 and (X 4.043) = .04. Therefore, the null hypothesis can berejected for items 4 and 5*
Reproduced with permission of the copyright owner. Further reproduction prohibited without permission.
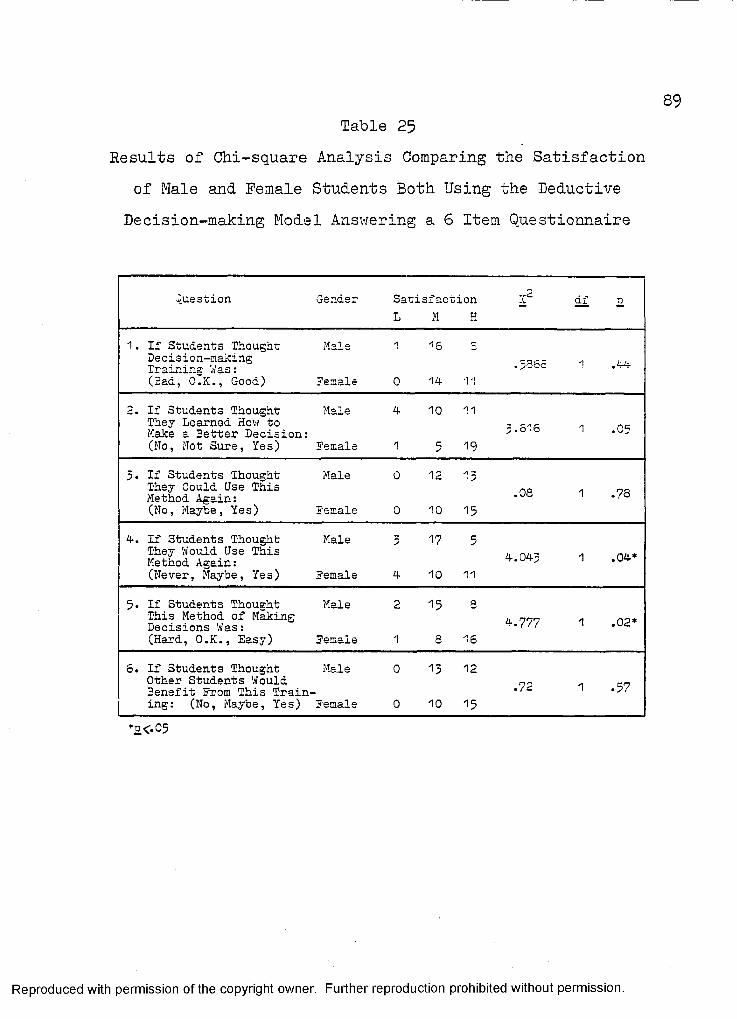
Table 25 Results of Chi-square Analysis Comparing the Satisfaction
of Male and Female Students Both Using the Deductive Decision-making Model Answering a 6 Item Questionnaire
vuesuion Genaer Satisfaction L M E
:c2 ai
1. If Students Thought Decision-making Training 7/as:(3ad, O.K., Good)
Mai i
?emals id. 536c
If Students Thought Male d 10 11They Learned How to Make a Better Decision:(No, Not Sure, Yes) Female 1 5 19
5.516 .05
5- If Students Thought Male 0They Gould Use This Method Again:(No, Maybe, Yes) Female 0
12 15
10 15.08 • 78
d. If Students Thought Male 5 17 5They Would Use This Method Again:(Never, Maybe, Yes) Female d 10 11
d.0d5 .Od*
5« If Students Thought This Method of Making Decisions Was:(Hard, O.K., Easy)
Male
Femaxe
2
1
15 8
8 16d.777 .02*
6. If Students Thought Male 0 13 12Other Students Would 3enefit From This Training: (No, Maybe, Yes) Female 0 10 15
.72 .57
*o<.05
Reproduced with permission of the copyright owner. Further reproduction prohibited without permission.
90
Inferred ResultsThere was significant difference between the satisfac
tion of males and females using the deductive decisionmaking model; significance was attained on two of the questions.
Question 5 concerned how difficult students thought the deductive model was: 64# of the female studentsthought it was easy, 32# of the males thought it was easy.The probability on question 5 was £ = .02.
On question 4, twice as many females indicated they would use the deductive decision-making model again. The probability on question 4 was £ = .04.
Question 2 approached significance, it was whether students thought they learned a better way to make decisions: 76# of the female students thought they had, 44#of the males thought they had. The probability on question 2 was £ = .03.
The results were significant, it appears that females were more satisfied with the deductive model.
Reproduced with permission of the copyright owner. Further reproduction prohibited without permission.
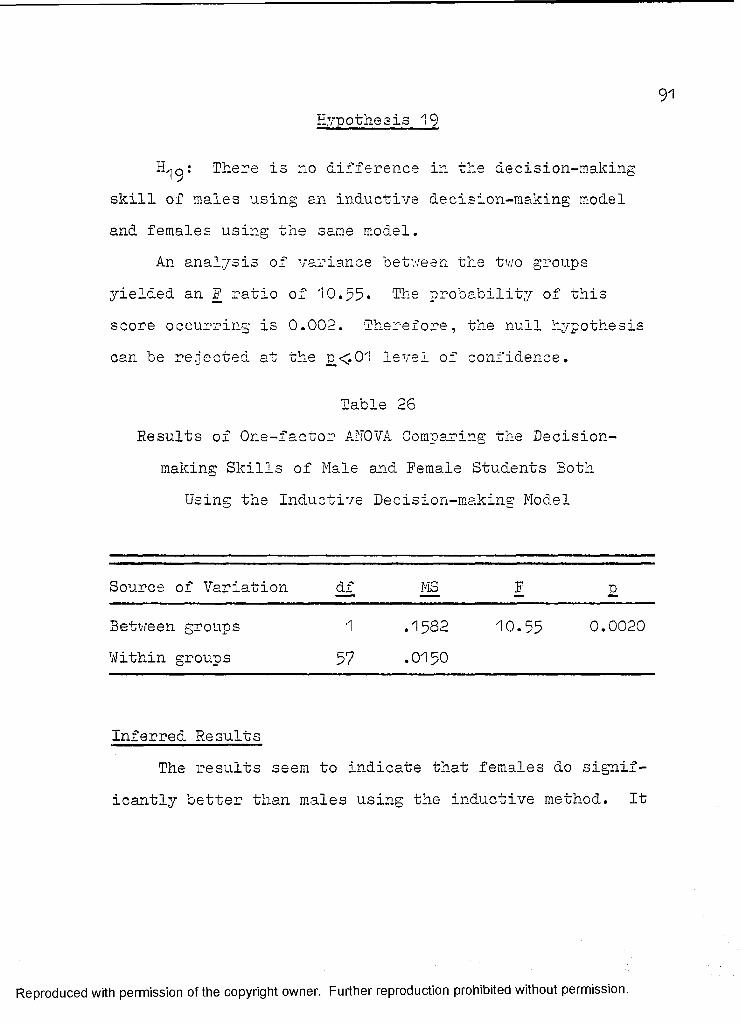
91Pjypothesis 19
There is no difference in the decision-making skill of males using an inductive decision-making model and females using the same model.
An analysis of variance between the two groups yielded an F ratio of 10.55* The probability of this score occurring is 0.002. Therefore, the null hypothesis can be rejected at the £<.01 level of confidence.
Table 26Results of One-factor ANOVA Comparing the Decision-
making Skills of Male Using the Inductive
and Female Students Both Decision-making Model
Source of Variation df MS F n
Between groups 1 .1582 10.55 0.0020Within groups 57 .0150
Inferred ResultsThe results seem to indicate that females do signif
icantly better than males using the inductive method. It
Reproduced with permission of the copyright owner. Further reproduction prohibited without permission.
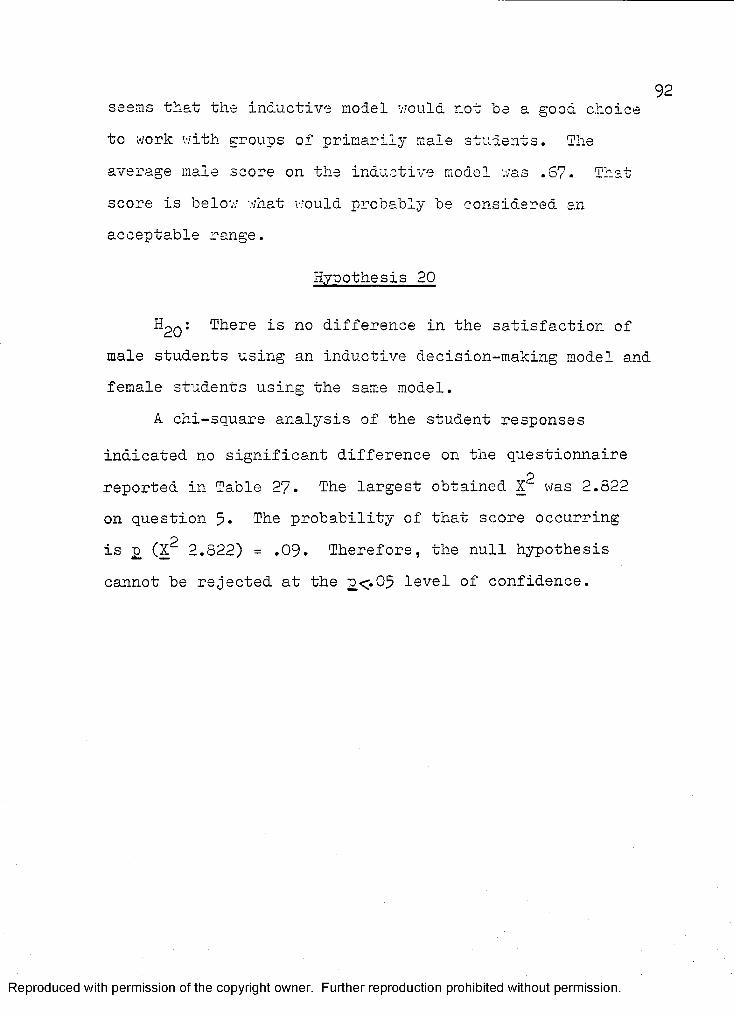
92seems that the inductive model v;ould not he a good choice to work with groups of primarily male students. The average male score on the inductive model was .67. That score is below what v;ould probably be considered an acceptable range.
Hypothesis 20
H£q : There is no difference in the satisfaction ofmale students using an inductive decision-making model and female students using the same model.
A chi-square analysis of the student responsesindicated no significant difference on the questionnaire
preported in Table 27- The largest obtained X was 2.822 on question 5. The probability of that score occurring is £ (X2 2.822) = .09. Therefore, the null hypothesis cannot be rejected at the £,<.05 level of confidence.
Reproduced with permission of the copyright owner. Further reproduction prohibited without permission.
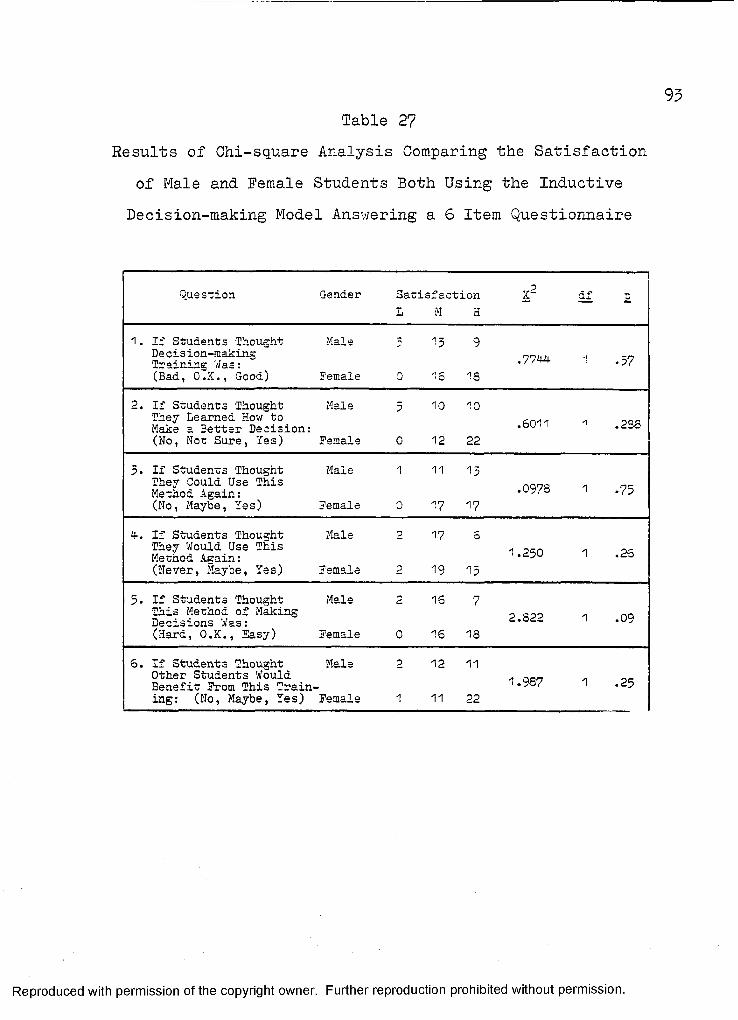
Table 27Results of Chi-square Analysis Comparing the Satisfaction
of Male and female Students Both Using the Inductive Decision-making Model Answering a 6 Item Questionnaire
Question Gender Satisfaction !CdL M a
1. If Students Thought MaleDecision-making Training Was:(Bad, O.K., Good) Female
.77 4 ■' .57
2. If Students Thought Male 5 10 10They Learned How toMake a Better Decision: .-do(No, Not Sure, Yes) Female 0 12 22
5. If Students Thought Male 1 11 15They Could Use This Q7Method Again: •O7 / 0 1 .7?(No, Maybe, Yes) Female 0 17 17
4-. If Students Thought Male 2 17 6They Would Use This . __n . „Method Again: ’ ^(Never, Maybe, Yes) Female 2 19 15
5. If Students Thought Male 2 16This Method of Making n qoo noDecisions Was: 1 'oy(Hard, O.K., Easy) Female 0 16 18
6. If Students Thought Male 2 12 11Other Students Would Benefit From This Training: (No, Maybe, Yes) Female 1 11 22
1.987 1 .25
Reproduced with permission of the copyright owner. Further reproduction prohibited without permission.
94Inferred Results
No significant difference between the satisfaction of males and females using the inductive method was found at the £ .05 level.
However, 65^ of the female students felt they learned a better way to make decisions using the inductive method. Only 40% of the male students felt they had learned a better way. Furthermore, 20% of the male students said they had definitely not learned a better way. There were not any negative responses from female students.
One other area that approached significance was question 5 concerning the difficulty of using the inductive model. Females thought it was easy.
There were a large number of negative male responses on item 2. If the low response category had not been collapsed, there would have been significance at the £ .01 level of confidence on item 2.
Hypothesis 21
Hp^: There is no difference between the decisionmaking skills of male students using a deductive decisionmaking model and male students using the inductive decision-making model.
Reproduced with permission of the copyright owner. Further reproduction prohibited without permission.
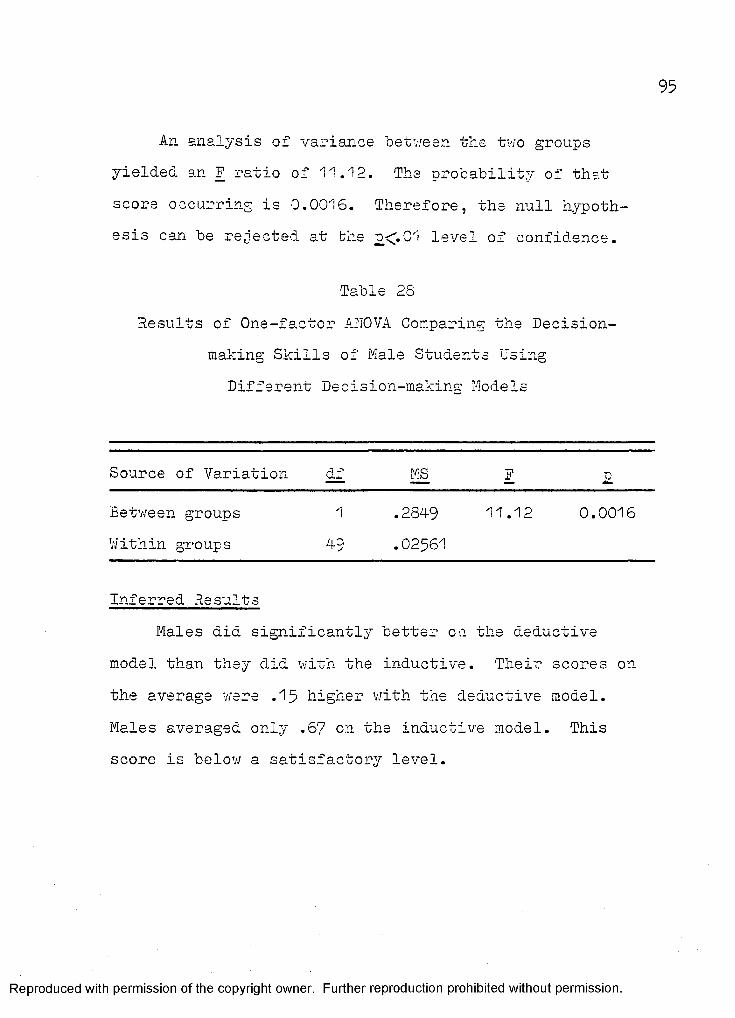
95
An analysis of variance between the tv/o groups yielded an F ratio of 11.12. The probability of that score occurring is 0.0016. Therefore, the null hypothesis can be rejected at bhe £<.01 level of confidence.
Table 28Results of One-factor ANOVA Comparing the Decision
making Skills of Male Students Using Different Decision-making Models
Source of Variation df MS F £
Between groups 1 Within groups 4-9
.284-9
.0256111.12 0.0016
Inferred ResultsMales did significantly better on the deductive
model than they did with the inductive. Their scores on the average were .15 higher with the deductive model. Males averaged only .67 on the inductive model. This score is below a satisfactory level.
Reproduced with permission of the copyright owner. Further reproduction prohibited without permission.
Hypothesis 22
H-22: There is no difference between the satisfaction of male students using a deductive decision-making model and male students using an inductive decisionmaking model.
A chi-square analysis of the student responses indicated no significant difference on the questionnaire reported in Table 29. The largest obtained X2 was .2827 on question 1. The probability of that score occurring is p (X2 .2827) = .59* Therefore, the null hypothesis cannot be rejected at the £<.05 level of confidence.
Reproduced with permission of the copyright owner. Further reproduction prohibited without permission.
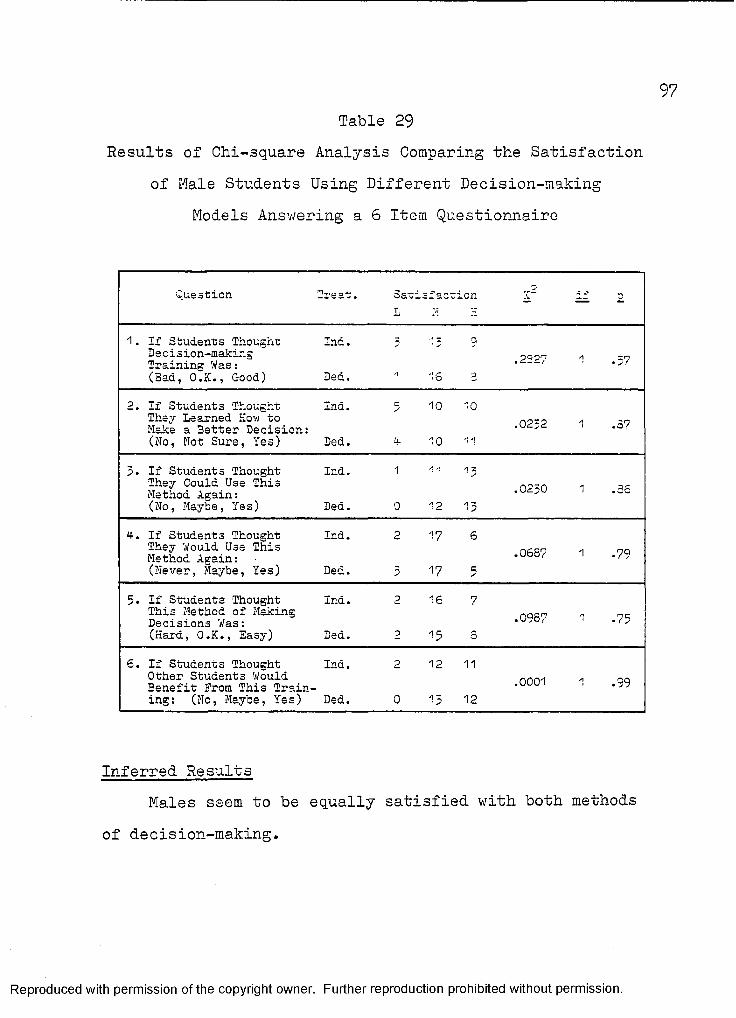
97
Table 29Results of Chi-square Analysis Comparing the Satisfaction
of Male Students Using Different Decision-making Models Answering a 6 Item Questionnaire
Question Treat. satisfaction L M H
If Students Thought Decision-making Training Was:(3ad, O.K., Good)
Inc.
Ded.
2. If Students Thought Ind.They Learned How to Make a Better Decision:(No, Not Sure, Yes) Ded.
10 10
10 11.02=2 .3?
5. If Students Thought Ind.They Could Use This Method Again:(No, Maybe, Yes) Ded.
.0230 .36
d. If Students Thought Ind.They Would Use This Method Again:(Never, Maybe, Yes) Ded.
17 617 5
.0687 • 79
5. If Students Thought This Method of Making Decisions Was:(Hard, O.K., Easy)
±na.
Ded.
16 7 15 3
.0967 • 75
6. If Students Thought Ind. 2Other Students Would Benefit From This Training: (No, Maybe, Yes) Ded. 0
12 11
13 12.0001 .99
Inferred. ResultsMales seem to be equally satisfied with both methods
of decision-making.
Reproduced with permission of the copyright owner. Further reproduction prohibited without permission.
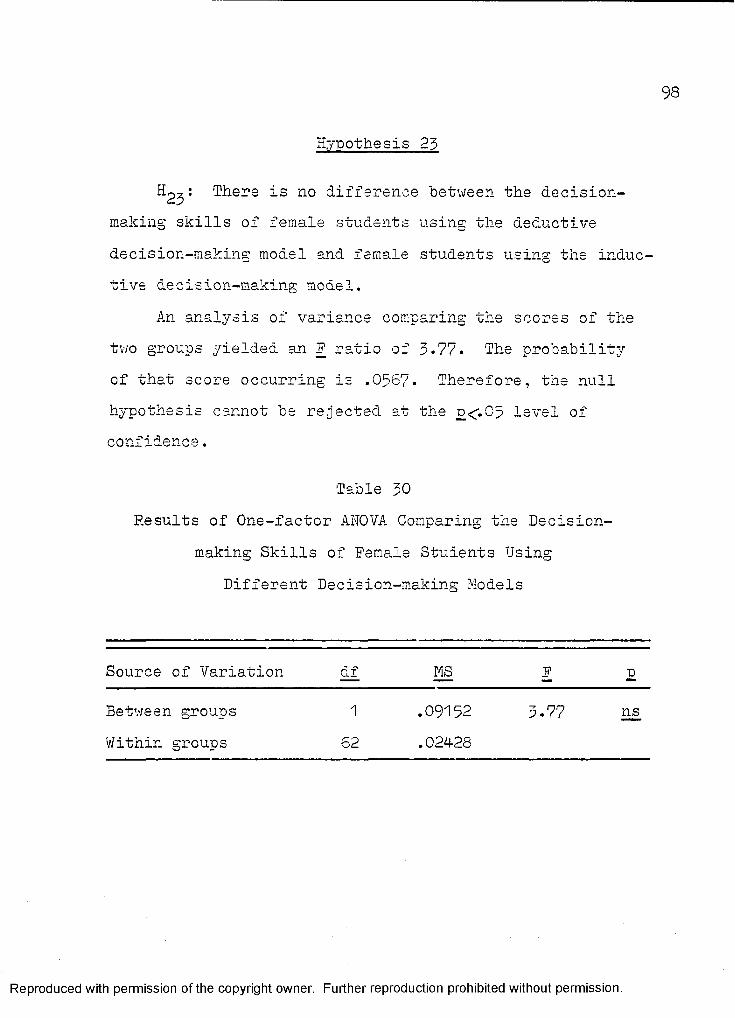
98
Hypothesis 23
^23 ’" There is no difference between the decisionmaking skills of female students using the deductive decision-making model and female students using the inductive decision-making model.
An analysis of variance comparing the scores of the two groups yielded an F ratio of 3-77* The probability of that score occurring is .0567. Therefore, the null hypothesis cannot be rejected at the n<.C5 level of confidence.
Table 30Results of One-factor ANOVA Comparing the Decision
making Skills of Female Students Using Different Decision-making Models
Source of Variation df MS F to
Between groups 1 .09152 3*77 nsWithin groups 62 .024-28
Reproduced with permission of the copyright owner. Further reproduction prohibited without permission.
99
Inferred ResultsFemale students seem to have done equally well with
both models. Female scores on the inductive model averaged .73. Female scores on the deductive model averaged .85.The significance of this result is that the instructor could probably use either model with female students without any apprehension.
Hypothesis 24
H2 There is no difference in the satisfaction of female students using the deductive decision-making model and female students using the inductive decision-making model.
A chi-square analysis of the student responses indicated no significant difference on the questionnaire
preported in Table • The largest obtained X was 1.092 on question 5* The probability of that score occurring is £ 1.092) = .29. Therefore, the null hypothesiscannot be rejected at the £<.05 level of confidence.
Reproduced with permission of the copyright owner. Further reproduction prohibited without permission.

1 0 0
Table 31 Results of Chi-square Analysis Comparing the Satisfaction
of Female Students Using Different Decision-making Models Answering a 6 Item Questionnaire
Question Treat. Satisfaction X^ dfL M H
"'.If Students Thought Ind. 0 "16 "'8Decision-making acne -iTraining Was:(Sad, O.X., Good) Ded. 0 '!4 11
2. If Students Thought Ind. 0 12 25They Learned How to Make a Better Decision:(No, Not Sure, Yes) Ded. 1 5 19
5. If Students Thought Ind. 0 17They Could Use ThisMethod Again: 1 -bcl(No, Maybe, Yes) Ded. 0 10
.97^2 1 .52
4. If Students Thought Ind. 2 19 15They Would Use ThisMethod Again: 1 *^°(Never, Maybe, Yes) Ded. 4 10 11
5. If Students Thought Ind. 0 16 18This Method of Making ,, nQ5 „ „Decisions Was: * y(Hard, O.K., Easy) Ded. 1 3 16
6. If Students Thought Ind. 1 11 22Other Students WouldBenefit Erom This Training: (No, Maybe, Yes) Ded. 0 10 15
.2757 1 .60
Inferred Results There seems to be no difference between the degree
of satisfaction female students derive from the two decision-making models.
Reproduced with permission of the copyright owner. Further reproduction prohibited without permission.
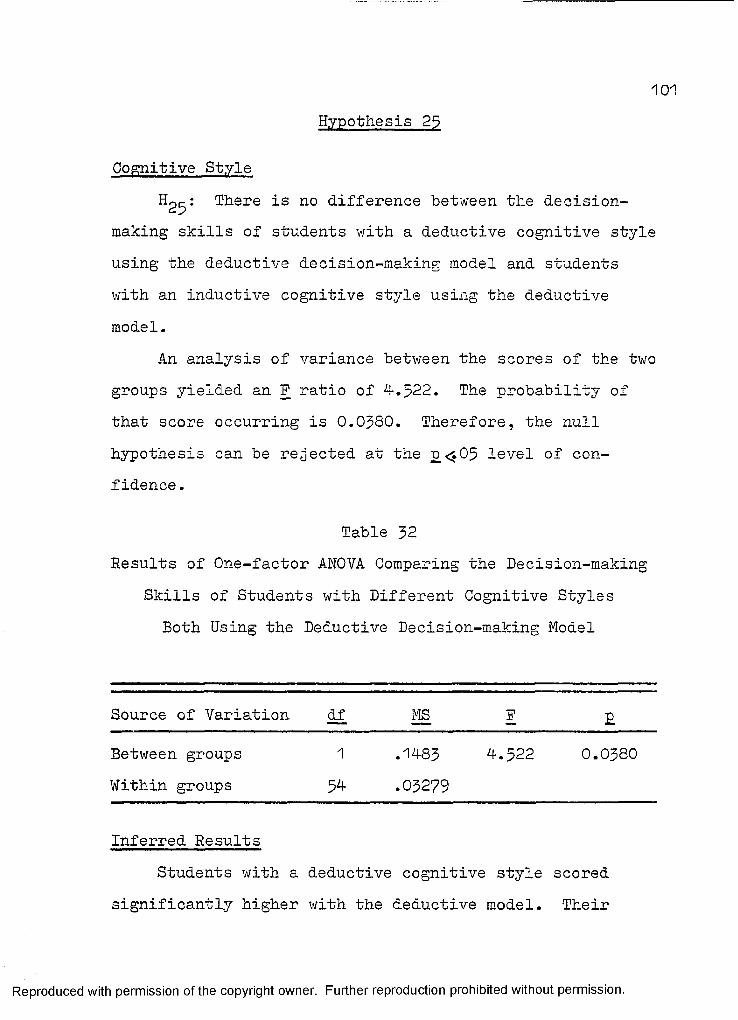
101
Hypothesis 25
Cognitive StyleH2E-: There is no difference between the decision
making skills of students with a deductive cognitive style using the deductive decision-making model and students with an inductive cognitive style using the deductive model.
An analysis of variance between the scores of the two groups yielded an P ratio of 4.522. The probability of that score occurring is 0.0380. Therefore, the null hypothesis can be rejected at the p <?05 level of confidence .
Table 32Results of One-factor ANOVA Comparing the Decision-making
Skills of Students with Different Cognitive Styles Both Using the Deductive Decision-making Model
Source of Variation df MS P £Between groups Within groups
154
.1483
.032794.522 0.0380
Inferred ResultsStudents with a deductive cognitive style scored
significantly higher with the deductive model. Their
Reproduced with permission of the copyright owner. Further reproduction prohibited without permission.
1 0 k
scores using the deductive model averaged .87. The average score with the inductive model was .73. Therefore, it seems, students that are deductive in cognitive style do 14$ better using a congruent decision-making model.
Hypothesis 26
There is no difference in the satisfaction of students with a deductive cognitive decision-making style using a deductive model and students with an inductive cognitive style using the deductive decision-making model.
A chi-square analysis of the student responses indicated no significant difference on the questionnaire
2reported in Table 33. The largest obtained X was 1.639 on question 4-. The probability of that score occurring is o (X2 1.639) = .20. Therefore, the null hypothesis cannot be rejected at the £<i05 level of confidence.
Reproduced with permission of the copyright owner. Further reproduction prohibited without permission.
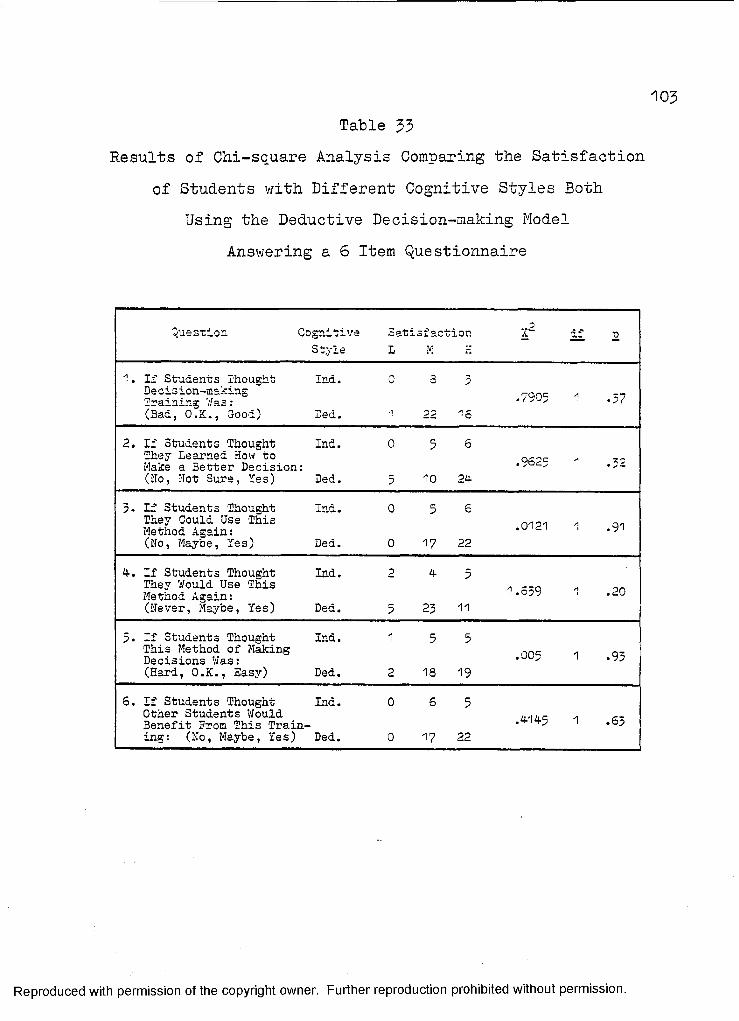
Table 33Results of Chi-square Analysis Comparing the Satisfaction
of Students with Different Cognitive Styles Both Using the Deductive Decision-making Model
Answering a 6 Item Questionnaire
question. Cognitive Style
SatiL
sf acM
tionn
X2 2.1 £
1. Ii Students Thought Decision-making Training V.'as:(Bad, O.K., Good)
Ind.
Ded.
0
A
3
22
3
i o.7905 A • 37
2. If Students Thought Ind. 0 5 6They learned How toMake a Better Decision: •(Ho, Hot Sure, Yes) Ded. 5 10 2d
3- If Students Thought Ind. 0 5 6They Could Use ThisMethod Again: • U * c I • 91(No, Maybe, Yes) Ded. 0 17 22
4. If Students Thought Ind. 0 4 5They Would Use This Method Again: 1.S59 .20(Never, Maybe, Yes) Ded. 5 23 11
5. If Students Thought Ind. 1 3 5This Method of Making • 93Decisions Was:(Hard, O.K., Easy) Ded. 2 18 19
6. If Students Thought Ind. 0 6 5Other Students Would .414-5Benefit Prom This Train 1 .63ing: (No, Maybe, Yes) Ded. 0 17 22
Reproduced with permission of the copyright owner. Further reproduction prohibited without permission.
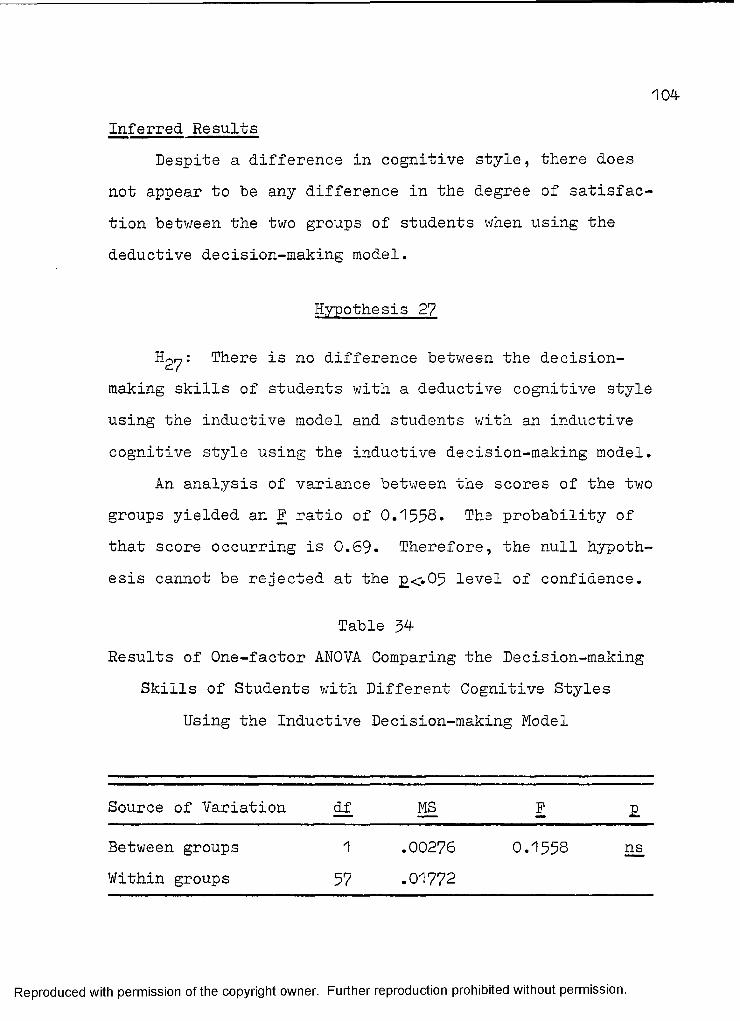
104Inferred Results
Despite a difference in cognitive style, there does not appear to be any difference in the degree of satisfaction between the two groups of students when using the deductive decision-making model.
Hypothesis 27
Hgy: There is no difference between the decisionmaking skills of students with a deductive cognitive style using the inductive model and students with an inductive cognitive style using the inductive decision-making model.
An analysis of variance between the scores of the two groups yielded an P ratio of 0.1558. The probability of that score occurring is 0.69. Therefore, the null hypothesis cannot be rejected at the £<.05 level of confidence.
Table 34Results of One-factor ANOVA Comparing the Decision-making
Skills of Students with Different Cognitive Styles Using the Inductive Decision-making Model
Source of Variation df MS P £Between groups Within groups
157
.00276
.017720.1558 ns
Reproduced with permission of the copyright owner. Further reproduction prohibited without permission.
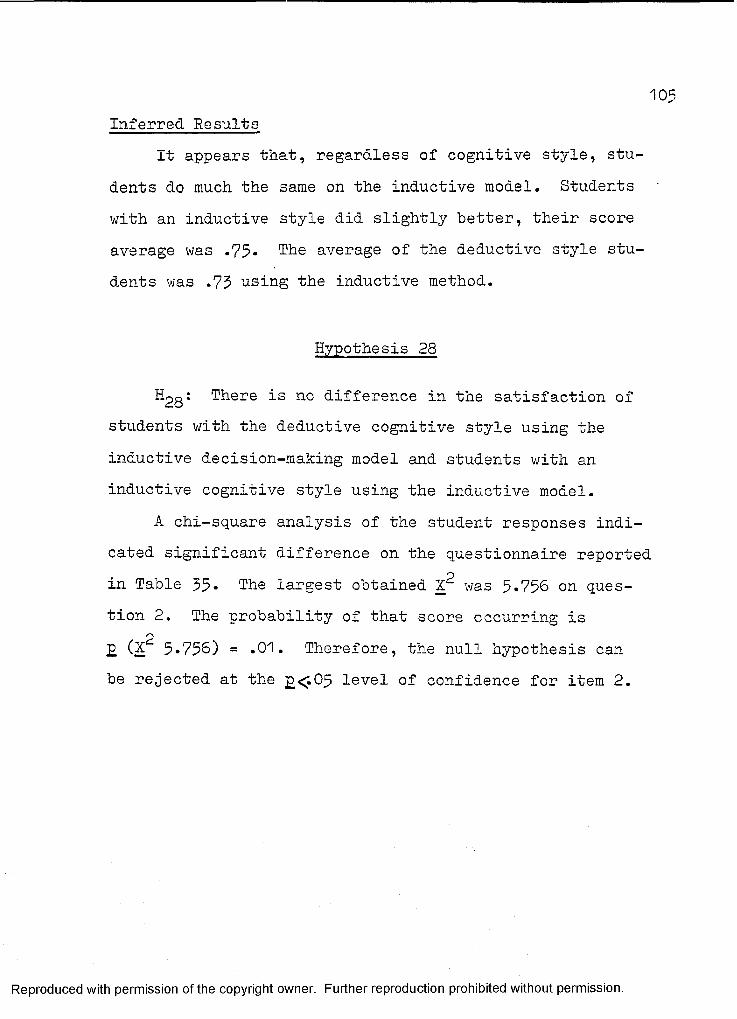
1 0 ?
Inferred ResultsIt appears that, regardless of cognitive style, stu
dents do much the same on the inductive model. Students with an inductive style did slightly better, their score average was .75. The average of the deductive style students was .73 using the inductive method.
Hypothesis 28
H-2Q: There is no difference in the satisfaction ofstudents with the deductive cognitive style using the inductive decision-making model and students with an inductive cognitive style using the inductive model.
A chi-square analysis of the student responses indicated significant difference on the questionnaire reported in Table 55* The largest obtained was 5.756 on question 2. The probability of that score occurring is E (X2 5*756) = .01. Therefore, the null hypothesis can be rejected at the £<.05 level of confidence for item 2.
Reproduced with permission of the copyright owner. Further reproduction prohibited without permission.
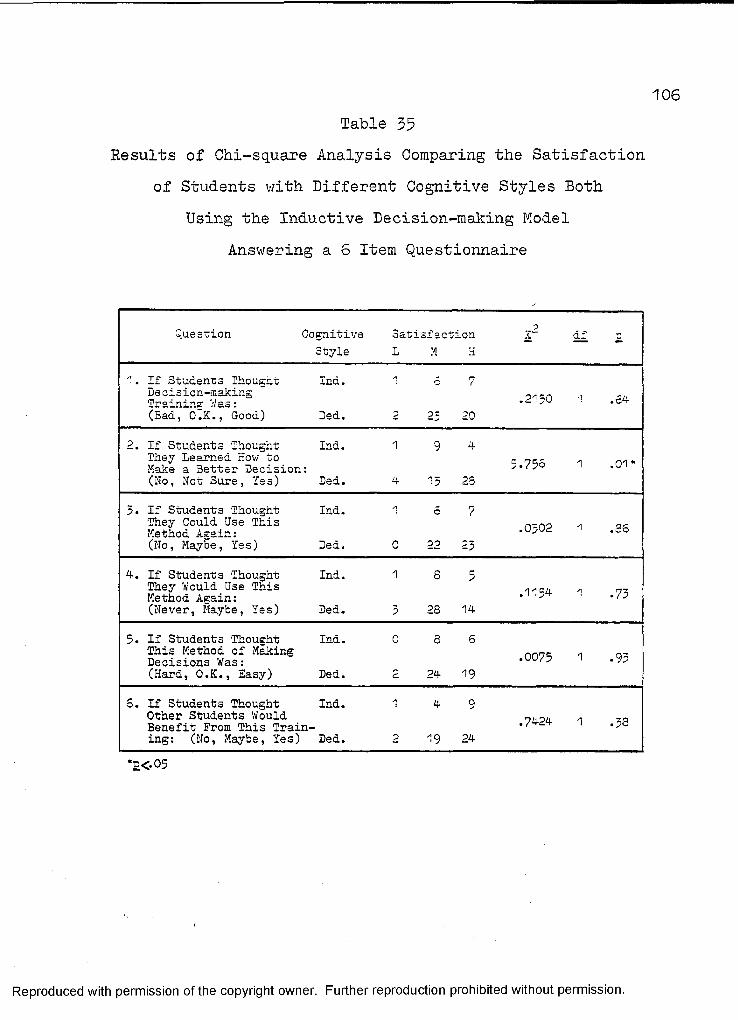
Table 35Results of Chi-square Analysis Comparing the Satisfaction
of Students with Different Cognitive Styles Both Using the Inductive Decision-making Model
Answering a 6 Item Questionnaire
5».ues~ion Cognitive Satisfaction X1" afStyle L M 3
1. If Students Thought Ind.Decision-making Training 7/as:(Bad, O.K., Good) Ded.Decision-making .1Training 7/as: .^-tu .c
2. If Students Thought Ind. 1 9 4They Learned How to . n .,Malrss a RpttpT' Tlpr-' ai nrt ? ^Make a Better Decision:(No, Not Sure, Yes) Ded. 4 15 23
5. If Students Thought Ind.They Could Use This Method Again:(No, Maybe, Yes) Ded. 0 22They Could Use This n-np .Method Again: .0;>02 1 .86
4. If Students Thought Ind. 1 8 5They Would Use ThisMethod Again: *(Never, Maybe, Yes) Ded. 5 28 14
5* If Students Thought Ind. 0 8 6This Method of Making nr.ne- *T lo r * ! c i • • ' • 'L V P • 7 ^Decisions Was:(Hard, O.K., Easy) Ded. 2 24 19
S. If Students Thought Ind. 1 4 9Other Students Would Benefit Prom This Training: (No, Maybe, Yes) Ded. 2 19 24
.7424 1 .38
*£<.05
Reproduced with permission of the copyright owner. Further reproduction prohibited without permission.
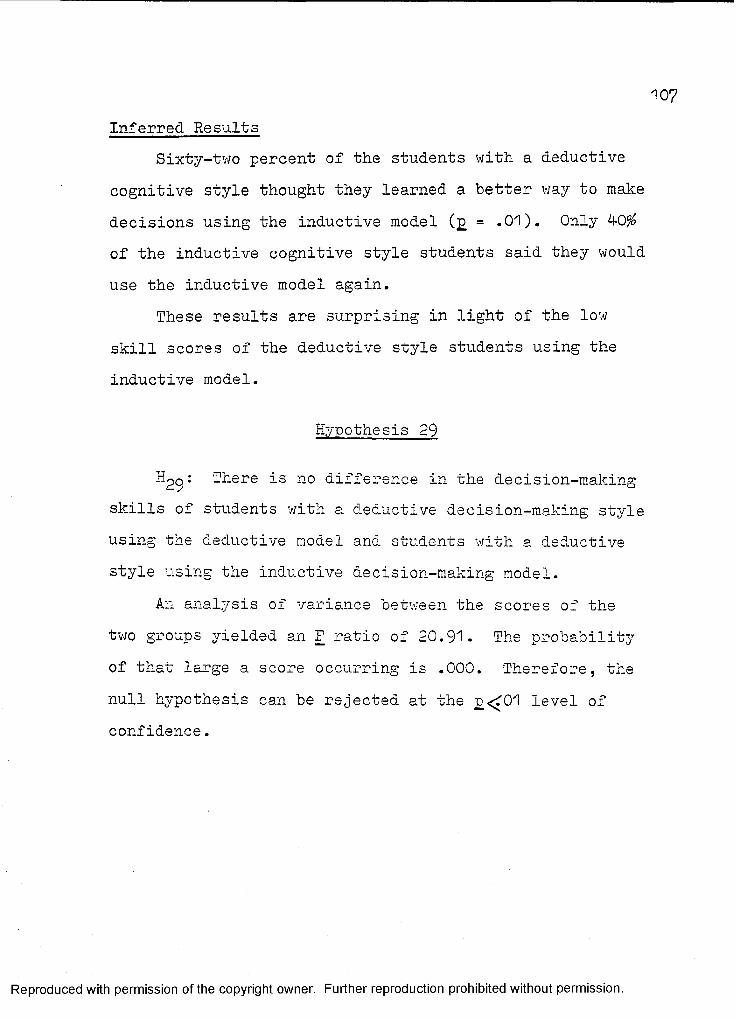
107
Inferred ResultsSixty-two percent of the students with a deductive
cognitive style thought they learned a better way to make decisions using the inductive model (£ = .01). Only 40# of the inductive cognitive style students said they would use the inductive model again.
These results are surprising in light of the low skill scores of the deductive style students using the inductive model.
Hypothesis 29
Hgcji There is no difference in the decision-making skills of students with a deductive decision-making style using the deductive model and students with a deductive style using the inductive decision-making model.
An analysis of variance between the scores of the two groups yielded an F ratio of 20.91. The probability of that large a score occurring is .000. Therefore, the null hypothesis can be rejected at the p <£01 level of confidence.
Reproduced with permission of the copyright owner. Further reproduction prohibited without permission.
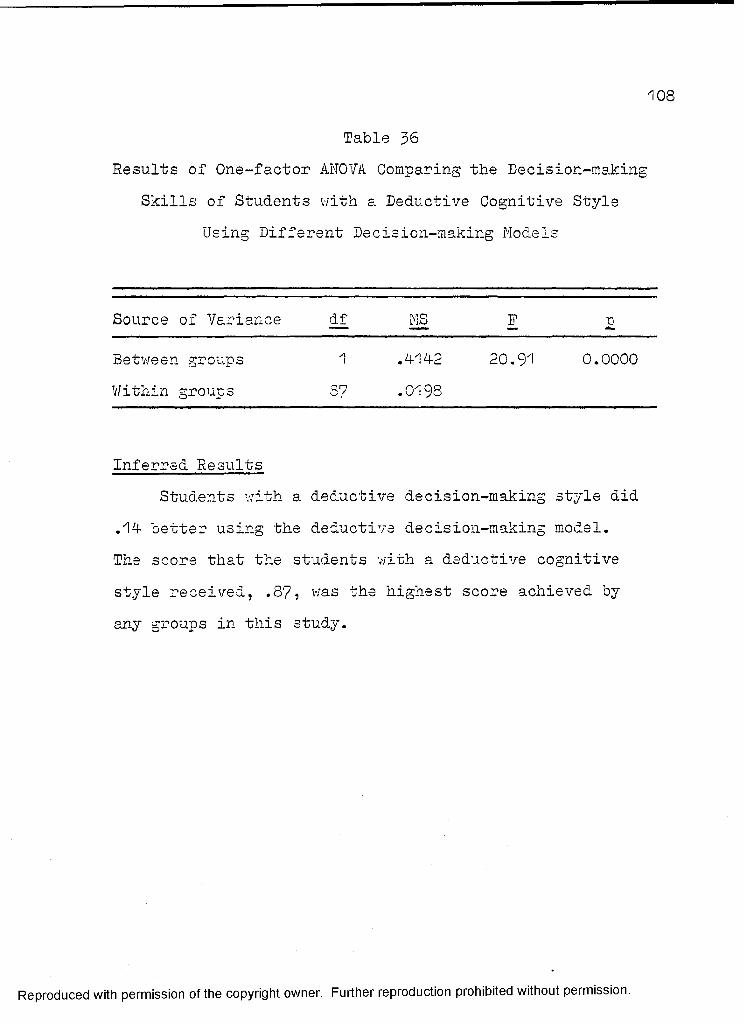
108
Table 36Results of One-factor ANOVA Comparing the Decision-making
Skills of Students with a Deductive Cognitive StyleUsing Different Decision-making Models
Source of Variance df i. *r,
Betv/een groups 1 .4-14-2 20.91 0.0000Within groups 37 .0198
Inferred ResultsStudents with a deductive decision-making style did
.14- better using the deductive decision-making model.The score that the students with a deductive cognitive style received, .87, was the highest score achieved by any groups in this study.
Reproduced with permission of the copyright owner. Further reproduction prohibited without permission.
109
Hypothesis 30
H^q ! There is no difference between the satisfaction of students with a deductive cognitive style using the deductive decision-making model and students with a deductive cognitive style using the inductive decisionmaking model.
A chi-square analysis of the student responses indicated no significant difference on the questionnaire
preported in Table 37 • The largest obtained X was .4-094- on question 5- The probability of that score occurring
pis £ (X .4-094-) = .67* Therefore, the null hypothesis cannot be rejected at the P<-05 level of confidence.
Reproduced with permission of the copyright owner. Further reproduction prohibited without permission.
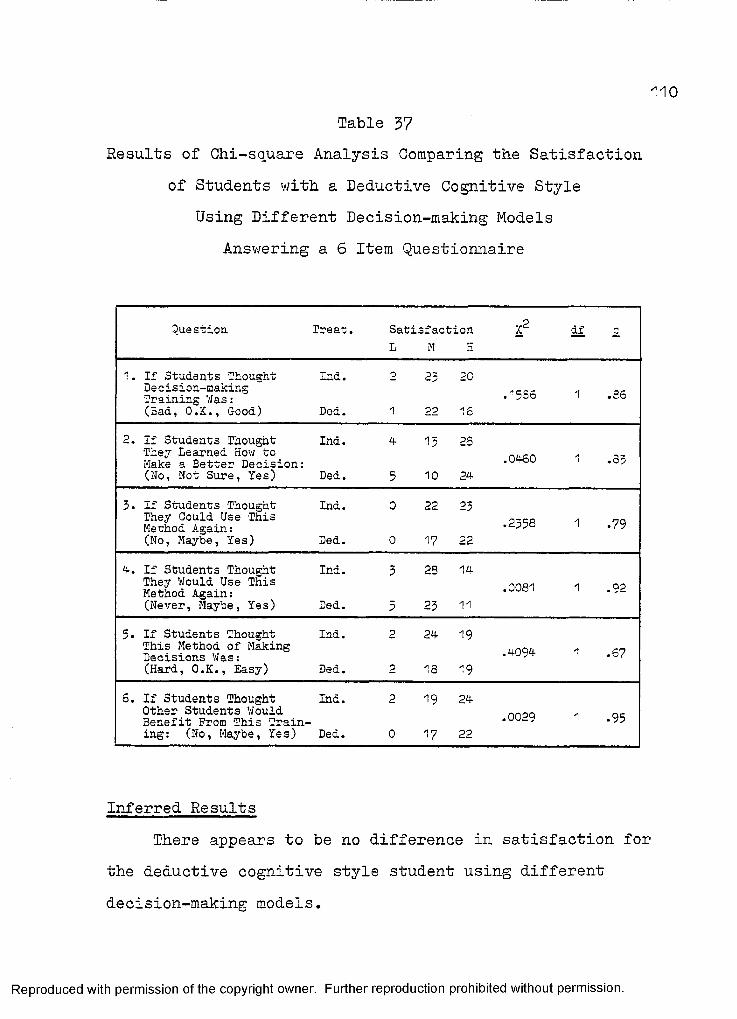
1 1 0
Table 37Results of Chi-square Analysis Comparing the Satisfaction
of Students with a Deductive Cognitive Style Using Different Decision-making Models
Answering a 6 Item Questionnaire
Question Treat. Satisfaction L M H
:<2 if
If Students Thought Ind.De cis ion-making Training W a s :(Bad, O.K., Good) Ded.
’536
.0460
.36
2. If Students Thought Ind. 4 15 26They Learned How to Make a Better Decision:(No, Not Sure, Yes) Ded. 5 10 24
.35
3- If Students Thought Ind. 0 22 23They Could Use This Method Again:(No, Maybe, Yes) Ded. 0 17 22
.2553 • 79
4. If Students Thought Ind. 3 23 14They Would Use This Method Again:(Never, Maybe, Yes) Ded. 5 23 11
.0081 .92
5. If Students Thought Ind.This Method of Making Decisions Was:(Hard, O.K., Easy) Ded.
24 19
18 19.4094 .67
6 . If Students Thought Ind. 2 19 24Other Students Would Benefit Prom This Training: (No, Maybe, Yes) Ded. 0 17 22
.0029 .95
Inferred ResultsThere appears to be no difference in satisfaction for
the deductive cognitive style student using different decision-making models.
Reproduced with permission of the copyright owner. Further reproduction prohibited without permission.
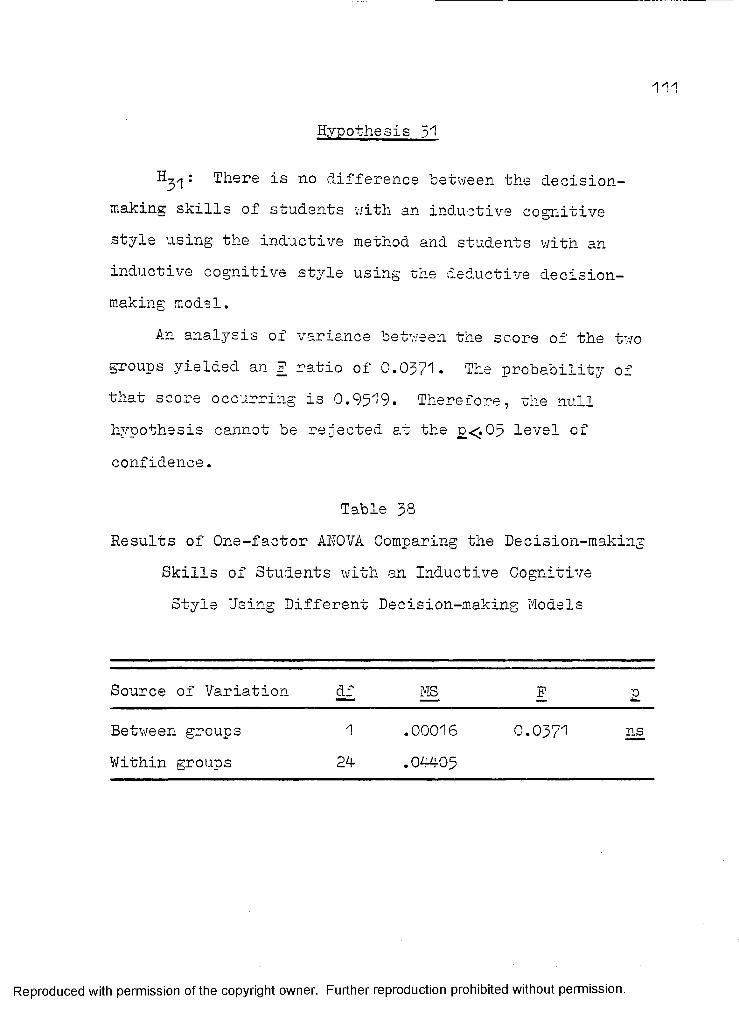
11 1
Hypothesis 51
^31' There is no difference between the decision- making skills of students with an inductive cognitive style using the inductive method and students with an inductive cognitive style using the deductive decisionmaking model.
An analysis of variance between the score of the two groups yielded an F ratio of 0.0371. The probability of tnat score occurring is 0.9519. Therefore, the null hypothesis cannot be rejected at the £<.05 level of confidence.
Table 33Results of One-factor AITOVA Comparing the Decision-making
Skills of Students with an Inductive Cognitive Style Using Different Decision-making Models
Source of Variation MS F £
Between groups Within groups
124-
.00016
.04-4-050.0371 ns
Reproduced with permission of the copyright owner. Further reproduction prohibited without permission.
1 1 2
Inferred ResultsThere appears to be no difference in the scores
between the groups. Inductive cognitive style students did equally well with both methods. They did slightly better wit.ii the inductive method .75 5-s conoared to the deductive method, .74. This was the first time in the study that the group using the inductive method had a higher average score than the group using the deductive model.
Hypothesis g2
H,~: There is no difference in the satisfaction ofstudents with an inductive cognitive style using a deductive decision-making model and students with an inductive cognitive style using the inductive decision-making model.
A chi-square analysis of the student responses indicated no difference on the questionnaire reported inTable 39. The largest obtained X2 was 1.731 on question
21. The probability of that score occurring is p (X 1.731)= .18. Therefore, the null hypothesis cannot be rejected at the p <.05 level of confidence.
Reproduced with permission of the copyright owner. Further reproduction prohibited without permission.
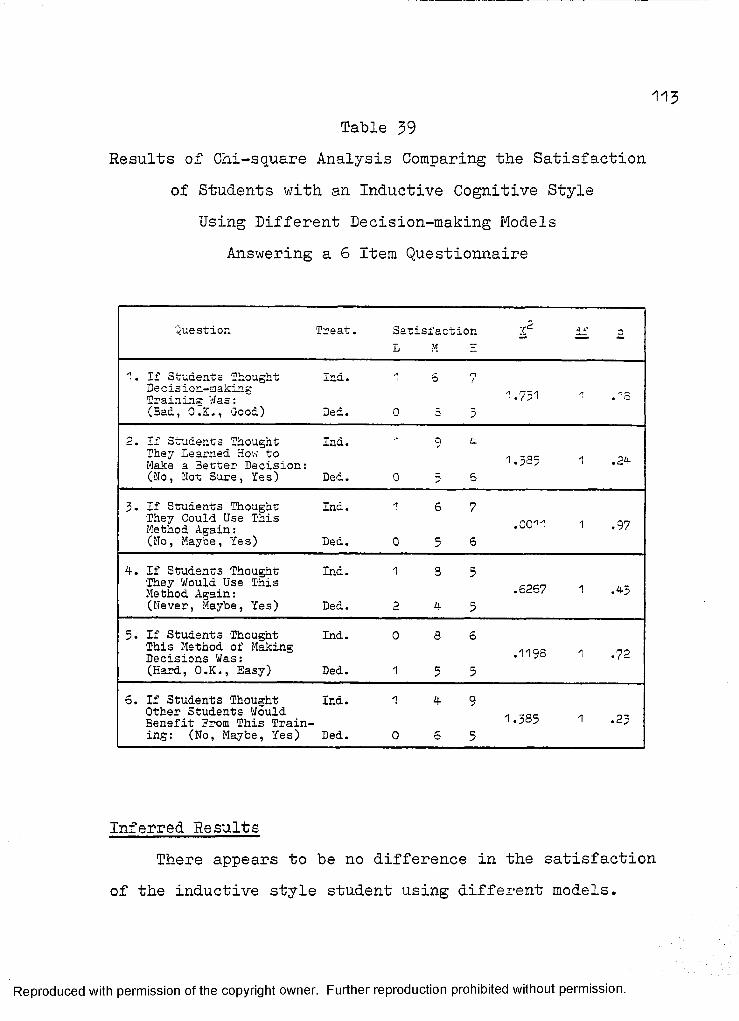
113Table 39
Results of Chi-square Analysis Comparing the Satisfaction of Students with an Inductive Cognitive Style
Using Different Decision-making Models Answering a 6 Item Questionnaire
pQuestion Treat. Satisfaction XL M 3
'I. If Students Thought Ind.De cis ion-making Training W a s :(3ad, O.K., Good) Ded.
* n~y] ■ • { ; 1
2. If Students Thought Ind. ” 9 dThey learned How to . ,,Make a 3etter Decision: 0 7(No, Hon Sure, Yes) Ded. 0 3 5
3- If Students Thought Ind. 1 6 7They Could Use This nn,M .Method Again: -uu ■ 1 •?7(Ho, Maybe, Yes) Ded. 0 3 6
4. If Students Thought Ind.They Would Use This Method Again:(Never, Maybe, Yes) Ded.
.6267 1 .45
5. If Students Thought Ind.This Method of Making Decisions Was:(Hard, O.K., Easy) DedThis Method of MakingDecisions Was: ' *72
6. If Students Thought Ind. 1 4 9Other Students Would . „Benefit Erom This Train- 1 *2;;ing: (No, Maybe, Yes) Ded.
Inferred ResultsThere appears to be no difference in the satisfaction
of the inductive style student using different models.
Reproduced with permission of the copyright owner. Further reproduction prohibited without permission.
Compilation Summary
Chapter IV has been a presentation of the results of this study. The skills scores were compared using a one- factor ANOVA. Satisfaction scores were compared by using chi-square analysis. There is a difference between members of the groups, especially concerning the inductive cognitive style group. Because of the difference in the cell sizes, the results must be carefully interpreted. Future replication studies would be useful for verification of these findings. The level of significance was set at £<^05- Below, is a review of significant differences.
Many of the chi-square analysis had response ratio less than 5; therefore, the two areas of statistical significance should be carefully interpreted. Further studies are needed to substantiate these findings.
GradesH : There is a significant difference in the sat
isfaction of students with high grades and low grades using the inductive model. Students with low grades were more satisfied with the inductive model.
H : There was a difference in how students withhigh grades learned decision-making skills with two different models. They did better with the deductive model.
Reproduced with permission of the copyright owner. Further reproduction prohibited without permission.
115Hg: There was a difference in the satisfaction of
students with high grades using two different decisionmaking models. The students were more satisfied with the deductive model.
Erp: There was a difference in the skills of studentswith low grades using the two different decision-making models. They did better with the deductive model.
Decision-maturity: There was a difference in how well students
did using the inductive model when they had different levels of decision-maturity. Decision-immature students did poorly, .68.
There was a difference in how well decision- mature students did using the two different models. The mature students did better using the deductive model.
H^: There was a difference in how well decision-immature students did using the two different models.The decision-immature student did better using the deductive model.
GenderH g: There was a difference between the satisfac
tion of males and females using the deductive decisionmaking model. Females were more satisfied.
H^: There was a difference between the scores of
Reproduced with permission of the copyright owner. Further reproduction prohibited without permission.
males and females using the inductive decision-making model. Females did better using the model.
HgQ.* There was a difference in how satisfied males and females were with the inductive model. Females were more satisfied.
H21: There was a difference in the skills of malesusing different decision-making models. Males did (.15) better using the deductive model.
Cognitive StyleHOI-: There was a difference in the skills of stu-25
dents with different cognitive styles using the deductive model. Students with a deductive cognitive style did .13 better.
H2Q! There was a difference between the satisfaction of students with different cognitive styles using the deductive decision-making model. Deductive cognitive style students were more satisfied.
There was a difference in the scores of students with a deductive cognitive style using different decision-making models. Students did .14- better with the deductive model.
Reproduced with permission of the copyright owner. Further reproduction prohibited without permission.
CHAPTER V
SUMMARY, DISCUSSION, AND RECOMMENDATIONS
Introduction
This chapter is the summary, discussion, and recommendations for each of the four individual differences considered in this study on the decision-making of teenagers. The individual differences v;ere: grades, decision-maturity, gender, and cognitive style. The final section is a generalisation of the results.
Grades
Summary
Skills. There was no significant difference found between the decision-making skill scores of students with high or low grades, regardless of whether an inductive or deductive model was used. The average score on both models was only two to three percent higher for students with high grades.
Both students with high and with low grades seemed to do better on the deductive model. The students did, on the average, .11 better with the deductive decisionmaking model.
117
Reproduced with permission of the copyright owner. Further reproduction prohibited without permission.

■118
Satisfaction. Satisfaction was the only area under the heading of grades where a significant difference was detected. It appears that students with high grades are more satisfied with the deductive model. Specifically,42$ indicated they would use it again. Conversely, 75# of the students with high grades were unsure as to whether they would use the inductive model again.
Significance was approached for students with low grades using different models. Of these students, 42$ indicated they would use the inductive model again.Sixty-six percent of the students with low grades said they were unsure about using the deductive model again.For students with low grades, the probability was £ = .03.
DiscussionThe results on this study appear to conflict with the
Egner-Jackson (1978) study cited in the review of literature. They found the difference between achievement of "academic" vs. "nonacademic" significant at the .01 level. Perhaps their criteria for the groups was different. A significant factor in this study may have been the inclusion of C students in the low grade group. Because of the nature of the population, exclusion of C students was not very plausible for this reason. Higher performance by students with the deductive model supports the research done by Murdock (1971)*
Reproduced with permission of the copyright owner. Further reproduction prohibited without permission.
119If an instructor were just using grades as a crite
rion for decision-making model selection, it appears that the deductive model would he the better choice since students on the average scored .11 higher with that model. However, this conclusion must be considered tentative inasmuch as the .73 average on the inductive model is still satisfactory. Students with high grades seem more satisfied with the deductive model. Students with low grades were more satisfied with the inductive model.Since user satisfaction is so important more research is needed to substantiate these findings. Perhaps differential decision-making training based on grades is warranted .
RecommendationsFurther research is needed to confirm the superiority
of the deductive model over the inductive model for students. If more research were done using grades as a variable, it might be prudent to eliminate the group of C average grades from the study, even though that might result in a small N.
Decision-maturity
Summary
Skills. There seems to be no difference between the
Reproduced with permission of the copyright owner. Further reproduction prohibited without permission.
120scores of mature and immature deciders using the deductive model. However, decision-maturity does seem to be a factor when using the inductive decision-making model inasmuch mature deciders did significantly better with this model. Immature deciders averaged only .68 on this model which, perhaps, would not be acceptable to someone selecting a model for a group of inexperienced deciders.
The students constituting the population for this study scored about .11 higher on the deductive model irrespective of their maturity level.
Satisfaction. There was no difference in satisfaction for any of the possible group combinations in the hypotheses. The satisfaction for all groups was around .80 which is acceptable for selection purposes.
DiscussionAll students seemed to do better with the deductive
model. This fact seems surprising since the deductive model requires the student to start with an in-depth understanding of their values. The inductive method on the other hand, takes them in search of their values.The immature students definitely did not like the search, or at least must have become weary along the way. These findings would tend to be in keeping with the work by Harren, Koos, Tinsley and Moreland (1978) that maturity
Reproduced with permission of the copyright owner. Further reproduction prohibited without permission.
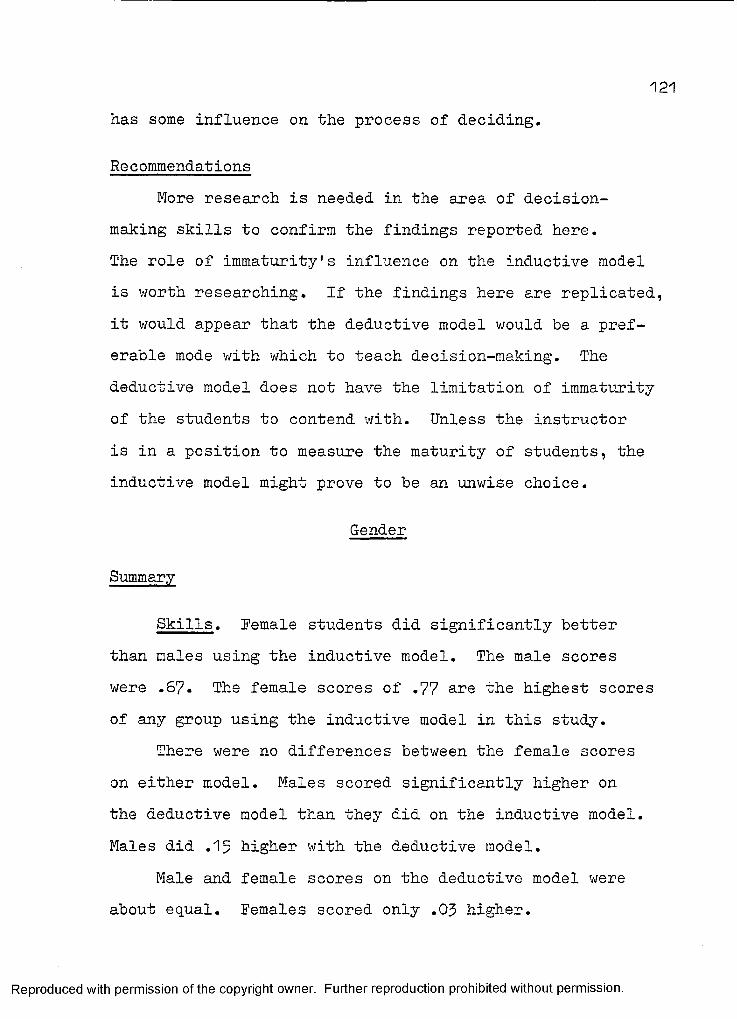
121
has some influence on the process of deciding.
RecommendationsMore research is needed in the area of decision
making skills to confirm the findings reported here.The role of immaturity's influence on the inductive model is worth researching. If the findings here are replicated, it would appear that the deductive model would be a preferable mode with which to teach decision-making. The deductive model does not have the limitation of immaturity of the students to contend with. Unless the instructor is in a position to measure the maturity of students, the inductive model might prove to be an unwise choice.
Gender
Summary
Skills. Remale students did significantly better than males using the inductive model. The male scores were .67. The female scores of .77 are the highest scores of any group using the inductive model in this study.
There were no differences between the female scores on either model. Males scored significantly higher on the deductive model than they did on the inductive model. Males did .15 higher with the deductive model.
Male and female scores on the deductive model were about equal. Females scored only .03 higher.
Reproduced with permission of the copyright owner. Further reproduction prohibited without permission.
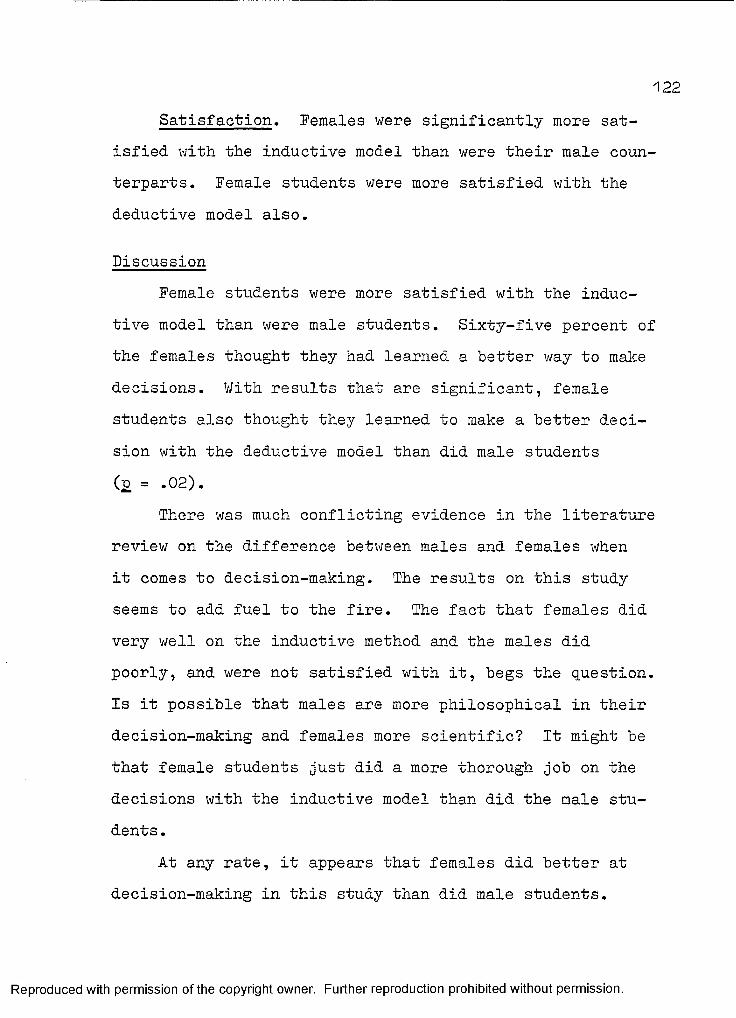
122
Satisfaction. Females were significantly more satisfied with the inductive model than were their male counterparts. Female students were more satisfied with the deductive model also.
DiscussionFemale students were more satisfied with the induc
tive model than were male students. Sixty-five percent of the females thought they had learned a better way to make decisions. With results that are significant, female students also thought they learned to make a better decision with the deductive model than did male students (£ = .02).
There was much conflicting evidence in the literature review on the difference between males and females when it comes to decision-making. The results on this study seems to add fuel to the fire. The fact that females did very well on the inductive method and the males did poorly, and were not satisfied with it, begs the question.Is it possible that males are more philosophical in their decision-making and females more scientific? It might be that female students just did a more thorough job on the decisions with the inductive model than did the male students .
At any rate, it appears that females did better at decision-making in this study than did male students.
Reproduced with permission of the copyright owner. Further reproduction prohibited without permission.
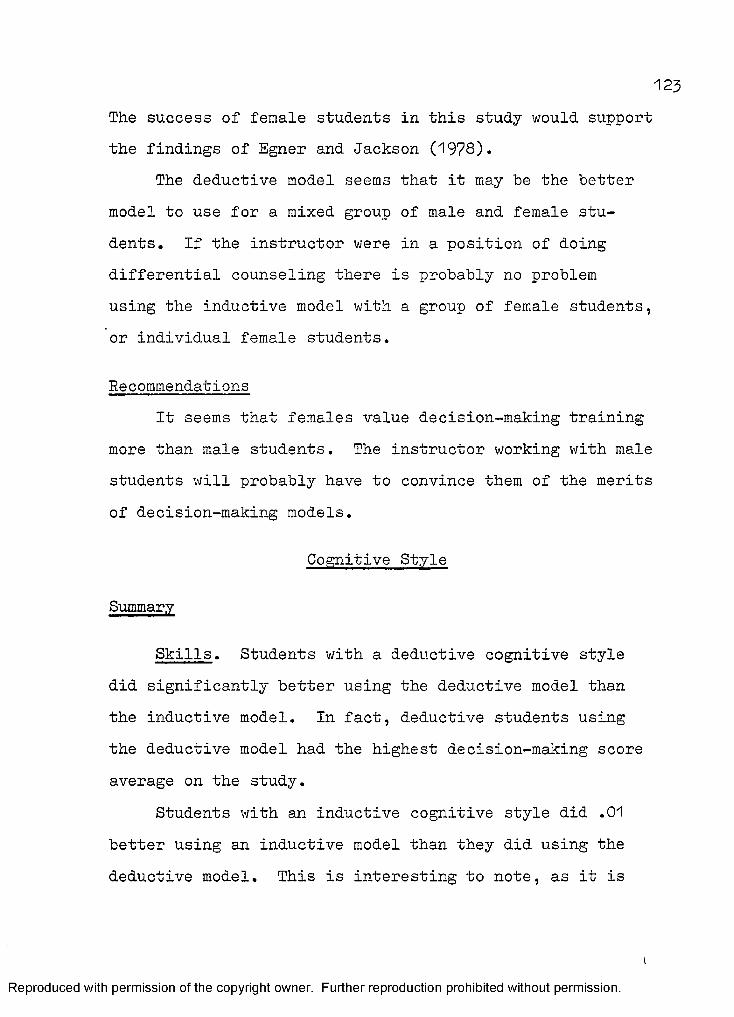
123The success of female students in this study would support the findings of Egner and Jackson (1978)*
The deductive model seems that it may be the better model to use for a mixed group of male and female students. If the instructor were in a position of doing differential counseling there is probably no problem using the inductive model with a group of female students, or individual female students.
RecommendationsIt seems that females value decision-making training
more than male students. The instructor working with male students will probably have to convince them of the merits of decision-making models.
Cognitive Style
Summary
Skills. Students with a deductive cognitive style did significantly better using the deductive model than the inductive model. In fact, deductive students using the deductive model had the highest decision-making score average on the study.
Students with an inductive cognitive style did .01 better using an inductive model than they did using the deductive model. This is interesting to note, as it is
Reproduced with permission of the copyright owner. Further reproduction prohibited without permission.
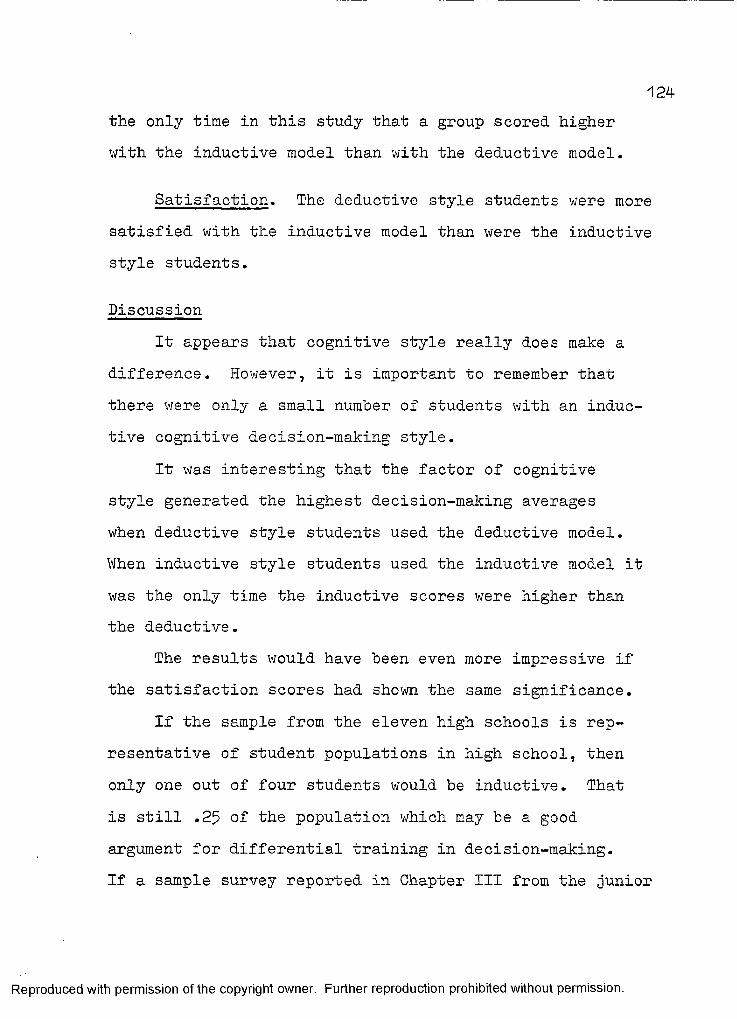
124the only time in this study that a group scored higher with the inductive model than with the deductive model.
Satisfaction. The deductive style students were more satisfied with the inductive model than were the inductive style students.
DiscussionIt appears that cognitive style really does make a
difference. However, it is important to remember that there were only a small number of students with an inductive cognitive decision-making style.
It was interesting that the factor of cognitive style generated the highest decision-making averages when deductive style students used the deductive model.When inductive style students used the inductive model it was the only time the inductive scores were higher than the deductive.
The results would have been even more impressive if the satisfaction scores had shown the same significance.
If the sample from the eleven high schools is representative of student populations in high school, then only one out of four students would be inductive. That is still .25 of the population which may be a good argument for differential training in decision-making.If a sample survey reported in Chapter III from the junior
Reproduced with permission of the copyright owner. Further reproduction prohibited without permission.
1 2 5
high school is representative, then half of the population there would benefit from the inductive model. If the adult population surveyed in Chapter III is representative, then the deductive model is clearly to be preferred when working with adults.
The observations in this section are all speculative, and more research is clearly needed.
RecommendationsA larger sample of inductive cognitive style deciders
should be used in future studies. The study probably should take place in a junior high school or middle school where the population seems to be more evenly divided between the two different cognitive styles.
Overall Summary, Discussion, and Recommendations
There needs to be more research on decision-making.The results presented in this study need verification and validation. This study was a start.
The purpose of this study was to see if individual differences were really significant factors in comparing the results of decision-making with two different approaches. In many ways, more questions are raised than answered.
To try to tie this study all together in a useful and hopefully usable conclusion, this researcher would
Reproduced with permission of the copyright owner. Further reproduction prohibited without permission.
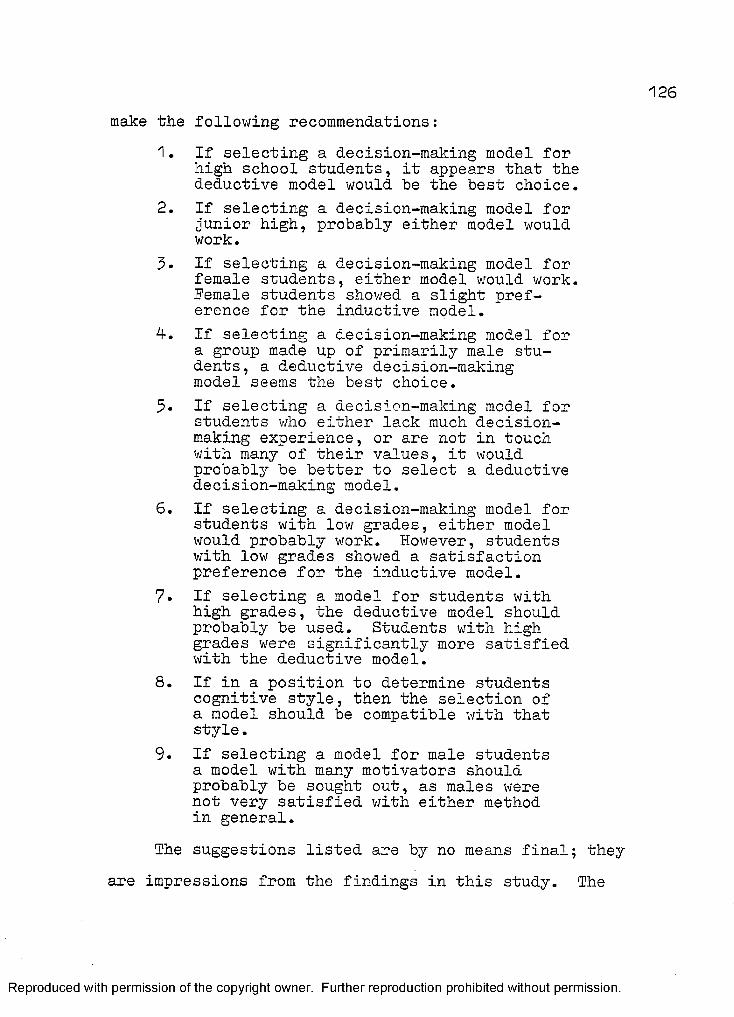
make the following recommendations:1. If selecting a decision-making model for
high school students, it appears that the deductive model would be the best choice.
2. If selecting a decision-making model for junior high, probably either model would work.
3* If selecting a decision-making model for female students, either model would work. Female students showed a slight preference for the inductive model.
4-. If selecting a decision-making model for a group made up of primarily male students, a deductive decision-making model seems the best choice.
5* If selecting a decision-making model for students who either lack much decisionmaking experience, or are not in touch with many of their values, it would probably be better to select a deductive decision-making model.
6. If selecting a decision-making model for students with low grades, either model would probably work. However, students with low grades showed a satisfaction preference for the inductive model.
7. If selecting a model for students with high grades, the deductive model should probably be used. Students with high grades were significantly more satisfied with the deductive model.
8. If in a position to determine students cognitive style, then the selection of a model should be compatible with that style.
9. If selecting a model for male students a model with many motivators should probably be sought out, as males were not very satisfied with either method in general.
The suggestions listed are by no means final; they are impressions from the findings in this study. The
Reproduced with permission of the copyright owner. Further reproduction prohibited without permission.

nine examples are intended as cautions used by the individuals training groups of students in the art of decision-making. The person working with the student on an individual basis should select a model that best suits the needs of that person.
More research is needed to substantiate or refute these findings, and the work here is presented as merely a strong possibility.
Reproduced with permission of the copyright owner. Further reproduction prohibited without permission.

APPENDICES
128
Reproduced with permission of the copyright owner. Further reproduction prohibited without permission.

APPENDIX A
Reproduced with permission of the copyright owner. Further reproduction prohibited without permission.
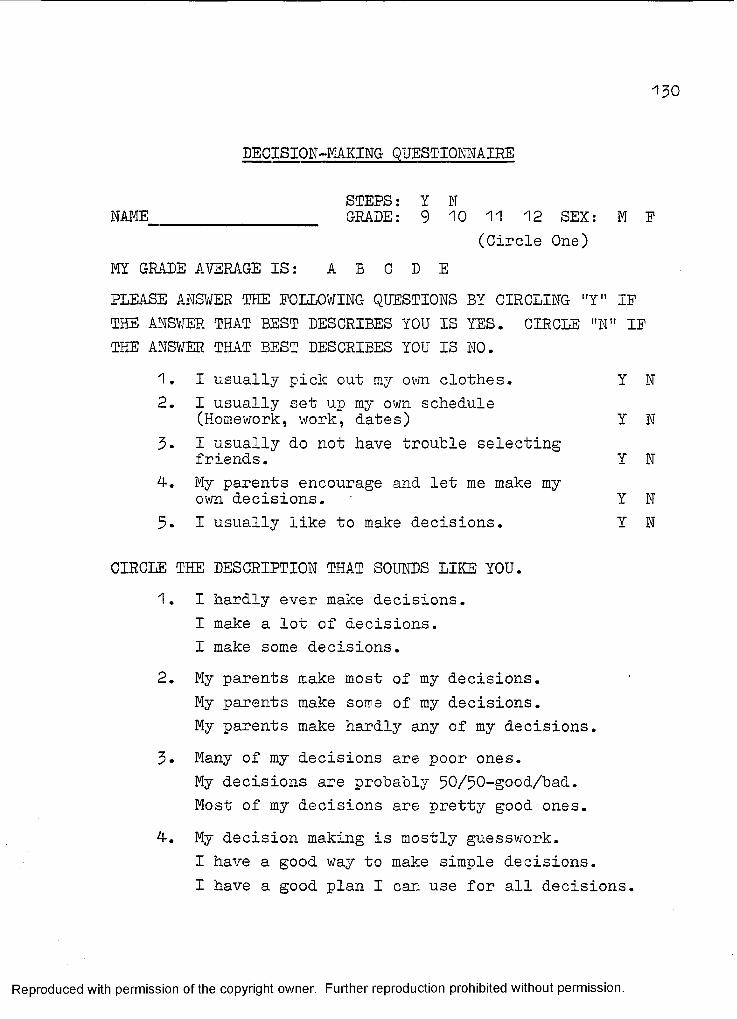
130
DECISION-MAKING QUESTIONNAIRE
STEPS: Y NNAME________________ GRADE: 9 10 11 12 SEX: M P
(Circle One)MY GRADE AVERAGE IS: A B C D EPLEASE ANSWER THE FOLLOWING QUESTIONS BY CIRCLING ,fY" IF THE ANSWER THAT BEST DESCRIBES YOU IS YES. CIRCLE "N" IF THE ANSWER THAT BEST DESCRIBES YOU IS NO.
1. I usually pick out my own clothes. Y N2. I usually set up my own schedule
(Homework, work, dates) Y N3. I usually do not have trouble selecting
friends. Y N4-. My parents encourage and let me make my
own decisions. Y N5- I usually like to make decisions. Y N
CIRCLE THE DESCRIPTION THAT SOUNDS LIKE YOU.1. I hardly ever make decisions.
I make a lot of decisions.I make some decisions.
2. My parents make most of my decisions.My parents make some of my decisions.My parents make hardly any of my decisions.
3. Many of my decisions are poor ones.My decisions are probably 50/50-good/bad.Most of my decisions are pretty good ones.
4-. My decision making is mostly guesswork.I have a good way to make simple decisions.I have a good plan I can use for all decisions.
Reproduced with permission of the copyright owner. Further reproduction prohibited without permission.
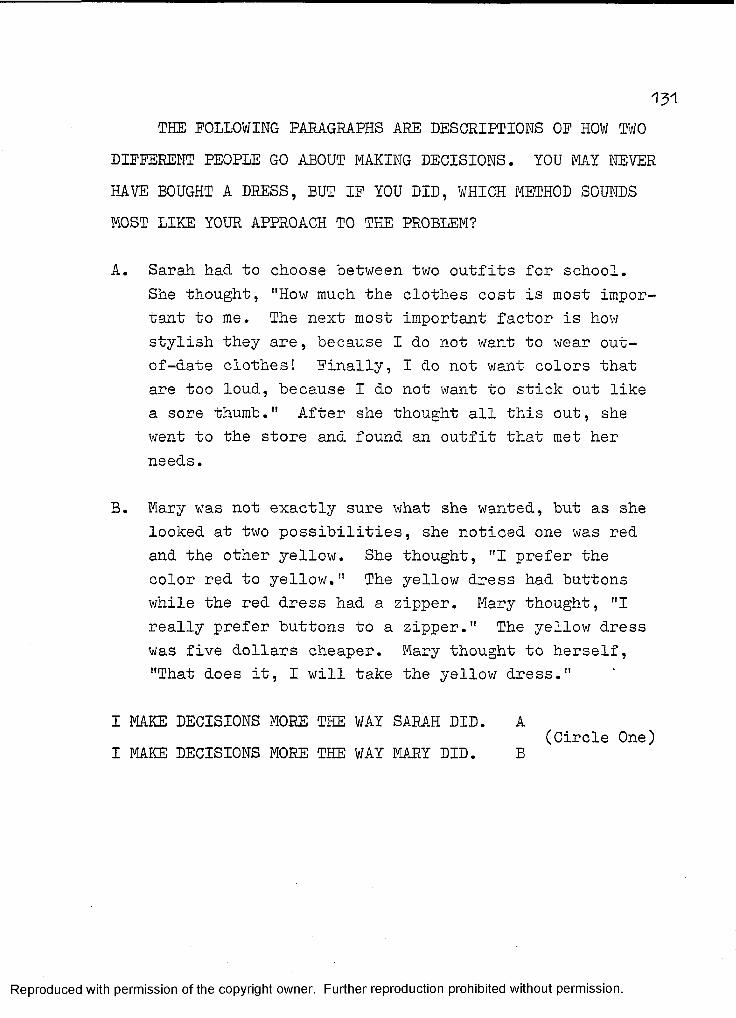
1 3 1
THE FOLLOWING PARAGRAPHS ARE DESCRIPTIONS OF HOW TWODIFFERENT PEOPLE GO ABOUT MAKING DECISIONS. YOU MAY NEVERHAVE BOUGHT A DRESS, BUT IF YOU DID, WHICH METHOD SOUNDSMOST LIKE YOUR APPROACH TO THE PROBLEM?
A. Sarah had to choose between two outfits for school.She thought, "How much the clothes cost is most important to me. The next most important factor is how stylish they are, because I do not want to wear out- of-date clothes! Finally, I do not want colors that are too loud, because I do not want to stick out like a sore thumb." After she thought all this out, she went to the store and found an outfit that met her needs.
B. Mary was not exactly sure what she wanted, but as she looked at two possibilities, she noticed one was red and the other yellow. She thought, "I prefer the color red to yellow." The yellow dress had buttonswhile the red dress had a zipper. Mary thought, "Ireally prefer buttons to a zipper." The yellow dress was five dollars cheaper. Mary thought to herself,"That does it, I will take the yellow dress."
I MAKE DECISIONS MORE THE WAY SARAH DID. A(Circle One)
I MAKE DECISIONS MORE THE WAY MARY DID. B
Reproduced with permission of the copyright owner. Further reproduction prohibited without permission.
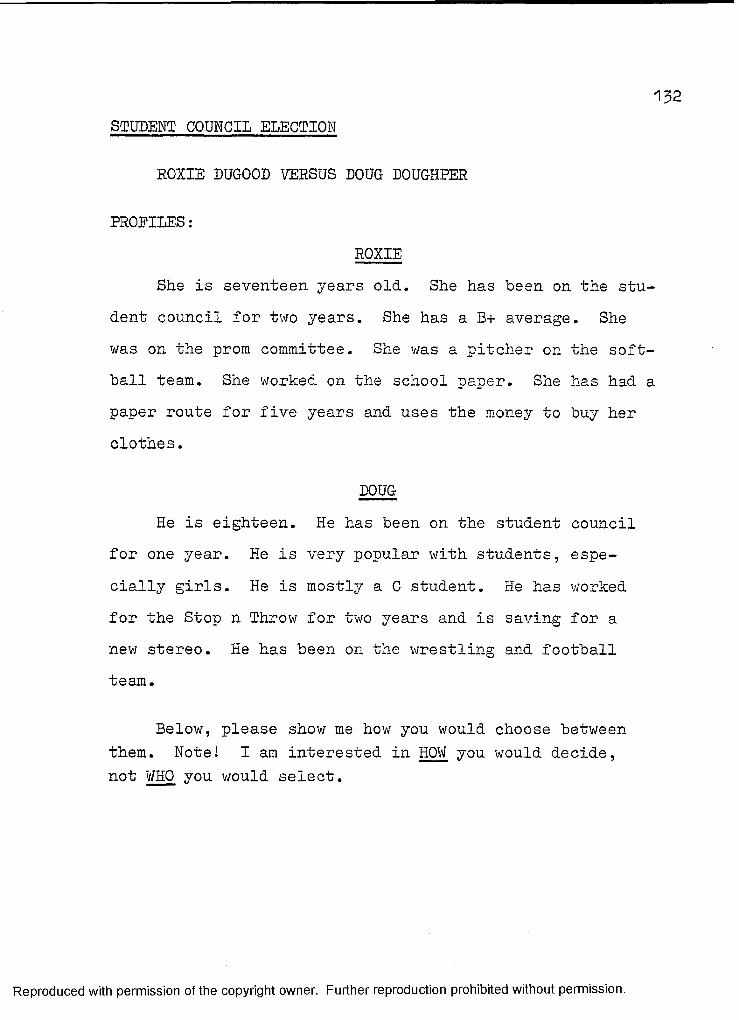
STUDENT COUNCIL ELECTION
ROXIE DUGOOD VERSUS DOUG DOUGHPER
PROFILES:ROXIE
She is seventeen years old. She has been on the stu dent council for two years. She has a B+ average. She was on the prom committee. She was a pitcher on the soft ball team. She worked on the school paper. She has had paper route for five years and uses the money to buy her clothes.
DOUGHe is eighteen. He has been on the student council
for one year. He is very popular with students, especially girls. He is mostly a C student. He has worked for the Stop n Throw for two years and is saving for a new stereo. He has been on the wrestling and football team.
Below, please show me how you would choose between them. Note! I am interested in HOW you would decide, not WHO you would select.
Reproduced with permission of the copyright owner. Further reproduction prohibited without permission.

Sometimes you can identify your values that influenc your choice. Usually you can do this after you have made a certain kind of decision a lot of different times. For example, if I have bought a lot of cars and most of them broke down on me, after a few miles, one of my values in choosing a car would certainly be RELIABILITY. I would not want to pick another car that was going to break down on me!
SEE IF YOU CAN LIST SOME OF YOUR VALUES (AS MANY AS YOU CAN) FOR THE FOLLOWING KINDS OF DECISIONS.WHEN IT COMES TO CHOOSING A MEAL, MY FOOD VALUES ARE:
(EXAMPLE: TASTE)1. 2. 3.__________4._______________ 5-______________ 6.______________7.______________ 8._____________ 9.____________
WHEN IT COMES TO DECIDING WHO TO GO OUT WITH, MY DATING VALUES ARE: (EXAMPLE: GOOD PERSONALITY)1. 2. 3.__________4._______________ 5._____________ 6._______________7.______________ 8.____________ 9. _________
WHEN IT COMES TO CHOOSING A CAR, MY VALUES ARE: (EXAMPLE: RELIABILITY)
1. 2. 3.____4._______________ 5-______________ 6.______7.______________ 8._____________ 9._____
WHEN IT COMES TO PICKING A HOUSE, MY VALUES ARE: (EXAMPLE: COST)
1._____________ 2.______________ 3.______4. 5._______________ 6.______7._____________ 8.______________ 9._____
Reproduced with permission of the copyright owner. Further reproduction prohibited without permission.

WHEN IT COMES TO CHOOSING A PRESIDENT, MY VALUES ARE: (EXAMPLE: HONESTY)
1. 2 . 3.______4.______________ 5-____________ 6.___________7.______________ 8.____________ 9.___________
Reproduced with permission of the copyright owner. Further reproduction prohibited without permission.

APPENDIX B
Reproduced with permission of the copyright owner. Further reproduction prohibited without permission.
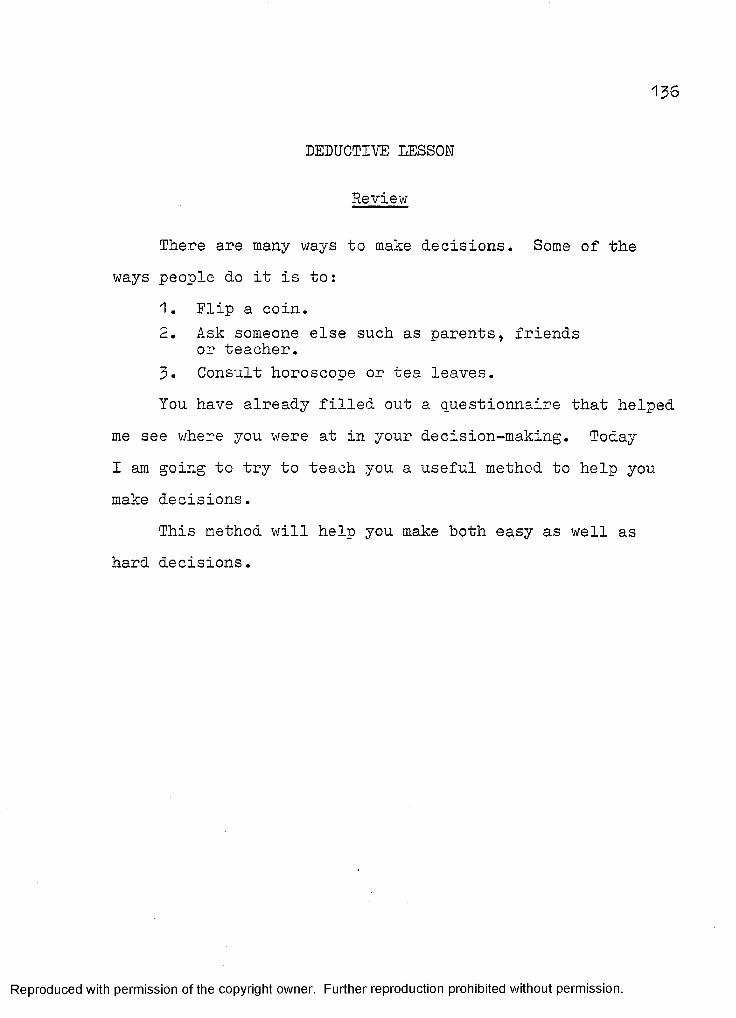
1 3 6
DEDUCTIVE LESSON
Review
There are many ways to make decisions. Some of the ways people do it is to:
1. Flip a coin.2. Ask someone else such as parents, friends
or teacher.3. Consult horoscope or tea leaves.You have already filled out a questionnaire that helped
me see where you were at in your decision-making. Today I am going to try to teach you a useful method to help you make decisions.
This method will help you make both easy as well as hard decisions.
Reproduced with permission of the copyright owner. Further reproduction prohibited without permission.

137
overview
1. Identify values related to choice.2. Define values.3. Hank values.4. Identify information.3. Compare values to option.5. Rate options.7. Add total.3. Compute percentages.
TILLIf you were choosing between two classes to taka, you would need to look at what's important to you in a class. A couple of my values are:1. Will I isam something
worthwhila.2. The grading system.1. Wcw list 3 of your
values for choosing a class.
2. The next step is to define those values in terms of what is good, o.k. or bad.
Tor me, in terms of learning something worthwhile :3 = good = something interesting I'd like and would be able to use frequently
PRESENTSHOW
Write my two values on board.
Write:3 = good 2 * c.k. 1 =» bad
on board.
write it on board.
ues.
Reproduced with permission of the copyright owner. Further reproduction prohibited without permission.

Itrl a,!<. =s something I willuse once ir. awhila.a bad *■ something I willprci;ably r.aver use.
Mew try and define your values.3. I knew these values
are important to me, out new X need to think ahout which one is .tore important to me.Worthwhile is, so X'11 rive that a two and rive grading system a0H3 •.
Mew, you rank yours, you have three so give the rest important value a 3, next most important a 2 ar.d least important a I.Mew we need to cet information about the options sc that we can compare our values to them.Who or what can we get information about classes.Give ciass description of two classes.(attached)Mew X can compare my values in terms of worthwhile. I'd give Art a 3, I need a good hobby.A. I'd give Auto a 3
because it's important too, to keep my car running
2o sam.a for two valuas (on board)good = grade myselfo.k. = 2 objective
tests bad = subjective
teacher rating 3vstem
On Board(2) Worthwhile(1) Grading System
Write:-Counselor -Course Description -Friends -Teacher
Do on board.
Art AutoWorth *5
l *I
while !Graces i
i
Class defines thei values.
Class ranks three values.
Class lists inform ticn sources.
Class reads.
I Class dees their I first value.
Reproduced with permission of the copyright owner. Further reproduction prohibited without permission.
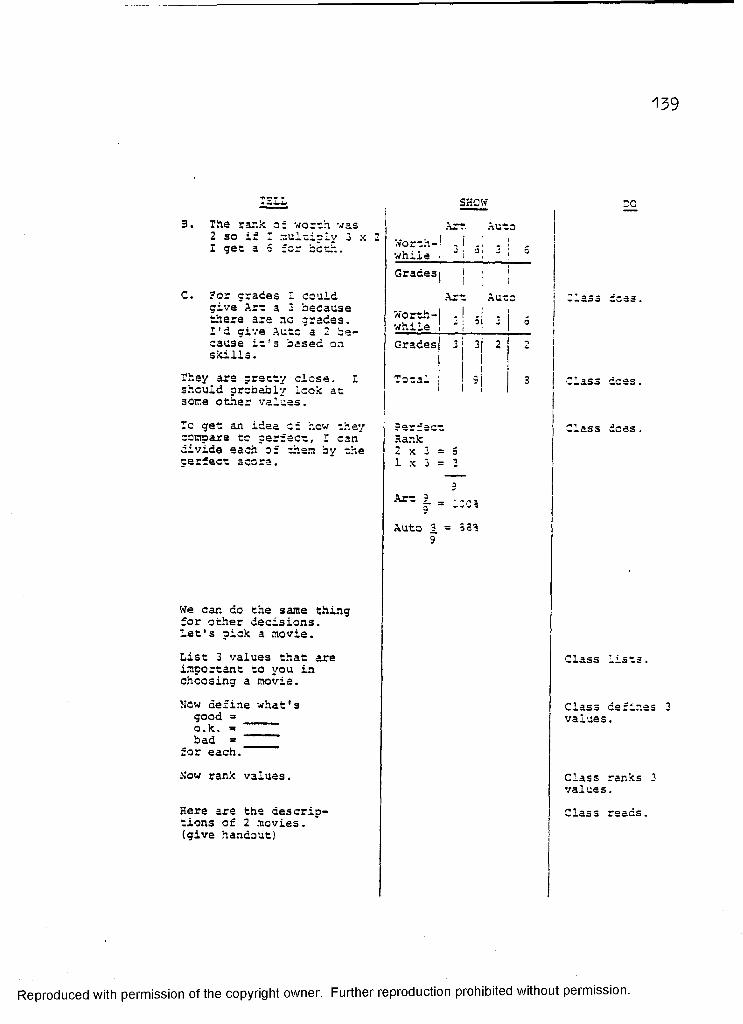
1 3 9
.ELI#3. The rar.k of worth was
2 so if I multiply 3 x 2 I get a 5 for both.
C. Tor grades I could give Art a 3 because there are nc grades. I'd give Auto a 2 because it's based on shills.
They are pretty close. I should probably Look at some other values.To get an idea of hew they compare to perfect, I can" divide each of than by the perfect score.
SHOW ICArt Auto
Worth-! . I. . . i J • 3iWflli.3 * •
Gradesj j ;Art Auto
Worthwhile ! - ; tl -Graces 3 3 2
Total !I I
-.350 t o e s .
Class cces.
?6I“2C"Hank2 x 3 = 5 1x3 = 2
S3 does,
aArt 9 _ * P i a —Auto 3, = 333
9
We can do the same thing for other decisions, let's pick a movie.List 3 values that are important to you in choosing a movie.
Mew define what'sgood = ______o.k. =bad =
for each.Mow rank values.
Here are the descriptions or 2 movies. (give handout!
Class .asts
Class defir. values.
Class ranks values.Class reads
Reproduced with permission of the copyright owner. Further reproduction prohibited without permission.
as 3
3
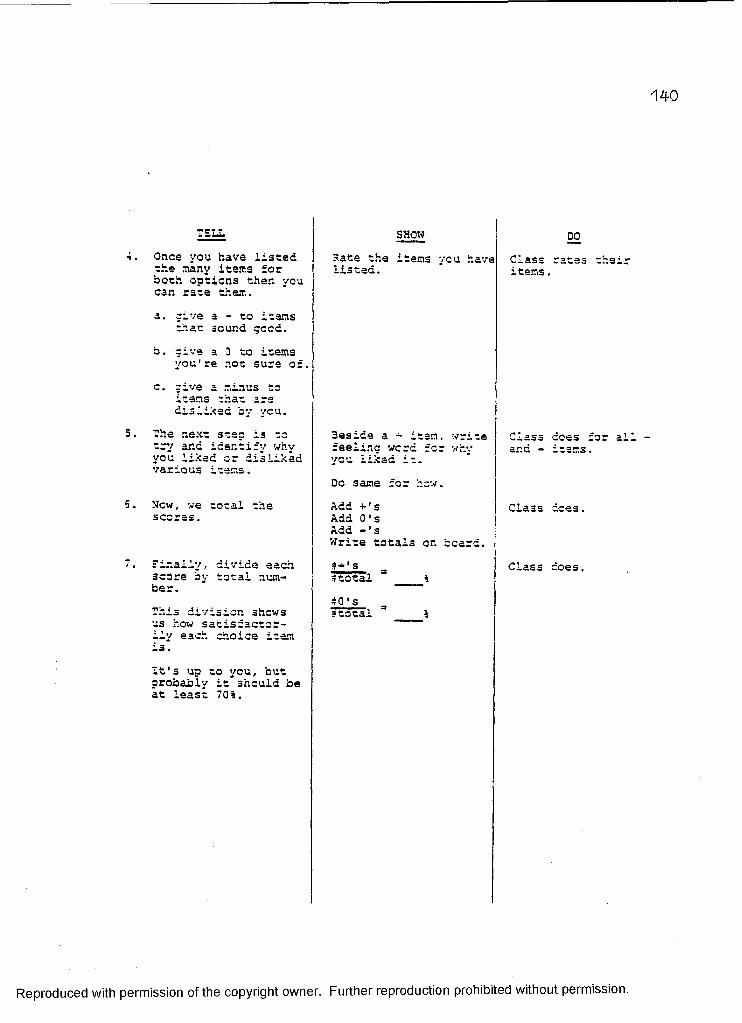
TSLLOnce you have listed the many items for both options then you can rate them.a. give a - to items
that sound good.b. give a 0 to items
you're not sure of,c. give a minus to
items that are disliked by ycu.
The next step is to try ar.c identify why you liked or disliked various items.
5. Mew, we total the scores.
Finally, divide each score by total number.This division shows us how satisfactorily each choice item
It's up to you, but probably it should be at least 70%.
SHOW
Rate the items you have listed.
3eside a - item, write feeling word for why you liked it.Do same for hew.Add +'s Add 0's Add -'sWrite totals on board.
t O 's ?total
DOClass rates items.
Class does for al and - items.
Class dees.
Class does.
Reproduced with permission of the copyright owner. Further reproduction prohibited without permission.

TELL SHOW DONow rate each movie based on your values.Multiply score by rank.Add totals.Divide by perfect score.
EXERCISEStudents do decision-making package.
SUMMARYYou have a good method now, for making decisions
rather than .just guessing or going with impulses.To get score feedback, I would like you to fill out
this questionnaire.
Class does
Class does Class does Class does
Reproduced with permission of the copyright owner. Further reproduction prohibited without permission.
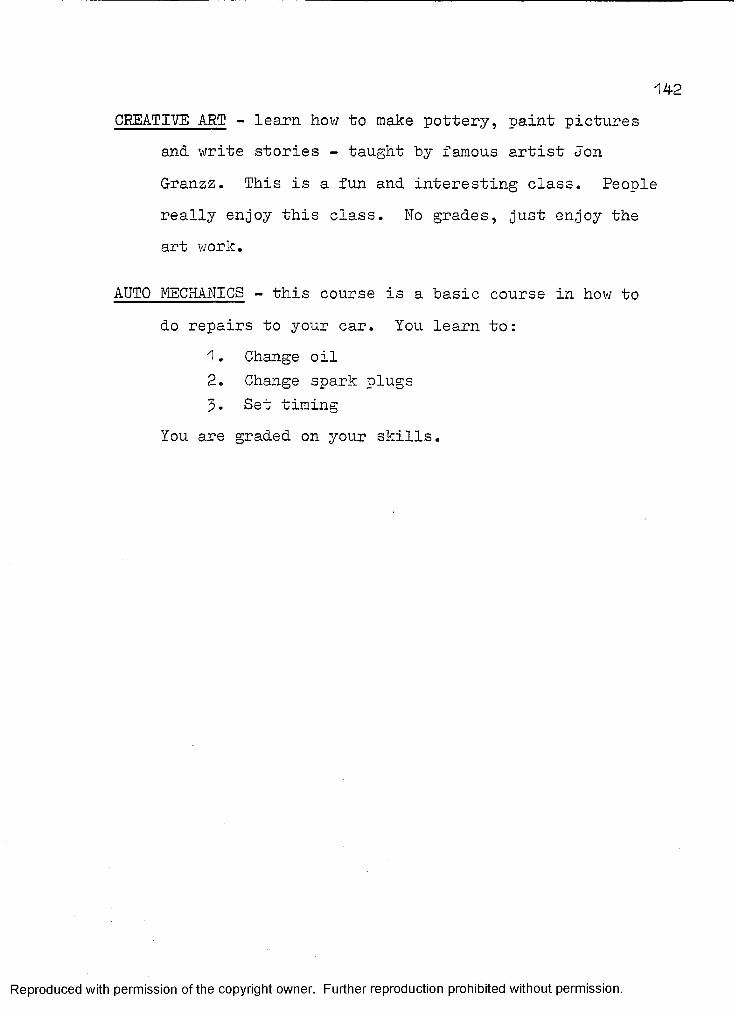
1 4 2
CREATIVE ART - learn how to make pottery, paint pictures and write stories - taught by famous artist Jon Granzz. This is a fun and interesting class. People really enjoy this class. No grades, just enjoy the art work.
AUTO MECHANICS - this course is a basic course in how to do repairs to your car. You learn to:
1. Change oil2. Change spark plugs3. Set timing
You are graded on your skills.
Reproduced with permission of the copyright owner. Further reproduction prohibited without permission.

APPENDIX C
Reproduced with permission of the copyright owner. Further reproduction prohibited without permission.

INDUCTIVE LESSON
Review
There are many ways to make decisions. Some of the ways people do it is to:
1. Elip a coin.2. Ask someone else such as parents, friends
or teacher.3. Consult horoscope or tea leaves.You have already filled out a questionnaire that
helped me see where you were at in your decision-making. Today JE _am going to try to teach you a useful method to help you make decisions.
This method will help you make both easy as well as hard decisions.
Reproduced with permission of the copyright owner. Further reproduction prohibited without permission.

1 4 5
OVERVIEW
There ars six steps in making decisions.1. Identify problem2. Identify information sources3. rind critical items •». Rate items3. Attach values6. Compute scores7. Figure percentages
TELI.The first
RSSSEST
SHOWstet is to
identify what the problem area is. What'if we were choosing what class to take athigh school. Our proo- Iem statement is, "Do I want class A or 3?What things do I need to knew to help me make that choice?Help class develop list.
-teachers -content -delivery -grading system -time-class make un etc.
Write a list for yourself.
On board write A or 3.
DO
Write on board.
Write items down.
-grading system -class size -subject etc.
Class identifies ini; sources; counselors, teachers, friends.
Class writes list
Reproduced with permission of the copyright owner. Further reproduction prohibited without permission.
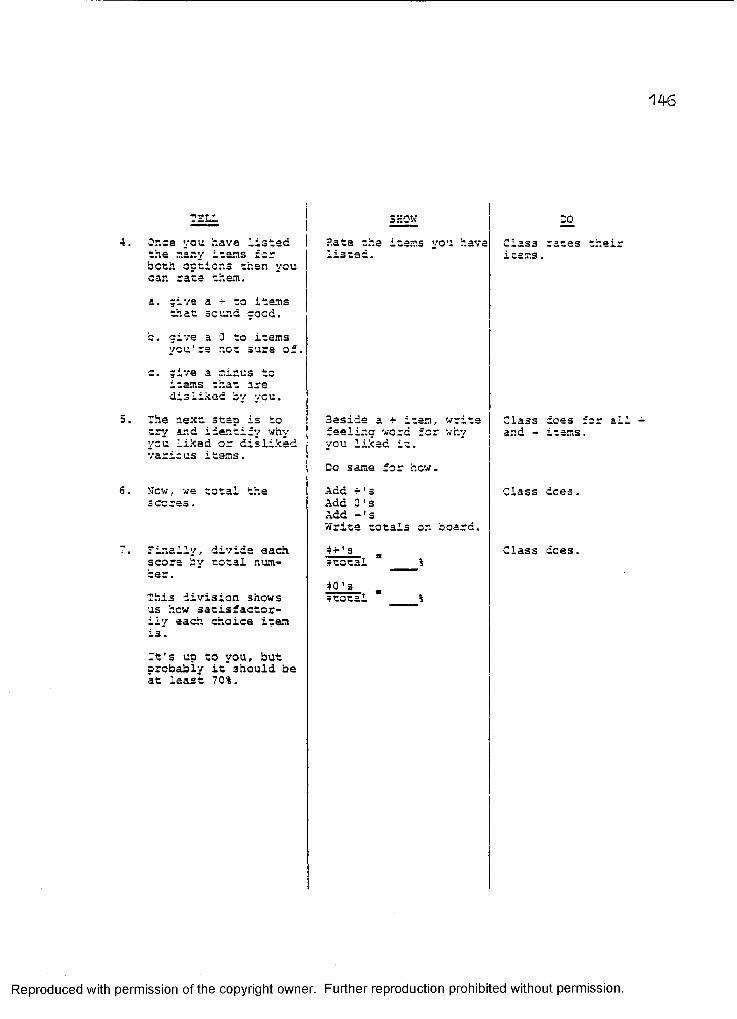
"146
4. 3r.ce you have listed the many items for both options then you can rate them.a. give a -r to items
that sound good.b. give a 0 to items
you're not sura of.c. give a minus to
items that are disliked by you.
5. The next step is to try and identify why you liked or disliked various items.
6. M e w , we total the scores.
Finally, divide each score by total number.This division shows us how satisfactorily each choice item is.
P.ate the items you listed.
'.ave
3eside a + item, write feeling word for why you liked it.Do same for hew.Add +'s Add 0's Add -'sWrite totals on board, f+'s
Crass rates items.
rtotal40' s Ttotal
Class does : and - items.
Class does.
Class does.
It's up to you, but probably it 3hould be at least 70%.
Reproduced with permission of the copyright owner. Further reproduction prohibited without permission.
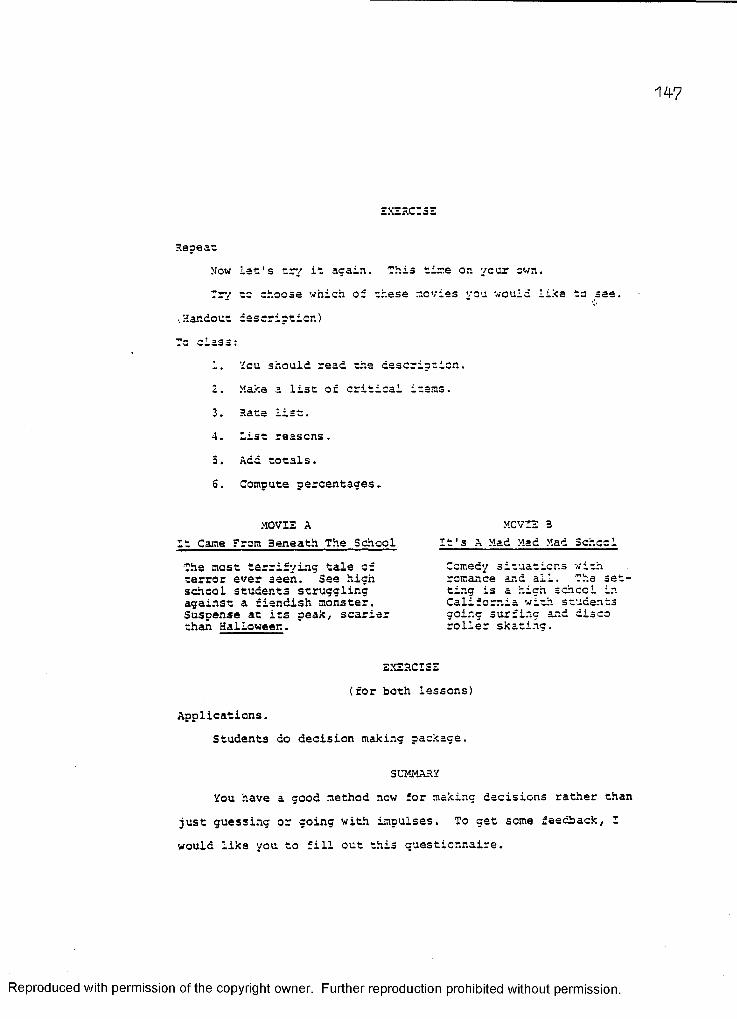
14-7
EXERCISE
Repeat>iow let's try it again, "his time on your own.Try to choose which of these movies you would like to see.
^Handout description)To class:
1. You should read the description.2. Make a list of critical items.3. Rate list.4. List reasons.
5. Add totals.6. Compute percentages.
MOVIE AIt Came From 3eneath The SchoolThe most terrifying tale of terror ever seen. See high school students struggling against a fiendish monster.Suspense at its peak, scarier than Halloween.
EXERCISE (for both lessons)
Applications.Students do decision making package.
SUMMARYYou have a good method now for making decisions rather than
just guessing or going with impulses. To get some feedback, I would like you to fill out this questionnaire.
MOVIE 3 It's A Mad Mad Mad SchoolComedy situations with romance and ail. The setting is a high schccl in California wirh students going surfing and disco roller skating.
Reproduced with permission of the copyright owner. Further reproduction prohibited without permission.

APPENDIX D
Reproduced with permission of the copyright owner. Further reproduction prohibited without permission.

DECISIONS
DECISIONS
DECISIONS
Reproduced with permission of the copyright owner. Further reproduction prohibited without permission.

150FOOD AT BIG BOISE RESTAURANTITEM A - COCOA BIN ITEM B - BEEF AU JAWS1. Fried Chicken 1. Roast Beef2. Mashed Potatoes 2. Baked Potatoes3. Homemade Gravy 3. Sour Cream4. Fresh Vegetables 4. Tossed Salad5. Home Baked Rolls 5. Homemade Bread6. Beverage Included 6. Hot Fudge Sundae7- Strawberry Shortcake Dessert
Dessert 7- Beverage Extra8. $5.65 8. $9.50
DESCRIPTION:ITEM A
You do not have to be chicken about our delicious cocoa bin. This meal is a favorite from coast to coast. Every item is fresh and our strawberry shortcake is made from just picked berries.
ITEM BOur beef is the best in the midwest. Our delicious
baked potato with sour cream is unbeatable. People come from miles around for this incredible deal of a meal.
Reproduced with permission of the copyright owner. Further reproduction prohibited without permission.

DATING GAME
A GUY1. 6' tall2. Blonde hair3. Blue eyes4. Athletic5. Likes disco music6. Good dancer7. On football team8. On swimming team9. Has own car10. Plans to go to
college11. Likes horses12. Likes to be outdoors13. Wants to go into
medicine14. Likes quiet places 15* Outgoing
A GIRL1. 5' 2" tall2. Rich3. Blonde hair4. Outgoing5. Cheerleader6. Very popular7. Plans to go to
college8. Likes to be outdoors9. 16 years old10. Unfriendly dad
B GUY1. 5' 9" tall2. Dark hair3. Brown eyes4. Friendly5. Likes animals6. Good student7* On student council8. Likes rock n roll
and folk music9. Plays guitar10. Plays chess11. Very active12. Enjoys tennis13* Likes photography14. Plans to go to work
after high school15* Editor of school
paper
B GIRL1. 5' 7" tall2. Middle income family3. Dark hair4. Quiet5. On girl's B-ball team6. Popular7. Plans to go to work
after grad.8. Likes rock concerts 9- 18 years old10. Friendly dad
Reproduced with permission of the copyright owner. Further reproduction prohibited without permission.
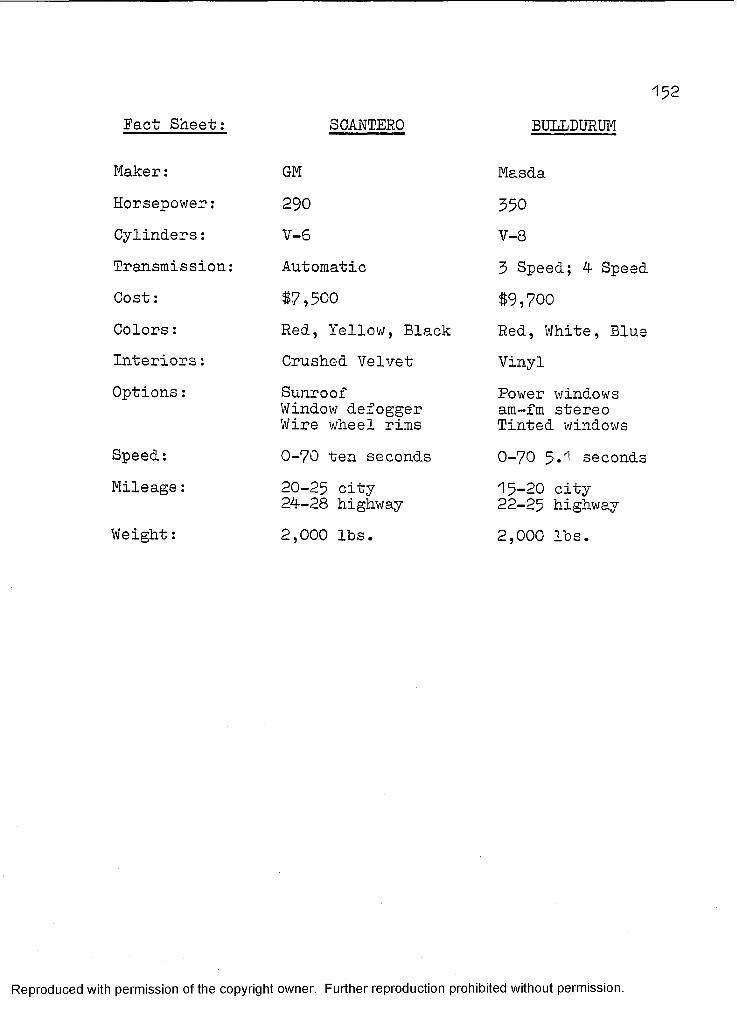
Fact Sheet: SCANTERO152
BULLDURUM
Maker: GM MasdaHorsepower: 290 350Cylinders: V-6 V-8Transmission: Automatic 3 Speed; 4 SpeedCost: $7,500 $9,700Colors: Red, Yellow, Black Red, White, BlueInteriors: Crushed Velvet VinylOptions: Sunroof
Window defogger Wire wheel rims
Power windows am-fm stereo Tinted windows
Speed: 0-70 ten seconds 0-70 5*'1 secondsMileage: 20-25 city
24-28 highway15-20 city 22-25 highway
Weight: 2,000 lbs. 2,000 lbs.
Reproduced with permission of the copyright owner. Further reproduction prohibited without permission.

153WHICH CAR DO YOU WANT?
SCANTEROThe 1980 Scantero is a no nonsense car of the future.
It is compact yet gutsy. It has great E.P.A. mileage.This car is automatic so there's never any trouble driving this beauty. The interior is a beautiful crushed velvet in your choice of exciting colors. It is also finished nicely in authentic corinthian leather. This car is great for a young couple as it is as practical as it is sporty.
BULLDURUMThis hot foreign number is fresh from successes on
the European racing scene. This car is almost too hot to handle. It hugs the road and corners unbelievably well. This car will turn heads as you drive by. This car has more sex appeal than any other car on the road.
Reproduced with permission of the copyright owner. Further reproduction prohibited without permission.

1 5 4
HOUSE AThis is a beautiful house in the country. It is
located on five acres. The house has three bedrooms, central air conditioning, gas heat, two fireplaces and a finished recreation room. The house is ranch style.The price is $62,000, with an assumable mortgage at 9%%•
HOUSE BThis house is located at the best part of the fun
city of Oz. It is a huge colonial with beautiful woodwork. It is on a double lot with huge trees. In additionto gas heat, it also has a woodstove to help keep thoseheat bills down. It has a beautiful huge kitchen and aformal dining room. It has four bedrooms.
Reproduced with permission of the copyright owner. Further reproduction prohibited without permission.

PRESIDENTIAL ELECTION1 5 5
There are two candidates running for president.Elliot Rosewater, known to his friends as Rosie and Matilda Pinsterwald known to her constituents as Matilda Finster- wald.
The main issues in this election (as in most) are Civil Rights, Taxes, Big Business vs. Little Guy and Law and Order and how to deal with the rest of the world.
Here are their voting records in Congress.
Article Rosie Matilda1 yea nay2 nay nay33a yea yea3b nay yea3c nay yea
1c yea nay
You need to select a candidate!
ON THE NEXT PAGE IS THE CIVIC FLASHLIGHT, IT TELLS YOU WHAT ALL OF THE ARTICLES ARE!
Reproduced with permission of the copyright owner. Further reproduction prohibited without permission.

1 5 6
THE CIVIC FLASHLIGHT
Article 1This is a bill that if enforced, would turn over the
Wayland Canal to Canada and rename Niagara Falls to Maple Leaf Falls.
Article 5AAllow non-native Laminites to occupy unoccupied HUD
homes, in urban slum areas.
Article 3BAllow Russian Fishermen to have no size limit on red
herring caught in the United States coastal waters.
Article 3CPrevent discrimination against lefthanders in the
classroom and mandate that in the future there are left- handed desks and pencil sharpeners.
Article 1CThere will be an 8# drop in taxes on gas, food and
clothing.
Article 2Independent businesses of a net worth of under
$1,000,000 will get a tax break of 3$ for the next five years.
PLEASE PICK YOUR CANDIDATE.
Reproduced with permission of the copyright owner. Further reproduction prohibited without permission.

APPENDIX E
Reproduced with permission of the copyright owner. Further reproduction prohibited without permission.

1 58 -
n a m e.
SCORE.
DECISION AREA
VALUES
PROGRAM
SCHOOL
STANDARDS TOR ACCEPTANCE
GOCD 3.
2 .GCCD 3.
0 .K.2
3 AD 1 .
3.
GCCD 3.
O.K. 2.BAD 1 .
4.GCOD 3. O.K. 2.
3 AD 1.
Reproduced with permission of the copyright owner. Further reproduction prohibited without permission.

159
1 ■ PERFECT | 1 . | 2.VALUES WEIGHT STAND EARL jSCGRZ j STANDEARD SCORE j STANDARD 5CCRZ
!
i ;1 ! i i
j 1 |i I ; ! :
TC TALS
PERCENTAGE^ Sea r°Perfecc score
DECISION : 1. 1. neichsr
Reproduced with permission of the copyright owner. Further reproduction prohibited without permission.

APPENDIX P
Reproduced with permission of the copyright owner. Further reproduction prohibited without permission.
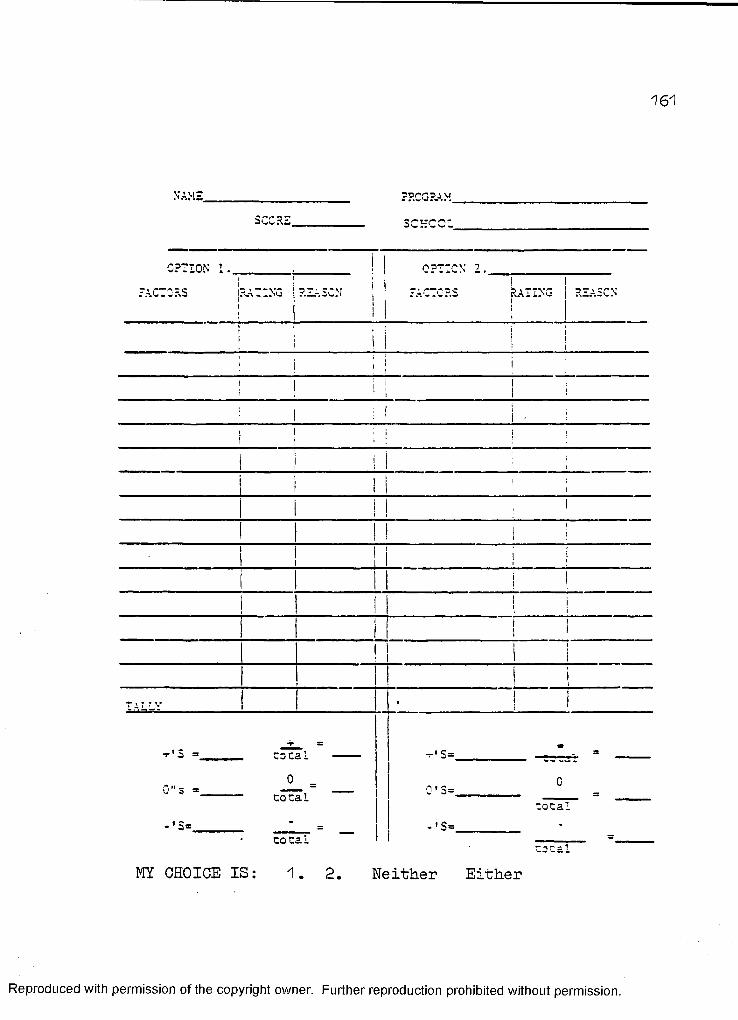
161
NAMESCC RE 3CKCCL
OPTION 1. OPTION 2.[RATING {P.EASC RATING | RE.-.3CN
T ' 5
- a*
+zo cal0 :
coca!
t o t a i
_ i s=
0' 5=_ - 'S=
-ocal
ZOZB.I
MY CHOICE IS: 1. 2. Neither Either
Reproduced with permission of the copyright owner. Further reproduction prohibited without permission.

APPENDIX G
Reproduced with permission of the copyright owner. Further reproduction prohibited without permission.

1 6 3
NAME
School _________________ _
__________________PROGRAM____________________ A3MFKLDIZI SCORE.
DECISION MAKING SATISFACTION SURVEY PLEASE CIRCLE THE WORD THT BEST DESCRIBES YCUR OPINION!
1. The desisior. making training was good o.k. had
2. Ilearned how 10 make better decisions yes not sure r.o
3. I will be able to use this approach ..to decision making againtcould you use ' S S ”,a-'-ethis method again or. your own?)
4.1 will use this method again definitely maybe never5This method of making decisions is easy o.k. hard
6. Other students would benefit from this training yes mavbe no
ADDITIONAL CCMMBDITS :
Reproduced with permission of the copyright owner. Further reproduction prohibited without permission.

APPENDIX H
Reproduced with permission of the copyright owner. Further reproduction prohibited without permission.
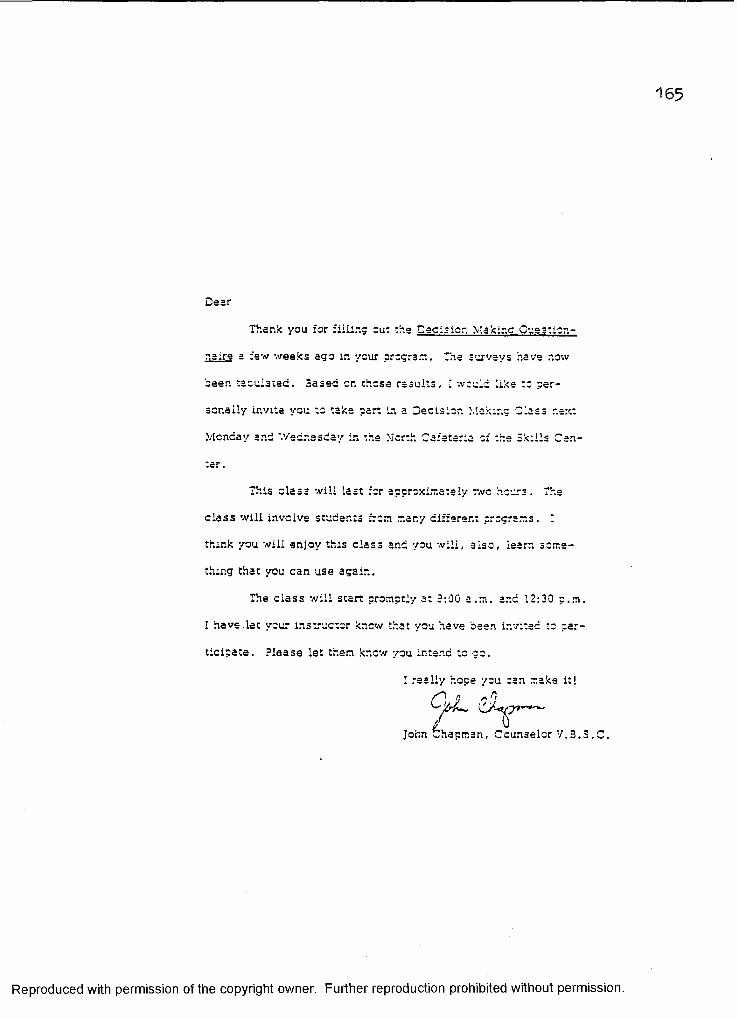
165
Dear
Thank you for filling cu: -.he Decision Makir.c Question
naire a few weeks ago in your program. The surveys have now
been tabulated. Based on those results, I would like to per
sonally invite you to take part in a Decision Making Class next
Monday and '.Vecnesday in the Morth Cafeteria of the Skills Cen
ter.
This class w ill last for approximately o.vo hours. The
class w ill involve students from many different programs. 1
think you w ill enjoy this class and you w ill , also, learn some
thing that you can use again.
The class w ill start promptly at 9:00 a .m . and 12:30 p.m.
I have.let your instructor knew that you have been invited to par
tic ipate. Please let them know you intend to go.
I really hope you can make it!
{^9 *'1
I 0John Chapman, Counselor V . 3 . 5 . C .
Reproduced with permission of the copyright owner. Further reproduction prohibited without permission.

BIBLIOGRAPHY
166
Reproduced with permission of the copyright owner. Further reproduction prohibited without permission.
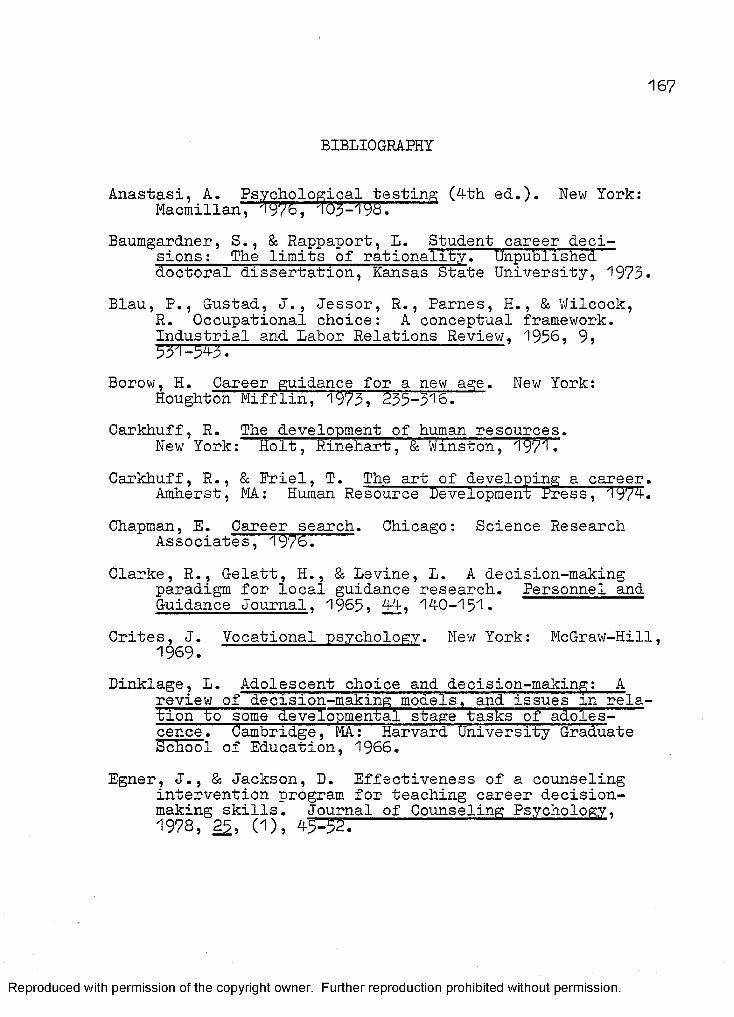
167
BIBLIOGRAPHY
Anastasi, A. Psychological testing (4th ed.). New York: Macmillan, 19%, “03-i98.
Baumgardner, S., & Rappaport, L. Student career decisions: The limits of rationality. Unpublisheddoctoral dissertation, Kansas State University, 1973*
Blau, P., Gustad, J., lessor, R., Parnes, H., & Wilcock,R. Occupational choice: A conceptual framework.Industrial and Labor Relations Review, 1956, 9,53T= 5 ^ --------------------------
Borow, H. Career guidance for a new age. New York: Houghton Mifflin, 1973, 235-316.
Carkhuff, R. The development of human resources.New York: Holt, Rinehart, & Winston, 1971*
Carkhuff, R., & Friel, T. The art of developing a career. Amherst, MA: Human Resource Development Press, 19?4.
Chapman, E. Career search. Chicago: Science Research Associates, 1976.
Clarke, R., Gelatt, H., & Levine, L. A decision-makingparadigm for local guidance research. Personnel and Guidance Journal, 1965, 44, 140-151.
Crites, J. Vocational psychology. New York: McGraw-Hill,1969.
Dinklage, L. Adolescent choice and decision-making: Areview of decision-making models, and issues xn relation to some developmental stage tasks of adolescence . Cambridge, MA: Harvard University Graduate School of Education, 1966.
Egner? J., & Jackson, D. Effectiveness of a counseling intervention program for teaching career decisionmaking skills. Journal of Counseling Psychology,1978, 25, (1), 4 5 ^
Reproduced with permission of the copyright owner. Further reproduction prohibited without permission.
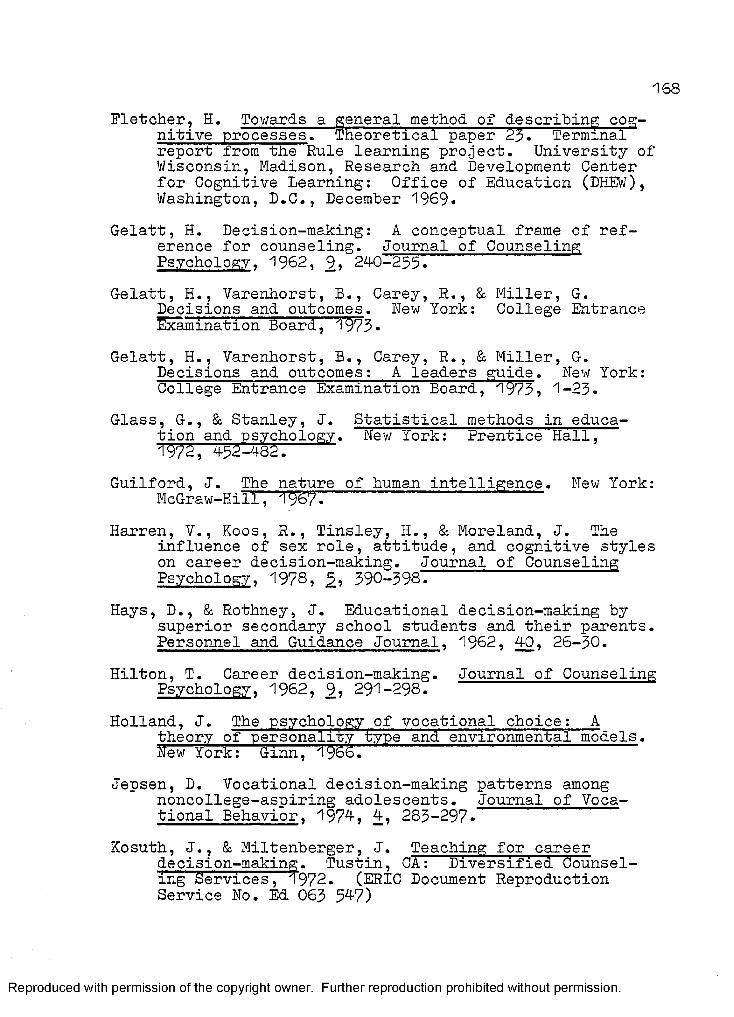
168Fletcher, H. Towards a general method of describing cog
nitive processes. Theoretical paper 23. Terminal report from the Rule learning project. University of Wisconsin, Madison, Research and Development Center for Cognitive Learning: Office of Education (DHEW),Washington, D.C., December 1969-
Gelatt, H. Decision-making: A conceptual frame of reference for counseling. Journal of Counseling Psychology. 1962, 9, 240-255.
Gelatt, H., Varenhorst, B., Carey, R., & Miller, G.Decisions and outcomes. New York: College EntranceExamination Board, 1*573*
Gelatt, H., Varenhorst, B., Carey, R., & Miller, G.Decisions and outcomes: A leaders guide. New York:College Entrance Examination Board, 1973, 1-23.
Glass, G., & Stanley, J. Statistical methods in educa- tion and psychology. New York: Prentice Hall,1972, 452-482.
Guilford, J. The nature of human intelligence. New York: McGraw-Kill, 1967.
Harren, V., Koos, R., Tinsley, H., & Moreland, J. Theinfluence of sex role, attitude, and cognitive styles on career decision-making. Journal of Counseling Psychology, 1978? 390-398.
Hays, D., 8s Rothney, J. Educational decision-making bysuperior secondary school students and their parents. Personnel and Guidance Journal, 1962, 40, 26-30.
Hilton, T. Career decision-making. Journal of Counseling Psychology, 1962, 9, 291-298.
Holland, J. The psychology of vocational choice: Atheory of personality type and environmental models. New York: Ginn, 1966.
Jepsen, D. Vocational decision-making patterns among noncollege-aspiring adolescents. Journal of Vocational Behavior, 1974-, ft? 283-297*
Kosuth, J., 8c Miltenberger, J. Teaching for careerdecision-making. Tustin, CT: Diversified Counseling Services, 1972. (ERIC Document Reproduction Service No. Ed 063 54-7)
Reproduced with permission of the copyright owner. Further reproduction prohibited without permission.
1 6 9
Lindley, D. Making decisions. London: John Wiley &Sons Ltd., 197 1 •
Lunnenborg, P. Sex and career decision-making styles. Journal of Counseling Psychology, 1978, 2£, (4),2^-565.
Mathewson, R., & Orton, J. Vocational imagery and vocational maturity of high school students. Journal of Counseling Psychology, 1963, 10, 384—388.
Michigan Career Education. A reference guide: Career development goals and performance indicators (2nd ed.). Washington, D.C.: United States Office ofEducation, 1974.
Miller, G. Students evaluate deciding. College Board Review, 86, 1972.
Murdock, R. Concept learning and retention: Effects ofpresentation method of learning procedure for different intelligence levels. (Doctoral dissertation, State University of New York, Albany, 1971)*(ERIC Document Reproduction Service, No. ED 054- 482)
O'Neil, J., Ohlde, C., Tollefson, N., Borke, C., & Piggot,T. Factor correlates and problem areas affecting career decision-making of a cross-sectional sample of students. Journal of Counseling Psychology, 1978,2£, (6), 571-580.
Osipow, S. Theories of career development. New York: Appleton Century-Crofts, 1966.
Schwartz, S., & Fatollah, D. Representation in deductive problem-solving: The matrix. Paper presented at tbeMidwestern Psychological Association, Detroit,May 197 .
Super, D., & Crites, J. Appraising vocational fitness (Rev. ed.). New York: Harper & Row, 1962.
Tolbert, E. Counseling for career development. Boston: Houghton Mifflin, 1974, 155-177.
Vriend, J. Vocational maturity ratings of high school seniors. Journal of Counseling Psychology, 1969,16, 377-38 1
Reproduced with permission of the copyright owner. Further reproduction prohibited without permission.

170
Weinrach, S. Career counseling. New York: McGraw-Hill,1979, 188l"2-0 3 ~ -----
Whiteley, J., 8s Resnikoff, A. Career counseling.Monterey: Brooks/Cole, 1978, 89-141.
Yabroff, W. An experiment in teaching decision-making.(Research Brief No. 9). Sacramento, CA: CaliforniaState Department of Education, 1964-.
Reproduced with permission of the copyright owner. Further reproduction prohibited without permission.