Embed Size (px)
Citation preview
4 Review of International Comparative Management Volume 22, Issue 1, March 2021
A Comparative Analysis of National Strategies to Underpin
Innovation Progress in Romania and Portugal
Corina-Cristiana NASTACĂ1
Ariana NĂSTĂSEANU2
Keywords: innovation, performance, European Innovation Scoreboard,
Innovation Index, Romania, Portugal
JEL classification: I20, I23, I29
DOI: 10.24818/RMCI.2021.1.4
1. Introduction
One of the most important tools for developing sustainable economies is
innovation, a key factor used in all regional and national development strategies.
Also, the European Union focuses on developing the innovation capacity of its
Member States, and a relevant example is one of the targets introduced in the
Europe 2020 Strategy- the allocation of 3% of the Gross Domestic Product (GDP)
for Research and Development (European Commission, 2010). The Reflection
paper: Towards a Sustainable Europe by 2030 (European Commission, 2019),
1 Corina-Cristiana Nastacă, The Bucharest University of Economic Studies, corina.nastaca
@amp.ase.ro, 0754303579 2 Ariana Năstăseanu, The Bucharest University of Economic Studies, ariana.nastaseanu
@gmail.com, 0032-493-457.286
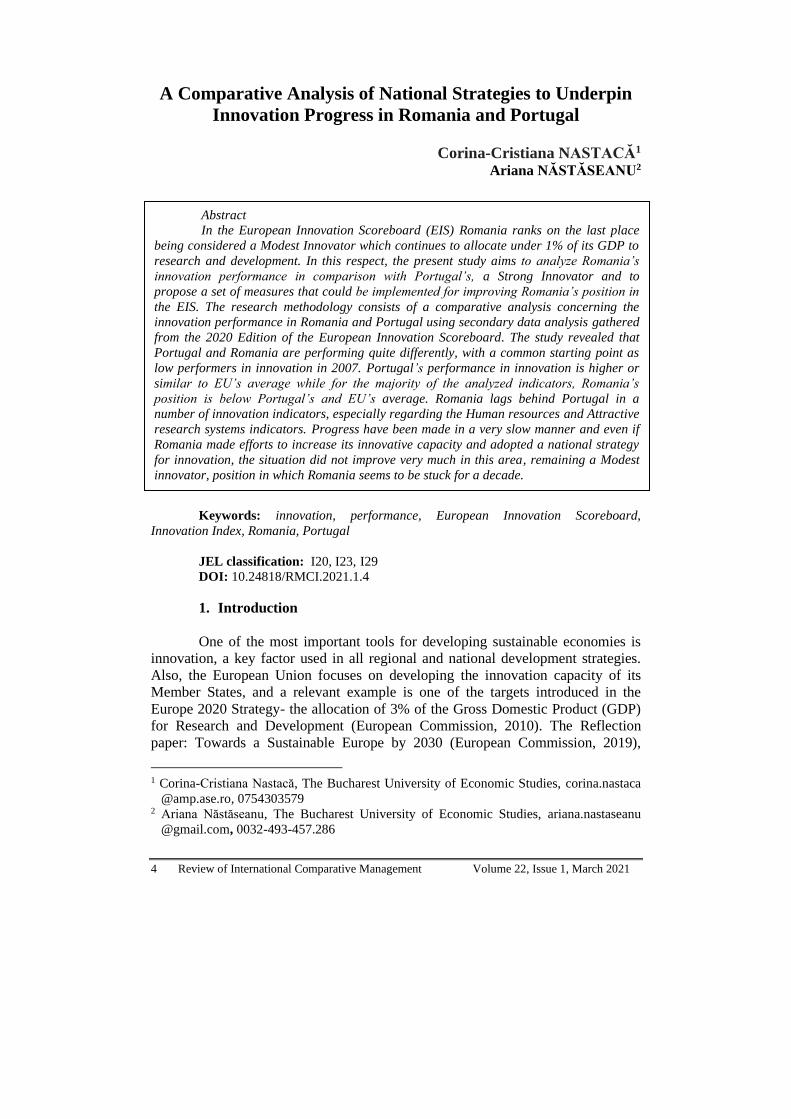
Abstract
In the European Innovation Scoreboard (EIS) Romania ranks on the last place
being considered a Modest Innovator which continues to allocate under 1% of its GDP to
research and development. In this respect, the present study aims to analyze Romania’s
innovation performance in comparison with Portugal’s, a Strong Innovator and to
propose a set of measures that could be implemented for improving Romania’s position in
the EIS. The research methodology consists of a comparative analysis concerning the
innovation performance in Romania and Portugal using secondary data analysis gathered
from the 2020 Edition of the European Innovation Scoreboard. The study revealed that
Portugal and Romania are performing quite differently, with a common starting point as
low performers in innovation in 2007. Portugal’s performance in innovation is higher or
similar to EU’s average while for the majority of the analyzed indicators, Romania’s
position is below Portugal’s and EU’s average. Romania lags behind Portugal in a
number of innovation indicators, especially regarding the Human resources and Attractive
research systems indicators. Progress have been made in a very slow manner and even if
Romania made efforts to increase its innovative capacity and adopted a national strategy
for innovation, the situation did not improve very much in this area, remaining a Modest
innovator, position in which Romania seems to be stuck for a decade.
Review of International Comparative Management Volume 22, Issue 1, March 2021 5
outlines that education, science, technological development, research, and
innovation are essential for a sustainable economy at the European level and even
if progress has been made, the Member States are still far from achieving the 3% of
GDP allocation target in research and development.
The European Union designed Framework Programmes for Research and
Innovation to boost competitiveness and investments as well as to develop
sustainable economies. The problem is that in order to achieve a sustainable
Europe until 2030, besides these framework programs and research and
development finance mechanisms, a strategic approach of investments is needed,
which should allow the introduction of innovative solutions, on the market.
Developing and using innovative solutions presume capital investments with a high
degree of risks and instruments like the European Fund have been designed to help
at lowering the risks of these types of investments (European Commission, 2019).
More than that, the European Innovation Council proposed measures for
supporting companies, innovators, small and top researchers to expand abroad and
achieve intellectual exchanges (European Commission, 2019).
The last report presenting The European Innovation Scoreboard (2020)
showed that the European Union leads over China, Brazil, Russia, South Africa,
and the United States regarding innovation indicators but it is behind states such as
South Korea, Canada, Australia, and Japan. More than that, United Kingdom’s
withdrawal from the EU had a negative impact consisting of a small reduction of
the EU’s average innovation performance (European Commission, 2020).
Considering this situation and the new context caused by the Covid-19
pandemic, the Member States should continue their efforts for supporting
innovation, by financing innovative technologies and companies to become market
leaders with a positive impact on the EU’s transition to sustainability (European
Commission, 2020).
In comparison to the other Member States, Romania is considered a
Modest Innovator which continues to allocate under 1% of its GDP to research and
development, ranking on the last place in the European Innovation Scoreboard.
Even if Romania made efforts to increase its innovative capacity and adopted a
national strategy for innovation, the situation did not improve very much in this
area (Maier et al., 2017, Maier, 2018).
2. Romania’s and Portugal’s innovation policies and performance
The last report on the European Innovation Scoreboard from 2020
(European Commission, 2020), revealed that even with UK’s withdrawal and the
negative consequences of this situation, EU’s innovation performance continued to
increase on average by 8.9% since 2012.
According to the Innovation Index, 24 Member States registered increases
in their innovation performance. The most significant achievements could be
observed in countries such as Lithuania, Malta, Latvia, Portugal, and Greece
(European Commission, 2020). Sweden, Finland, Denmark, and the Netherlands
6 Review of International Comparative Management Volume 22, Issue 1, March 2021
remained innovation leaders (as compared to the previous year) and Luxembourg,
in the past a Strong innovator, upgraded its position and became an Innovation
leader. Major progress was registered by Portugal which evolved from the
Moderate innovators to the Strong innovators group. Romania maintained its
position, remaining in the Modest innovators group (European Commission, 2020).
Regarding Portugal’s situation, it can be observed that the country is
considered a Strong Innovator, ranking in the second position after Norway on the
attractiveness of countries for innovators, with a score of 156.33 (European
Commission, 2020). Several measures and indicators can explain Portugal’s
success in the European innovation ranking. GDP growth resumed in Portugal
in 2014 and has been on an upward trend ever since, reaching 2.6% in
2017, almost catching up with the EU15’s annual growth rate and doubling
between 2016 and 2017 (OECD, 2019). The Portuguese Agency for
Competitiveness and Innovation and SME Investment (IAPMEI) launched several
credit lines since 2008 to facilitate SMEs access to funding. In addition, the
Agency will allocate, in the coming years, EUR 1.7 billion to SMEs as
government-guaranteed credit lines and EUR 100 million in the form of mezzanine
funding to fast-growth firms (The Portuguese Agency for SME and Innovation,
2020). Mezzanine financing is a hybrid of debt and equity financing that gives the
lender the right to convert to an equity interest in the company in case of default,
generally, after venture capital companies and other senior lenders are paid
(Investopedia, 2020).
Portuguese business expenditure on R&D (BERD) as a percentage of GDP
fell from 0.75% to 0.59% of GDP between 2009 and 2014 (OECD, 2020). As of
2016, a set of reforms were designed covering four main dimensions addressing
human resources, institutions, innovation systems and regional economic
development. The main national innovation strategy is the Industrial Development
Strategy for Growth and Employment (Estratégia de Fomento Industrial Para o
Crescimento e o Emprego 2014-2020) developed in 2013 by the Ministry of
Economy (Government of Portugal, 2013).
In 2014 the state support for research and development (R&D) in Portugal
was similar (1,29) in terms of percentage of GDP with the allocation in Spain,
Italy, and Luxemburg which situated between 1,24 and 1,34 % (Eurostat, 2014).
While comparing Portugal’s business R&D expenditure and innovation
output performance, according to OECD data of 2020 these are below the OECD
median, which has a double fold explanation: the country’s specialization in low-
and medium-low-technology industries and the small share of investment in R&D
by large companies compared with other European countries (OECD, 2020). A
dedicated cluster policy has been promoted in some critical areas, such as marine
technologies, and it is expected to be reactivated. Moreover, the
internationalization of firms with innovative potential is of critical relevance for
Portuguese enterprises (Sousa, Ferreira, Vaz, 2019). The area of entrepreneurship
and R&D, one of the strategic axes, is centered on the promotion of co-operation
between science and industry. More recently, the Council of Ministers adopted the

Review of International Comparative Management Volume 22, Issue 1, March 2021 7
Technological and Business Innovation Strategy 2018-2030, partly based on the
aforementioned Portugal knowledge strategy for European convergence (National
Agency of Innovation, 2018).
The Portugal 2020 Partnership Agreement includes several major financing
initiatives to stimulate business R&D and innovation; foster cooperation among
STI actors; and encourage the development of entrepreneurship and innovation in
strategic sectors (European Commission, 2014).
Portugal has lean on EU’s support offered through the Structural Funds as
a source of funding for research and innovation-related activities and created
dedicated management entities and co-ordination bodies to manage Funds
implementation in these fields. An Inter-ministerial Commission for the
coordination of the Partnership Agreement (CIC) has been created, headed by the
minister in charge of the regional development, along with several functional
networks, in areas such as research and innovation, regional economic
development, smart specialization and science, technology and innovation support.
(OECD 2019).
Since joining the European Union, Portugal has received significant
financial support towards innovation and R&D (Santos & Simões, 2014) allowing
the country to improve significantly its position in the European Commission
Regional Innovation Scoreboard rank as it went from a low innovator to a
moderate innovator over the last decade (Faria, Barbosa & Bastos, 2020).
There is a need to support low and mid-tech businesses to develop
Portugal’s internal innovation capacity. The innovation capacity and output of
Portuguese businesses have remained at a low level in international comparison,
partly due to the dominance of SMEs and the weight of traditional sectors in the
economy. Although more could be done to promote engagement with industry
among academic institutions and staff, at present, there are only a limited number
of companies with sufficient ‘absorption capacity’ to collaborate effectively with
academic partners. It is therefore important to support more low and mid-tech
businesses that do not yet innovate significantly and serve mainly regional markets
to develop their internal innovation capacity and exploit the opportunities offered
by cooperation with the academic sector. This could be done through ‘regional
innovation platforms’ that provide domestic SMEs easy access to resources such as
information, expertise, and equipment that allow them to upgrade their innovation
capabilities (OECD, 2019).
Regarding Romania’s position in the European Innovation Scoreboard, it
can be observed that the country ranks the last in The Innovation Index, being
considered a Modest Innovator.
From 2007 (when Romania joined the UE) the innovation performance
mostly increased until 2011 when it started to decline (European Innovation
Scoreboard, 2015). The development of Romania's relative performance to the EU
has closely followed the development of the innovation index. The weakest relative
performance in terms of dimensions in 2015 was registered for Linkages and
entrepreneurship while in terms of indicators the worst relative performance was

8 Review of International Comparative Management Volume 22, Issue 1, March 2021
observed for PCT patent applications and PCT patent applications in societal
challenges. Romania performed similar to the EU average for a number of
indicators, in particular New doctorate graduates, Exports in knowledge-intensive
services and Youth with upper secondary level education (European Innovation
Scoreboard, 2015). In the present, the country’s innovation performance remains
poor, ranking last among Member States (European Commission, 2020).
Investments in employee training and ICT solutions are lower than the EU average
(European Commission, 2020). R&D investment is very low, with an R&D
intensity of 0.51% of its GDP in 2018, well below the 2020 national target of 2%
and the EU average of 2.12%. Public R&D investment was 0.2% of its GDP in
2018. Private expenditure on R&D was only 0.30% of GDP, below the EU’s
average of 1.41% (European Commission, 2020).
The state support for research and development (R&D) in Romania
from 2000 until 2017 remained steadily around 0.5% of the GDP. The situation
since then hasn’t improved and in 2020 Romania allocated to this area only
0.51% of GDP.
In the last European Innovation Scoreboard (European Commission, 2020),
the strongest innovation dimensions were Innovation-friendly environment and
Sales impacts. Romania’s performance was similar to the EU’s average on the
Broadband penetration and Medium and high-tech product exports indicators. The
weakest innovation dimensions were Innovators, Firm investments, and Human
resources. Also, the lowest scores were registered at Lifelong learning, SMEs with
product or process innovations, SMEs with marketing or organizational
innovations, and SMEs innovating in-house indicators. For all four mentioned
indicators Romania performed the worst of all countries (European Commission,
2020).
The RD&I system in Romania consists of 263 public R&D organizations
(56 public universities, 46 national R&D institutes, 65 research institutes and
centers of the Romanian Academy, and another 96 public research institutes and
centers), and about 600 private companies. The network for technology transfer
and innovation (ReNITT) has around 50 specific organizations (technology transfer
centers, technology information centers, technology and business incubators).
The number of R&D personnel in the public sector was approx. 31.500 in
2018. The percentage of researchers per 1000 civil employed persons was 2.02
(OECD, 2018).
To tackle the challenges, a tax exemption on salary incomes for the
personnel involved in CD activities came into force since 2016. The exemption is
granted for all persons included in the team of an RD&I project within the limits
for personnel costs. In the last academic years, the distribution of students by specialization
shows higher weights in certain areas. In 2016-2017, 23.7% of undergraduate students were enrolled in business, administration and law; 21.1% in engineering, processing and construction; and 16% in the health and social assistance group. The lowest numbers are recorded in the following fields: education sciences (3.1%), services (3.7%), and natural sciences, mathematics and statistics (4.1%).
Review of International Comparative Management Volume 22, Issue 1, March 2021 9
The last group is critical for R&D capacity and therefore for the development of technology- and knowledge-intensive sectors.
Romanian Government approved the Third National Research and Development Innovation Plan for 2015-2020 period (Romanian Government, 2015), which is one of the main instruments for the implementation of the National Strategy in this field, comprising five programs of major importance (Romanian Government, 2014):
1. Development of a National Research and Development System (research projects to stimulate young researchers and independent teams, etc.);
2. Increasing the competitiveness of the Romanian economy, providing support for the development of models and solutions for products;
3. European and international cooperation program; 4. Fundamental and frontier research designed to maintain and develop
niche areas; 5. Research in areas of strategic interest, support program led by
institutions with a scientific role for the development of research institutions. The main objectives tap on the transformation of the National RDI system
into a functional, efficient, performance-related one, supported by a critical mass of researchers in the system and developing new generations of international competitive researchers. The Plan foresees to increase effective public funding by pooling resources in areas of economic relevance demonstrating research potential (especially intelligent specialization areas) and stimulating private spending for research, development and innovation through public co-financing to reach, by 2020, a level of 1% of GDP.
On 14 May 2020 the Romanian Government approved the memorandum on the use of the Policy Support Mechanism (PSM) of Horizon 2020, for the evaluation of national policies in the field of research and innovation, governance and institutional architecture, with a view to better integration into the European Research Area. "Policy Support Facility" (PSF), represents the mechanism supporting the reform of national RDI policies, which provides independent support to national public authorities with RDI assignments from experts recognized by the European Commission and is 100% funded by Horizon 2020. With this memorandum, the Government has assumed its peer review through the PSM instrument, which will run for a maximum of one year, the costs being fully covered by the European Commission through Horizon 2020. Following the dialogue with the European Commission, the Ministry of Education and Research assumed implementing the reforms of the PSM, by creating an independent structure with a temporary status organized at the level of the directorate (Romanian Government, 2020).
3. Research Methodology
The purpose of this study is to analyze Romania’s innovation performance
in comparison with Portugal’s, considered to be a Strong Innovator. A set of
indicators were collected and analyzed in order to reveal the major problems and
weaknesses in the Romanian research, development, and innovation area. Also, the
10 Review of International Comparative Management Volume 22, Issue 1, March 2021
research proposes a set of measures that could be implemented for improving
Romania’s position in the European Innovation Scoreboard.
The main objectives of the study are:
1. To investigate Romania’s position in the European Innovation
Scoreboard 2020 and its progress compared with European Union’s average.
2. To compare Romania’s innovation performance with Portugal’s, a
Strong Innovator.
3. To propose measures to improve Romania’s innovative performance
based on the lessons learned from the other European Member States.
The research methodology consists of a comparative analysis concerning
the innovation performance in Romania and Portugal using secondary data
analysis. The data were gathered from the European Innovation Scoreboard – 2020
Edition, for the two selected countries.
The European Innovation Scoreboard (EIS) presents the innovation
performance of the European Member States, other European countries, regional
neighbors, and other selected countries (such as US, Japan, or China), in a
comparative manner, revealing which are the strengths and weaknesses of the
national innovation systems. According to their scores and position in the EIS,
countries can identify their weak spots regarding the innovation systems and the
main areas they need to orientate their actions and innovation policies (European
Commission, 2020). The EIS divides the Member States, based on their average
performance scores into four performance groups: Innovative Leaders, Strong
Innovators, Moderate Innovators, and Modest Innovators. Their innovative
performance is measured through ten innovation dimensions, grouped into four
types of activities. The first activity, namely Framework conditions are based on
three dimensions- Human resources, Attractive research systems, and an
Innovation-friendly environment. The second activity- Investments, covers two
dimensions: Finance and support and Firm investments. The third activity is
Innovation activities and comprises three dimensions- Innovators, Linkages, and
Intellectual assets and the last activity, namely Impacts, is formed by two
dimensions: Employment impacts and Sales impacts. All ten dimensions are
measured using 27 indicators.
All the collected data is presented comparatively, by dimensions and the
indicators which measure them, in order to reveal the differences in innovation
performance between Romania and Portugal and their position compared with the
European Union’s average. The used data is the most recent one, from 2019,
analyzed in the European Innovation Scoreboard- 2020 Edition. The reason for
choosing these particular countries is that Portugal is one of the countries which
registered a major performance increase, despite the circumstances created by the
Covid-19 pandemic, evolving from the Moderate Innovators category in 2019 to
Strong Innovators in 2020. Romania remains a Modest Innovator, being one of the
two countries where the innovation performance decreased the most, along with
Slovenia. In these circumstances, the comparison between two countries situated at
opposite poles, is important, to reveal which are Romania’s weakness and the areas
Review of International Comparative Management Volume 22, Issue 1, March 2021 11
where it should focus its policies and actions to improve its innovation
performance.
4. The main findings of the study regarding Romania’s
and Portugal’s innovation performance
In this chapter, the results of the comparative analysis regarding Romania’s
and Portugal’s innovation performance will be presented. The collected data were
compared by the dimensions and indicators used in the European Innovation
Scoreboard (2020). In addition, all the indicators were compared with EU27’s
average, to outline the differences and similarities between the selected countries’
performance and the innovation performance at the European level.
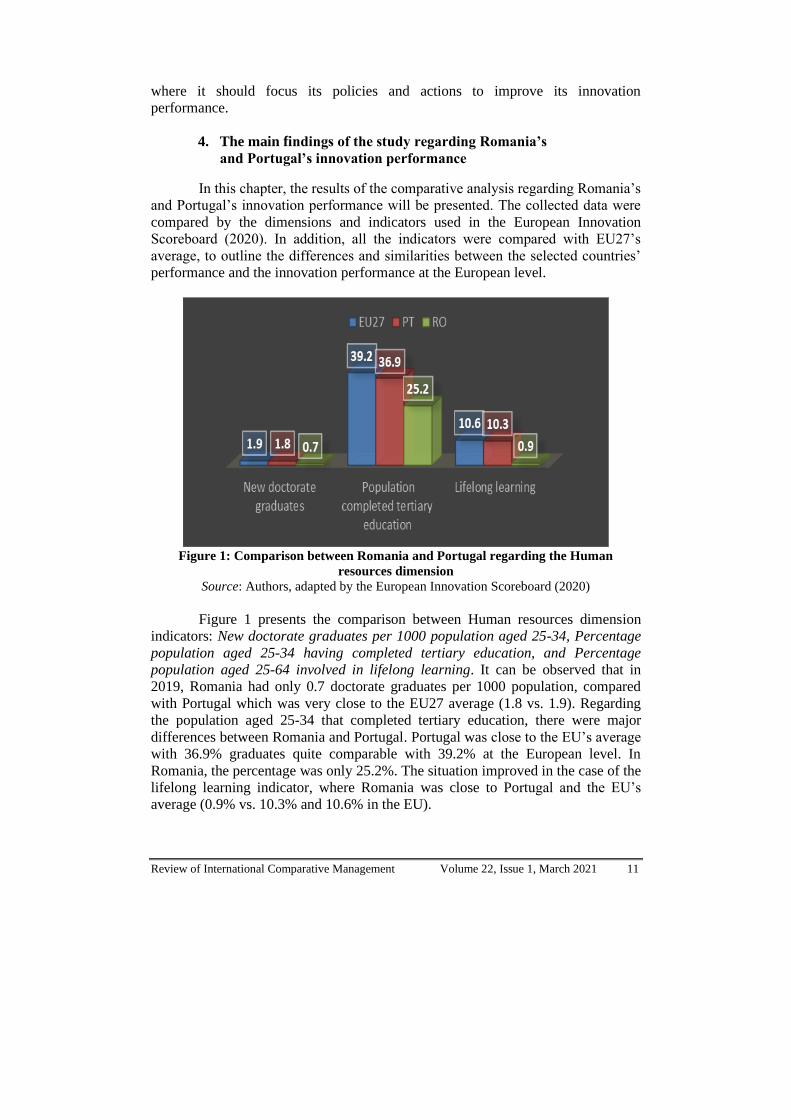
Figure 1: Comparison between Romania and Portugal regarding the Human
resources dimension
Source: Authors, adapted by the European Innovation Scoreboard (2020)
Figure 1 presents the comparison between Human resources dimension
indicators: New doctorate graduates per 1000 population aged 25-34, Percentage
population aged 25-34 having completed tertiary education, and Percentage
population aged 25-64 involved in lifelong learning. It can be observed that in
2019, Romania had only 0.7 doctorate graduates per 1000 population, compared
with Portugal which was very close to the EU27 average (1.8 vs. 1.9). Regarding
the population aged 25-34 that completed tertiary education, there were major
differences between Romania and Portugal. Portugal was close to the EU’s average
with 36.9% graduates quite comparable with 39.2% at the European level. In
Romania, the percentage was only 25.2%. The situation improved in the case of the
lifelong learning indicator, where Romania was close to Portugal and the EU’s
average (0.9% vs. 10.3% and 10.6% in the EU).
12 Review of International Comparative Management Volume 22, Issue 1, March 2021
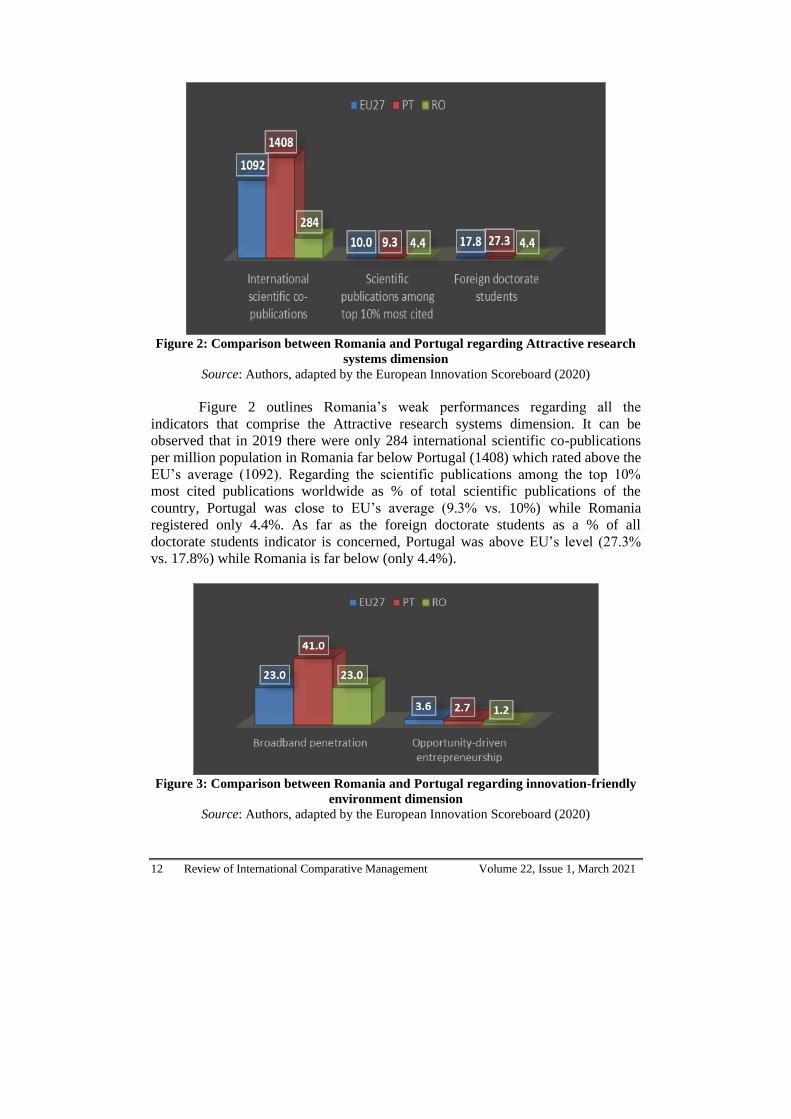
Figure 2: Comparison between Romania and Portugal regarding Attractive research
systems dimension
Source: Authors, adapted by the European Innovation Scoreboard (2020)
Figure 2 outlines Romania’s weak performances regarding all the
indicators that comprise the Attractive research systems dimension. It can be
observed that in 2019 there were only 284 international scientific co-publications
per million population in Romania far below Portugal (1408) which rated above the
EU’s average (1092). Regarding the scientific publications among the top 10%
most cited publications worldwide as % of total scientific publications of the
country, Portugal was close to EU’s average (9.3% vs. 10%) while Romania
registered only 4.4%. As far as the foreign doctorate students as a % of all
doctorate students indicator is concerned, Portugal was above EU’s level (27.3%
vs. 17.8%) while Romania is far below (only 4.4%).
Figure 3: Comparison between Romania and Portugal regarding innovation-friendly
environment dimension
Source: Authors, adapted by the European Innovation Scoreboard (2020)

Review of International Comparative Management Volume 22, Issue 1, March 2021 13
Figure 3 presents the comparison between innovation-friendly environment
indicators, such as Broadband penetration (subscriptions per 100 inhabitants) and
Opportunity-driven entrepreneurship (Motivational index). Regarding broadband
penetration, Romania’s situation was similar to the EU’s average (23%) and below
Portugal’s (41%). As for Opportunity-driven entrepreneurship, the motivational
index was 1.2 for Romania, while Portugal was closer to the EU’s average (2.7 vs.
1.2). At this dimension, Romania had the best performance from all the analyzed
dimensions.
Figure 4: Comparison between Romania and Portugal regarding Finance and support
dimension
Source: Authors, adapted by the European Innovation Scoreboard (2020)
Regarding Finance and support indicators presented in figure 4, it can be
outlined the low level of R&D expenditure in the public sector (% of GDP) in
Romania’s case (0.2%) compared with Portugal’s (0.65%) that was closer to EU
average (0.72%). Regarding Venture capital (% of GDP), Romania’s allocation
was higher than Portugal’s (0.107% vs. 0.099%) and closer to the EU’s average
(0.124%).
Figure 5: Comparison between Romania and Portugal regarding Firm investments
dimension
Source: Authors, adapted by the European Innovation Scoreboard (2020)

14 Review of International Comparative Management Volume 22, Issue 1, March 2021
Figure 5 shows major differences related to Romania’s performance on
Firm investments indicators. It can be observed that the R&D expenditure in the
business sector (% of GDP) was only 0.30% compared with Portugal (0.69%).
Both countries allocated less than the EU’s average (1.45%). Concerning the non-
R&D innovation expenditures (% of turnover), Portugal’s situation was above the
EU’s average (1.02 vs. 0.86) while Romania allocated expenses of only 0.12%.
Regarding the enterprises providing training to develop or upgrade the ICT skills of
their personnel, Portugal was above the European average (28 vs. 23) and Romania
situated far below (6).
Figure 6: Comparison between Romania and Portugal
regarding Innovators dimension
Source: Authors, adapted by the European Innovation Scoreboard (2020)
Regarding the Innovators dimension, it can be observed that Romania’s
performance on the indicators comprising this dimension was very weak.
Portugal’s performance was above the European average at all three indicators and
Romania’s percentage of SMEs introducing product or process innovations, SMEs
which are introducing marketing or organizational innovations, and SMEs
innovating in-house was extremely low (4.6%, 7.4%, and 4.2%).
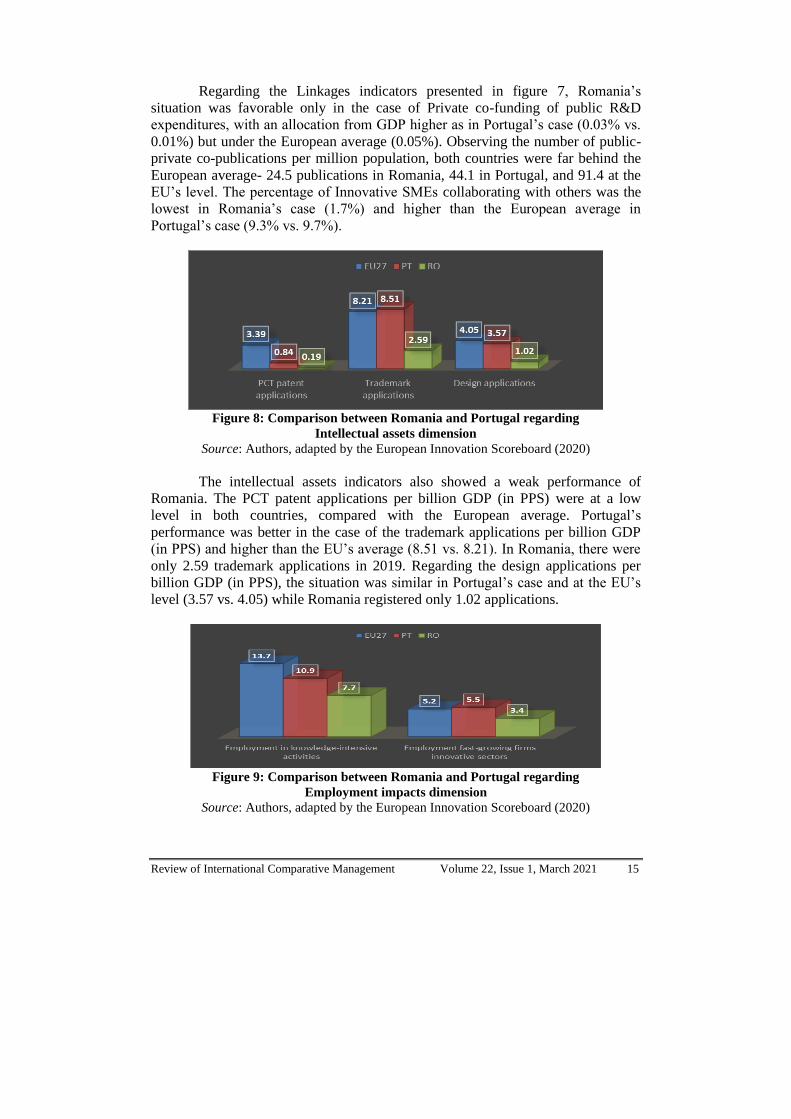
Figure 7: Comparison between Romania and Portugal regarding Linkages dimension
Source: Authors, adapted by the European Innovation Scoreboard (2020)
Review of International Comparative Management Volume 22, Issue 1, March 2021 15
Regarding the Linkages indicators presented in figure 7, Romania’s
situation was favorable only in the case of Private co-funding of public R&D
expenditures, with an allocation from GDP higher as in Portugal’s case (0.03% vs.
0.01%) but under the European average (0.05%). Observing the number of public-
private co-publications per million population, both countries were far behind the
European average- 24.5 publications in Romania, 44.1 in Portugal, and 91.4 at the
EU’s level. The percentage of Innovative SMEs collaborating with others was the
lowest in Romania’s case (1.7%) and higher than the European average in
Portugal’s case (9.3% vs. 9.7%).
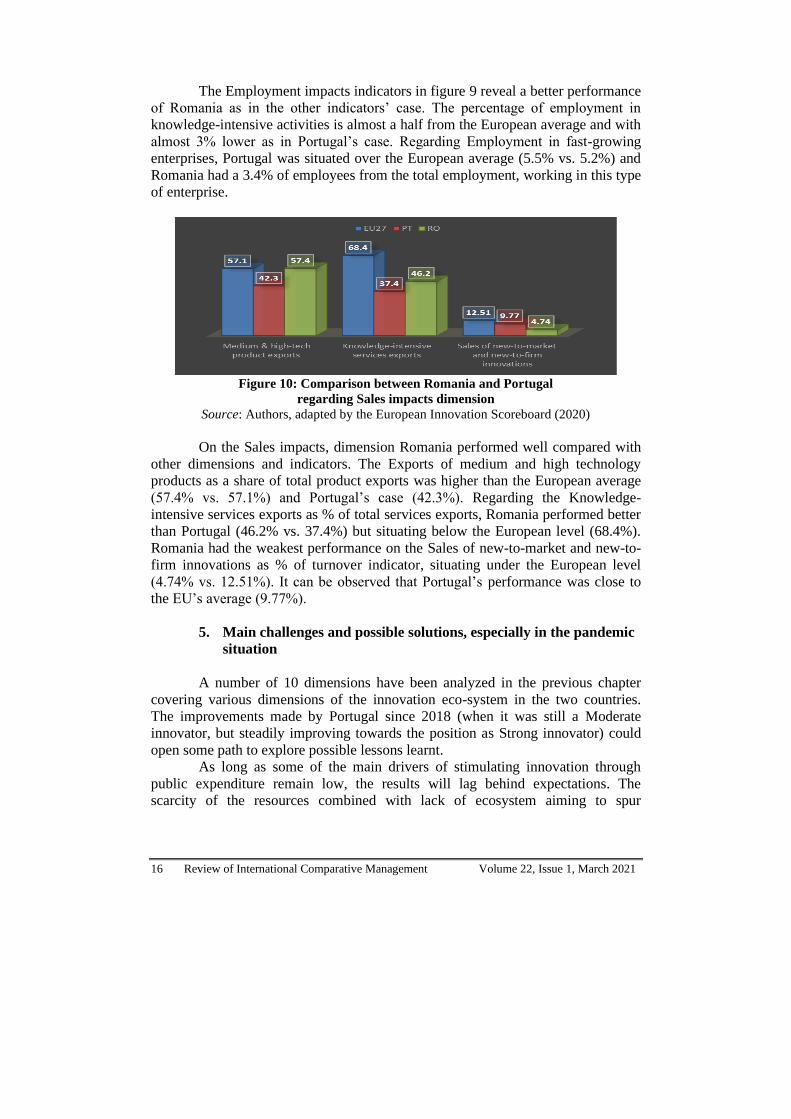
Figure 8: Comparison between Romania and Portugal regarding
Intellectual assets dimension
Source: Authors, adapted by the European Innovation Scoreboard (2020)
The intellectual assets indicators also showed a weak performance of
Romania. The PCT patent applications per billion GDP (in PPS) were at a low
level in both countries, compared with the European average. Portugal’s
performance was better in the case of the trademark applications per billion GDP
(in PPS) and higher than the EU’s average (8.51 vs. 8.21). In Romania, there were
only 2.59 trademark applications in 2019. Regarding the design applications per
billion GDP (in PPS), the situation was similar in Portugal’s case and at the EU’s
level (3.57 vs. 4.05) while Romania registered only 1.02 applications.
Figure 9: Comparison between Romania and Portugal regarding
Employment impacts dimension
Source: Authors, adapted by the European Innovation Scoreboard (2020)
16 Review of International Comparative Management Volume 22, Issue 1, March 2021
The Employment impacts indicators in figure 9 reveal a better performance
of Romania as in the other indicators’ case. The percentage of employment in
knowledge-intensive activities is almost a half from the European average and with
almost 3% lower as in Portugal’s case. Regarding Employment in fast-growing
enterprises, Portugal was situated over the European average (5.5% vs. 5.2%) and
Romania had a 3.4% of employees from the total employment, working in this type
of enterprise.
Figure 10: Comparison between Romania and Portugal
regarding Sales impacts dimension
Source: Authors, adapted by the European Innovation Scoreboard (2020)
On the Sales impacts, dimension Romania performed well compared with
other dimensions and indicators. The Exports of medium and high technology
products as a share of total product exports was higher than the European average
(57.4% vs. 57.1%) and Portugal’s case (42.3%). Regarding the Knowledge-
intensive services exports as % of total services exports, Romania performed better
than Portugal (46.2% vs. 37.4%) but situating below the European level (68.4%).
Romania had the weakest performance on the Sales of new-to-market and new-to-
firm innovations as % of turnover indicator, situating under the European level
(4.74% vs. 12.51%). It can be observed that Portugal’s performance was close to
the EU’s average (9.77%).
5. Main challenges and possible solutions, especially in the pandemic
situation
A number of 10 dimensions have been analyzed in the previous chapter
covering various dimensions of the innovation eco-system in the two countries.
The improvements made by Portugal since 2018 (when it was still a Moderate
innovator, but steadily improving towards the position as Strong innovator) could
open some path to explore possible lessons learnt.
As long as some of the main drivers of stimulating innovation through
public expenditure remain low, the results will lag behind expectations. The
scarcity of the resources combined with lack of ecosystem aiming to spur

Review of International Comparative Management Volume 22, Issue 1, March 2021 17
innovation will continue to negatively impact the gap between the Modest
innovator position in which Romania seems to be stuck for a decade.
Taking into consideration that overall, the economic performance depends
on innovation in general, and especially digital and new frontier technologies, the
productivity boost they could provide at a time when changing demographics are
acting as a drag on growth.
One of the first recovery measures that should be considered to bridge the
gap of the innovation performance is ensuring sufficient public and private
investment for research and innovation. The signal sent by the public sector should
be vigorous, reaching at least 1% of the GDP that could trigger an adequate
response from banks, venture capital companies, and the private investment sector.
Equity finance as a key driver for innovation remains underdeveloped, with 90
percent of the European Union’s venture capital funding concentrated in only eight
member states (Bughin et al., 2019).
A set of measures stimulating the next wave of frontier technologies,
including artificial intelligence, Internet of Things, block-chain, high-power
computing, must be stimulated in view of the potential to deliver the breakthrough
in productivity. The Romanian Academy initiated a "Manifesto for adaptation to
the digital age" i.e. scientific debates on information and communication
technologies (ICT) and artificial intelligence (AI), focusing on their effect on
society as a whole, as well as on the role of robotics in Romanian society.
A third pillar of proposed measures relates to the labor-force and the skills
required by the fast-growing enterprises. The number-one obstacle to investing
more in R&D and digitization is represented by the lack of skills (European
Investment Bank, 2018). Romania as part of the EU has to put in place a plan to try
to prevent the brain-drain phenomenon, fostering international cooperation with
well-known universities and promoting fiscal incentives, which can be effective in
raising R&D, especially when firms face financial constraints. Tax relief for
private R&D is often found to provide a stronger stimulus to business R&D than
direct government support (OECD, 2007). This could include encouraging the
return of high skilled workers who live abroad.
The economic impact of the pandemic is already tangible and will unfold
over a longer time frame. Comparisons with the global financial crisis may go
some way to convey the seriousness of the pandemic, but that crisis will
undoubtedly pale in comparison.
Conclusions and lessons learned
Analyzing the main drivers of the European Innovation Scoreboard 2020,
Portugal and Romania are performing quite differently, with a common starting
point as low performers in innovation in 2007. However, the leap made by Portugal
in 2019-2020 is impressive if one compares the situation of three decades ago. Portugal was recognized by its ‘lack of co-operation culture, the individualistic
behavior of the firms and their human, technological and financial chronic

18 Review of International Comparative Management Volume 22, Issue 1, March 2021
handicaps, the predominance of non-qualified labor pools, the absence of science-
based industries, the lack of investments in R&D and other intangible factors, the
low density and quality of the innovation infrastructures and an erratic innovation
policy’ (Santos & Simões, 2014,). With a large number of research institutions,
some of them with a good scientific reputation and staffed with highly qualified
researchers, nevertheless, the processes of technology transfer to industry steadily
improved recently due to policies oriented towards the creation of transfer
mechanisms, the pressure on public institutions to self-finance their activities and
the increased technological awareness of industry.
Romania however lags behind Portugal in a number of innovation
indicators, but especially regarding the Human resources dimension indicators.
There are major differences between Romania and Portugal regarding the
population aged 25-34 that completed tertiary education, with Portugal is close to
the EU’s average with 36.9% graduates quite comparable with 39.2% at the
European level whilst in Romania the percentage is only 25.2%. Effort should be
made by the public responsible authorities to fill the gap between the EU average
percentages. To summarize, in Romania the public system is too fragmented with
respect to the available funding, struggling with a low administrative capacity.
There are too many strategies suffering from overlaps and discrepancies between
design and implementation, significant degree of fragmentation of the public
system, lack of coordination and communication and insufficient and unpredictable
financing. The financing agencies such as the Executive Unit for Financing Higher
Education, Research, Development and Innovation (UEFISCDI), Romanian Space
Agency (ROSA) and Institute for Atomic Physics (IFA) are managing the
implementation of the National RD&I Plan, however they alone cannot support the
economy to transition towards a knowledge based one.
REFERENCES
1. Bughin, J., Windhagen E., Smit, S., Mischke, J., Sjatil, P. E., Gürich, B., 2019,
Innovation in Europe. Changing the game to regain a competitive edge, McKinsey
Global Institute.
2. European Commission, 2010, EUROPA 2020, O strategie europeană pentru o
creștere inteligentă, ecologică și favorabilă incluziunii, [[Online]], Available at:
https://eur-lex.europa.eu/legal-content/RO/TXT/PDF/?uri=CELEX:52010DC2020
&from=en. [Accessed 20 January 2021].
3. European Commission, 2014, Acordo de parceria 2014-2020, [Online], Available at:
http://www.qren.pt/np4/np4/?newsId=4209&fileName=ACORDO_DE_PARCERIA.
pdf. [Accessed 20 February 2021].
4. European Commission, 2019, REFLECTION PAPER TOWARDS A SUSTAINABLE
EUROPE BY 2030, [Online], Available at: https://ec.europa.eu/info/sites/info/
files/rp_sustainable_europe_30-01_en_web.pdf. [Accessed 27 January 2021].
5. European Commission, 2020, European Innovation Scoreboard 2020, [Online],
Available at: https://ec.europa.eu/docsroom/documents/42981. [Accessed 29 January
2021].
Review of International Comparative Management Volume 22, Issue 1, March 2021 19
6. European Commission, 2015, European Innovation Scoreboard 2015, [Online],
Available at: https://op.europa.eu/en/publication-detail/-/publication/b00c3803-a940-
11e5-b528-01aa75ed71a1. [Accessed 29 January 2021].
7. European Investment Bank, 2018, Investment report 2018/2019: Retooling Europe’s
economy, [Online], Available at: https://www.eib.org/attachments/efs
/economic_investment_report_2018_key_findings_en.pdf. [Accessed 29 January
2021].
8. Eurostat, 2014, Science, Technology and Innovation, [Online], Available at:
https://ec.europa.eu/eurostat/web/science-technology-innovation. [Accessed 27
January 2021].
9. Faria, A.P, Barbosa, N. & Bastos, J., 2020 Portuguese regional innovation systems
efficiency in the European Union context, European Planning Studies, 28(8), pp.
1599-1618, DOI: 10.1080/09654313.2019.1680611.
10. Government of Portugal, 2013, Estratégia de Fomento Industrial Para o Crescimento
e o Emprego 2014-2020, [Online], Available at: https://www.dn.pt/DNMultimedia
/DOCS+PDFS/ECEFI%202013.pdf. [Accessed 27 February 2021].
11. Investopedia, 2020, Mezzanine Financing, [Online], Available at:
https://www.investopedia.com/terms/m/mezzaninefinancing.asp. [Accessed 25
February 2021]. 12. Maier, D., 2018, The Romanian national innovation performance in the EU context,
International Journal of Advanced Engineering and Management Research, 36, pp. 123-131, ISSN: 2456-3676.
13. Maier D., Verjel, A., Bercovici A., & Maier A, 2017. Innovation Management System - a Necessity for Business Performance, 29th International-Business-Information-Management Association Conference, Vienna, Austria, May 03-04, 2017.
14. National Agency of Innovation, 2018, The Technological and Business Innovation Strategy 2018-2030, [Online], Available at: https://dre.pt/application/conteudo/ 114832287. [Accessed 25 February 2021].
15. OECD, 2007, Innovation and Growth, Rationale for an Innovation Strategy, [Online], Available at: https://www.oecd.org/sti/39374789.pdf. [Accessed 25 February 2021].
16. OECD, 2018, Researchers, [Online], Available at: https://data.oecd.org/rd/ researchers.htm. [Accessed 25 February 2021].
17. OECD, 2019, OECD Review of Higher Education, Research and Innovation: Portugal, OECD Publishing, Paris https://www.oecd-ilibrary.org/docserver/9789264308138-en.pdf?expires=1615141463&id=id&accname =oid031827&checksum=103302963949B9ABA2EDFEB8BBB5E3ED
18. OECD, 2020, Main Science and Technology Indicators, Vol. 1, 2020, [Online], Available at: https://www.oecd-ilibrary.org/science-and-technology/business-enterprise-expenditure-on-r-d-berd-as-a-percentage-of-gdp_83b74c19-en. [Accessed 21 January 2021].
19. Romanian Government, 2014, Strategia națională de cercetare, dezvoltare şi inovare 2014 – 2020, [Online], Available at: https://www.edu.ro/sites/default/files/_fi% C8%99iere/Minister/2016/strategii/strategia-cdi-2020_-proiect-hg.pdf. [Accessed 22 February 2021].
20. Romanian Government, 2015, HOTĂRÂRE Nr. 583/2015 din 22 iulie 2015 pentru aprobarea Planului naţional de cercetare-dezvoltare şi inovare pentru perioada 2015 - 2020 (PNCDI III), published in the Official Monitor no. 594 from 6th August 2015, [Online], Available at: https://www.research.gov.ro/uploads/programe-nationale/pn-cdi-iii/hg-583-2015-cu-modificarile-si-completarile-ulterioare.pdf. [Accessed 22 February 2021].

20 Review of International Comparative Management Volume 22, Issue 1, March 2021
21. Romanian Government, 2020, Memorandum, [Online], Available at:
https://www.research.gov.ro/uploads/memorandum/memorandum-psf.pdf. [Accessed
22 February 2021].
22. Santos, D. & Simões, M. J. 2014: Regional innovation systems in Portugal: a critical
evaluation, Investigaciones Regionales, 28, pp. 37-56
23. Sousa M. J, Carla F. & Vaz D., 2019, Innovation Public Policy: The Case of
Portugal, Vol. 6, pp. 14.
24. The Portuguese Agency for SME and Innovation, 2020, Portugal 2020 Support
Schemes, [Online], Available at: https://www.iapmei.pt/Paginas/Financial-support-
Grants-PT2020-Framework.aspx. [Accessed 21 January 2021].