Embed Size (px)
Citation preview
PT SUMMARECON AGUNG Tbk
1
A Company PresentationJUNE 2014
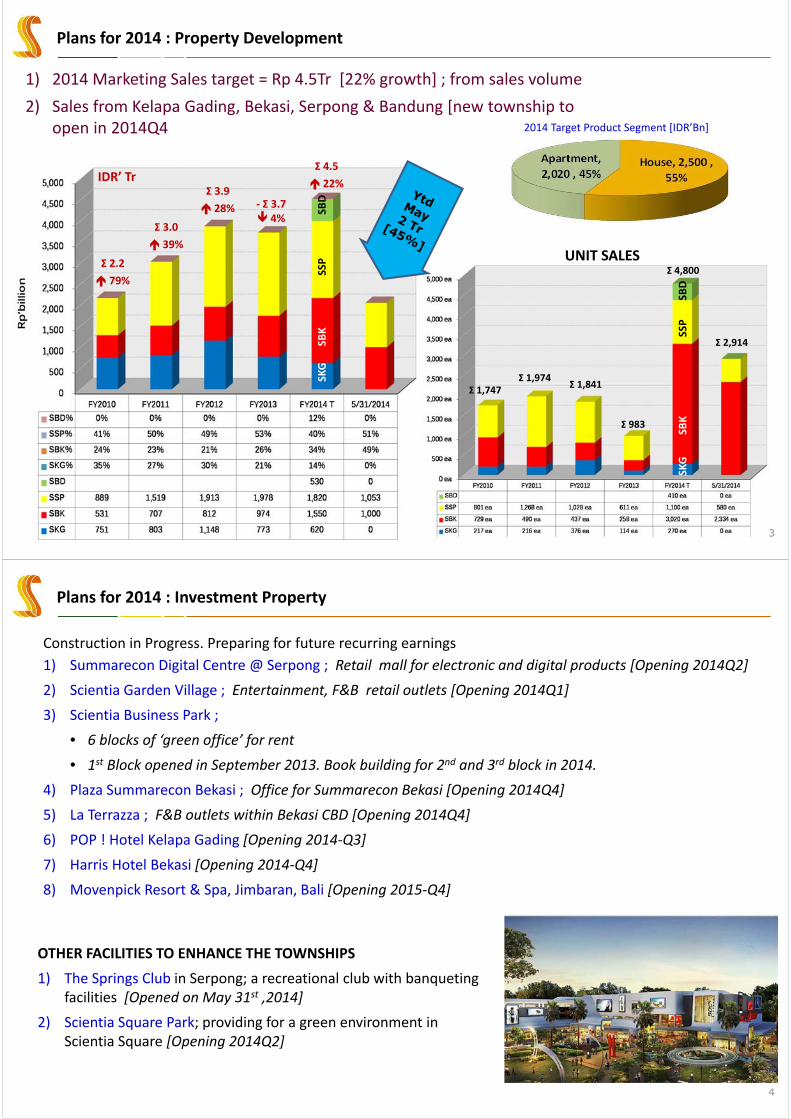
Contents
Slide No.
14. Outlook 43
15. Moving Forward 44
16. Consistent Value to Shareholders 45
17. Contact us 46
18. Disclaimer 47
19. Appendix : Product Specifications 48‐52
Slide No.
1. Plans for 2014 3‐4
2. Corporate Information 5
3. Management 6‐8
4. Principal Activities 9
5. Township Locations 10
6. Summarecon Kelapa Gading 11‐12
7. Summarecon Serpong 13‐16
8. Summarecon Bekasi 17‐18
9. Investment Properties 19‐29
10. Corporate Structure 30
11.1 Income Statement : Consolidated Results 31‐36
11.3 Key Financial Indicators 37
11.4 Land Bank 38
11.5 Capital Investments 39
12. Net Asset Value 40
13. Summarecon’s Competitiveness 41‐42
HO : Plaza Summarecon
2
Plans for 2014 : Property Development
3
1) 2014 Marketing Sales target = Rp 4.5Tr [22% growth] ; from sales volume
2) Sales from Kelapa Gading, Bekasi, Serpong & Bandung [new township to open in 2014Q4
Σ 2.2
79%
Σ 3.0
39%
‐ Σ 3.7 4%
IDR’ TrΣ 3.9
28%
2014 Target Product Segment [IDR’Bn]
Σ 1,974Σ 1,747
Σ 2,914
Σ 1,841
Σ 983
SKG
SBK
SSP SBD
Σ 4,800
Σ 4.5
22%
UNIT SALES
SKG
SBK
SSP SBD
Plans for 2014 : Investment Property
4
Construction in Progress. Preparing for future recurring earnings
1) Summarecon Digital Centre @ Serpong ; Retail mall for electronic and digital products [Opening 2014Q2]
2) Scientia Garden Village ; Entertainment, F&B retail outlets [Opening 2014Q1]
3) Scientia Business Park ;
• 6 blocks of ‘green office’ for rent
• 1st Block opened in September 2013. Book building for 2nd and 3rd block in 2014.
4) Plaza Summarecon Bekasi ; Office for Summarecon Bekasi [Opening 2014Q4]
5) La Terrazza ; F&B outlets within Bekasi CBD [Opening 2014Q4]
6) POP ! Hotel Kelapa Gading [Opening 2014‐Q3]
7) Harris Hotel Bekasi [Opening 2014‐Q4]
8) Movenpick Resort & Spa, Jimbaran, Bali [Opening 2015‐Q4]
OTHER FACILITIES TO ENHANCE THE TOWNSHIPS
1) The Springs Club in Serpong; a recreational club with banqueting facilities [Opened on May 31st ,2014]
2) Scientia Square Park; providing for a green environment in Scientia Square [Opening 2014Q2]
Corporate Information
5
Incorporation Date : 26 Nov 1975 IPO Date : 7 May 1990 Ticker : SMRA.IJ
Share Capital @ 31 May 2014 : Total Shares in Issue = 14,426,781,680 @ Rp 100/share
: Total Paid‐up = Rp 1.44 tr (~USD 125 mn)
Total Value Rupiah per share
Market Capitalisation @ 31 May 2014 : Rp 18.1 tr (~USD 1.6bn) Rp 1,255
Net Book Value : Rp 4.0 tr (~USD 391 mn) Rp 546
NAV (Market/Replacement Cost) : Rp 39.0 tr (~USD 3.4 bn) Rp 2,708
Shareholder Profile @ 31 May 2014 : Founders & Associates ~ 36%
: Public – Local ~ 17 %
: Public – Foreign ~ 47 %
: No. of Shareholders 4,139
Employees : ~ 3,000
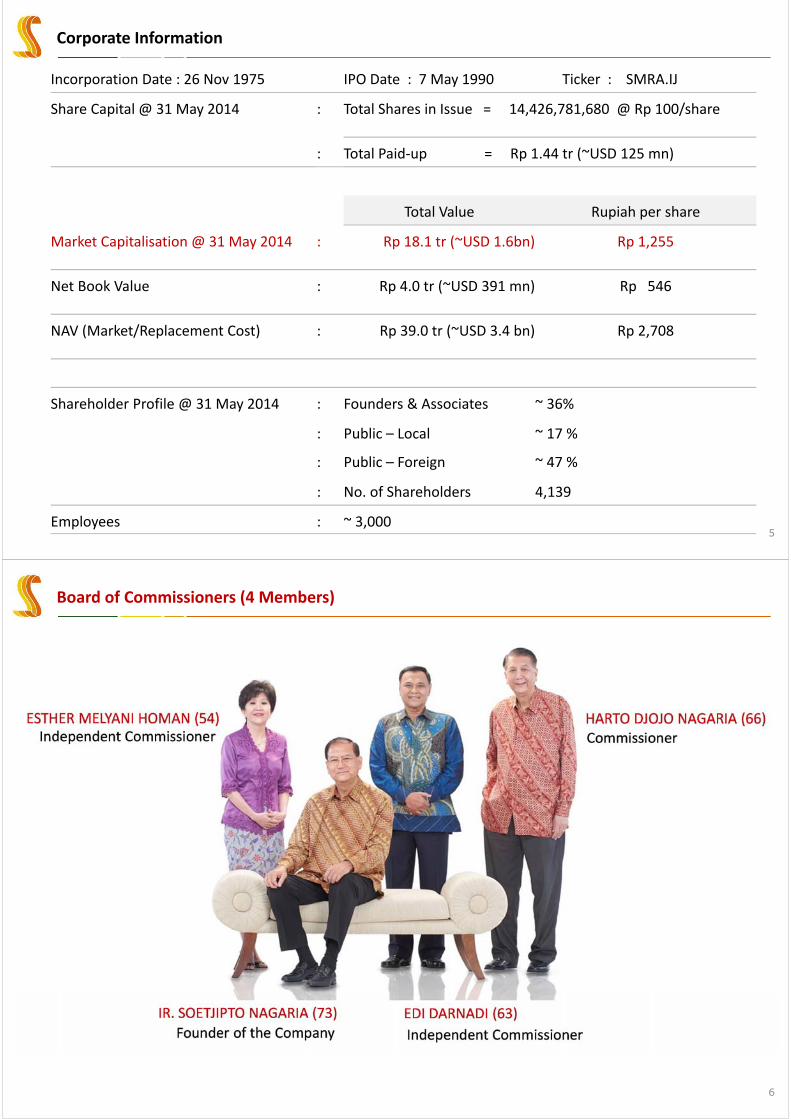
Board of Commissioners (4 Members)
6

7
Board of Directors [9 members] [Pg 1]
8
Board of Directors [9 members] [Pg 2]
JOHANNES MARDJUKI (54)
President Director
Appointed President Director in June 2006. Previously served as Director of Finance and Accounting from 2003. Joined the Company in 1993 as Corporate Secretary. Prior to joining Summarecon, he was the Finance Director of Grup Garuda Mas.
LILIAWATI RAHARDJO (65)
Managing Director
Appointed Director in June 2002. Was a Commissioner from 1992 to 1997, and then the President Commissioner from 1997 to 2001 before assuming an executive role as Managing Director in 2002.
LEXY ARIE TUMIWA (65)
Director ‐ Corporate Services
Appointed Director in June 1993. Previously served as Assistant Director in corporate and operational functions. Joined Company in 1987. Prior to joining Summarecon, he held managerial positions at PT. Ponderosa Pelangi and Holland America Cruises
LILIES YAMIN (60)
Director – Technical & Planning
Appointed Director in June 2006. Previously served as Technical Assistant Director from 2003. Joined the Company in 1981. She has worked as an architect in numerous companies since 1976.
HERMAN NAGARIA (38)
Director – Business & Property Development
Appointed Director in June 2006. Previously served as Assistant Director in Business Development from 2003, and has worked in various managerial positions since joining the Company in 1999.
SHARIF BENYAMIN (53)
Director – Serpong
Appointed Director in June 2013. Joined the Company as Executive Director (operations director) for Serpong in 2005. Worked in the construction industry as an employee and as an entrepreneur contractor from 1985 to 2004.
ADRIANTO PITOYO ADHI (55)
Director – Kelapa Gading, Bekasi
Appointed Director in June 2013. Joined in the Company as Executive Director (operations director) in 2005. Joined PT Metropolitan Land in 1997 as General Manager., then promoted to Director from 2002. From 1986 to 1997, worked in a number of companies in the property industry.
.
SOEGIANTO NAGARIA (41)
Director – Investment Property
Appointed Director in June 2006. Since joining the Company in 1997, he has served in various managerial positions in business development, club management and retail leasing.
YONG KING CHING, Michael (54)
Director – Finance, Corporate Secretary
Appointed Director in May 2010. Joined in 1994 as Company Secretary till 1998, and returned to Company in 2006. Worked in PwC 1979 – 1988, Ernst & Whinney London 1988 – 1990, Bank Dharmala 1990 – 1994, and Hexagon Malaysia in 2000 as FC, then as FD in 2001
Principal Activities
9
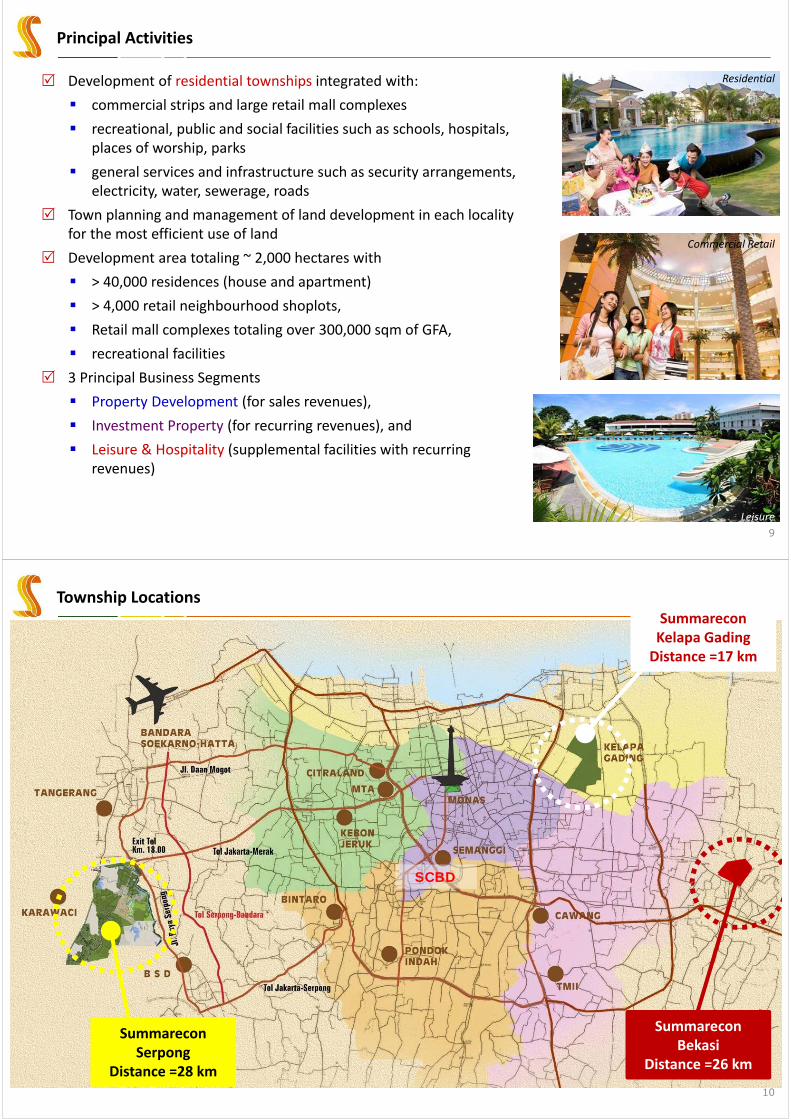
Development of residential townships integrated with:
commercial strips and large retail mall complexes
recreational, public and social facilities such as schools, hospitals, places of worship, parks
general services and infrastructure such as security arrangements, electricity, water, sewerage, roads
Town planning and management of land development in each locality for the most efficient use of land
Development area totaling ~ 2,000 hectares with
> 40,000 residences (house and apartment)
> 4,000 retail neighbourhood shoplots,
Retail mall complexes totaling over 300,000 sqm of GFA,
recreational facilities
3 Principal Business Segments
Property Development (for sales revenues),
Investment Property (for recurring revenues), and
Leisure & Hospitality (supplemental facilities with recurring revenues)
Residential
Commercial Retail
Leisure
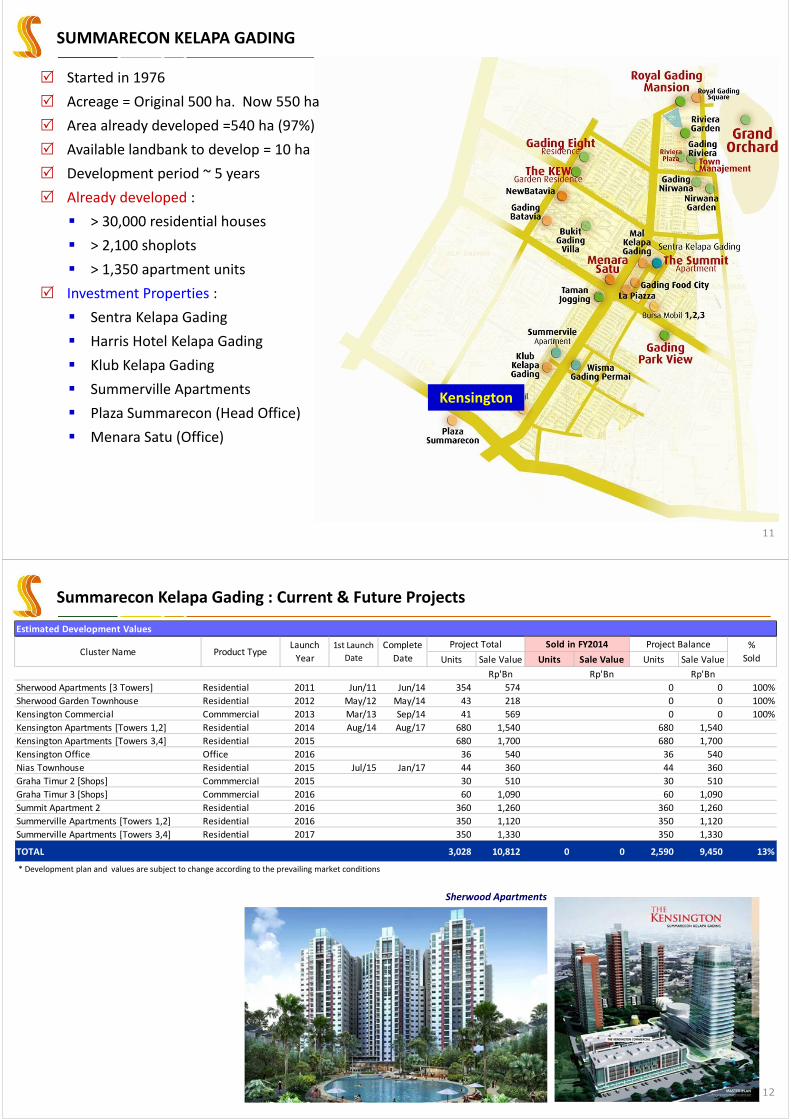
Township Locations
10
SCBD
Summarecon Kelapa GadingDistance =17 km
Summarecon Bekasi
Distance =26 km
Summarecon Serpong
Distance =28 km
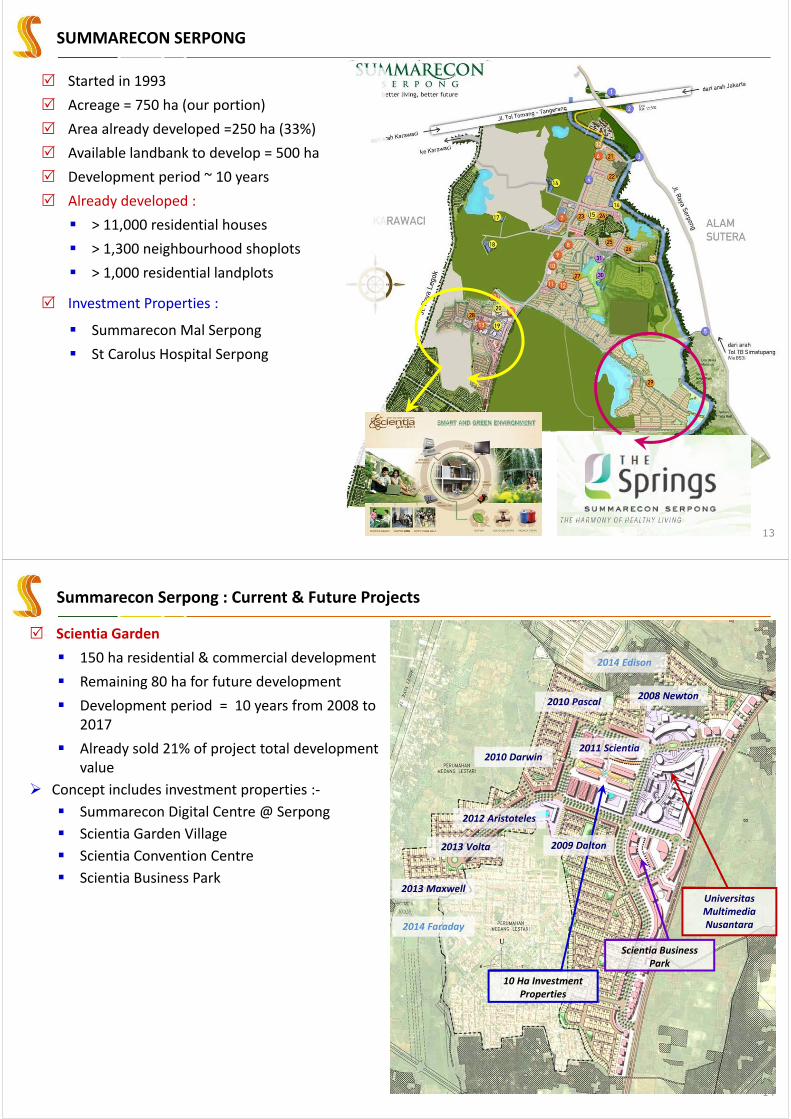
SUMMARECON KELAPA GADING
11
Started in 1976
Acreage = Original 500 ha. Now 550 ha
Area already developed =540 ha (97%)
Available landbank to develop = 10 ha
Development period ~ 5 years
Already developed :
> 30,000 residential houses
> 2,100 shoplots
> 1,350 apartment units
Investment Properties :
Sentra Kelapa Gading
Harris Hotel Kelapa Gading
Klub Kelapa Gading
Summerville Apartments
Plaza Summarecon (Head Office)
Menara Satu (Office)
Kensington
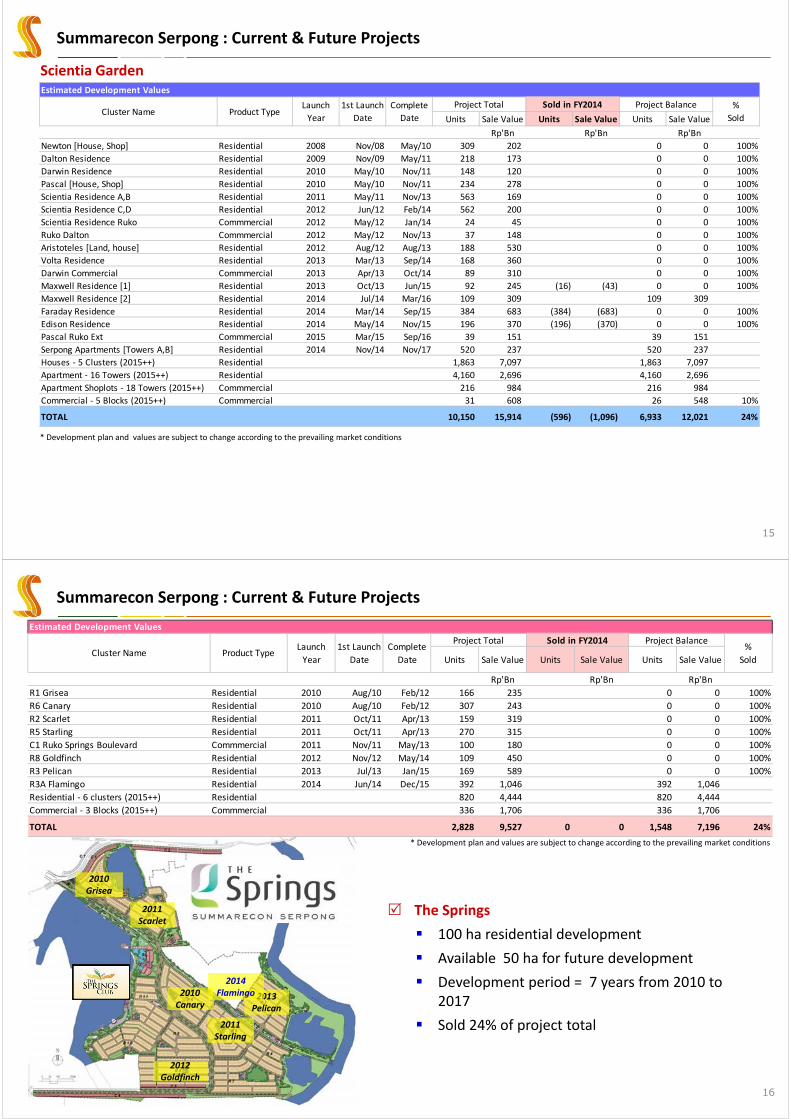
Summarecon Kelapa Gading : Current & Future Projects
12
Sherwood Apartments
* Development plan and values are subject to change according to the prevailing market conditions
Units Sale Value Units Sale Value Units Sale Value
Rp'Bn Rp'Bn Rp'Bn
Sherwood Apartments [3 Towers] Residential 2011 Jun/11 Jun/14 354 574 0 0 0 0 100%
Sherwood Garden Townhouse Residential 2012 May/12 May/14 43 218 0 0 0 0 100%
Kensington Commercial Commmercial 2013 Mar/13 Sep/14 41 569 0 0 0 0 100%
Kensington Apartments [Towers 1,2] Residential 2014 Aug/14 Aug/17 680 1,540 0 0 680 1,540 0%
Kensington Apartments [Towers 3,4] Residential 2015 Apr/15 Apr/18 680 1,700 0 0 680 1,700 0%
Kensington Office Office 2016 Jun/16 Jun/19 36 540 0 0 36 540 0%
Nias Townhouse Residential 2015 Jul/15 Jan/17 44 360 0 0 44 360 0%
Graha Timur 2 [Shops] Commmercial 2015 Jul/15 Jan/17 30 510 0 0 30 510 0%
Graha Timur 3 [Shops] Commmercial 2016 Jul/16 Jan/18 60 1,090 0 0 60 1,090 0%
Summit Apartment 2 Residential 2016 Feb/16 Feb/19 360 1,260 0 0 360 1,260 0%
Summerville Apartments [Towers 1,2] Residential 2016 Nov/16 Nov/19 350 1,120 0 0 350 1,120 0%
Summerville Apartments [Towers 3,4] Residential 2017 May/17 May/20 350 1,330 0 0 350 1,330 0%
TOTAL 3,028 10,812 0 0 2,590 9,450 13%
Estimated Development Values
Cluster Name%
SoldProduct Type
Launch
Year
1st Launch
Date
Project Total Sold in FY2014Complete
Date
Project Balance
SUMMARECON SERPONG
13
Started in 1993
Acreage = 750 ha (our portion)
Area already developed =250 ha (33%)
Available landbank to develop = 500 ha
Development period ~ 10 years
Already developed :
> 11,000 residential houses
> 1,300 neighbourhood shoplots
> 1,000 residential landplots
Investment Properties :
Summarecon Mal Serpong
St Carolus Hospital Serpong
Summarecon Serpong : Current & Future Projects
14
Scientia Garden
150 ha residential & commercial development
Remaining 80 ha for future development
Development period = 10 years from 2008 to 2017
Already sold 21% of project total development value
Concept includes investment properties :‐
Summarecon Digital Centre @ Serpong
Scientia Garden Village
Scientia Convention Centre
Scientia Business Park
10 Ha Investment Properties
UniversitasMultimedia Nusantara
2010 Pascal
2010 Darwin2011 Scientia
2009 Dalton
2008 Newton
2012 Aristoteles
2013 Volta
Scientia Business Park
2013 Maxwell
2014 Faraday
2014 Edison
Summarecon Serpong : Current & Future Projects
15
* Development plan and values are subject to change according to the prevailing market conditions
Scientia Garden
Units Sale Value Units Sale Value Units Sale Value
Rp'Bn Rp'Bn Rp'Bn
Newton [House, Shop] Residential 2008 Nov/08 May/10 309 202 0 0 0 0 100%
Dalton Residence Residential 2009 Nov/09 May/11 218 173 0 0 0 0 100%
Darwin Residence Residential 2010 May/10 Nov/11 148 120 0 0 0 0 100%
Pascal [House, Shop] Residential 2010 May/10 Nov/11 234 278 0 0 0 0 100%
Scientia Residence A,B Residential 2011 May/11 Nov/13 563 169 0 0 0 0 100%
Scientia Residence C,D Residential 2012 Jun/12 Feb/14 562 200 0 0 0 0 100%
Scientia Residence Ruko Commmercial 2012 May/12 Jan/14 24 45 0 0 0 0 100%
Ruko Dalton Commmercial 2012 May/12 Nov/13 37 148 0 0 0 0 100%
Aristoteles [Land, house] Residential 2012 Aug/12 Aug/13 188 530 0 0 0 0 100%
Volta Residence Residential 2013 Mar/13 Sep/14 168 360 0 0 100%
Darwin Commercial Commmercial 2013 Apr/13 Oct/14 89 310 0 0 100%
Maxwell Residence [1] Residential 2013 Oct/13 Jun/15 92 245 (16) (43) 0 0 100%
Maxwell Residence [2] Residential 2014 Jul/14 Mar/16 109 309 0 109 309 0%
Faraday Residence Residential 2014 Mar/14 Sep/15 384 683 (384) (683) 0 0 100%
Edison Residence Residential 2014 May/14 Nov/15 196 370 (196) (370) 0 0 100%
Pascal Ruko Ext Commmercial 2015 Mar/15 Sep/16 39 151 0 0 39 151 0%
Serpong Apartments [Towers A,B] Residential 2014 Nov/14 Nov/17 520 237 0 0 520 237 0%
Houses ‐ 5 Clusters (2015++) Residential Jan/14 Jul/15 1,863 7,097 1,863 7,097 0%
Apartment ‐ 16 Towers (2015++) Residential 4,160 2,696 4,160 2,696
Apartment Shoplots ‐ 18 Towers (2015++) Commmercial 216 984 216 984
Commercial ‐ 5 Blocks (2015++) Commmercial Jan/14 Jul/15 31 608 26 548 10%
TOTAL 10,150 15,914 (596) (1,096) 6,933 12,021 24%
Launch
Year
%
SoldCluster Name
1st Launch
Date
Project BalanceProduct Type
Complete
Date
Estimated Development Values
Project Total Sold in FY2014
Summarecon Serpong : Current & Future Projects
16
* Development plan and values are subject to change according to the prevailing market conditions
The Springs
100 ha residential development
Available 50 ha for future development
Development period = 7 years from 2010 to 2017
Sold 24% of project total
2010 Canary
2010 Grisea
2011 Scarlet
2011 Starling
2012 Goldfinch
2013 Pelican
2014 Flamingo
Units Sale Value Units Sale Value Units Sale Value
Rp'Bn Rp'Bn Rp'Bn
R1 Grisea Residential 2010 Aug/10 Feb/12 166 235 0 0 0 0 100%
R6 Canary Residential 2010 Aug/10 Feb/12 307 243 0 0 0 0 100%
R2 Scarlet Residential 2011 Oct/11 Apr/13 159 319 0 0 0 0 100%
R5 Starling Residential 2011 Oct/11 Apr/13 270 315 0 0 0 0 100%
C1 Ruko Springs Boulevard Commmercial 2011 Nov/11 May/13 100 180 0 0 0 0 100%
R8 Goldfinch Residential 2012 Nov/12 May/14 109 450 0 0 0 0 100%
R3 Pelican Residential 2013 Jul/13 Jan/15 169 589 0 0 0 0 100%
R3A Flamingo Residential 2014 Jun/14 Dec/15 392 1,046 0 0 392 1,046 0%
Residential ‐ 6 clusters (2015++) Residential Jan/14 Jan/14 820 4,444 0 0 820 4,444 0%
Commercial ‐ 3 Blocks (2015++) Commmercial Jan/14 Jan/14 336 1,706 0 0 336 1,706 0%
TOTAL 2,828 9,527 0 0 1,548 7,196 24%
Complete
Date
%
Sold
Sold in FY2014Launch
Year
Project Balance
Cluster Name
Estimated Development Values
Project Total
Product Type1st Launch
Date
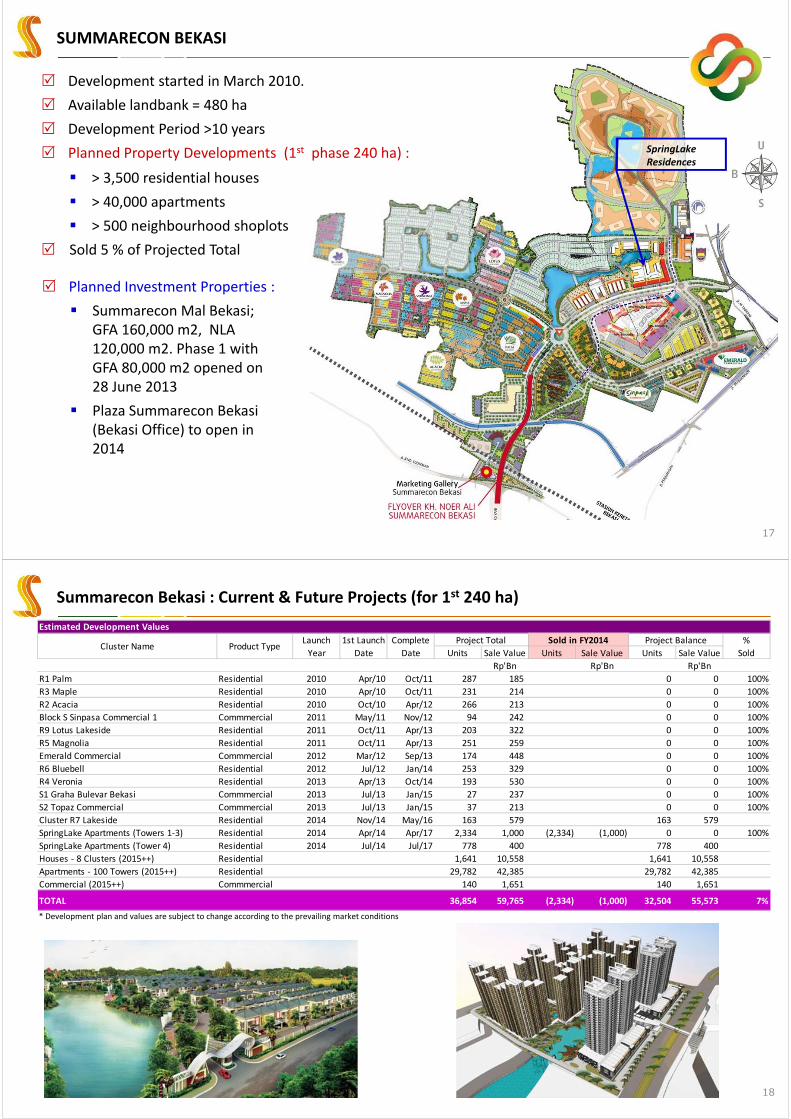
SUMMARECON BEKASI
17
Development started in March 2010.
Available landbank = 480 ha
Development Period >10 years
Planned Property Developments (1st phase 240 ha) :
> 3,500 residential houses
> 40,000 apartments
> 500 neighbourhood shoplots
Sold 5 % of Projected Total
Planned Investment Properties :
Summarecon Mal Bekasi; GFA 160,000 m2, NLA120,000 m2. Phase 1 with GFA 80,000 m2 opened on 28 June 2013
Plaza Summarecon Bekasi (Bekasi Office) to open in 2014
SpringLakeResidences
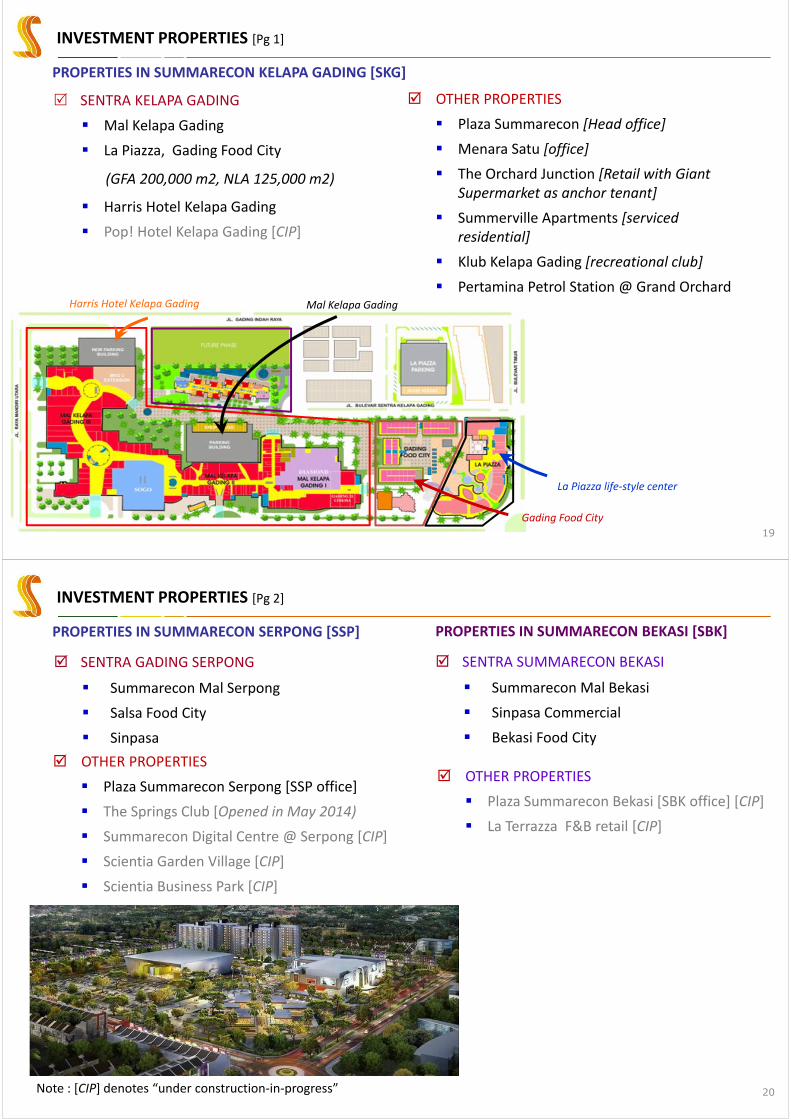
Summarecon Bekasi : Current & Future Projects (for 1st 240 ha)
18
* Development plan and values are subject to change according to the prevailing market conditions
Units Sale Value Units Sale Value Units Sale Value
Rp'Bn Rp'Bn Rp'Bn
R1 Palm Residential 2010 Apr/10 Oct/11 287 185 0 0 0 0 100%
R3 Maple Residential 2010 Apr/10 Oct/11 231 214 0 0 0 0 100%
R2 Acacia Residential 2010 Oct/10 Apr/12 266 213 0 0 0 0 100%
Block S Sinpasa Commercial 1 Commmercial 2011 May/11 Nov/12 94 242 0 0 0 0 100%
R9 Lotus Lakeside Residential 2011 Oct/11 Apr/13 203 322 0 0 0 0 100%
R5 Magnolia Residential 2011 Oct/11 Apr/13 251 259 0 0 0 0 100%
Emerald Commercial Commmercial 2012 Mar/12 Sep/13 174 448 0 0 0 0 100%
R6 Bluebell Residential 2012 Jul/12 Jan/14 253 329 0 0 0 0 100%
R4 Veronia Residential 2013 Apr/13 Oct/14 193 530 0 0 0 0 100%
S1 Graha Bulevar Bekasi Commmercial 2013 Jul/13 Jan/15 27 237 0 0 0 0 100%
S2 Topaz Commercial Commmercial 2013 Jul/13 Jan/15 37 213 0 0 0 0 100%
Cluster R7 Lakeside Residential 2014 Nov/14 May/16 163 579 0 0 163 579 0%
SpringLake Apartments (Towers 1‐3) Residential 2014 Apr/14 Apr/17 2,334 1,000 (2,334) (1,000) 0 0 100%
SpringLake Apartments (Tower 4) Residential 2014 Jul/14 Jul/17 778 400 0 0 778 400 0%
Houses ‐ 8 Clusters (2015++) Residential Jan/14 1,641 10,558 0 0 1,641 10,558 0%
Apartments ‐ 100 Towers (2015++) Residential Jan/14 29,782 42,385 29,782 42,385 0%
Commercial (2015++) Commmercial Jan/14 140 1,651 0 0 140 1,651 0%
TOTAL 36,854 59,765 (2,334) (1,000) 32,504 55,573 7%
Complete
Date
%
Sold
Project TotalCluster Name
1st Launch
Date
Sold in FY2014 Project BalanceLaunch
YearProduct Type
Estimated Development Values
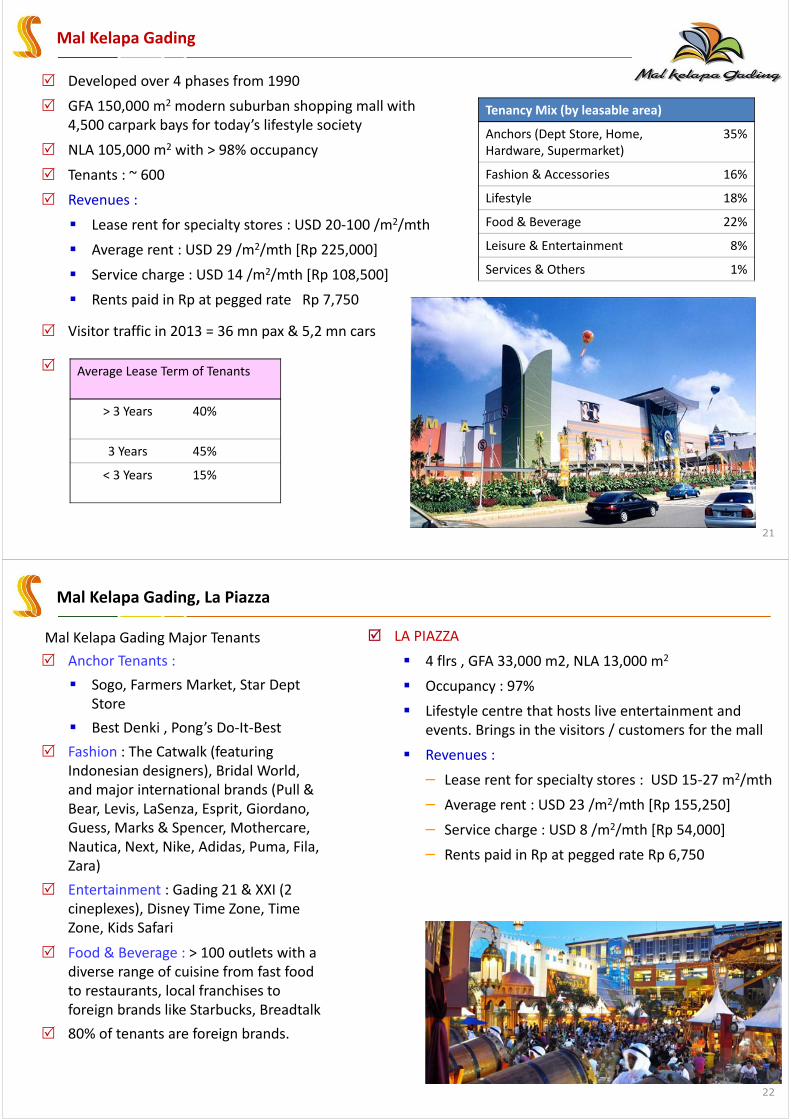
INVESTMENT PROPERTIES [Pg 1]
19
SENTRA KELAPA GADING
Mal Kelapa Gading
La Piazza, Gading Food City
(GFA 200,000 m2, NLA 125,000 m2)
Harris Hotel Kelapa Gading
Pop! Hotel Kelapa Gading [CIP]
OTHER PROPERTIES
Plaza Summarecon [Head office]
Menara Satu [office]
The Orchard Junction [Retail with Giant Supermarket as anchor tenant]
Summerville Apartments [serviced residential]
Klub Kelapa Gading [recreational club]
Pertamina Petrol Station @ Grand OrchardHarris Hotel Kelapa Gading
La Piazza life‐style center
Gading Food City
Mal Kelapa Gading
PROPERTIES IN SUMMARECON KELAPA GADING [SKG]
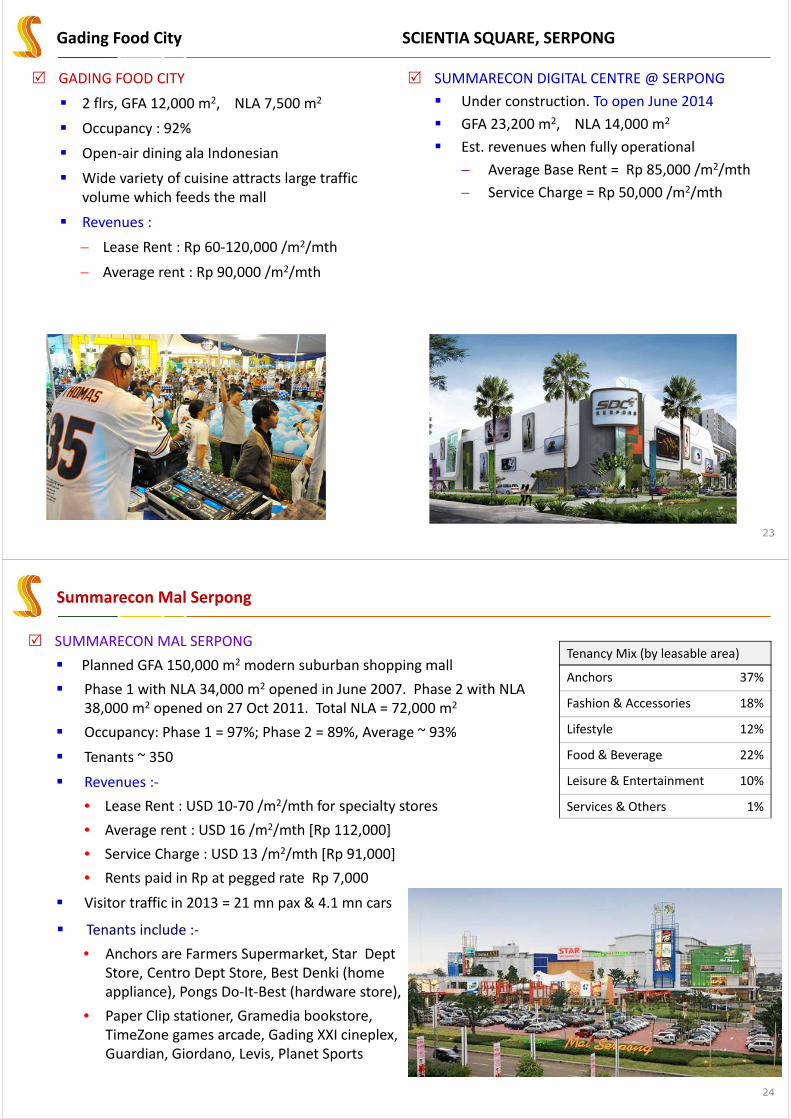
INVESTMENT PROPERTIES [Pg 2]
20
SENTRA GADING SERPONG
Summarecon Mal Serpong
Salsa Food City
Sinpasa
PROPERTIES IN SUMMARECON SERPONG [SSP]
OTHER PROPERTIES
Plaza Summarecon Serpong [SSP office]
The Springs Club [Opened in May 2014)
Summarecon Digital Centre @ Serpong [CIP]
Scientia Garden Village [CIP]
Scientia Business Park [CIP]
PROPERTIES IN SUMMARECON BEKASI [SBK]
SENTRA SUMMARECON BEKASI
Summarecon Mal Bekasi
Sinpasa Commercial
Bekasi Food City
OTHER PROPERTIES
Plaza Summarecon Bekasi [SBK office] [CIP]
La Terrazza F&B retail [CIP]
Note : [CIP] denotes “under construction‐in‐progress”
Mal Kelapa Gading
21
Developed over 4 phases from 1990
GFA 150,000 m2 modern suburban shopping mall with 4,500 carpark bays for today’s lifestyle society
NLA 105,000 m2 with > 98% occupancy
Tenants : ~ 600
Revenues :
Lease rent for specialty stores : USD 20‐100 /m2/mth
Average rent : USD 29 /m2/mth [Rp 225,000]
Service charge : USD 14 /m2/mth [Rp 108,500]
Rents paid in Rp at pegged rate Rp 7,750
Visitor traffic in 2013 = 36 mn pax & 5,2 mn cars
. Average Lease Term of Tenants
> 3 Years 40%
3 Years 45%
< 3 Years 15%
Tenancy Mix (by leasable area)
Anchors (Dept Store, Home, Hardware, Supermarket)
35%
Fashion & Accessories 16%
Lifestyle 18%
Food & Beverage 22%
Leisure & Entertainment 8%
Services & Others 1%
Mal Kelapa Gading, La Piazza
22
Anchor Tenants :
Sogo, Farmers Market, Star DeptStore
Best Denki , Pong’s Do‐It‐Best
Fashion : The Catwalk (featuring Indonesian designers), Bridal World, and major international brands (Pull & Bear, Levis, LaSenza, Esprit, Giordano, Guess, Marks & Spencer, Mothercare, Nautica, Next, Nike, Adidas, Puma, Fila, Zara)
Entertainment : Gading 21 & XXI (2 cineplexes), Disney Time Zone, Time Zone, Kids Safari
Food & Beverage : > 100 outlets with a diverse range of cuisine from fast food to restaurants, local franchises to foreign brands like Starbucks, Breadtalk
80% of tenants are foreign brands.
Mal Kelapa Gading Major Tenants LA PIAZZA
4 flrs , GFA 33,000 m2, NLA 13,000 m2
Occupancy : 97%
Lifestyle centre that hosts live entertainment and events. Brings in the visitors / customers for the mall
Revenues :
− Lease rent for specialty stores : USD 15‐27 m2/mth
− Average rent : USD 23 /m2/mth [Rp 155,250]
− Service charge : USD 8 /m2/mth [Rp 54,000]
− Rents paid in Rp at pegged rate Rp 6,750
Gading Food City SCIENTIA SQUARE, SERPONG
SUMMARECON DIGITAL CENTRE @ SERPONG
Under construction. To open June 2014
GFA 23,200 m2, NLA 14,000 m2
Est. revenues when fully operational
Average Base Rent = Rp 85,000 /m2/mth
Service Charge = Rp 50,000 /m2/mth
23
GADING FOOD CITY
2 flrs, GFA 12,000 m2, NLA 7,500 m2
Occupancy : 92%
Open‐air dining ala Indonesian
Wide variety of cuisine attracts large traffic volume which feeds the mall
Revenues :
Lease Rent : Rp 60‐120,000 /m2/mth
Average rent : Rp 90,000 /m2/mth
Summarecon Mal Serpong
24
Tenancy Mix (by leasable area)
Anchors 37%
Fashion & Accessories 18%
Lifestyle 12%
Food & Beverage 22%
Leisure & Entertainment 10%
Services & Others 1%
SUMMARECON MAL SERPONG
Planned GFA 150,000 m2 modern suburban shopping mall
Phase 1 with NLA 34,000 m2 opened in June 2007. Phase 2 with NLA 38,000 m2 opened on 27 Oct 2011. Total NLA = 72,000 m2
Occupancy: Phase 1 = 97%; Phase 2 = 89%, Average ~ 93%
Tenants ~ 350
Revenues :‐
• Lease Rent : USD 10‐70 /m2/mth for specialty stores
• Average rent : USD 16 /m2/mth [Rp 112,000]
• Service Charge : USD 13 /m2/mth [Rp 91,000]
• Rents paid in Rp at pegged rate Rp 7,000
Visitor traffic in 2013 = 21 mn pax & 4.1 mn cars
.Tenants include :‐
• Anchors are Farmers Supermarket, Star DeptStore, Centro Dept Store, Best Denki (home appliance), Pongs Do‐It‐Best (hardware store),
• Paper Clip stationer, Gramedia bookstore, TimeZone games arcade, Gading XXI cineplex, Guardian, Giordano, Levis, Planet Sports
Summarecon Mal Bekasi
25
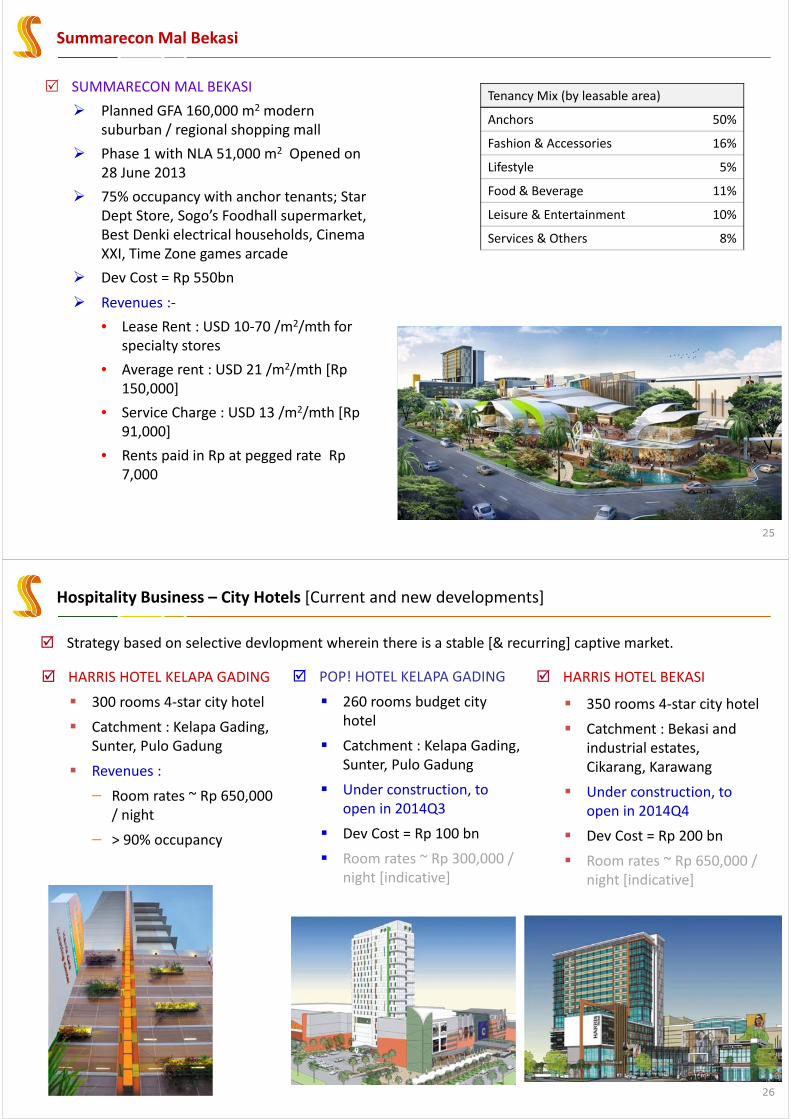
SUMMARECON MAL BEKASI
Planned GFA 160,000 m2 modern suburban / regional shopping mall
Phase 1 with NLA 51,000 m2 Opened on 28 June 2013
75% occupancy with anchor tenants; Star Dept Store, Sogo’s Foodhall supermarket, Best Denki electrical households, Cinema XXI, Time Zone games arcade
Dev Cost = Rp 550bn
Revenues :‐
• Lease Rent : USD 10‐70 /m2/mth for specialty stores
• Average rent : USD 21 /m2/mth [Rp 150,000]
• Service Charge : USD 13 /m2/mth [Rp 91,000]
• Rents paid in Rp at pegged rate Rp 7,000
Tenancy Mix (by leasable area)
Anchors 50%
Fashion & Accessories 16%
Lifestyle 5%
Food & Beverage 11%
Leisure & Entertainment 10%
Services & Others 8%
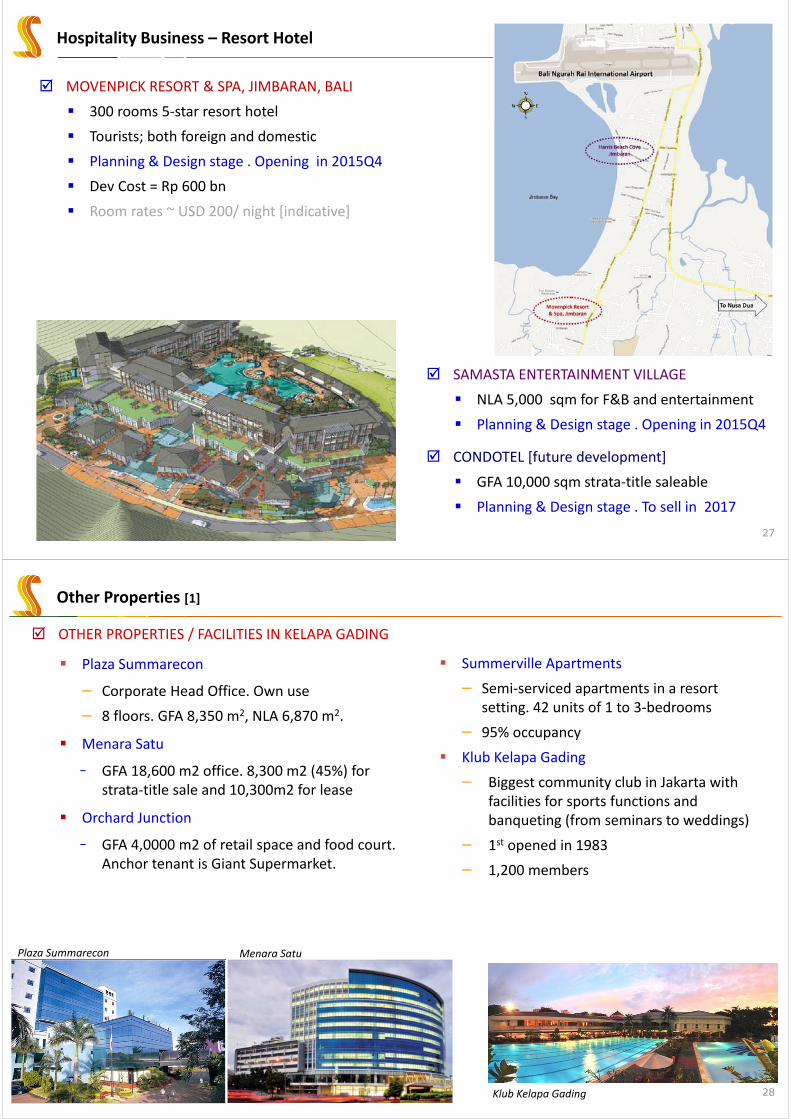
Hospitality Business – City Hotels [Current and new developments]
26
HARRIS HOTEL KELAPA GADING
300 rooms 4‐star city hotel
Catchment : Kelapa Gading, Sunter, Pulo Gadung
Revenues :
− Room rates ~ Rp 650,000 / night
− > 90% occupancy
Strategy based on selective devlopment wherein there is a stable [& recurring] captive market.
POP! HOTEL KELAPA GADING
260 rooms budget city hotel
Catchment : Kelapa Gading, Sunter, Pulo Gadung
Under construction, to open in 2014Q3
Dev Cost = Rp 100 bn
Room rates ~ Rp 300,000 / night [indicative]
HARRIS HOTEL BEKASI
350 rooms 4‐star city hotel
Catchment : Bekasi and industrial estates, Cikarang, Karawang
Under construction, to open in 2014Q4
Dev Cost = Rp 200 bn
Room rates ~ Rp 650,000 / night [indicative]
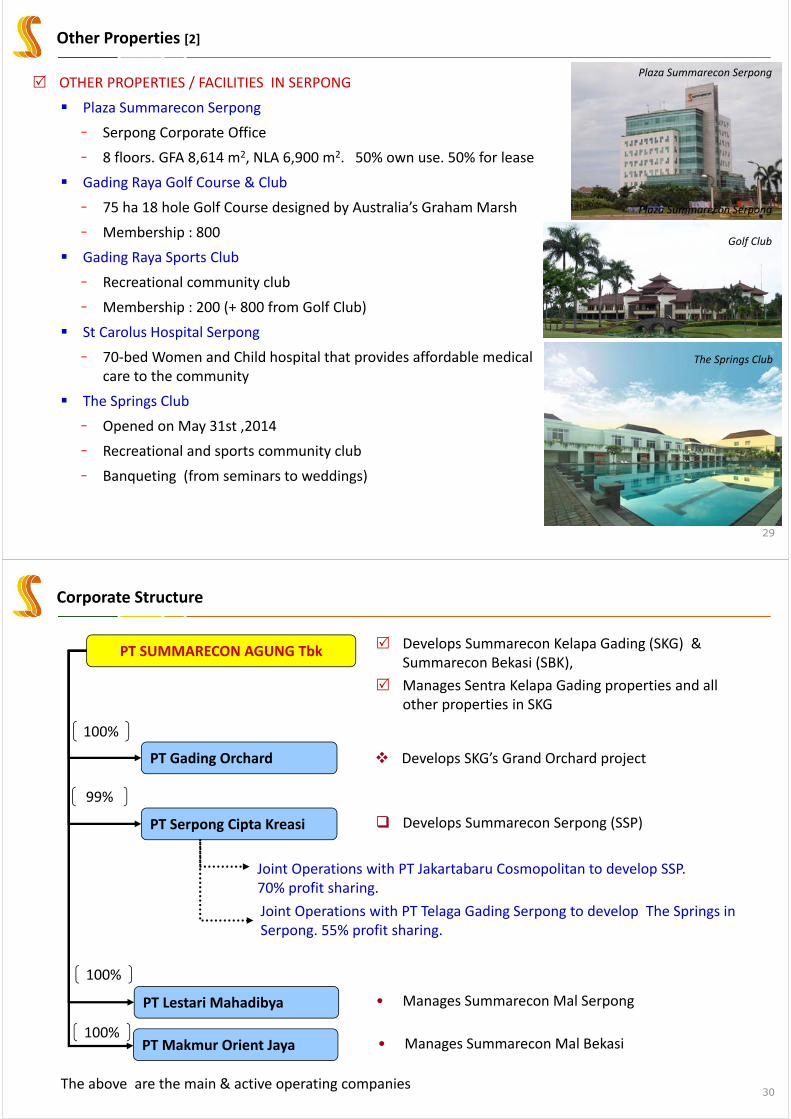
Hospitality Business – Resort Hotel
27
MOVENPICK RESORT & SPA, JIMBARAN, BALI
300 rooms 5‐star resort hotel
Tourists; both foreign and domestic
Planning & Design stage . Opening in 2015Q4
Dev Cost = Rp 600 bn
Room rates ~ USD 200/ night [indicative]
SAMASTA ENTERTAINMENT VILLAGE
NLA 5,000 sqm for F&B and entertainment
Planning & Design stage . Opening in 2015Q4
CONDOTEL [future development]
GFA 10,000 sqm strata‐title saleable
Planning & Design stage . To sell in 2017
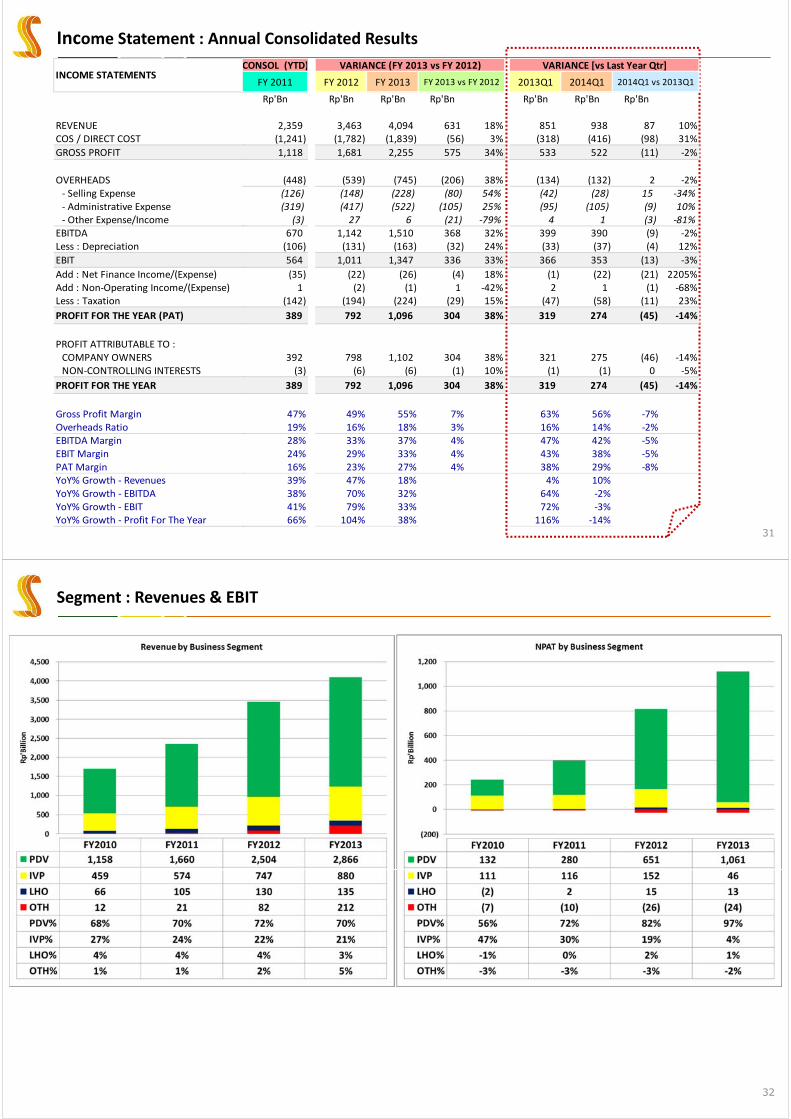
Other Properties [1]
28
OTHER PROPERTIES / FACILITIES IN KELAPA GADING
Plaza Summarecon
− Corporate Head Office. Own use
− 8 floors. GFA 8,350 m2, NLA 6,870 m2.
Menara Satu
− GFA 18,600 m2 office. 8,300 m2 (45%) for strata‐title sale and 10,300m2 for lease
Orchard Junction
− GFA 4,0000 m2 of retail space and food court. Anchor tenant is Giant Supermarket.
Plaza Summarecon
Klub Kelapa Gading
Summerville Apartments
− Semi‐serviced apartments in a resort setting. 42 units of 1 to 3‐bedrooms
− 95% occupancy
Klub Kelapa Gading
− Biggest community club in Jakarta with facilities for sports functions and banqueting (from seminars to weddings)
− 1st opened in 1983
− 1,200 members
Menara Satu
Other Properties [2]
29
OTHER PROPERTIES / FACILITIES IN SERPONG
Plaza Summarecon Serpong
− Serpong Corporate Office
− 8 floors. GFA 8,614 m2, NLA 6,900 m2. 50% own use. 50% for lease
Gading Raya Golf Course & Club
− 75 ha 18 hole Golf Course designed by Australia’s Graham Marsh
− Membership : 800
Gading Raya Sports Club
− Recreational community club
− Membership : 200 (+ 800 from Golf Club)
St Carolus Hospital Serpong
− 70‐bed Women and Child hospital that provides affordable medical care to the community
The Springs Club
− Opened on May 31st ,2014
− Recreational and sports community club
− Banqueting (from seminars to weddings)
Golf Club
Plaza Summarecon Serpong
Plaza Summarecon Serpong
The Springs Club
Corporate Structure
30
PT SUMMARECON AGUNG Tbk
PT Lestari Mahadibya
PT Serpong Cipta Kreasi
99%
100%
PT Gading Orchard
100%
The above are the main & active operating companies
Joint Operations with PT Jakartabaru Cosmopolitan to develop SSP. 70% profit sharing.
Joint Operations with PT Telaga Gading Serpong to develop The Springs in Serpong. 55% profit sharing.
Develops Summarecon Kelapa Gading (SKG) & Summarecon Bekasi (SBK),
Manages Sentra Kelapa Gading properties and all other properties in SKG
Develops SKG’s Grand Orchard project
Develops Summarecon Serpong (SSP)
• Manages Summarecon Mal Serpong
PT Makmur Orient Jaya • Manages Summarecon Mal Bekasi100%
Income Statement : Annual Consolidated Results
31
REVENUECOS / DIRECT COST
GROSS PROFIT
OVERHEADS‐ Selling Expense‐ Administrative Expense‐ Other Expense/Income
EBITDALess : Depreciation
EBIT
Add : Net Finance Income/(Expense)Add : Non‐Operating Income/(Expense)Less : Taxation
PROFIT FOR THE YEAR (PAT)
PROFIT ATTRIBUTABLE TO :COMPANY OWNERSNON‐CONTROLLING INTERESTS
PROFIT FOR THE YEAR
Gross Profit MarginOverheads RatioEBITDA MarginEBIT MarginPAT MarginYoY% Growth ‐ RevenuesYoY% Growth ‐ EBITDAYoY% Growth ‐ EBITYoY% Growth ‐ Profit For The Year
INCOME STATEMENTSFY 2011 FY 2012 FY 2013 2013Q1 2014Q1
Rp'Bn Rp'Bn Rp'Bn Rp'Bn Rp'Bn Rp'Bn Rp'Bn
2,359 3,463 4,094 631 18% 851 938 87 10%(1,241) (1,782) (1,839) (56) 3% (318) (416) (98) 31%
1,118 1,681 2,255 575 34% 533 522 (11) ‐2%
(448) (539) (745) (206) 38% (134) (132) 2 ‐2%(126) (148) (228) (80) 54% (42) (28) 15 ‐34%(319) (417) (522) (105) 25% (95) (105) (9) 10%
(3) 27 6 (21) ‐79% 4 1 (3) ‐81%670 1,142 1,510 368 32% 399 390 (9) ‐2%(106) (131) (163) (32) 24% (33) (37) (4) 12%
564 1,011 1,347 336 33% 366 353 (13) ‐3%
(35) (22) (26) (4) 18% (1) (22) (21) 2205%1 (2) (1) 1 ‐42% 2 1 (1) ‐68%
(142) (194) (224) (29) 15% (47) (58) (11) 23%
389 792 1,096 304 38% 319 274 (45) ‐14%
392 798 1,102 304 38% 321 275 (46) ‐14%(3) (6) (6) (1) 10% (1) (1) 0 ‐5%
389 792 1,096 304 38% 319 274 (45) ‐14%
47% 49% 55% 7% 63% 56% ‐7%19% 16% 18% 3% 16% 14% ‐2%28% 33% 37% 4% 47% 42% ‐5%24% 29% 33% 4% 43% 38% ‐5%16% 23% 27% 4% 38% 29% ‐8%39% 47% 18% 4% 10%38% 70% 32% 64% ‐2%41% 79% 33% 72% ‐3%66% 104% 38% 116% ‐14%
FY 2013 vs FY 2012 2014Q1 vs 2013Q1
CONSOL (YTD) VARIANCE (FY 2013 vs FY 2012) VARIANCE [vs Last Year Qtr]
Segment : Revenues & EBIT
32
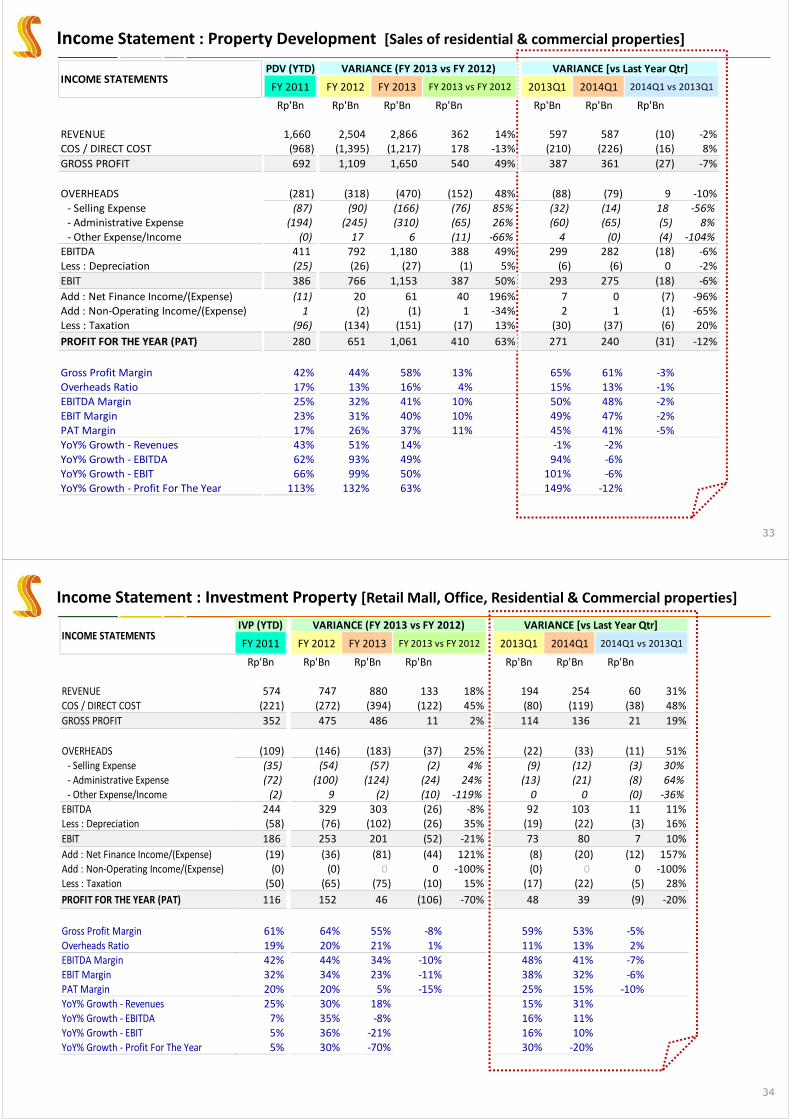
Income Statement : Property Development [Sales of residential & commercial properties]
33
FY 2011 FY 2012 FY 2013 2013Q1 2014Q1
Rp'Bn Rp'Bn Rp'Bn Rp'Bn Rp'Bn Rp'Bn Rp'Bn
REVENUE 1,660 2,504 2,866 362 14% 597 587 (10) ‐2%COS / DIRECT COST (968) (1,395) (1,217) 178 ‐13% (210) (226) (16) 8%
GROSS PROFIT 692 1,109 1,650 540 49% 387 361 (27) ‐7%
OVERHEADS (281) (318) (470) (152) 48% (88) (79) 9 ‐10%‐ Selling Expense (87) (90) (166) (76) 85% (32) (14) 18 ‐56%‐ Administrative Expense (194) (245) (310) (65) 26% (60) (65) (5) 8%‐ Other Expense/Income (0) 17 6 (11) ‐66% 4 (0) (4) ‐104%
EBITDA 411 792 1,180 388 49% 299 282 (18) ‐6%Less : Depreciation (25) (26) (27) (1) 5% (6) (6) 0 ‐2%
EBIT 386 766 1,153 387 50% 293 275 (18) ‐6%
Add : Net Finance Income/(Expense) (11) 20 61 40 196% 7 0 (7) ‐96%Add : Non‐Operating Income/(Expense) 1 (2) (1) 1 ‐34% 2 1 (1) ‐65%Less : Taxation (96) (134) (151) (17) 13% (30) (37) (6) 20%
PROFIT FOR THE YEAR (PAT) 280 651 1,061 410 63% 271 240 (31) ‐12%
Gross Profit Margin 42% 44% 58% 13% 65% 61% ‐3%Overheads Ratio 17% 13% 16% 4% 15% 13% ‐1%EBITDA Margin 25% 32% 41% 10% 50% 48% ‐2%EBIT Margin 23% 31% 40% 10% 49% 47% ‐2%PAT Margin 17% 26% 37% 11% 45% 41% ‐5%YoY% Growth ‐ Revenues 43% 51% 14% ‐1% ‐2%YoY% Growth ‐ EBITDA 62% 93% 49% 94% ‐6%YoY% Growth ‐ EBIT 66% 99% 50% 101% ‐6%YoY% Growth ‐ Profit For The Year 113% 132% 63% 149% ‐12%
INCOME STATEMENTSPDV (YTD) VARIANCE (FY 2013 vs FY 2012) VARIANCE [vs Last Year Qtr]
FY 2013 vs FY 2012 2014Q1 vs 2013Q1
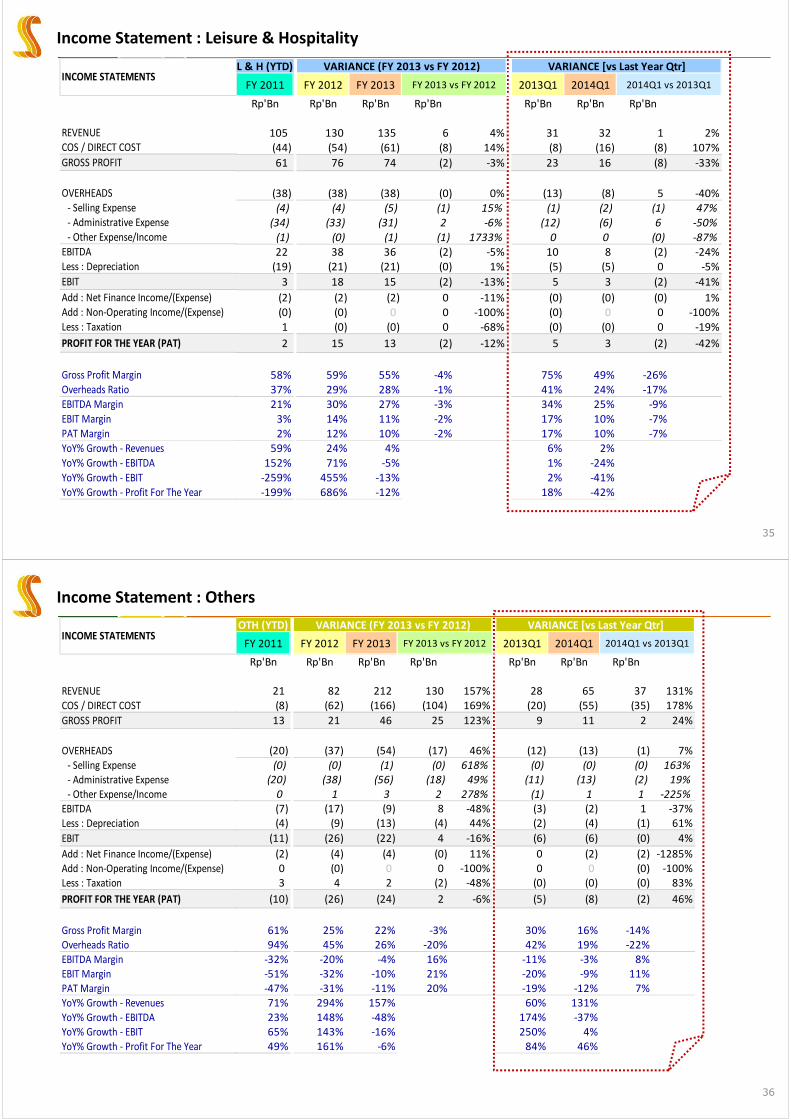
Income Statement : Investment Property [Retail Mall, Office, Residential & Commercial properties]
34
REVENUECOS / DIRECT COST
GROSS PROFIT
OVERHEADS‐ Selling Expense‐ Administrative Expense‐ Other Expense/Income
EBITDALess : Depreciation
EBIT
Add : Net Finance Income/(Expense)Add : Non‐Operating Income/(Expense)Less : Taxation
PROFIT FOR THE YEAR (PAT)
Gross Profit MarginOverheads RatioEBITDA MarginEBIT MarginPAT MarginYoY% Growth ‐ RevenuesYoY% Growth ‐ EBITDAYoY% Growth ‐ EBITYoY% Growth ‐ Profit For The Year
INCOME STATEMENTSFY 2011 FY 2012 FY 2013 2013Q1 2014Q1
Rp'Bn Rp'Bn Rp'Bn Rp'Bn Rp'Bn Rp'Bn Rp'Bn
574 747 880 133 18% 194 254 60 31%(221) (272) (394) (122) 45% (80) (119) (38) 48%
352 475 486 11 2% 114 136 21 19%
(109) (146) (183) (37) 25% (22) (33) (11) 51%(35) (54) (57) (2) 4% (9) (12) (3) 30%(72) (100) (124) (24) 24% (13) (21) (8) 64%(2) 9 (2) (10) ‐119% 0 0 (0) ‐36%
244 329 303 (26) ‐8% 92 103 11 11%(58) (76) (102) (26) 35% (19) (22) (3) 16%
186 253 201 (52) ‐21% 73 80 7 10%
(19) (36) (81) (44) 121% (8) (20) (12) 157%(0) (0) 0 0 ‐100% (0) 0 0 ‐100%
(50) (65) (75) (10) 15% (17) (22) (5) 28%
116 152 46 (106) ‐70% 48 39 (9) ‐20%
61% 64% 55% ‐8% 59% 53% ‐5%19% 20% 21% 1% 11% 13% 2%42% 44% 34% ‐10% 48% 41% ‐7%32% 34% 23% ‐11% 38% 32% ‐6%20% 20% 5% ‐15% 25% 15% ‐10%25% 30% 18% 15% 31%7% 35% ‐8% 16% 11%5% 36% ‐21% 16% 10%5% 30% ‐70% 30% ‐20%
VARIANCE (FY 2013 vs FY 2012) VARIANCE [vs Last Year Qtr]IVP (YTD)
FY 2013 vs FY 2012 2014Q1 vs 2013Q1
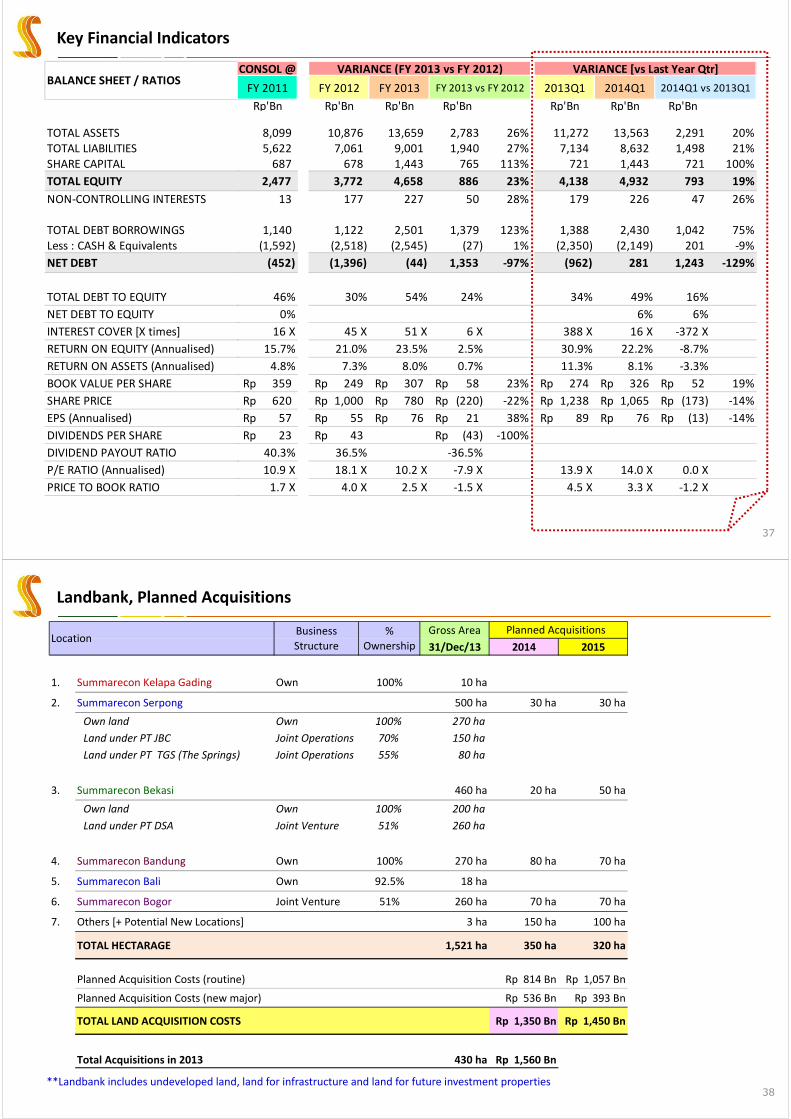
Income Statement : Leisure & Hospitality
35
REVENUECOS / DIRECT COST
GROSS PROFIT
OVERHEADS‐ Selling Expense‐ Administrative Expense‐ Other Expense/Income
EBITDALess : Depreciation
EBIT
Add : Net Finance Income/(Expense)Add : Non‐Operating Income/(Expense)Less : Taxation
PROFIT FOR THE YEAR (PAT)
Gross Profit MarginOverheads RatioEBITDA MarginEBIT MarginPAT MarginYoY% Growth ‐ RevenuesYoY% Growth ‐ EBITDAYoY% Growth ‐ EBITYoY% Growth ‐ Profit For The Year
INCOME STATEMENTSFY 2011 FY 2012 FY 2013 2013Q1 2014Q1
Rp'Bn Rp'Bn Rp'Bn Rp'Bn Rp'Bn Rp'Bn Rp'Bn
105 130 135 6 4% 31 32 1 2%(44) (54) (61) (8) 14% (8) (16) (8) 107%
61 76 74 (2) ‐3% 23 16 (8) ‐33%
(38) (38) (38) (0) 0% (13) (8) 5 ‐40%(4) (4) (5) (1) 15% (1) (2) (1) 47%
(34) (33) (31) 2 ‐6% (12) (6) 6 ‐50%(1) (0) (1) (1) 1733% 0 0 (0) ‐87%22 38 36 (2) ‐5% 10 8 (2) ‐24%(19) (21) (21) (0) 1% (5) (5) 0 ‐5%
3 18 15 (2) ‐13% 5 3 (2) ‐41%
(2) (2) (2) 0 ‐11% (0) (0) (0) 1%(0) (0) 0 0 ‐100% (0) 0 0 ‐100%1 (0) (0) 0 ‐68% (0) (0) 0 ‐19%
2 15 13 (2) ‐12% 5 3 (2) ‐42%
58% 59% 55% ‐4% 75% 49% ‐26%37% 29% 28% ‐1% 41% 24% ‐17%21% 30% 27% ‐3% 34% 25% ‐9%3% 14% 11% ‐2% 17% 10% ‐7%2% 12% 10% ‐2% 17% 10% ‐7%
59% 24% 4% 6% 2%152% 71% ‐5% 1% ‐24%‐259% 455% ‐13% 2% ‐41%‐199% 686% ‐12% 18% ‐42%
2014Q1 vs 2013Q1FY 2013 vs FY 2012
L & H (YTD) VARIANCE (FY 2013 vs FY 2012) VARIANCE [vs Last Year Qtr]
Income Statement : Others
36
REVENUECOS / DIRECT COST
GROSS PROFIT
OVERHEADS‐ Selling Expense‐ Administrative Expense‐ Other Expense/Income
EBITDALess : Depreciation
EBIT
Add : Net Finance Income/(Expense)Add : Non‐Operating Income/(Expense)Less : Taxation
PROFIT FOR THE YEAR (PAT)
Gross Profit MarginOverheads RatioEBITDA MarginEBIT MarginPAT MarginYoY% Growth ‐ RevenuesYoY% Growth ‐ EBITDAYoY% Growth ‐ EBITYoY% Growth ‐ Profit For The Year
INCOME STATEMENTSFY 2011 FY 2012 FY 2013 2013Q1 2014Q1
Rp'Bn Rp'Bn Rp'Bn Rp'Bn Rp'Bn Rp'Bn Rp'Bn
21 82 212 130 157% 28 65 37 131%(8) (62) (166) (104) 169% (20) (55) (35) 178%
13 21 46 25 123% 9 11 2 24%
(20) (37) (54) (17) 46% (12) (13) (1) 7%(0) (0) (1) (0) 618% (0) (0) (0) 163%
(20) (38) (56) (18) 49% (11) (13) (2) 19%0 1 3 2 278% (1) 1 1 ‐225%(7) (17) (9) 8 ‐48% (3) (2) 1 ‐37%(4) (9) (13) (4) 44% (2) (4) (1) 61%
(11) (26) (22) 4 ‐16% (6) (6) (0) 4%
(2) (4) (4) (0) 11% 0 (2) (2) ‐1285%0 (0) 0 0 ‐100% 0 0 (0) ‐100%3 4 2 (2) ‐48% (0) (0) (0) 83%
(10) (26) (24) 2 ‐6% (5) (8) (2) 46%
61% 25% 22% ‐3% 30% 16% ‐14%94% 45% 26% ‐20% 42% 19% ‐22%‐32% ‐20% ‐4% 16% ‐11% ‐3% 8%‐51% ‐32% ‐10% 21% ‐20% ‐9% 11%‐47% ‐31% ‐11% 20% ‐19% ‐12% 7%71% 294% 157% 60% 131%23% 148% ‐48% 174% ‐37%65% 143% ‐16% 250% 4%49% 161% ‐6% 84% 46%
FY 2013 vs FY 2012 2014Q1 vs 2013Q1
OTH (YTD) VARIANCE (FY 2013 vs FY 2012) VARIANCE [vs Last Year Qtr]
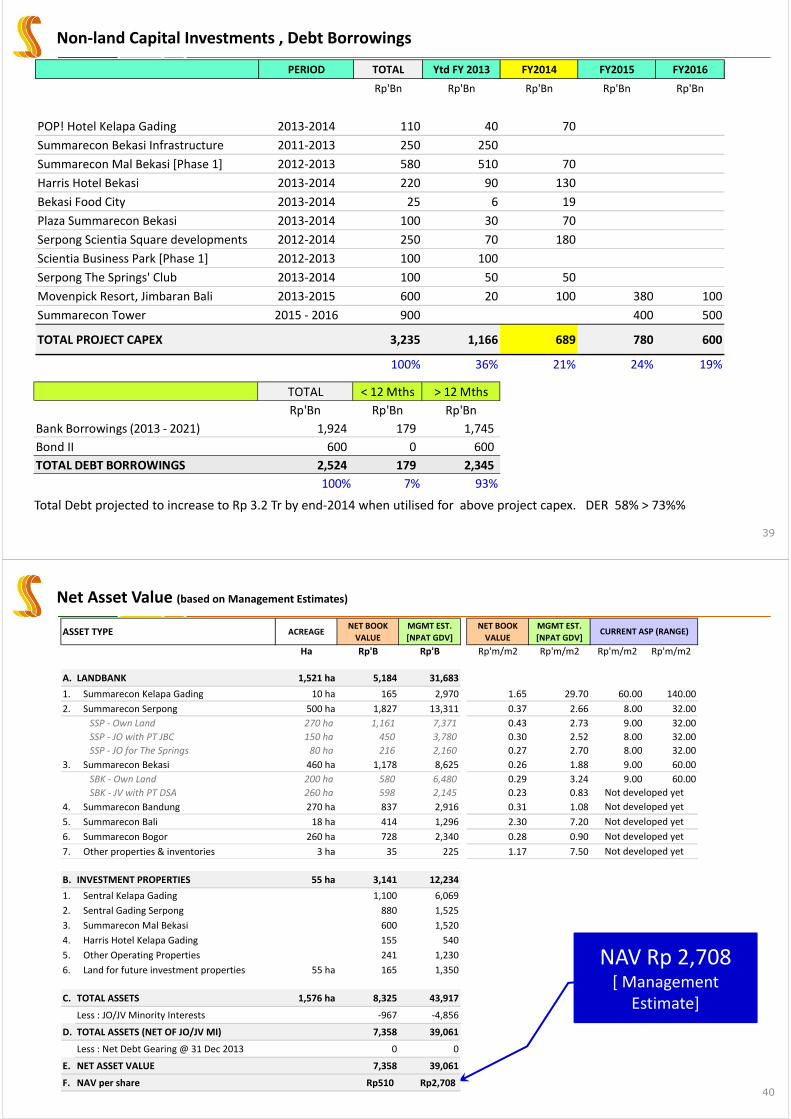
Key Financial Indicators
37
TOTAL ASSETSTOTAL LIABILITIESSHARE CAPITAL
TOTAL EQUITY
NON‐CONTROLLING INTERESTS
TOTAL DEBT BORROWINGSLess : CASH & Equivalents
NET DEBT
TOTAL DEBT TO EQUITY
NET DEBT TO EQUITY
INTEREST COVER [X times]
RETURN ON EQUITY (Annualised)
RETURN ON ASSETS (Annualised)
BOOK VALUE PER SHARE
SHARE PRICE
EPS (Annualised)
DIVIDENDS PER SHARE
DIVIDEND PAYOUT RATIO
P/E RATIO (Annualised)
PRICE TO BOOK RATIO
BALANCE SHEET / RATIOSFY 2011 FY 2012 FY 2013 2013Q1 2014Q1
Rp'Bn Rp'Bn Rp'Bn Rp'Bn Rp'Bn Rp'Bn Rp'Bn
8,099 10,876 13,659 2,783 26% 11,272 13,563 2,291 20%5,622 7,061 9,001 1,940 27% 7,134 8,632 1,498 21%687 678 1,443 765 113% 721 1,443 721 100%
2,477 3,772 4,658 886 23% 4,138 4,932 793 19%
13 177 227 50 28% 179 226 47 26%
1,140 1,122 2,501 1,379 123% 1,388 2,430 1,042 75%(1,592) (2,518) (2,545) (27) 1% (2,350) (2,149) 201 ‐9%
(452) (1,396) (44) 1,353 ‐97% (962) 281 1,243 ‐129%
46% 30% 54% 24% 34% 49% 16%
0% 0% 0% 0% 0% 6% 6%
16 X 45 X 51 X 6 X 388 X 16 X ‐372 X
15.7% 21.0% 23.5% 2.5% 30.9% 22.2% ‐8.7%
4.8% 7.3% 8.0% 0.7% 11.3% 8.1% ‐3.3%
359Rp 249Rp 307Rp 58Rp 23% 274Rp 326Rp 52Rp 19%
620Rp 1,000Rp 780Rp (220)Rp ‐22% 1,238Rp 1,065Rp (173)Rp ‐14%
57Rp 55Rp 76Rp 21Rp 38% 89Rp 76Rp (13)Rp ‐14%
23Rp 43Rp ‐Rp (43)Rp ‐100% ‐Rp ‐Rp ‐Rp 0%
40.3% 36.5% 0.0% ‐36.5% 0.0% 0.0% 0.0%
10.9 X 18.1 X 10.2 X ‐7.9 X 13.9 X 14.0 X 0.0 X
1.7 X 4.0 X 2.5 X ‐1.5 X 4.5 X 3.3 X ‐1.2 X
CONSOL @ VARIANCE (FY 2013 vs FY 2012) VARIANCE [vs Last Year Qtr]
FY 2013 vs FY 2012 2014Q1 vs 2013Q1
Landbank, Planned Acquisitions
38**Landbank includes undeveloped land, land for infrastructure and land for future investment properties
Gross Area
31/Dec/13 2014 2015
1. Summarecon Kelapa Gading Own 100% 10 ha
2. Summarecon Serpong 500 ha 30 ha 30 ha
Own land Own 100% 270 ha
Land under PT JBC Joint Operations 70% 150 ha
Land under PT TGS (The Springs) Joint Operations 55% 80 ha
3. Summarecon Bekasi 460 ha 20 ha 50 ha
Own land Own 100% 200 ha
Land under PT DSA Joint Venture 51% 260 ha
4. Summarecon Bandung Own 100% 270 ha 80 ha 70 ha
5. Summarecon Bali Own 92.5% 18 ha
6. Summarecon Bogor Joint Venture 51% 260 ha 70 ha 70 ha
7. Others [+ Potential New Locations] 3 ha 150 ha 100 ha
TOTAL HECTARAGE 1,521 ha 350 ha 320 ha
Planned Acquisition Costs (routine) Rp 814 Bn Rp 1,057 Bn
Planned Acquisition Costs (new major) Rp 536 Bn Rp 393 Bn
TOTAL LAND ACQUISITION COSTS Rp 1,350 Bn Rp 1,450 Bn
Total Acquisitions in 2013 430 ha Rp 1,560 Bn
Location Business
Structure
%
Ownership
Planned Acquisitions
Non‐land Capital Investments , Debt Borrowings
39
Total Debt projected to increase to Rp 3.2 Tr by end‐2014 when utilised for above project capex. DER 58% > 73%%
TOTAL < 12 Mths > 12 Mths
Rp'Bn Rp'Bn Rp'Bn
Bank Borrowings (2013 ‐ 2021) 1,924 179 1,745
Bond II 600 0 600
TOTAL DEBT BORROWINGS 2,524 179 2,345
100% 7% 93%
PERIOD TOTAL Ytd FY 2013 FY2014 FY2015 FY2016
Rp'Bn Rp'Bn Rp'Bn Rp'Bn Rp'Bn
POP! Hotel Kelapa Gading 2013‐2014 110 40 70
Summarecon Bekasi Infrastructure 2011‐2013 250 250
Summarecon Mal Bekasi [Phase 1] 2012‐2013 580 510 70
Harris Hotel Bekasi 2013‐2014 220 90 130
Bekasi Food City 2013‐2014 25 6 19
Plaza Summarecon Bekasi 2013‐2014 100 30 70
Serpong Scientia Square developments 2012‐2014 250 70 180
Scientia Business Park [Phase 1] 2012‐2013 100 100
Serpong The Springs' Club 2013‐2014 100 50 50
Movenpick Resort, Jimbaran Bali 2013‐2015 600 20 100 380 100
Summarecon Tower 2015 ‐ 2016 900 400 500
TOTAL PROJECT CAPEX 3,235 1,166 689 780 600
100% 36% 21% 24% 19%
Net Asset Value (based on Management Estimates)
40
NAV Rp 2,708 [ Management
Estimate]
ASSET TYPE ACREAGENET BOOK
VALUE
MGMT EST.
[NPAT GDV]
NET BOOK
VALUE
MGMT EST.
[NPAT GDV]
Ha Rp'B Rp'B Rp'm/m2 Rp'm/m2 Rp'm/m2 Rp'm/m2
A. LANDBANK 1,521 ha 5,184 31,683
1. Summarecon Kelapa Gading 10 ha 165 2,970 1.65 29.70 60.00 140.00
2. Summarecon Serpong 500 ha 1,827 13,311 0.37 2.66 8.00 32.00
SSP ‐ Own Land 270 ha 1,161 7,371 0.43 2.73 9.00 32.00
SSP ‐ JO with PT JBC 150 ha 450 3,780 0.30 2.52 8.00 32.00
SSP ‐ JO for The Springs 80 ha 216 2,160 0.27 2.70 8.00 32.00
3. Summarecon Bekasi 460 ha 1,178 8,625 0.26 1.88 9.00 60.00
SBK ‐ Own Land 200 ha 580 6,480 0.29 3.24 9.00 60.00
SBK ‐ JV with PT DSA 260 ha 598 2,145 0.23 0.83
4. Summarecon Bandung 270 ha 837 2,916 0.31 1.08
5. Summarecon Bali 18 ha 414 1,296 2.30 7.20
6. Summarecon Bogor 260 ha 728 2,340 0.28 0.90
7. Other properties & inventories 3 ha 35 225 1.17 7.50
B. INVESTMENT PROPERTIES 55 ha 3,141 12,234
1. Sentral Kelapa Gading 1,100 6,069
2. Sentral Gading Serpong 880 1,525
3. Summarecon Mal Bekasi 600 1,520
4. Harris Hotel Kelapa Gading 155 540
5. Other Operating Properties 241 1,230
6. Land for future investment properties 55 ha 165 1,350
C. TOTAL ASSETS 1,576 ha 8,325 43,917
Less : JO/JV Minority Interests ‐967 ‐4,856
D. TOTAL ASSETS (NET OF JO/JV MI) 7,358 39,061
Less : Net Debt Gearing @ 31 Dec 2013 0 0
E. NET ASSET VALUE 7,358 39,061
F. NAV per share Rp510 Rp2,708
Not developed yet
CURRENT ASP (RANGE)
Not developed yet
Not developed yet
Not developed yet
Not developed yet
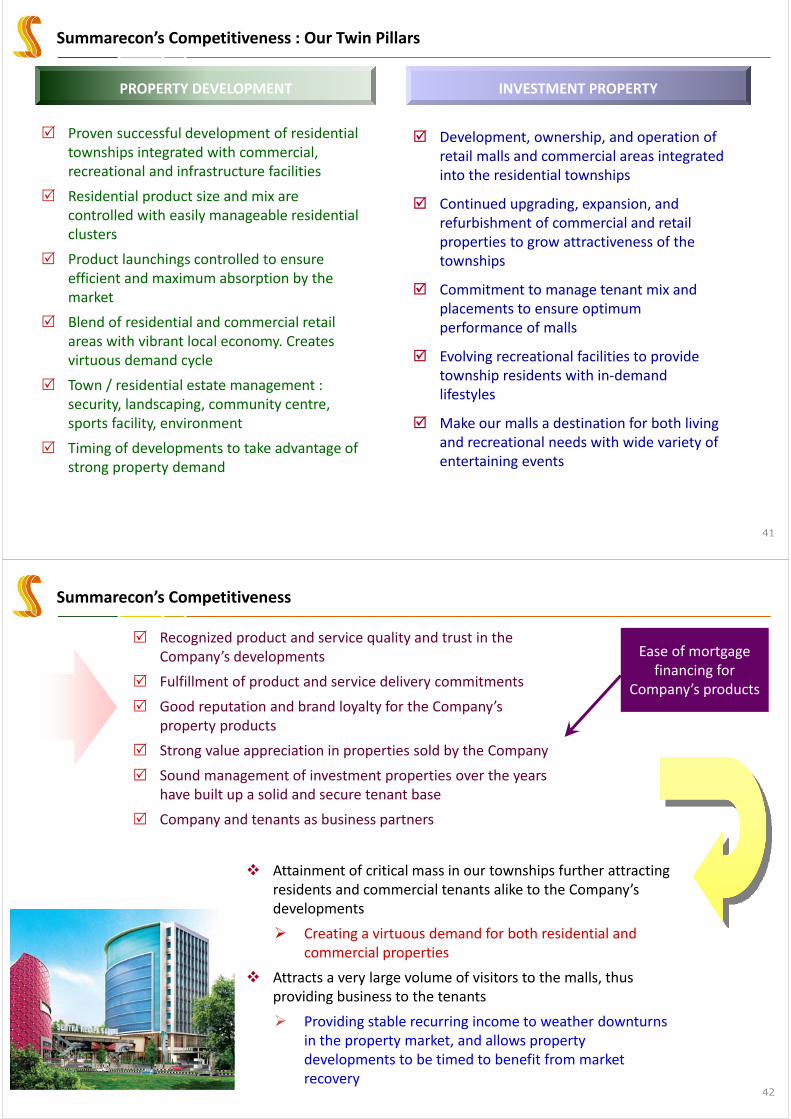
Summarecon’s Competitiveness : Our Twin Pillars
41
Proven successful development of residential townships integrated with commercial, recreational and infrastructure facilities
Residential product size and mix are controlled with easily manageable residential clusters
Product launchings controlled to ensure efficient and maximum absorption by the market
Blend of residential and commercial retail areas with vibrant local economy. Creates virtuous demand cycle
Town / residential estate management : security, landscaping, community centre, sports facility, environment
Timing of developments to take advantage of strong property demand
PROPERTY DEVELOPMENT INVESTMENT PROPERTY
Development, ownership, and operation of retail malls and commercial areas integrated into the residential townships
Continued upgrading, expansion, and refurbishment of commercial and retail properties to grow attractiveness of the townships
Commitment to manage tenant mix and placements to ensure optimum performance of malls
Evolving recreational facilities to provide township residents with in‐demand lifestyles
Make our malls a destination for both living and recreational needs with wide variety of entertaining events
Summarecon’s Competitiveness
42
Recognized product and service quality and trust in the Company’s developments
Fulfillment of product and service delivery commitments
Good reputation and brand loyalty for the Company’s property products
Strong value appreciation in properties sold by the Company
Sound management of investment properties over the years have built up a solid and secure tenant base
Company and tenants as business partners
Attainment of critical mass in our townships further attracting residents and commercial tenants alike to the Company’s developments
Creating a virtuous demand for both residential and commercial properties
Attracts a very large volume of visitors to the malls, thus providing business to the tenants
Providing stable recurring income to weather downturns in the property market, and allows property developments to be timed to benefit from market recovery
Ease of mortgage financing for
Company’s products
Outlook : The market and how we see it
43
Overall demand for properties in the middle and above price segment remains strong with demand largely driven by :‐
Strong macroeconomic outlook , thus increasing the size of the middle income group
First time buyers
Changing household sizes, upgrading to bigger units
Strong savings and income growth
Increasing but still sustainable Interest Rates
BI rate = 7.50% since 12 Nov 2013.
Home mortgage rates with wide spread from 9 – 12 % pa and longer tenors.
Mortgage penetration is still low. Banking sector can provide a lot more funding to the sector, thereby fueling demand for properties
For Summarecon :‐
Summarecon Kelapa Gading is a well sought‐ after residential area for the upper middle class, and high net worth individuals.
Summarecon Serpong is in the growth corridor of Serpong which is the fastest growing area on the fringe of Jakarta. Moreover our market segment is the growing middle class of professionals working in Jakarta.
Summarecon Bekasi will be the impetus that accelerates modern developments on the eastern fringe of Jakarta, and uplift the economy, livelihood and living standards of the residents living there.
Summarecon Bandung will be the next growth area as it will provide geographic diversity to our development portfolio.
Corporate objective
Assure appropriate returns to our stakeholders; customers, shareholders, government authorities, business associates , and employees
Strengthen market position in property development
Continue to focus on developments within our two townships, and to ramp up development in the newly started 3rd township
Offer innovative products in developing residential projects
Timely and assured delivery of these quality products to our customers, thereby further enhancing the Summarecon brand and its products
Large landbank allows us the flexibility to market products appropriate to the prevailing market conditions
Strengthen market position in property investment
Expand our portfolio of investment properties within our townships
In the mid‐ to long‐term, to develop new products and businesses
Offer innovative programs to attract visitors to our shopping and life‐style properties, thereby deriving values for our tenants and customers
Moving Forward
44
1,000
2,000
3,000
4,000
5,000
6,000
100
200
300
400
500
600
700
800
900
1,000
1,100
1,200
1,300
1,400
1,500
1,600
2/
Jan
/1
2
14
/Feb
/1
2
28
/M
ar/
12
10
/M
ay/
12
27
/Ju
n/
12
14
/A
ug
/1
2
1/
Oct
/1
2
15
/N
ov/
12
2/
Jan
/1
3
14
/Feb
/1
3
2/
Ap
r/1
3
15
/M
ay/
13
27
/Ju
n/
13
15
/A
ug
/1
3
26
/S
ep
/1
3
13
/N
ov/
13
27
/D
ec/
13
11
/Feb
/1
4
27
/M
ar/
14
14
/M
ay/
14
IDX
Co
mp
osi
te I
nd
ex
Sh
are
Pri
ce (
Ru
pia
h/
share
)
SMRA JSX Index
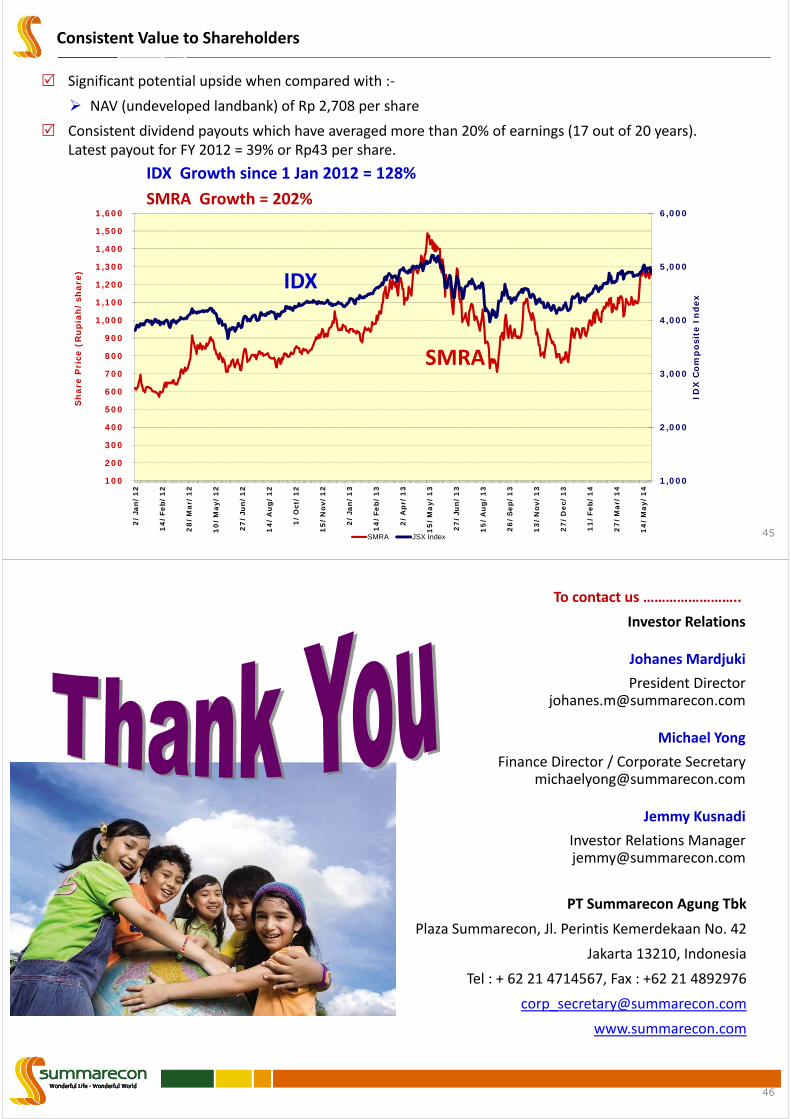
Consistent Value to Shareholders
45
Significant potential upside when compared with :‐
NAV (undeveloped landbank) of Rp 2,708 per share
Consistent dividend payouts which have averaged more than 20% of earnings (17 out of 20 years). Latest payout for FY 2012 = 39% or Rp43 per share.
IDX Growth since 1 Jan 2012 = 128%
SMRA Growth = 202%
SMRA
IDX
46
EndInvestor Relations
Johanes Mardjuki
President [email protected]
Michael Yong
Finance Director / Corporate [email protected]
Jemmy Kusnadi
Investor Relations [email protected]
To contact us ……………………..
PT Summarecon Agung Tbk
Plaza Summarecon, Jl. Perintis Kemerdekaan No. 42
Jakarta 13210, Indonesia
Tel : + 62 21 4714567, Fax : +62 21 4892976
www.summarecon.com
Disclaimer
47
We caution investors that all statements other than statements of historical fact included in this document, including without limitation, those regarding our financial position, business strategy, plans and objectives of management for future operations (including development plans and objectives relating to our existing and future products), are forward‐looking statements.
Such forward‐looking statements involve known and unknown risks, uncertainties and other factors, which may cause our actual results, performance or achievements, or industry results, to be materially different from any future results, performance or achievements expressed or implied by such forward‐looking statements.
Such forward‐looking statements are based on numerous assumptions regarding our present and future business strategies and the environment in which we expect to operate in the future.
We expressly disclaim any obligation or undertaking to release publicly any update of or revisions to any forward‐looking statement contained herein to reflect any change in our expectations with regard hereto or any change in events, conditions or circumstances on which any such statement is based.
This document has been prepared and provided on a confidential basis and may not be reproduced in whole or in part, nor may its contents be disclosed to any third party, without PT Summarecon Agung Tbk’s prior written consent.
48
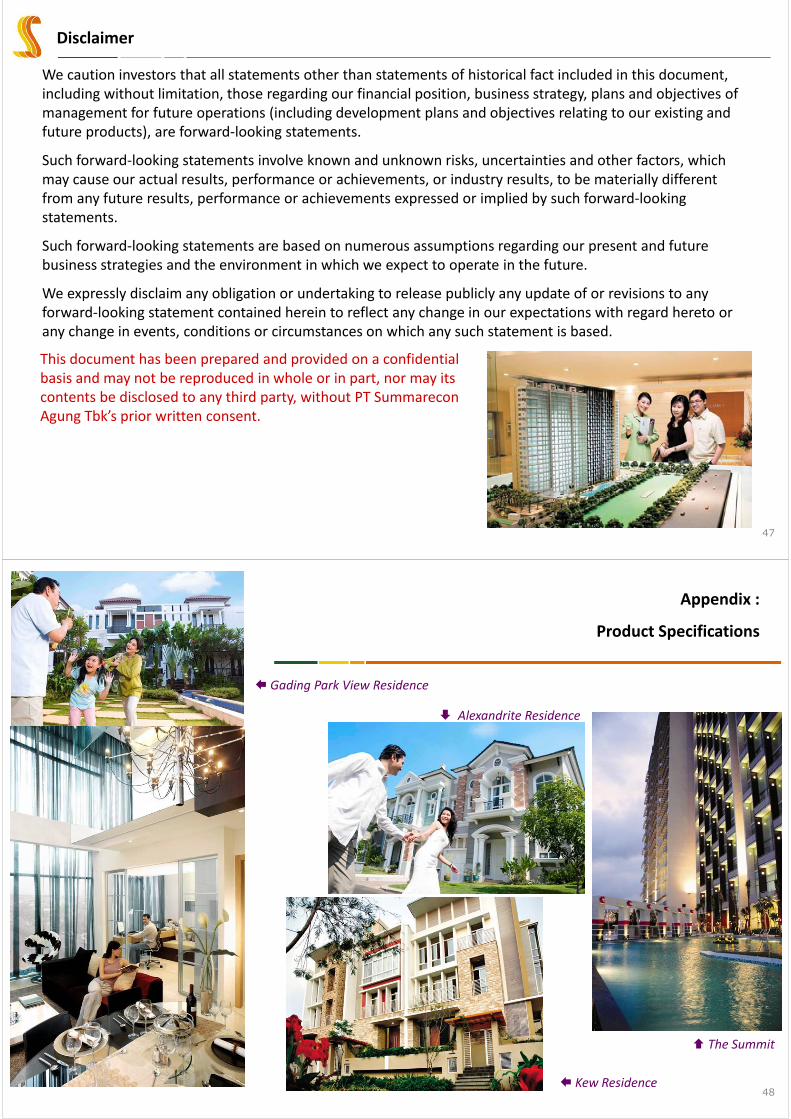
Appendix :
Product Specifications
The Summit
Kew Residence
Alexandrite Residence
Gading Park View Residence
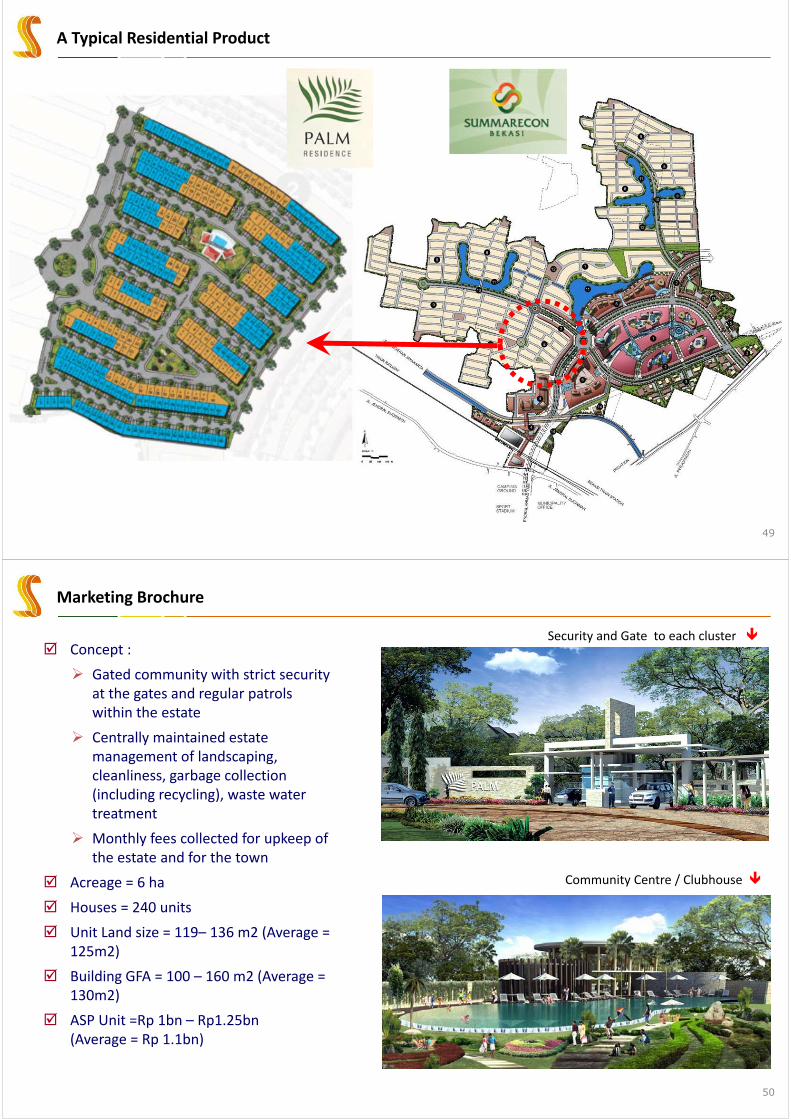
A Typical Residential Product
49
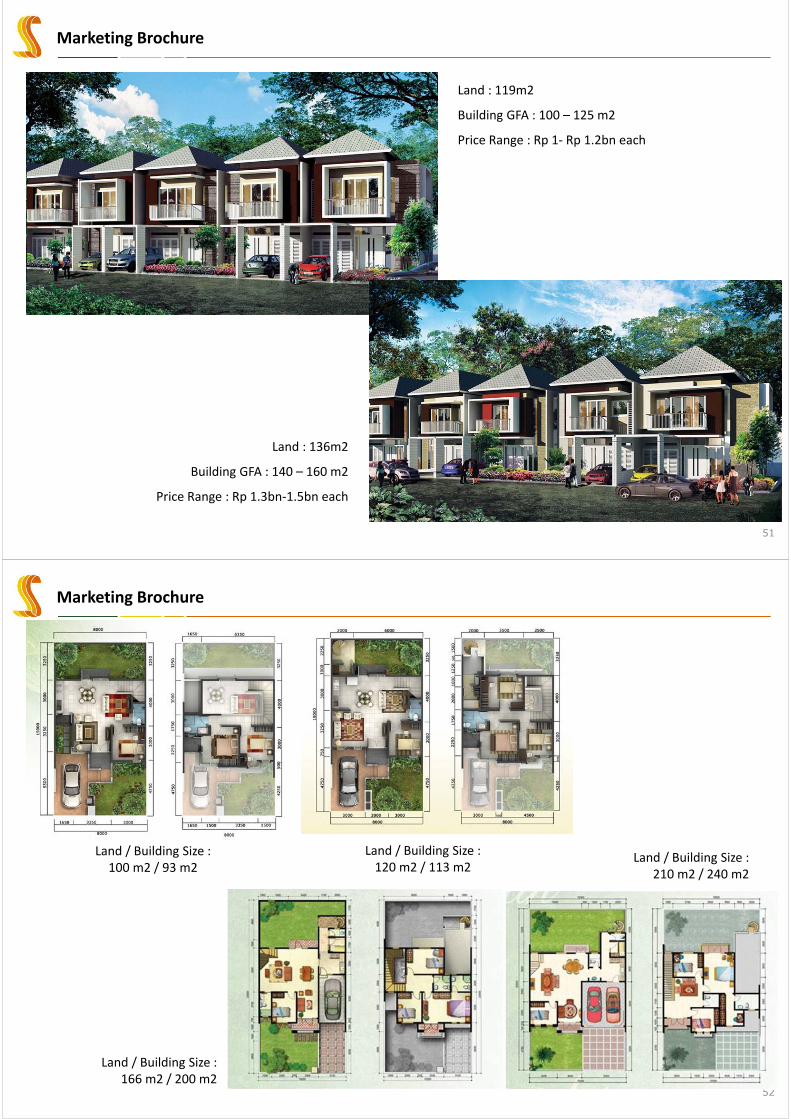
Marketing Brochure
50
Security and Gate to each cluster
Community Centre / Clubhouse
Concept :
Gated community with strict security at the gates and regular patrols within the estate
Centrally maintained estate management of landscaping, cleanliness, garbage collection (including recycling), waste water treatment
Monthly fees collected for upkeep of the estate and for the town
Acreage = 6 ha
Houses = 240 units
Unit Land size = 119– 136 m2 (Average = 125m2)
Building GFA = 100 – 160 m2 (Average = 130m2)
ASP Unit =Rp 1bn – Rp1.25bn (Average = Rp 1.1bn)
Marketing Brochure
51
Land : 119m2
Building GFA : 100 – 125 m2
Price Range : Rp 1‐ Rp 1.2bn each
Land : 136m2
Building GFA : 140 – 160 m2
Price Range : Rp 1.3bn‐1.5bn each
Marketing Brochure
52
Land / Building Size :100 m2 / 93 m2
Land / Building Size :120 m2 / 113 m2
Land / Building Size :166 m2 / 200 m2
Land / Building Size :210 m2 / 240 m2