Embed Size (px)
Citation preview
1
A Cholesterol Biosensor Based on the NIR
Electrogenerated-Chemiluminescence (ECL) of
Water-Soluble CdSeTe/ZnS Quantum Dots
Alasdair J. Stewart,a,b
Emmet J. O’Reilly,b,c
Roisin D. Moriarty,bPaolo Bertoncello,
d Tia E.
Keyes,b Robert J. Forster
b and Lynn Dennany
a*
aWestCHEM. Department of Pure and Applied Chemistry, University of Strathclyde. 295
Cathedral Street, Glasgow, G1 1XL
bNational Biophotonics& Imaging Platform Ireland, School of Chemical Sciences, Dublin City
University, Dublin 9, Ireland
cDepartment of Chemical and Environmental Science, Materials and Surface Science Institute,
University of Limerick, Limerick, Ireland.
dCollege of Engineering, Multidiscplinary Nanotechnology Centre and Centre for NanoHealth,
Swansea University, Swansea, SA2 8PP, UK.
* To whom correspondence should be addressed.
2
ABSTRACT
This contribution examines the application of near infra-red (NIR) quantum dot (QD) containing
films for cholesterol detection. Water-soluble, 2-(dimethylamino)ethanthiol (DAET) protected
800 nm CdSeTe/ZnS core-shell QDs were prepared and incorporated into a chitosan film. The
NIR electrogenerated chemiluminescence (ECL) of the QD/chitosan films upon reaction with
H2O2 co-reactant (produced as a by-product of cholesterol oxidase-catalysed oxidation of
cholesterol) gave a strong ECL signal at -1.35 V vs. Ag/AgCl. The sensor displayed a linear
response over the clinically relevant range (0.25 ≤ [cholesterol] ≤ 5 mM) allowing the rapid
detection of cholesterol and providing a platform for future development. Significantly, this NIR
emission has been shown to exhibit excellent penetrability through biological samples, and will
likely be at the forefront of development in the biosensing and imaging fields for the foreseeable
future.
3
INTRODUCTION
The burden of high cholesterol levels on healthcare services worldwide is becoming an
increasing problem as over-eating and lack of exercise drive the current global obesity epidemic.
Hypercholesterolemia (total blood cholesterol concentrations above 5mM),1caused by a diet high
in saturated fat2 results in the accumulation of cholesterol on arterial walls, leading to hardening,
thinning and chronic inflammation (atherosclerosis)3Patients suffering from this indisposition are
at a proven risk of developing more serious cardiac related diseases such as ischaemic heart
disease4-5
, stroke6 and peripheral vascular disease.
7 Detection of elevated cholesterol levels is
therefore key in implementing a strategic health plan to reduce total cholesterol blood
concentrations and minimize the risk of progression to more serious diseases.8Literature in this
area indicates that it is the levels of high density and low density lipoproteins that are most
strongly indicative of cardiovascular disease risk.8-10
Both low levels of high density lipoproteins
(HDL) and high levels of low density lipoproteins (LDL) are associated with an increased risk of
CVD.11
This is because oxidation of LDL tends to promote the development of atherosclerosis,12
whereas HDL has a host of benefits that fight its onset.13
Levels of these lipoproteins can be
estimated via their associated cholesterol concentrations.14
As such the requirement for accurate,
robust and selective biosensors for cholesterol detection is of clear clinical importance.
A number of cholesterol detection methods based on spectrophotometric15
, HPLC16
and
gas-liquid chromatography17
have previously been reported. However, these tend to require
expensive equipment, extensive sample preparation and suffer from poorer sensitivity and
selectivity when compared to enzymatic based techniques. As such the majority of cholesterol
biosensors incorporate cholesterol oxidase (ChOx) into their design and use electrochemical
detection (amperometric) of hydrogen peroxide, produced as a byproduct in the ChOx-catalysed
oxidation of cholesterol in the presence of oxygen.18-22
The presence of ChOx infers excellent
4
inherent selectivity, avoiding the need for lengthy sample preparation procedures and reducing
costs, however, interference from other analytes present in the sample, as with any analysis, can
lead to errors in interpretation.
ECL has been used extensively as a detection method in bio-sensing because of its
advantages over other detection techniques. Excellent sensitivity is achieved as no light source is
required, resulting in minimal background light intensity23
, whilst scattered light and
interferences from emission by impurities or other analytes is effectively eliminated.24
Combined
with the specificity of the ECL reaction, these attributes produce a technique that is ideally suited
for detecting low concentration target analytes in complex matrices with a good signal to noise
ratio.25-28
These benefits have allowed the development of a variety of ECL-based biosensors for
cholesterol detection. Marquette et al29
developed a biosensor based on the ECL of a
luminol/H2O2 system, with ChOx immobilised in a membrane through which the cholesterol
samples were passed. Generation of H2O2 in the presence of cholesterol resulted in the emission
of ECL from luminol, allowing detection down to 0.6nM. Ballesta-Claveret al30
created a
disposable sensor that incorporated synthesized luminol copolymers onto which ChOx was
covalently attached. In the presence of cholesterol, production of H2O2 resulted in the generation
of ECL from these conducting polymers that showed a linear response to increasing cholesterol
concentrations.
Clearly, one of the most important aspects of enzymatic-based sensors is that the
bioactivity, stability and specificity of the enzymatic reaction is retained in both the conditions
and/or immobilization techniques used. A number of immobilization matrices have been reported
previously, including sol-gel films31-33
, polyaniline films34-35
, polypyyrole films36-38
and a
selection of other conducting polymer films.39-41
However, more recently, the use of nano-
5
materials as immobilization matrices have been pursued. Their large surface area relative to bulk
size provides a high enzyme loading ability and a compatible microenvironment allows retention
of bioactivity. QDs in particular, have found uses in a broad range of bio-sensing applications
because of their unique optical and electronic properties and have been widely used in ECL
systems following their discovery as ECL emitters by Bards group in 2002.42
Their high
quantum efficiency and resistance to photo-bleaching, combined with their size-tuneable
emission, make them ideal luminophores, whilst their large surface area allows greater
biomolecule loading than standard emitters. Zhu et al43
developed a cholesterol biosensor with
ChOx immobilised on gold nanoparticle-decorated multiwalled carbon nanotubes. The use of
nanoparticles allowed high enzyme loading and fast electron transfer rates with amperometric
detection being used to determine cholesterol concentrations. Hong et al44
used cupric oxide
nanoparticles to catalyse the oxidation of luminol by H2O2. The sensitivity of this
chemiluminescent sensor was improved when compared to the same system with no
nanoparticles present.
However, at the time of writing there does not appear to be any work based on the ECL
of near-infrared (NIR) QD films for the detection of cholesterol. The benefit of such a system is
that emission above 800 nm reduces signal interference from whole blood samples, an issue that
can affect detection systems that use emitters in the visible region. These NIR emitters can
therefore act as a gateway for development of a cholesterol sensor that can directly analyze
whole blood samples with no sample pre-treatment.
In this work, we have developed a biosensor for cholesterol based on the ECL of 800 nm
CdSeTe/ZnS core-shell QDs (Figure 1). A glassy carbon electrode (GCE) was modified with a
QD/chitosan composite. Chitosan was selected as the polymer for film development due to its
6
non-toxicity, good biocompatibility and commercial availability.45-46
This work has shown that
these water-soluble, NIR-emitting QDs are suitable for use in ECL biosensors and could be
extremely helpful in the development of novel systems that are able to detect clinically relevant
analytes directly from clinical samples. They have been used to successfully develop a
cholesterol detection system with a clinically-relevant linear range, minimizing the requirement
for sample preparation. Ideally, this system could be used in combination with an agent that has
the ability to selectively release cholesterol from HDL and LDL prior to its quantification and is
an area in which future work would focus.
7
EXPERIMENTAL SECTION
Materials and Methods
Core-shell CdSeTe/ZnSquantum dots (Qdot® 800 ITK™ organic quantum dots, 1μM in
decane) were purchased from Invitrogen. Chitosan (medium molecular weight, 75-85%
deacetylated), phosphate buffered saline (PBS, pH 7.4), hydrogen peroxide, cholesterol,
cholesterol oxidase (ChOx) from Streptomyces sp., 2-(dimethylamino)ethanthiol (DAET) and
25% aqueous glutaraldehyde were all purchased from Sigma-Aldrich and used as received. All
other chemicals were of reagent grade quality and used as received. Human serum samples were
obtained from Dublin City University following ethical approval and stored at -20°C until use.
Glassy carbon electrodes (3mm diameter)were purchased from IJ Cambria (UK). They were
cleaned by successive polishing using 1, 0.3 and 0.05 μm alumina slurry, followed by sonication
in ethanol and water, respectively, for 30 minutes. Measurements involving simultaneous
detection of light and current utilized a CH instrument model 760D connected to a Hamamatsu
H6780-20 PMT powered at -950 V.
During the ECL experiments, 1 mL sample volume was required and run time was 40 s. The
cell was kept in a light-tight Faraday cage in a specially designed holder configuration where the
working electrode was positioned directly above the PMT window. All electrochemical
experiments were carried out using a conventional three-electrode assembly. Potentials are
quoted versus Ag/AgCl using a platinum wire as counter and all measurements were made at
room temperature (20°C). All other reagents used were of analytical grade, and all solutions were
prepared in Milli-Q water (18 mΩ cm). ECL spectra were recorded on Ocean Optics USB2000+
CCD spectrometer using CH instriument electrochemical analyser, CH instrument model 760D.
8
Preparation of water soluble CdSeTe/ZnS core-shell QDs
The method followed was similar to that developed by Woelfle and Claus47
. 0.5 mL of 0.5 M
DAET in methanol was mixed with 0.25 mL of the CdSeTe/ZnS QDs in decane (1μM). Nitrogen
was bubbled through the solution for 5 minutes, which was then sealed and left stirring overnight
at room temperature in the dark. The QDs were then precipitated with an excess of acetone
followed by centrifugation at 5000 rpm for 6 minutes. The filtrate was removed and the
precipitate was re-dispersed in 0.25 mL of distilled water. These water-soluble QDs were
centrifuged for a further 6 minutes at 3000 rpm to remove any impurities and then stored in
darkness in the fridge.
Preparation of CdSeTe/ZnS core-shell QD-chitosan composite film
0.1% chitosan was prepared by dissolving 1.1 mg chitosan in 1 mL of 1% aqueous acetic acid.
The QD/chitosan composite was prepared by mixing aliquots of the water-soluble QDs with the
chitosan solution in a 1:1 (v/v) ratio. This composite was then carefully cast onto the
electroactive portion of a GCE and allowed to dry in the fridge for 1 hour in the dark.
Cholesterol and cholesterol oxidase solution preparation
5 mL of Triton X-100 and 5 mL of isopropanol were mixed and heated to 50°C. 0.1933 g of
cholesterol was slowly added to this solution until fully dissolved and then 40 mL of 0.1 M PBS
was added with continuous mixing to produce a 10 mM stock solution. A cloudy solution
resulted, which became clear after cooling. The solution was stored in the fridge (4°C) when not
in use and required gentle heating, to 35°C, and cooling if it turned cloudy. Aliquots of this stock
9
solution were diluted in Triton X-100:isopropanol:0.1 M PBS (1:1:8) to obtain the required
cholesterol concentrations for analysis.
A 10 mg/mL ChOx stock solution was prepared on the day of use by dissolving 1 mg of
ChOx in 100 μL of distilled water.A 1 in 10 dilution of this ChOx solution was made in
cholesterol solutions at varying concentrations, giving a working concentration of 0.1 mg/mL.
The modified electrode was immersed in these solutions, which had been incubated for 60
minutes at 45⁰C to allow oxidation of cholesterol to occur. The incubation temperature was set at
45⁰C as maximum activity of Cholesterol Oxidase from Streptomyces sp. is achieved at this
temperature (according to manufacturer). A scanning potential between 0 and -2 V was then
applied to the modified electrodes and the ECL signal was monitored using a photomultiplier
tube (PMT).
Preparation of spiked interferent samples
A 5 mM cholesterol solution was prepared in Triton X-100:isopropanol:0.1 M PBS (1:1:8) to
which 10 mM urea, 10 mM glucose or 1 mg/mL citric acid was added. This solution was then
incubated with ChOx as outlined above and the ECL response of the QD/chitosan film was then
monitored.
Preparation of spiked and unknown human serum samples
Human serum was mixed 1 to 1 with cholesterol solutions at different concentrations
containing 0.1 mg/mL ChOx. These solutions were mixed and left to incubate for 60 minutes at
45⁰C and then analyzed by ECL.
10
Preparation of CdSeTe/ZnS core-shell QD-chitosan-ChOx composite film
Water-soluble CdSeTe/ZnS QDs were dropcast onto the electrode and left to dry in the fridge
for 1 hour. 0.05% chitosan was then dropcast on top of this film and allowed to dry in the fridge
for 1 hour. This film was then incubated in 10% glutaraldehyde for 1 hour at room temperature
followed by washing with distilled water. The electrode was then incubated in a 10 mg/mL
solution of ChOx for 3 hours at room temperature followed by washing in PBS-Tween and
distilled water. These films were then immersed in solutions of cholesterol and immediately
analyzed.
11
RESULTS AND DISCUSSION
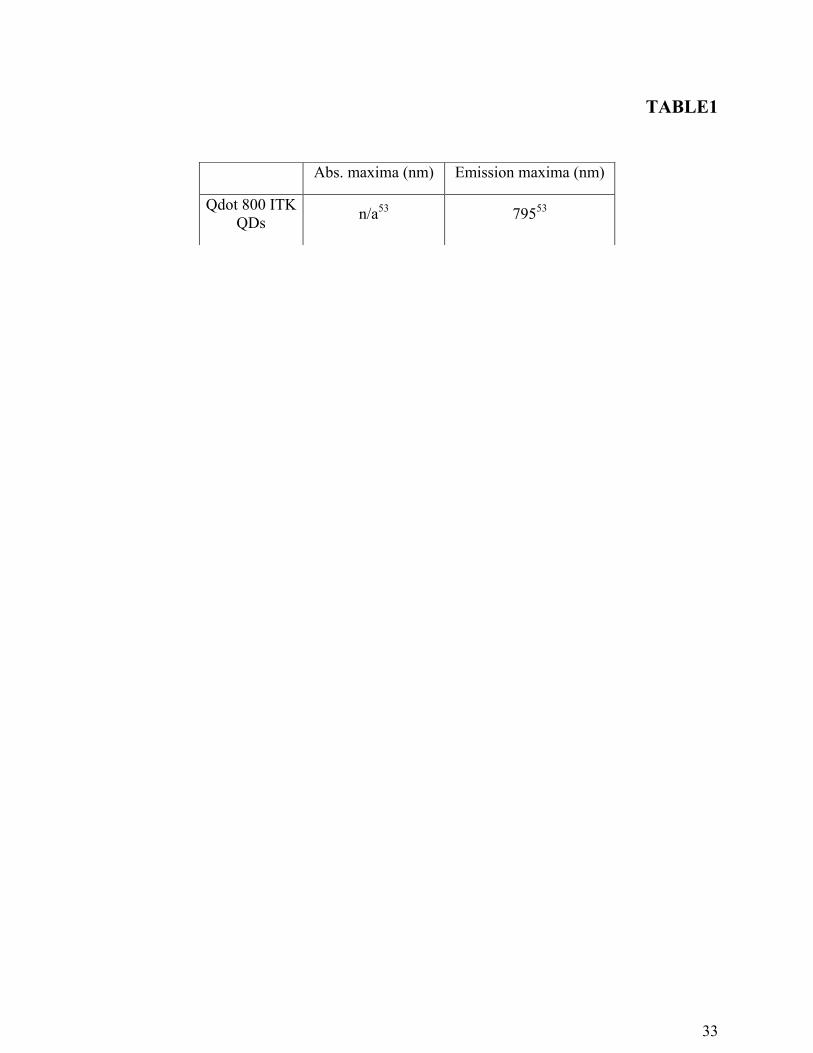
Characterisation of the QD/chitosan composite film. The absorption and emission profiles of
the QDs are shown in Table 1. Examination of the QDs was undertaken utilizing emission
spectrometry. The emission maximum for the QDs lies at ~795 nm. This is related to the
radiative recombination of electrons, which have been excited into higher energy levels of the
QD following photon absorption, as they return to the ground state.
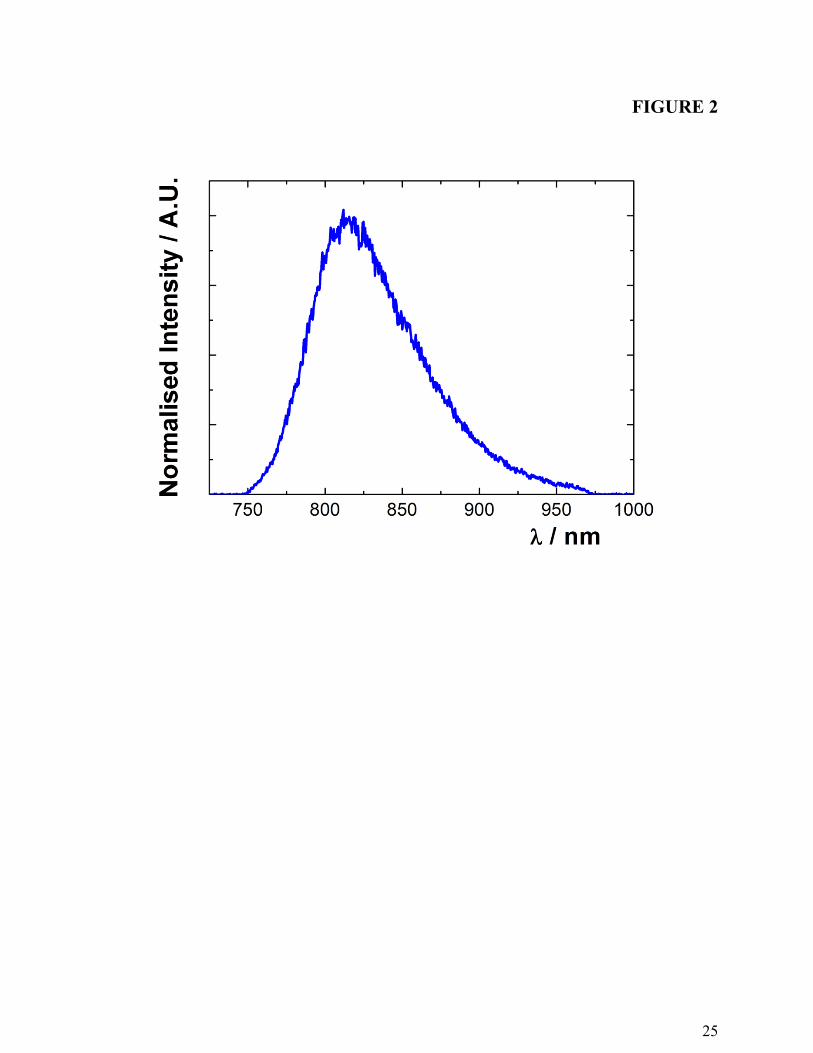
The ECL spectrum of the QDs, Fig. 2, shows an emission peak at approximately 810 nm, ~15
nm longer than the photo-induced emission peaks of the QDs. This red shifted wavelength
associated with the surface-confined electrochemical reactions leading to emission in the ECL
process is most likely due to the difference in the reorganization energy of this route when
compared to standard, optically-induced emission, as seen previously.26-27, 48-50
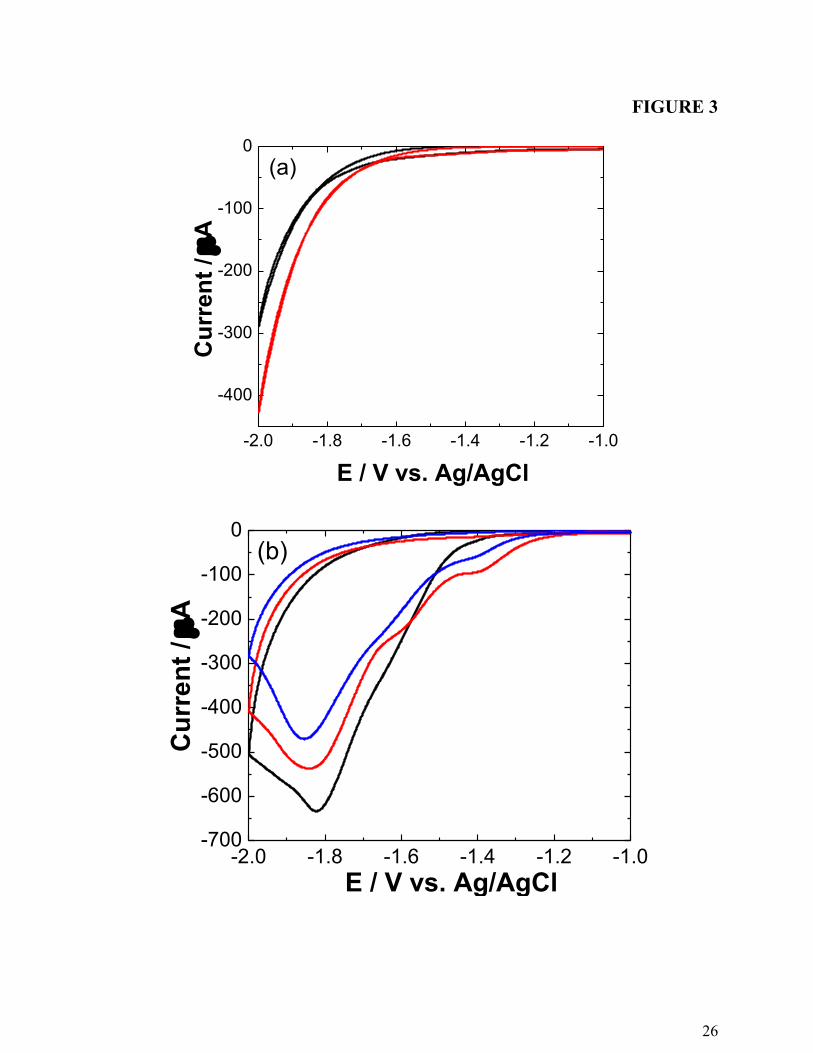
The electrochemical characteristics of a blank GCE and the QD/chitosan films in the presence
and absence of H2O2 and in the presence of cholesterol were investigated using cyclic
voltammetry (CV) and are shown in Fig. 3. When no QD/chitosan film is present, no discernable
peaks are observed. Following QD/chitosan film application, a peak is observed at -1.8 V vs.
Ag/AgCl in all cases. Investigations into this peak (see supplementary data) suggested it was
related to a secondary reduction of the QDs themselves, which resulted in their destruction.
When H2O2 is introduced into the system, either directly or via cholesterol oxidation, two
additional irreversible reduction processes are observed at approximately -1.35 V and -1.55 V vs.
Ag/AgCl. The peak at -1.35 V is related to the concentration of H2O2 (peak current increases
with increasing H2O2 concentration – see supplementary data), suggesting it is associated with its
direct reduction or the reduction of one of its degradation products, such as the formation of
hydroxyl ions from hydroxyl radicals. The peak at -1.55 V is likely related to a similar process,
12
but may involve reduction of a species created following electron transfer between film
components, causing this increase in peak potential.
In the presence of an incubated cholesterol/ChOx solution, the same reduction peaks are
observed as when H2O2 is present, indicating that oxidation of cholesterol has been successful
and H2O2 has been produced following reduction of dissolved oxygen. H2O2 can then act as a co-
reactant for the production of ECL from the QDs through the following electrochemical
reactions:51-52
QDs + 1e- → QDs(e
-1Se) (1)
QDs(e-1Se) + H2O2 → QDs + OH
- + OH
• (2)
OH• + QDs → OH
- + QDs(h
+1Sh) (3)
QDs(e-1Se) + OH
•→ OH
- + QDs* (4)
QDs(e-1Se) + QDs(h
+1Sh)→ QDs* (5)
QDs* → QDs + hν (800 nm) (6)
Initially, electrons are injected into the 1Se quantum confined orbital of the QDs to create
electron-injected QD intermediates (equation (1)) that are capable of reducing H2O2 to OH- and
OH• (equation (2)) following a simulated Haber-Weiss reaction. Typically, this requires
superoxide, O2-, generated through the single electron reduction of oxygen. However, in this
case, QDs(e-1Se) acts as the radical anion in place of superoxide to reduce H2O2 to OH
•. This
hydroxyl radical is the crucial species for ECL production in this system and following its
formation is reduced in the process of injecting a hole into the 1Sh quantum confined orbital of a
QD to create hole-injected QDs, QDs(h+1Sh) (equation (3)). This process is favorabledueto the
13
high standard redox potential of the OH-/OH
• couple. Excited state QDs (QDs*) can then be
formed via an annihilation or co-reactant pathway. Hole-injected QDs can recombine with
electron-injected QDs to create QDs* via the annihilation route (equation (5)), whilst reduced
QDs can also interact directly with OH• to create QDs* following the co-reactant route (equation
(4)). Both of these processes result in the formation of QDs*, which will relax to the ground state
accompanied by the emission of light at a wavelength determined by the band gap, and therefore
size, of the QD material. In the presence of H2O2, two ECL peaks were present, which has been
observed previously.46
The initial peak, ECL-1, was shown to result from the interaction of a
nanocrystal species formed due the reduction of the QDs and the co-reactants, whilst ECL-2 is
produced from the interaction of the co-reactants and the assembly of QD reduced nanocrystal
species. Investigations in this study, showed that ECL-2 is more sensitive to the dissolved H2O2,
and thus was chosen to detect H2O2 for developing ECL sensing applications of these
QD/chitosan films.
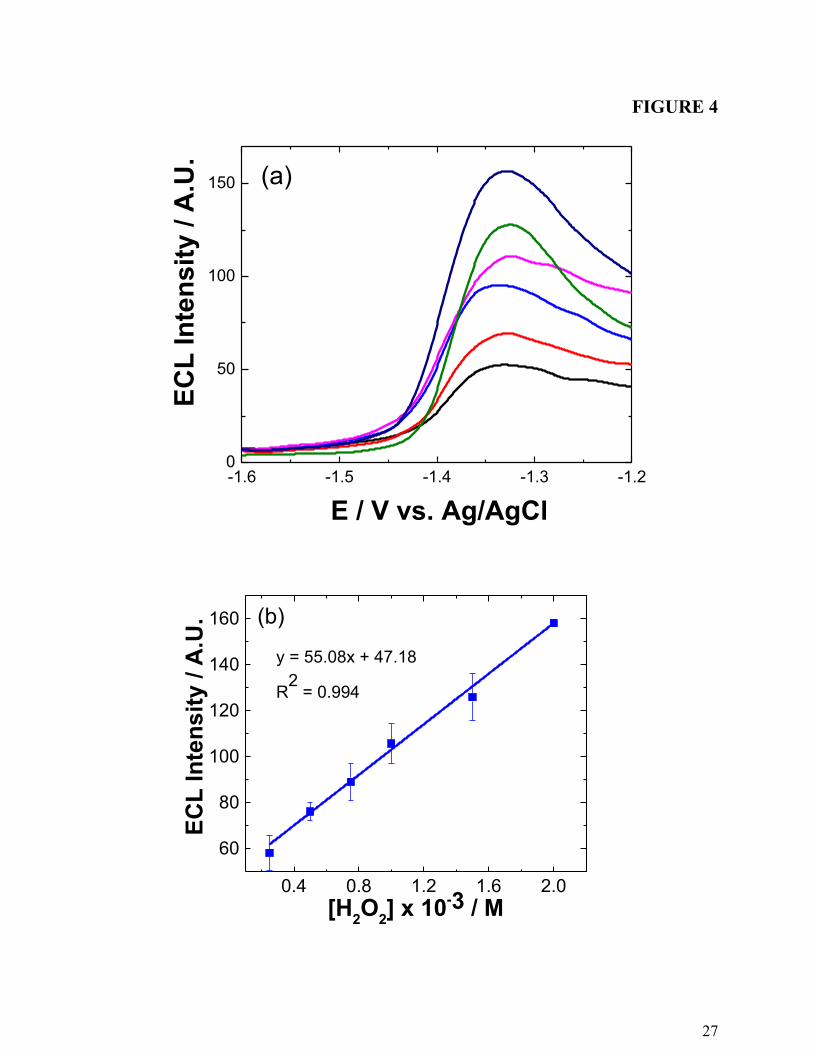
ECL of the QD/chitosan composite film. Fig. 4 illustrates the ECL response of the
QD/chitosan composite film as a function of H2O2concentration. An ECL peak is seen at
approximately -1.35 V vs. Ag/AgCl, with intensity increasing linearly with increasing H2O2
concentrations from 0.25 to 2 mM. This peak is closely related to the reduction process seen in
the CVs at a very similar potential, indicating the two events are closely related and that ECL
emission is dependent upon this process.46
Reproducibility was improved by using small volumes, below 1.5 L of QD/chitosan which
reduced the possibility of aggregation of the QDs in the film which might lead to variations in
the ECL response.
14
Quantitative Detection of Cholesterol. In the presence of ChOx, H2O2 is produced as a by-
product of cholesterol oxidation and can then act as a co-reactant for the production of QD ECL,
in the reactions described previously (equations 1 – 6). As a linear ECL response to H2O2 has
been achieved, it is proposed that QD/chitosan film ECL could be used for the quantitative
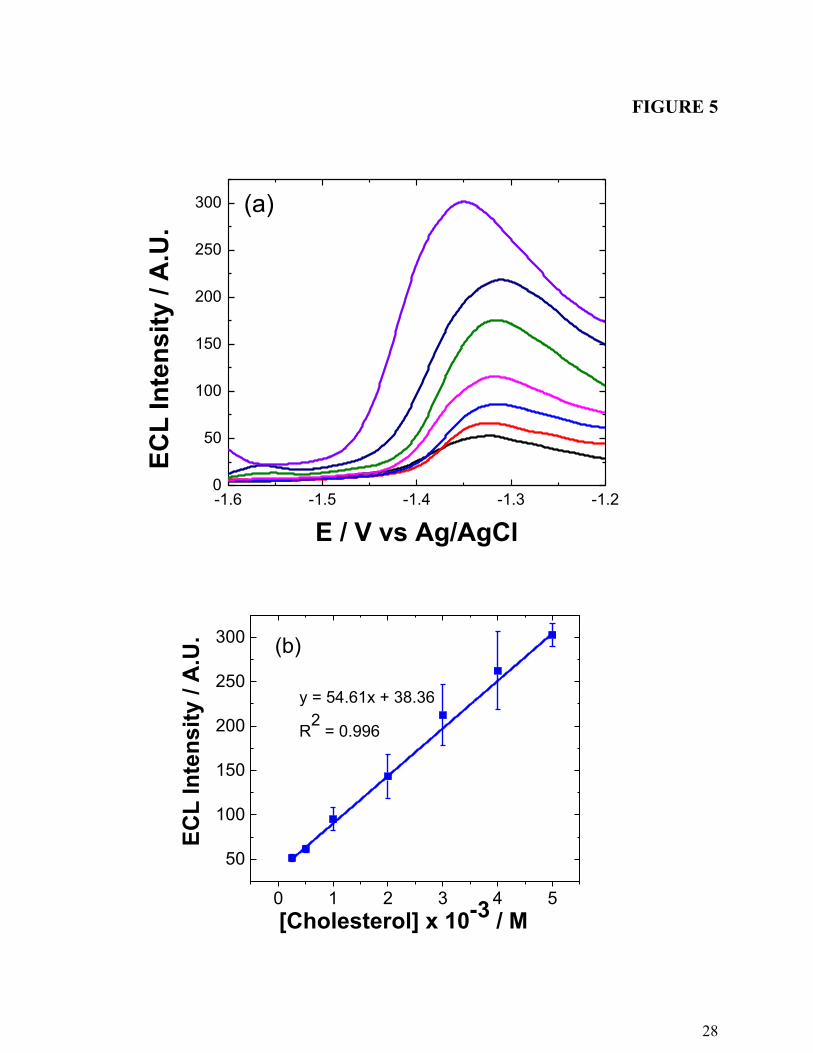
detection of cholesterol. Fig. 5 shows the ECL response of the QD/chitosan films to increasing
cholesterol concentrations.
The ECL signal shows a linear dependence over the range 0.25-5 mM cholesterol. The ECL
spectrum is consistent with those acquired using H2O2 co-reactant, as shown in Fig. 4. This
indicates that H2O2 is successfully being produced at a concentration dependent upon the
cholesterol concentration and can therefore be utilized to monitor cholesterol concentration. As
such, an increase in ECL intensity is seen with an increase in total cholesterol concentration.
Above 5 mM, the ECL response deviates from linearity; however this is above the medical cut-
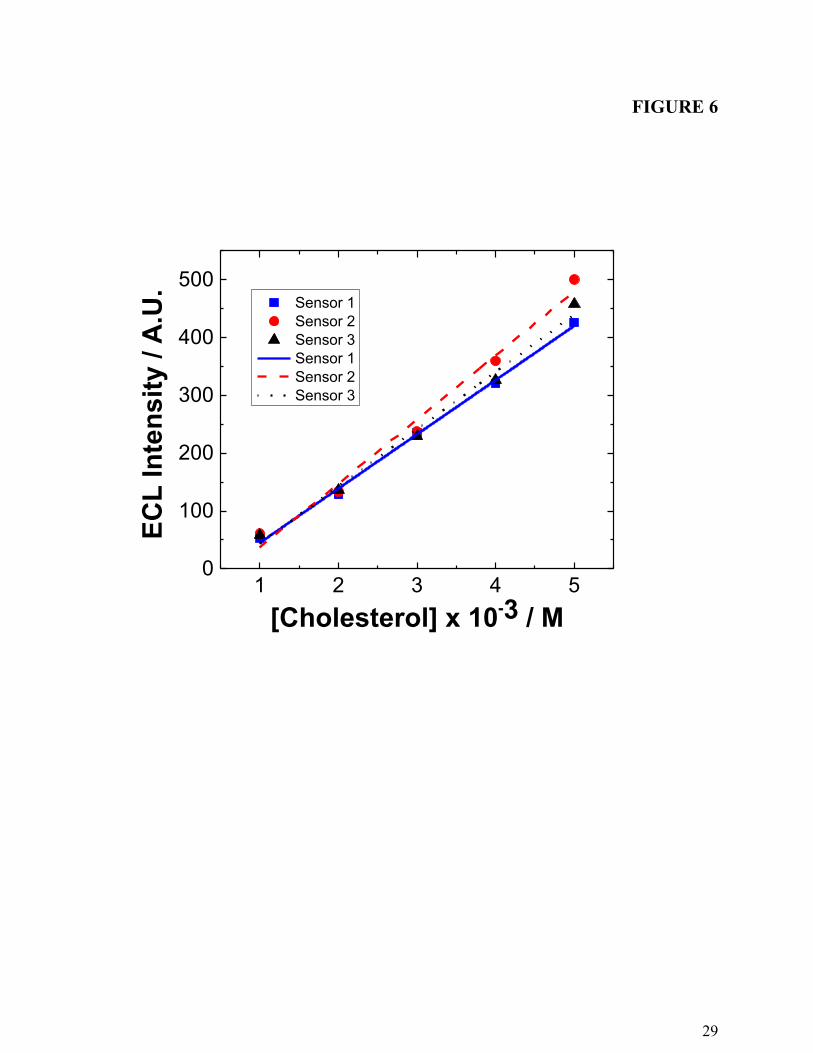
off for high cholesterol.8 The response from multiple biosensors was investigated to determine
the reproducibility of this system and is shown in Fig. 6.
This shows a reproducible linear response to increasing cholesterol concentrations from three
independent biosensors, highlighting the consistent behaviour of this system. QD stability over a
three week period was examined to give an indication of the shelf-life of this biosensor
(supplementary information, Fig. S2). A consistent ECL response from the QDs is apparent over
the considered period, with a drop in intensity of only 5.2% after three weeks. Response
variability increases at the three week point, indicating biosensor reproducibility may suffer after
this time.
15
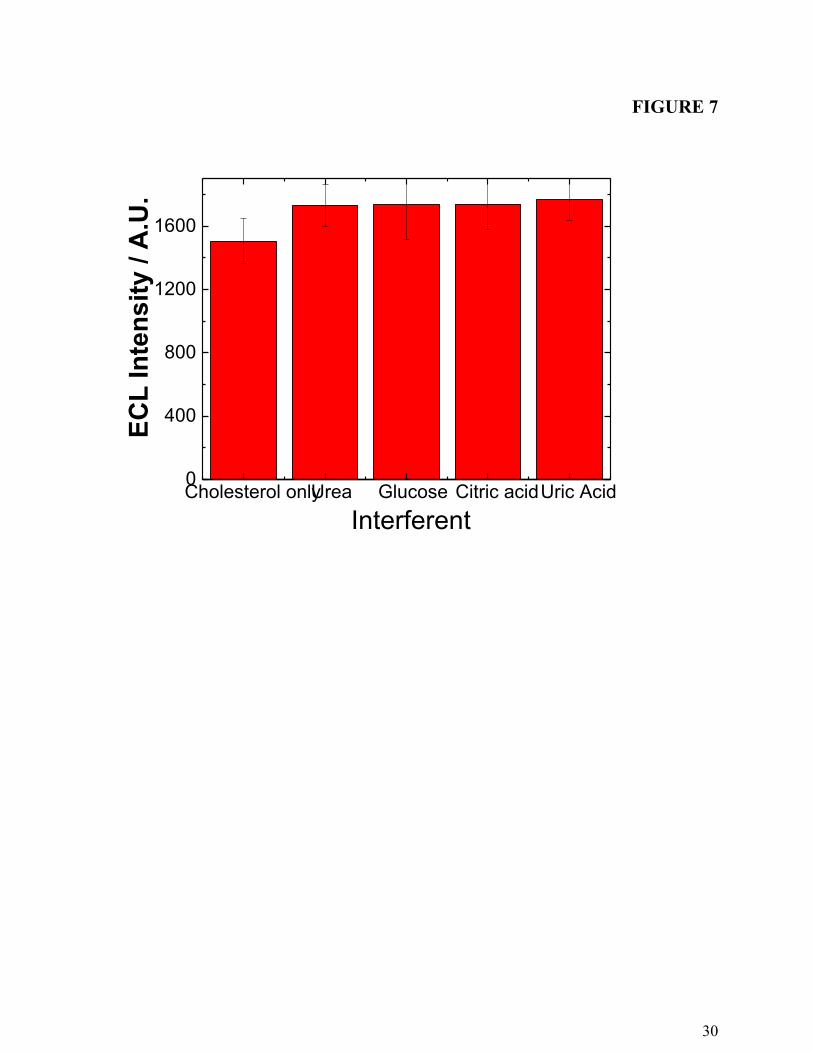
In order to determine the clinical viability and cross-reactivity of this system, the influence of
interferents commonly found in clinical samples (glucose, urea, citric acid) on the ECL response
of this biosensor in 5 mM cholesterol is shown in Fig. 7.
None of these had any appreciable effect on the observed ECL intensity indicating good sensor
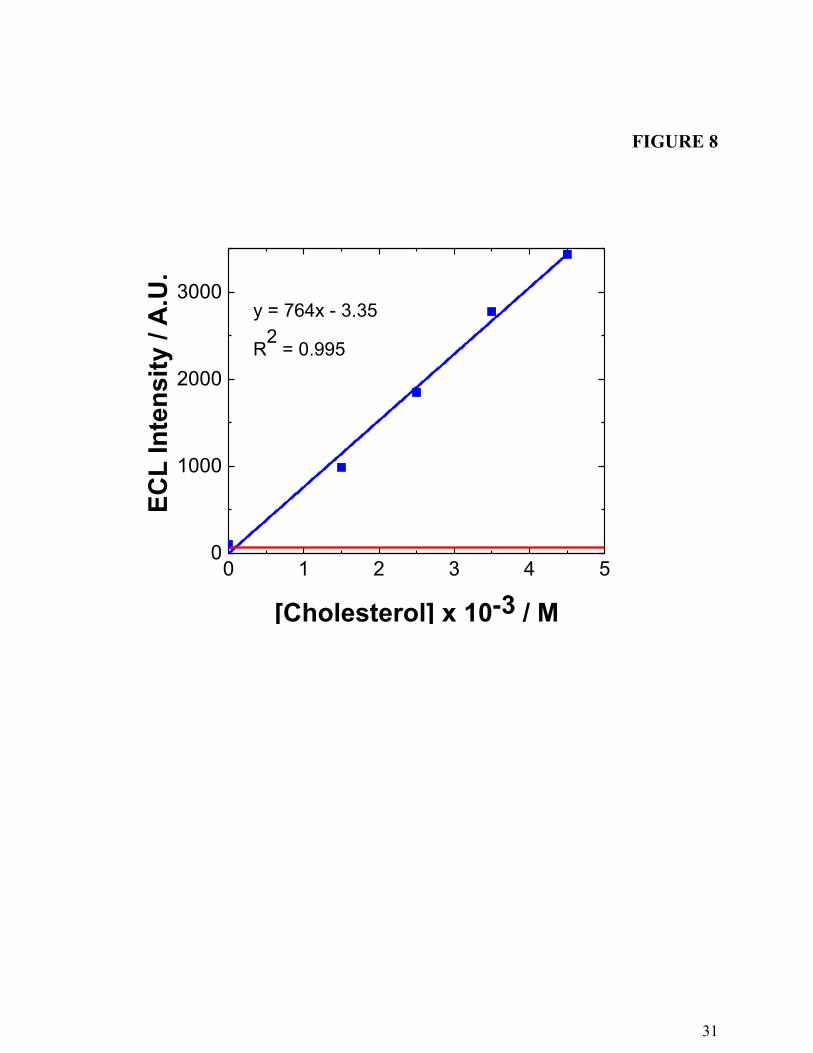
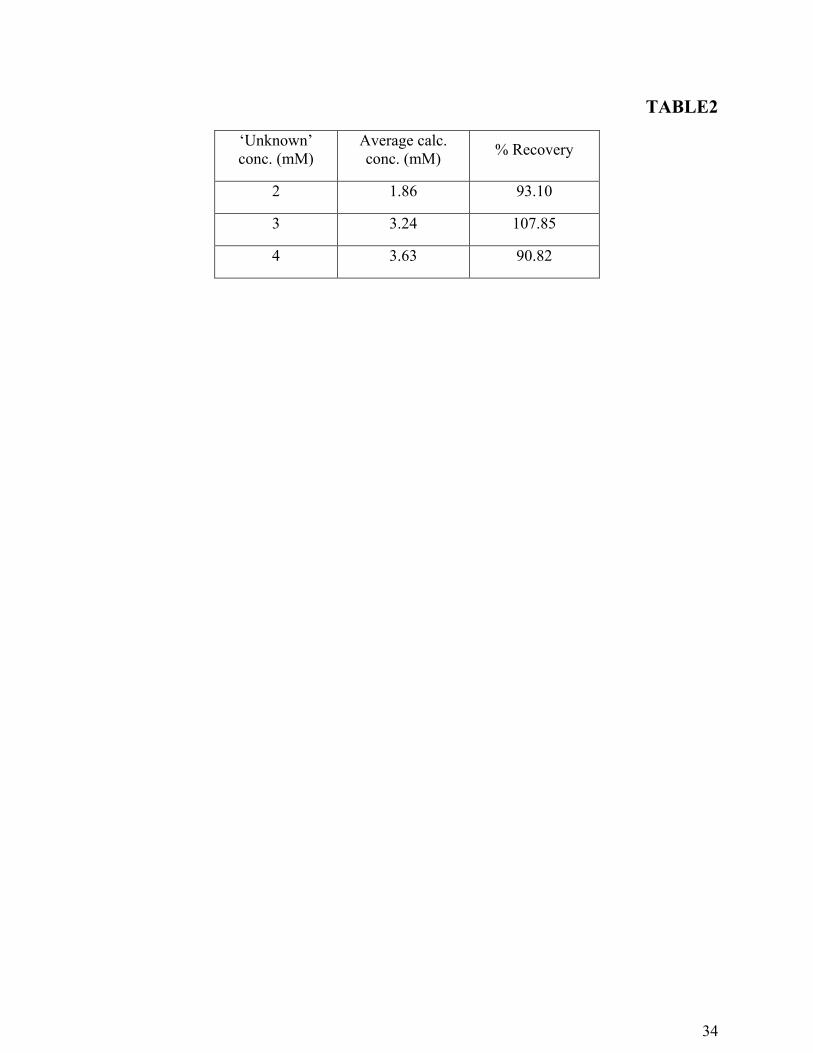
specificity. Therefore, human serum samples were spiked with increasing cholesterol
concentrations and the response of the QD/chitosan film in each sample was measured (Fig. 8).
A linear range from 1.5 to 4.5 mM cholesterol was examined and the ECL responses were used
to quantify cholesterol in spiked serum samples. Table 2 described the results obtained for the
spiked serum samples, showing an averaged recovery of 93% over the concentrations examined.
These results show that this specific system can be used to determine cholesterol
concentrations from human serum samples, confirming the viability of this biosensor. In order to
progress the development of this sensor, the incubation step was removed and evaluation of the
QD film ECL response following immobilization of ChOx on the electrode surface was
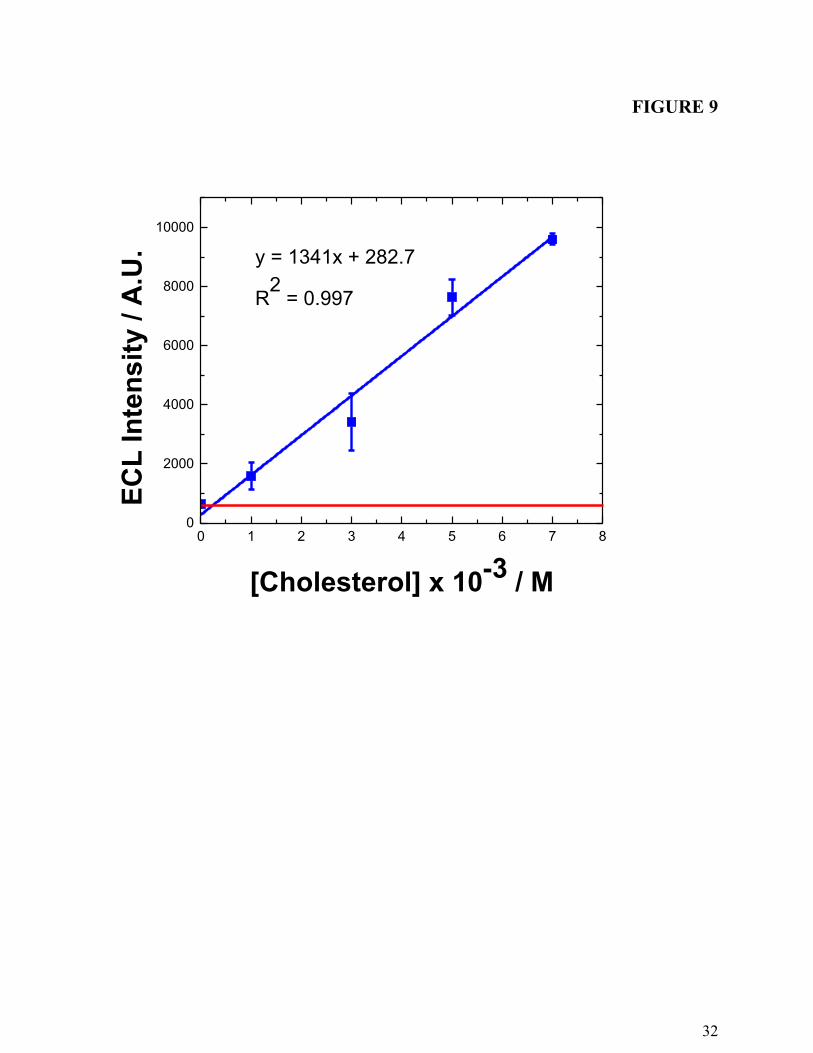
investigated. Figure 9 shows the response of these QD/chitosan/ChOx films to increasing
cholesterol concentrations.
As with ChOx in solution, a peak at approximately -1.35 V vs. Ag/AgCl was observed, with
the ECL intensity linearly dependent upon the cholesterol concentration. The linear range was
expanded to examine the concentration range 0 mM [cholesterol] 7 mM cholesterol. This
suggests that the system is sufficiently sensitive to detect H2O2 even without an incubation step,
opening up possibilities for future development into a more rapid, convenient biosensor for
cholesterol detection.
16
CONCLUSIONS
An ECL biosensor for the determination of total blood cholesterol was demonstrated using
water-soluble CdSeTe/ZnS core-shell QDs. Electrodes modified with thin films containing these
NIR ECL QDs were used to monitor the cholesterol concentrations as a result of the production
of H2O2 during the ChOx-catalyzed oxidation of cholesterol. The ECL response showed good
linear dependence on cholesterol concentrations over the clinically relevant range. This system
was then successfully used to generate a linear calibration plot for cholesterol in spiked human
serum samples and to quantify cholesterol in unknown human serum samples. As far as the
authors know, this is one of the first ECL biosensors based on NIR emission from QD films
examining the applicability of these sensors for blood serum analysis. The major advantage of
this is the much improved penetrability of the ECL signal through biological samples, paving the
way for developments in whole blood point-of-care biosensing based on these nano-architectured
surfaces. Future studies will examine interferences, storage stability as well as pH and
temperature effects for the integration of this biosensor in a lab-on-a-chip system.
17
REFERENCES
1. Durrington, P., The Lancet 2003, 362, (9385), 717-731.
2. Tan, M.; Dickinson, M.; Albers, J.; Havel, R.; Cheung, M.; Vigne, J., The American
journal of clinical nutrition 1980, 33, (12), 2559-2565.
3. Kovala, J. P., Cholesterol in Atherosclerosis and Coronary Heart Disease. Nova Science
Pub Incorporated: 2005.
4. Castelli, W. P.; Anderson, K., The American Journal of Medicine 1986, 80, (2,
Supplement 1), 23-32.
5. Ezzati, M.; Lopez, A. D.; Rodgers, A.; Vander Hoorn, S.; Murray, C. J. L., The Lancet
2002, 360, (9343), 1347-1360.
6. Collins, R.; Armitage, J.; Parish, S.; Sleight, P.; Peto, R.; null, Lancet 2004, 363, (9411),
757-767.
7. Aspry, K. E.; Holcroft, J. W.; Amsterdam, E. A., American journal of preventive
medicine 1995, 11, (5), 336-341.
8. Gordon, D. J.; Probstfield, J. L.; Garrison, R. J.; Neaton, J. D.; Castelli, W. P.; Knoke, J.
D.; Jacobs, D. R.; Bangdiwala, S.; Tyroler, H. A., Circulation 1989, 79, (1), 8-15.
9. Castelli, W. P.; Garrison, R. J.; Wilson, P. F.; Abbott, R. D.; Kalousdian, S.; Kannel, W.
B., JAMA 1986, 256, (20), 2835-2838.
10. Bonow, R. O., Circulation 2002, 106, (25), 3140-3141.
11. Mathieu, P.; Pibarot, P.; Larose, É.; Poirier, P.; Marette, A.; Després, J.-P., The
international journal of biochemistry & cell biology 2008, 40, (5), 821-836.
12. Stocker, R.; Keaney, J. F., Physiological reviews 2004, 84, (4), 1381-1478.
13. Navab, M.; Reddy, S. T.; Van Lenten, B. J.; Fogelman, A. M., Nature Reviews
Cardiology 2011, 8, (4), 222-232.
18
14. Cui, Y.; Blumenthal, R. S.; Flaws, J. A.; Whiteman, M. K.; Langenberg, P.; Bachorik, P.
S.; Bush, T. L., Archives of Internal Medicine 2001, 161, (11), 1413-1419.
15. Kenny, A., Biochemical Journal 1952, 52, (4), 611.
16. Wong, W. W.; Hachey, D. L.; Clarke, L. L.; Zhang, S.; Llaurador, M.; Pond, W. G.,
Applied radiation and isotopes 1994, 45, (4), 529-533.
17. Agulló, E.; Gelós, B. S., Food research international 1996, 29, (1), 77-80.
18. Tan, X.; Li, M.; Cai, P.; Luo, L.; Zou, X., Anal Biochem 2005, 337, (1), 111-120.
19. Vidal, J.-C.; Espuelas, J.; Garcia-Ruiz, E.; Castillo, J.-R., Talanta 2004, 64, (3), 655-664.
20. Crumbliss, A.; Stonehuerner, J.; Henkens, R.; Zhao, J.; O'Daly, J., Biosensors and
Bioelectronics 1993, 8, (6), 331-337.
21. Guo, M.; Chen, J.; Li, J.; Nie, L.; Yao, S., Electroanalysis 2004, 16, (23), 1992-1998.
22. Brahim, S.; Narinesingh, D.; Guiseppi-Elie, A., Analytica chimica acta 2001, 448, (1),
27-36.
23. Arora, A.; Eijkel, J. C. T.; Morf, W. E.; Manz, A., Analytical Chemistry 2001, 73, (14),
3282-3288.
24. Fan, F.-R. F., Electrogenerated Chemiluminescence. 1 ed.; Marcel Dekker, Inc.: New
York, 2004; Vol. 1, p 540.
25. Qi, H.; Peng, Y.; Gao, Q.; Zhang, C., Sensors 2009, 9, (1), 674-695.
26. en atanara anan . ehar-D l e, A.-M.; Dennany, L.; Pellegrin, Y.; Keyes, T. E.;
Forster, R. J., Langmuir 2008, 24, (19), 11233-11238.
27. O'Reilly, E. J.; Keyes, T. E.; Forster, R. J.; Dennany, L., Analyst 2013, 138, (2), 677-682.
28. Devadoss, A.; Dennany, L.; Dickinson, C.; Keyes, T. E.; Forster, R. J., Electrochemistry
Communications 2012, 19, (0), 43-45.
19
29. Marquette, C. A.; Ravaud, S.; Blum, L. J.,Analytical Letters2000, 33, (9), 1779-1796.
30. Ballesta-Claver, J.; Ametis-Cabello, J.; Morales-Sanfrutos, J.; Megía-Fernández, A.;
Valencia-Mirón, M.; Santoyo-González, F.; Capitán-Vallvey, L., Analytica chimica acta 2012,
754, 91-98.
31. Kumar, A.; Malhotra, R.; Malhotra, B.; Grover, S., Analytica chimica acta 2000, 414,
(1), 43-50.
32. Li, J.; Peng, T.; Peng, Y., Electroanalysis 2003, 15, (12), 1031-1037.
33. Singh, S.; Singhal, R.; Malhotra, B., Analytica chimica acta 2007, 582, (2), 335-343.
34. Wang, H.; Mu, S., Sensors and Actuators B: Chemical 1999, 56, (1), 22-30.
35. Singh, S.; Solanki, P. R.; Pandey, M.; Malhotra, B., Sensors and Actuators B: Chemical
2006, 115, (1), 534-541.
36. idal . . arc a, E.; Castillo, J. R., Analytica chimica acta 1999, 385, (1), 213-222.
37. Singh, S.; Chaubey, A.; Malhotra, B., Analytica chimica acta 2004, 502, (2), 229-234.
38. Singh, S.; Chaubey, A.; Malhotra, B., Journal of applied polymer science 2004, 91, (6),
3769-3773.
39. a a B. Şahin F. Demirel . Tümtür H. Biochemical Engineering Journal 2009,
43, (3), 333-337.
40. Dennany, L.; Forster, R. J.; Rusling, J. F., Journal of the American Chemical Society
2003, 125, (17), 5213-5218.
41. Dennany, L.; Forster, R. J.; White, B.; Smyth, M.; Rusling, J. F., Journal of the American
Chemical Society 2004, 126, (28), 8835-8841.
42. Ding, Z.; Quinn, B. M.; Haram, S. K.; Pell, L. E.; Korgel, B. A.; Bard, A. J., Science
2002, 296, (5571), 1293-1297.
20
43. Zhu, L.; Xu, L.; Tan, L.; Tan, H.; Yang, S.; Yao, S., Talanta 2012.
44. Hong, L.; Liu, A.-L.; Li, G.-W.; Chen, W.; Lin, X.-H., Biosensors and Bioelectronics
2013, 43, (0), 1-5.
45. VandeVord, P. J.; Matthew, H. W. T.; DeSilva, S. P.; Mayton, L.; Wu, B.; Wooley, P. H.,
Journal of Biomedical Materials Research 2002, 59, (3), 585-590.
46. Mansouri, S.; Lavigne, P.; Corsi, K.; Benderdour, M.; Beaumont, E.; Fernandes, J. C.,
European Journal of Pharmaceutics and Biopharmaceutics 2004, 57, (1), 1-8.
47. Woelfle, C.; Claus, R. O., Nanotechnology 2007, 18, (2), 025402.
48. Dennan L. O’Reill E. . Innis P. . Wallace . . Forster R. . Electrochimica
Acta 2008, 53, (13), 4599-4605.
49. Dennany, L.; Gerlach, M.; O'Carroll, S.; Keyes, T. E.; Forster, R. J.; Bertoncello, P.,
Journal of Materials Chemistry 2011, 21, (36), 13984-13990.
50. Devadoss, A.; Dennany, L.; Dickinson, C.; Keyes, T. E.; Forster, R. J., Electrochemistry
Communications 2012, 19, 43-45.
51. Zou, G.; Ju, H., Analytical Chemistry 2004, 76, (23), 6871-6876.
52. Jiang, H.; Ju, H., Analytical Chemistry 2007, 79, (17), 6690-6696.
53. Rosenblum, L. T.; Kosaka, N.; Mitsunaga, M.; Choyke, P. L.; Kobayashi, H., Contrast
Media & Molecular Imaging 2011, 6, (3), 148-152.
21
AUTHOR INFORMATION
Corresponding Author
*WestCHEM. Department of Pure and Applied Chemistry, University of Strathclyde. 295
Cathedral Street, Glasgow, G1 1XL. Fax: +141 548 2535; Tel: +141 548 4322; Email:
ACKNOWLEDGMENT
This research is based upon works supported by the European Union 7th
Framework programme,
Marie Curie Reintegration Grant (PIRG-2010-268236).
22
LEGENDS
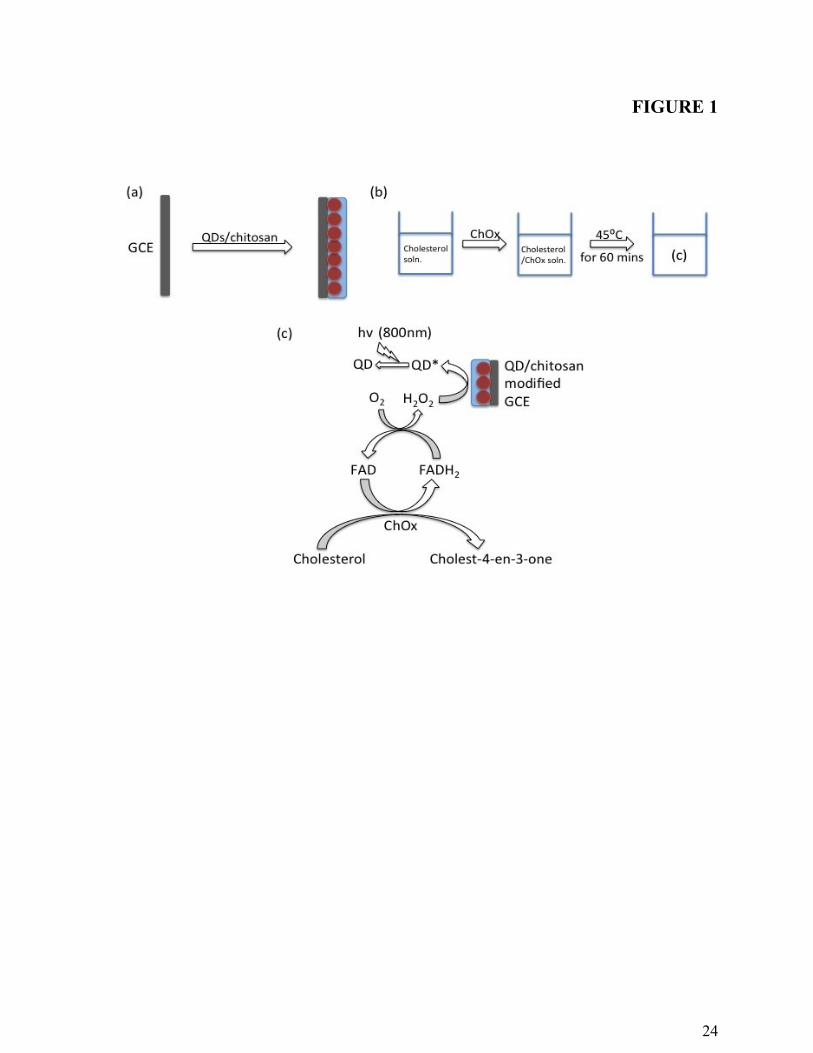
Figure 1. (a) Preparation of the modified GCE by drop-casting QD/chitosan composite, (b)
preparation of the cholesterol/ChOx solution with incubation at 45°C for 60 minutes and (c)
generation of QD ECL signal through interaction with H2O2 co-reactant, produced in the ChOx-
catalysed oxidation of cholesterol.
Figure 2. The ECL spectrum of CdSeTe/ZnS QDs in 2mM H2O2 at a potential of -1.5 V vs.
Ag/AgCl.
Figure 3. Current response for: (a) blank GCE in 0.1 M PBS (black line) and in 2 mM H2O2 (red
line), (b) QD/chitosan film in 0.1 M PBS (black line), with 2 mM H2O2 (red line) and in 3 mM
cholesterol (blue line) incubated with ChOx for 75 mins at 45°C. These were carried out at a
scan rate of 100 mV s-1
over the potential range -2 V ≤ν≤ -1 V vs. Ag/AgCl.
Figure 4. (a) ECL response of QD/chitosan film to increasing H2O2 concentration (0.25 (black
line), 0.5 (red line), 1 (blue line), 2 (pink line), 3 (green line), 4 (navy line) and 5 (navy line)
mM) at a scan rate of 100 mV s-1
over the potential range -1.6 ≤ ν≤ -1.2 V vs. Ag/AgCl and (b)
the linear dependence of ECL response with respect to [H2O2] for the QD/chitosan film. Error
bars represent triplicate data points.
Figure 5. (a) ECL response of QD/chitosan film to increasing cholesterol concentration (0.25
(black line), 0.5 (red line), 0.75 (blue line), 1 (pink line), 1.5 (green line) and 2 (purple line) mM)
at a scan rate of 100 mV s-1
over the potential range -1.6 ≤ ν≤ -1.2 V vs. Ag/AgCl and (b) the
linear dependence of ECL response with respect to [cholesterol] for the QD/chitosan film. Error
bars represent triplicate data points.
23
Figure 6. The linear dependence of ECL response with respect to [cholesterol] for 3 independent
biosensors.
Figure 7. Dependence of the ECL response at -1.35 V for the QD/chitosan film in 5 mM
cholesterol with 10 mM urea, 10 mM glucose, 1 mg/mL citric acid and 10 mM uric acid. Error
bars represent triplicate data points.
Figure 8. Dependence of the ECL response at -1.35 V with respect to [cholesterol] for the
QD/chitosan film in spiked human serum samples. Red line indicates background signal
intensity.
Figure 9. Dependence of the ECL response at -1.35 V with respect to [cholesterol] for the
QD/chitosan/ChOx film. Error bars represent triplicate data points. Red line indicates
background signal intensity.
Table1.Absorption and emission maxima of 2 μM Qdot 800 ITK QDs in PBS.
Table2.Average calculated concentrations and recoveries from unknown human serum samples.
24
FIGURE 1
25
FIGURE 2
26
FIGURE 3
-2.0 -1.8 -1.6 -1.4 -1.2 -1.0
-400
-300
-200
-100
0
(a)
E / V vs. Ag/AgCl
Cu
rre
nt
/
A
-2.0 -1.8 -1.6 -1.4 -1.2 -1.0-700
-600
-500
-400
-300
-200
-100
0(b)
Cu
rren
t /
A
E / V vs. Ag/AgCl
27
FIGURE 4
-1.6 -1.5 -1.4 -1.3 -1.20
50
100
150 (a)
E / V vs. Ag/AgCl
EC
L In
ten
sit
y / A
.U.
0.4 0.8 1.2 1.6 2.0
60
80
100
120
140
160 (b)
y = 55.08x + 47.18
R2
= 0.994
EC
L In
ten
sit
y / A
.U.
[H2O
2] x 10
-3 / M
28
FIGURE 5
-1.6 -1.5 -1.4 -1.3 -1.20
50
100
150
200
250
300 (a)
E
CL
In
ten
sit
y /
A.U
.
E / V vs Ag/AgCl
0 1 2 3 4 5
50
100
150
200
250
300
EC
L I
nte
ns
ity
/ A
.U.
[Cholesterol] x 10-3
/ M
y = 54.61x + 38.36
R2
= 0.996
(b)
29
FIGURE 6
1 2 3 4 50
100
200
300
400
500
Sensor 1
Sensor 2
Sensor 3
Sensor 1
Sensor 2
Sensor 3
EC
L In
ten
sit
y / A
.U.
[Cholesterol] x 10-3 / M
30
FIGURE 7
Cholesterol onlyUrea Glucose Citric acidUric Acid0
400
800
1200
1600
E
CL
In
ten
sit
y /
A.U
.
Interferent
31
FIGURE 8
0 1 2 3 4 50
1000
2000
3000y = 764x - 3.35
R2
= 0.995
EC
L In
ten
sit
y / A
.U.
[Cholesterol] x 10-3 / M
32
FIGURE 9
0 1 2 3 4 5 6 7 80
2000
4000
6000
8000
10000
y = 1341x + 282.7
R2
= 0.997
EC
L In
ten
sit
y / A
.U.
[Cholesterol] x 10-3
/ M
33
TABLE1
Abs. maxima (nm) Emission maxima (nm)
Qdot 800 ITK
QDs n/a
53 795
53
34
TABLE2
‘Un nown’
conc. (mM)
Average calc.
conc. (mM) % Recovery
2 1.86 93.10
3 3.24 107.85
4 3.63 90.82