Embed Size (px)
Citation preview
The author(s) shown below used Federal funds provided by the U.S. Department of Justice and prepared the following final report: Document Title: A Chip-Based Genetic Detector for Rapid
Identification of Individuals Author(s): Ron Sosnowski Document No.: 213911 Date Received: April 2006 Award Number: 1997-LB-VX-0004 This report has not been published by the U.S. Department of Justice. To provide better customer service, NCJRS has made this Federally-funded grant final report available electronically in addition to traditional paper copies.
Opinions or points of view expressed are those
of the author(s) and do not necessarily reflect the official position or policies of the U.S.
Department of Justice.
Final Report
A Chip-Based Genetic Detector for
Rapid Identification of Individuals
National Institute of Justice
Project No.: 97-LB-VX-0004
Project Period: 09-01-2002 - 06-30-2005
Nanogen, Inc.
10398 Pacific Center Court
San Diego, CA 92121
This document is a research report submitted to the U.S. Department of Justice. This report has not been published by the Department. Opinions or points of view expressed are those of the author(s)
and do not necessarily reflect the official position or policies of the U.S. Department of Justice.
Project Title: “A Chip-Based Genetic Detector for Rapid Identification of
Individuals”
Project No.: 97-LB-VX-0004
National Institute of Justice Project Period: 09-01-2002 - 06-30-2005 Principal Investigator: Dr. Ron Sosnowski Nanogen, Inc.
Research scientists, engineers and technicians who contributed to the project throughout the period of performance are listed in alphabetical order below:
Jacob Bramer Stuart Duffy Richard Gelbart Sandra Gore Tammy Grogan Matthew Harris Ying Huang Dalibor Hodko Penelope Isabella Manny Jimenez Shila Jalali Sunghae Joo Naomi Kernoski Jain Krotz Graham Lidgard James Light Beth Mather Karen Menge Monika Milewski Kenny Nguyen Toni Paladino Howie Reese Tony Reyes Ray Radtkey Astrid Schroder Sam Sihapong Jack Shirajian Michael Smith Dan Smolko Bill Street Paul Swanson Huong Tang Don Thomas Will Weisburg Joon Mo Yang Zuxu Yao
Final Report 97-LB-VX-004 1
Table of Contents
page
1. Summary 3
2. Introduction 8
3. Project History 10
4. The STR Hybridization Assay 13
5. Anchored Strand Displacement Amplification 14
6. STRs – On-chip SDA and analysis 19
7. SNPs – On-chip SDA and analysis 21
8. Instruments 23
9. Permeation Layer 26
10. References Cited 28
11. List of Figures 30
12. List of Tables 33
Final Report 97-LB-VX-004 2
1. Summary
Since its introduction in 1985, human DNA identification has steadily
worked its way into the routine of criminal investigation. What started as a highly
controversial means of fighting crime has now become an indispensable tool. Its
initial value was recognized for the ability to associate crime scene evidence with
known suspects. As the power of this method became evident, national
databases of convicted felons were established to allow a search for suspects.
These so-called cold hits, association of crime scene evidence with individuals in
a database, have helped solve many crimes world-wide.
These efforts have also benefited innocent individuals who were errantly
associated with crimes. Numerous convicts have been exonerated either by
fortuitous review or direct solicitation of DNA evidence from a crime.
These positive outcomes have prompted a desire for expanded use of this
powerful tool. One area for expansion is the broadening of legislature controlling
those individuals who might be tested. Currently most states require DNA
identity testing of individuals convicted of violent crimes. However many states
have recently passed laws to expand this testing to all felony convictions. Recent
studies have shown a strong correlation between property crimes and crimes
against individuals 1. A resource sponsored by Applied Biosciences, the DNA
Legislative and Media Report, has shown a substantial increase in new
legislation for expanded DNA testing passed by state legislations:
Final Report 97-LB-VX-004 3
• all felon bills have gone from 5 in 2000 to more than 34 in 2005
• all 50 states require DNA testing for felons convicted of sex crimes
and/or murder
• California, Louisiana, Texas and Virginia allow DNA testing upon
arrest
The last development listed above has been the impetus of this project.
As the use of DNA testing has increased, users have learned that expansion of
its application leads to synergistic effects in fighting crime.1 This report will
address the benefits, issues and our attempt to provide technology for
implementation of Record of Arrest DNA Testing (RADT).
Laws requiring DNA testing during recording of arrests face several
impediments. One issue is funding: many of the laws are dependent on federal
money. However, California recently passed a bill that assesses an additional fee to
court costs to pay for DNA testing. Many other states are currently studying this
model of payment.
While social and safety benefits achieved by preventing crime are of course
paramount, it is important to track the strictly economic impact of crime-fighting
methods. Beneficial use of DNA testing can most easily win public approval if an
economic argument can be made that demonstrates cost savings. Studies are
needed to show that record of arrest DNA testing (RADT) not only reduces crime
Final Report 97-LB-VX-004 4
but also lowers overall investigational costs. The National Forensic DNA Study
Report2 recently collected data to estimate the volume of forensic DNA backlogs,
but did not address the cost-benefits of DNA testing. Further studies providing
econometric data would be useful tools for prioritizing DNA technology
development and gaining pubic support
A further economic consideration is efficient use of lab space. The cost of
increasing the size of forensic DNA testing laboratories is highly prohibitive. This
means that methods requiring equipment that have a large footprint (like fluid handling
robotic platforms ) need to be redeveloped towards the goal of miniaturization and
automation. This will permit a greater efficiency of use of current space.
Reducing labor costs can be achieved through the greater use of automation
provided by integrated, miniaturized systems. Great steps towards improved
efficiency are currently being made through the use of robotic systems. However
these systems require high sample volume to be practical. This is due to the large
capital expense development and maintenance costs associated with robotics. A
better solution would be the miniaturized devices supported by this grant, which
integrate automation into a disposable product.
Reduced labor costs could also be realized with interrupting the criminal
patterns of serial criminals or recidivists, therefore eliminating the cost of investigating
their future crimes. This is achievable through obtaining DNA profiles of suspects at
the time of arrest since many minor crimes are committed by those responsible for
serious offenses. Rapid RADT could further reduce costs by providing evidence to
Final Report 97-LB-VX-004 5

support probable cause, so a suspect could be charged before expiration of a holding
period. This would eliminate the cost of finding and re-arresting the suspect.
Apprehending a charged suspect is likely one of the higher risk duties required by a
law enforcement officer. Benefits will also be realized by reducing the number of
times this duty is required to be performed.
In addition to funding, the lack of appropriate technology is also an impediment
to practical RADT. Current means of DNA identity testing often depend on methods
that require high levels of skill and experience. Compartmentalized rooms with
separate tasks and highly trained individuals are standards for DNA testing today.
Such facilities are highly efficient as centralized processors of biological samples, but
not every police station has timely access to these. Very few police stations have the
space or resources to set up such labs for their own use. To realize the potential
benefits of RADT, DNA identification needs to be self-contained, have a rapid time to
result and be easy to use.
While RADT is a primary target for the device being developed with the support
of this grant, there are other forensic and national defense applications that will benefit
from such a system. Identification of disaster victims in remote sights could be
facilitated by self-contained and mobile instrumentation. These same attributes would
also support crime scene investigations. Such devices could additionally provide
unique advantages for tracking individuals suspected to be a threat to U.S. security.
The 9/11 attack means that we have a new perspective on national security. As such,
there have been proposals to implement DNA testing at ports of entry into the U.S. It
Final Report 97-LB-VX-004 6
is clear that current technology would have difficulty meeting the time-to-result
requirements of that goal.
In Summary, the benefits offered by point-of-use forensic DNA testing include:
1) crime prevention by taking recidivists off the streets, 2) lower investigative costs by
preventing crime, 3) lower investigative costs by providing timely evidence thereby
preventing premature release of arrestees, 4) lower infrastructure costs by more
efficient use of currently available space, 5) lower personnel costs by reduced training
requirements, 6) enable broader application of forensic DNA testing.
The purpose of this research grant has been to investigate development of a
cost-effective, rapid and integrated system for human genetic identification. The
proposed system has been shown to: amplify and analyze target loci directly on
individual array sites, and provide easily interpretable results. This has been
accomplished with both STR and SNP loci.
This project has resulted in the development of numerous assays for
genetic variants relative to forensic investigations. These include STR and SNP
loci. Assays have been developed for use with PCR amplification (STRs) and
anchored SDA (STRs and SNPs). Ultimately, these efforts resulted in a panel of
22 SNP loci featuring automated amplification and analysis. The SNPs were
selected from Y-chromosome, autosomal and mitochondrial loci.
Final Report 97-LB-VX-004 7
2. Introduction
Issue Addressed
Active DNA chip technology offers easy-to-use assays for SNPs and
STRs. This research project supported development of sample-to-answer
devices with the goal of making DNA identification technology capable of
operation by anyone who can take fingerprints. Integration and ease-of-use will
permit rapid turnaround and short chain of custody for forensic samples, enabling
DNA information to be applied during the critical early hours of an investigation.
The Human Identification CODIS and international databases contain
allelic information of short tandem repeat genetic variants. Discovery of STRs by
Alec Jeffreys in the early 1980’s and refinement of Jeffreys’ concept in the early
1990’s represented a breakthrough in genetic analysis because the recently
developed technology of DNA amplification, PCR could be applied to these
variants. Previously used RFLP variants were not amenable to PCR so the
combination of STRs and PCR constituted a broad based breakthrough in human
identification. However, due to the molecular nature of STRs, analysis has been
limited to sieving methodologies. While this method supported rapid acceptance
of DNA identification as a crime-fighting tool, it is limited. Typical sieving
methods include porous gels through which DNA follows a tortuous path,
allowing precise size separation to occur. Size resolution of a single base
difference can be routinely attained.
Final Report 97-LB-VX-004 8
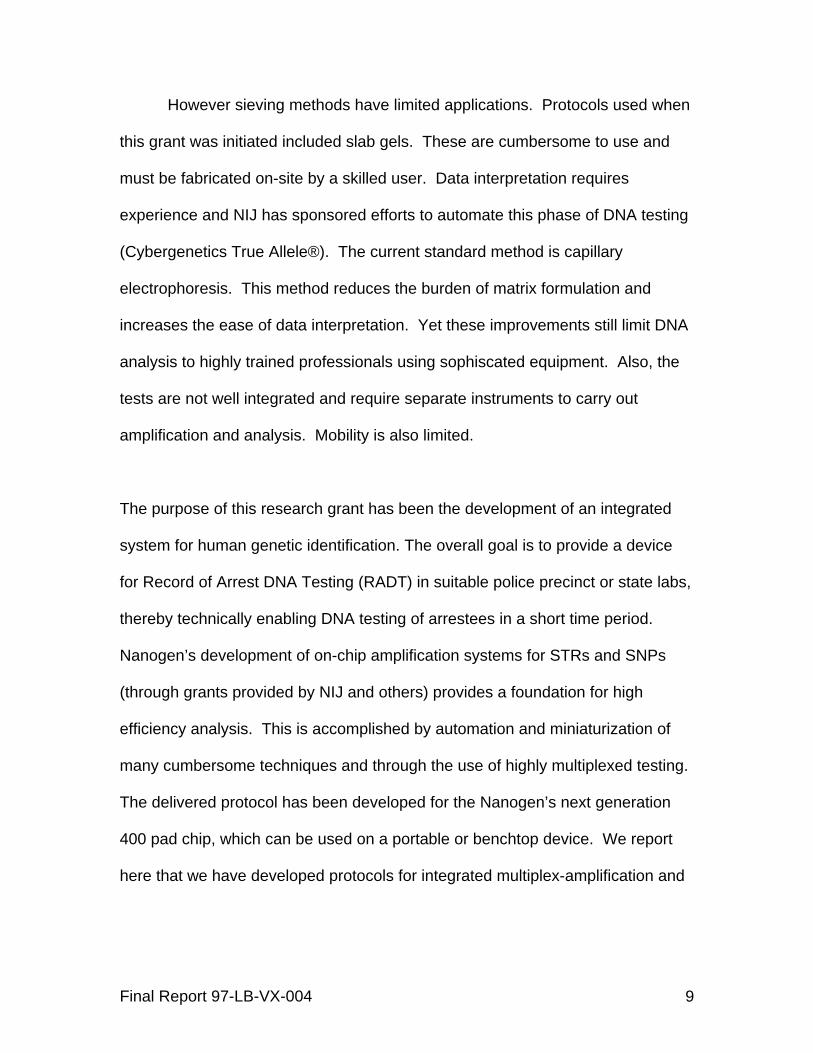
However sieving methods have limited applications. Protocols used when
this grant was initiated included slab gels. These are cumbersome to use and
must be fabricated on-site by a skilled user. Data interpretation requires
experience and NIJ has sponsored efforts to automate this phase of DNA testing
(Cybergenetics True Allele®). The current standard method is capillary
electrophoresis. This method reduces the burden of matrix formulation and
increases the ease of data interpretation. Yet these improvements still limit DNA
analysis to highly trained professionals using sophiscated equipment. Also, the
tests are not well integrated and require separate instruments to carry out
amplification and analysis. Mobility is also limited.
The purpose of this research grant has been the development of an integrated
system for human genetic identification. The overall goal is to provide a device
for Record of Arrest DNA Testing (RADT) in suitable police precinct or state labs,
thereby technically enabling DNA testing of arrestees in a short time period.
Nanogen’s development of on-chip amplification systems for STRs and SNPs
(through grants provided by NIJ and others) provides a foundation for high
efficiency analysis. This is accomplished by automation and miniaturization of
many cumbersome techniques and through the use of highly multiplexed testing.
The delivered protocol has been developed for the Nanogen’s next generation
400 pad chip, which can be used on a portable or benchtop device. We report
here that we have developed protocols for integrated multiplex-amplification and
Final Report 97-LB-VX-004 9
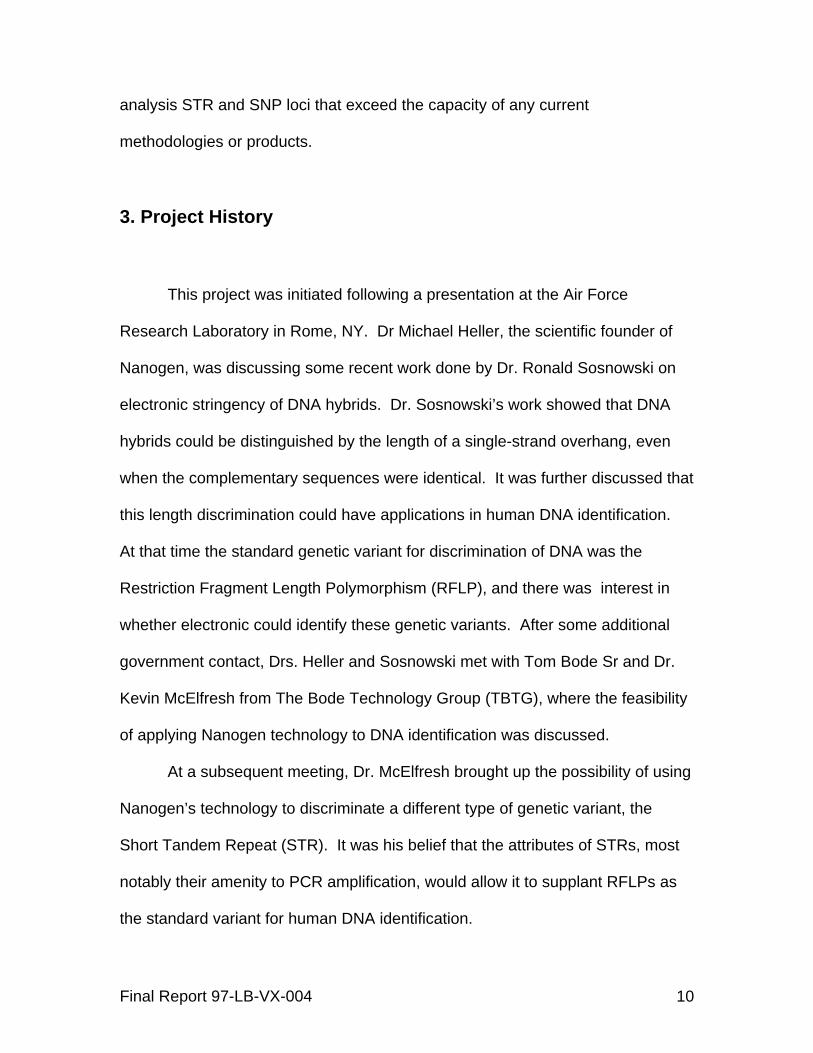
analysis STR and SNP loci that exceed the capacity of any current
methodologies or products.
3. Project History
This project was initiated following a presentation at the Air Force
Research Laboratory in Rome, NY. Dr Michael Heller, the scientific founder of
Nanogen, was discussing some recent work done by Dr. Ronald Sosnowski on
electronic stringency of DNA hybrids. Dr. Sosnowski’s work showed that DNA
hybrids could be distinguished by the length of a single-strand overhang, even
when the complementary sequences were identical. It was further discussed that
this length discrimination could have applications in human DNA identification.
At that time the standard genetic variant for discrimination of DNA was the
Restriction Fragment Length Polymorphism (RFLP), and there was interest in
whether electronic could identify these genetic variants. After some additional
government contact, Drs. Heller and Sosnowski met with Tom Bode Sr and Dr.
Kevin McElfresh from The Bode Technology Group (TBTG), where the feasibility
of applying Nanogen technology to DNA identification was discussed.
At a subsequent meeting, Dr. McElfresh brought up the possibility of using
Nanogen’s technology to discriminate a different type of genetic variant, the
Short Tandem Repeat (STR). It was his belief that the attributes of STRs, most
notably their amenity to PCR amplification, would allow it to supplant RFLPs as
the standard variant for human DNA identification.
Final Report 97-LB-VX-004 10
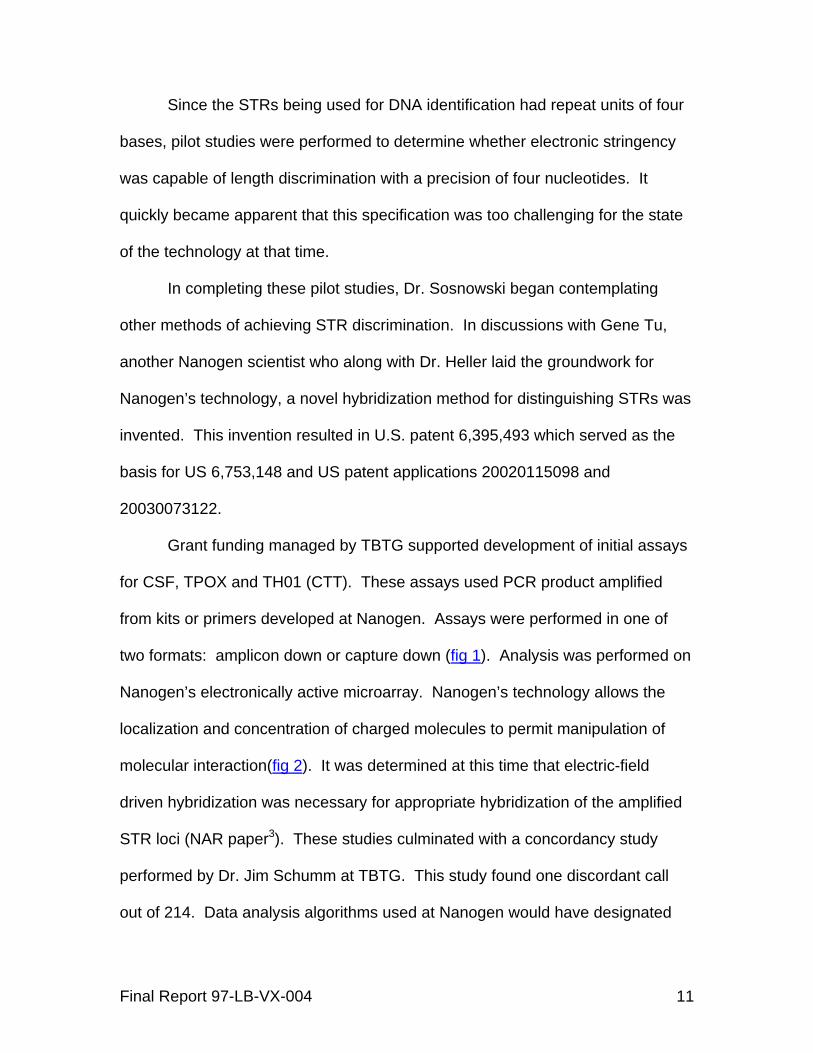
Since the STRs being used for DNA identification had repeat units of four
bases, pilot studies were performed to determine whether electronic stringency
was capable of length discrimination with a precision of four nucleotides. It
quickly became apparent that this specification was too challenging for the state
of the technology at that time.
In completing these pilot studies, Dr. Sosnowski began contemplating
other methods of achieving STR discrimination. In discussions with Gene Tu,
another Nanogen scientist who along with Dr. Heller laid the groundwork for
Nanogen’s technology, a novel hybridization method for distinguishing STRs was
invented. This invention resulted in U.S. patent 6,395,493 which served as the
basis for US 6,753,148 and US patent applications 20020115098 and
20030073122.
Grant funding managed by TBTG supported development of initial assays
for CSF, TPOX and TH01 (CTT). These assays used PCR product amplified
from kits or primers developed at Nanogen. Assays were performed in one of
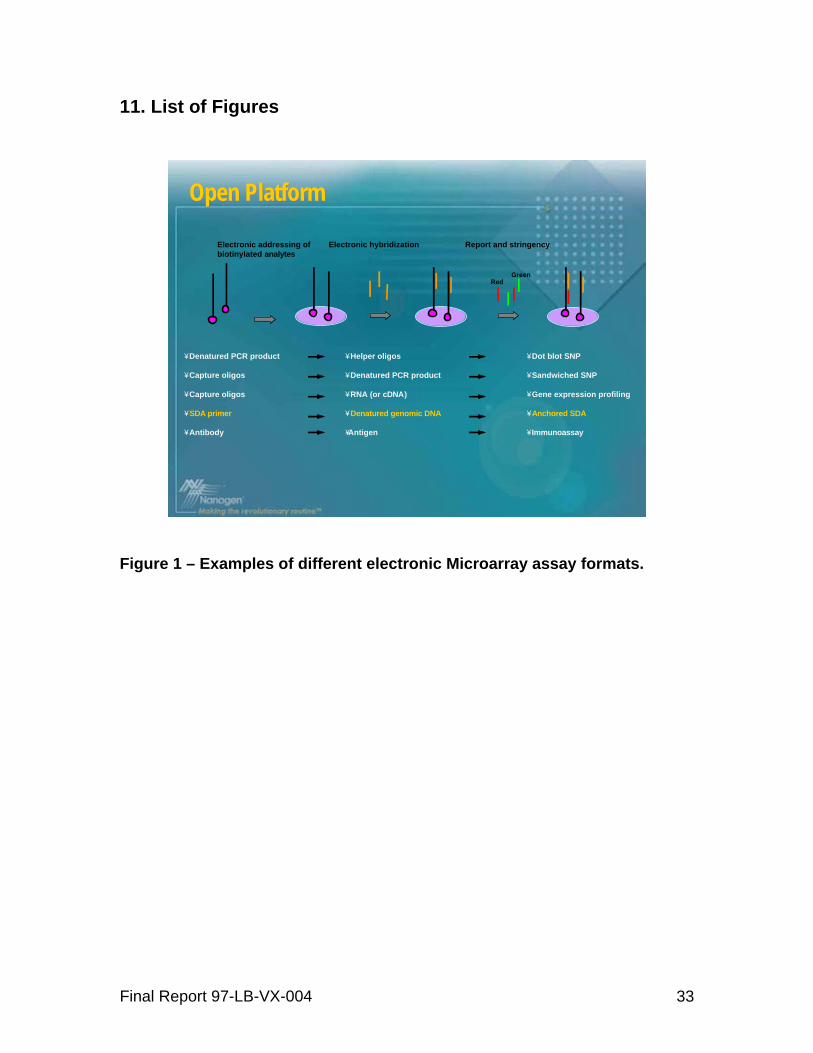
two formats: amplicon down or capture down (fig 1). Analysis was performed on
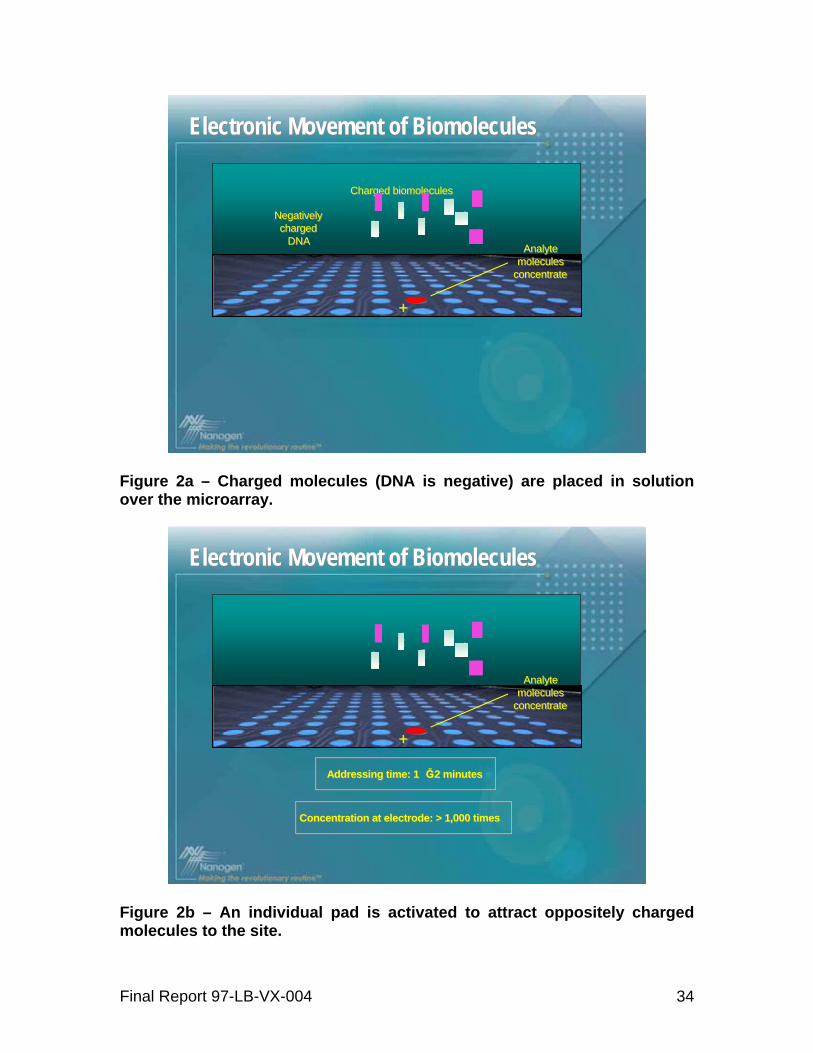
Nanogen’s electronically active microarray. Nanogen’s technology allows the
localization and concentration of charged molecules to permit manipulation of
molecular interaction(fig 2). It was determined at this time that electric-field
driven hybridization was necessary for appropriate hybridization of the amplified
STR loci (NAR paper3). These studies culminated with a concordancy study
performed by Dr. Jim Schumm at TBTG. This study found one discordant call
out of 214. Data analysis algorithms used at Nanogen would have designated
Final Report 97-LB-VX-004 11
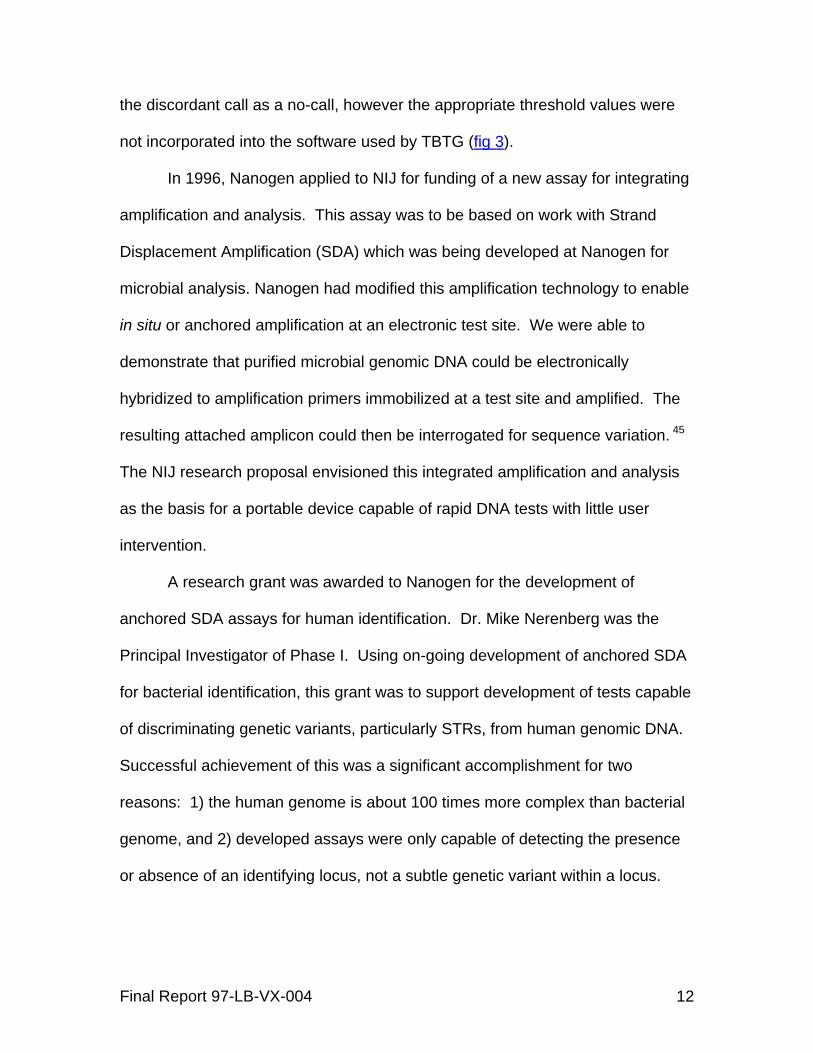
the discordant call as a no-call, however the appropriate threshold values were
not incorporated into the software used by TBTG (fig 3).
In 1996, Nanogen applied to NIJ for funding of a new assay for integrating
amplification and analysis. This assay was to be based on work with Strand
Displacement Amplification (SDA) which was being developed at Nanogen for
microbial analysis. Nanogen had modified this amplification technology to enable
in situ or anchored amplification at an electronic test site. We were able to
demonstrate that purified microbial genomic DNA could be electronically
hybridized to amplification primers immobilized at a test site and amplified. The
resulting attached amplicon could then be interrogated for sequence variation. 45
The NIJ research proposal envisioned this integrated amplification and analysis
as the basis for a portable device capable of rapid DNA tests with little user
intervention.
A research grant was awarded to Nanogen for the development of
anchored SDA assays for human identification. Dr. Mike Nerenberg was the
Principal Investigator of Phase I. Using on-going development of anchored SDA
for bacterial identification, this grant was to support development of tests capable
of discriminating genetic variants, particularly STRs, from human genomic DNA.
Successful achievement of this was a significant accomplishment for two
reasons: 1) the human genome is about 100 times more complex than bacterial
genome, and 2) developed assays were only capable of detecting the presence
or absence of an identifying locus, not a subtle genetic variant within a locus.
Final Report 97-LB-VX-004 12
7
Complexity is a major factor in any DNA test. In more complex genomes,
the probability of randomly finding sequences that are partially complementary to
the probe increases. Specific probe hybridization can be attained, but it takes
the probe longer to find its most stable state, since it must entertain false suitors
that keep getting in the way.
Detecting the presence or absence of a specific probe is less demanding
than differentiating variation within a sequence. Stringency must be applied in
both cases, but precision is less of an issue for simple detection.
4. The STR Hybridization Assay
From a molecular mechanistic viewpoint, STRs are a unique genetic
variant. Theories regarding the origin of these multi-allelic variants include a
mechanism whereby slippage between strands within the repeat region during
replication results in generation of new alleles with differing numbers of repeats.6
This intrinsic hybridization characteristic creates difficulties for amplification
and analysis with complementary probes. For example, the THO1 locus is
generally present in the population with alleles of 5-10 repeat units8. That means
that analysis with a conventional complementary probe could require a repeat
region of 40 bases. However, such a probe, even with unique flanking sequence
is relatively stable with just 20 complementary base pairs. Therefore there are
many conformations that would allow the probe to bind to a target incorrectly.
Final Report 97-LB-VX-004 13
Our solution to this issue was to use the electronically active microarray to
make each test site a spot for detection of an individual allele. This allowed each
allele to be tested individually. In addition to the microarray allowing individual
analysis, we also took advantage of the properties of electric field facilitated
hybridization. Because the same field that concentrates the target DNA at a test
site can simultaneously remove partially hybridized complements, a high level of
specific hybridization is attainable9. The enabling factor of the assay was the
splitting of the complementary probe into two parts: one of which is immobilized
at the test site and the other labeled (fig 4). By using this configuration, we were
able to identify the number of repeat units in a specific target. This format is the
basis for all STR assays discussed.
5. Anchored Strand Displacement Amplification
Strand Displacement Amplification (SDA) is an exponential amplification
method that uses opposable primers10. It differs from PCR in that replicating
strands are separated by the actions of the polymerase, rather than repeated
cycles of thermal denaturation. Advantages include no requirement for precise
and rapid temperature changes and short amplification times. Disadvantages
are additional reagents and a more complex reaction. Originally developed by
Becton-Dickinson, several solution SDA products are on the market, including
those utilizing real-time SDA. A market advantage for commercial use of SDA is
a licensing agreement that is more favorable to developers and customers than
Final Report 97-LB-VX-004 14
the Roche PCR agreement. Nanogen holds a license to develop SDA on its
electronically active microarray.
While BD has investigated the use of SDA probes immobilized on
microbeads, Nanogen has used probes with amplification primers immobilized on
electronic test sites. This method, dubbed anchored SDA (aSDA), enables target
amplification and analysis to occur at the same site. This method is ideally suited
to a microarray system, since the target is immobilized at the analytical site, and
buffer changes do not require re-isolation and application of the target. Once
target material has been immobilized any sequence analysis using
complementary probes may be performed. Nanogen has demonstrated analysis
of STRs and SNPs. These developments have been disclosed in US patent
6,531,302.
While microarray test sites are capable of isolating specifically addressed
molecules, all sites share the same solution. Some products of aSDA are free in
solution. Therefore one concern regarding the application of aSDA on a
microarray is that of carryover or cross-contamination between test sites. This is
clearly an issue when the same sequence is being analyzed for multiple
samples. But carryover between sites can also affect tests for different
sequences if the amount and is significant or especially if there is some cross-
reactivity between the sequences. Since carryover between different samples
being analyzed for the same sequence is the more sensitive condition, we
addressed this issue in a publication11 attached as an exhibit. These results
demonstrate that for Factor V gene, a sequence that displays robust
Final Report 97-LB-VX-004 15
amplification, ten samples of all possible SNP genotypes could be reliably
discriminated. These results indicate that it is highly unlikely that carryover is an
issue with the genetic panels developed for human DNA identification.
One of the challenges of this project has been transitioning from methods
and materials that function in the research lab, to methods and materials
furnished by manufacturing. In order to meet yield and other efficiency
requirements, processes must sometimes be changed in manufacturing. While
these changes are validated for their effect on commercial products, it is not
feasible to also check the effects on all products still in research. This has
created several significant impediments to progress in this project.
The approach we have taken is to continually improve the robustness of
the assay by expanding the boundary limits of performance. That is, the assay
has repeatedly been improved to provide greater adaptability to varying
conditions that were not under our control.
Guidelines for optimum assay performance have been developed and
were continually improved as a particular parameter or experimental variable was
controlled or understood better.
Apendix I shows an example of such guidelines developed throughout the
project that was established and was used by all participants and researchers on
the grant consistently until a new finding or implementation of changes was
agreed and approved. This assured that all the results could be easily compared
and a status of assay development was understood at all levels of assay
management and performance. Appendix I provides generic guidelines for
Final Report 97-LB-VX-004 16
designing the discriminators for the anchored SDA including the melting
temperature calculations as well as recommended concentrations of reagents
and salts.
Appendix II shows typical conditions used for PCR amplification of SNPs
and STRs.
The development of each particular SNP followed established protocols
that were optimized throughout the project, and an example of these protocols is
given in Appendix III. These protocols comprised a choice and preparation of
oligonucleotides including on-chip and nested primers, bumper primers
(biotinylated and non-biotinylated), discriminators and ratio of references. The
first optimization steps included testing of discriminators at varying
concentrations and temperature. The following development step involved testing
of series of designed discriminators using PCR amplicons prepared from
genomic DNA samples (NIJ# samples). Ampllicons were denatured and their
concentration determined on Agilent Bioanalyzer 2100. They were prepared as
dilutions in a series of concentrations and addressed electronically on our
cartridges. The genotypes were recorded using green and red fluorescence and
calls were compared to known genotype results for each sample. Once the best
discriminators were determined using this approach testing of on-chip
amplification was pursued. Combinations of primers and/or nested primers were
addressed at varying concentrations on the cartridges. The best amplification
primers are chosen based on criteria that included primers that yielded correct
genotypes as the PCR amplicons, produced highest signals and showed no
Final Report 97-LB-VX-004 17
signals on primer-only pads (no target addressed). The procedure was repeated
until one combination of primers satisfied those criteria.
Once the discriminators and primers were determined for a particular
SNP, validation of best primer combinations was performed using a series of
genomic DNA samples (NIJ# samples) prepared at concentrations that
commonly ranged from 0.5 ng/µl to 20 ng/µl. The sensitivity of the assay was
thus achieved and correctness of genotyping confirmed by comparison with the
PCR amplicons generated from same samples. If needed, some samples were
sent for DNA sequencing that provided further confirmation of results.
Each individual SNP assay development followed those procedures, and
once accurate results were confirmed, the newly developed SNP assay was
added to the multiplexed SNP panel. This commonly required further
optimization, often further varying of primers and discriminators design to prevent
overlapping with existing and established multiplexed panel assay.
Appendix IV shows typical experimental conditions of the SDA workflow
on the Nanogen instrument. Typical electronic addressing conditions are
summarized as well as typical concentrations of primers, targets and ratio of
references used in the anchored or on-chip SDA amplification assays. The
procedure also emphasizes enzyme and other reagent concentrations for the on-
chip amplification and amplification conditions such as temperature and time. A
separate set of optimizations is normally performed in the detection step
involving denaturation, reporter mix addition and imaging at varying optical
conditions.
Final Report 97-LB-VX-004 18

As the individual SNP assays were developed, and capability to increase the
number of multiplexed SNPs we improved our understanding of mechanisms of
the anchored SDA processes occurring on the chip. A number of approaches
based on understanding of anchored SDA mechanism were tested and used to
optimize the assays. These included using different nicking enzymes, number of
bumper primers and/or nesting primers, excluding bumper primers, or for
instance repeating the amplification process on the same chip.
One mechanism in the assay that might affect performance is nicking of
the restriction site. Nicking provides an extendable site for the polymerase.
Allowing the restriction enzyme to cut both strands of the hybrid would result in a
loss of the template strand. The original assay uses α-thiol dNTP to limit cutting
by the restriction enzyme. The thiolated nucleotide is selected so that the SDA
restriction site is modified on only one strand. That way a restriction enzyme can
be manipulated to nick only one strand of the hybrid. However, the restriction
enzyme is capable of cutting through the thiolated site. And the α-thiol dNTP is
not the natural reagent of the polymerase, so it likely produces some decay in the
processivity of the polymerase. α-thiol dNTP also adds to the complexity and
cost of the reagent mix.
New England Biolabs (NEB) has engineered enzymes that have one of
their cutting domains inactivated. This means that α-thiol dNTP is not needed in
the mix. After trying several NEB nicking enzymes, we settled on BbvC 1B. It
has a 7 base recognition site which means that the recognition is not frequently
found in the genome, which is an important factor.
Final Report 97-LB-VX-004 19
Some recent advancements in assay performance have also resulted in a
more general improvement to assay expandability. The issue of complexity was
discussed earlier in a comparison between bacterial and human genomes.
Complexity can also be an issue when working with large numbers of amplified
loci. That problem is addressed in this system by sequestering amplification at
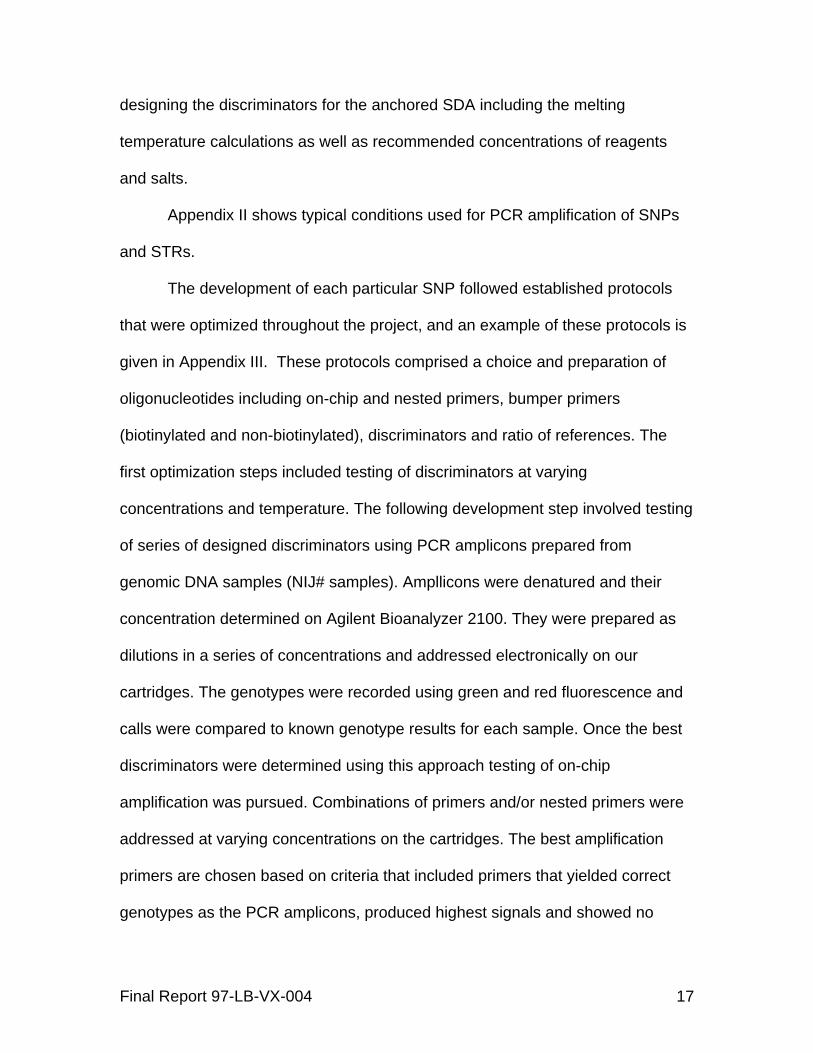
individual test sites. However, standard SDA protocols require bumper primers
in solution (fig 5). As the number of loci being amplified increases, so does the
number of bumper primers and complexity becomes an issue.
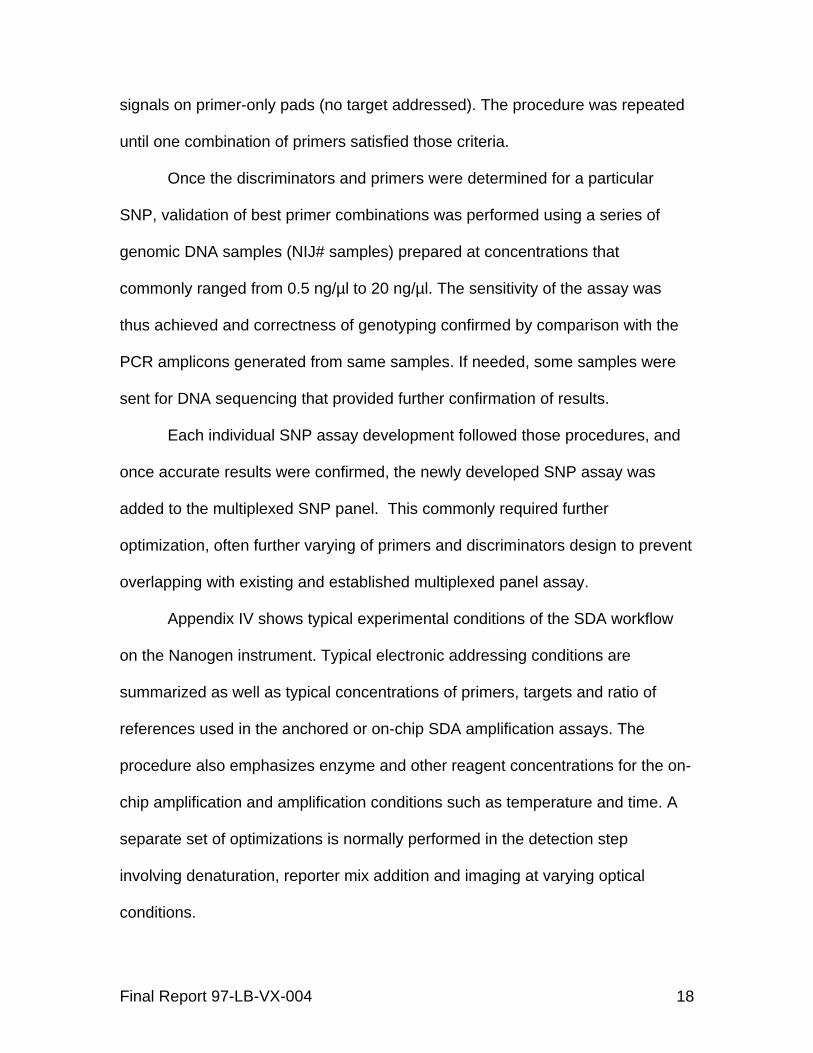
Therefore we asked whether it would be possible to eliminate bumper
primers. It is theoretically possible, if bridging between double-stranded
amplification primers occurs (fig 6). The function of the bumper primers is to
displace the genomic strand of DNA. This exposes the extended single-strand
and allows complementary polymerization, including the nicking site. This
process activates the nicking site and permits exponential amplification to occur.
The same result can be attained if an unextended amplification primer can
invade the end of the extended hybrid. In order to get amplification with anchored
amplification, bridging between extended single-stranded primers and
unextended primers must occur. Since DNA hybrids open up most often at their
termini12, it is possible that primer bridging by invasion can occur (fig 6).
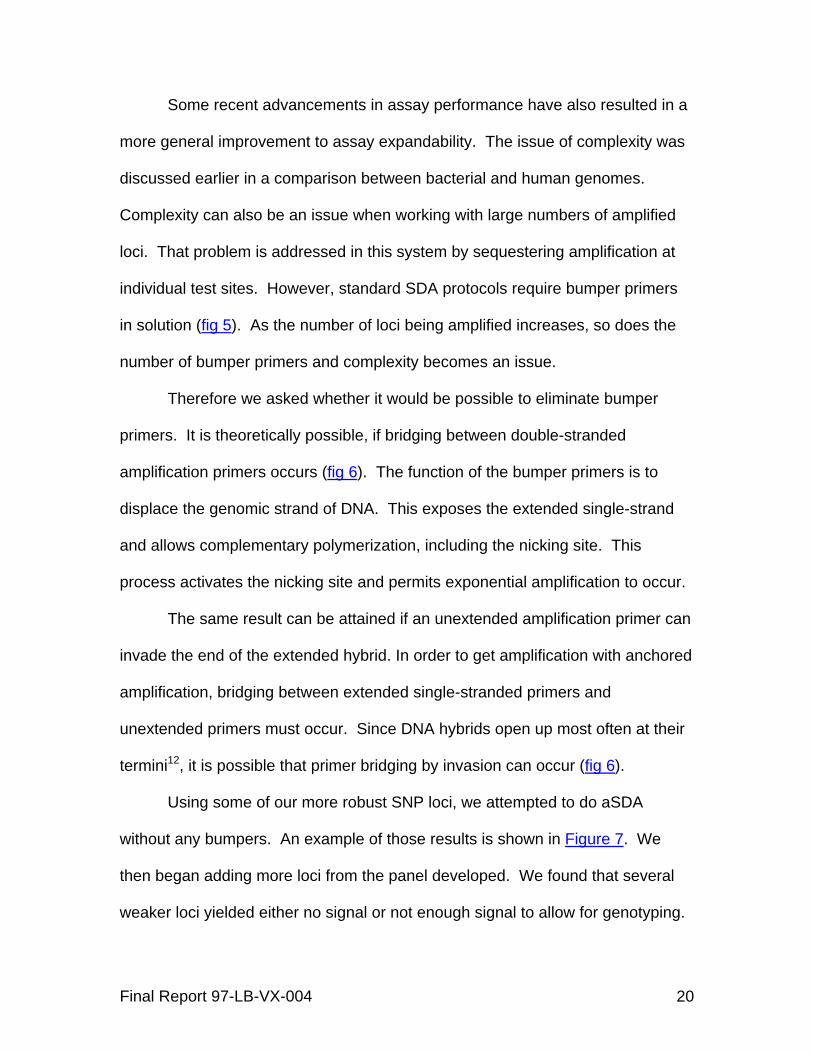
Using some of our more robust SNP loci, we attempted to do aSDA
without any bumpers. An example of those results is shown in Figure 7. We
then began adding more loci from the panel developed. We found that several
weaker loci yielded either no signal or not enough signal to allow for genotyping.
Final Report 97-LB-VX-004 20
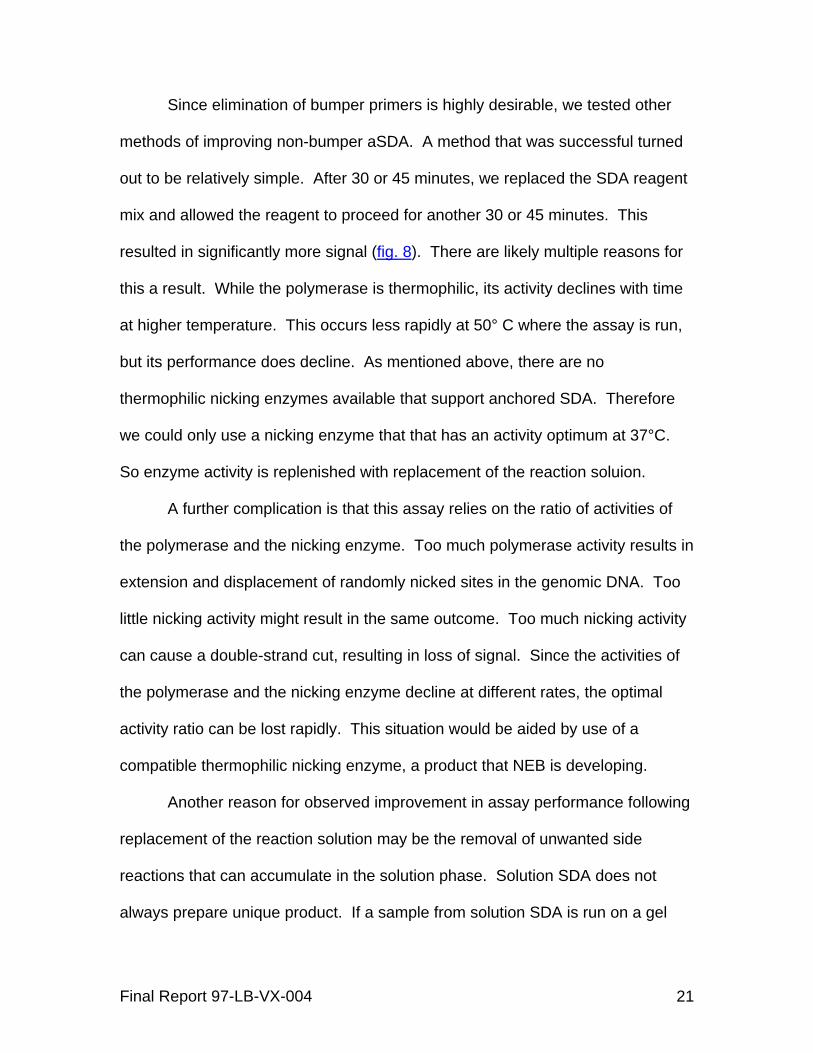
Since elimination of bumper primers is highly desirable, we tested other
methods of improving non-bumper aSDA. A method that was successful turned
out to be relatively simple. After 30 or 45 minutes, we replaced the SDA reagent
mix and allowed the reagent to proceed for another 30 or 45 minutes. This
resulted in significantly more signal (fig. 8). There are likely multiple reasons for
this a result. While the polymerase is thermophilic, its activity declines with time
at higher temperature. This occurs less rapidly at 50° C where the assay is run,
but its performance does decline. As mentioned above, there are no
thermophilic nicking enzymes available that support anchored SDA. Therefore
we could only use a nicking enzyme that that has an activity optimum at 37°C.
So enzyme activity is replenished with replacement of the reaction soluion.
A further complication is that this assay relies on the ratio of activities of
the polymerase and the nicking enzyme. Too much polymerase activity results in
extension and displacement of randomly nicked sites in the genomic DNA. Too
little nicking activity might result in the same outcome. Too much nicking activity
can cause a double-strand cut, resulting in loss of signal. Since the activities of
the polymerase and the nicking enzyme decline at different rates, the optimal
activity ratio can be lost rapidly. This situation would be aided by use of a
compatible thermophilic nicking enzyme, a product that NEB is developing.
Another reason for observed improvement in assay performance following
replacement of the reaction solution may be the removal of unwanted side
reactions that can accumulate in the solution phase. Solution SDA does not
always prepare unique product. If a sample from solution SDA is run on a gel
Final Report 97-LB-VX-004 21
and stained with ethidium bromide or other nucleic acid stain, many bands will be
seen. In anchored SDA, solution amplification reactions can also occur. With
time, they can dominate the anchored amplification reactions and rob the
anchored reaction of enzymes and reactants. Replacement of the reaction
solution removes the majority of the solution amplification templates and “resets
the clock” in favor of anchored amplification.
This simple modification to the protocol permitted robust amplification of
22 SNP loci without the need for bumper primers. However, we had indications
that a complex panel might require bumpers for selected loci.
6. STRs – On-chip SDA and analysis
The original of this project was to use Nanogen’s active DNA chips to
analyze length polymorphisms in loci containing short tandem repeats. To
enable this, a novel method of STR analysis using hybridization probes was
invented (U.S. patent 6,395,493). This invention was discussed above. Using
PCR, we developed assays for 8 STR loci. Since this work was started before
the announcement of loci selected for CODIS, a few of the developed loci were
not in the CODIS thirteen. Also we found that development time increased
significantly as we moved away from the simpler loci (CTT) towards ones with
higher numbers of alleles and high frequencies of microvariants (D21S11).
Through the suggestion of reviewers at NIJ, we ultimately decided that
completion of all thirteen CODIS loci would consume too many resources,
Final Report 97-LB-VX-004 22
especially when combined with anchored SDA. Therefore we began to consider
other uses of the technology developed for DNA identification applications.
The use of SNPs for human identification was just coming under
consideration at this time. It was suggested that Nanogen proceed with SNP
analysis, incorporating anchored SDA into the assay. Those efforts are
discussed below.
We also discussed using STRs in combination with SNPs as a means of
creating a method that might yield results that could be back-compatible with
STR databases (fig 9). The initial plan was to include six STR loci with a panel of
SNPs, as a demonstration of the feasibility of this approach. We developed
assays for three loci (fig 10) and designed reagents for another three (table).
Later in the project, development of SNP assays became a priority and we
focused on those.
7. SNPs – On-chip SDA and analysis
The major attraction of this system is the ability to combine amplification
and analysis on the same medium without the need for movement of the analyte.
Therefore it was determined to be valuable to use other genetic variants even
though their applicability to human identification was not yet validated.
At the onset of the SNP phase of the project, it was not clear what a SNP
panel should look like. It was determined with NIJ that a representative panel
Final Report 97-LB-VX-004 23
would be developed consisting of: Y-chromosome SNPs, mitochondrial SNPs
and autosomal SNPs. Y-SNPs had just been described by Mike Hammer, Peter
Gill, Peter Underhill and others, but their genomic distribution was not yet fully
understood. After many Y SNP assays had been developed for this platform, it
was determined that their greatest value lies in identifying populations rather than
individuals. They have remained on the multiplex panel. Analysis of Y markers
has a technical advantage because there is only a single copy in an individual’s
genetic make-up. However one of the Y loci, P25, is present in multiple copies.
Three copies have been documented (STRbase). Prior to this discovery we
were having difficulty understanding our results with P25, which often gave
sample specific ambiguities. It is now clear that the assay was reflecting what
was present in the sample.
The use of autosomal SNPs for human identification was also a novel
concept at the time the initial SNP was being considered. However it seems that
the value of autosomal SNPs for this application has increased since the original
plan. Because of the growing interest in the possibility of using autosomal SNPs
for human identification, they became the priority in the later stages of the grant.
The use of SNPs for human identification has been well-supported in Europe by
organizations like the Forensic Science Service and the SNPforID consortium.
Peter Gill at the FSS and Angel Carracedo and Peter Schneider at SNPforID
have led the investigations in this area. At the time we were selecting autosomal
SNPs, Peter Gill had submitted a list of suitable candidates to STRbase and
Final Report 97-LB-VX-004 24
these served as the basis for our panel. Orchid has also established a 70 locus
panel and has made information on those sequences available as well.
Analysis of mitochondrial SNPs is a well established tool for forensic
identification of biological material. Because of the biology of mitochondria,
mitochondrial genomes can be present at a thousand-fold greater excess than
nuclear DNA. Therefore it is highly useful in analyzing ancient DNA or DNA
subjected to extreme levels of trauma and degradation. However the
mitochondrial genome is riddled with variants, likely because of the low level of
selective pressure on the integrity of it’s genome. Heteroplasmy , where different
cells can have alternative mitochondrial genetic variants further complicates
analysis.
As might be expected, amplification of mitochondrial was not an issue
even with DNA isolation methods optimized for nuclear DNA. However
developing probes for analysis was challenging. Only a single HVII variant is
included in this SNP panel because of theses challenges. We felt that it was
more important to obtain the highest level multiplicity of loci possible, and that the
autosomal SNPs were a good combination of utility and practicality.
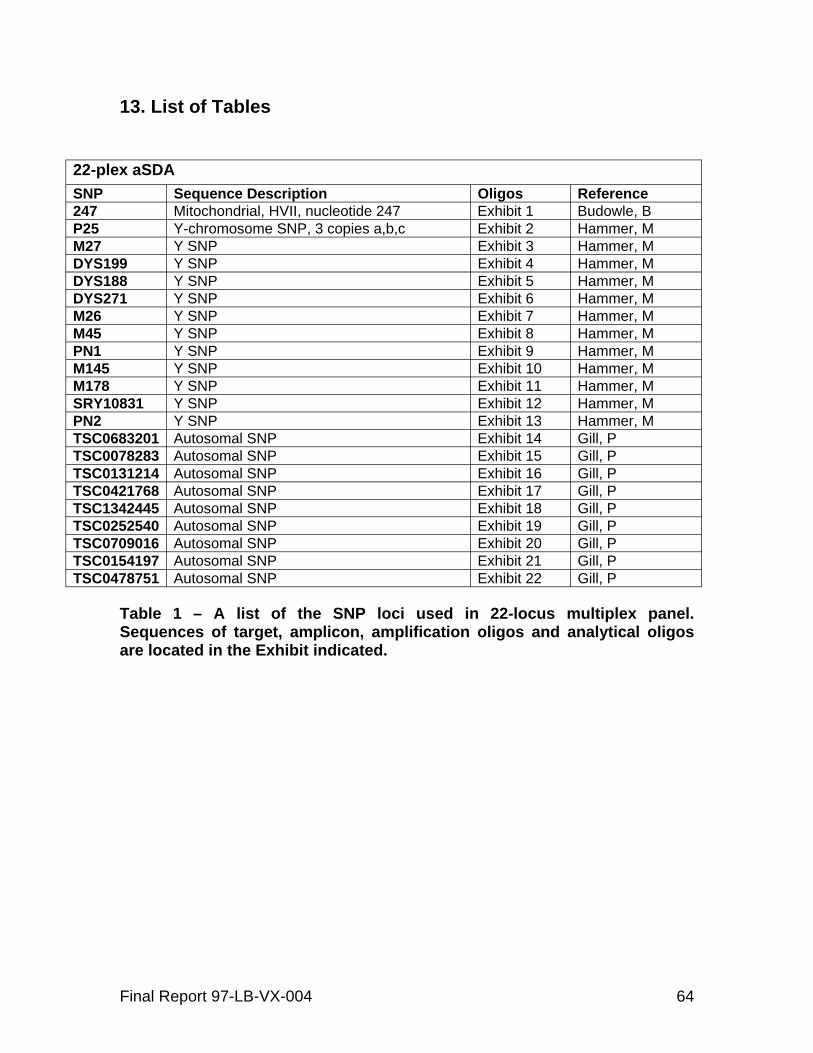
The project concluded with a panel of 22 SNPs combining mitochondrial,
Y chromosome and autosomal SNPs (Table 1). To our knowledge, this is the
largest multiplex that is simultaneously amplified for forensic applications (fig.
11).
Final Report 97-LB-VX-004 25
8. Instruments
Three different instrument systems were used during the course of the
grant: the Molecular Biology Workstation with 100 pad chip, the portable NIJ box
with a 400 pad chip and the Nanochip 400 which include fluid handling robotics.
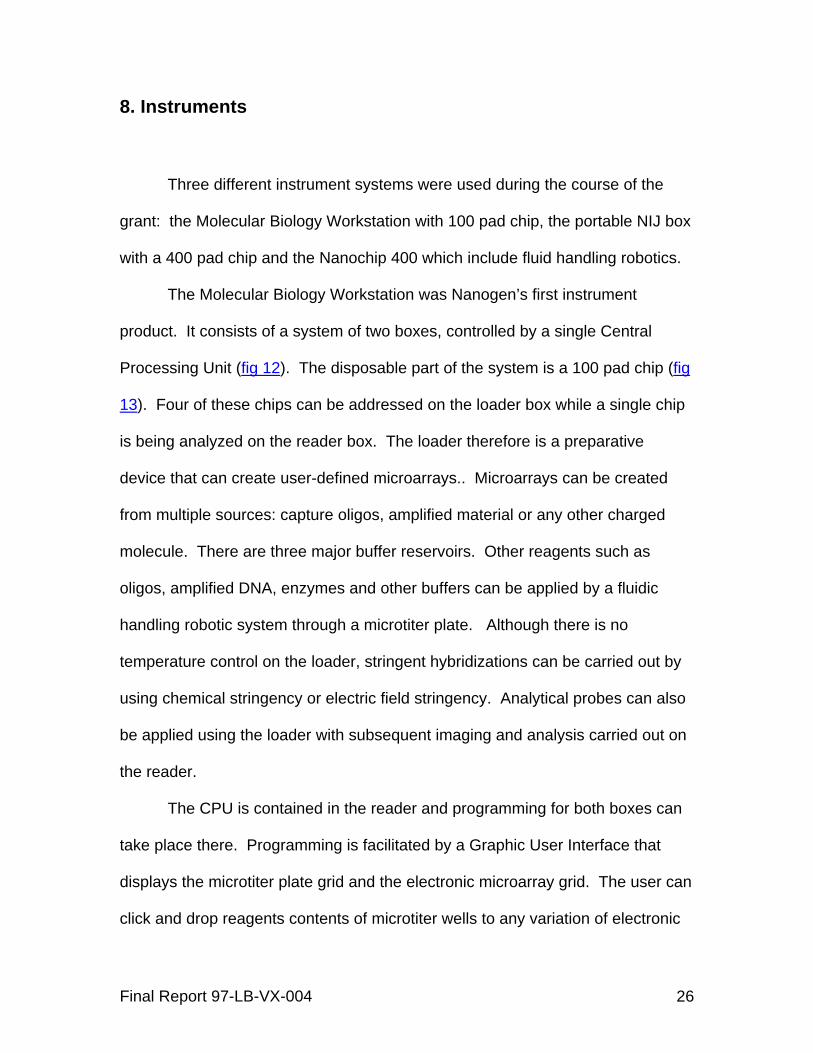
The Molecular Biology Workstation was Nanogen’s first instrument
product. It consists of a system of two boxes, controlled by a single Central
Processing Unit (fig 12). The disposable part of the system is a 100 pad chip (fig
13). Four of these chips can be addressed on the loader box while a single chip
is being analyzed on the reader box. The loader therefore is a preparative
device that can create user-defined microarrays.. Microarrays can be created
from multiple sources: capture oligos, amplified material or any other charged
molecule. There are three major buffer reservoirs. Other reagents such as
oligos, amplified DNA, enzymes and other buffers can be applied by a fluidic
handling robotic system through a microtiter plate. Although there is no
temperature control on the loader, stringent hybridizations can be carried out by
using chemical stringency or electric field stringency. Analytical probes can also
be applied using the loader with subsequent imaging and analysis carried out on
the reader.
The CPU is contained in the reader and programming for both boxes can
take place there. Programming is facilitated by a Graphic User Interface that
displays the microtiter plate grid and the electronic microarray grid. The user can
click and drop reagents contents of microtiter wells to any variation of electronic
Final Report 97-LB-VX-004 26
microarray pads. The user is warned when multiple use of wells or pads is
attempted. Programs can be stored as templates for re-use with different
samples.
The reader has an optical imaging system that accommodates the two
most common fluorescent probes: red and green. The optical system detects
fluorescence and translates image data to quantitative data via a Photo Multiplier
Tube. That data can then be interrogated by numerous mathematical algorithms.
Internal analysis algorithms have been written for some applications, but data
can also be exported to spread sheet programs like Excel. The CPU can be
networked with in-house systems to permit export of data and reports.
Another individual aspect of reader function is temperature control. This
feature, combined with real time imaging allows melt curves to be generated.
This method can be useful when interrogating sequences that are difficult to
discriminate.
The need for a chip capable of analyzing more complex panels or more
samples led to the development of a new disposable and instrumentation to
handle it. Market analysis determined that a 400 pad chip (fig 14) would have
optimal utility. Also, in order to reduce the cost of the instrumentation, more
functions were transferred from the instrument to the chip. These include current
switching and temperature detection. The flow cell volume remains the same
meaning the total amount of reagent used can in some circumstances be
reduced 4-fold relative to the 100 pad chip. Additionally, a new feedback
mechanism was incorporated that permits current measurement at each pad,
Final Report 97-LB-VX-004 27
allowing for more precise control of electrical field effects on molecular reactions.
Starting with a breadboard device, new instruments were developed in parallel
with chip development.
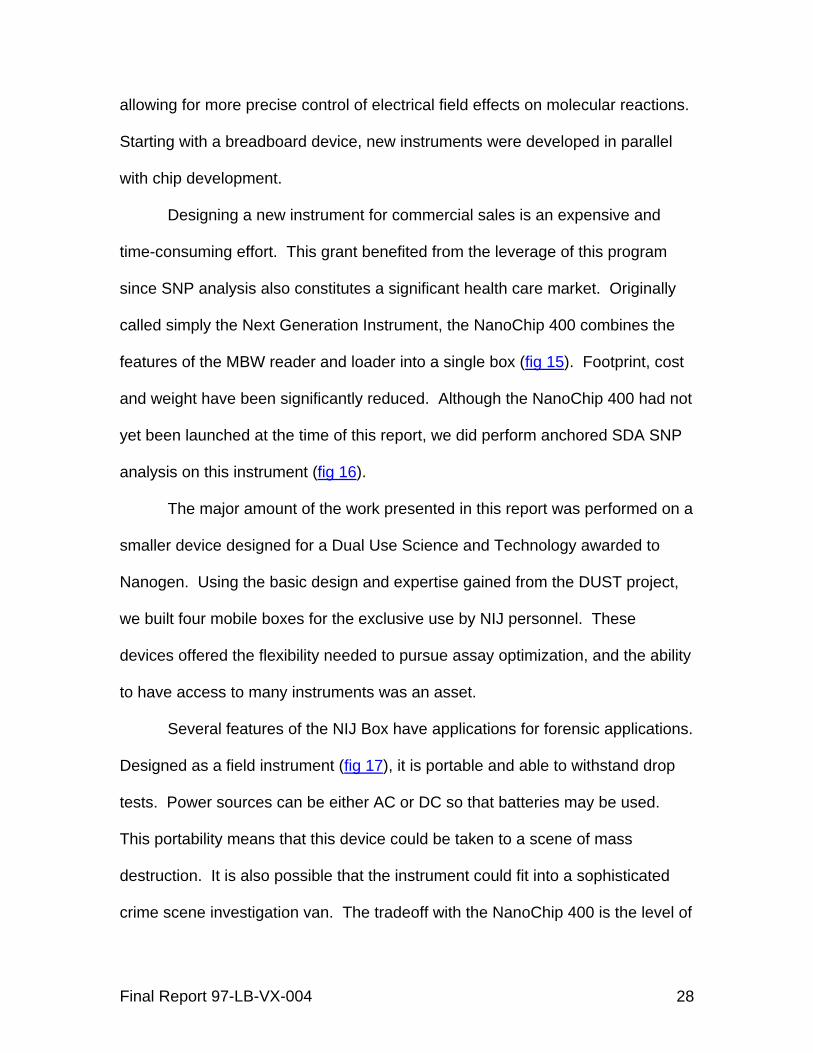
Designing a new instrument for commercial sales is an expensive and
time-consuming effort. This grant benefited from the leverage of this program
since SNP analysis also constitutes a significant health care market. Originally
called simply the Next Generation Instrument, the NanoChip 400 combines the
features of the MBW reader and loader into a single box (fig 15). Footprint, cost
and weight have been significantly reduced. Although the NanoChip 400 had not
yet been launched at the time of this report, we did perform anchored SDA SNP
analysis on this instrument (fig 16).
The major amount of the work presented in this report was performed on a
smaller device designed for a Dual Use Science and Technology awarded to
Nanogen. Using the basic design and expertise gained from the DUST project,
we built four mobile boxes for the exclusive use by NIJ personnel. These
devices offered the flexibility needed to pursue assay optimization, and the ability
to have access to many instruments was an asset.
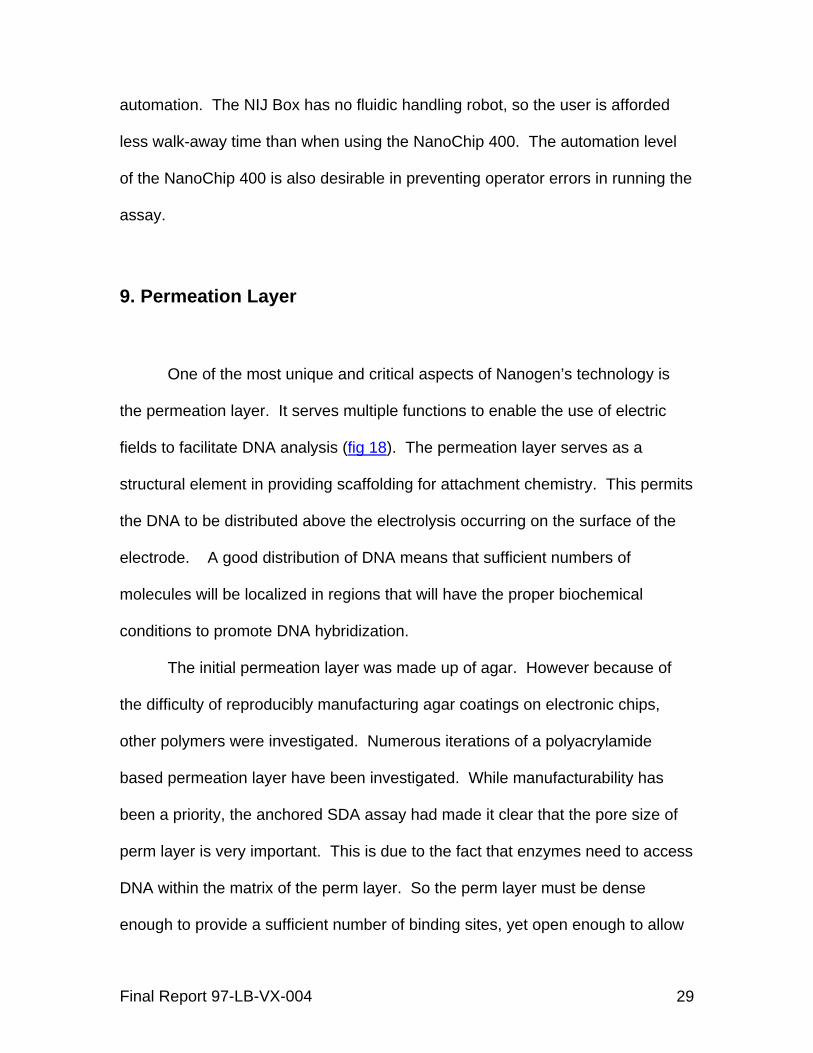
Several features of the NIJ Box have applications for forensic applications.
Designed as a field instrument (fig 17), it is portable and able to withstand drop
tests. Power sources can be either AC or DC so that batteries may be used.
This portability means that this device could be taken to a scene of mass
destruction. It is also possible that the instrument could fit into a sophisticated
crime scene investigation van. The tradeoff with the NanoChip 400 is the level of
Final Report 97-LB-VX-004 28
automation. The NIJ Box has no fluidic handling robot, so the user is afforded
less walk-away time than when using the NanoChip 400. The automation level
of the NanoChip 400 is also desirable in preventing operator errors in running the
assay.
9. Permeation Layer
One of the most unique and critical aspects of Nanogen’s technology is
the permeation layer. It serves multiple functions to enable the use of electric
fields to facilitate DNA analysis (fig 18). The permeation layer serves as a
structural element in providing scaffolding for attachment chemistry. This permits
the DNA to be distributed above the electrolysis occurring on the surface of the
electrode. A good distribution of DNA means that sufficient numbers of
molecules will be localized in regions that will have the proper biochemical
conditions to promote DNA hybridization.
The initial permeation layer was made up of agar. However because of
the difficulty of reproducibly manufacturing agar coatings on electronic chips,
other polymers were investigated. Numerous iterations of a polyacrylamide
based permeation layer have been investigated. While manufacturability has
been a priority, the anchored SDA assay had made it clear that the pore size of
perm layer is very important. This is due to the fact that enzymes need to access
DNA within the matrix of the perm layer. So the perm layer must be dense
enough to provide a sufficient number of binding sites, yet open enough to allow
Final Report 97-LB-VX-004 29

access to the DNA by enzymes. Unfortunately, we did not find any methods that
were able to directly measure the pore size of the perm layer. Therefore any
change in the perm layer needed to be evaluated by aSDA experimentation.
Final Report 97-LB-VX-004 30
10. References Cited:
1. “Minor Crime Report”, NIJ, Nov. 2004.
2. “National Forensic DNA Study Report”, 2004, No. 203970 N.P Lovric et al.
3. “Rapid, high fidelity analysis of simple sequence repeats on an electronically active DNA microchip”, Radtkey R, Feng L, Muralhidar M, Duhon M, Canter D, DiPierro D, Fallon S, Tu E, McElfresh K, Nerenberg M, Sosnowski R, Nucleic Acids Res. 2000 Apr 1;28(7):E17.
4. “Anchored multiplex amplification on a microelectronic chip array”, Westin L, Xu X, Miller C, Wang L, Edman CF, Nerenberg M., Nat Biotechnol. 2000 Feb;18(2):199-204.
5. “Antimicrobial resistance and bacterial identification utilizing a microelectronic chip array, Westin L, Miller C, Vollmer D, Canter D, Radtkey R, Nerenberg M, O'Connell JP., J Clin Microbiol. 2001 Mar;39(3):1097-104.
6. “A polymorphic X-linked tetranucleotide repeat locus displaying a high rate of new mutation: implications for mechanisms of mutation at short tandem repeat loci”, Mahtani MM, Willard HF, Hum Mol Genet. 1993 Apr;2(4):431-7.
7. “Population study of 3 STR loci in the Basque Country (northern Spain)”, Alonso S, Castro A, Fernandez I, Gomez de Cedron M, Garcia-Orad A, Meyer E, Martinez de Pancorbo M., Int J Legal Med. 1995;107(5):239-45.
8. STRbase - http://www.cstl.nist.gov/div831/strbase/
9. “Rapid, high fidelity analysis of simple sequence repeats on an electronically active DNA microchip”, Radtkey R, Feng L, Muralhidar M, Duhon M, Canter D, DiPierro D, Fallon S, Tu E, McElfresh K, Nerenberg M, Sosnowski R., Nucleic Acids Res. 2000 Apr 1;28(7):E17.
10. “Strand displacement amplification--an isothermal, in vitro DNA amplification technique”, Walker GT, Fraiser MS, Schram JL, Little MC, Nadeau JG, Malinowski DP., Nucleic Acids Res. 1992 Apr 11;20(7):1691-6.
11. “Multiple sample amplification and genotyping integrated on a single electronic Microarray”, Huang Y, Shirajian J, Schroder A, Yao Z, Summers T, Hodko D, Sosnowski R, , Electrophoresis. 2004 Oct;25(18-19):3106-16.
Final Report 97-LB-VX-004 31
12. “Kinetics for exchange of imino protons in deoxyribonucleic acid, ribonucleic acid, and hybrid oligonucleotide helices”, Pardi A, Tinoco I Jr., Biochemistry. 1982 Sep 14;21(19):4686-93.
Final Report 97-LB-VX-004 32
11. List of Figures
Open PlatformOpen Platform
Electronic addressing of Electronic hybridization Report and stringency biotinylated analytes
Red Green
¥Denatured PCR product ¥Helper oligos ¥Dot blot SNP
¥Capture oligos ¥Denatured PCR product ¥Sandwiched SNP
¥Capture oligos ¥RNA (or cDNA) ¥Gene expression profiling
¥ SDA primer ¥ Denatured genomic DNA ¥Anchored SDA
¥Antibody ¥Antigen ¥Immunoassay
Figure 1 – Examples of different electronic Microarray assay formats.
Final Report 97-LB-VX-004 33
Final Report 97-LB-VX-004 34
Charged biomoleculesCharged biomolecules
Analytemolecules
concentrate
Analytemolecules
concentrate
Negativelycharged
DNA
Negativelycharged
DNA
++
Electronic Movement of BiomoleculesElectronic Movement of Biomolecules
Figure 2a – Charged molecules (DNA is negative) are placed in solution over the microarray.
Analytemolecules
concentrate
Analytemolecules
concentrate
++
Electronic Movement of BiomoleculesElectronic Movement of Biomolecules
Addressing time: 1 Ğ 2 minutesAddressing time: 1 Ğ 2 minutes
Concentration at electrode: > 1,000 timesConcentration at electrode: > 1,000 times
Figure 2b – An individual pad is activated to attract oppositely charged molecules to the site.

Final Report 97-LB-VX-004 35
AddressingSecond
Electrode
AddressingSecond
Electrode
++
Electronic Movement of BiomoleculesElectronic Movement of Biomolecules
Figure 2c – Molecules concentrate to an equilibrium concentration. Additional sites may be activated
++
Electronic Movement of BiomoleculesElectronic Movement of Biomolecules
FluidicWashFluidicWash
ElectronicWash
ElectronicWash
Genetic variant recognition: SNPs, STRsGenetic variant recognition: SNPs, STRs
Types of assays: - amplicon down - capture probe down
- sandwich assays
Types of assays: - amplicon down - capture probe down
- sandwich assays
Figure 2d – Electric field concentration of charged molecules drives an attachment reaction between moieties on the mobile molecules (biotin) and complementary entities imbedded in the permeation layer (streptavidin)
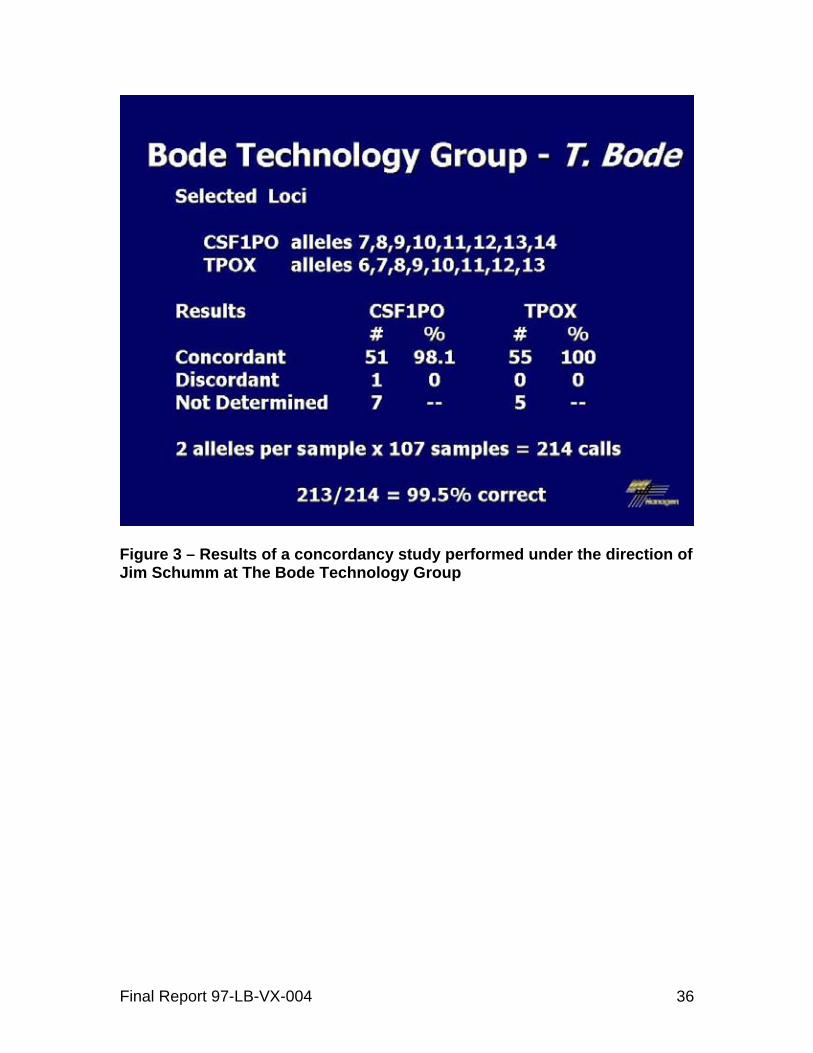
Figure 3 – Results of a concordancy study performed under the direction of Jim Schumm at The Bode Technology Group
Final Report 97-LB-VX-004 36
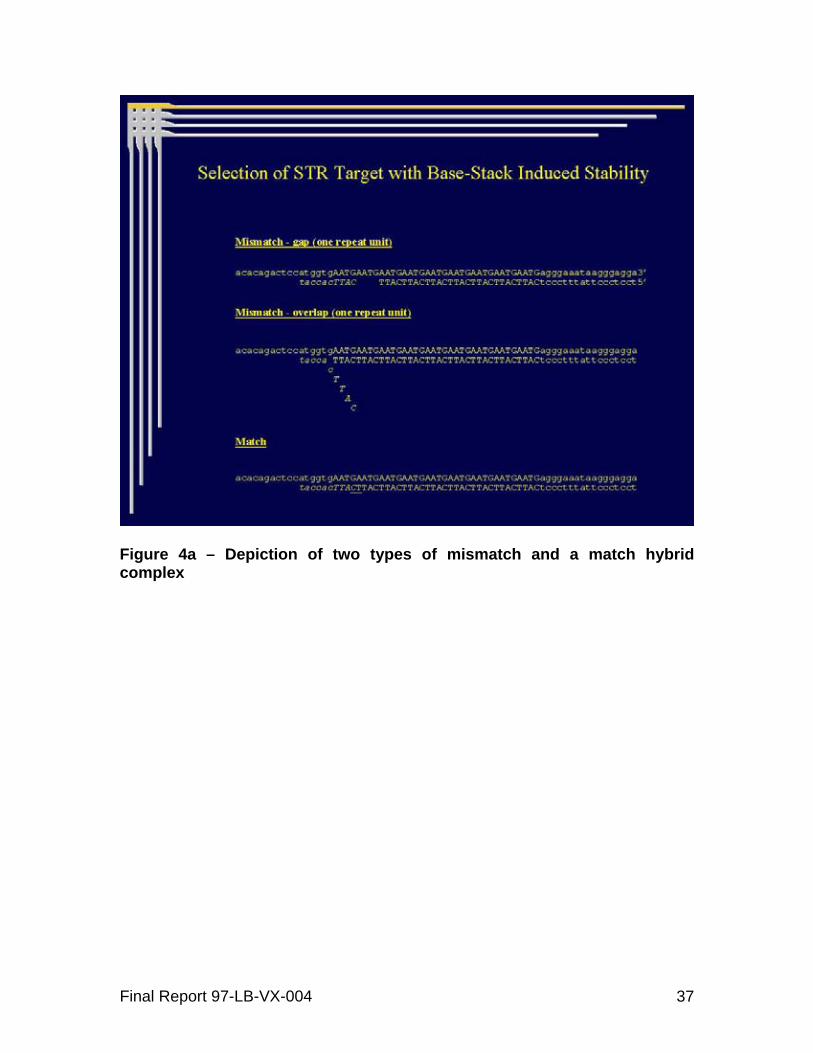
Figure 4a – Depiction of two types of mismatch and a match hybrid complex
Final Report 97-LB-VX-004 37
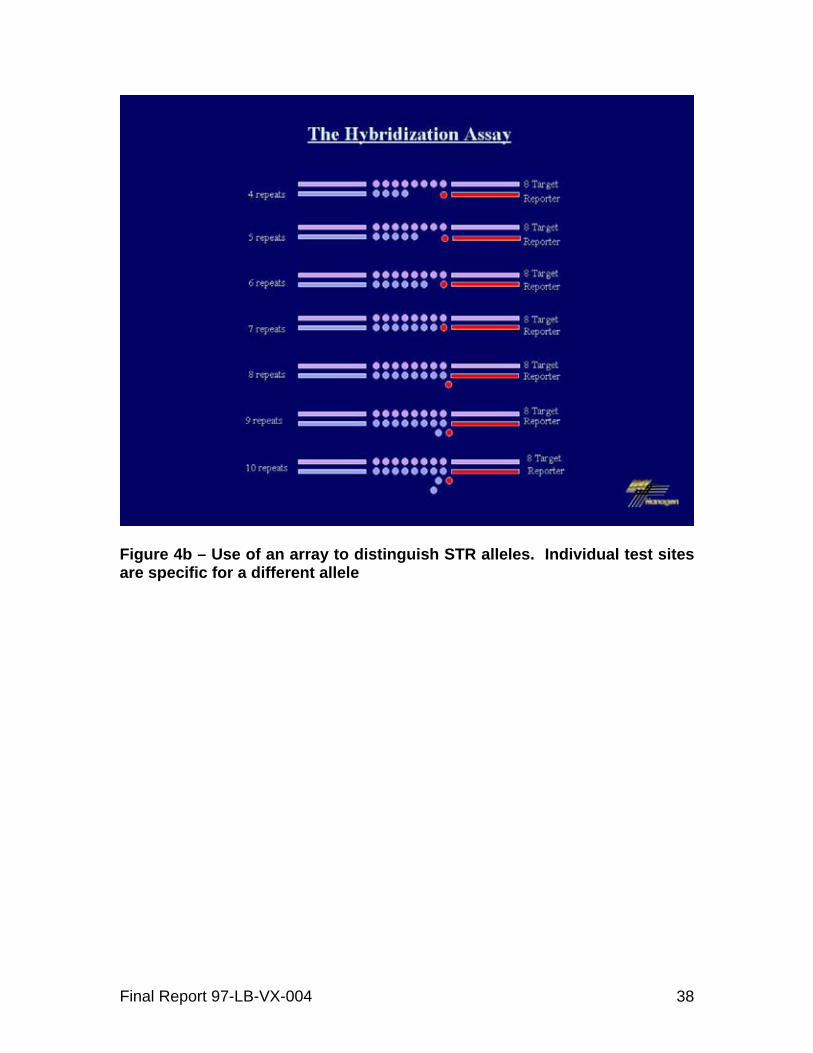
Figure 4b – Use of an array to distinguish STR alleles. Individual test sites are specific for a different allele
Final Report 97-LB-VX-004 38
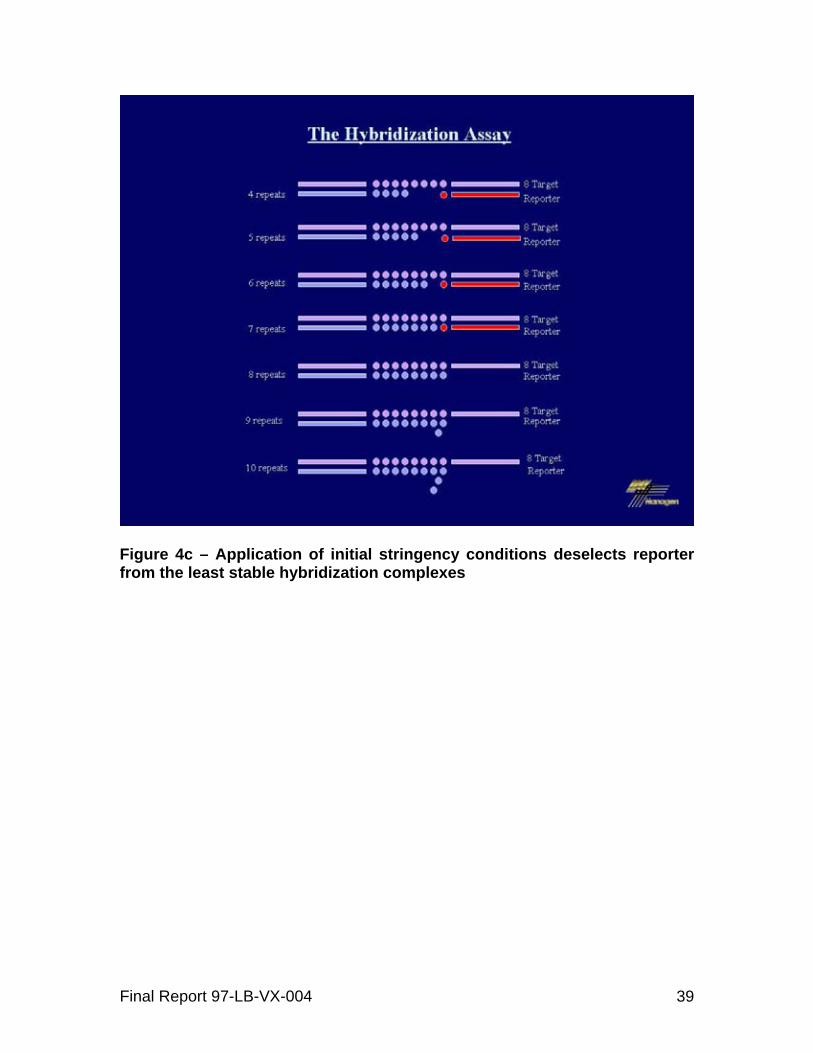
Figure 4c – Application of initial stringency conditions deselects reporter from the least stable hybridization complexes
Final Report 97-LB-VX-004 39
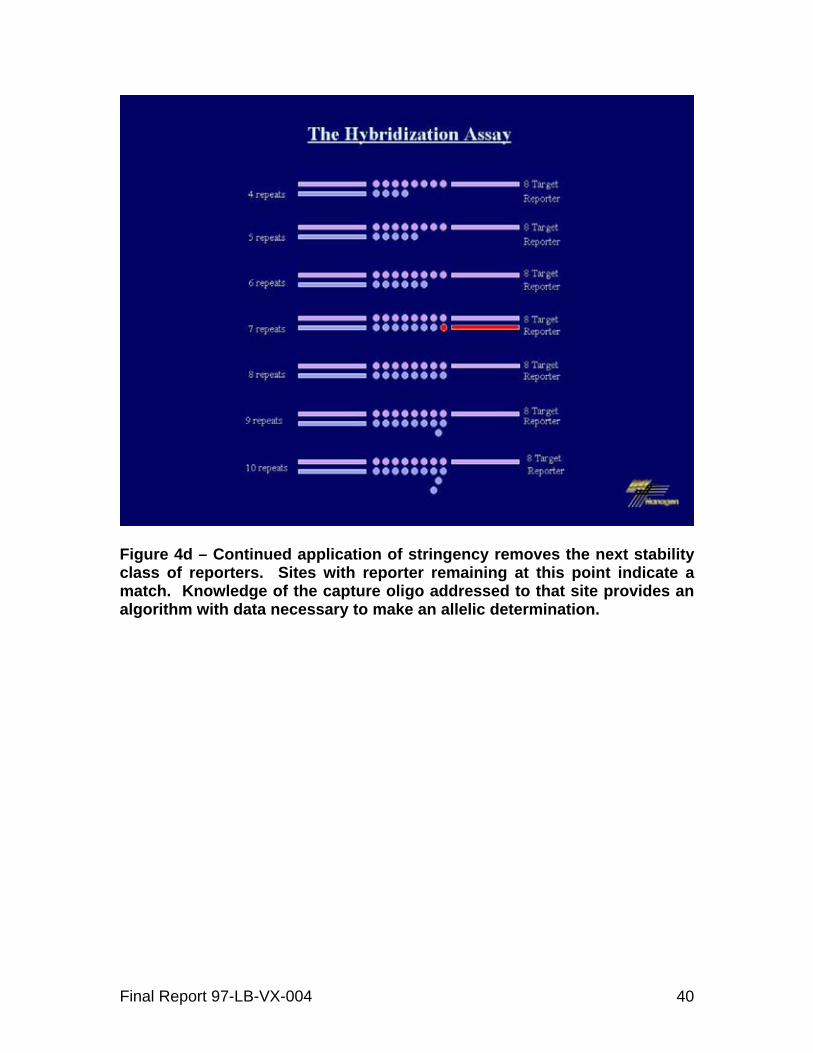
Figure 4d – Continued application of stringency removes the next stability class of reporters. Sites with reporter remaining at this point indicate a match. Knowledge of the capture oligo addressed to that site provides an algorithm with data necessary to make an allelic determination.
Final Report 97-LB-VX-004 40
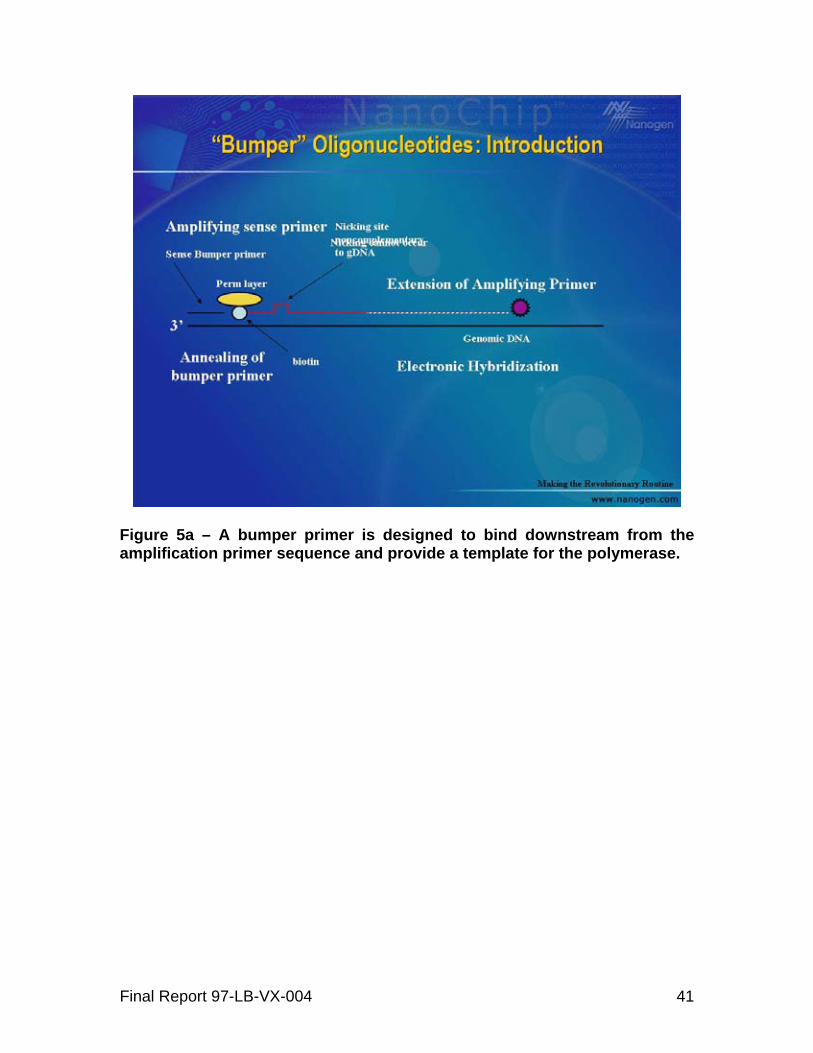
Figure 5a – A bumper primer is designed to bind downstream from the amplification primer sequence and provide a template for the polymerase.
Final Report 97-LB-VX-004 41
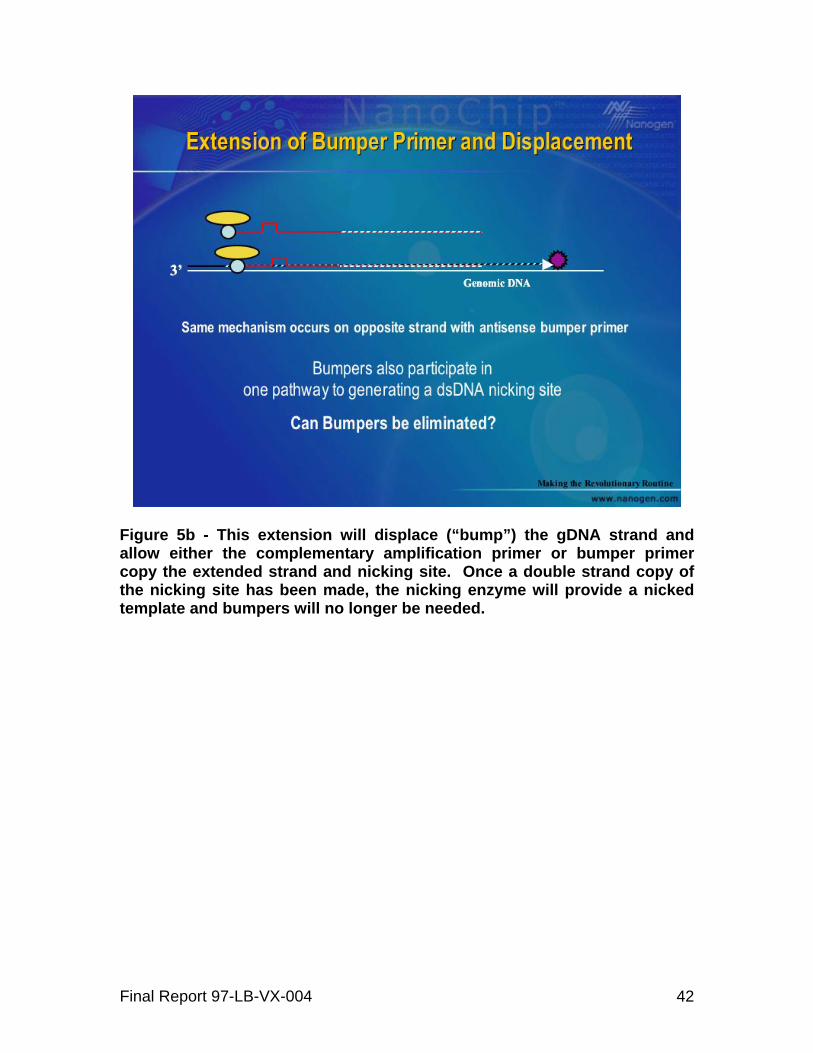
Figure 5b - This extension will displace (“bump”) the gDNA strand and allow either the complementary amplification primer or bumper primer copy the extended strand and nicking site. Once a double strand copy of the nicking site has been made, the nicking enzyme will provide a nicked template and bumpers will no longer be needed.
Final Report 97-LB-VX-004 42
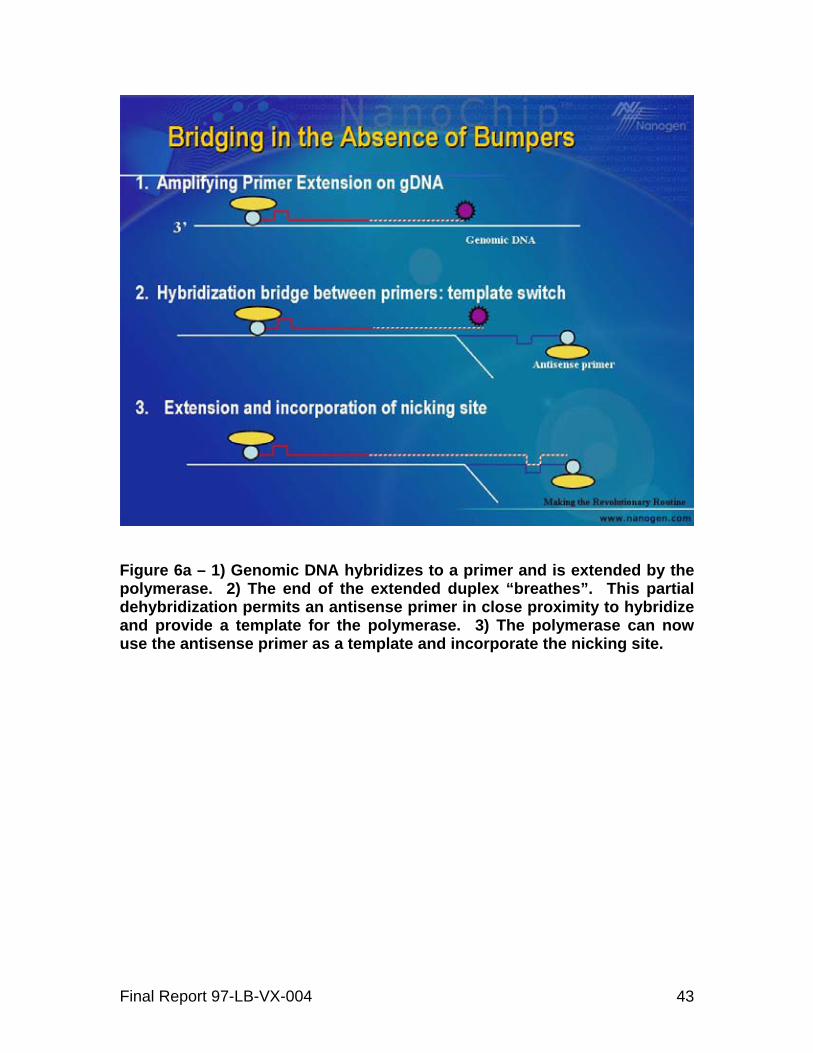
Figure 6a – 1) Genomic DNA hybridizes to a primer and is extended by the polymerase. 2) The end of the extended duplex “breathes”. This partial dehybridization permits an antisense primer in close proximity to hybridize and provide a template for the polymerase. 3) The polymerase can now use the antisense primer as a template and incorporate the nicking site.
Final Report 97-LB-VX-004 43
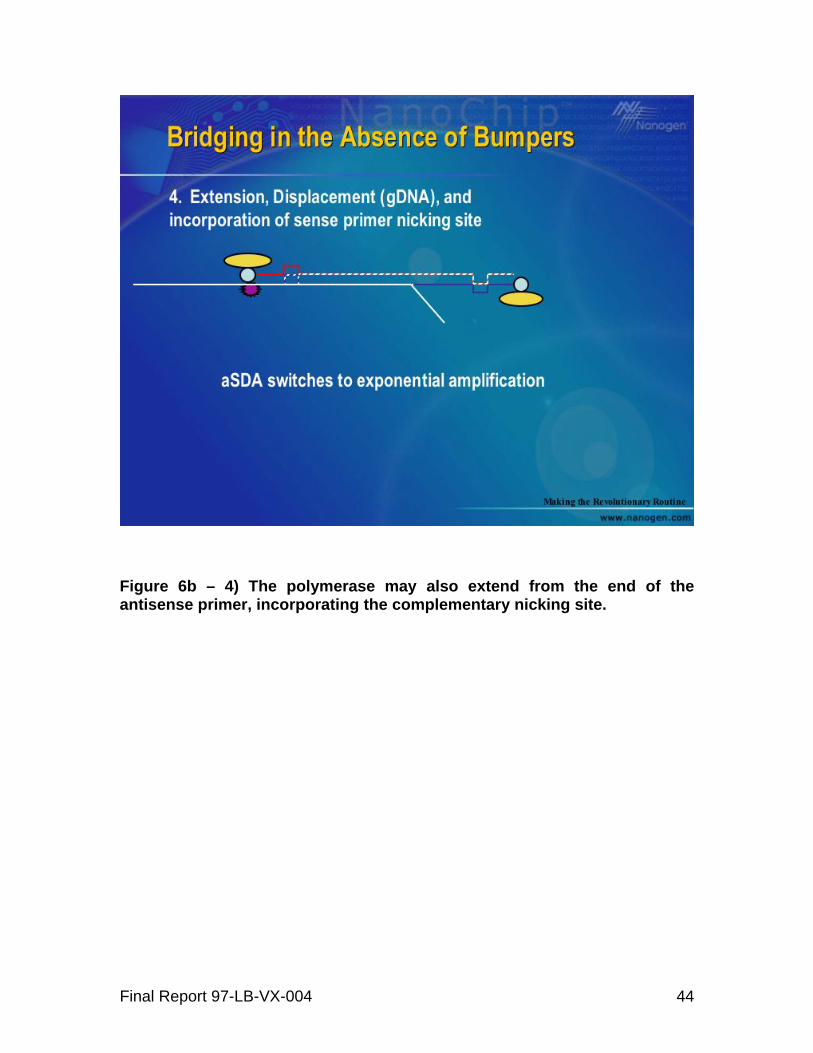
Figure 6b – 4) The polymerase may also extend from the end of the antisense primer, incorporating the complementary nicking site.
Final Report 97-LB-VX-004 44
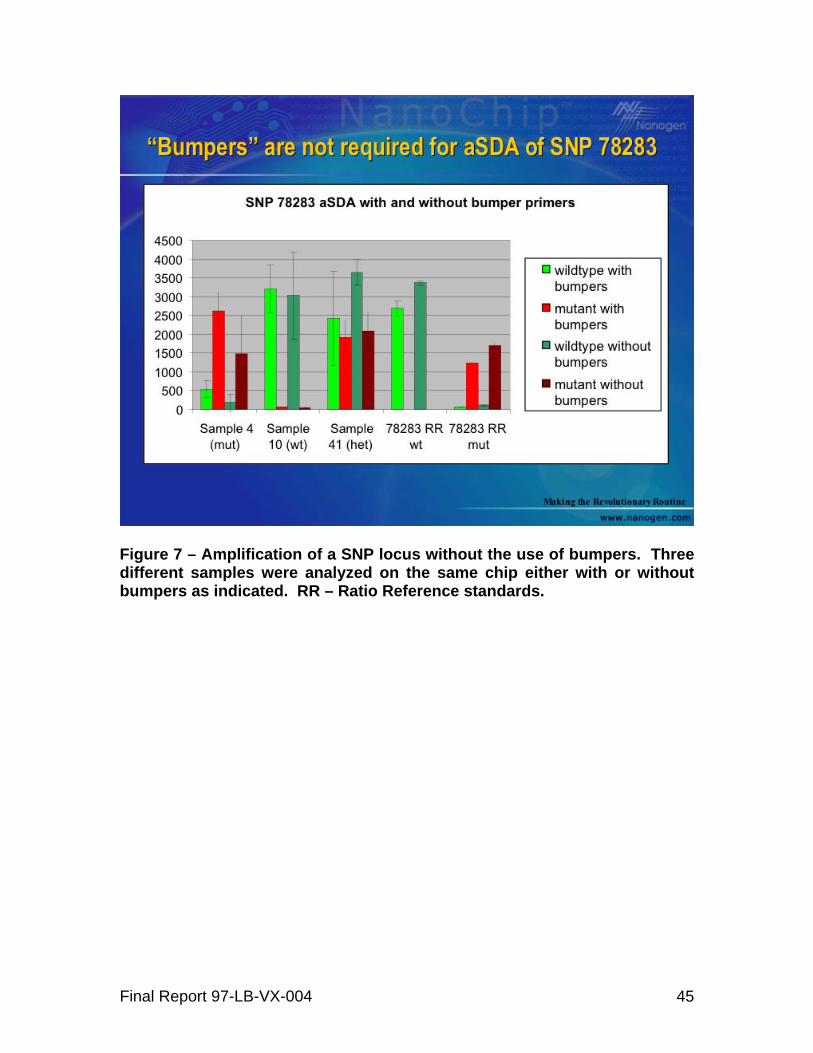
Figure 7 – Amplification of a SNP locus without the use of bumpers. Three different samples were analyzed on the same chip either with or without bumpers as indicated. RR – Ratio Reference standards.
Final Report 97-LB-VX-004 45
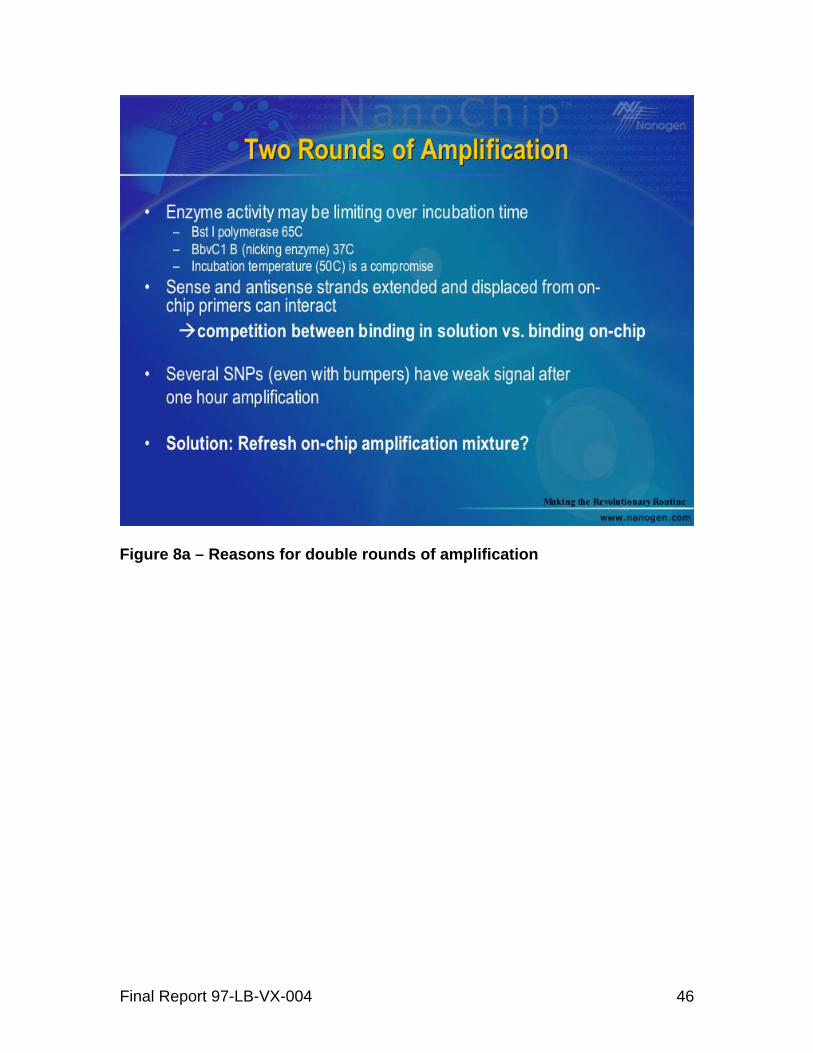
Figure 8a – Reasons for double rounds of amplification
Final Report 97-LB-VX-004 46
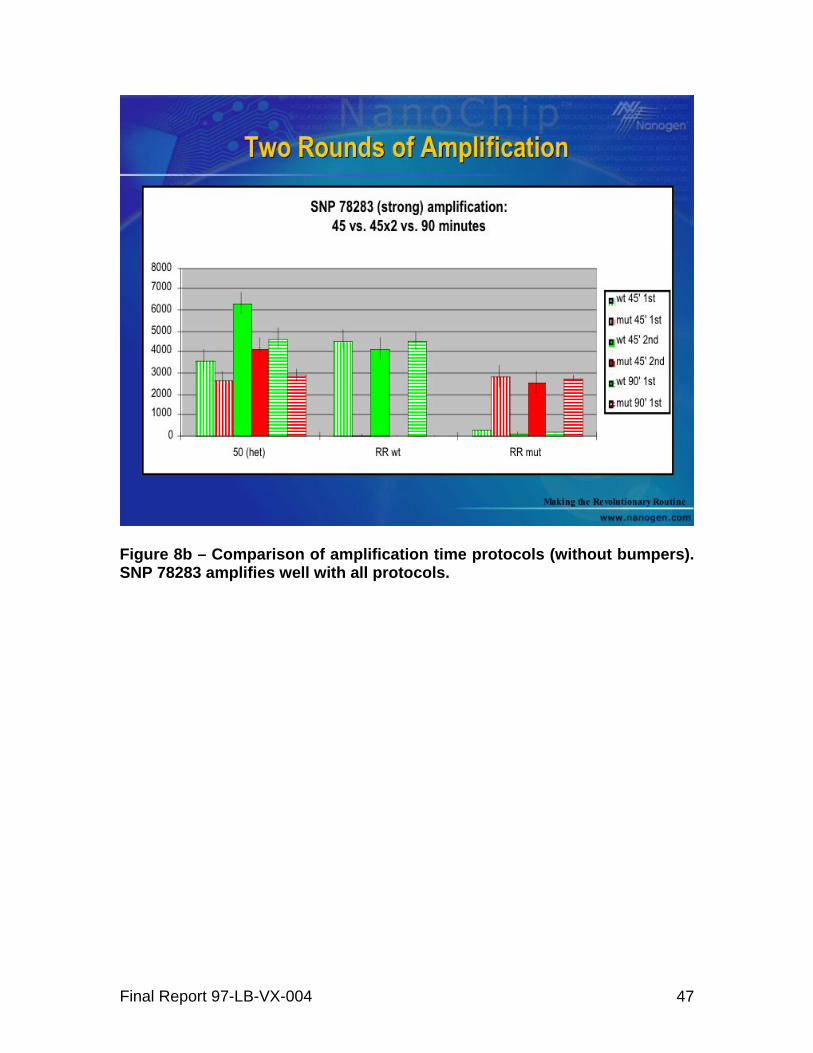
Figure 8b – Comparison of amplification time protocols (without bumpers). SNP 78283 amplifies well with all protocols.
Final Report 97-LB-VX-004 47
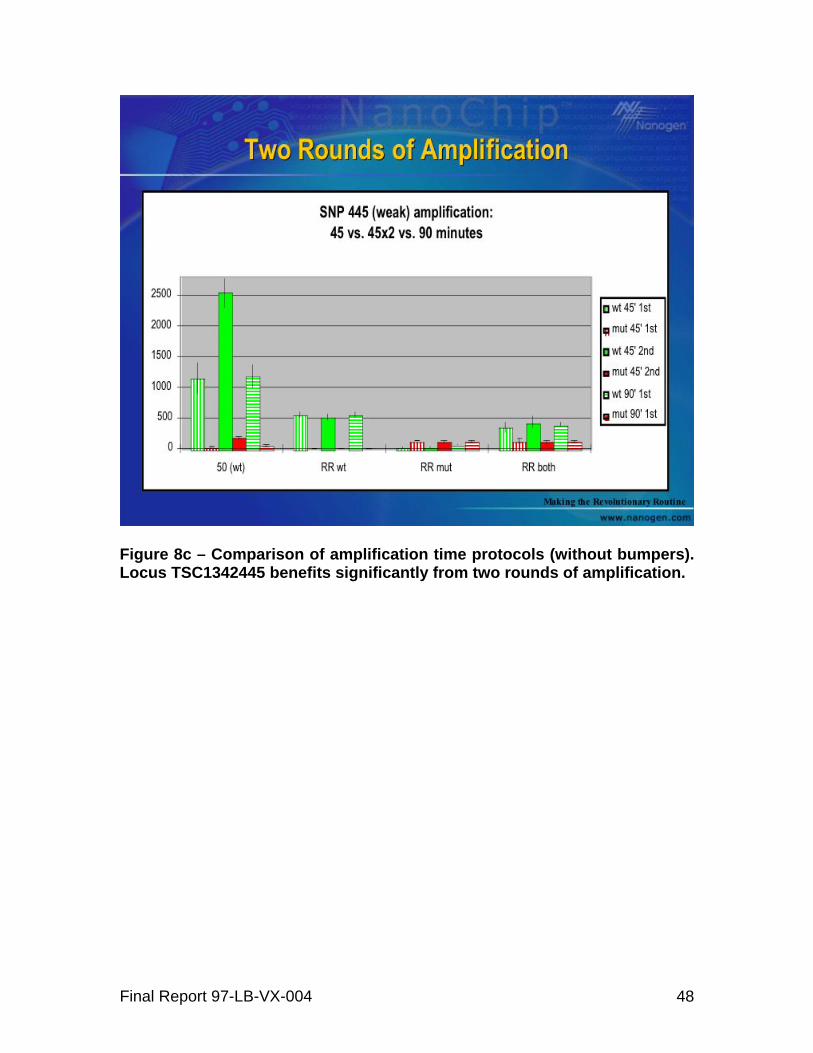
Figure 8c – Comparison of amplification time protocols (without bumpers). Locus TSC1342445 benefits significantly from two rounds of amplification.
Final Report 97-LB-VX-004 48
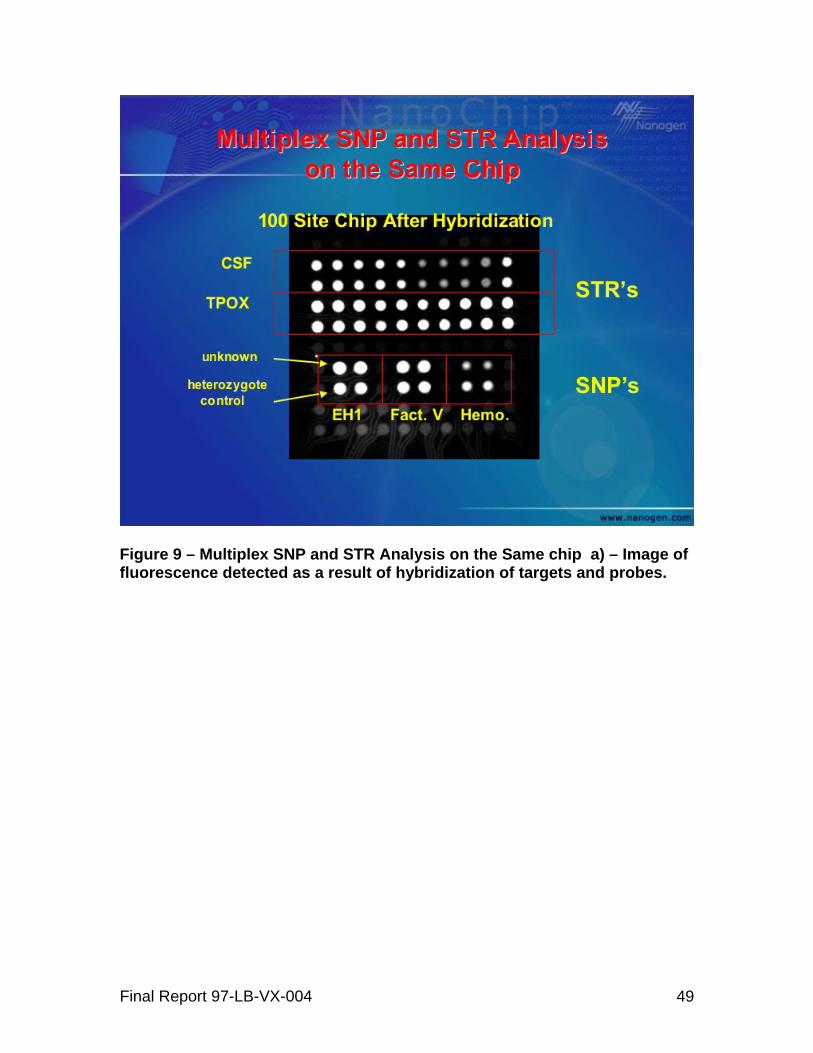
Figure 9 – Multiplex SNP and STR Analysis on the Same chip a) – Image of fluorescence detected as a result of hybridization of targets and probes.
Final Report 97-LB-VX-004 49

Figure 9b – Image of fluorescence after stringent conditions were applied. Fluorescence remains at pads with the greatest stability of the complex, indicating the target length (see text).
Final Report 97-LB-VX-004 50
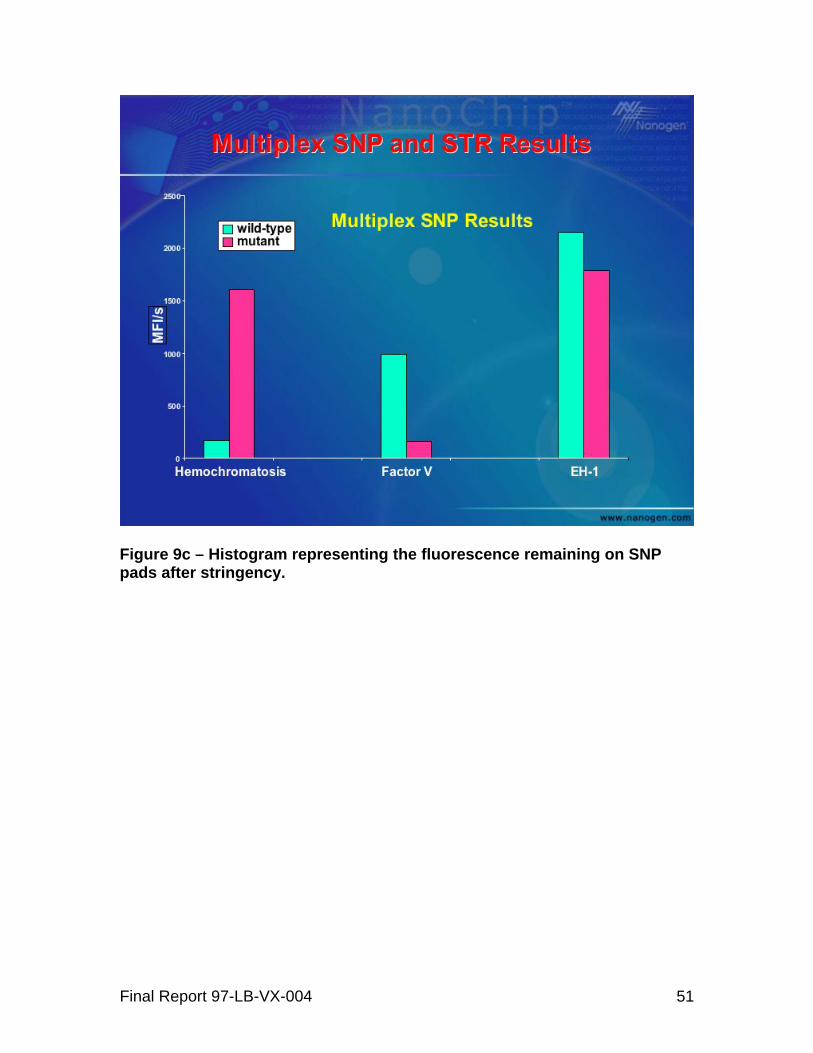
Figure 9c – Histogram representing the fluorescence remaining on SNP pads after stringency.
Final Report 97-LB-VX-004 51
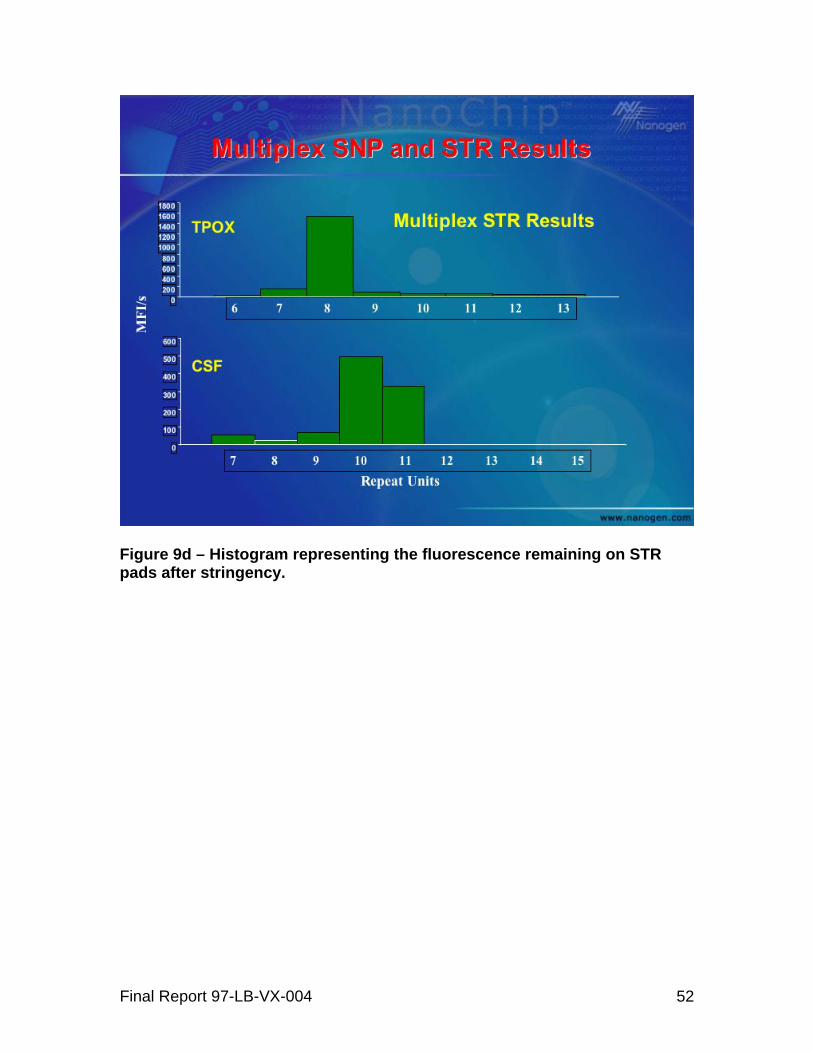
Figure 9d – Histogram representing the fluorescence remaining on STR pads after stringency.
Final Report 97-LB-VX-004 52
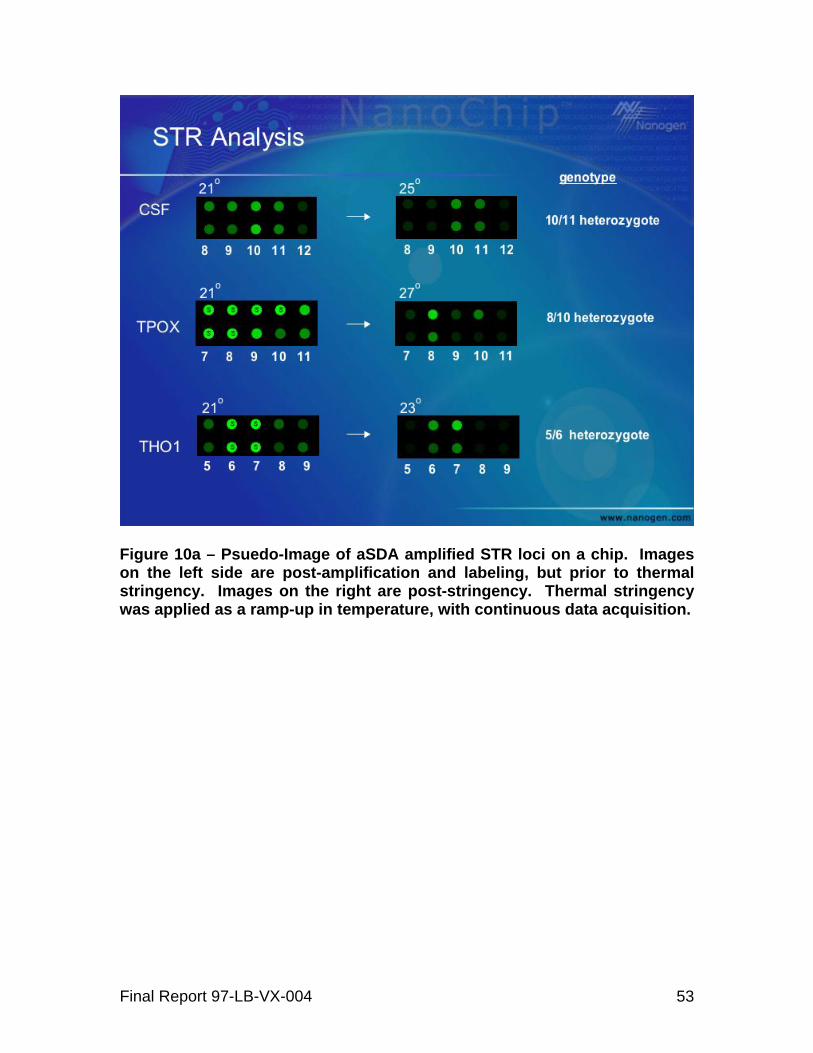
Figure 10a – Psuedo-Image of aSDA amplified STR loci on a chip. Images on the left side are post-amplification and labeling, but prior to thermal stringency. Images on the right are post-stringency. Thermal stringency was applied as a ramp-up in temperature, with continuous data acquisition.
Final Report 97-LB-VX-004 53
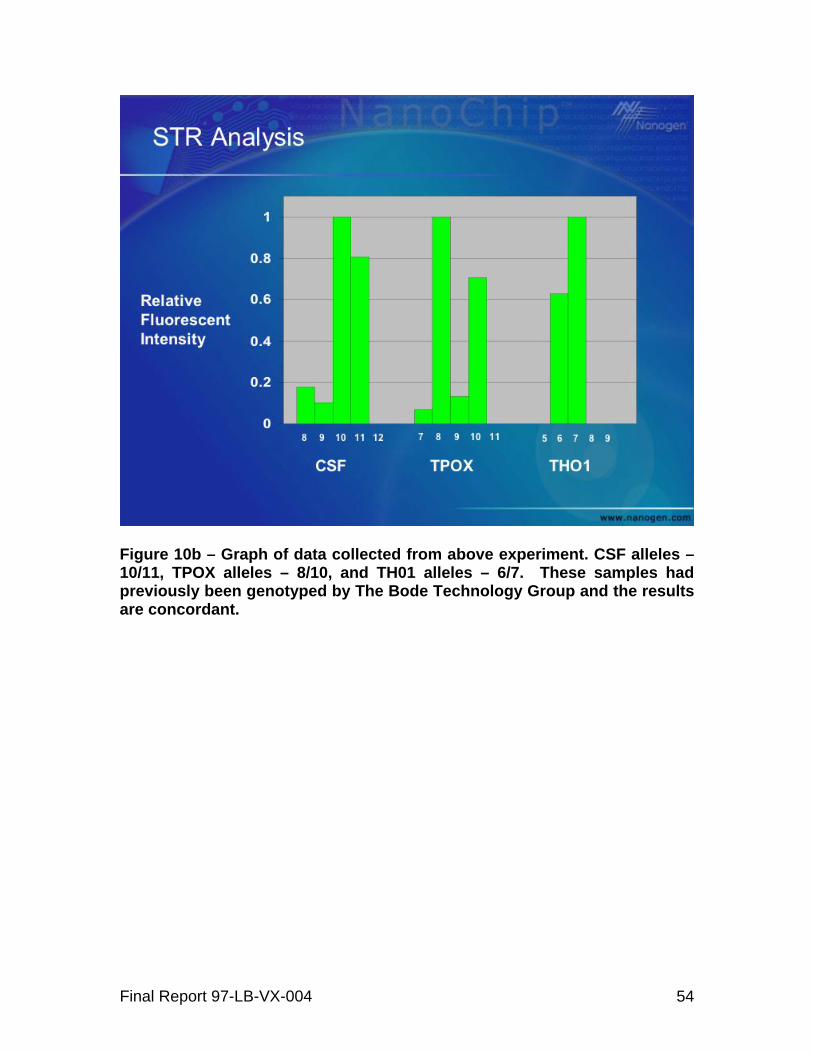
Figure 10b – Graph of data collected from above experiment. CSF alleles – 10/11, TPOX alleles – 8/10, and TH01 alleles – 6/7. These samples had previously been genotyped by The Bode Technology Group and the results are concordant.
Final Report 97-LB-VX-004 54

Figure 11 – Discrimination results from a simultaneous amplification of 22 loci. Results are concordant with tests from individual PCR amplification of the same loci.
Final Report 97-LB-VX-004 55
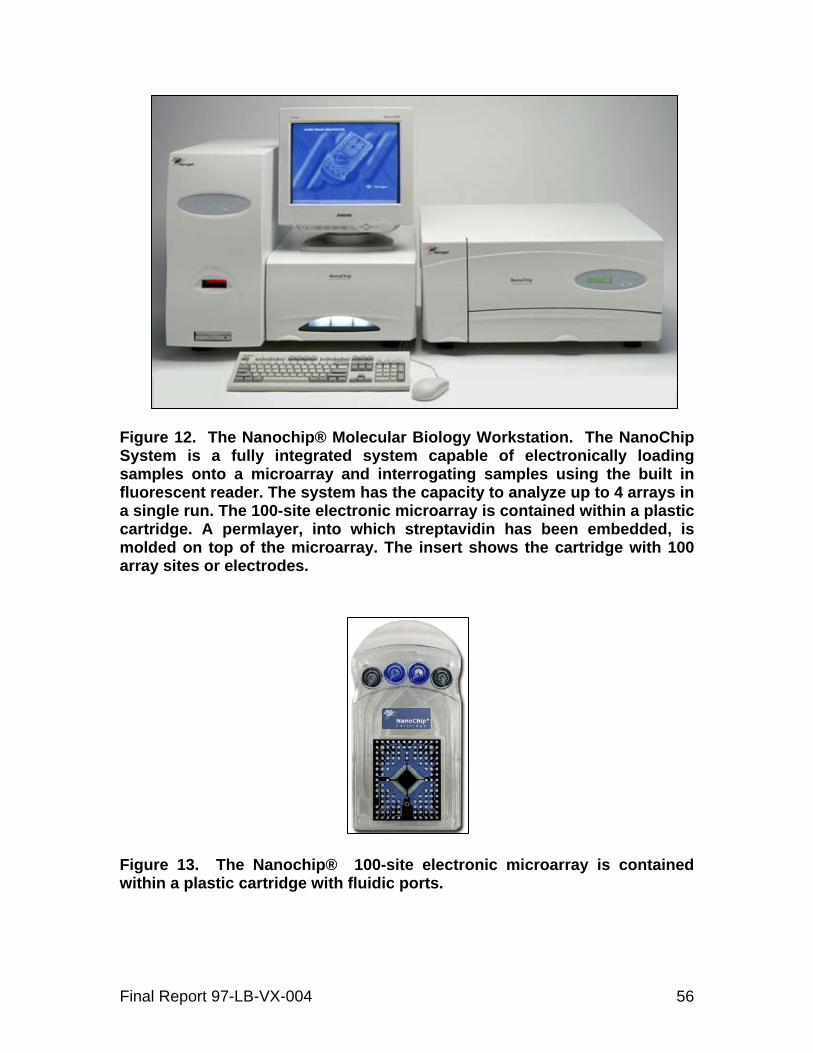
Figure 12. The Nanochip® Molecular Biology Workstation. The NanoChip System is a fully integrated system capable of electronically loading samples onto a microarray and interrogating samples using the built in fluorescent reader. The system has the capacity to analyze up to 4 arrays in a single run. The 100-site electronic microarray is contained within a plastic cartridge. A permlayer, into which streptavidin has been embedded, is molded on top of the microarray. The insert shows the cartridge with 100 array sites or electrodes.
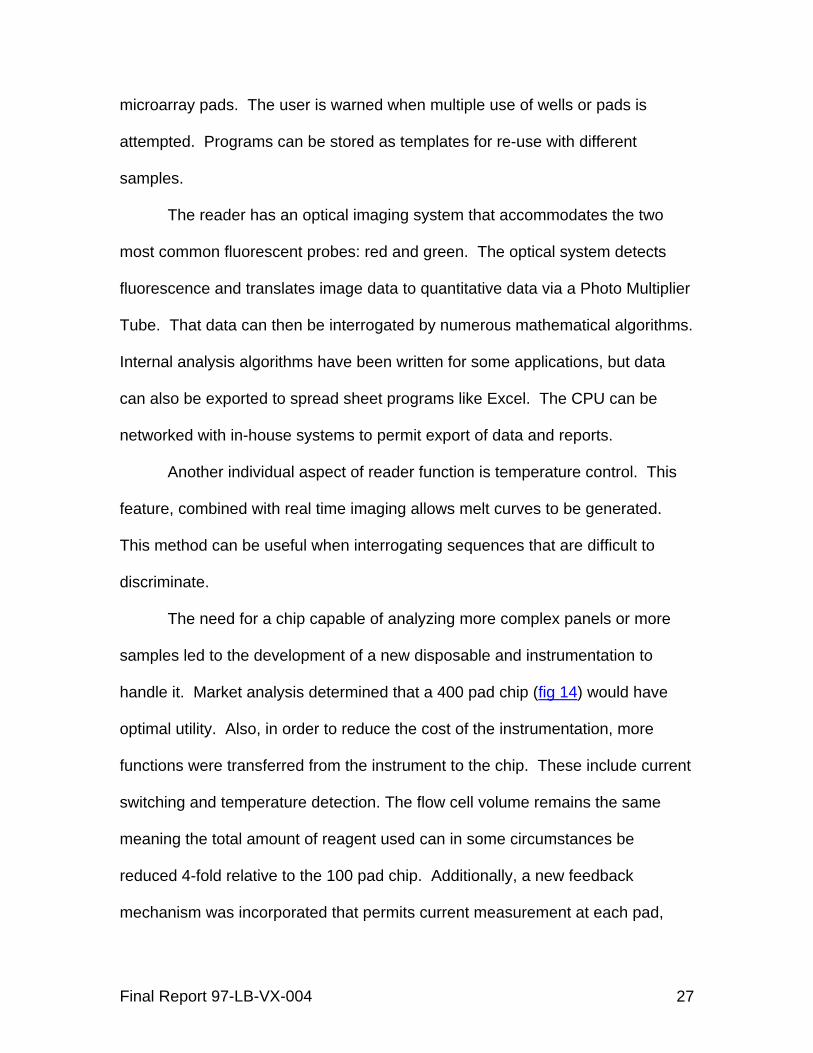
Figure 13. The Nanochip® 100-site electronic microarray is contained within a plastic cartridge with fluidic ports.
Final Report 97-LB-VX-004 56
NanogenÕs Microarray is Different
= Affymetrix GeneChip¨
Illumina BeadArray¨
NanoChip¨ 400 Cartridge
* GeneC hip is a registered trademark of Affymetrix, Inc. BeadArray is a registered trademark of Illumina, Inc.
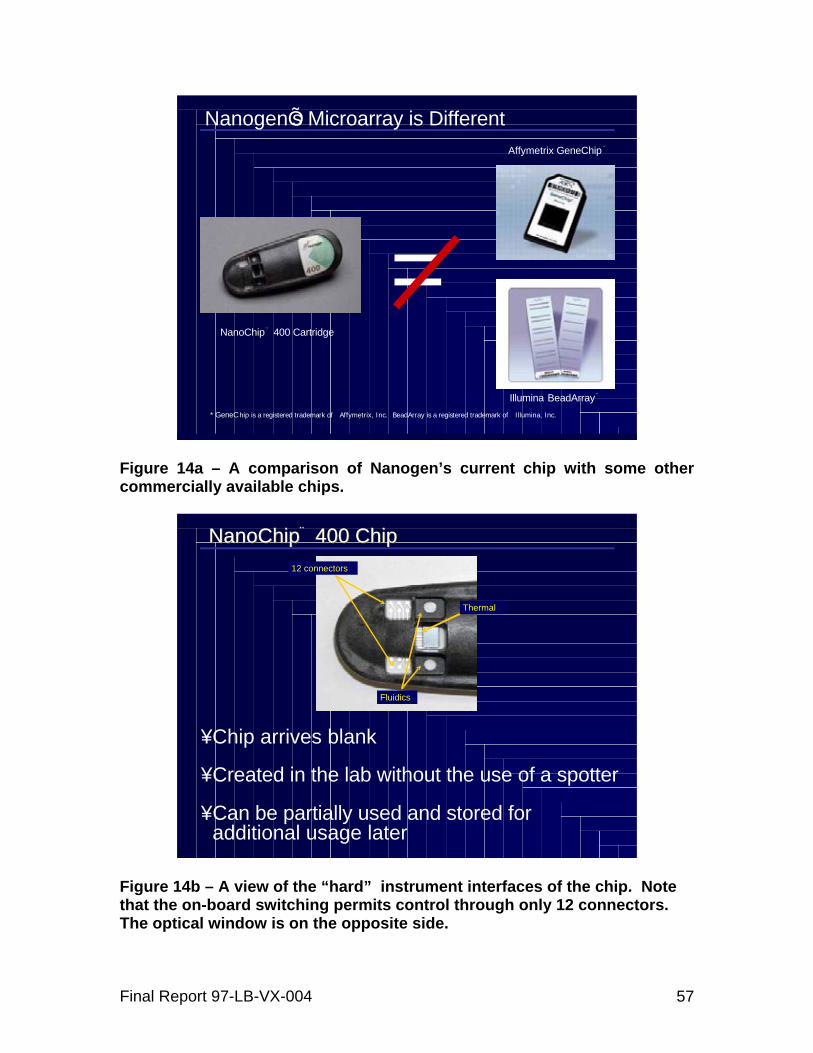
Figure 14a – A comparison of Nanogen’s current chip with some other commercially available chips.
NanoChip¨ 400 ChipNanoChip¨ 400 Chip
¥Chip arrives blank
¥Created in the lab without the use of a spotter
¥Can be partially used and stored foradditional usage later
12 connectors
Thermal
Fluidics
Figure 14b – A view of the “hard” instrument interfaces of the chip. Note that the on-board switching permits control through only 12 connectors. The optical window is on the opposite side.
Final Report 97-LB-VX-004 57
Active Chip TechnologyActive Chip Technology
Standard NanoChip® CMOS chips
All control and sensing is provided by the host
system
Control, sensing and data storage is on-chip
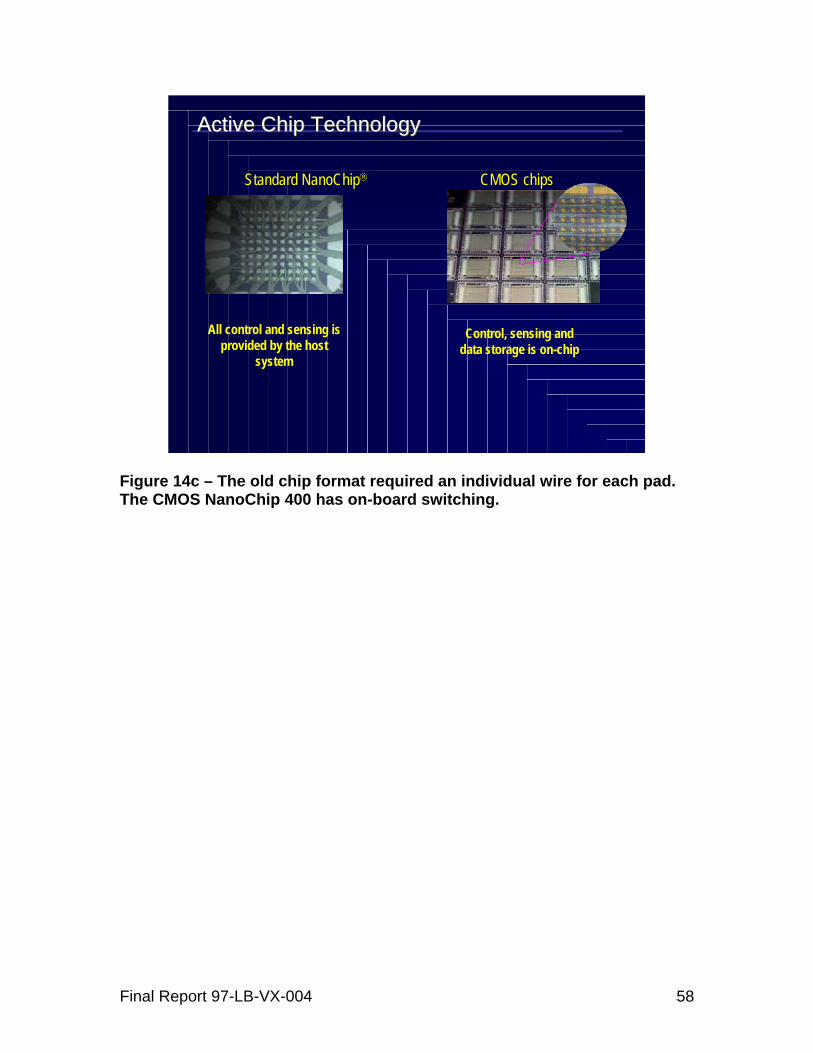
Figure 14c – The old chip format required an individual wire for each pad. The CMOS NanoChip 400 has on-board switching.
Final Report 97-LB-VX-004 58

Buffer & Water bottlesBuffer & Water bottles
LCD DisplayLCD Display
Cartridge DoorCartridge Door
Barcode ScannerBarcode Scanner
Robotic ArmRobotic Arm
Ethernet PortEthernet Port
Probe TipProbe Tip
NanoChip¨ 400 SystemNanoChip¨ 400 System
NanoChip¨ 400 Instrument Deck
96/384 well plate96/384 well plate
Salt (Other) buffersSalt (Other) buffers
Reagent Pack CassetteReagent Pack Cassette
Wash-tipWash-tip
Dispense CupDispense Cup
Cooled Reagent TrayCooled Reagent Tray
Figure 15 - NanoChip® 400 instrument.
Final Report 97-LB-VX-004 59
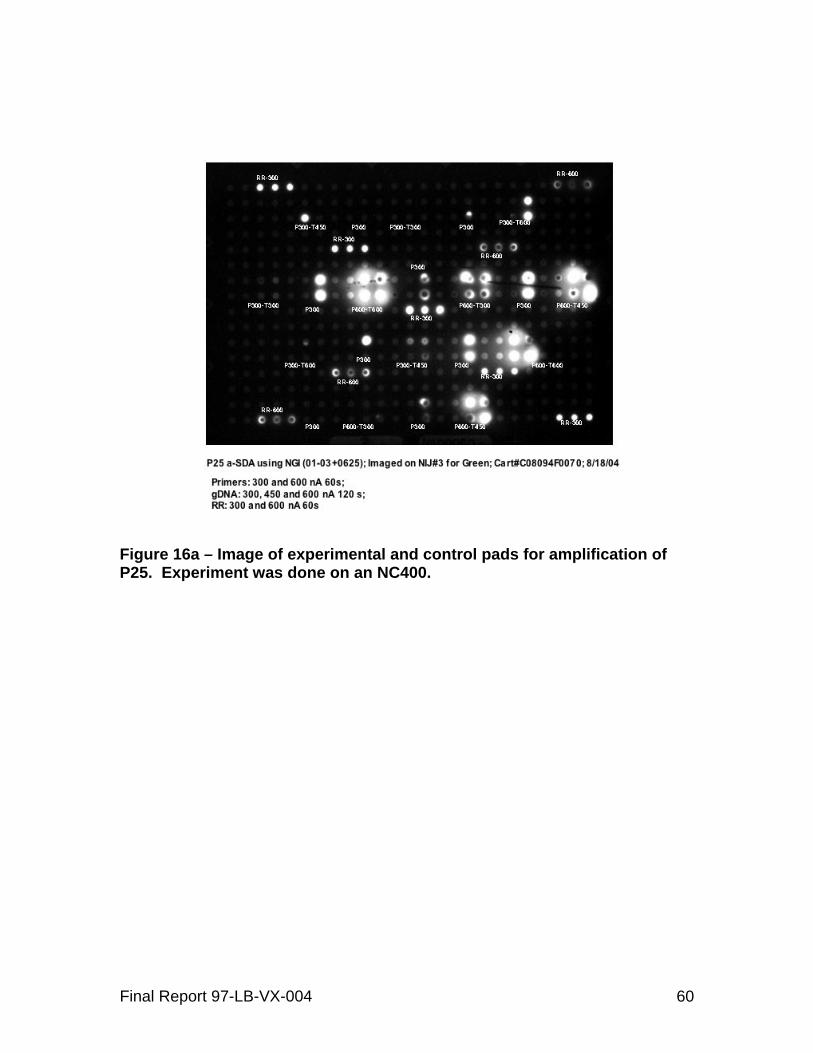
Figure 16a – Image of experimental and control pads for amplification of P25. Experiment was done on an NC400.
Final Report 97-LB-VX-004 60
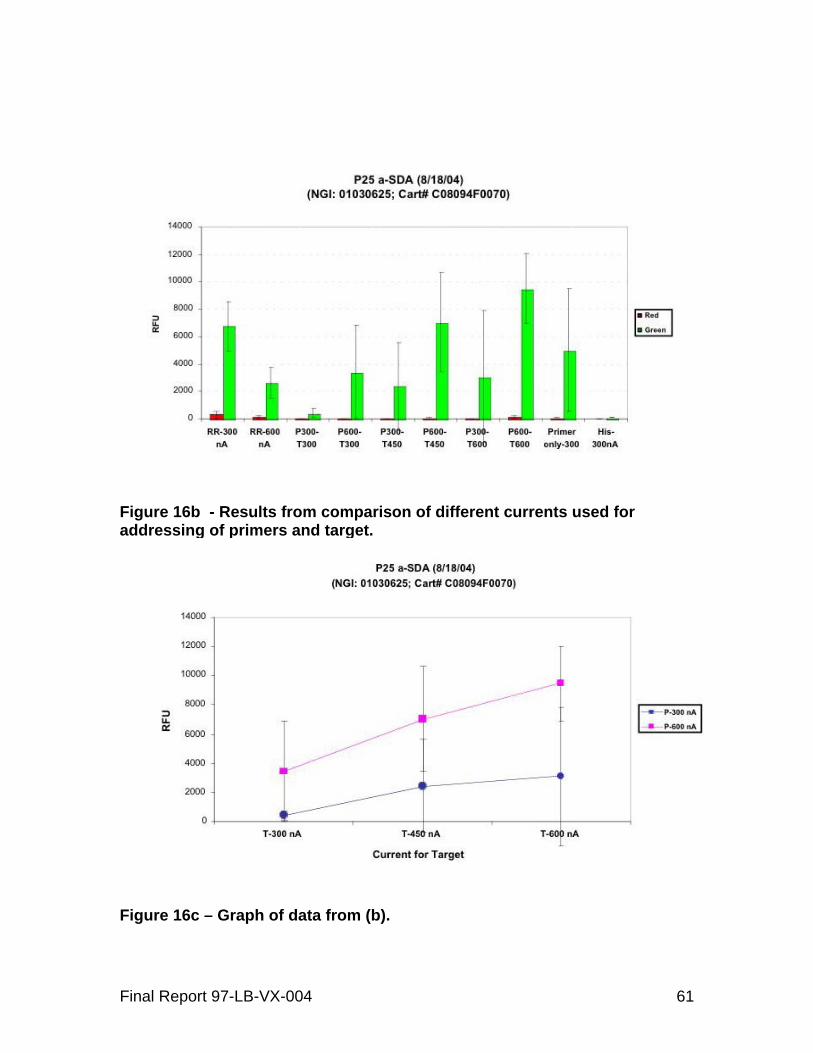
Figure 16b - Results from comparison of different currents used for addressing of primers and target.
Figure 16c – Graph of data from (b).
Final Report 97-LB-VX-004 61
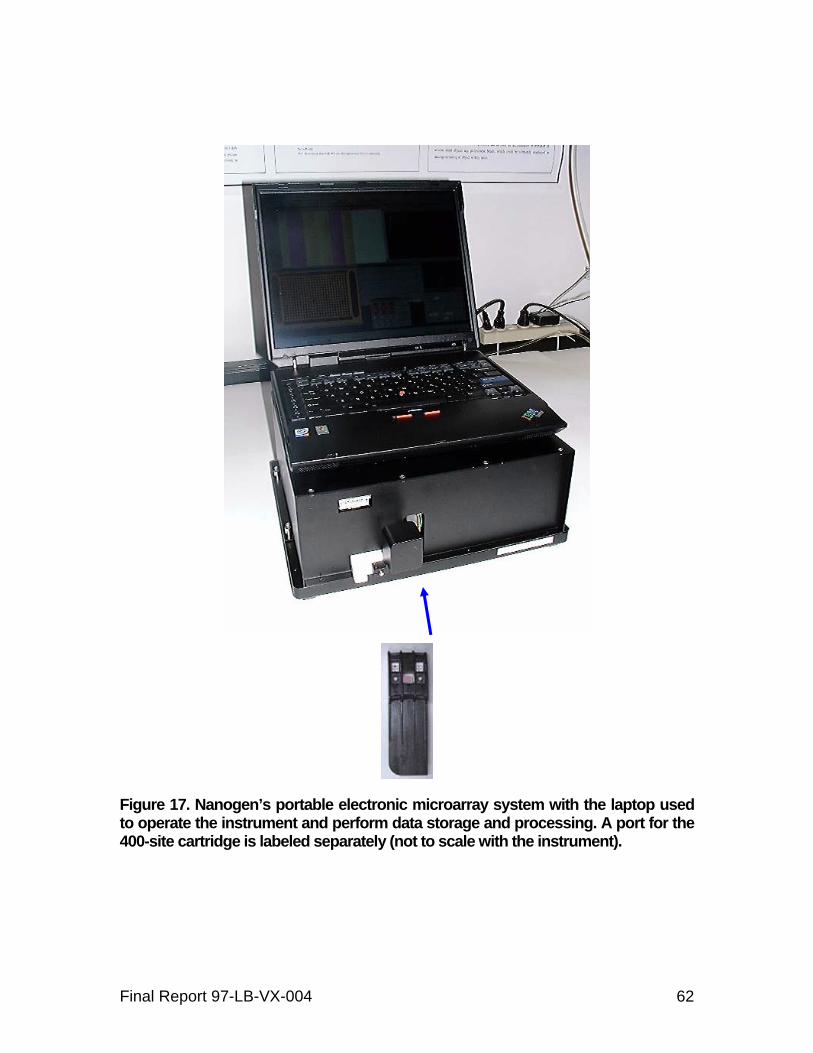
Figure 17. Nanogen’s portable electronic microarray system with the laptop used to operate the instrument and perform data storage and processing. A port for the 400-site cartridge is labeled separately (not to scale with the instrument).
Final Report 97-LB-VX-004 62
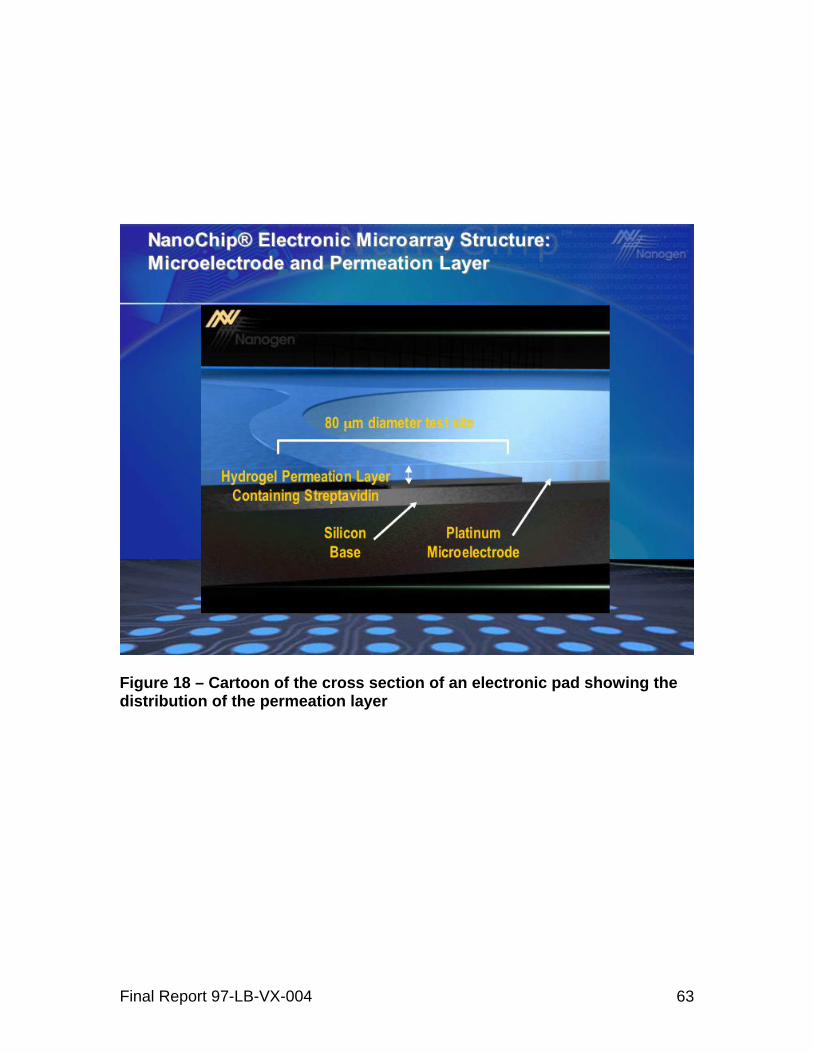
Figure 18 – Cartoon of the cross section of an electronic pad showing the distribution of the permeation layer
Final Report 97-LB-VX-004 63
13. List of Tables
22-plex aSDA SNP Sequence Description Oligos Reference 247 Mitochondrial, HVII, nucleotide 247 Exhibit 1 Budowle, B P25 Y-chromosome SNP, 3 copies a,b,c Exhibit 2 Hammer, M M27 Y SNP Exhibit 3 Hammer, M DYS199 Y SNP Exhibit 4 Hammer, M DYS188 Y SNP Exhibit 5 Hammer, M DYS271 Y SNP Exhibit 6 Hammer, M M26 Y SNP Exhibit 7 Hammer, M M45 Y SNP Exhibit 8 Hammer, M PN1 Y SNP Exhibit 9 Hammer, M M145 Y SNP Exhibit 10 Hammer, M M178 Y SNP Exhibit 11 Hammer, M SRY10831 Y SNP Exhibit 12 Hammer, M PN2 Y SNP Exhibit 13 Hammer, M TSC0683201 Autosomal SNP Exhibit 14 Gill, P TSC0078283 Autosomal SNP Exhibit 15 Gill, P TSC0131214 Autosomal SNP Exhibit 16 Gill, P TSC0421768 Autosomal SNP Exhibit 17 Gill, P TSC1342445 Autosomal SNP Exhibit 18 Gill, P TSC0252540 Autosomal SNP Exhibit 19 Gill, P TSC0709016 Autosomal SNP Exhibit 20 Gill, P TSC0154197 Autosomal SNP Exhibit 21 Gill, P TSC0478751 Autosomal SNP Exhibit 22 Gill, P
Table 1 – A list of the SNP loci used in 22-locus multiplex panel. Sequences of target, amplicon, amplification oligos and analytical oligos are located in the Exhibit indicated.
Final Report 97-LB-VX-004 64

Exhibit 1
HVII (189-200, 247) We detect senseUpdated 4Oct04 MH
GATCACAGGTCTATCACCCTATTAACCACTCACGGGAGCTCTCCATGCATTTGGTATTTTCGTCTGGGGGGT GA(73)TGCACGCGATAGCATTG 90
CTAGTGTCCAGATAGTGGGATAATTGGTGAGTGCCCTCGAGAGGTACGTAAACCATAAAAGCAGACCCCCCATACGTGCGCTATCGTAAC
5’-AGACGCTGGAGCCGGAGCAC-3’ 189-200 bumper s189-200 s1Bbv 5’-bio-ATCTGTCTTTGATTCCTGCCCCTCAGCATTATTTATCGCAC-3’
189-200 N1 5’-bio-ACCTACGTTCAATATT 247 s1 Bbv 5’-bio-CAATATT
(146)(150)(152)C T C
CGAGACGCTGGAGCCGGAGCACCCTATGTCGCAGTATCTGTCTTTGATTCCTGCCTCATCCTATTATTTATCGCACCTACGTTCAATATT 180 GCTCTGCGACCTCGGCCTCGTGGGATACAGCGTCATAGACAGAAACTAAGGACGGAGTAGGATAATAAATAGCGTGGATGCAAGTTATAA
5’-bio-TAATGCTTGTAGGACATAAT-3’ 247 N1 ACAG-3’ 189-200 N1 ACAGGCGA-3’ 189-200 N2 (same 5’ end as N1, removes SNPs 185, 186, 188)ACAGGCGAACATACCCTCAGCAGTGTGTTAATTAAT 247 s1 Bbv (62.6, 52.0, 45)
247 wt RR CTTGTAGGACATAATAATAACAATTGAATGTCTGCACAGC (189)(195)(198)(200) (247)
G C T G A ACAGGCGAACATACTTACTAAAGTGTGTTAATTAATTAATGCTTGTAGGACATAATAATAACAATTGAATGTCTGCACAGCCACTTTCCA 270 TGTCCGCTTGTATGAATGATTTCACACAATTAATTAATTACGAACATCCTGTATTATTATTGTTAACTTACAGACGTGTCGGTGAAAGGT
3’-CACACAATTAATTACGACTCCACATCCTGTATTATTATTGT-bio-5’ 189-200 as1 Bbv (YH) (202 NOT removed)
3’-ACAGACGTGTCGactccAGGT
CACAGACATCATAACAAAAAATTTCCACCAAACCCCCCCTCCCCCGCTTCTGGCCACAGCACTTAAACACATCTCTGCCAAACCCCAAAA 360 GTGTCTGTAGTATTGTTTTTTAAAGGTGGTTTGGGGGGGAGGGGGCGAAGACCGGTGTCGTGAATTTGTGTAGAGACGGTTTGGGGTTTT GTGTCTGTAGTATTGTT-bio-5’ 189-247 as1 Bbv
3’-GAAGACCGGTGTCGTGAATT-5’ 189-247 bumper as
Final Report 97-LB-VX-004 65
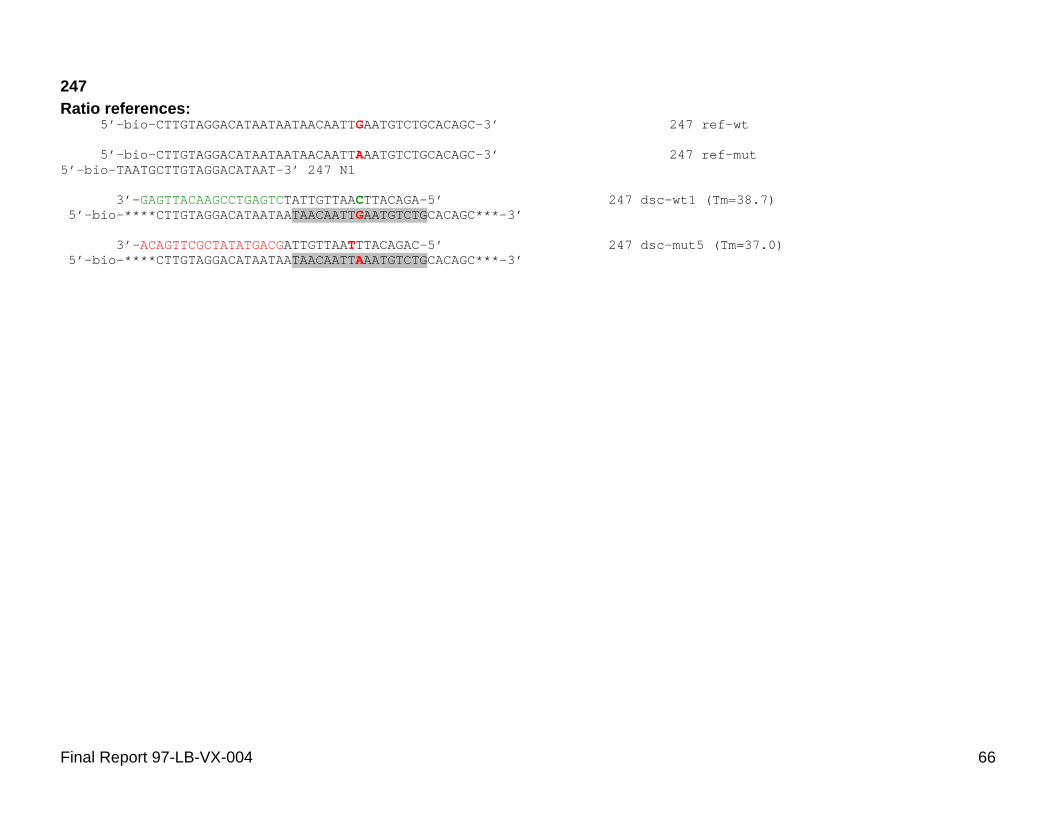
247 Ratio references:
5’-bio-CTTGTAGGACATAATAATAACAATTGAATGTCTGCACAGC-3’ 247 ref-wt
5’-bio-CTTGTAGGACATAATAATAACAATTAAATGTCTGCACAGC-3’ 247 ref-mut 5’-bio-TAATGCTTGTAGGACATAAT-3’ 247 N1
3’-GAGTTACAAGCCTGAGTCTATTGTTAACTTACAGA-5’ 247 dsc-wt1 (Tm=38.7)5’-bio-****CTTGTAGGACATAATAATAACAATTGAATGTCTGCACAGC***-3’
3’-ACAGTTCGCTATATGACGATTGTTAATTTACAGAC-5’ 247 dsc-mut5 (Tm=37.0)5’-bio-****CTTGTAGGACATAATAATAACAATTAAATGTCTGCACAGC***-3’
Final Report 97-LB-VX-004 66

189 3'-GAGTTACAAGCCTGAGTCTGTCCGCTTGTA-5' 3'-GAGTTACAAGCCTGAGTCTGTCCGCTTGTAT-5'
5'-***TCAATATTACAGGCGAACATACTTACTAAAGTGTGTTAATTAATT***-3'
3'-ACAGTTCGCTATATGACGTGTCCGCTCGT-5’ 5'-***TCAATATTACAGGCGAGCATACTTACTAAAGTGTGTTAATTAATT***-3'
195 (overlap with 198)3'-GAGTTACAAGCCTGAGTCCGCTCGTATGAAT-5’ 3'-GAGTTACAAGCCTGAGTCCCGCTTGTATGAAT-5’
5'-***TCAATATTACAGGCGAACATACTTACTAAAGTGTGTTAATTAATT***-3'
3'-ACAGTTCGCTATATGACGCGCTCGTATGGAT-5’ 3'-ACAGTTCGCTATATGACGCCGCTTGTATGGAT-5’
5'-***TCAATATTACAGGCGAACATACCTACTAAAGTGTGTTAATTAATT***-3'
198 (overlap with 200)3’-GAGTTACAAGCCTGAGTCTTATGACTTCACACAATTAA-5’ 3’-GAGTTACAAGCCTGAGTCTTATGATTTCACACAATTAA-5’
5'-***TCAATATTACAGGCGAACATACTTACTAAAGTGTGTTAATTAATT***-3'
3'-ACAGTTCGCTATATGACGTTTATAACTTCACACAATTA-5’ 3'-ACAGTTCGCTATATGACGTTTATAATTTCACACAATTA-5’
5'-***TCAATATTACAGGCGAACATACTTATTAAAGTGTGTTAATTAATT***-3'
200 (overlap with 198)3’-GAGTTACAAGCCTGAGTCTTTATCATTTCACACAATTAA-5’ 3’-GAGTTACAAGCCTGAGTCTTTATTATTTCACACAATTAA-5’
5'-***TCAATATTACAGGCGAACATACTTACTAAAGTGTGTTAATTAATT***-3'
3'-ACAGTTCGCTATATGACGTTTATCACTTCACACAATTA-5’ 3'-ACAGTTCGCTATATGACGTTTATTACTTCACACAATTA-5’
5'-***TCAATATTACAGGCGAACATACTTACTGAAGTGTGTTAATTAATT***-3'
189 dsc-wt1 (Tm=38.1)189 dsc-wt2 (Tm=39.0)
189 dsc-mut3 (Tm=40.2)
195 Dsc-wt1c (Tm=36.6) 195 Dsc-wt1t (Tm=38.1)
195 Dsc-mut2c (Tm=39.4) 195 Dsc-mut2t (Tm=40.8)
198 Dsc-wt3c(Tm=42.0) 198 Dsc-wt3t(Tm=39.2)
198 Dsc-mut4c(Tm=38.3) 198 Dsc-mut4t(Tm=35.3)
200 Dsc-wt6c(Tm=39.2) 200 Dsc-wt6t(Tm=38.6)
200 Dsc-mut4c(Tm=40.6) 200 Dsc-mut4t(Tm=38.3)
Final Report 97-LB-VX-004 67

189-200 References 5'-BIO-TCAATATTACAGGCGAACATACTTACTAAAGTGTGTTAATTAATT-3' 5'-BIO-TCAATATTACAGGCGAACATACTTACTGAAGTGTGTTAATTAATT-3' 5'-BIO-TCAATATTACAGGCGAACATACTTATTAAAGTGTGTTAATTAATT-3' 5'-BIO-TCAATATTACAGGCGAACATACTTATTGAAGTGTGTTAATTAATT-3' 5'-BIO-TCAATATTACAGGCGAACATACCTACTAAAGTGTGTTAATTAATT-3' 5'-BIO-TCAATATTACAGGCGAACATACCTACTGAAGTGTGTTAATTAATT-3' 5'-BIO-TCAATATTACAGGCGAACATACCTATTAAAGTGTGTTAATTAATT-3' 5'-BIO-TCAATATTACAGGCGAACATACCTATTGAAGTGTGTTAATTAATT-3' 5'-BIO-TCAATATTACAGGCGAGCATACTTACTAAAGTGTGTTAATTAATT-3' 5'-BIO-TCAATATTACAGGCGAGCATACTTACTGAAGTGTGTTAATTAATT-3' 5'-BIO-TCAATATTACAGGCGAGCATACTTATTAAAGTGTGTTAATTAATT-3' 5'-BIO-TCAATATTACAGGCGAGCATACTTATTGAAGTGTGTTAATTAATT-3' 5'-BIO-TCAATATTACAGGCGAGCATACCTACTAAAGTGTGTTAATTAATT-3' 5'-BIO-TCAATATTACAGGCGAGCATACCTACTGAAGTGTGTTAATTAATT-3' 5'-BIO-TCAATATTACAGGCGAGCATACCTATTAAAGTGTGTTAATTAATT-3' 5'-BIO-TCAATATTACAGGCGAGCATACCTATTGAAGTGTGTTAATTAATT-3'
REF 189-200 ATCA REF 189-200 ATCG REF 189-200 ATTA REF 189-200 ATTG REF 189-200 ACCA REF 189-200 ACCG REF 189-200 ACTA REF 189-200 ACTG REF 189-200 GTCA REF 189-200 GTCG REF 189-200 GTTA REF 189-200 GTTG REF 189-200 GCCA REF 189-200 GCCG REF 189-200 GCTA REF 189-200 GCTG
Final Report 97-LB-VX-004 68
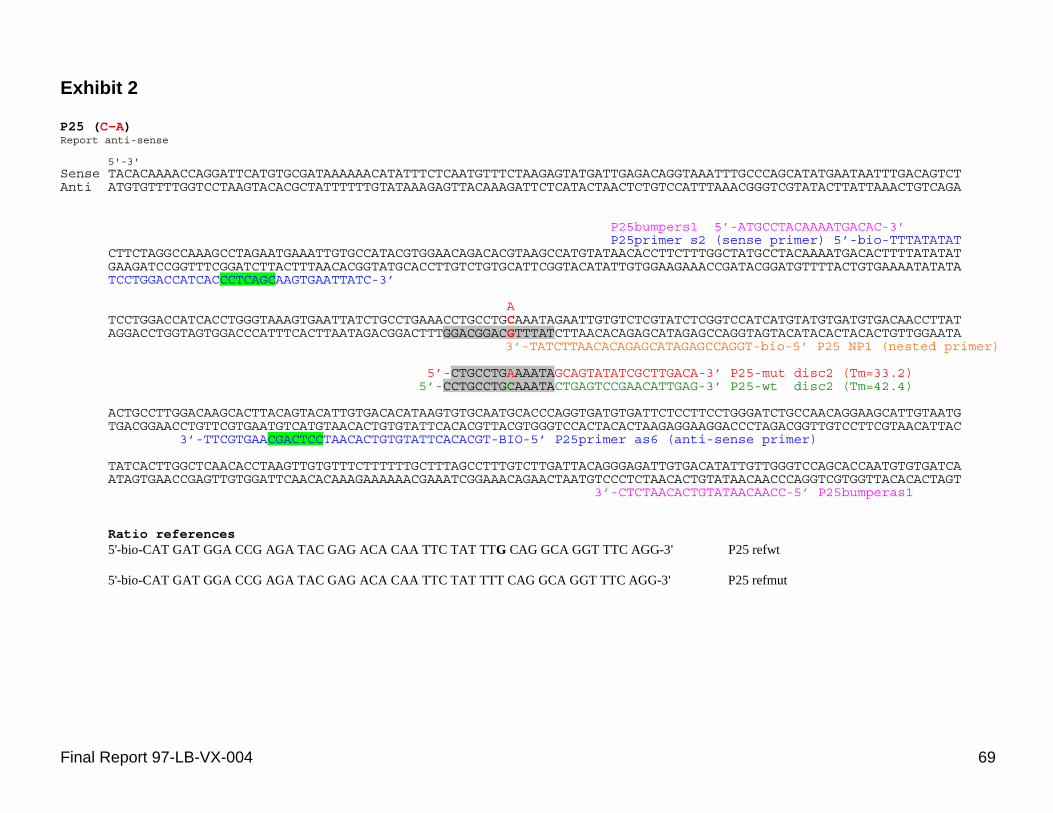
Exhibit 2
P25 (C-A)Report anti-sense
5'-3'Sense TACACAAAACCAGGATTCATGTGCGATAAAAAACATATTTCTCAATGTTTCTAAGAGTATGATTGAGACAGGTAAATTTGCCCAGCATATGAATAATTTGACAGTCTAnti ATGTGTTTTGGTCCTAAGTACACGCTATTTTTTGTATAAAGAGTTACAAAGATTCTCATACTAACTCTGTCCATTTAAACGGGTCGTATACTTATTAAACTGTCAGA
P25bumpers1 5’-ATGCCTACAAAATGACAC-3’P25primer s2 (sense primer) 5’-bio-TTTATATAT
CTTCTAGGCCAAAGCCTAGAATGAAATTGTGCCATACGTGGAACAGACACGTAAGCCATGTATAACACCTTCTTTGGCTATGCCTACAAAATGACACTTTTATATAT GAAGATCCGGTTTCGGATCTTACTTTAACACGGTATGCACCTTGTCTGTGCATTCGGTACATATTGTGGAAGAAACCGATACGGATGTTTTACTGTGAAAATATATA
TCCTGGACCATCACCCTCAGCAAGTGAATTATC-3’
A TCCTGGACCATCACCTGGGTAAAGTGAATTATCTGCCTGAAACCTGCCTGCAAATAGAATTGTGTCTCGTATCTCGGTCCATCATGTATGTGATGTGACAACCTTAT AGGACCTGGTAGTGGACCCATTTCACTTAATAGACGGACTTTGGACGGACGTTTATCTTAACACAGAGCATAGAGCCAGGTAGTACATACACTACACTGTTGGAATA
3’-TATCTTAACACAGAGCATAGAGCCAGGT-bio-5’ P25 NP1 (nested primer)
5’-CTGCCTGAAAATAGCAGTATATCGCTTGACA-3’ P25-mut disc2 (Tm=33.2) 5’-CCTGCCTGCAAATACTGAGTCCGAACATTGAG-3’ P25-wt disc2 (Tm=42.4)
ACTGCCTTGGACAAGCACTTACAGTACATTGTGACACATAAGTGTGCAATGCACCCAGGTGATGTGATTCTCCTTCCTGGGATCTGCCAACAGGAAGCATTGTAATG TGACGGAACCTGTTCGTGAATGTCATGTAACACTGTGTATTCACACGTTACGTGGGTCCACTACACTAAGAGGAAGGACCCTAGACGGTTGTCCTTCGTAACATTAC
3’-TTCGTGAACGACTCCTAACACTGTGTATTCACACGT-BIO-5’ P25primer as6 (anti-sense primer)
TATCACTTGGCTCAACACCTAAGTTGTGTTTCTTTTTTGCTTTAGCCTTTGTCTTGATTACAGGGAGATTGTGACATATTGTTGGGTCCAGCACCAATGTGTGATCA ATAGTGAACCGAGTTGTGGATTCAACACAAAGAAAAAACGAAATCGGAAACAGAACTAATGTCCCTCTAACACTGTATAACAACCCAGGTCGTGGTTACACACTAGT
3’-CTCTAACACTGTATAACAACC-5’ P25bumperas1
Ratio references 5'-bio-CAT GAT GGA CCG AGA TAC GAG ACA CAA TTC TAT TTG CAG GCA GGT TTC AGG-3' P25 refwt
5'-bio-CAT GAT GGA CCG AGA TAC GAG ACA CAA TTC TAT TTT CAG GCA GGT TTC AGG-3' P25 refmut
Final Report 97-LB-VX-004 69
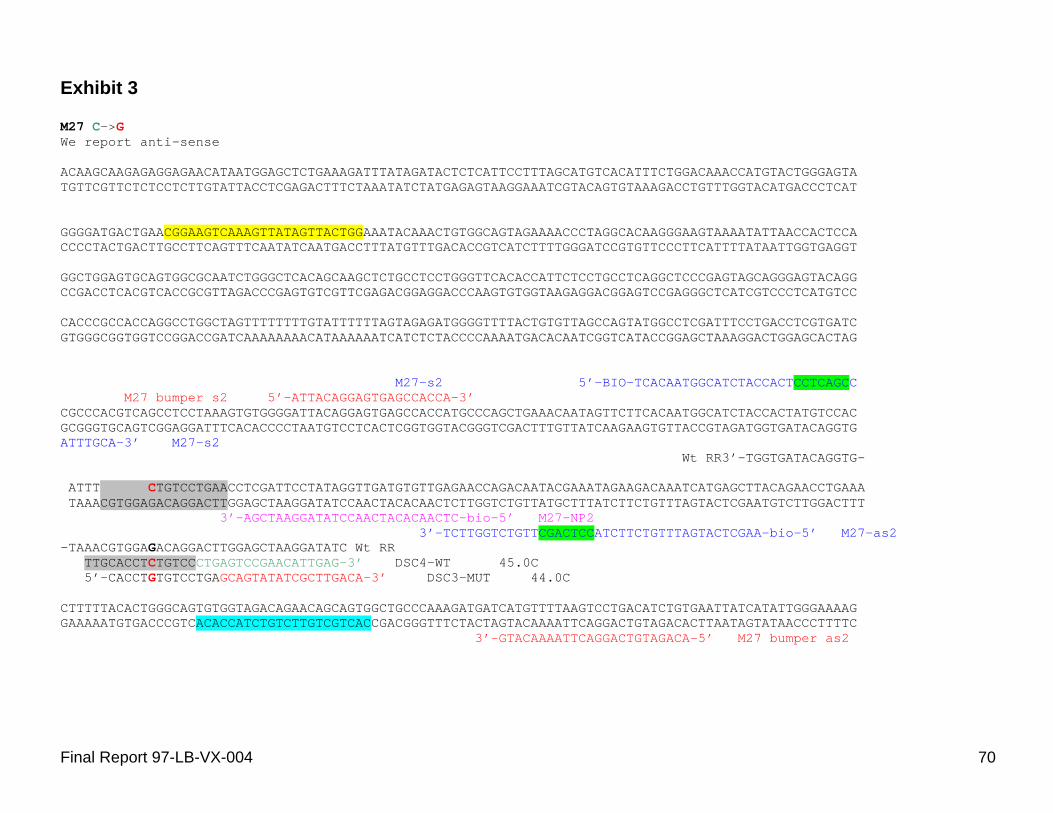
Exhibit 3
M27 C->G We report anti-sense
ACAAGCAAGAGAGGAGAACATAATGGAGCTCTGAAAGATTTATAGATACTCTCATTCCTTTAGCATGTCACATTTCTGGACAAACCATGTACTGGGAGTA TGTTCGTTCTCTCCTCTTGTATTACCTCGAGACTTTCTAAATATCTATGAGAGTAAGGAAATCGTACAGTGTAAAGACCTGTTTGGTACATGACCCTCAT
GGGGATGACTGAACGGAAGTCAAAGTTATAGTTACTGGAAATACAAACTGTGGCAGTAGAAAACCCTAGGCACAAGGGAAGTAAAATATTAACCACTCCA CCCCTACTGACTTGCCTTCAGTTTCAATATCAATGACCTTTATGTTTGACACCGTCATCTTTTGGGATCCGTGTTCCCTTCATTTTATAATTGGTGAGGT
GGCTGGAGTGCAGTGGCGCAATCTGGGCTCACAGCAAGCTCTGCCTCCTGGGTTCACACCATTCTCCTGCCTCAGGCTCCCGAGTAGCAGGGAGTACAGG CCGACCTCACGTCACCGCGTTAGACCCGAGTGTCGTTCGAGACGGAGGACCCAAGTGTGGTAAGAGGACGGAGTCCGAGGGCTCATCGTCCCTCATGTCC
CACCCGCCACCAGGCCTGGCTAGTTTTTTTTGTATTTTTTAGTAGAGATGGGGTTTTACTGTGTTAGCCAGTATGGCCTCGATTTCCTGACCTCGTGATC GTGGGCGGTGGTCCGGACCGATCAAAAAAAACATAAAAAATCATCTCTACCCCAAAATGACACAATCGGTCATACCGGAGCTAAAGGACTGGAGCACTAG
M27-s2 5’-BIO-TCACAATGGCATCTACCACTCCTCAGCC M27 bumper s2 5’-ATTACAGGAGTGAGCCACCA-3’
CGCCCACGTCAGCCTCCTAAAGTGTGGGGATTACAGGAGTGAGCCACCATGCCCAGCTGAAACAATAGTTCTTCACAATGGCATCTACCACTATGTCCAC GCGGGTGCAGTCGGAGGATTTCACACCCCTAATGTCCTCACTCGGTGGTACGGGTCGACTTTGTTATCAAGAAGTGTTACCGTAGATGGTGATACAGGTG ATTTGCA-3’ M27-s2
Wt RR3’-TGGTGATACAGGTG-
ATTTGCACCTCTGTCCTGAACCTCGATTCCTATAGGTTGATGTGTTGAGAACCAGACAATACGAAATAGAAGACAAATCATGAGCTTACAGAACCTGAAA TAAACGTGGAGACAGGACTTGGAGCTAAGGATATCCAACTACACAACTCTTGGTCTGTTATGCTTTATCTTCTGTTTAGTACTCGAATGTCTTGGACTTT
3’-AGCTAAGGATATCCAACTACACAACTC-bio-5’ M27-NP2 3’-TCTTGGTCTGTTCGACTCCATCTTCTGTTTAGTACTCGAA-bio-5’ M27-as2
-TAAACGTGGAGACAGGACTTGGAGCTAAGGATATC Wt RR TTGCACCTCTGTCCCTGAGTCCGAACATTGAG-3’ DSC4-WT 45.0C 5’-CACCTGTGTCCTGAGCAGTATATCGCTTGACA-3’ DSC3-MUT 44.0C
CTTTTTACACTGGGCAGTGTGGTAGACAGAACAGCAGTGGCTGCCCAAAGATGATCATGTTTTAAGTCCTGACATCTGTGAATTATCATATTGGGAAAAG GAAAAATGTGACCCGTCACACCATCTGTCTTGTCGTCACCGACGGGTTTCTACTAGTACAAAATTCAGGACTGTAGACACTTAATAGTATAACCCTTTTC
3’-GTACAAAATTCAGGACTGTAGACA-5’ M27 bumper as2
Final Report 97-LB-VX-004 70
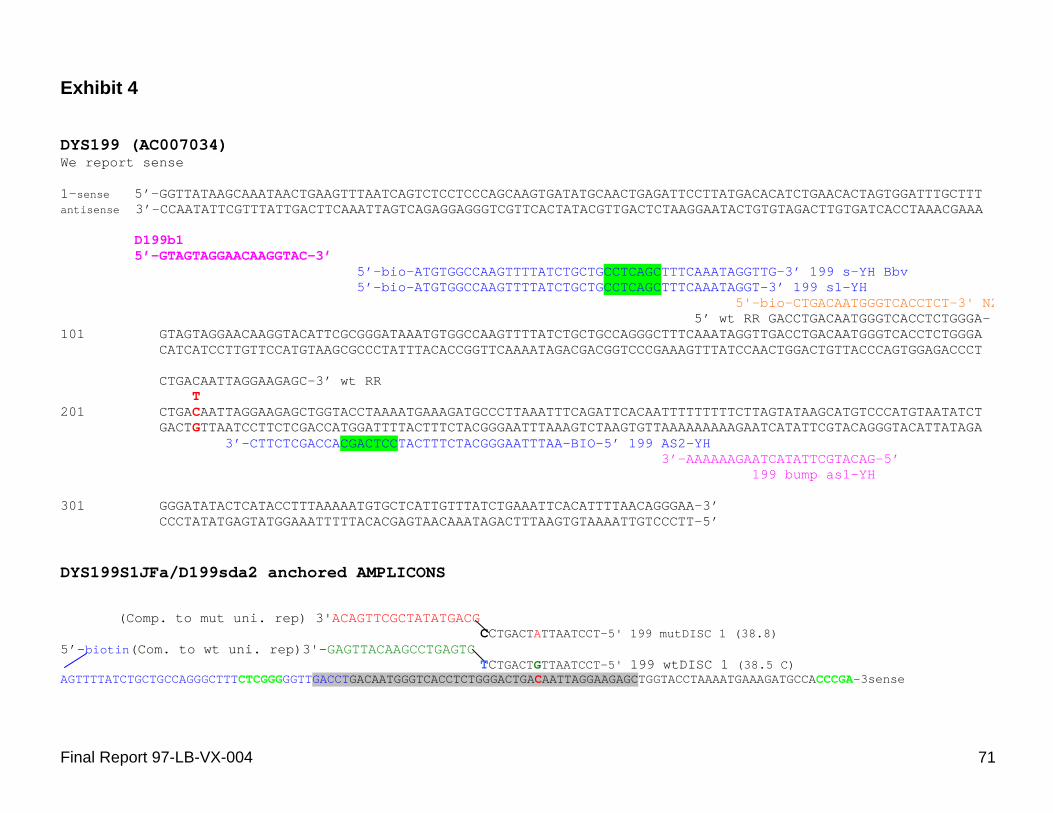
Exhibit 4
DYS199 (AC007034)We report sense
1-sense 5’-GGTTATAAGCAAATAACTGAAGTTTAATCAGTCTCCTCCCAGCAAGTGATATGCAACTGAGATTCCTTATGACACATCTGAACACTAGTGGATTTGCTTT antisense 3’-CCAATATTCGTTTATTGACTTCAAATTAGTCAGAGGAGGGTCGTTCACTATACGTTGACTCTAAGGAATACTGTGTAGACTTGTGATCACCTAAACGAAA
D199b1 5’-GTAGTAGGAACAAGGTAC-3’
5’-bio-ATGTGGCCAAGTTTTATCTGCTGCCTCAGCTTTCAAATAGGTTG-3’ 199 s-YH Bbv 5’-bio-ATGTGGCCAAGTTTTATCTGCTGCCTCAGCTTTCAAATAGGT-3’ 199 s1-YH
5'-bio-CTGACAATGGGTCACCTCT-3' N2 5’ wt RR GACCTGACAATGGGTCACCTCTGGGA-
101 GTAGTAGGAACAAGGTACATTCGCGGGATAAATGTGGCCAAGTTTTATCTGCTGCCAGGGCTTTCAAATAGGTTGACCTGACAATGGGTCACCTCTGGGA CATCATCCTTGTTCCATGTAAGCGCCCTATTTACACCGGTTCAAAATAGACGACGGTCCCGAAAGTTTATCCAACTGGACTGTTACCCAGTGGAGACCCT
CTGACAATTAGGAAGAGC-3’ wt RR T
201 CTGACAATTAGGAAGAGCTGGTACCTAAAATGAAAGATGCCCTTAAATTTCAGATTCACAATTTTTTTTTCTTAGTATAAGCATGTCCCATGTAATATCT GACTGTTAATCCTTCTCGACCATGGATTTTACTTTCTACGGGAATTTAAAGTCTAAGTGTTAAAAAAAAAGAATCATATTCGTACAGGGTACATTATAGA
3’-CTTCTCGACCACGACTCCTACTTTCTACGGGAATTTAA-BIO-5’ 199 AS2-YH 3’-AAAAAAGAATCATATTCGTACAG-5’
199 bump as1-YH
301 GGGATATACTCATACCTTTAAAAATGTGCTCATTGTTTATCTGAAATTCACATTTTAACAGGGAA-3’ CCCTATATGAGTATGGAAATTTTTACACGAGTAACAAATAGACTTTAAGTGTAAAATTGTCCCTT-5’
DYS199S1JFa/D199sda2 anchored AMPLICONS
(Comp. to mut uni. rep) 3'ACAGTTCGCTATATGACG CCTGACTATTAATCCT-5' 199 mutDISC 1 (38.8)
5’-biotin(Com. to wt uni. rep)3'-GAGTTACAAGCCTGAGTC TCTGACTGTTAATCCT-5' 199 wtDISC 1 (38.5 C)
AGTTTTATCTGCTGCCAGGGCTTTCTCGGGGGTTGACCTGACAATGGGTCACCTCTGGGACTGACAATTAGGAAGAGCTGGTACCTAAAATGAAAGATGCCACCCGA-3sense
Final Report 97-LB-VX-004 71

Exhibit 5
Dys 188
We report anti-sense
GAGAAGGCATGGTGTGCAAGGACCTGATTTGCTGTTGGAGGGTGACAATGGAGACAGCAGATAATGTCTGTTTTCAGGACAGCTGAAGCAGGTCAGCCCCATCCTGA CTCTTCCGTACCACACGTTCCTGGACTAAACGACAACCTCCCACTGTTACCTCTGTCGTCTATTACAGACAAAAGTCCTGTCGACTTCGTCCAGTCGGGGTAGGACT
188 s-YH Bbv 5'-BIO-TTCATCTCTATATATGAGGGCAGAGCCT DYS188S1 5'-TTCATCTCTATATATGAGGGCAGAGCCT
5’-AGGAATGCCAGCTGTAGGCCCA-3’ 188 bumper s1-YH AGGAATGCCAGCTGTAGGCCCAAAGATCCAAAGGTGTCTCCCAAGGCCACCTGTCACTAGACTGTGATCAGCATTTGCCTTCATCTCTATATATGAGGGCAGAGATT TCCTTACGGTCGACATCCGGGTTTCTAGGTTTCCACAGAGGGTTCCGGTGGACAGTGATCTGACACTAGTCGTAAACGGAAGTAGAGATATATACTCCCGTCTCTAA
CAGCATGATAATCCAGT-3' 188 s-YH Bbv CAGCATGATAATCCAG-3' T TAGAATGATAATCCAGTTGGCTGAAATTTCCATTTTCCATATGCAGATAGATGGAAATACATGCATATCTATTCACTTTCCACATGCAGATAGATGGAAATACATGC ATCTTACTATTAGGTCAACCGACTTTAAAGGTAAAAGGTATACGTCTATCTACCTTTATGTACGTATAGATAAGTGAAAGGTGTACGTCTATCTACCTTTATGTACG
Wt RR ACCGACTTTAAAGGTAAAAGGTATACGTCTATCTACCTT-5’ 3'-TAAAAGGTATACGTCTATCTACC-BIO-5' 188 N1
3'-AGGTATACGTCTATCTACC-BIO-5' 188 NP-YH 3’-TATGTACGTATAGCGACTCCAAAGGTGTACGTCTATCTACCTT-BIO-5’
188 as1-YH
ATATCTATTATTAGATAGAAGGGAGAATTTGTTAATGAGTACAGACAAGAGAAAGTGGNGTAAATTTGTCTGTGGGAAATATGTTCATGGAGCGAATATCCAACAAT TATAGATAATAATCTATCTTCCCTCTTAAACAATTACTCATGTCTGTTCTCTTTCACCNCATTTAAACAGACACCCTTTATACAAGTACCTCGCTTATAGGTTGTTA
3’-ATCTTCCCTCTTAAACAATTACTC-5’ 188 bumper as1-YH
We report antisense
antisense amplicon: 34.7 5'-AAATTTCTATTTTCCAGCAGTATATCGCTTGACA-3'188 MUT DISC11
38.4 C 5'-AATTTCCATTTTCCATTATTTCTGAGTCCGAACATTGAC-3' 188 WT DISC7 3'-AGCCCTACTATTAGGTCAACCGACTTTAAAGGTAAAAGGTATACGTCTATCTACCTTTATGTAGGGCTCGATAAGTGAAAGGTGTACGTCTATCTA-5'
Final Report 97-LB-VX-004 72
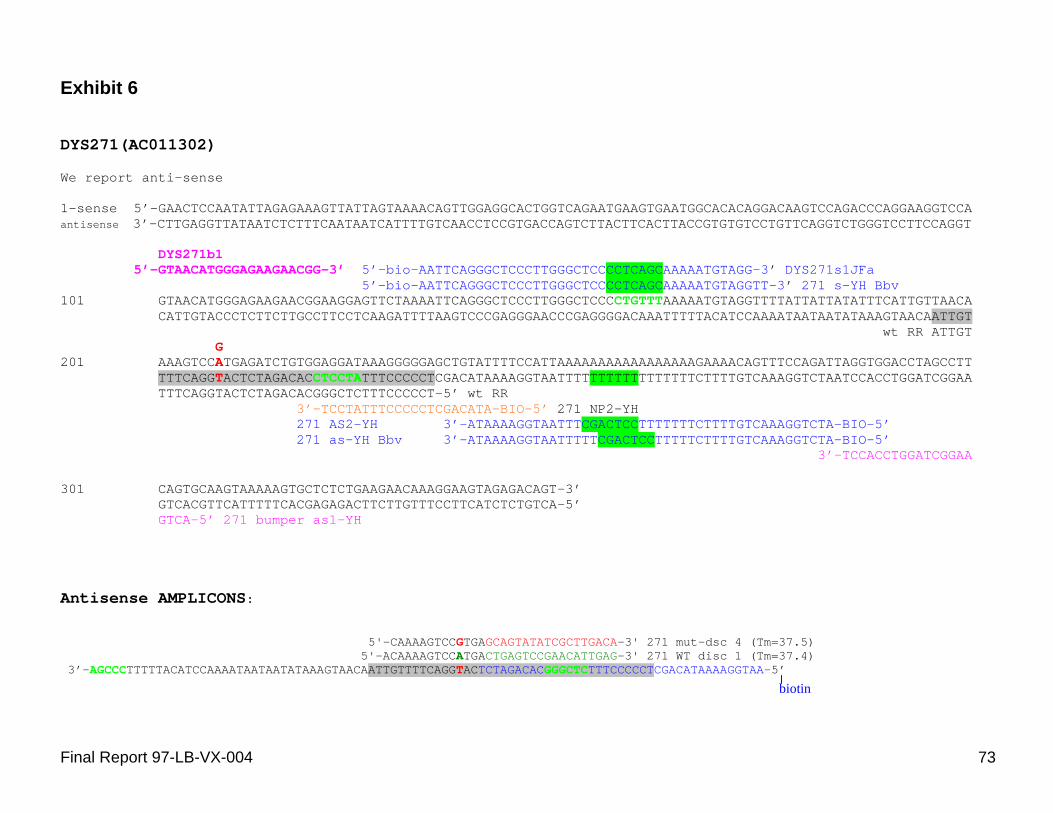
Exhibit 6
DYS271(AC011302)
We report anti-sense
1-sense 5’-GAACTCCAATATTAGAGAAAGTTATTAGTAAAACAGTTGGAGGCACTGGTCAGAATGAAGTGAATGGCACACAGGACAAGTCCAGACCCAGGAAGGTCCA antisense 3’-CTTGAGGTTATAATCTCTTTCAATAATCATTTTGTCAACCTCCGTGACCAGTCTTACTTCACTTACCGTGTGTCCTGTTCAGGTCTGGGTCCTTCCAGGT
DYS271b1 5’-GTAACATGGGAGAAGAACGG-3’ 5’-bio-AATTCAGGGCTCCCTTGGGCTCCCCTCAGCAAAAATGTAGG-3’ DYS271s1JFa
5’-bio-AATTCAGGGCTCCCTTGGGCTCCCCTCAGCAAAAATGTAGGTT-3’ 271 s-YH Bbv 101 GTAACATGGGAGAAGAACGGAAGGAGTTCTAAAATTCAGGGCTCCCTTGGGCTCCCCTGTTTAAAAATGTAGGTTTTATTATTATATTTCATTGTTAACA
CATTGTACCCTCTTCTTGCCTTCCTCAAGATTTTAAGTCCCGAGGGAACCCGAGGGGACAAATTTTTACATCCAAAATAATAATATAAAGTAACAATTGT wt RR ATTGT
G 201 AAAGTCCATGAGATCTGTGGAGGATAAAGGGGGAGCTGTATTTTCCATTAAAAAAAAAAAAAAAAAGAAAACAGTTTCCAGATTAGGTGGACCTAGCCTT
TTTCAGGTACTCTAGACACCTCCTATTTCCCCCTCGACATAAAAGGTAATTTTTTTTTTTTTTTTTCTTTTGTCAAAGGTCTAATCCACCTGGATCGGAA TTTCAGGTACTCTAGACACGGGCTCTTTCCCCCT-5’ wt RR
3’-TCCTATTTCCCCCTCGACATA-BIO-5’ 271 NP2-YH 271 AS2-YH 3’-ATAAAAGGTAATTTCGACTCCTTTTTTTCTTTTGTCAAAGGTCTA-BIO-5’
271 as-YH Bbv 3’-ATAAAAGGTAATTTTTCGACTCCTTTTTCTTTTGTCAAAGGTCTA-BIO-5’ 3’-TCCACCTGGATCGGAA
301 CAGTGCAAGTAAAAAGTGCTCTCTGAAGAACAAAGGAAGTAGAGACAGT-3’ GTCACGTTCATTTTTCACGAGAGACTTCTTGTTTCCTTCATCTCTGTCA-5’ GTCA-5’ 271 bumper as1-YH
Antisense AMPLICONS:
5'-CAAAAGTCCGTGAGCAGTATATCGCTTGACA-3' 271 mut-dsc 4 (Tm=37.5) 5'-ACAAAAGTCCATGACTGAGTCCGAACATTGAG-3' 271 WT disc 1 (Tm=37.4)
3’-AGCCCTTTTTACATCCAAAATAATAATATAAAGTAACAATTGTTTTCAGGTACTCTAGACACGGGCTCTTTCCCCCTCGACATAAAAGGTAA-5’
biotin
Final Report 97-LB-VX-004 73

Exhibit 7
Final Report 97-LB-VX-004 74
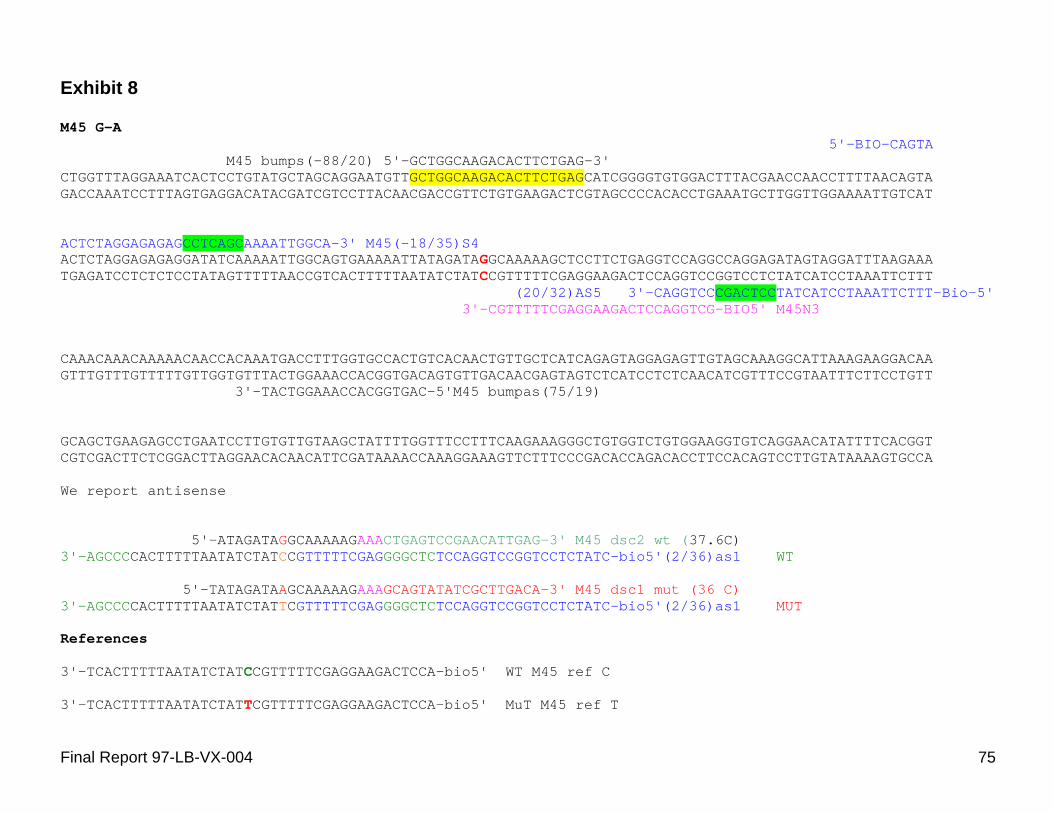
Exhibit 8
M45 G-A 5'-BIO-CAGTA
M45 bumps(-88/20) 5'-GCTGGCAAGACACTTCTGAG-3' CTGGTTTAGGAAATCACTCCTGTATGCTAGCAGGAATGTTGCTGGCAAGACACTTCTGAGCATCGGGGTGTGGACTTTACGAACCAACCTTTTAACAGTA GACCAAATCCTTTAGTGAGGACATACGATCGTCCTTACAACGACCGTTCTGTGAAGACTCGTAGCCCCACACCTGAAATGCTTGGTTGGAAAATTGTCAT
ACTCTAGGAGAGAGCCTCAGCAAAATTGGCA-3' M45(-18/35)S4 ACTCTAGGAGAGAGGATATCAAAAATTGGCAGTGAAAAATTATAGATAGGCAAAAAGCTCCTTCTGAGGTCCAGGCCAGGAGATAGTAGGATTTAAGAAA TGAGATCCTCTCTCCTATAGTTTTTAACCGTCACTTTTTAATATCTATCCGTTTTTCGAGGAAGACTCCAGGTCCGGTCCTCTATCATCCTAAATTCTTT
(20/32)AS5 3'-CAGGTCCCGACTCCTATCATCCTAAATTCTTT-Bio-5' 3'-CGTTTTTCGAGGAAGACTCCAGGTCG-BIO5' M45N3
CAAACAAACAAAAACAACCACAAATGACCTTTGGTGCCACTGTCACAACTGTTGCTCATCAGAGTAGGAGAGTTGTAGCAAAGGCATTAAAGAAGGACAA GTTTGTTTGTTTTTGTTGGTGTTTACTGGAAACCACGGTGACAGTGTTGACAACGAGTAGTCTCATCCTCTCAACATCGTTTCCGTAATTTCTTCCTGTT
3'-TACTGGAAACCACGGTGAC-5'M45 bumpas(75/19)
GCAGCTGAAGAGCCTGAATCCTTGTGTTGTAAGCTATTTTGGTTTCCTTTCAAGAAAGGGCTGTGGTCTGTGGAAGGTGTCAGGAACATATTTTCACGGT CGTCGACTTCTCGGACTTAGGAACACAACATTCGATAAAACCAAAGGAAAGTTCTTTCCCGACACCAGACACCTTCCACAGTCCTTGTATAAAAGTGCCA
We report antisense
5'-ATAGATAGGCAAAAAGAAACTGAGTCCGAACATTGAG-3' M45 dsc2 wt (37.6C) 3'-AGCCCCACTTTTTAATATCTATCCGTTTTTCGAGGGGCTCTCCAGGTCCGGTCCTCTATC-bio5'(2/36)as1 WT
5'-TATAGATAAGCAAAAAGAAAGCAGTATATCGCTTGACA-3' M45 dsc1 mut (36 C) 3'-AGCCCCACTTTTTAATATCTATTCGTTTTTCGAGGGGCTCTCCAGGTCCGGTCCTCTATC-bio5'(2/36)as1 MUT
References
3'-TCACTTTTTAATATCTATCCGTTTTTCGAGGAAGACTCCA-bio5' WT M45 ref C
3'-TCACTTTTTAATATCTATTCGTTTTTCGAGGAAGACTCCA-bio5' MuT M45 ref T
Final Report 97-LB-VX-004 75
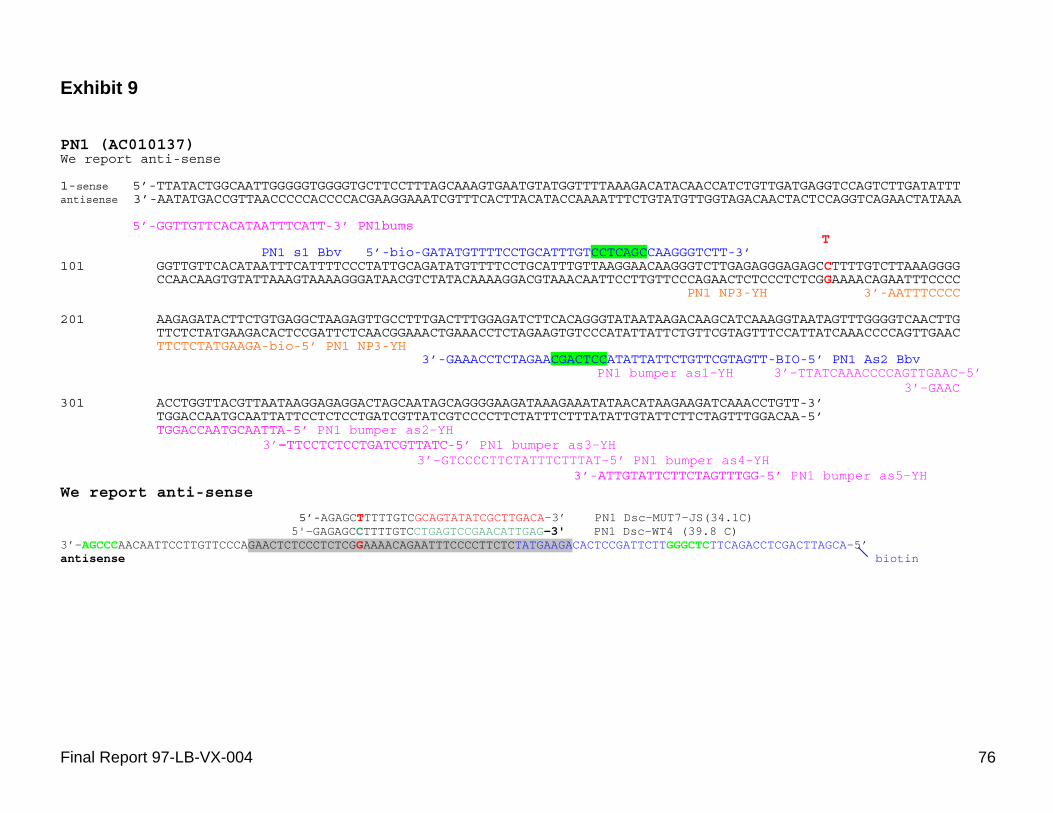
Exhibit 9
PN1 (AC010137) We report anti-sense
1-sense 5’-TTATACTGGCAATTGGGGGTGGGGTGCTTCCTTTAGCAAAGTGAATGTATGGTTTTAAAGACATACAACCATCTGTTGATGAGGTCCAGTCTTGATATTTantisense 3’-AATATGACCGTTAACCCCCACCCCACGAAGGAAATCGTTTCACTTACATACCAAAATTTCTGTATGTTGGTAGACAACTACTCCAGGTCAGAACTATAAA
5’-GGTTGTTCACATAATTTCATT-3’ PN1bumsT
PN1 s1 Bbv 5’-bio-GATATGTTTTCCTGCATTTGTCCTCAGCCAAGGGTCTT-3’ 101 GGTTGTTCACATAATTTCATTTTCCCTATTGCAGATATGTTTTCCTGCATTTGTTAAGGAACAAGGGTCTTGAGAGGGAGAGCCTTTTGTCTTAAAGGGG
CCAACAAGTGTATTAAAGTAAAAGGGATAACGTCTATACAAAAGGACGTAAACAATTCCTTGTTCCCAGAACTCTCCCTCTCGGAAAACAGAATTTCCCCPN1 NP3-YH 3’-AATTTCCCC
201 AAGAGATACTTCTGTGAGGCTAAGAGTTGCCTTTGACTTTGGAGATCTTCACAGGGTATAATAAGACAAGCATCAAAGGTAATAGTTTGGGGTCAACTTGTTCTCTATGAAGACACTCCGATTCTCAACGGAAACTGAAACCTCTAGAAGTGTCCCATATTATTCTGTTCGTAGTTTCCATTATCAAACCCCAGTTGAACTTCTCTATGAAGA-bio-5’ PN1 NP3-YH
3’-GAAACCTCTAGAACGACTCCATATTATTCTGTTCGTAGTT-BIO-5’ PN1 As2 Bbv PN1 bumper as1-YH 3’-TTATCAAACCCCAGTTGAAC-5’
3’-GAAC 301 ACCTGGTTACGTTAATAAGGAGAGGACTAGCAATAGCAGGGGAAGATAAAGAAATATAACATAAGAAGATCAAACCTGTT-3’
TGGACCAATGCAATTATTCCTCTCCTGATCGTTATCGTCCCCTTCTATTTCTTTATATTGTATTCTTCTAGTTTGGACAA-5’TGGACCAATGCAATTA-5’ PN1 bumper as2-YH
3’-TTCCTCTCCTGATCGTTATC-5’ PN1 bumper as3-YH 3’-GTCCCCTTCTATTTCTTTAT-5’ PN1 bumper as4-YH
3’-ATTGTATTCTTCTAGTTTGG-5’ PN1 bumper as5-YH We report anti-sense
5’-AGAGCTTTTTGTCGCAGTATATCGCTTGACA-3’ PN1 Dsc-MUT7-JS(34.1C)
G3’-AGCCCAACAATTCCTTGTTCCCAGAACTCTCCCTCTCG AAAACAGAATTTCCCCTTCTCTATGAAGACACTCCGATTCTTGGGCTCTTCAGACCTCGACTTAGCA-5’ 5'-GAGAGCCTTTTGTCCTGAGTCCGAACATTGAG-3' PN1 Dsc-WT4 (39.8 C)
antisense biotin
Final Report 97-LB-VX-004 76
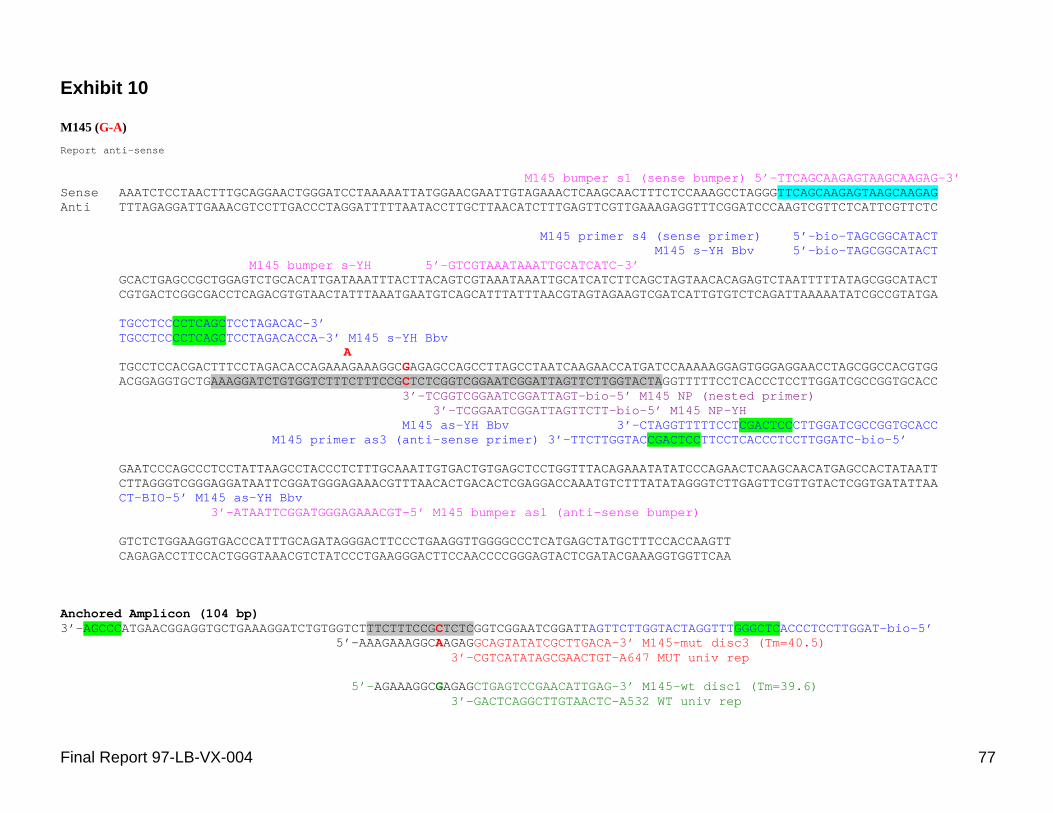
Exhibit 10
M145 (G-A)
Report anti-sense
M145 bumper s1 (sense bumper) 5’-TTCAGCAAGAGTAAGCAAGAG-3’ Sense AAATCTCCTAACTTTGCAGGAACTGGGATCCTAAAAATTATGGAACGAATTGTAGAAACTCAAGCAACTTTCTCCAAAGCCTAGGGTTCAGCAAGAGTAAGCAAGAG Anti TTTAGAGGATTGAAACGTCCTTGACCCTAGGATTTTTAATACCTTGCTTAACATCTTTGAGTTCGTTGAAAGAGGTTTCGGATCCCAAGTCGTTCTCATTCGTTCTC
M145 primer s4 (sense primer) 5’-bio-TAGCGGCATACT M145 s-YH Bbv 5’-bio-TAGCGGCATACT
M145 bumper s-YH 5’-GTCGTAAATAAATTGCATCATC-3’ GCACTGAGCCGCTGGAGTCTGCACATTGATAAATTTACTTACAGTCGTAAATAAATTGCATCATCTTCAGCTAGTAACACAGAGTCTAATTTTTATAGCGGCATACT CGTGACTCGGCGACCTCAGACGTGTAACTATTTAAATGAATGTCAGCATTTATTTAACGTAGTAGAAGTCGATCATTGTGTCTCAGATTAAAAATATCGCCGTATGA
TGCCTCCCCTCAGCTCCTAGACAC-3’ TGCCTCCCCTCAGCTCCTAGACACCA-3’ M145 s-YH Bbv
A TGCCTCCACGACTTTCCTAGACACCAGAAAGAAAGGCGAGAGCCAGCCTTAGCCTAATCAAGAACCATGATCCAAAAAGGAGTGGGAGGAACCTAGCGGCCACGTGG ACGGAGGTGCTGAAAGGATCTGTGGTCTTTCTTTCCGCTCTCGGTCGGAATCGGATTAGTTCTTGGTACTAGGTTTTTCCTCACCCTCCTTGGATCGCCGGTGCACC
3’-TCGGTCGGAATCGGATTAGT-bio-5’ M145 NP (nested primer) 3’-TCGGAATCGGATTAGTTCTT-bio-5’ M145 NP-YH
M145 as-YH Bbv 3’-CTAGGTTTTTCCTCGACTCCCTTGGATCGCCGGTGCACC M145 primer as3 (anti-sense primer) 3’-TTCTTGGTACCGACTCCTTCCTCACCCTCCTTGGATC-bio-5’
GAATCCCAGCCCTCCTATTAAGCCTACCCTCTTTGCAAATTGTGACTGTGAGCTCCTGGTTTACAGAAATATATCCCAGAACTCAAGCAACATGAGCCACTATAATT CTTAGGGTCGGGAGGATAATTCGGATGGGAGAAACGTTTAACACTGACACTCGAGGACCAAATGTCTTTATATAGGGTCTTGAGTTCGTTGTACTCGGTGATATTAA
CT-BIO-5’ M145 as-YH Bbv 3’-ATAATTCGGATGGGAGAAACGT-5’ M145 bumper as1 (anti-sense bumper)
GTCTCTGGAAGGTGACCCATTTGCAGATAGGGACTTCCCTGAAGGTTGGGGCCCTCATGAGCTATGCTTTCCACCAAGTT CAGAGACCTTCCACTGGGTAAACGTCTATCCCTGAAGGGACTTCCAACCCCGGGAGTACTCGATACGAAAGGTGGTTCAA
Anchored Amplicon (104 bp) 3’-AGCCCATGAACGGAGGTGCTGAAAGGATCTGTGGTCTTTCTTTCCGCTCTCGGTCGGAATCGGATTAGTTCTTGGTACTAGGTTTGGGCTCACCCTCCTTGGAT-bio-5’
5’-AAAGAAAGGCAAGAGGCAGTATATCGCTTGACA-3’ M145-mut disc3 (Tm=40.5) 3’-CGTCATATAGCGAACTGT-A647 MUT univ rep
5’-AGAAAGGCGAGAGCTGAGTCCGAACATTGAG-3’ M145-wt disc1 (Tm=39.6) 3’-GACTCAGGCTTGTAACTC-A532 WT univ rep
Final Report 97-LB-VX-004 77
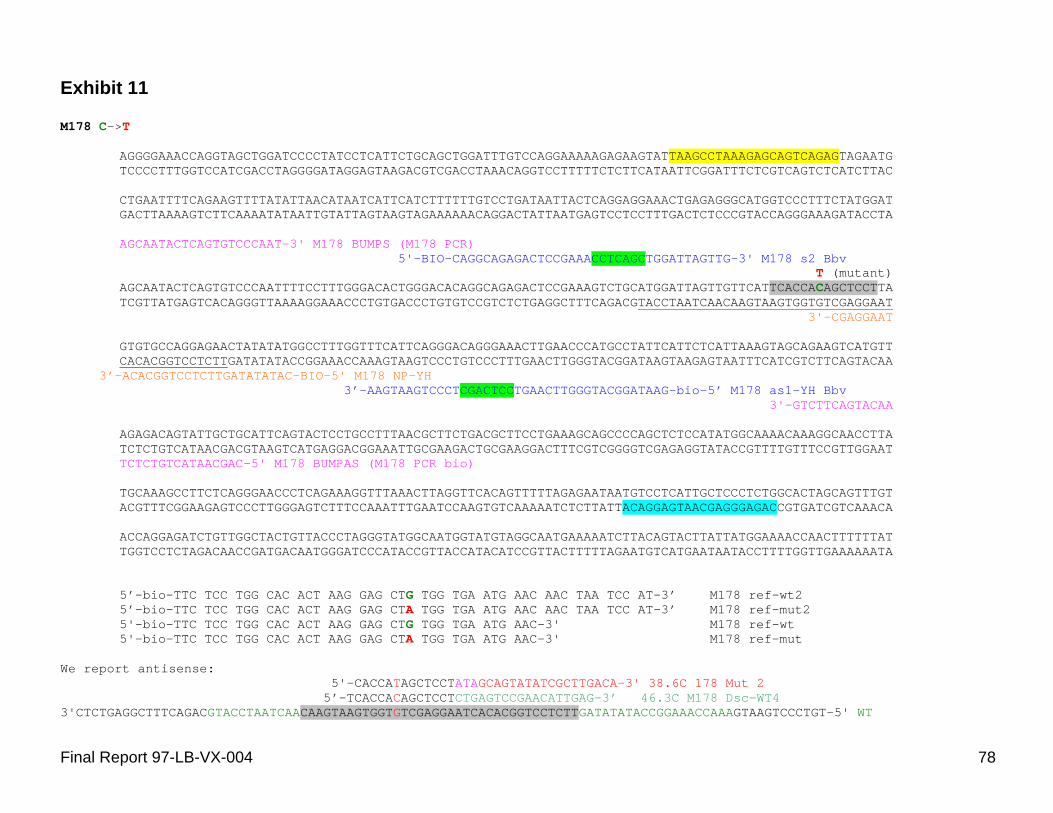
Exhibit 11
M178 C->T
AGGGGAAACCAGGTAGCTGGATCCCCTATCCTCATTCTGCAGCTGGATTTGTCCAGGAAAAAGAGAAGTATTAAGCCTAAAGAGCAGTCAGAGTAGAATG TCCCCTTTGGTCCATCGACCTAGGGGATAGGAGTAAGACGTCGACCTAAACAGGTCCTTTTTCTCTTCATAATTCGGATTTCTCGTCAGTCTCATCTTAC
CTGAATTTTCAGAAGTTTTATATTAACATAATCATTCATCTTTTTTGTCCTGATAATTACTCAGGAGGAAACTGAGAGGGCATGGTCCCTTTCTATGGAT GACTTAAAAGTCTTCAAAATATAATTGTATTAGTAAGTAGAAAAAACAGGACTATTAATGAGTCCTCCTTTGACTCTCCCGTACCAGGGAAAGATACCTA
AGCAATACTCAGTGTCCCAAT-3' M178 BUMPS (M178 PCR) 5'-BIO-CAGGCAGAGACTCCGAAACCTCAGCTGGATTAGTTG-3' M178 s2 Bbv
T (mutant) AGCAATACTCAGTGTCCCAATTTTCCTTTGGGACACTGGGACACAGGCAGAGACTCCGAAAGTCTGCATGGATTAGTTGTTCATTCACCACAGCTCCTTA TCGTTATGAGTCACAGGGTTAAAAGGAAACCCTGTGACCCTGTGTCCGTCTCTGAGGCTTTCAGACGTACCTAATCAACAAGTAAGTGGTGTCGAGGAAT
3'-CGAGGAAT
GTGTGCCAGGAGAACTATATATGGCCTTTGGTTTCATTCAGGGACAGGGAAACTTGAACCCATGCCTATTCATTCTCATTAAAGTAGCAGAAGTCATGTT CACACGGTCCTCTTGATATATACCGGAAACCAAAGTAAGTCCCTGTCCCTTTGAACTTGGGTACGGATAAGTAAGAGTAATTTCATCGTCTTCAGTACAA
3’-ACACGGTCCTCTTGATATATAC-BIO-5' M178 NP-YH 3’-AAGTAAGTCCCTCGACTCCTGAACTTGGGTACGGATAAG-bio-5’ M178 as1-YH Bbv
3'-GTCTTCAGTACAA
AGAGACAGTATTGCTGCATTCAGTACTCCTGCCTTTAACGCTTCTGACGCTTCCTGAAAGCAGCCCCAGCTCTCCATATGGCAAAACAAAGGCAACCTTA TCTCTGTCATAACGACGTAAGTCATGAGGACGGAAATTGCGAAGACTGCGAAGGACTTTCGTCGGGGTCGAGAGGTATACCGTTTTGTTTCCGTTGGAAT
TCTCTGTCATAACGAC-5' M178 BUMPAS (M178 PCR bio)
TGCAAAGCCTTCTCAGGGAACCCTCAGAAAGGTTTAAACTTAGGTTCACAGTTTTTAGAGAATAATGTCCTCATTGCTCCCTCTGGCACTAGCAGTTTGT ACGTTTCGGAAGAGTCCCTTGGGAGTCTTTCCAAATTTGAATCCAAGTGTCAAAAATCTCTTATTACAGGAGTAACGAGGGAGACCGTGATCGTCAAACA
ACCAGGAGATCTGTTGGCTACTGTTACCCTAGGGTATGGCAATGGTATGTAGGCAATGAAAAATCTTACAGTACTTATTATGGAAAACCAACTTTTTTAT TGGTCCTCTAGACAACCGATGACAATGGGATCCCATACCGTTACCATACATCCGTTACTTTTTAGAATGTCATGAATAATACCTTTTGGTTGAAAAAATA
5’-bio-TTC TCC TGG CAC ACT AAG GAG CTG TGG TGA ATG AAC AAC TAA TCC AT-3’ M178 ref-wt2 5’-bio-TTC TCC TGG CAC ACT AAG GAG CTA TGG TGA ATG AAC AAC TAA TCC AT-3’ M178 ref-mut2 5'-bio-TTC TCC TGG CAC ACT AAG GAG CTG TGG TGA ATG AAC-3' M178 ref-wt 5'-bio-TTC TCC TGG CAC ACT AAG GAG CTA TGG TGA ATG AAC-3' M178 ref-mut
We report antisense: 5'-CACCATAGCTCCTATAGCAGTATATCGCTTGACA-3' 38.6C 178 Mut 2
5’-TCACCACAGCTCCTCTGAGTCCGAACATTGAG-3’ 46.3C M178 Dsc-WT4 3'CTCTGAGGCTTTCAGACGTACCTAATCAACAAGTAAGTGGTGTCGAGGAATCACACGGTCCTCTTGATATATACCGGAAACCAAAGTAAGTCCCTGT-5' WT
Final Report 97-LB-VX-004 78
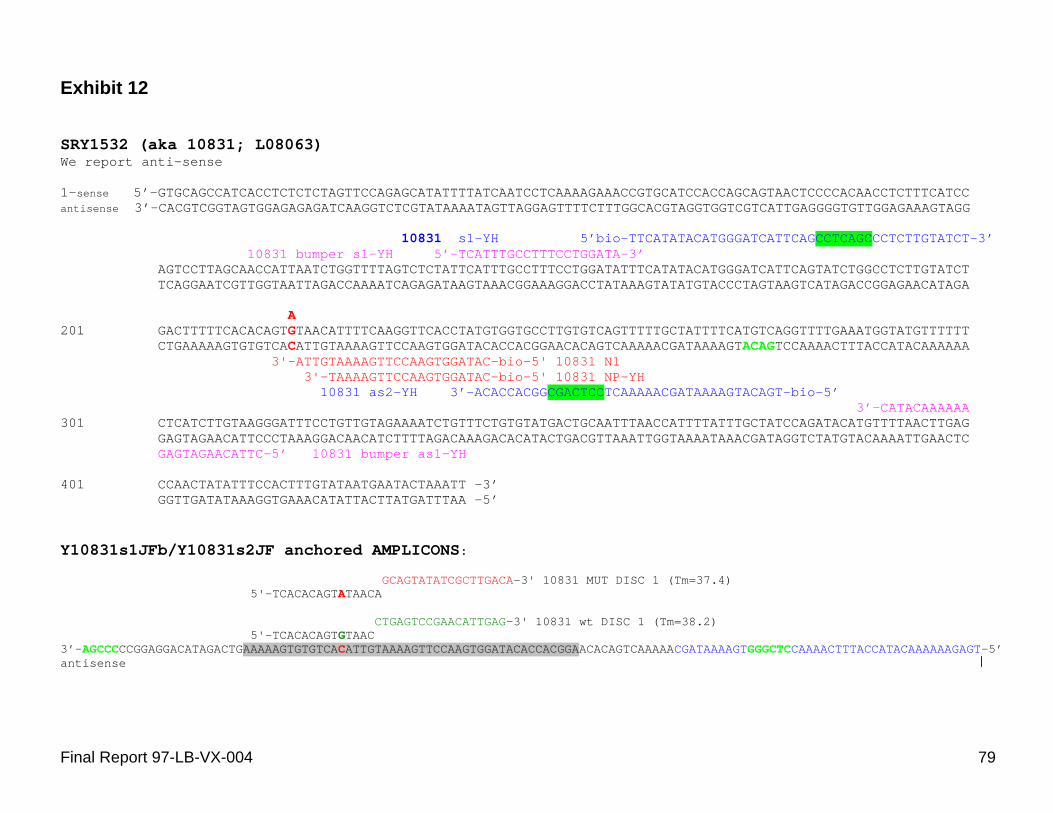
Exhibit 12
SRY1532 (aka 10831; L08063)We report anti-sense
1-sense 5’-GTGCAGCCATCACCTCTCTCTAGTTCCAGAGCATATTTTATCAATCCTCAAAAGAAACCGTGCATCCACCAGCAGTAACTCCCCACAACCTCTTTCATCC antisense 3’-CACGTCGGTAGTGGAGAGAGATCAAGGTCTCGTATAAAATAGTTAGGAGTTTTCTTTGGCACGTAGGTGGTCGTCATTGAGGGGTGTTGGAGAAAGTAGG
10831 s1-YH 5’bio-TTCATATACATGGGATCATTCAGCCTCAGCCCTCTTGTATCT-3’ 10831 bumper s1-YH 5’-TCATTTGCCTTTCCTGGATA-3’
AGTCCTTAGCAACCATTAATCTGGTTTTAGTCTCTATTCATTTGCCTTTCCTGGATATTTCATATACATGGGATCATTCAGTATCTGGCCTCTTGTATCT TCAGGAATCGTTGGTAATTAGACCAAAATCAGAGATAAGTAAACGGAAAGGACCTATAAAGTATATGTACCCTAGTAAGTCATAGACCGGAGAACATAGA
A 201 GACTTTTTCACACAGTGTAACATTTTCAAGGTTCACCTATGTGGTGCCTTGTGTCAGTTTTTGCTATTTTCATGTCAGGTTTTGAAATGGTATGTTTTTT
CTGAAAAAGTGTGTCACATTGTAAAAGTTCCAAGTGGATACACCACGGAACACAGTCAAAAACGATAAAAGTACAGTCCAAAACTTTACCATACAAAAAA 3'-ATTGTAAAAGTTCCAAGTGGATAC-bio-5' 10831 N1
3'-TAAAAGTTCCAAGTGGATAC-bio-5' 10831 NP-YH 10831 as2-YH 3’-ACACCACGGCGACTCCTCAAAAACGATAAAAGTACAGT-bio-5’
3’-CATACAAAAAA 301 CTCATCTTGTAAGGGATTTCCTGTTGTAGAAAATCTGTTTCTGTGTATGACTGCAATTTAACCATTTTATTTGCTATCCAGATACATGTTTTAACTTGAG
GAGTAGAACATTCCCTAAAGGACAACATCTTTTAGACAAAGACACATACTGACGTTAAATTGGTAAAATAAACGATAGGTCTATGTACAAAATTGAACTC GAGTAGAACATTC-5’ 10831 bumper as1-YH
401 CCAACTATATTTCCACTTTGTATAATGAATACTAAATT -3’ GGTTGATATAAAGGTGAAACATATTACTTATGATTTAA -5’
Y10831s1JFb/Y10831s2JF anchored AMPLICONS:
GCAGTATATCGCTTGACA-3' 10831 MUT DISC 1 (Tm=37.4) 5'-TCACACAGTATAACA
CTGAGTCCGAACATTGAG-3' 10831 wt DISC 1 (Tm=38.2) 5'-TCACACAGTGTAAC
3’-AGCCCCCGGAGGACATAGACTGAAAAAGTGTGTCACATTGTAAAAGTTCCAAGTGGATACACCACGGAACACAGTCAAAAACGATAAAAGTGGGCTCCAAAACTTTACCATACAAAAAAGAGT-5’ antisense
Final Report 97-LB-VX-004 79

Exhibit 13
PN2 (AC010137) CÆ T We report anti-sense
1-sense 5’-GTACATCCATGAACCCTGAGGGCTGCATCATCCATAGCTTGAGGTCCCCGGTGAGTCCCTTGATGCAAATGAGAAAGAACTTCTCTCATGAGGGTTTTGG antisense 3’-CATGTAGGTACTTGGGACTCCCGACGTAGTAGGTATCGAACTCCAGGGGCCACTCAGGGAACTACGTTTACTCTTTCTTGAAGAGAGTACTCCCAAAACC
PN2bumps 5’-ATAACATTTCTCTTTGGTCTG-3’ PN2 sbub Bbv 5’-bio-TTAGGTTTTGGATCTTCATGCTGCCTCAGCGAGCATTA
PN2 s1-YH Bbv 5’-bio-TTCTCTTAGGTTTTGGATCTTCACCTCAGCTAAAGGAGCATT-3’ PN2 s2-YH Bbv 5’-bio-TTGGATCTTCATGCTGGTTCCTCAGCCATTA
101 ATAACATTTCTCTTTGGTCTGGTAACACCCATAAAGGTTGTCTAATAGTGGCTTGAGTTCTCTTAGGTTTTGGATCTTCATGCTGGTTAAAGGAGCATTA TATTGTAAAGAGAAACCAGACCATTGTGGGTATTTCCAACAGATTATCACCGAACTCAAGAGAATCCAAAACCTAGAAGTACGACCAATTTCCTCGTAAT
ATAAA-3’PN2bubs2TATAAAACTAA-3’ PN2 s2-YH Bbv
201 ATAAAACTAATGCCTTCTCCTCCTAGGGGCACCTCTCTTAAGGAAAAGATGGCTGGAGCTGATTCTCCTGAGGTAGAGGGGAATCGGGAGTTCTGAATAC TATTTTGATTACGGAAGAGGAGGATCCCCGTGGAGAGAATTCCTTTTCTACCGACCTCGACTAAGAGGACTCCATCTCCCCTTAGCCCTCAAGACTTATG
3’-ATTCCTTTTCTACGACTCCCGACTAAGAGGACTCCATCT-bio-5’ PN2 as1-YH Bbv PN2 as2-YH Bbv 3’-ATCTCCCCTTACGACTCCAGACTTATG
PN2 as3-YH Bbv 3’-CTCGACTAAGACGACTCCATCTCCCCTTAGCCCTCAAG-bio-5’ 3’-AGGATCCCCGTGGAGAGAAT-bio-5’ PN2 N1
301 CGTTTTTTACATTGCTCTATCTCACGTTGAAGTCCTTTCAGAGAAGCGTACTTAGGCTGGTAGTGAAGAGGCTCTTGGGATGATTACCAAGAGGCAGGGG GCAAAAAATGTAACGAGATAGAGTGCAACTTCAGGAAAGTCTCTTCGCATGAATCCGACCATCACTTCTCCGAGAACCCTACTAATGGTTCTCCGTCCCC GCAAAAAATGTA-BIO-5’ PN2 as2-YH Bbv
3’-AGATCGAGTGCAACTTCAGGA-5’ PN2BUMPAS
401 tacaaggaggtgggacaatgtgagtaggagaagcat-3’ atgttcctccaccctgttacactcatcctcttcgta-5’
Final Report 97-LB-VX-004 80
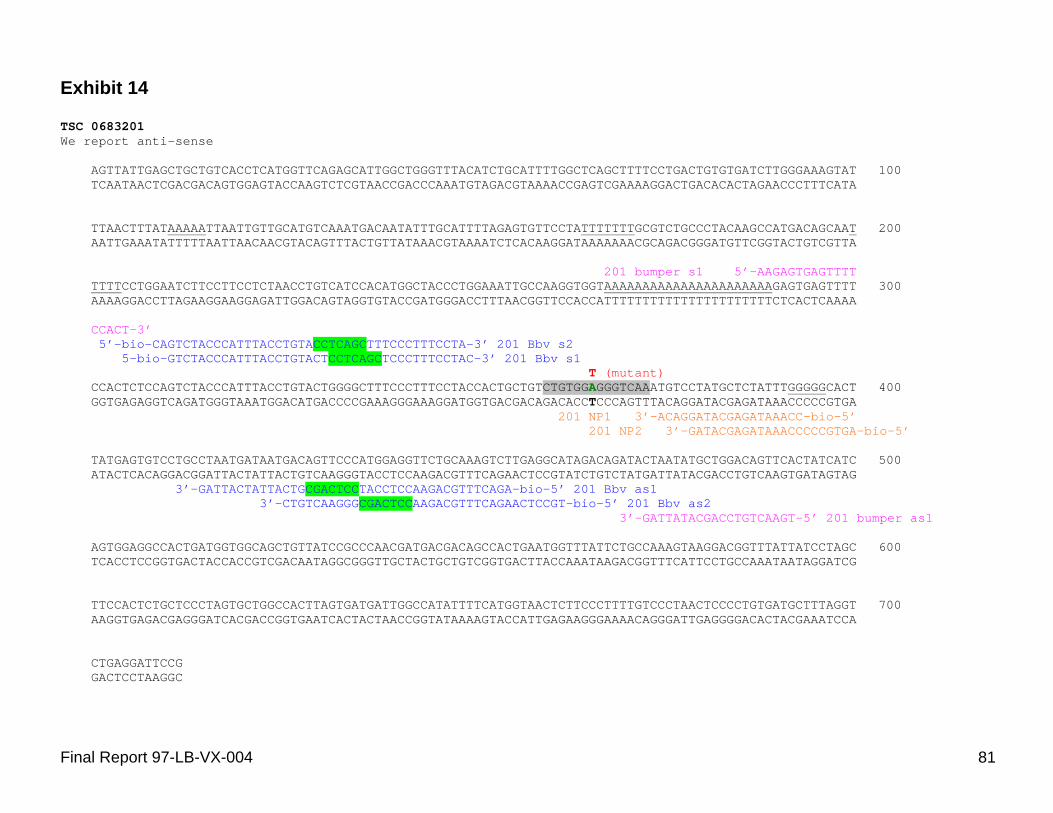
Exhibit 14
TSC 0683201 We report anti-sense
AGTTATTGAGCTGCTGTCACCTCATGGTTCAGAGCATTGGCTGGGTTTACATCTGCATTTTGGCTCAGCTTTTCCTGACTGTGTGATCTTGGGAAAGTAT 100 TCAATAACTCGACGACAGTGGAGTACCAAGTCTCGTAACCGACCCAAATGTAGACGTAAAACCGAGTCGAAAAGGACTGACACACTAGAACCCTTTCATA
TTAACTTTATAAAAATTAATTGTTGCATGTCAAATGACAATATTTGCATTTTAGAGTGTTCCTATTTTTTTGCGTCTGCCCTACAAGCCATGACAGCAAT 200 AATTGAAATATTTTTAATTAACAACGTACAGTTTACTGTTATAAACGTAAAATCTCACAAGGATAAAAAAACGCAGACGGGATGTTCGGTACTGTCGTTA
201 bumper s1 5’-AAGAGTGAGTTTT TTTTCCTGGAATCTTCCTTCCTCTAACCTGTCATCCACATGGCTACCCTGGAAATTGCCAAGGTGGTAAAAAAAAAAAAAAAAAAAAAAGAGTGAGTTTT 300
AAAAGGACCTTAGAAGGAAGGAGATTGGACAGTAGGTGTACCGATGGGACCTTTAACGGTTCCACCATTTTTTTTTTTTTTTTTTTTTTCTCACTCAAAA
CCACT-3’ 5’-bio-CAGTCTACCCATTTACCTGTACCTCAGCTTTCCCTTTCCTA-3’ 201 Bbv s2
5-bio-GTCTACCCATTTACCTGTACTCCTCAGCTCCCTTTCCTAC-3’ 201 Bbv s1 T (mutant)
CCACTCTCCAGTCTACCCATTTACCTGTACTGGGGCTTTCCCTTTCCTACCACTGCTGTCTGTGGAGGGTCAAATGTCCTATGCTCTATTTGGGGGCACT 400 GGTGAGAGGTCAGATGGGTAAATGGACATGACCCCGAAAGGGAAAGGATGGTGACGACAGACACCTCCCAGTTTACAGGATACGAGATAAACCCCCGTGA
201 NP1 3’-ACAGGATACGAGATAAACC-bio-5’ 201 NP2 3’-GATACGAGATAAACCCCCGTGA-bio-5’
TATGAGTGTCCTGCCTAATGATAATGACAGTTCCCATGGAGGTTCTGCAAAGTCTTGAGGCATAGACAGATACTAATATGCTGGACAGTTCACTATCATC 500 ATACTCACAGGACGGATTACTATTACTGTCAAGGGTACCTCCAAGACGTTTCAGAACTCCGTATCTGTCTATGATTATACGACCTGTCAAGTGATAGTAG
3’-GATTACTATTACTGCGACTCCTACCTCCAAGACGTTTCAGA-bio-5’ 201 Bbv as1 3’-CTGTCAAGGGCGACTCCAAGACGTTTCAGAACTCCGT-bio-5’ 201 Bbv as2
3’-GATTATACGACCTGTCAAGT-5’ 201 bumper as1
AGTGGAGGCCACTGATGGTGGCAGCTGTTATCCGCCCAACGATGACGACAGCCACTGAATGGTTTATTCTGCCAAAGTAAGGACGGTTTATTATCCTAGC 600 TCACCTCCGGTGACTACCACCGTCGACAATAGGCGGGTTGCTACTGCTGTCGGTGACTTACCAAATAAGACGGTTTCATTCCTGCCAAATAATAGGATCG
TTCCACTCTGCTCCCTAGTGCTGGCCACTTAGTGATGATTGGCCATATTTTCATGGTAACTCTTCCCTTTTGTCCCTAACTCCCCTGTGATGCTTTAGGT 700 AAGGTGAGACGAGGGATCACGACCGGTGAATCACTACTAACCGGTATAAAAGTACCATTGAGAAGGGAAAACAGGGATTGAGGGGACACTACGAAATCCA
CTGAGGATTCCG GACTCCTAAGGC
Final Report 97-LB-VX-004 81
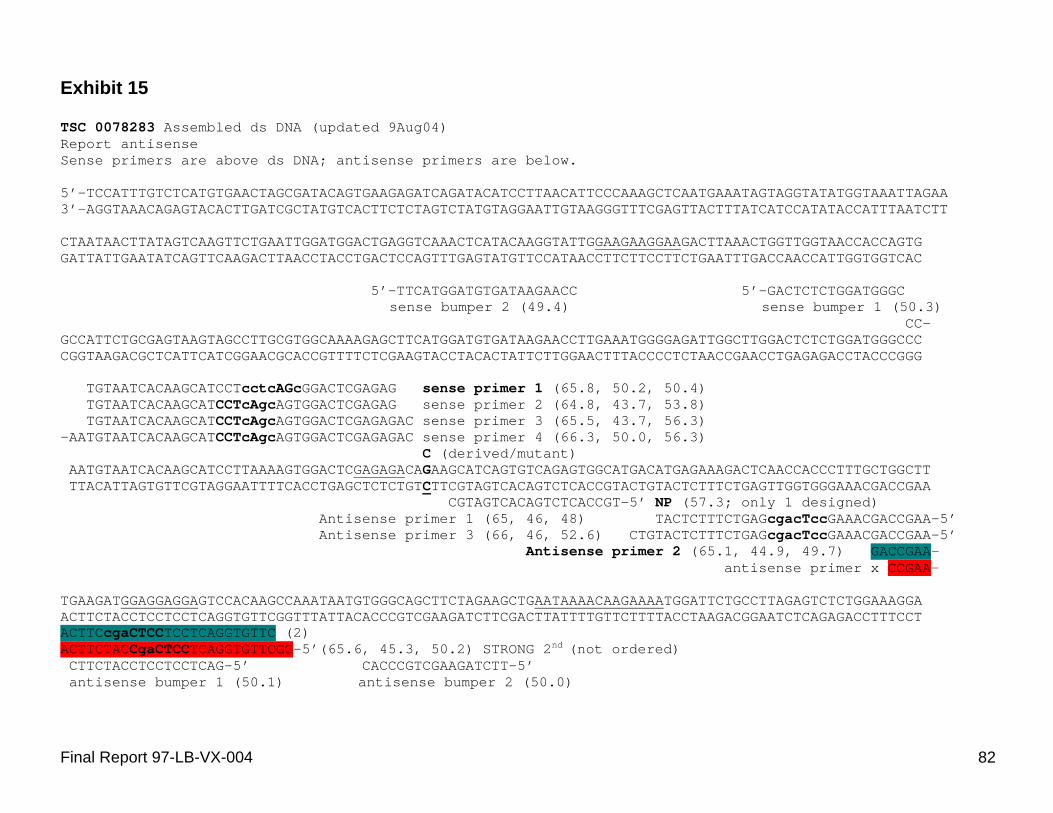
Exhibit 15
TSC 0078283 Assembled ds DNA (updated 9Aug04) Report antisenseSense primers are above ds DNA; antisense primers are below.
5’-TCCATTTGTCTCATGTGAACTAGCGATACAGTGAAGAGATCAGATACATCCTTAACATTCCCAAAGCTCAATGAAATAGTAGGTATATGGTAAATTAGAA 3’-AGGTAAACAGAGTACACTTGATCGCTATGTCACTTCTCTAGTCTATGTAGGAATTGTAAGGGTTTCGAGTTACTTTATCATCCATATACCATTTAATCTT
CTAATAACTTATAGTCAAGTTCTGAATTGGATGGACTGAGGTCAAACTCATACAAGGTATTGGAAGAAGGAAGACTTAAACTGGTTGGTAACCACCAGTG GATTATTGAATATCAGTTCAAGACTTAACCTACCTGACTCCAGTTTGAGTATGTTCCATAACCTTCTTCCTTCTGAATTTGACCAACCATTGGTGGTCAC
5’-TTCATGGATGTGATAAGAACC 5’-GACTCTCTGGATGGGC sense bumper 2 (49.4) sense bumper 1 (50.3)
CC-GCCATTCTGCGAGTAAGTAGCCTTGCGTGGCAAAAGAGCTTCATGGATGTGATAAGAACCTTGAAATGGGGAGATTGGCTTGGACTCTCTGGATGGGCCC CGGTAAGACGCTCATTCATCGGAACGCACCGTTTTCTCGAAGTACCTACACTATTCTTGGAACTTTACCCCTCTAACCGAACCTGAGAGACCTACCCGGG
TGTAATCACAAGCATCCTcctcAGcGGACTCGAGAG sense primer 1 (65.8, 50.2, 50.4)TGTAATCACAAGCATCCTcAgcAGTGGACTCGAGAG sense primer 2 (64.8, 43.7, 53.8) TGTAATCACAAGCATCCTcAgcAGTGGACTCGAGAGAC sense primer 3 (65.5, 43.7, 56.3)
-AATGTAATCACAAGCATCCTcAgcAGTGGACTCGAGAGAC sense primer 4 (66.3, 50.0, 56.3) C (derived/mutant)
AATGTAATCACAAGCATCCTTAAAAGTGGACTCGAGAGACAGAAGCATCAGTGTCAGAGTGGCATGACATGAGAAAGACTCAACCACCCTTTGCTGGCTT TTACATTAGTGTTCGTAGGAATTTTCACCTGAGCTCTCTGTCTTCGTAGTCACAGTCTCACCGTACTGTACTCTTTCTGAGTTGGTGGGAAACGACCGAA
CGTAGTCACAGTCTCACCGT-5’ NP (57.3; only 1 designed) Antisense primer 1 (65, 46, 48) TACTCTTTCTGAGcgacTccGAAACGACCGAA-5’ Antisense primer 3 (66, 46, 52.6) CTGTACTCTTTCTGAGcgacTccGAAACGACCGAA-5’
GACCGAA-Antisense primer 2 (65.1, 44.9, 49.7) antisense primer x CCGAA-
TGAAGATGGAGGAGGAGTCCACAAGCCAAATAATGTGGGCAGCTTCTAGAAGCTGAATAAAACAAGAAAATGGATTCTGCCTTAGAGTCTCTGGAAAGGA ACTTCTACCTCCTCCTCAGGTGTTCGGTTTATTACACCCGTCGAAGATCTTCGACTTATTTTGTTCTTTTACCTAAGACGGAATCTCAGAGACCTTTCCT ACTTCcgaCTCCACTTCTACCgaCTCC nd
TCCTCAGGTGTTC (2) TCAGGTGTTCGG-5’(65.6, 45.3, 50.2) STRONG 2 (not ordered)
CTTCTACCTCCTCCTCAG-5’ CACCCGTCGAAGATCTT-5’ antisense bumper 1 (50.1) antisense bumper 2 (50.0)
Final Report 97-LB-VX-004 82
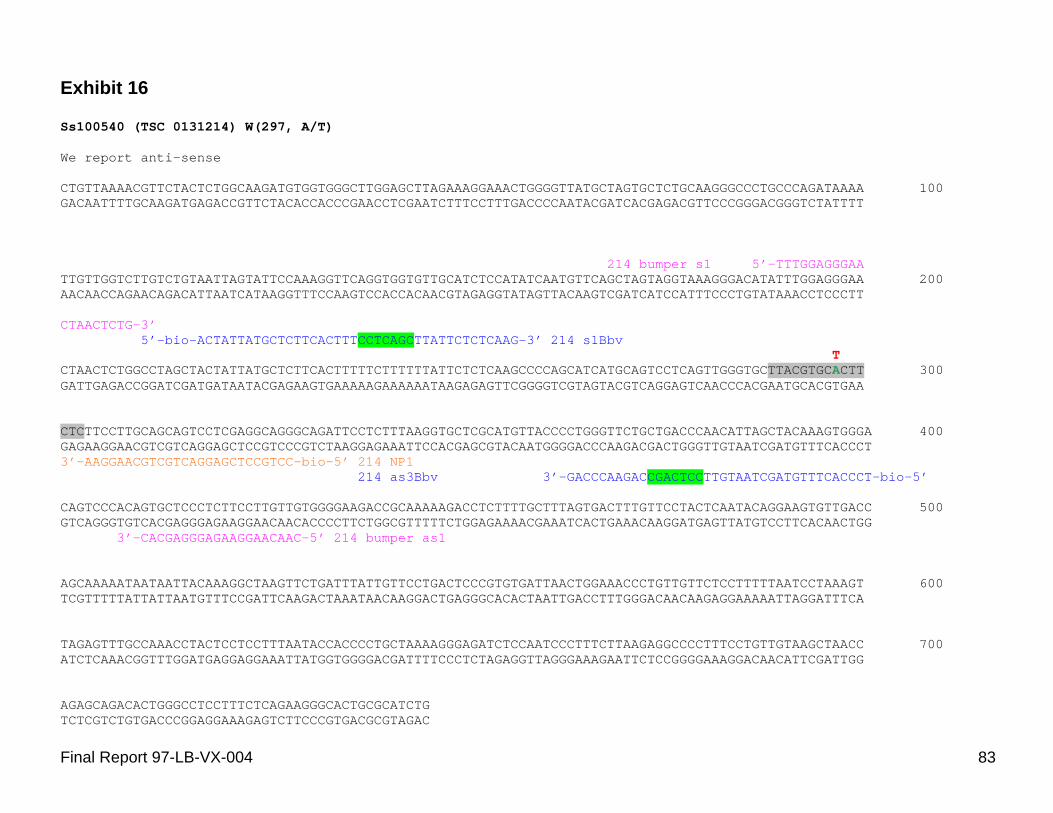
Exhibit 16
Ss100540 (TSC 0131214) W(297, A/T)
We report anti-sense
CTGTTAAAACGTTCTACTCTGGCAAGATGTGGTGGGCTTGGAGCTTAGAAAGGAAACTGGGGTTATGCTAGTGCTCTGCAAGGGCCCTGCCCAGATAAAA 100 GACAATTTTGCAAGATGAGACCGTTCTACACCACCCGAACCTCGAATCTTTCCTTTGACCCCAATACGATCACGAGACGTTCCCGGGACGGGTCTATTTT
214 bumper s1 5’-TTTGGAGGGAA TTGTTGGTCTTGTCTGTAATTAGTATTCCAAAGGTTCAGGTGGTGTTGCATCTCCATATCAATGTTCAGCTAGTAGGTAAAGGGACATATTTGGAGGGAA 200 AACAACCAGAACAGACATTAATCATAAGGTTTCCAAGTCCACCACAACGTAGAGGTATAGTTACAAGTCGATCATCCATTTCCCTGTATAAACCTCCCTT
CTAACTCTG-3’ 5’-bio-ACTATTATGCTCTTCACTTTCCTCAGCTTATTCTCTCAAG-3’ 214 s1Bbv
T CTAACTCTGGCCTAGCTACTATTATGCTCTTCACTTTTTCTTTTTTATTCTCTCAAGCCCCAGCATCATGCAGTCCTCAGTTGGGTGCTTACGTGCACTT 300 GATTGAGACCGGATCGATGATAATACGAGAAGTGAAAAAGAAAAAATAAGAGAGTTCGGGGTCGTAGTACGTCAGGAGTCAACCCACGAATGCACGTGAA
CTCTTCCTTGCAGCAGTCCTCGAGGCAGGGCAGATTCCTCTTTAAGGTGCTCGCATGTTACCCCTGGGTTCTGCTGACCCAACATTAGCTACAAAGTGGGA 400 GAGAAGGAACGTCGTCAGGAGCTCCGTCCCGTCTAAGGAGAAATTCCACGAGCGTACAATGGGGACCCAAGACGACTGGGTTGTAATCGATGTTTCACCCT 3’-AAGGAACGTCGTCAGGAGCTCCGTCC-bio-5’ 214 NP1
214 as3Bbv 3’-GACCCAAGACCGACTCCTTGTAATCGATGTTTCACCCT-bio-5’
CAGTCCCACAGTGCTCCCTCTTCCTTGTTGTGGGGAAGACCGCAAAAAGACCTCTTTTGCTTTAGTGACTTTGTTCCTACTCAATACAGGAAGTGTTGACC 500 GTCAGGGTGTCACGAGGGAGAAGGAACAACACCCCTTCTGGCGTTTTTCTGGAGAAAACGAAATCACTGAAACAAGGATGAGTTATGTCCTTCACAACTGG
3’-CACGAGGGAGAAGGAACAAC-5’ 214 bumper as1
AGCAAAAATAATAATTACAAAGGCTAAGTTCTGATTTATTGTTCCTGACTCCCGTGTGATTAACTGGAAACCCTGTTGTTCTCCTTTTTAATCCTAAAGT 600 TCGTTTTTATTATTAATGTTTCCGATTCAAGACTAAATAACAAGGACTGAGGGCACACTAATTGACCTTTGGGACAACAAGAGGAAAAATTAGGATTTCA
TAGAGTTTGCCAAACCTACTCCTCCTTTAATACCACCCCTGCTAAAAGGGAGATCTCCAATCCCTTTCTTAAGAGGCCCCTTTCCTGTTGTAAGCTAACC 700 ATCTCAAACGGTTTGGATGAGGAGGAAATTATGGTGGGGACGATTTTCCCTCTAGAGGTTAGGGAAAGAATTCTCCGGGGAAAGGACAACATTCGATTGG
AGAGCAGACACTGGGCCTCCTTTCTCAGAAGGGCACTGCGCATCTG TCTCGTCTGTGACCCGGAGGAAAGAGTCTTCCCGTGACGCGTAGAC
Final Report 97-LB-VX-004 83
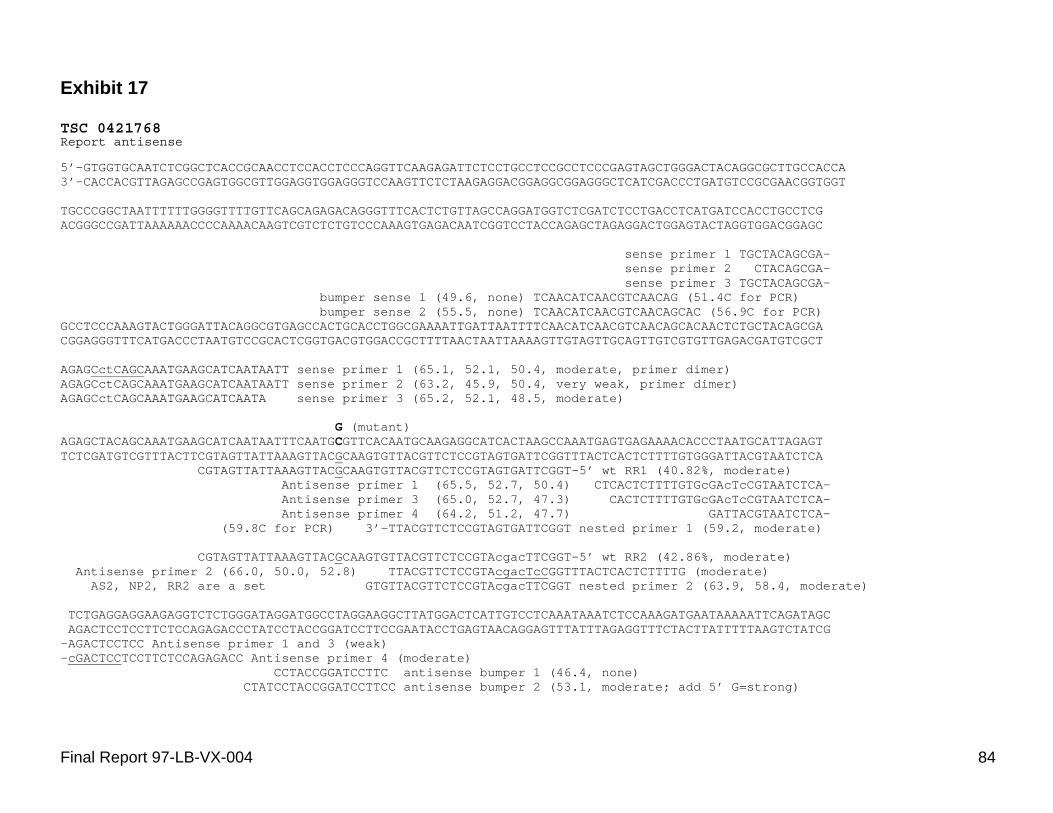
Exhibit 17
TSC 0421768Report antisense
5’-GTGGTGCAATCTCGGCTCACCGCAACCTCCACCTCCCAGGTTCAAGAGATTCTCCTGCCTCCGCCTCCCGAGTAGCTGGGACTACAGGCGCTTGCCACCA 3’-CACCACGTTAGAGCCGAGTGGCGTTGGAGGTGGAGGGTCCAAGTTCTCTAAGAGGACGGAGGCGGAGGGCTCATCGACCCTGATGTCCGCGAACGGTGGT
TGCCCGGCTAATTTTTTGGGGTTTTGTTCAGCAGAGACAGGGTTTCACTCTGTTAGCCAGGATGGTCTCGATCTCCTGACCTCATGATCCACCTGCCTCG ACGGGCCGATTAAAAAACCCCAAAACAAGTCGTCTCTGTCCCAAAGTGAGACAATCGGTCCTACCAGAGCTAGAGGACTGGAGTACTAGGTGGACGGAGC
sense primer 1 TGCTACAGCGA- sense primer 2 CTACAGCGA- sense primer 3 TGCTACAGCGA-
bumper sense 1 (49.6, none) TCAACATCAACGTCAACAG (51.4C for PCR) bumper sense 2 (55.5, none) TCAACATCAACGTCAACAGCAC (56.9C for PCR)
GCCTCCCAAAGTACTGGGATTACAGGCGTGAGCCACTGCACCTGGCGAAAATTGATTAATTTTCAACATCAACGTCAACAGCACAACTCTGCTACAGCGA CGGAGGGTTTCATGACCCTAATGTCCGCACTCGGTGACGTGGACCGCTTTTAACTAATTAAAAGTTGTAGTTGCAGTTGTCGTGTTGAGACGATGTCGCT
AGAGCctCAGCAAATGAAGCATCAATAATT sense primer 1 (65.1, 52.1, 50.4, moderate, primer dimer) AGAGCctCAGCAAATGAAGCATCAATAATT sense primer 2 (63.2, 45.9, 50.4, very weak, primer dimer) AGAGCctCAGCAAATGAAGCATCAATA sense primer 3 (65.2, 52.1, 48.5, moderate)
G (mutant) AGAGCTACAGCAAATGAAGCATCAATAATTTCAATGCGTTCACAATGCAAGAGGCATCACTAAGCCAAATGAGTGAGAAAACACCCTAATGCATTAGAGT TCTCGATGTCGTTTACTTCGTAGTTATTAAAGTTACGCAAGTGTTACGTTCTCCGTAGTGATTCGGTTTACTCACTCTTTTGTGGGATTACGTAATCTCA
CGTAGTTATTAAAGTTACGCAAGTGTTACGTTCTCCGTAGTGATTCGGT-5’ wt RR1 (40.82%, moderate) Antisense primer 1 (65.5, 52.7, 50.4) CTCACTCTTTTGTGcGAcTcCGTAATCTCA- Antisense primer 3 (65.0, 52.7, 47.3) CACTCTTTTGTGcGAcTcCGTAATCTCA- Antisense primer 4 (64.2, 51.2, 47.7) GATTACGTAATCTCA-
(59.8C for PCR) 3’-TTACGTTCTCCGTAGTGATTCGGT nested primer 1 (59.2, moderate)
CGTAGTTATTAAAGTTACGCAAGTGTTACGTTCTCCGTAcgacTTCGGT-5’ wt RR2 (42.86%, moderate) Antisense primer 2 (66.0, 50.0, 52.8) TTACGTTCTCCGTAcgacTcCGGTTTACTCACTCTTTTG (moderate)
AS2, NP2, RR2 are a set GTGTTACGTTCTCCGTAcgacTTCGGT nested primer 2 (63.9, 58.4, moderate)
TCTGAGGAGGAAGAGGTCTCTGGGATAGGATGGCCTAGGAAGGCTTATGGACTCATTGTCCTCAAATAAATCTCCAAAGATGAATAAAAATTCAGATAGC AGACTCCTCCTTCTCCAGAGACCCTATCCTACCGGATCCTTCCGAATACCTGAGTAACAGGAGTTTATTTAGAGGTTTCTACTTATTTTTAAGTCTATCG -AGACTCCTCC Antisense primer 1 and 3 (weak) -cGACTCCTCCTTCTCCAGAGACC Antisense primer 4 (moderate)
CCTACCGGATCCTTC antisense bumper 1 (46.4, none) CTATCCTACCGGATCCTTCC antisense bumper 2 (53.1, moderate; add 5’ G=strong)
Final Report 97-LB-VX-004 84
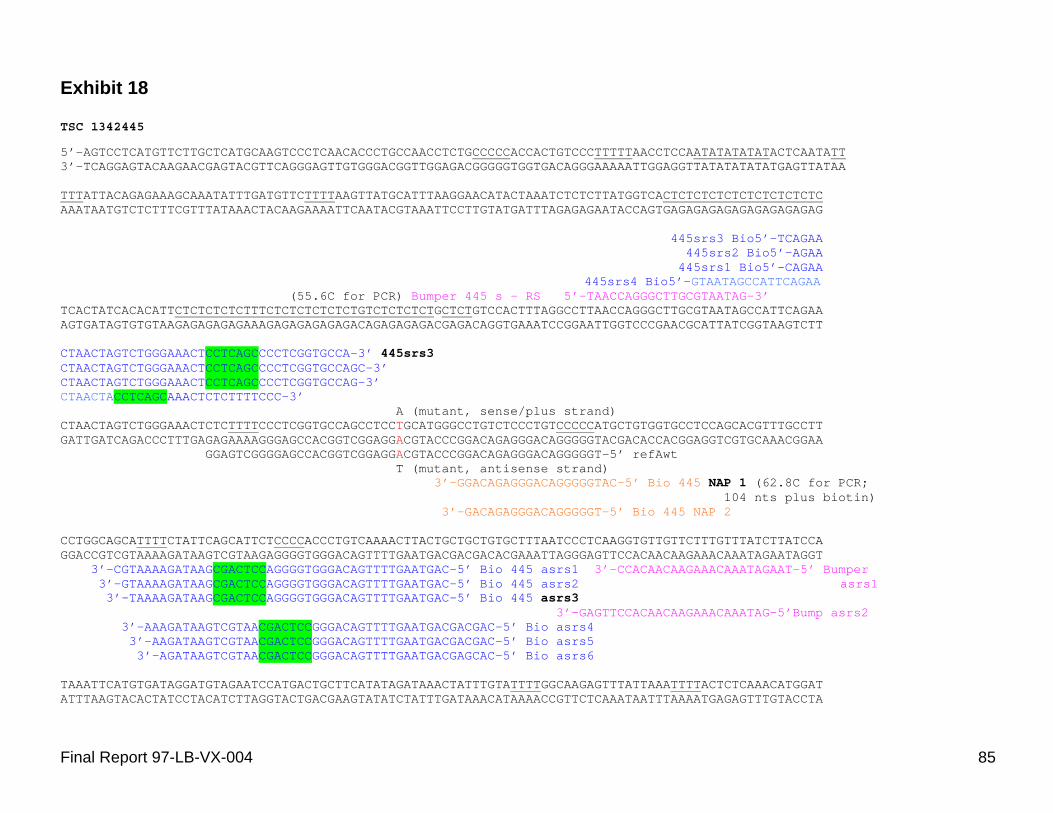
Exhibit 18
TSC 1342445
5’-AGTCCTCATGTTCTTGCTCATGCAAGTCCCTCAACACCCTGCCAACCTCTGCCCCCACCACTGTCCCTTTTTAACCTCCAATATATATATACTCAATATT 3’-TCAGGAGTACAAGAACGAGTACGTTCAGGGAGTTGTGGGACGGTTGGAGACGGGGGTGGTGACAGGGAAAAATTGGAGGTTATATATATATGAGTTATAA
TTTATTACAGAGAAAGCAAATATTTGATGTTCTTTTAAGTTATGCATTTAAGGAACATACTAAATCTCTCTTATGGTCACTCTCTCTCTCTCTCTCTCTC AAATAATGTCTCTTTCGTTTATAAACTACAAGAAAATTCAATACGTAAATTCCTTGTATGATTTAGAGAGAATACCAGTGAGAGAGAGAGAGAGAGAGAG
445srs3 Bio5’-TCAGAA 445srs2 Bio5’-AGAA
445srs1 Bio5’-CAGAA 445srs4 Bio5’-GTAATAGCCATTCAGAA
(55.6C for PCR) Bumper 445 s – RS 5’-TAACCAGGGCTTGCGTAATAG-3’ TCACTATCACACATTCTCTCTCTCTTTCTCTCTCTCTCTGTCTCTCTCTGCTCTGTCCACTTTAGGCCTTAACCAGGGCTTGCGTAATAGCCATTCAGAA AGTGATAGTGTGTAAGAGAGAGAGAAAGAGAGAGAGAGACAGAGAGAGACGAGACAGGTGAAATCCGGAATTGGTCCCGAACGCATTATCGGTAAGTCTT
CTAACTAGTCTGGGAAACTCCTCAGCCCCTCGGTGCCA-3’ 445srs3 CTAACTAGTCTGGGAAACTCCTCAGCCCCTCGGTGCCAGC-3’ CTAACTAGTCTGGGAAACTCCTCAGCCCCTCGGTGCCAG-3’ CTAACTACCTCAGCAAACTCTCTTTTCCC-3’
A (mutant, sense/plus strand) CTAACTAGTCTGGGAAACTCTCTTTTCCCTCGGTGCCAGCCTCCTGCATGGGCCTGTCTCCCTGTCCCCCATGCTGTGGTGCCTCCAGCACGTTTGCCTT GATTGATCAGACCCTTTGAGAGAAAAGGGAGCCACGGTCGGAGGACGTACCCGGACAGAGGGACAGGGGGTACGACACCACGGAGGTCGTGCAAACGGAA
GGAGTCGGGGAGCCACGGTCGGAGGACGTACCCGGACAGAGGGACAGGGGGT-5’ refAwt T (mutant, antisense strand)
3’-GGACAGAGGGACAGGGGGTAC-5’ Bio 445 NAP 1 (62.8C for PCR; 104 nts plus biotin)
3’-GACAGAGGGACAGGGGGT-5’ Bio 445 NAP 2
CCTGGCAGCATTTTCTATTCAGCATTCTCCCCACCCTGTCAAAACTTACTGCTGCTGTGCTTTAATCCCTCAAGGTGTTGTTCTTTGTTTATCTTATCCA GGACCGTCGTAAAAGATAAGTCGTAAGAGGGGTGGGACAGTTTTGAATGACGACGACACGAAATTAGGGAGTTCCACAACAAGAAACAAATAGAATAGGT
3’-CGTAAAAGATAAGCGACTCCAGGGGTGGGACAGTTTTGAATGAC-5’ Bio 445 asrs1 3’-CCACAACAAGAAACAAATAGAAT-5’ Bumper 3’-GTAAAAGATAAGCGACTCCAGGGGTGGGACAGTTTTGAATGAC-5’ Bio 445 asrs2 asrs1 3’-TAAAAGATAAGCGACTCCAGGGGTGGGACAGTTTTGAATGAC-5’ Bio 445 asrs3
3’-GAGTTCCACAACAAGAAACAAATAG-5’Bump asrs2 3’-AAAGATAAGTCGTAACGACTCCGGGACAGTTTTGAATGACGACGAC-5’ Bio asrs4 3’-AAGATAAGTCGTAACGACTCCGGGACAGTTTTGAATGACGACGAC-5’ Bio asrs5 3’-AGATAAGTCGTAACGACTCCGGGACAGTTTTGAATGACGAGCAC-5’ Bio asrs6
TAAATTCATGTGATAGGATGTAGAATCCATGACTGCTTCATATAGATAAACTATTTGTATTTTGGCAAGAGTTTATTAAATTTTACTCTCAAACATGGAT ATTTAAGTACACTATCCTACATCTTAGGTACTGACGAAGTATATCTATTTGATAAACATAAAACCGTTCTCAAATAATTTAAAATGAGAGTTTGTACCTA
Final Report 97-LB-VX-004 85
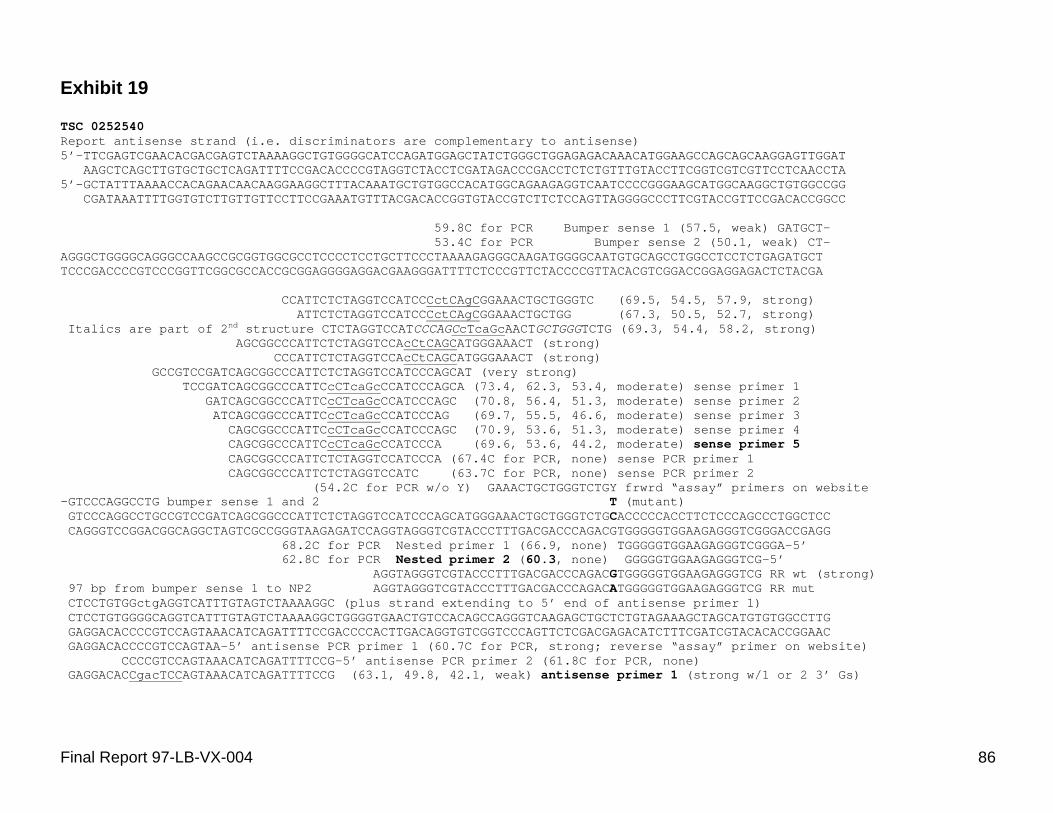
Exhibit 19
TSC 0252540 Report antisense strand (i.e. discriminators are complementary to antisense) 5’-TTCGAGTCGAACACGACGAGTCTAAAAGGCTGTGGGGCATCCAGATGGAGCTATCTGGGCTGGAGAGACAAACATGGAAGCCAGCAGCAAGGAGTTGGAT
AAGCTCAGCTTGTGCTGCTCAGATTTTCCGACACCCCGTAGGTCTACCTCGATAGACCCGACCTCTCTGTTTGTACCTTCGGTCGTCGTTCCTCAACCTA 5’-GCTATTTAAAACCACAGAACAACAAGGAAGGCTTTACAAATGCTGTGGCCACATGGCAGAAGAGGTCAATCCCCGGGAAGCATGGCAAGGCTGTGGCCGG
CGATAAATTTTGGTGTCTTGTTGTTCCTTCCGAAATGTTTACGACACCGGTGTACCGTCTTCTCCAGTTAGGGGCCCTTCGTACCGTTCCGACACCGGCC
59.8C for PCR Bumper sense 1 (57.5, weak) GATGCT- 53.4C for PCR Bumper sense 2 (50.1, weak) CT-
AGGGCTGGGGCAGGGCCAAGCCGCGGTGGCGCCTCCCCTCCTGCTTCCCTAAAAGAGGGCAAGATGGGGCAATGTGCAGCCTGGCCTCCTCTGAGATGCT TCCCGACCCCGTCCCGGTTCGGCGCCACCGCGGAGGGGAGGACGAAGGGATTTTCTCCCGTTCTACCCCGTTACACGTCGGACCGGAGGAGACTCTACGA
CCATTCTCTAGGTCCATCCCctCAgCGGAAACTGCTGGGTC (69.5, 54.5, 57.9, strong) ATTCTCTAGGTCCATCCCctCAgCGGAAACTGCTGG (67.3, 50.5, 52.7, strong)
Italics are part of 2nd structure CTCTAGGTCCATCCCAGCcTcaGcAACTGCTGGGTCTG (69.3, 54.4, 58.2, strong)AGCGGCCCATTCTCTAGGTCCAcCtCAGC
CCCATTCTCTAGGTCCAcCtCAGCATGGGAAACT (strong) ATGGGAAACT (strong)
GCCGTCCGATCAGCGGCCCATTCTCTAGGTCCATCCCAGCAT (very strong) TCCGATCAGCGGCCCATTCcCTcaGc
GATCAGCGGCCCATTCcCTcaGcCCATCCCAGCA (73.4, 62.3, 53.4, moderate) sense primer 1CCATCCCAGC (70.8, 56.4, 51.3, moderate) sense primer 2
ATCAGCGGCCCATTCcCTcaGcCCATCCCAG (69.7, 55.5, 46.6, moderate) sense primer 3 CAGCGGCCCATTCcCTcaGcCCATCCCAGC (70.9, 53.6, 51.3, moderate) sense primer 4 CAGCGGCCCATTCcCTcaGcCCATCCCA (69.6, 53.6, 44.2, moderate) sense primer 5
CAGCGGCCCATTCTCTAGGTCCATCCCA (67.4C for PCR, none) sense PCR primer 1 CAGCGGCCCATTCTCTAGGTCCATC (63.7C for PCR, none) sense PCR primer 2
(54.2C for PCR w/o Y) GAAACTGCTGGGTCTGY frwrd “assay” primers on website -GTCCCAGGCCTG bumper sense 1 and 2 T (mutant) GTCCCAGGCCTGCCGTCCGATCAGCGGCCCATTCTCTAGGTCCATCCCAGCATGGGAAACTGCTGGGTCTGCACCCCCACCTTCTCCCAGCCCTGGCTCC CAGGGTCCGGACGGCAGGCTAGTCGCCGGGTAAGAGATCCAGGTAGGGTCGTACCCTTTGACGACCCAGACGTGGGGGTGGAAGAGGGTCGGGACCGAGG
68.2C for PCR Nested primer 1 (66.9, none) TGGGGGTGGAAGAGGGTCGGGA-5’ 62.8C for PCR Nested primer 2 (60.3, none) GGGGGTGGAAGAGGGTCG-5’
AGGTAGGGTCGTACCCTTTGACGACCCAGACGTGGGGGTGGAAGAGGGTCG RR wt (strong) 97 bp from bumper sense 1 to NP2 AGGTAGGGTCGTACCCTTTGACGACCCAGACATGGGGGTGGAAGAGGGTCG RR mut CTCCTGTGGctgAGGTCATTTGTAGTCTAAAAGGC (plus strand extending to 5’ end of antisense primer 1) CTCCTGTGGGGCAGGTCATTTGTAGTCTAAAAGGCTGGGGTGAACTGTCCACAGCCAGGGTCAAGAGCTGCTCTGTAGAAAGCTAGCATGTGTGGCCTTG GAGGACACCCCGTCCAGTAAACATCAGATTTTCCGACCCCACTTGACAGGTGTCGGTCCCAGTTCTCGACGAGACATCTTTCGATCGTACACACCGGAAC GAGGACACCCCGTCCAGTAA-5’ antisense PCR primer 1 (60.7C for PCR, strong; reverse “assay” primer on website)
CCCCGTCCAGTAAACATCAGATTTTCCG-5’ antisense PCR primer 2 (61.8C for PCR, none) GAGGACACCgacTCCAGTAAACATCAGATTTTCCG (63.1, 49.8, 42.1, weak) antisense primer 1 (strong w/1 or 2 3’ Gs)
Final Report 97-LB-VX-004 86

Exhibit 20
TSC 0709016
5’-CCAATATAACTTTAATAATAGGCGGCAGGAGGATTTGGTCCTTTGGCTGGGGTTTGCCATCCTTTGGTATAGATTGTATAGAAAGACTGAAAACTCTATT 3’-GGTTATATTGAAATTATTATCCGCCGTCCTCCTAAACCAGGAAACCGACCCCAAACGGTAGGAAACCATATCTAACATATCTTTCTGACTTTTGAGATAA
TAATCAGTTAATTAACTCATATGAATTTGTTAAAAGATGAGAAAGCATCACAAAATGTGTGCCTCAATAACATAATGACTAGGACTCTTCTCTGGAGTTT ATTAGTCAATTAATTGAGTATACTTAAACAATTTTCTACTCTTTCGTAGTGTTTTACACACGGAGTTATTGTATTACTGATCCTGAGAAGAGACCTCAAA
016 bumps 5’- TATGACCCAGCTCACCTT- AAAAGGAATTCTCTGGCAGTGTCTTCAGGCCCTATGCCCTGGTGGTCACCCTGAGAAGACGTCTTCAGGGCAGGGCTGTGTCTATGACCCAGCTCACCTT TTTTCCTTAAGAGACCGTCACAGAAGTCCGGGATACGGGACCACCAGTGGGACTCTTCTGCAGAAGTCCCGTCCCGACACAGATACTGGGTCGAGTGGAA
GCTCC – 3’ (016 bumps) 5’- CCTCAGCGGATCCACACAGGGAATGACAGGGAACCA 5’-BioCTCCAACCAAGCTCCATTCCTAGTGTCCTCAGCATCCACACAGG-3’ 016s13
5’-BioAACCAAGCTCCATTCCTAGTGTCCTCAGCATCCACACAGGGAA-3’ 016s12 5’-BioCTCCAACCAAGCTCCATTCCTAGTGTCCTCAGCATCCACACAGGGAATG-3’ 016s11 T(mutant)
GCTCCACTCCAACCAAGCTCCATTCCTAGTGTGCTGAGGATCCACACAGGGAATGACAGGGAACCACTAATATCACAAAAGGCCTAGGCCTCTGGGCTGC CGAGGTGAGGTTGGTTCGAGGTAAGGATCACACGACTCCTAGGTGTGTCCCTTACTGTCCCTTGGTGATTATAGTGTTTTCCGGATCCGGAGACCCGACG
??BbvC1B site 016nap1-3’-GGAGACCCGACG 016nap2-3’-GAGACCCGACG
CTGCATGGGTGACTTTCCAAGATCAGTCGAGTGAACAAGGAGTTGGTCTTAAAAGATGTACAGCAAACCCTTGAAGCTTTGCTGAAAAAACAACTCACAA GACGTACCCACTGAAAGGTTCTAGTCAGCTCACTTGTTCCTCAACCAGAATTTTCTACATGTCGTTTGGGAACTTCGAAACGACTTTTTTGTTGAGTGTT GACGTAC-5’Bio 016 bumpas2 3’-CGTTTGGGAACTTCGAAACGACTT 3’-GTTGAGTGTT GACGTA-5’Bio
AAGGTTCTAGTCAGCGACTCCGTTCCTCAACCAGAATTTTCTACAT-Bio-5’ 016as4 AGGTTCTAGTCAGCGACTCCGTTCCTCAACCAGAATTTTCTACATG-Bio-5’ 016as5
GGTTCTAGTCAGCGACTCCGTTCCTCAACCAGAATTTTCTACATG-Bio-5’ 016as6
AAAGCAGATTAACAGGAGAAAAGATGTGATATGGATTCAGTTAATGAGAACTCAGGGAAGTGACCAGCAGTTAATTGTTTTCTTCTTTGGTAGGTCTGGA TTTCGTCTAATTGTCCTCTTTTCTACACTATACCTAAGTCAATTACTCTTGAGTCCCTTCACTGGTCGTCAATTAACAAAAGAAGAAACCATCCAGACCT TTTCGTCTAATTG -5’016 bumpas1 3’-CTCTTGAGTCCCTTCACTGGTCG-5’ 016 bumpas3
CTTTAGGCAGACAAGGGAACTTTAGAGAATCTAATGCTTTGGGAGAGACAGTATGGGGGAGATCAGGGAGACCTTGAGGCTCCCTTTTCAGTTCAGCATG
Final Report 97-LB-VX-004 87
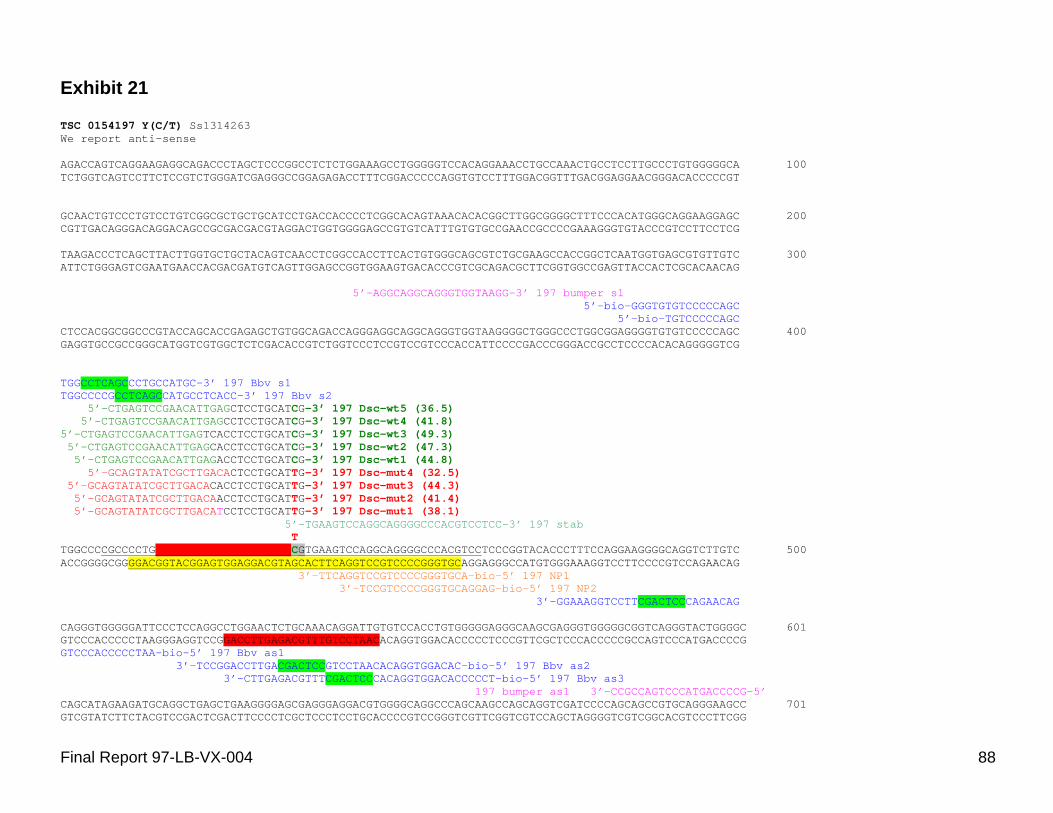
Exhibit 21
TSC 0154197 Y(C/T) Ss1314263 We report anti-sense
AGACCAGTCAGGAAGAGGCAGACCCTAGCTCCCGGCCTCTCTGGAAAGCCTGGGGGTCCACAGGAAACCTGCCAAACTGCCTCCTTGCCCTGTGGGGGCA 100 TCTGGTCAGTCCTTCTCCGTCTGGGATCGAGGGCCGGAGAGACCTTTCGGACCCCCAGGTGTCCTTTGGACGGTTTGACGGAGGAACGGGACACCCCCGT
GCAACTGTCCCTGTCCTGTCGGCGCTGCTGCATCCTGACCACCCCTCGGCACAGTAAACACACGGCTTGGCGGGGCTTTCCCACATGGGCAGGAAGGAGC 200 CGTTGACAGGGACAGGACAGCCGCGACGACGTAGGACTGGTGGGGAGCCGTGTCATTTGTGTGCCGAACCGCCCCGAAAGGGTGTACCCGTCCTTCCTCG
TAAGACCCTCAGCTTACTTGGTGCTGCTACAGTCAACCTCGGCCACCTTCACTGTGGGCAGCGTCTGCGAAGCCACCGGCTCAATGGTGAGCGTGTTGTC 300 ATTCTGGGAGTCGAATGAACCACGACGATGTCAGTTGGAGCCGGTGGAAGTGACACCCGTCGCAGACGCTTCGGTGGCCGAGTTACCACTCGCACAACAG
5’-AGGCAGGCAGGGTGGTAAGG-3’ 197 bumper s1 5’-bio-GGGTGTGTCCCCCAGC
5’-bio-TGTCCCCCAGC CTCCACGGCGGCCCGTACCAGCACCGAGAGCTGTGGCAGACCAGGGAGGCAGGCAGGGTGGTAAGGGGCTGGGCCCTGGCGGAGGGGTGTGTCCCCCAGC 400 GAGGTGCCGCCGGGCATGGTCGTGGCTCTCGACACCGTCTGGTCCCTCCGTCCGTCCCACCATTCCCCGACCCGGGACCGCCTCCCCACACAGGGGGTCG
TGGCCTCAGCCCTGCCATGC-3’ 197 Bbv s1 TGGCCCCGCCTCAGCCATGCCTCACC-3’ 197 Bbv s2
5’-CTGAGTCCGAACATTGAGCTCCTGCATCG-3’ 197 Dsc-wt5 (36.5) 5’-CTGAGTCCGAACATTGAGCCTCCTGCATCG-3’ 197 Dsc-wt4 (41.8)
5’-CTGAGTCCGAACATTGAGTCACCTCCTGCATCG-3’ 197 Dsc-wt3 (49.3) 5’-CTGAGTCCGAACATTGAGCACCTCCTGCATCG-3’ 197 Dsc-wt2 (47.3) 5’-CTGAGTCCGAACATTGAGACCTCCTGCATCG-3’ 197 Dsc-wt1 (44.8)
5’-GCAGTATATCGCTTGACACTCCTGCATTG-3’ 197 Dsc-mut4 (32.5) 5’-GCAGTATATCGCTTGACACACCTCCTGCATTG-3’ 197 Dsc-mut3 (44.3)
5’-GCAGTATATCGCTTGACAACCTCCTGCATTG-3’ 197 Dsc-mut2 (41.4)5’-GCAGTATATCGCTTGACATCCTCCTGCATTG-3’ 197 Dsc-mut1 (38.1)
5’-TGAAGTCCAGGCAGGGGCCCACGTCCTCC-3’ 197 stab T
TGGCCCCGCCCCTGCCATGCCTCACCTCCTGCATCGTGAAGTCCAGGCAGGGGCCCACGTCCTCCCGGTACACCCTTTCCAGGAAGGGGCAGGTCTTGTC 500 ACCGGGGCGGGGACGGTACGGAGTGGAGGACGTAGCACTTCAGGTCCGTCCCCGGGTGCAGGAGGGCCATGTGGGAAAGGTCCTTCCCCGTCCAGAACAG
3’-TTCAGGTCCGTCCCCGGGTGCA-bio-5’ 197 NP1 3’-TCCGTCCCCGGGTGCAGGAG-bio-5’ 197 NP2
3’-GGAAAGGTCCTTCGACTCCCAGAACAG
CAGGGTGGGGGATTCCCTCCAGGCCTGGAACTCTGCAAACAGGATTGTGTCCACCTGTGGGGGAGGGCAAGCGAGGGTGGGGGCGGTCAGGGTACTGGGGC 601 GTCCCACCCCCTAAGGGAGGTCCGGACCTTGAGACGTTTGTCCTAACACAGGTGGACACCCCCTCCCGTTCGCTCCCACCCCCGCCAGTCCCATGACCCCG GTCCCACCCCCTAA-bio-5’ 197 Bbv as1
3’-TCCGGACCTTGACGACTCCGTCCTAACACAGGTGGACAC-bio-5’ 197 Bbv as2 3’-CTTGAGACGTTTCGACTCCCACAGGTGGACACCCCCT-bio-5’ 197 Bbv as3
197 bumper as1 3’-CCGCCAGTCCCATGACCCCG-5’ CAGCATAGAAGATGCAGGCTGAGCTGAAGGGGAGCGAGGGAGGACGTGGGGCAGGCCCAGCAAGCCAGCAGGTCGATCCCCAGCAGCCGTGCAGGGAAGCC 701 GTCGTATCTTCTACGTCCGACTCGACTTCCCCTCGCTCCCTCCTGCACCCCGTCCGGGTCGTTCGGTCGTCCAGCTAGGGGTCGTCGGCACGTCCCTTCGG
Final Report 97-LB-VX-004 88
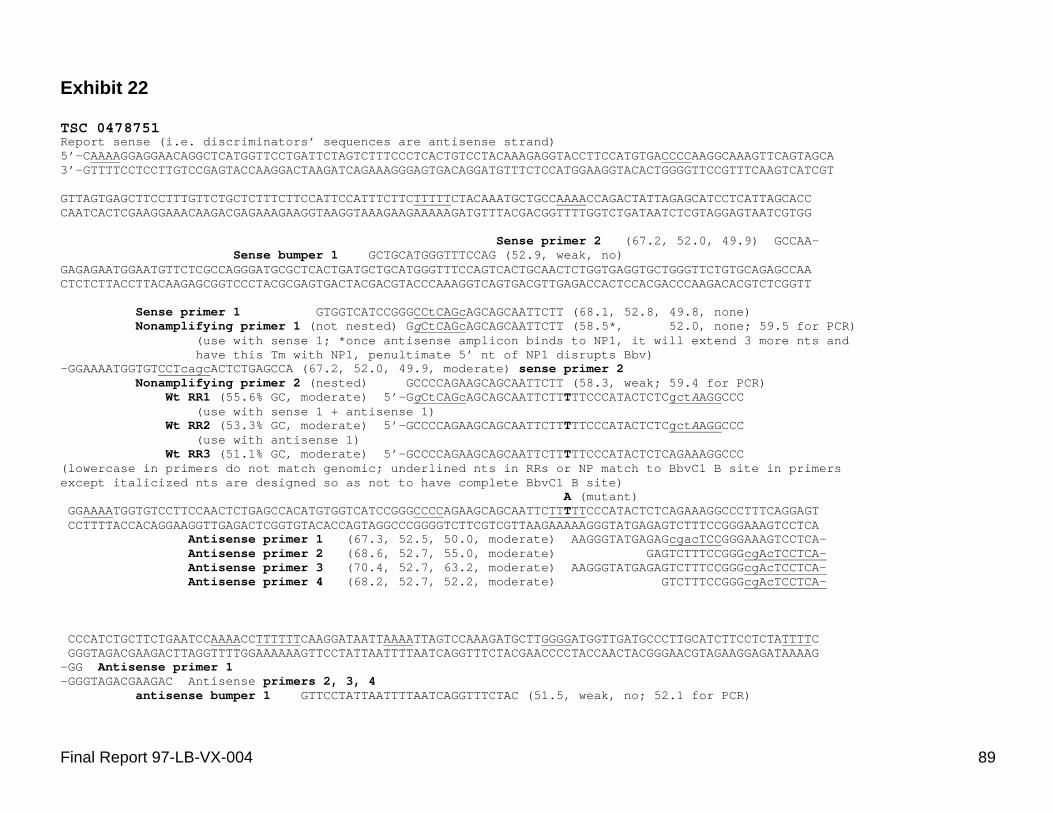
Exhibit 22
TSC 0478751Report sense (i.e. discriminators’ sequences are antisense strand) 5’-CAAAAGGAGGAACAGGCTCATGGTTCCTGATTCTAGTCTTTCCCTCACTGTCCTACAAAGAGGTACCTTCCATGTGACCCCAAGGCAAAGTTCAGTAGCA 3’-GTTTTCCTCCTTGTCCGAGTACCAAGGACTAAGATCAGAAAGGGAGTGACAGGATGTTTCTCCATGGAAGGTACACTGGGGTTCCGTTTCAAGTCATCGT
GTTAGTGAGCTTCCTTTGTTCTGCTCTTTCTTCCATTCCATTTCTTCTTTTTCTACAAATGCTGCCAAAACCAGACTATTAGAGCATCCTCATTAGCACC CAATCACTCGAAGGAAACAAGACGAGAAAGAAGGTAAGGTAAAGAAGAAAAAGATGTTTACGACGGTTTTGGTCTGATAATCTCGTAGGAGTAATCGTGG
Sense primer 2 (67.2, 52.0, 49.9) GCCAA- Sense bumper 1 GCTGCATGGGTTTCCAG (52.9, weak, no)
GAGAGAATGGAATGTTCTCGCCAGGGATGCGCTCACTGATGCTGCATGGGTTTCCAGTCACTGCAACTCTGGTGAGGTGCTGGGTTCTGTGCAGAGCCAA CTCTCTTACCTTACAAGAGCGGTCCCTACGCGAGTGACTACGACGTACCCAAAGGTCAGTGACGTTGAGACCACTCCACGACCCAAGACACGTCTCGGTT
Sense primer 1 GTGGTCATCCGGGCCtCAGcAGCAGCAATTCTT (68.1, 52.8, 49.8, none) Nonamplifying primer 1 (not nested) GgCtCAGcAGCAGCAATTCTT (58.5*, 52.0, none; 59.5 for PCR)
(use with sense 1; *once antisense amplicon binds to NP1, it will extend 3 more nts and have this Tm with NP1, penultimate 5’ nt of NP1 disrupts Bbv)
-GGAAAATGGTGTCCTcagcACTCTGAGCCA (67.2, 52.0, 49.9, moderate) sense primer 2 Nonamplifying primer 2 (nested) GCCCCAGAAGCAGCAATTCTT (58.3, weak; 59.4 for PCR)
Wt RR1 (55.6% GC, moderate) 5’-GgCtCAGcAGCAGCAATTCTTTTTCCCATACTCTCgctAAGGCCC (use with sense 1 + antisense 1)
Wt RR2 (53.3% GC, moderate) 5’-GCCCCAGAAGCAGCAATTCTTTTTCCCATACTCTCgctAAGGCCC (use with antisense 1)
Wt RR3 (51.1% GC, moderate) 5’-GCCCCAGAAGCAGCAATTCTTTTTCCCATACTCTCAGAAAGGCCC (lowercase in primers do not match genomic; underlined nts in RRs or NP match to BbvC1 B site in primers except italicized nts are designed so as not to have complete BbvC1 B site)
A (mutant) GGAAAATGGTGTCCTTCCAACTCTGAGCCACATGTGGTCATCCGGGCCCCAGAAGCAGCAATTCTTTTTCCCATACTCTCAGAAAGGCCCTTTCAGGAGT CCTTTTACCACAGGAAGGTTGAGACTCGGTGTACACCAGTAGGCCCGGGGTCTTCGTCGTTAAGAAAAAGGGTATGAGAGTCTTTCCGGGAAAGTCCTCA
Antisense primer 1 (67.3, 52.5, 50.0, moderate) AAGGGTATGAGAGcgacTCCGGGAAAGTCCTCA- Antisense primer 2 (68.6, 52.7, 55.0, moderate) GAGTCTTTCCGGGcgAcTCCTCA-Antisense primer 3 (70.4, 52.7, 63.2, moderate) AAGGGTATGAGAGTCTTTCCGGGcgAcTCCTCA-Antisense primer 4 (68.2, 52.7, 52.2, moderate) GTCTTTCCGGGcgAcTCCTCA
CCCATCTGCTTCTGAATCCAAAACCTTTTTTCAAGGATAATTAAAATTAGTCCAAAGATGCTTGGGGATGGTTGATGCCCTTGCATCTTCCTCTATTTTC GGGTAGACGAAGACTTAGGTTTTGGAAAAAAGTTCCTATTAATTTTAATCAGGTTTCTACGAACCCCTACCAACTACGGGAACGTAGAAGGAGATAAAAG -GG Antisense primer 1 -GGGTAGACGAAGAC
antisense bumper 1 Antisense primers 2, 3, 4
GTTCCTATTAATTTTAATCAGGTTTCTAC (51.5, weak, no; 52.1 for PCR)
Final Report 97-LB-VX-004 89
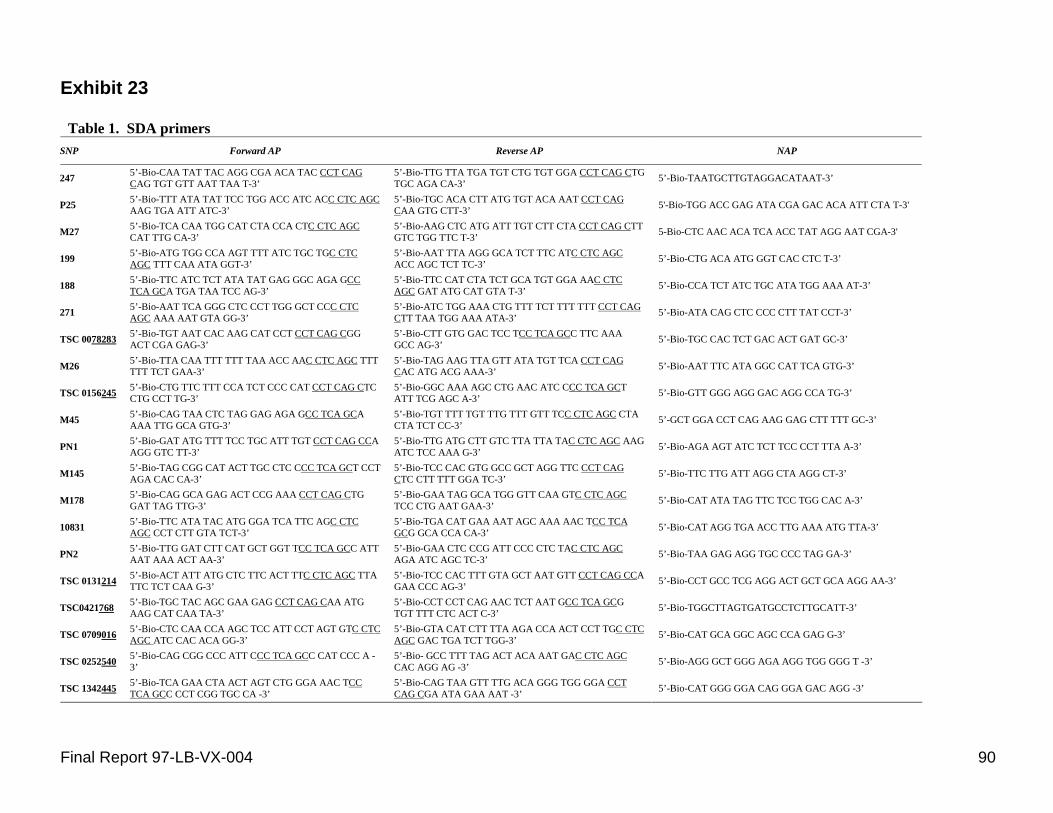
Exhibit 23
Table 1. SDA primers SNP Forward AP Reverse AP NAP
5’-Bio-CAA TAT TAC AGG CGA ACA TAC CCT CAG 247 CAG TGT GTT AAT TAA T-3’5’-Bio-TTT ATA TAT TCC TGG ACC ATC ACC CTC AGCP25 AAG TGA ATT ATC-3’5’-Bio-TCA CAA TGG CAT CTA CCA CTC CTC AGCM27 CAT TTG CA-3’ 5’-Bio-ATG TGG CCA AGT TTT ATC TGC TGC CTC199 AGC TTT CAA ATA GGT-3’5’-Bio-TTC ATC TCT ATA TAT GAG GGC AGA GCC188 TCA GCA TGA TAA TCC AG-3’5’-Bio-AAT TCA GGG CTC CCT TGG GCT CCC CTC271 AGC AAA AAT GTA GG-3’5’-Bio-TGT AAT CAC AAG CAT CCT CCT CAG CGGTSC 0078283 ACT CGA GAG-3’5’-Bio-TTA CAA TTT TTT TAA ACC AAC CTC AGC TTT M26 TTT TCT GAA-3’5’-Bio-CTG TTC TTT CCA TCT CCC CAT CCT CAG CTCTSC 0156245 CTG CCT TG-3’5’-Bio-CAG TAA CTC TAG GAG AGA GCC TCA GCAM45 AAA TTG GCA GTG-3’5’-Bio-GAT ATG TTT TCC TGC ATT TGT CCT CAG CCAPN1 AGG GTC TT-3’ 5’-Bio-TAG CGG CAT ACT TGC CTC CCC TCA GCT CCTM145 AGA CAC CA-3’5’-Bio-CAG GCA GAG ACT CCG AAA CCT CAG CTGM178 GAT TAG TTG-3’5’-Bio-TTC ATA TAC ATG GGA TCA TTC AGC CTC10831 AGC CCT CTT GTA TCT-3’5’-Bio-TTG GAT CTT CAT GCT GGT TCC TCA GCC ATTPN2 AAT AAA ACT AA-3’5’-Bio-ACT ATT ATG CTC TTC ACT TTC CTC AGC TTATSC 0131214 TTC TCT CAA G-3’5’-Bio-TGC TAC AGC GAA GAG CCT CAG CAA ATGTSC0421768 AAG CAT CAA TA-3’5’-Bio-CTC CAA CCA AGC TCC ATT CCT AGT GTC CTC TSC 0709016 AGC ATC CAC ACA GG-3’5’-Bio-CAG CGG CCC ATT CCC TCA GCC CAT CCC A TSC 0252540 3’5’-Bio-TCA GAA CTA ACT AGT CTG GGA AAC TCCTSC 1342445 TCA GCC CCT CGG TGC CA -3’
5’-Bio-TTG TTA TGA TGT CTG TGT GGA CCT CAG CTG TGC AGA CA-3’ 5’-Bio-TGC ACA CTT ATG TGT ACA AAT CCT CAG CAA GTG CTT-3’ 5’-Bio-AAG CTC ATG ATT TGT CTT CTA CCT CAG CTT GTC TGG TTC T-3’ 5’-Bio-AAT TTA AGG GCA TCT TTC ATC CTC AGC ACC AGC TCT TC-3’ 5’-Bio-TTC CAT CTA TCT GCA TGT GGA AAC CTC AGC GAT ATG CAT GTA T-3’ 5’-Bio-ATC TGG AAA CTG TTT TCT TTT TTT CCT CAG CTT TAA TGG AAA ATA-3’ 5’-Bio-CTT GTG GAC TCC TCC TCA GCC TTC AAA GCC AG-3’ 5’-Bio-TAG AAG TTA GTT ATA TGT TCA CCT CAG CAC ATG ACG AAA-3’ 5’-Bio-GGC AAA AGC CTG AAC ATC CCC TCA GCT ATT TCG AGC A-3’ 5’-Bio-TGT TTT TGT TTG TTT GTT TCC CTC AGC CTA CTA TCT CC-3’ 5’-Bio-TTG ATG CTT GTC TTA TTA TAC CTC AGC AAG ATC TCC AAA G-3’ 5’-Bio-TCC CAC GTG GCC GCT AGG TTC CCT CAG CTC CTT TTT GGA TC-3’ 5’-Bio-GAA TAG GCA TGG GTT CAA GTC CTC AGC TCC CTG AAT GAA-3’ 5’-Bio-TGA CAT GAA AAT AGC AAA AAC TCC TCA GCG GCA CCA CA-3’ 5’-Bio-GAA CTC CCG ATT CCC CTC TAC CTC AGC AGA ATC AGC TC-3’ 5’-Bio-TCC CAC TTT GTA GCT AAT GTT CCT CAG CCA GAA CCC AG-3’ 5’-Bio-CCT CCT CAG AAC TCT AAT GCC TCA GCG TGT TTT CTC ACT C-3’ 5’-Bio-GTA CAT CTT TTA AGA CCA ACT CCT TGC CTC AGC GAC TGA TCT TGG-3’ 5’-Bio- GCC TTT TAG ACT ACA AAT GAC CTC AGC CAC AGG AG -3’ 5’-Bio-CAG TAA GTT TTG ACA GGG TGG GGA CCT CAG CGA ATA GAA AAT -3’
5’-Bio-TAATGCTTGTAGGACATAAT-3’
5'-Bio-TGG ACC GAG ATA CGA GAC ACA ATT CTA T-3'
5-Bio-CTC AAC ACA TCA ACC TAT AGG AAT CGA-3'
5’-Bio-CTG ACA ATG GGT CAC CTC T-3’
5’-Bio-CCA TCT ATC TGC ATA TGG AAA AT-3’
5’-Bio-ATA CAG CTC CCC CTT TAT CCT-3’
5’-Bio-TGC CAC TCT GAC ACT GAT GC-3’
5’-Bio-AAT TTC ATA GGC CAT TCA GTG-3’
5’-Bio-GTT GGG AGG GAC AGG CCA TG-3’
5’-GCT GGA CCT CAG AAG GAG CTT TTT GC-3’
5’-Bio-AGA AGT ATC TCT TCC CCT TTA A-3’
5’-Bio-TTC TTG ATT AGG CTA AGG CT-3’
5’-Bio-CAT ATA TAG TTC TCC TGG CAC A-3’
5’-Bio-CAT AGG TGA ACC TTG AAA ATG TTA-3’
5’-Bio-TAA GAG AGG TGC CCC TAG GA-3’
5’-Bio-CCT GCC TCG AGG ACT GCT GCA AGG AA-3’
5’-Bio-TGGCTTAGTGATGCCTCTTGCATT-3’
5’-Bio-CAT GCA GGC AGC CCA GAG G-3’
5’-Bio-AGG GCT GGG AGA AGG TGG GGG T -3’
5’-Bio-CAT GGG GGA CAG GGA GAC AGG -3’
Final Report 97-LB-VX-004 90
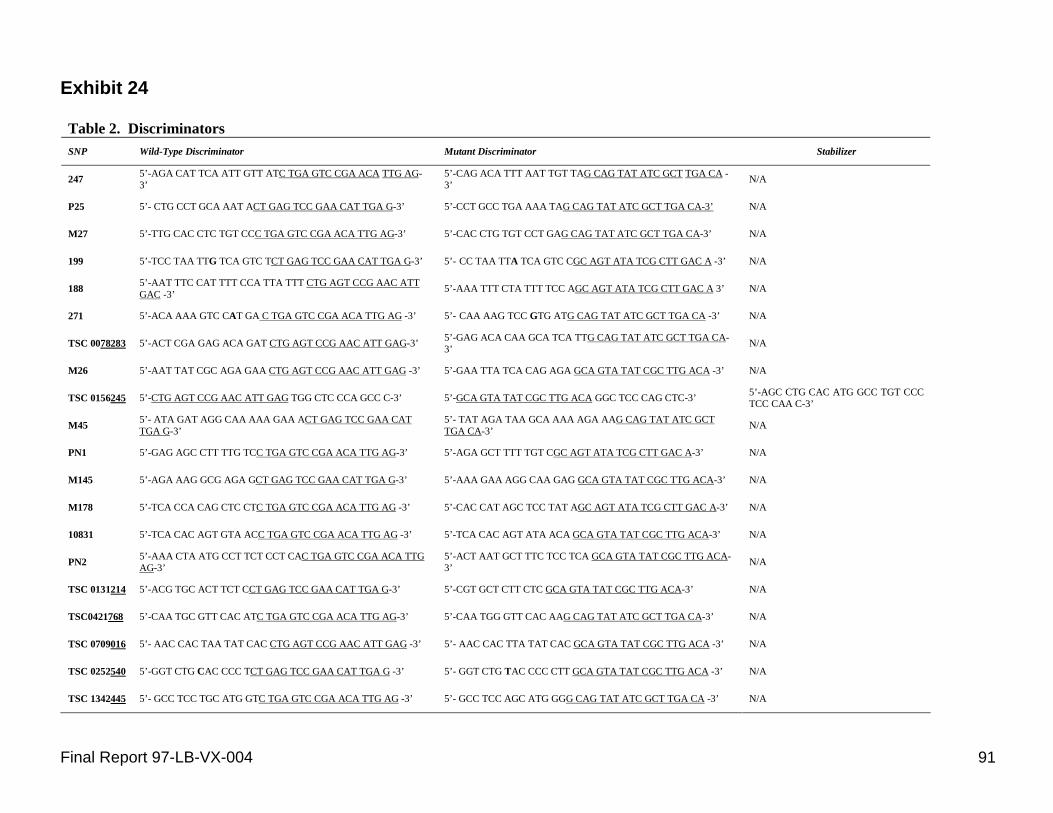
Exhibit 24
Table 2. Discriminators SNP Wild-Type Discriminator Mutant Discriminator Stabilizer
247 5’-AGA CAT TCA ATT GTT ATC TGA GTC CGA ACA TTG AG3’
5’-CAG ACA TTT AAT TGT TAG CAG TAT ATC GCT TGA CA 3’ N/A
P25 5’- CTG CCT GCA AAT ACT GAG TCC GAA CAT TGA G-3’ 5’-CCT GCC TGA AAA TAG CAG TAT ATC GCT TGA CA-3’ N/A
M27 5’-TTG CAC CTC TGT CCC TGA GTC CGA ACA TTG AG-3’ 5’-CAC CTG TGT CCT GAG CAG TAT ATC GCT TGA CA-3’ N/A
199 5’-TCC TAA TTG TCA GTC TCT GAG TCC GAA CAT TGA G-3’ 5’- CC TAA TTA TCA GTC CGC AGT ATA TCG CTT GAC A -3’ N/A
188 5’-AAT TTC CAT TTT CCA TTA TTT CTG AGT CCG AAC ATT GAC -3’ 5’-AAA TTT CTA TTT TCC AGC AGT ATA TCG CTT GAC A 3’ N/A
271 5’-ACA AAA GTC CAT GA C TGA GTC CGA ACA TTG AG -3’ 5’- CAA AAG TCC GTG ATG CAG TAT ATC GCT TGA CA -3’ N/A
TSC 0078283 5’-ACT CGA GAG ACA GAT CTG AGT CCG AAC ATT GAG-3’ 5’-GAG ACA CAA GCA TCA TTG CAG TAT ATC GCT TGA CA3’ N/A
M26 5’-AAT TAT CGC AGA GAA CTG AGT CCG AAC ATT GAG -3’ 5’-GAA TTA TCA CAG AGA GCA GTA TAT CGC TTG ACA -3’ N/A
TSC 0156245 5’-CTG AGT CCG AAC ATT GAG TGG CTC CCA GCC C-3’ 5’-GCA GTA TAT CGC TTG ACA GGC TCC CAG CTC-3’ TCC CAA C-3’
M45 5’- ATA GAT AGG CAA AAA GAA ACT GAG TCC GAA CAT TGA G-3’
5’- TAT AGA TAA GCA AAA AGA AAG CAG TAT ATC GCT TGA CA-3’ N/A
PN1 5’-GAG AGC CTT TTG TCC TGA GTC CGA ACA TTG AG-3’ 5’-AGA GCT TTT TGT CGC AGT ATA TCG CTT GAC A-3’ N/A
M145 5’-AGA AAG GCG AGA GCT GAG TCC GAA CAT TGA G-3’ 5’-AAA GAA AGG CAA GAG GCA GTA TAT CGC TTG ACA-3’ N/A
M178 5’-TCA CCA CAG CTC CTC TGA GTC CGA ACA TTG AG -3’ 5’-CAC CAT AGC TCC TAT AGC AGT ATA TCG CTT GAC A-3’ N/A
10831 5’-TCA CAC AGT GTA ACC TGA GTC CGA ACA TTG AG -3’ 5’-TCA CAC AGT ATA ACA GCA GTA TAT CGC TTG ACA-3’ N/A
PN2 5’-AAA CTA ATG CCT TCT CCT CAC TGA GTC CGA ACA TTG AG-3’
5’-ACT AAT GCT TTC TCC TCA GCA GTA TAT CGC TTG ACA3’ N/A
TSC 0131214 5’-ACG TGC ACT TCT CCT GAG TCC GAA CAT TGA G-3’ 5’-CGT GCT CTT CTC GCA GTA TAT CGC TTG ACA-3’ N/A
TSC0421768 5’-CAA TGC GTT CAC ATC TGA GTC CGA ACA TTG AG-3’ 5’-CAA TGG GTT CAC AAG CAG TAT ATC GCT TGA CA-3’ N/A
TSC 0709016 5’- AAC CAC TAA TAT CAC CTG AGT CCG AAC ATT GAG -3’ 5’- AAC CAC TTA TAT CAC GCA GTA TAT CGC TTG ACA -3’ N/A
TSC 0252540 5’-GGT CTG CAC CCC TCT GAG TCC GAA CAT TGA G -3’ 5’- GGT CTG TAC CCC CTT GCA GTA TAT CGC TTG ACA -3’ N/A
TSC 1342445 5’- GCC TCC TGC ATG GTC TGA GTC CGA ACA TTG AG -3’ 5’- GCC TCC AGC ATG GGG CAG TAT ATC GCT TGA CA -3’ N/A
5’-AGC CTG CAC ATG GCC TGT CCC
Final Report 97-LB-VX-004 91
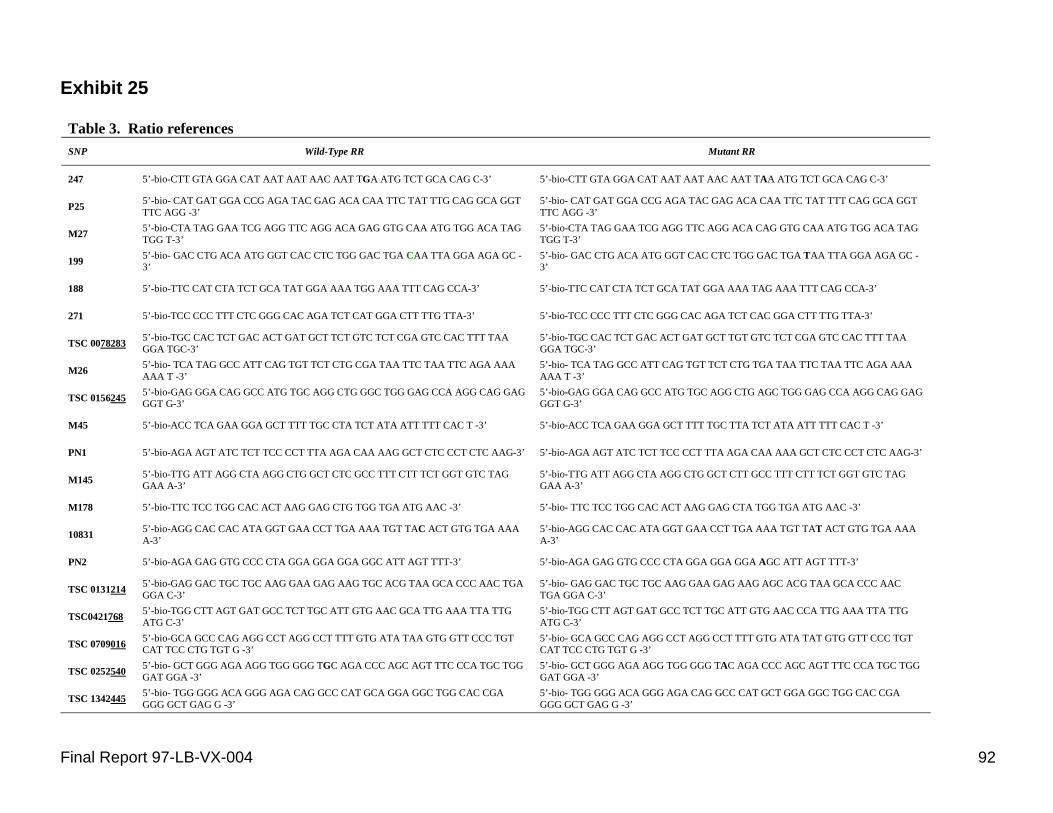
Exhibit 25
Table 3. Ratio references SNP Wild-Type RR Mutant RR
247
P25
M27
199
188
271
TSC 0078283
M26
TSC 0156245
M45
PN1
M145
M178
10831
PN2
TSC 0131214
TSC0421768
TSC 0709016
TSC 0252540
TSC 1342445
5’-bio-CTT GTA GGA CAT AAT AAT AAC AAT TGA ATG TCT GCA CAG C-3’
5’-bio- CAT GAT GGA CCG AGA TAC GAG ACA CAA TTC TAT TTG CAG GCA GGT TTC AGG -3’ 5’-bio-CTA TAG GAA TCG AGG TTC AGG ACA GAG GTG CAA ATG TGG ACA TAG TGG T-3’ 5’-bio- GAC CTG ACA ATG GGT CAC CTC TGG GAC TGA CAA TTA GGA AGA GC 3’
5’-bio-TTC CAT CTA TCT GCA TAT GGA AAA TGG AAA TTT CAG CCA-3’
5’-bio-TCC CCC TTT CTC GGG CAC AGA TCT CAT GGA CTT TTG TTA-3’
5’-bio-TGC CAC TCT GAC ACT GAT GCT TCT GTC TCT CGA GTC CAC TTT TAA GGA TGC-3’ 5’-bio- TCA TAG GCC ATT CAG TGT TCT CTG CGA TAA TTC TAA TTC AGA AAA AAA T -3’ 5’-bio-GAG GGA CAG GCC ATG TGC AGG CTG GGC TGG GAG CCA AGG CAG GAG GGT G-3’
5’-bio-ACC TCA GAA GGA GCT TTT TGC CTA TCT ATA ATT TTT CAC T -3’
5’-bio-AGA AGT ATC TCT TCC CCT TTA AGA CAA AAG GCT CTC CCT CTC AAG-3’
5’-bio-TTG ATT AGG CTA AGG CTG GCT CTC GCC TTT CTT TCT GGT GTC TAG GAA A-3’
5’-bio-TTC TCC TGG CAC ACT AAG GAG CTG TGG TGA ATG AAC -3’
5’-bio-AGG CAC CAC ATA GGT GAA CCT TGA AAA TGT TAC ACT GTG TGA AAA A-3’
5’-bio-AGA GAG GTG CCC CTA GGA GGA GGA GGC ATT AGT TTT-3’
5’-bio-GAG GAC TGC TGC AAG GAA GAG AAG TGC ACG TAA GCA CCC AAC TGA GGA C-3’ 5’-bio-TGG CTT AGT GAT GCC TCT TGC ATT GTG AAC GCA TTG AAA TTA TTG ATG C-3’ 5’-bio-GCA GCC CAG AGG CCT AGG CCT TTT GTG ATA TAA GTG GTT CCC TGT CAT TCC CTG TGT G -3’ 5’-bio- GCT GGG AGA AGG TGG GGG TGC AGA CCC AGC AGT TTC CCA TGC TGG GAT GGA -3’ 5’-bio- TGG GGG ACA GGG AGA CAG GCC CAT GCA GGA GGC TGG CAC CGA GGG GCT GAG G -3’
5’-bio-CTT GTA GGA CAT AAT AAT AAC AAT TAA ATG TCT GCA CAG C-3’
5’-bio- CAT GAT GGA CCG AGA TAC GAG ACA CAA TTC TAT TTT CAG GCA GGT TTC AGG -3’ 5’-bio-CTA TAG GAA TCG AGG TTC AGG ACA CAG GTG CAA ATG TGG ACA TAG TGG T-3’ 5’-bio- GAC CTG ACA ATG GGT CAC CTC TGG GAC TGA TAA TTA GGA AGA GC 3’
5’-bio-TTC CAT CTA TCT GCA TAT GGA AAA TAG AAA TTT CAG CCA-3’
5’-bio-TCC CCC TTT CTC GGG CAC AGA TCT CAC GGA CTT TTG TTA-3’
5’-bio-TGC CAC TCT GAC ACT GAT GCT TGT GTC TCT CGA GTC CAC TTT TAA GGA TGC-3’ 5’-bio- TCA TAG GCC ATT CAG TGT TCT CTG TGA TAA TTC TAA TTC AGA AAA AAA T -3’ 5’-bio-GAG GGA CAG GCC ATG TGC AGG CTG AGC TGG GAG CCA AGG CAG GAG GGT G-3’
5’-bio-ACC TCA GAA GGA GCT TTT TGC TTA TCT ATA ATT TTT CAC T -3’
5’-bio-AGA AGT ATC TCT TCC CCT TTA AGA CAA AAA GCT CTC CCT CTC AAG-3’
5’-bio-TTG ATT AGG CTA AGG CTG GCT CTT GCC TTT CTT TCT GGT GTC TAG GAA A-3’
5’-bio- TTC TCC TGG CAC ACT AAG GAG CTA TGG TGA ATG AAC -3’
5’-bio-AGG CAC CAC ATA GGT GAA CCT TGA AAA TGT TAT ACT GTG TGA AAA A-3’
5’-bio-AGA GAG GTG CCC CTA GGA GGA GGA AGC ATT AGT TTT-3’
5’-bio- GAG GAC TGC TGC AAG GAA GAG AAG AGC ACG TAA GCA CCC AAC TGA GGA C-3’ 5’-bio-TGG CTT AGT GAT GCC TCT TGC ATT GTG AAC CCA TTG AAA TTA TTG ATG C-3’ 5’-bio- GCA GCC CAG AGG CCT AGG CCT TTT GTG ATA TAT GTG GTT CCC TGT CAT TCC CTG TGT G -3’ 5’-bio- GCT GGG AGA AGG TGG GGG TAC AGA CCC AGC AGT TTC CCA TGC TGG GAT GGA -3’ 5’-bio- TGG GGG ACA GGG AGA CAG GCC CAT GCT GGA GGC TGG CAC CGA GGG GCT GAG G -3’
Final Report 97-LB-VX-004 92
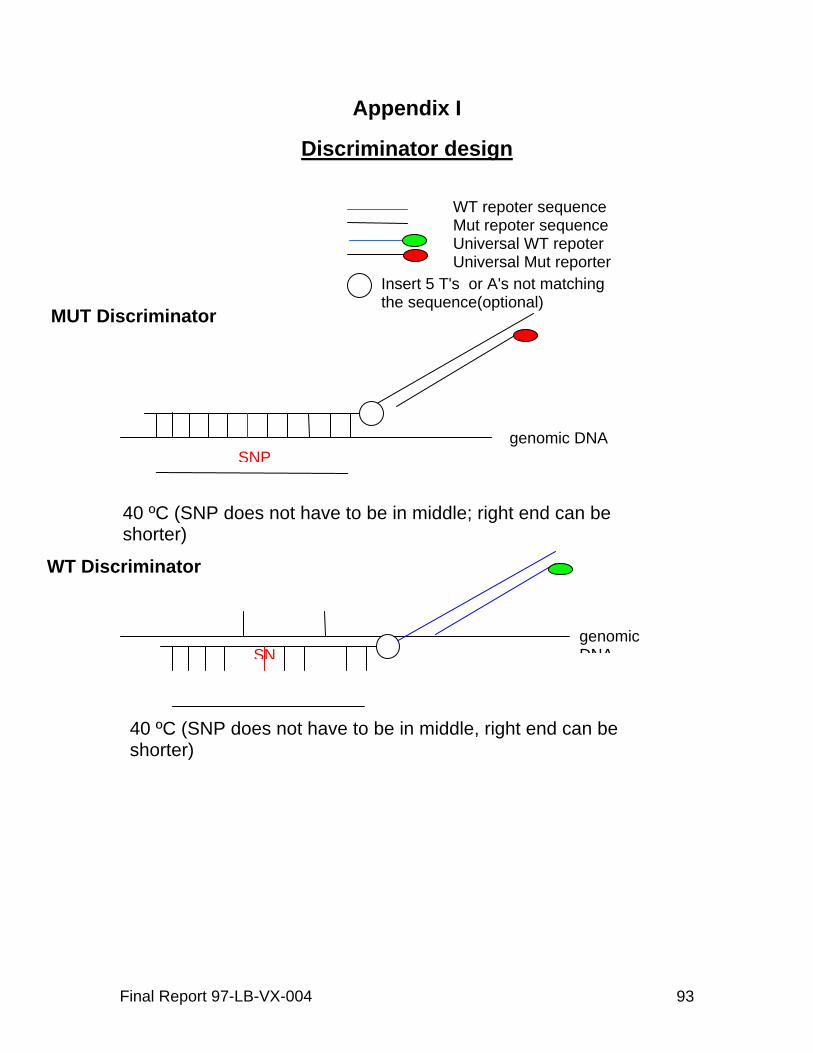
Appendix I
Discriminator design
WT repoter sequence Mut repoter sequence Universal WT repoter Universal Mut reporter
Insert 5 T's or A's not matching the sequence(optional)
genomic DNA
MUT Discriminator
SNP
40 ºC (SNP does not have to be in middle; right end can be shorter)
genomic DNASN
WT Discriminator
40 ºC (SNP does not have to be in middle, right end can be shorter)
Final Report 97-LB-VX-004 93
Guidelines for Discriminator Design:
• Perform Tm calculations, e.g., using the IDT oligo analyzer. http://207.32.43.70/biotools/oligocalc/oligocalc.asp
• Set the discriminator concentration to 100 nM (concentration used in reporter mix).
• Use 50 mM Salt (default) for calculations (Low Salt Buffer) • Stability of Discriminator/genomic DNA complex should be around 40ºC
(for example 36-38ºC) • Try to design WT and Mut discriminator as close in Tm as possible, by
adjusting length • Try to design discriminator for different SNPs used in the same reporter
mix as close as possible in Tm value to receive a common discrimination temperature
Final Report 97-LB-VX-004 94
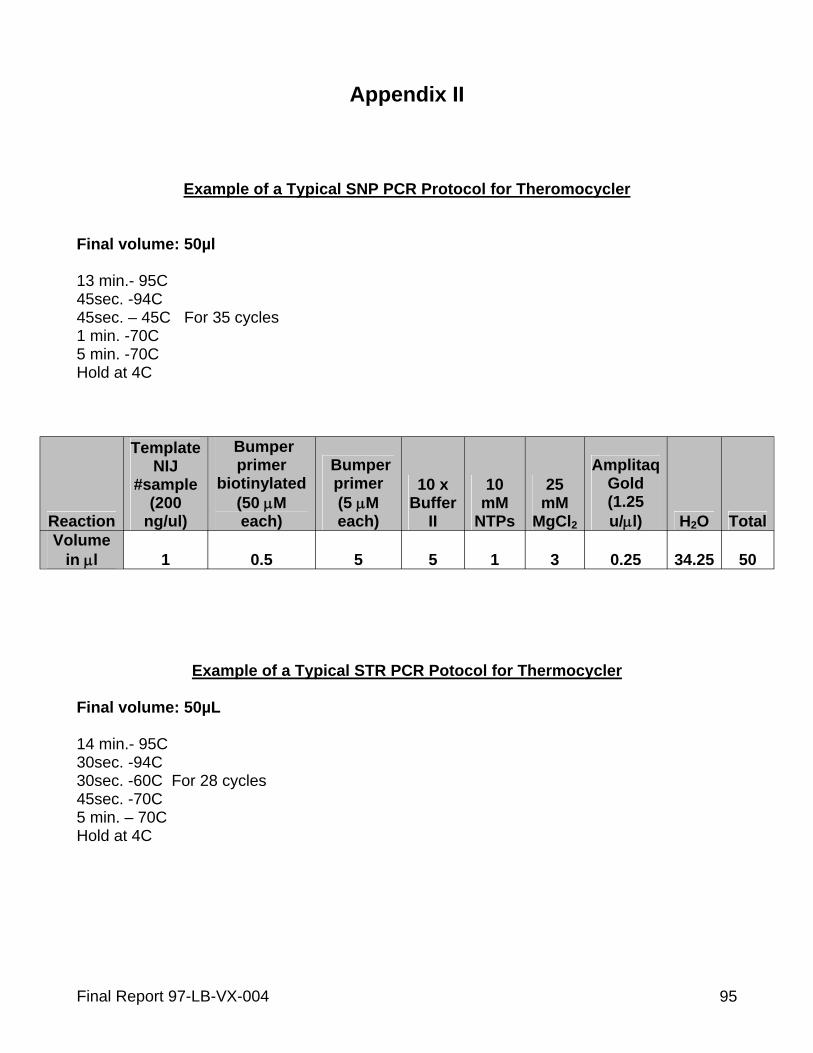
Appendix II
Example of a Typical SNP PCR Protocol for Theromocycler
Final volume: 50µl
13 min.- 95C 45sec. -94C 45sec. – 45C For 35 cycles 1 min. -70C 5 min. -70C Hold at 4C
Template NIJ
Bumper primer Bumper Amplitaq
#sample (200
biotinylated (50 μM
primer (5 μM
10 x Buffer
10 mM
25 mM
Gold (1.25
Reaction ng/ul) each) each) II NTPs MgCl2 u/μl) H2O Total Volume
in μl 1 0.5 5 5 1 3 0.25 34.25 50
Example of a Typical STR PCR Potocol for Thermocycler
Final volume: 50µL
14 min.- 95C 30sec. -94C 30sec. -60C For 28 cycles 45sec. -70C 5 min. – 70C Hold at 4C
Final Report 97-LB-VX-004 95
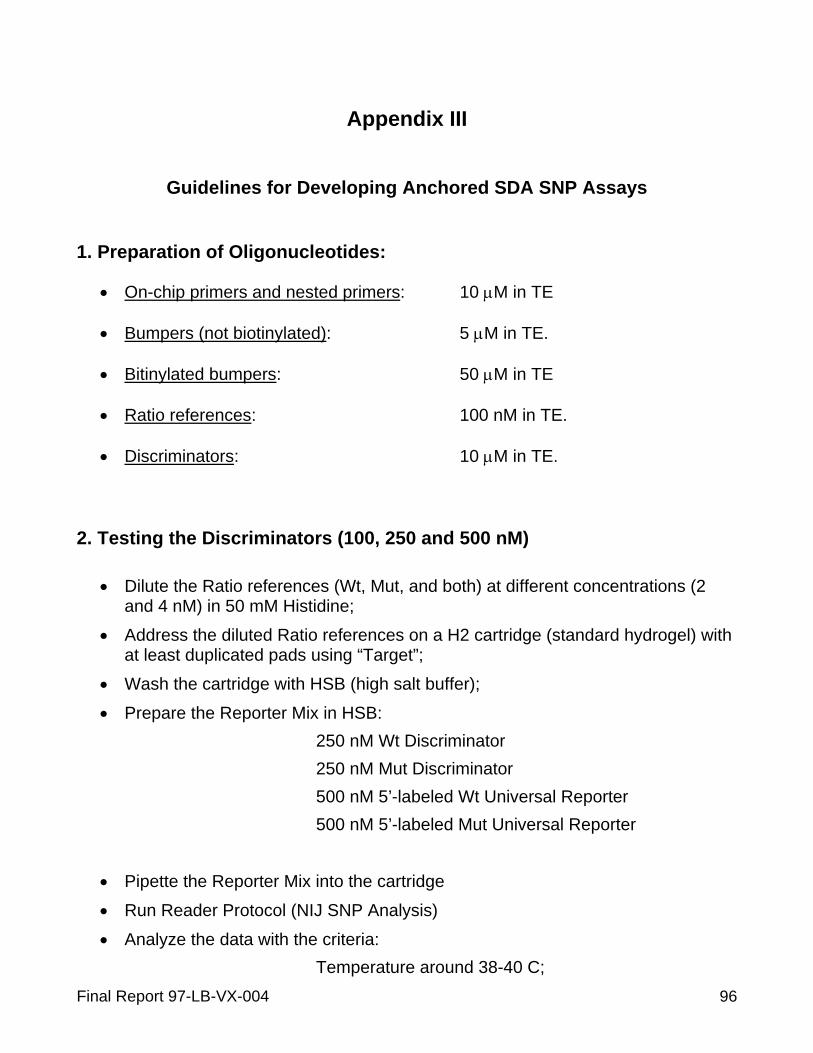
Appendix III
Guidelines for Developing Anchored SDA SNP Assays
1. Preparation of Oligonucleotides:
• On-chip primers and nested primers: 10 μM in TE
• Bumpers (not biotinylated): 5 μM in TE.
• Bitinylated bumpers: 50 μM in TE
• Ratio references: 100 nM in TE.
• Discriminators: 10 μM in TE.
2. Testing the Discriminators (100, 250 and 500 nM)
• Dilute the Ratio references (Wt, Mut, and both) at different concentrations (2 and 4 nM) in 50 mM Histidine;
• Address the diluted Ratio references on a H2 cartridge (standard hydrogel) with at least duplicated pads using “Target”;
• Wash the cartridge with HSB (high salt buffer);
• Prepare the Reporter Mix in HSB: 250 nM Wt Discriminator 250 nM Mut Discriminator 500 nM 5’-labeled Wt Universal Reporter 500 nM 5’-labeled Mut Universal Reporter
• Pipette the Reporter Mix into the cartridge
• Run Reader Protocol (NIJ SNP Analysis)
• Analyze the data with the criteria: Temperature around 38-40 C;
Final Report 97-LB-VX-004 96
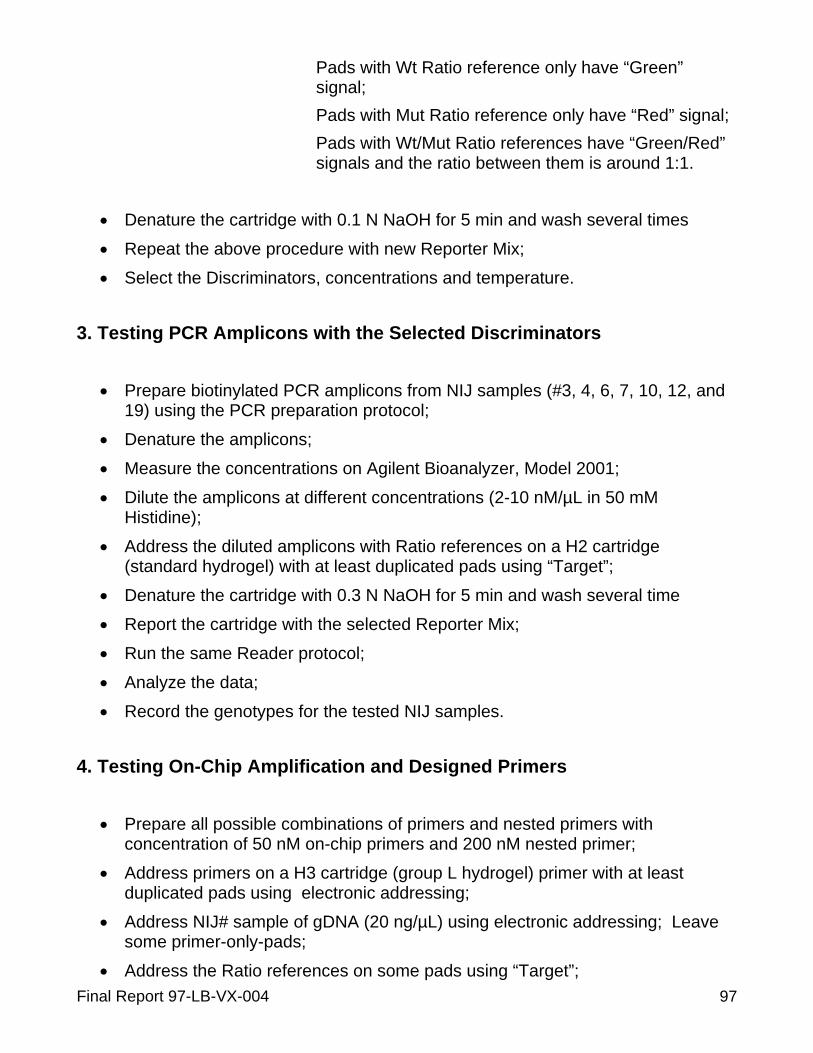
Pads with Wt Ratio reference only have “Green” signal; Pads with Mut Ratio reference only have “Red” signal; Pads with Wt/Mut Ratio references have “Green/Red” signals and the ratio between them is around 1:1.
• Denature the cartridge with 0.1 N NaOH for 5 min and wash several times
• Repeat the above procedure with new Reporter Mix;
• Select the Discriminators, concentrations and temperature.
3. Testing PCR Amplicons with the Selected Discriminators
• Prepare biotinylated PCR amplicons from NIJ samples (#3, 4, 6, 7, 10, 12, and 19) using the PCR preparation protocol;
• Denature the amplicons;
• Measure the concentrations on Agilent Bioanalyzer, Model 2001;
• Dilute the amplicons at different concentrations (2-10 nM/µL in 50 mM Histidine);
• Address the diluted amplicons with Ratio references on a H2 cartridge (standard hydrogel) with at least duplicated pads using “Target”;
• Denature the cartridge with 0.3 N NaOH for 5 min and wash several time
• Report the cartridge with the selected Reporter Mix;
• Run the same Reader protocol;
• Analyze the data;
• Record the genotypes for the tested NIJ samples.
4. Testing On-Chip Amplification and Designed Primers
• Prepare all possible combinations of primers and nested primers with concentration of 50 nM on-chip primers and 200 nM nested primer;
• Address primers on a H3 cartridge (group L hydrogel) primer with at least duplicated pads using electronic addressing;
• Address NIJ# sample of gDNA (20 ng/µL) using electronic addressing; Leave some primer-only-pads;
• Address the Ratio references on some pads using “Target”; Final Report 97-LB-VX-004 97
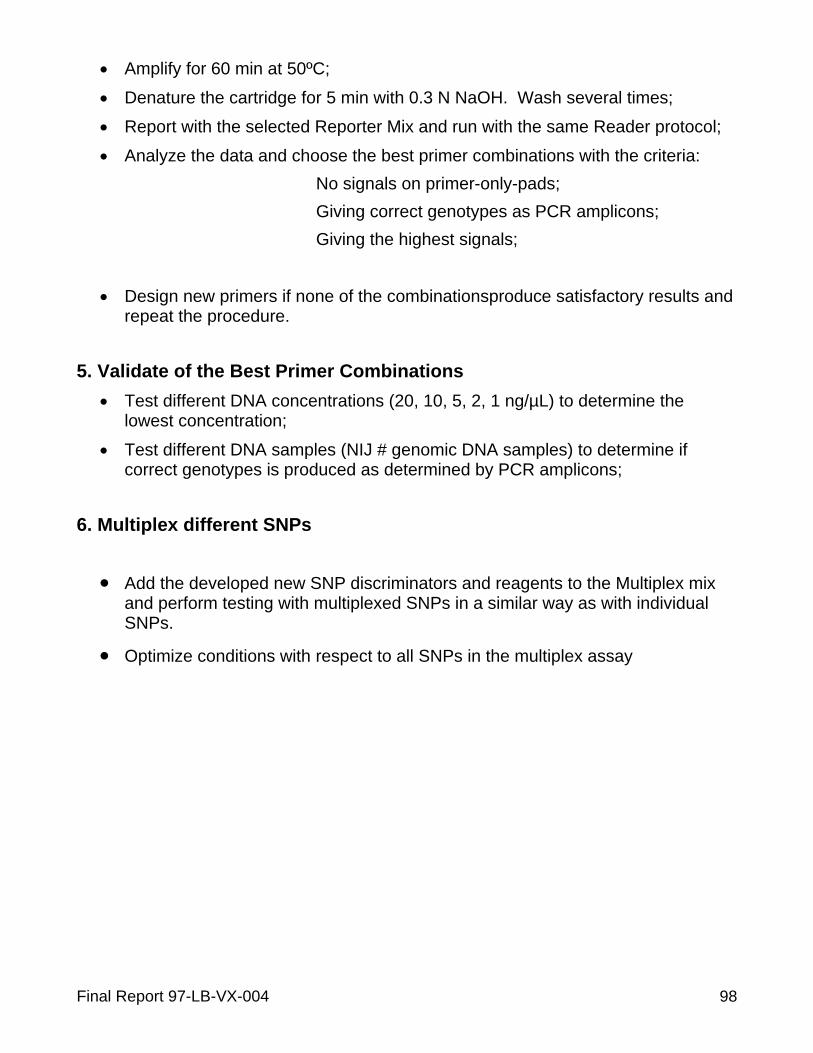
• Amplify for 60 min at 50ºC;
• Denature the cartridge for 5 min with 0.3 N NaOH. Wash several times;
• Report with the selected Reporter Mix and run with the same Reader protocol;
• Analyze the data and choose the best primer combinations with the criteria: No signals on primer-only-pads; Giving correct genotypes as PCR amplicons; Giving the highest signals;
• Design new primers if none of the combinationsproduce satisfactory results and repeat the procedure.
5. Validate of the Best Primer Combinations • Test different DNA concentrations (20, 10, 5, 2, 1 ng/µL) to determine the
lowest concentration;
• Test different DNA samples (NIJ # genomic DNA samples) to determine if correct genotypes is produced as determined by PCR amplicons;
6. Multiplex different SNPs
• Add the developed new SNP discriminators and reagents to the Multiplex mix and perform testing with multiplexed SNPs in a similar way as with individual SNPs.
• Optimize conditions with respect to all SNPs in the multiplex assay
Final Report 97-LB-VX-004 98

Appendix IV
Anchored SDA Workflow
1. Addressing
Primer Mix • 50 nM each primer; 200 nM nested primer; • 300 nA for 60s
gDNA • 10 ng/μL; • Denatured at 95o C for 20 min; • 300 nA for 120s
Ratio References • 4 nM of each ratio reference in 50 mM histidine; • 300 nA for 60s
Final Report 97-LB-VX-004 99
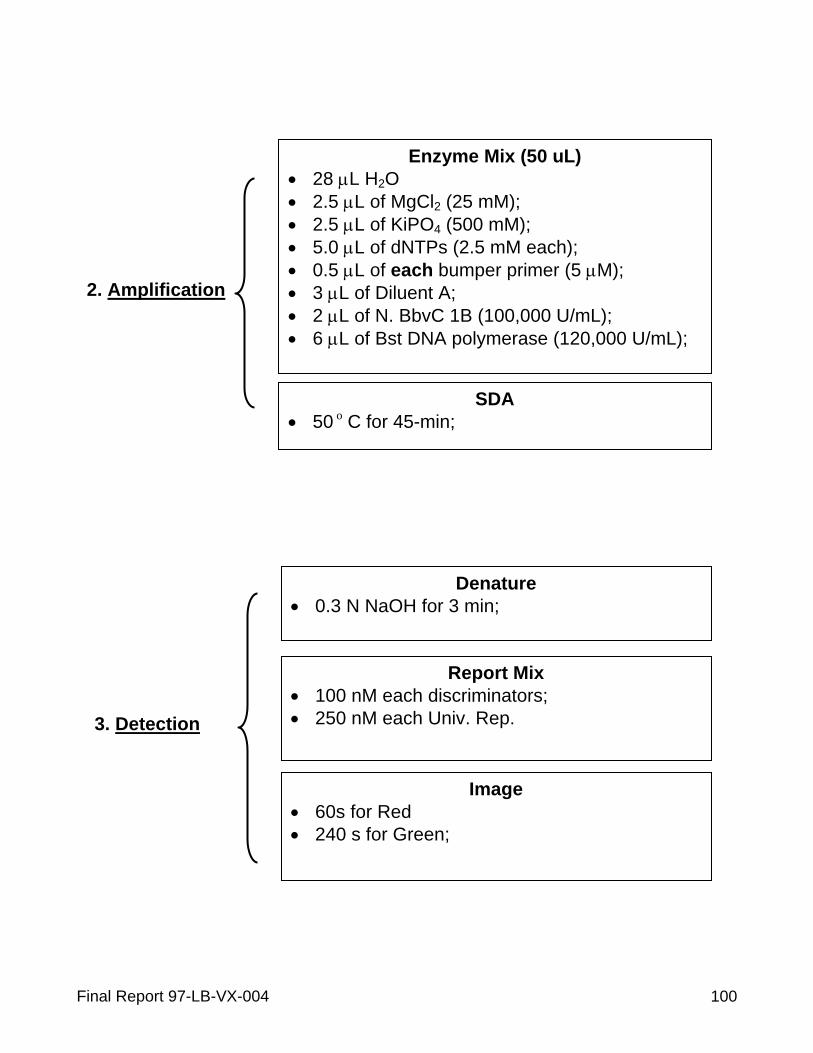
Enzyme Mix (50 uL) • 28 μL H2O • 2.5 μL of MgCl2 (25 mM); • 2.5 μL of KiPO4 (500 mM); • 5.0 μL of dNTPs (2.5 mM each); • 0.5 μL of each bumper primer (5 μM); • 3 μL of Diluent A; • 2 μL of N. BbvC 1B (100,000 U/mL); • 6 μL of Bst DNA polymerase (120,000 U/mL);
SDA • 50 o C for 45-min;
2. Amplification
Denature • 0.3 N NaOH for 3 min;
Report Mix • 100 nM each discriminators; • 250 nM each Univ. Rep.
Image • 60s for Red • 240 s for Green;
3. Detection
Final Report 97-LB-VX-004 100


![A new ADC chip Vulcan for PMT readout - Indico [Home]indico.ihep.ac.cn/event/6156/session/3/contribution/63/... · · 2016-11-02A new ADC chip Vulcan for PMT readout ... Juno Detector](https://img.pdfslide.us/doc/110x75/5ad9d82c7f8b9a53618bca4d/a-new-adc-chip-vulcan-for-pmt-readout-indico-home-new-adc-chip-vulcan-for-pmt.jpg)