Embed Size (px)
Citation preview
RESEARCH PAPER
A chemometric approach to characterization of ionic liquidsfor gas chromatography
Jaime González-Álvarez & Juan José Mangas-Alonso &
Pilar Arias-Abrodo & María Dolores Gutiérrez-Álvarez
Received: 28 November 2013 /Revised: 14 February 2014 /Accepted: 6 March 2014 /Published online: 30 March 2014# Springer-Verlag Berlin Heidelberg 2014
Abstract A chemometric study was carried out to character-ize three ionic liquid types (ILs) with hexacationicimidazolium, polymeric imidazolium, and phosphonium cat-ionic cores, using a range of contra-anions such as halogens,thiocyanate, boron anions, triflate, and bistriflimide. The sol-vation parameter model developed by Abraham et al., unsu-pervised techniques as cluster analysis (CA), and supervisedtechniques as linear discriminant analysis (LDA), step-LDA,quadratic discriminant analysis (QDA), and multivariate re-gression techniques as discriminant partial least squares (D-PLS), or multiple linear regression (MLR) were used to char-acterize the functionalized ILs above. CA established twomain groups of phases, those with an acidic H-bond and thosewith basic ones. Once detected, the two natural groups, alinear and quadratic delimiters with good classification(>96 %) and prediction (>92 %) capacities were computed.The use of step-LDA technique allowed us to establish that a,b, and s solvation parameters were the most discriminantvariables. These variables were used for modeling purposes,and a D-PLS and MLR models were constructed using abinary response. The explained variance of categorical vari-able by the model validated by cross-validation was 65%, and94.5 % of ILs were correctly predicted. IL characterization
carried out would allow the appropriate selection of phases forgas chromatography (GC).
Keywords Chemometric techniques . Ionic liquids .
Stationary phases
Introduction
Research into ionic liquid types (ILs) has grown extraordi-narily in recent years due to the unique properties (highviscosity, thermal stability, and negligible vapor pressure) thatmake ILs a new class of stationary phases for gas chromatog-raphy (GC) [1–5]. These properties, and the possibility ofmodifying their chemical composition by simple syntheticstrategies, have allowed the use of ILs in areas of chemistrysuch as electrochemistry [6], mass spectrometry [7], reactionsolvents [8], and catalysis [9–11].
The selectivity of stationary phases is defined as theircapacity to enter into specific intermolecular interactions suchas dispersion, hydrogen bond formation, and orientation. ILsshow a dual nature when used as the stationary phase for GC,making the interaction with both polar and nonpolar com-pounds possible when they act as polar or nonpolar stationaryphases, respectively [12].
Solvation parameter models are well established as a usefultool for obtaining quantitative structure–property relationshipsfor chemical, biomedical, and environmental processes.Various methods have been developed to characterize thesolvation behavior of liquids [13]. These methods includeRohrschneider–McReynolds classification system, solvationparameters model, and the measurement of ILs thermodynam-ic parameters such as activity coefficients at infinite dilution[14, 15]. Initially, the Rohrschneider–McReynolds approachwas used [3, 16]. This model assumes that intermolecularforces are additive and can be obtained by the contribution
Electronic supplementary material The online version of this article(doi:10.1007/s00216-014-7754-3) contains supplementary material,which is available to authorized users.
J. González-Álvarez (*) : P. Arias-Abrodo :M. D. Gutiérrez-Álvarez (*)Department of Physical and Analytical Chemistry, University ofOviedo, Julián Clavería 8, 33006 Oviedo, Spaine-mail: [email protected]: [email protected]
J. J. Mangas-AlonsoServicio Regional de Investigación y Desarrollo Agroalimentario(SERIDA), Carretera de Oviedo s/n, 33300 Villaviciosa, Spain
Anal Bioanal Chem (2014) 406:3149–3155DOI 10.1007/s00216-014-7754-3
of different individual interactions in a nonpolar referencephase such as squalene, for instance. In this method, theuse of only one probe molecule per interaction meansthat the reliability of the values obtained is statisticallylow.
In the early 1980s, Taft and Kamlet [17, 18] developed thebasic concept of linear solvation energy relationships(LSERs). The most recent representation of the LSER modelwas proposed by Abraham and coworkers [19, 20]. In thiscase, the different types of solvent–solute interactions areassessed separately and can be mathematically evaluated withEq. (1):
log k ¼ c þ eE þ sS þ aA þ bB þ 1L ð1Þ
where the capital letters represent the solutes properties andthe lower case letters the complementary properties of thestationary phase. Solute descriptor values for a number ofsolutes have been evaluated and published in the literature[19]. These descriptors values are known for a number ofcommon compounds these have been calculated using a vari-ety of experimental or estimated free-energy properties mostoften taken from the general literature and when they are usedto calibrate additional systems perpetuate the descriptor errorproblem. To avoid the small errors in the descriptors, Pooleand coworkers optimized these descriptors by GC, reversed-phase liquid chromatography and micellar electrokineticchromatography [20].
The classification of GC columns based on their solvationparameters is very important for the prediction of the retentionof solutes on different phases. Chemometric methods, bothunsupervised and supervised, such as cluster analysis (CA),discriminant analysis, or regression techniques, such as partialleast squares (PLS) or multiple linear regression (MLR) areuseful for identifying the criteria affecting retention and thepossible correlations between these criteria, and for groupingthe stationary phases in a two- or three-dimensional space[21–23].
The activity coefficient at infinite dilution (γ∞) providesinformation about the intermolecular energy between a soluteand a solvent. Values of γ∞ are important in separationprocesses, in particular for the selection of solvents for extrac-tion and extractive distillation. The equation developed byEverett and Cruickshank [24] is used for determining of γ∞.
These chemometric methods are useful tool whensearching for natural groups or classes within a database andfor the detection of any relationship between these classes andthe variables studied, such as between ILs and different sol-vation parameters.
The determination of factors that are important in thecharacterization of solvent properties of ILs stationaryphases has become the goal of recent investigation.The aim of this study is to use the unsupervised and
supervised chemometric techniques to categorize variousILs that have interesting applications in GC because oftheir solvent properties.
Materials and methods
Untreated fused silica capillaries (0.25 mm i.d.) werepurchased from Supelco (Madrid, Spain). Chemical re-agents, all of which were used without further purifica-tion, were purchased from Sigma-Aldrich (Madrid,Spain). Methanol, dichloromethane, hydrochloric acid,sodium hydroxide, and n-hexane were obtained fromMerck (Darmstadt, Germany).
Synthesis and structure of ILs The synthesis and characteri-zation of ILs have been reported in other studies [2, 25, 26].The structures of the ILs included in this study are given asElectronic supplementary material (Figs. S1 and S3), and aredescribed as follows:
1. Hexacationic (H) imidazolium ILs: IL1H (±) trans-cyclohexanol imidazolium, and bis(trifluoromethane)sulfonimide (NTF2
−) as contra-anion; IL2H (±) trans-cyclohexyl acetate imidazolium, and NTF2
− as contra-anion; IL3H (±) trans-cyclopentanol imidazolium, andNTF2
− as contra-anion; IL4H (±) cis-cyclopentanolimidazolium, and NTF2
− as contra-anion; IL5H (±) trans-cyclohexanol imidazolium, and triflate (OTf−) as contra-anion (Fig. S1, Electronic supplementary material).
2. Polymeric imidazolium ILs (I): IL1I 2-(1H-imidazol-1-3-butenyl) cyclohexanol, and bromide (Br−) as contra-anion; IL2I 2-(1H-imidazol-1-3-butenyl) cyclohexanol,and NTF2
− as contra-anion; IL3I 2-(1H-imidazol-1-3-butenyl) cyclohexanol, and thiocyanate (SCN−) ascontra-anion; IL4I 2-(1H-imidazol-1-3-butenyl)cyclohexanol, and tetrafluoroborate (BF4
−) as contra-anion; IL5I 2-(1H-imidazol-1-allyl) cyclohexanol, andNTF2
− as contra-anion; IL6I 2-(1H-imidazol-1-7-octenyl)cyclohexanol, and NTF2
− as contra-anion; IL7I 2-(1H-imidazol-1-vinyl benzyl) cyclohexanol, and NTF2
− ascontra-anion.
3. Phosphonium (P) ILs: IL1P tributyl allyl phosphonium,and Br− as contra-anion; IL2P tributyl allyl phosphonium,and NTF2
− as contra-anion; IL3P tributyl allyl phospho-nium, and triflate (OTf−) as contra-anion; IL4P tributylallyl phosphonium, and tetraphenylborate (BAr4−) ascontra-anion; IL5P tributyl crotyl phosphonium, and chlo-ride (Cl−) as contra-anion; IL6P tributyl crotyl phospho-nium, and NTF2
− as contra-anion; IL7P tributyl methallylphosphonium, and NTF2
− as contra-anion; IL8P diphenyldiallyl phosphonium, and NTF2
− as contra-anion (Fig. S3,Electronic supplementary material).
3150 J. González-Álvarez et al.
Column preparation The coating of the GC columns wasperformed using the static method on a 10-m capillary col-umns (0.25 mm i.d.), dissolving the ILs in dicholoromethane.Before performing the static coating, the capillaries werepretreated with sodium hydroxide (NaOH 1 M) and hydro-chloric acid (HCl 1 M). Subsequently, one end of the columnwas sealed and the other end was connected to a vacuumsystem to remove the solvent. The vacuum was manteined at4 loops/h. The column was then conditioned from 40 to150 °C at a rate of 1 °C min−1. IL column efficiencies weredetermined using naphthalene at 100 °C and were found to behigher than 2,000 plates m−1 [2, 26, 27].
An estimation of the film thickness of the stationary phasefor capillary coated by the static method can be obtained fromEquation df=dcc/400 (see references [5, 21, 22]), where dc isthe diameter of the capillary tubing (in micrometers), and c isthe percentage by weight concentration of the stationary phasedissolved in an appropriate solvent. The capillary columnswere prepared using the percentage of ILs that providesgreatest separation efficiencies.
Gas chromatographic conditions The GC equipment usedwas a Shimadzu GC-2010 Gas Chromatograph (Shimadzu,Kyoto, Japan) equipped with a flame ionization detector.Analyses of probe molecules were performed with helium ascarrier gas at a flow rate of 1 mLmin−1 and a split ratio of 100/1. Injector and detector temperatures were 250 and 300 °C,respectively. Methane was used to measure the column hold-up time.
Solvation parameters evaluation Solvation parameters weredetermined using 41 probe molecules. As the more volatileprobe compounds eluted with the dead volume at 100 °C, theywere not included in the final data set. In addition, some of theprobe molecules suffered high peak asymmetry factors at70 °C and so were likewise rejected from the data set. Thesolute descriptors for the 41 probe molecules are listed inTable S1 (Electronic supplementary material) [28]. Probemolecules were injected and retention times were measuredin triplicate.
Methane was used to measure the column hold-up timeand, in all cases, the measurement of the retention time whennaphthalene was injected at 100 °C each 50 runs, indicatedthat the columns coated with the new phases endured series of400 runs without loss of activity.
With the aim of evaluating the GC columns constructedfrom the different ILs described above, each probe moleculewas injected into the column at different temperatures: 70 and100 °C, for H ILs; 50, 70, and 100 °C, for I ILs; and 50, 80,and 110 °C for P ILs.
Statistics and database To evaluate solvation parameters,MLR analyses were performed using Statgraphics Centurion
XV for Windows, version 15.2.06. The linearity regression(R2) for all evaluations was ≥0.97.
For ILs characterization, we used a database consisting of55 rows (three ILs evaluated at different temperatures) andfive columns (system constants, a, b, s, l, and e). Data weremean-centered before CA; CA, linear discriminant analysis(LDA), quadratic discriminant analysis (QDA), and step-LDAwere carried out by means of the V-PARVUS 2007 statisticalpackage [29]; and discriminant partial least regression (D-PLS) and MLR were carried out by means of TheUnscrambler® (v9.2, 2005 Camo Process AS, Norway) mul-tivariate software.
Results and discussion
We have used the solvation parameter model developed byAbraham et al. to characterize the different functionalized ILsas stationary phases for GC. The retention factor (k; see Eq. 1)of a given solute at a specific temperature is determinedchromatographically. E, S, A, B, and L are solute descriptorsthat represent excess molar refraction, dipolarity, H-bondacidity, H-bond basicity, and the gas-hexadecane partitioncoefficient at 298 K, respectively. The systems constants (e,s, a, b, and l) were computed byMLR analysis. These measurethe strength of each solvation interaction between the analytestested and the different stationary phases evaluated, namely n/π interactions (e-term), dipolarity/polarizability (s-term), ba-sicity of H-bonding (a-term), acidity of H-bonding (b-term),and dispersion forces (l-term). l-term also measures the phaseability to distinguish or to separate homologues in any homol-ogous series, while the intercept (c-term) can be used todetermine and verify the phase ratio of the column.
Tables S2 and S4 (see Electronic supplementary material)display the statistics of the database. As we can see, three ofthe five interaction parameter coefficients, namely a-term, s-term, and b-term have the greatest magnitude for all ILs. e-term is negative for P PILs, implying that the interactionbetween the solute and the IL stationary phase through π–πand nonbonding electrons is minimal compared with othertypes of interactions. In addition, the l parameter is positive, soLondon interactions are significant.
Cluster analysis CA is a unsupervised chemometric tech-nique that allows us to find natural sample groupings in adatabase. With this aim in mind, an exploratory CA wascarried out of the observations (ILs at different temperatures).A 55×55 matrix consisting of similarities of correlation coef-ficients, where each observation was represented by a five-dimensional vector (five-system constants), was used for hi-erarchical clustering on the basis of the average linkage-weighted, pair group method.
A chemometric approach to characterization of ionic liquids 3151
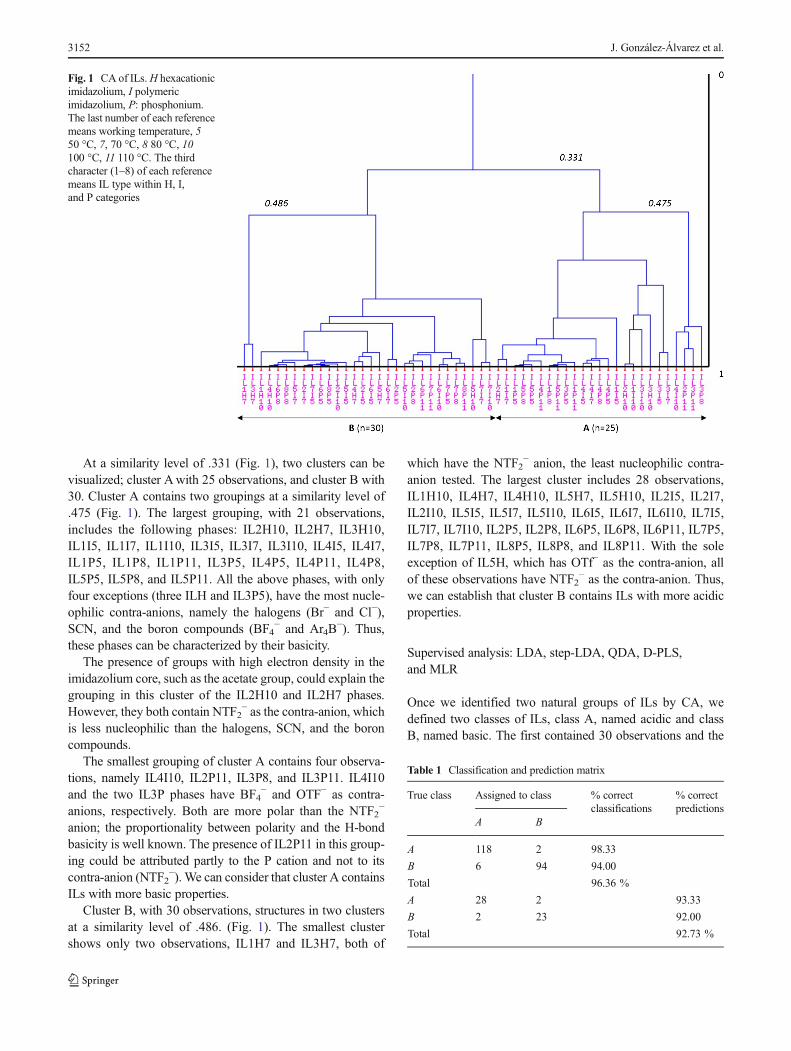
At a similarity level of .331 (Fig. 1), two clusters can bevisualized; cluster Awith 25 observations, and cluster B with30. Cluster A contains two groupings at a similarity level of.475 (Fig. 1). The largest grouping, with 21 observations,includes the following phases: IL2H10, IL2H7, IL3H10,IL1I5, IL1I7, IL1I10, IL3I5, IL3I7, IL3I10, IL4I5, IL4I7,IL1P5, IL1P8, IL1P11, IL3P5, IL4P5, IL4P11, IL4P8,IL5P5, IL5P8, and IL5P11. All the above phases, with onlyfour exceptions (three ILH and IL3P5), have the most nucle-ophilic contra-anions, namely the halogens (Br− and Cl−),SCN, and the boron compounds (BF4
− and Ar4B−). Thus,
these phases can be characterized by their basicity.The presence of groups with high electron density in the
imidazolium core, such as the acetate group, could explain thegrouping in this cluster of the IL2H10 and IL2H7 phases.However, they both contain NTF2
− as the contra-anion, whichis less nucleophilic than the halogens, SCN, and the boroncompounds.
The smallest grouping of cluster A contains four observa-tions, namely IL4I10, IL2P11, IL3P8, and IL3P11. IL4I10and the two IL3P phases have BF4
− and OTF− as contra-anions, respectively. Both are more polar than the NTF2
−
anion; the proportionality between polarity and the H-bondbasicity is well known. The presence of IL2P11 in this group-ing could be attributed partly to the P cation and not to itscontra-anion (NTF2
−). We can consider that cluster A containsILs with more basic properties.
Cluster B, with 30 observations, structures in two clustersat a similarity level of .486. (Fig. 1). The smallest clustershows only two observations, IL1H7 and IL3H7, both of
which have the NTF2− anion, the least nucleophilic contra-
anion tested. The largest cluster includes 28 observations,IL1H10, IL4H7, IL4H10, IL5H7, IL5H10, IL2I5, IL2I7,IL2I10, IL5I5, IL5I7, IL5I10, IL6I5, IL6I7, IL6I10, IL7I5,IL7I7, IL7I10, IL2P5, IL2P8, IL6P5, IL6P8, IL6P11, IL7P5,IL7P8, IL7P11, IL8P5, IL8P8, and IL8P11. With the soleexception of IL5H, which has OTf− as the contra-anion, allof these observations have NTF2
− as the contra-anion. Thus,we can establish that cluster B contains ILs with more acidicproperties.
Supervised analysis: LDA, step-LDA, QDA, D-PLS,and MLR
Once we identified two natural groups of ILs by CA, wedefined two classes of ILs, class A, named acidic and classB, named basic. The first contained 30 observations and the
Fig. 1 CA of ILs.H hexacationicimidazolium, I polymericimidazolium, P: phosphonium.The last number of each referencemeans working temperature, 550 °C, 7, 70 °C, 8 80 °C, 10100 °C, 11 110 °C. The thirdcharacter (1–8) of each referencemeans IL type within H, I,and P categories
Table 1 Classification and prediction matrix
True class Assigned to class % correctclassifications
% correctpredictions
A B
A 118 2 98.33
B 6 94 94.00
Total 96.36 %
A 28 2 93.33
B 2 23 92.00
Total 92.73 %
3152 J. González-Álvarez et al.
second 25. We used several supervised chemometric tech-niques such as LDA, step-LDA, QDA, D-PLS, and MLR toconstruct models of pattern recognition and classificationrules for ILs.
Linear discriminan analysis LDA is a classification methodof searching the optimal linear combination of original vari-ables that best separate the classes established, in our caseacidic and basic classes. LDA analysis works taking in ac-count that all classes or categories have the same covariancematrix. Discriminant scores are computed from density func-tion, and each object is classified on the basis of discriminantscores computed in each class. To validate the classificationrule, we used cross-validation methodology with four groupsfor cancelation.
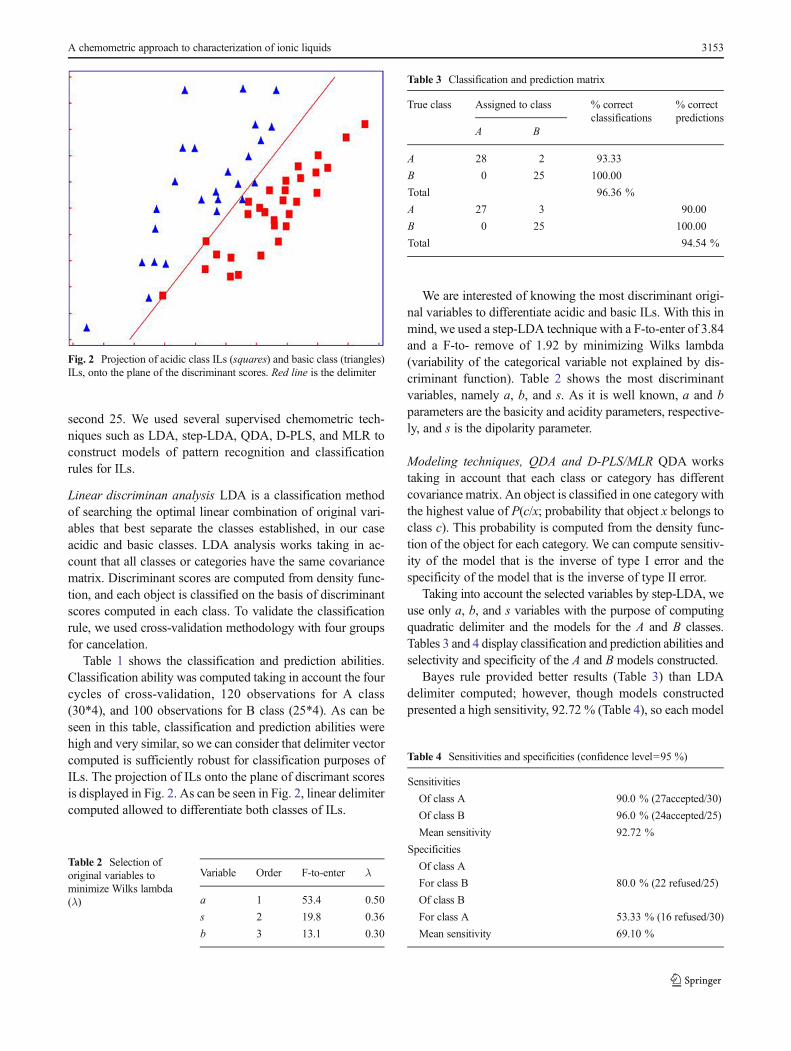
Table 1 shows the classification and prediction abilities.Classification ability was computed taking in account the fourcycles of cross-validation, 120 observations for A class(30*4), and 100 observations for B class (25*4). As can beseen in this table, classification and prediction abilities werehigh and very similar, so we can consider that delimiter vectorcomputed is sufficiently robust for classification purposes ofILs. The projection of ILs onto the plane of discrimant scoresis displayed in Fig. 2. As can be seen in Fig. 2, linear delimitercomputed allowed to differentiate both classes of ILs.
We are interested of knowing the most discriminant origi-nal variables to differentiate acidic and basic ILs. With this inmind, we used a step-LDA technique with a F-to-enter of 3.84and a F-to- remove of 1.92 by minimizing Wilks lambda(variability of the categorical variable not explained by dis-criminant function). Table 2 shows the most discriminantvariables, namely a, b, and s. As it is well known, a and bparameters are the basicity and acidity parameters, respective-ly, and s is the dipolarity parameter.
Modeling techniques, QDA and D-PLS/MLR QDA workstaking in account that each class or category has differentcovariance matrix. An object is classified in one category withthe highest value of P(c/x; probability that object x belongs toclass c). This probability is computed from the density func-tion of the object for each category. We can compute sensitiv-ity of the model that is the inverse of type I error and thespecificity of the model that is the inverse of type II error.
Taking into account the selected variables by step-LDA, weuse only a, b, and s variables with the purpose of computingquadratic delimiter and the models for the A and B classes.Tables 3 and 4 display classification and prediction abilities andselectivity and specificity of the A and B models constructed.
Bayes rule provided better results (Table 3) than LDAdelimiter computed; however, though models constructedpresented a high sensitivity, 92.72 % (Table 4), so each model
Fig. 2 Projection of acidic class ILs (squares) and basic class (triangles)ILs, onto the plane of the discriminant scores. Red line is the delimiter
Table 2 Selection oforiginal variables tominimize Wilks lambda(λ)
Variable Order F-to-enter λ
a 1 53.4 0.50
s 2 19.8 0.36
b 3 13.1 0.30
Table 3 Classification and prediction matrix
True class Assigned to class % correctclassifications
% correctpredictions
A B
A 28 2 93.33
B 0 25 100.00
Total 96.36 %
A 27 3 90.00
B 0 25 100.00
Total 94.54 %
Table 4 Sensitivities and specificities (confidence level=95 %)
Sensitivities
Of class A 90.0 % (27accepted/30)
Of class B 96.0 % (24accepted/25)
Mean sensitivity 92.72 %
Specificities
Of class A
For class B 80.0 % (22 refused/25)
Of class B
For class A 53.33 % (16 refused/30)
Mean sensitivity 69.10 %
A chemometric approach to characterization of ionic liquids 3153
accepted a high percentage of samples belonging to ownmodel, type II error computed for class B was very high, asthis model only refused 53.33 % of the samples belonging tomodel A (Table 4).
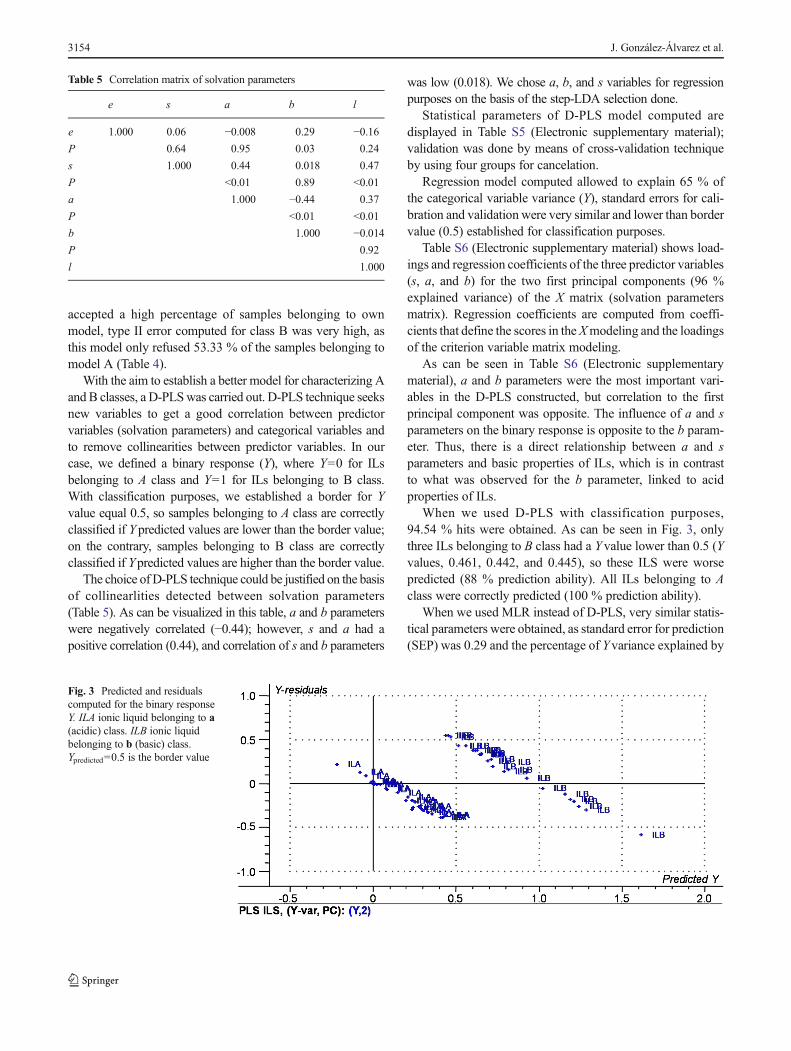
With the aim to establish a better model for characterizing Aand B classes, a D-PLSwas carried out. D-PLS technique seeksnew variables to get a good correlation between predictorvariables (solvation parameters) and categorical variables andto remove collinearities between predictor variables. In ourcase, we defined a binary response (Y), where Y=0 for ILsbelonging to A class and Y=1 for ILs belonging to B class.With classification purposes, we established a border for Yvalue equal 0.5, so samples belonging to A class are correctlyclassified if Ypredicted values are lower than the border value;on the contrary, samples belonging to B class are correctlyclassified if Ypredicted values are higher than the border value.
The choice of D-PLS technique could be justified on the basisof collinearlities detected between solvation parameters(Table 5). As can be visualized in this table, a and b parameterswere negatively correlated (−0.44); however, s and a had apositive correlation (0.44), and correlation of s and b parameters
was low (0.018). We chose a, b, and s variables for regressionpurposes on the basis of the step-LDA selection done.
Statistical parameters of D-PLS model computed aredisplayed in Table S5 (Electronic supplementary material);validation was done by means of cross-validation techniqueby using four groups for cancelation.
Regression model computed allowed to explain 65 % ofthe categorical variable variance (Y), standard errors for cali-bration and validation were very similar and lower than bordervalue (0.5) established for classification purposes.
Table S6 (Electronic supplementary material) shows load-ings and regression coefficients of the three predictor variables(s, a, and b) for the two first principal components (96 %explained variance) of the X matrix (solvation parametersmatrix). Regression coefficients are computed from coeffi-cients that define the scores in the Xmodeling and the loadingsof the criterion variable matrix modeling.
As can be seen in Table S6 (Electronic supplementarymaterial), a and b parameters were the most important vari-ables in the D-PLS constructed, but correlation to the firstprincipal component was opposite. The influence of a and sparameters on the binary response is opposite to the b param-eter. Thus, there is a direct relationship between a and sparameters and basic properties of ILs, which is in contrastto what was observed for the b parameter, linked to acidproperties of ILs.
When we used D-PLS with classification purposes,94.54 % hits were obtained. As can be seen in Fig. 3, onlythree ILs belonging to B class had a Yvalue lower than 0.5 (Yvalues, 0.461, 0.442, and 0.445), so these ILS were worsepredicted (88 % prediction ability). All ILs belonging to Aclass were correctly predicted (100 % prediction ability).
When we used MLR instead of D-PLS, very similar statis-tical parameters were obtained, as standard error for prediction(SEP) was 0.29 and the percentage of Yvariance explained by
Table 5 Correlation matrix of solvation parameters
e s a b l
e 1.000 0.06 −0.008 0.29 −0.16P 0.64 0.95 0.03 0.24
s 1.000 0.44 0.018 0.47
P <0.01 0.89 <0.01
a 1.000 −0.44 0.37
P <0.01 <0.01
b 1.000 −0.014P 0.92
l 1.000
Fig. 3 Predicted and residualscomputed for the binary responseY. ILA ionic liquid belonging to a(acidic) class. ILB ionic liquidbelonging to b (basic) class.Ypredicted=0.5 is the border value
3154 J. González-Álvarez et al.
the MLR model was 66 %. Whole hits of prediction were thesame also (94.54%); however, withMLRwe obtained 96.7%prediction hits for A class and 92 % prediction hits for B class.Thus, both D-PLS andMLR are useful tools for characterizingILs classes.
Conclusions
Chemometric unsupervised technique, such as CA, and thesystem constants (a, b, s, e, and l) evaluated by multivariatelinear regression, allowed us to identify two groups of the ILsstudied (H imidazolium, polymeric imidazolium, and P) onthe basis of acidic or basic character of their H-bonding.Subsequently, the use of supervised techniques such asLDA, step-LDA, QDA, and multivariate regression tech-niques as D-PLS or MLR provided robust classification rulesand models with high prediction capacity. These rules andmodels allowed us to classify and to characterize ILs on thebasis of their acidic and basic properties, which is interestingin GC, particularly when it is necessary to separate analytes byusing H-bonding interaction.
References
1. Poole CF (2004) J Chromatogr A 1037:49–822. Gónzalez-Álvarez J, Blanco-Gomis D, Arias-Abrodo P, Díaz-
Llorente D, Busto E, Ríos-Lombardía N, Gotor-Fernández V,Gutierrez-Álvarez MD (2012) J Sep Sci 35:273–279
3. Armstrong DW, He L, Liu Y-S (1999) Anal Chem 71:3873–38764. Huang K, Han X, Zhang X, Armstrong DW (2007) Anal Bioanal
Chem 389:2265–22755. Anderson JL, Armstrong DW (2005) Anal Chem 77:6453–6462
6. Doyle KP, Lang CM, Kim K, Kohl PA (2006) J Electrochem Soc153:A1351–A1357
7. Armstrong DW, Zhang L, He L, Gross ML (2001) Anal Chem 73:3679–3683
8. Hallet JP, Welton T (2011) Chem Rev 111:3508–35769. Welton T (2004) Coord Chem Rev 248:2459–2477
10. Domínguez de María P (2008) Angew. Chem Int Ed 47:6960–696811. Zhang Q, Zhang S, Deng Y (2011) Green Chem 13:2619–263712. Anderson JL, Armstrong DW (2003) Anal Chem 75:4851–485813. Cong Y, Anderson JL (2009) J Chromatogr A 1216:1658–171214. Yue C, Fang D, Liu L, Yi TF (2011) J Molecular Liquids 163:99–12115. Heydar KT, Gharavi HG, Nazifi M, Mirzaei M, Sharifi A (2013)
Fluid Phase Equilibria 353:93–10016. Petsch M, Mayer-Helm BX, Soellner V (2005) Anal Bioanal Chem
383:322–32617. Kamlet MJ, Carr PW, Taft RW, Abraham MH (1981) J Am Chem
Soc 103(20):6062–606618. Kamlet MJ, Doherty RM, Famini GR, Taft RW (1987) Acta Chem
Scand B 41:589–59819. Abraham MH, Whiting GS, Doherty RM, Shuely WJ (1990) J
Chromatogr 518:329–34820. Abraham MH, Poole CF, Poole SK (1999) J Chromatogr A 842:79–
11421. Poole SW, Poole CF (1995) J Chromatogr A 697:415–42722. Héberger K (1999) Chemometrics Intell Lab Systems 47:41–4923. Poole CF (2012) Classification and selection of open tubular
columns for analytical separations. Elsevier, Oxford, UK, pp137–160
24. CruickshankAJB,WindsorML,YoungCL (1966) Proc RSocA 295:259–270
25. González-Álvarez J, Blanco-Gomis D, Arias-Abrodo P, Díaz-Llorente D, Busto E, Ríos-Lombardía N, Gotor-Fernández V,Gutierrez-Álvarez MD (2012) Anal Chim Acta 721:173–181
26. González-Álvarez J, Arias-Abrodo P, Puerto M, Viguri ME,Pérez J, Gutiérrez-Álvarez MD (2013) RSC Advances 3:21377–21380
27. Poole CF, Atapattu SN, Poole SK, Bell AK (2009) Anal Chim Acta652:32–53
28. Abraham MH (1993) Chem Soc Rev 22:73–8329. Forina M, Leardi R, Lanteri S, Armanino C (1998) IN PARVUS. An
extendable package of programs for data exploration, classificationand correlation. Elsevier, Amsterdam
A chemometric approach to characterization of ionic liquids 3155