Embed Size (px)
Citation preview

Supercritical Fluid Chromatography of Ionic Compounds
by
Jun Zheng
Dissertation submitted to the Graduate Faculty of the Virginia Polytechnic Institute and State University in partial fulfillment of the requirements for the degree of
Doctor of Philosophy
in
Chemistry
Larry T. Taylor, Chairman
J. David Pinkston
Harold M. McNair
David G. I. Kingston
Gary L. Long
October 27th, 2005
Blacksburg, Virginia
Keywords: Supercritical Fluid Chromatography, Ultraviolet Detector, Ionic additives, Ionic analytes, Peptides, Mass Spectrometry

Supercritical Fluid Chromatography of Ionic Compounds
Jun Zheng
ABSTRACT
Addition of a small amount of polar solvent (i.e. modifier) which contains an
ionic component (i.e. additive) to a CO2 mobile phase has shown major improvement in
the elution of ionic analytes via packed column supercritical fluid chromatography (SFC).
Firstly, we focused on the elution of sodium arylsulfonate analytes by using
various ionic additives, such as lithium acetate, ammonium acetate,
tetramethylammonium acetate, tetrabutylammonium acetate, and ammonium chloride.
The analytes were successfully eluted with all additives with good peak shape under
isocratic/isobaric/isothermal conditions. Three stationary phases with different degrees of
deactivation were considered. They were conventional Cyanopropyl, Deltabond
Cyanopropyl, and non-chemically bonded silica. The effect of additive concentration and
additive functionality on retention was also investigated.
Secondly, solid state NMR of the silica packing material before and after being
flushed with supercritical CO2 modified by methanol containing the ionic additives was
performed to gain some insight into the retention mechanism(s). A fraction of silanol
protons were undetected after being treated with the mobile phase which suggested
replacement by the cationic component of the additive. CaChe calculations were carried
out on several of the additives in an attempt to explain why different ionic additives
produce different effects on chromatographic retention. Modification of the stationary
phase and ion pairing with the analyte are two possible retention mechanisms being
considered.

As ion-pair formation was considered to be one of the retention mechanisms, the
use of sodium sulfonates as mobile phase additives to elute secondary and quaternary
ammonium salts was then studied. Propranolol HCl, benzyltrimethylammonium chloride,
and cetylpyridium chloride were chosen as the probe analytes. Sodium ethansulfonate,
sodium 1-heptanesulfonate, and sodium 1-decanesulfonate were studied as mobile phase
additives. The analytes were successfully eluted from Deltabond Cyano phase within 5
minutes, but were retained strongly without additive or with ammonium acetate as the
additive. An Ethylpyridine column showed dramatic advantages on the elution of these
ammonium analytes. No additive was required to elute these ionic compounds.
Protonation of some fraction of the pyridine functional groups and the deactivation of
active silanol sites were believed to be the major mechanisms responsible for this
behavior.
Lastly, we successfully eluted large peptides (up to 40 mers) containing a variety
of acidic and basic residues in SFC. We used trifluoroacetic acid as additive in a
CO2/methanol mobile phase to suppress deprotonation of peptide carboxylic acid groups
and to protonate peptide amino groups. The Ethylpyridine column was used for the
majority of this work. The relatively simple mobile phase was compatible with mass
spectrometric (MS) detection. To our knowledge, this is the first report of the elution of
peptides of this size with a simple, MS-compatible mobile phase. Fast analysis speed, the
possibility of coupling multiple columns to achieve desired resolution, a normal-phase
retention mechanism, and less use of organic solvents are the advantages of SFC
approach for peptide separation.

iv
This dissertation is dedicated to
Sheng, Dad, and Mom

v
Personal Acknowledgements
I would like to thank my families for their support through my entire education. I
would like to extend my deepest thanks to my husband, Sheng Tu for his love,
encouragement, and inspiration. Without him I couldn’t overcome difficulties during the
tough times.
I would like to acknowledge my research advisor, Dr. Larry T. Taylor, Dr. J.
David Pinkston, and my doctoral committees for their guidance and support. I would also
like to thank Dr. Jame M. Tanko for helping with the computational calculation; Tom
Glass for helping with the solid state NMR study. The Taylor research group has also
been helpful during my graduate career.
Many thanks are extended to my friends for lightening up my life at Virginia
Tech.

vi
Acknowledgements of Funding
The Author would like to recognize several individuals and companies for
financial and research support: J. David Pinkston and Procter and Gamble
Pharmaceuticals, Inc. for financial support and collaboration in research; Jerry Clark
from Supelco for providing SAX/SCX stationary phases and silica packing materials;
Terry Berger from Mettler-Toledo Autochem Berger Instruments for chromatography
supplies and useful chromatography information; and the Graduate Student Association
of Virginia Tech for financial support for travel to scientific conferences.
vii
Table of Contents
Page
Personal Acknowledgements iv
Acknowledgements of funding v
List of Figures viii
List of Tables xii
І. Introduction 1
П. Effect of Ionic Additives on the Elution of Sodium Aryl Sulfonates in Supercritical Fluid Chromatography 2.1 Introduction 8 2.2 Experimental
2.2.1 Chemicals 11 2.2.2 SFC/UV Instrumentation 11 2.2.3 SFC/MS Instrumentation 13
2.3 Results and Discussion 14 2.4 Conclusions 31 III. Study of the Elution Mechanism of Sodium Aryl Sulfonates on Bare Silica and a Cyano Bonded Phase with Methanol-Modified Carbon Dioxide Containing an Ionic Additive 3.1 Introduction 32 3.2 Experimental
3.2.1 Chemicals 35 3.2.2 SFC/UV Instrumentation 36 3.2.3 Solid State CP-MAS NMR Spectroscopy 37 3.2.4 Computational Chemistry 38 3.2.5 Study of the Acidity of CO2/methanol Mixture Solvent 38
3.3 Results and Discussion 3.3.1 Additive Concentration Study 39 3.3.2 Memory Effect on Silica Phase 45 3.3.3 Solid State NMR Study of Silica Phase 52 3.3.4 Acidity of Supercritical CO2/methanol Mobile Phase 55 3.3.5 Computational Calculation of Charge Distribution 60
IV. Elution of Amine Salts with and without Sulfonate Additives by Packed Column Supercritical Fluid Chromatography
viii
4.1 Introduction 65 4.2 Experimental
4.2.1 Chemicals 70 4.2.2 SFC/UV Instrumentation 71
4.3 Results and Discussion 4.3.1 Deltabond Cyano Stationary Phase 72 4.3.2 Bare Silica Stationary Phase 76 4.3.3 Ethylpyridine Silica Stationary Phase 81 4.3.4 Strong Anion Exchange Stationary Phase 88 4.3.5 Aminopropyl Silica Stationary Phase 91
4.4 Conclusions 93 V. Advances in the Elution of Polypeptides with SFC/MS 5.1 Introduction 94 5.2 Experimental
5.2.1 Chemicals 96 5.2.2 SFC/UV Instrumentation 97 5.2.3 SFC/MS Instrumentation 99
5.3 Results and Discussion 5.3.1 Separation of Simple Peptides 100 5.3.2 Separation of Basic Polypeptides 105 5.3.3 Separation of Larger Polypeptides 113 5.3.4 Synthetic Polypeptides 116
5.4 Conclusions 124 VI. Conclusions and future work 126 References 130

ix
List of Figures
Figure Description Page
1 Phase diagram of a pure fluid. (32 °C and 73 atm are the 2 critical temperature and pressure for carbon dioxide.) 2 (A) Benzylamines eluted from a Deltabond octyl 6 column using pure carbon dioxide as the mobile phase.
100×2mm, 5μm, 0.5mL/min, 40oC, 182 bar. (B) Separation of three benzylamines on Diol column, using 5% methanol in carbon dioxide; Nucleosil Diol 100×2mm, 7μm, 0.5mL/min, 40 oC, 182 bar. (C) Separation of the same three benzylamines using a ternary mobile phase of 2% methanol (containing 0.1% t-butylammonium hydroxide) in carbon dioxide; Deltabond CN column 100×2mm, 5μm, 0.5 mL/min, 40
oC, 182 bar. Solutes in order of retention are: (T) tribenzylamine, (D) dibenzylamine, and (B) benzylamine.
3 Structures of (I) sodium para-normal 4-dodecylbenzene 12 sulfonate; (II) sodium 4-octylbene sulfonate; (III) sodium
p-toluene sulfonate. 4 SFC/UV chromatograms (λ = 230 nm) of sodium 4- 16
dodecylbenzene sulfonate with 15% 2.5 mM NH4OAc in methanol as mobile phase modifier modified CO2 employing various stationary phases.
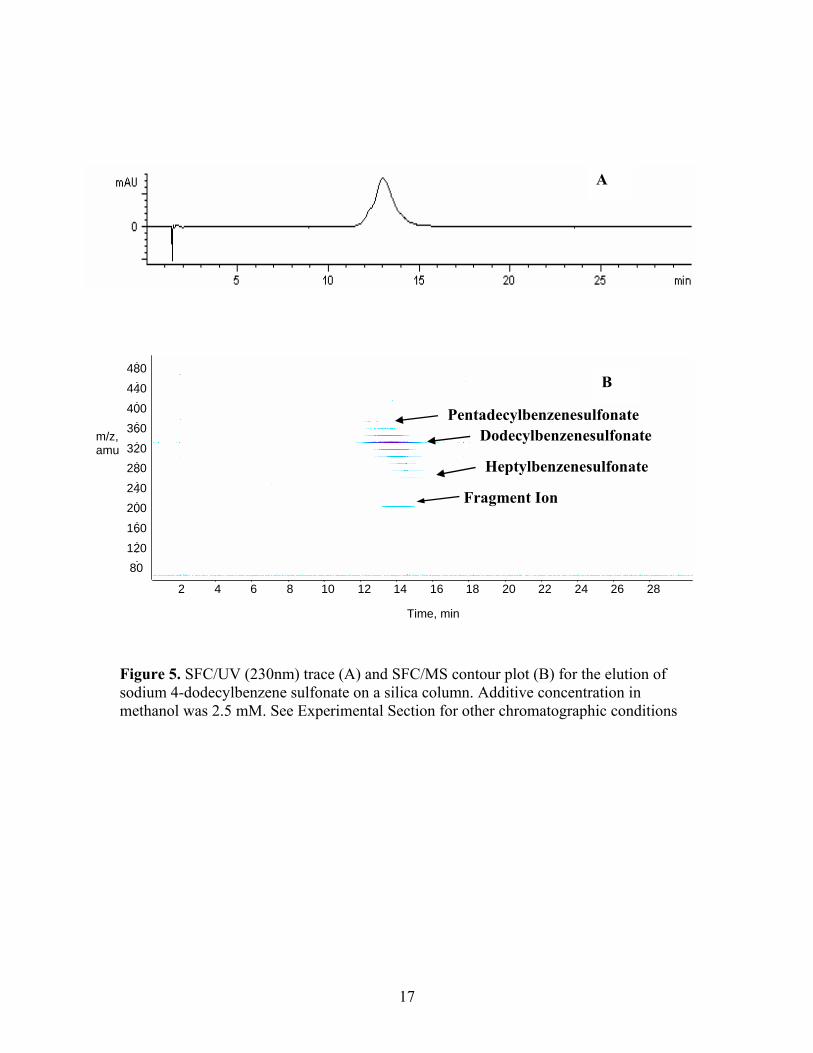
5 SFC/UV (230nm) trace (A) and SFC/MS contour plot 17
(B) for the elution of sodium 4-dodecylbenzene sulfonate on a silica column.
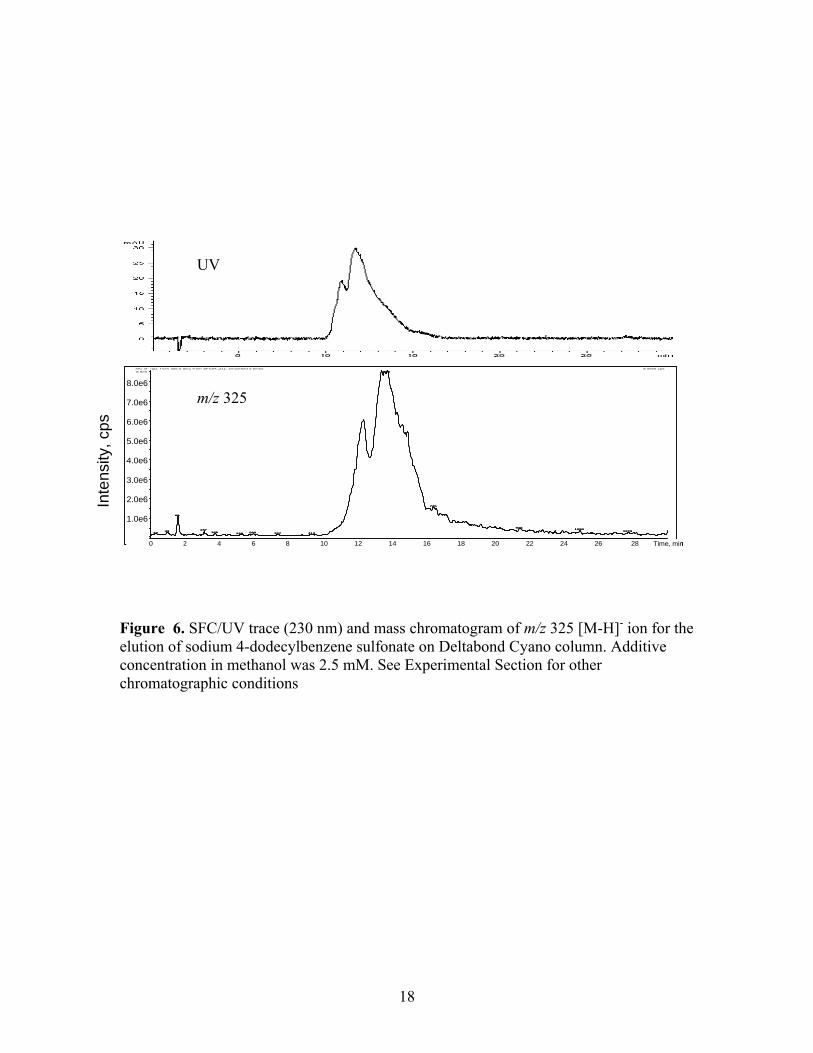
6 SFC/UV trace (230 nm) and mass chromatogram of m/z 18 325 [M-H]- ion for the elution of sodium 4-dodecylbenzene
sulfonate on Deltabond Cyano column. 7 MS/MS reconstructed-total-ion-current chromatogram and 20 product ion spectra of different peak components. Analyte
is sodium 4-dodecylbenzene sulfonate. 8 Effect of different mobile phase additives for the elution of 21
x
sodium 4-dodecylbenzene sulfonate with Deltabond Cyano column.
9 Effect of different mobile phase additives for the elution of 23 sodium 4-dodecylbenzene sulfonate with conventional
cyano column. 10 Effect of different mobile phase additives for the elution of 24 sodium 4-dodecylbenzene sulfonate with silica column. 11 Effect of ammonium salts as mobile phase additives on 28 the elution of sodium p-toluene sulfonate on silica column. 12 Effect of different salt mobile phase additives on the 30 elution of propranolol hydrochloride from silica column. 13 Retention time of sodium dodecylbenzenesulfonate on bare 41 silica and Deltabond Cyano columns with different
concentrations of ammonium acetate as mobile phase additive.
14 Proposed mechanism for modification of bare silica phase 44 by ionic additive. 15 (A) Retention times for fourteen repeated injections of a 46 sodium p-toluene sulfonate solution on a silica column.
Injections 1-5: modifier contained 2.5 mM ammonium acetate; Injections 6-14: modifier was pure methanol. (B) Selected chromatograms from the fourteen separations.
16 (A) Retention times for fourteen repeated injections of a 48 sodium p-toluene sulfonate solution on a silica column.
Injections 1-5: the modifier contained 2.5 mM TBAA; Injections 6-14: modifier was pure methanol. (B) Selected chromatograms from the fourteen injections.
17 (A) Retention times for twelve repeated injections of a 50 sodium p-toluene sulfonate solution on a silica column.
Injections1-5: the modifier contained 2.5 mM TMAA; Injections 6-12: modifier was pure methanol. (B) Selected chromatograms from the fourteen injections.
18 Repeated injections of sodium p-toluene sulfonate on a 51
xi
Deltabond Cyano column. Injections1-5: the modifier contained 2.5 mM ammonium acetate; Injections 6-14: modifier was pure methanol.
19 29Si CP-MAS NMR spectrum of bare silica packing 53 material. 20 Color change of methanol and water containing universal 57 pH indicator when bubbling CO2 into the solutions. 21 Color change of methanol and water after saturated with 59 CO2 gas with methyl red as pH indicator (pH 4.2-6.3).
Reaction of methyl red when gaining a proton. 22 Optimized geometry of AA, TMAA, and TBAA molecules 62 and partial charges on each atom. 23 Molecular structure of analytes that are discussed in this 67 chapter. 24 Elution of propranolol hydrochloride from a Deltabond 74 Cyano column with different mobile phase additives. 25 Elution of cetylpyridinium chloride on Deltabond Cyano 77 column with different mobile phase additives. 26 Elution of propranolol hydrochloride on a silica column. 79 27 Retention factors for three organo ammonium analytes on 82 Deltabond Cyano column with different concentrations of
sodium 1-heptanesulfonate as additive. 28 Elution of (A) cetylpyridinium chloride; (B) 84 benzyltrimethylammonium chloride; (C) propranolol
hydrochloride on 2-ethyl pyridine column with 20% pure methanol-modified pressurized CO2.
29 The ‘switching’ of a switchable solvent. Protonation of 85 DBU (1,8-diazabicyclo-[5.4.0]-undec-7-ene) in the
presence of an alcohol and carbon dioxide is reversed when CO2 is removed.
30 Elution of the three ammonium analytes on 2-ethylpyridine 87 column with (A) 20% methanol containing 0.5% IPA; (B)
20% methanol containing 2.5 mM ammonium acetate as the mobile phase modifier.

xii
31 Structures of (A) ethylpyridine; (B) SAX; (C) aminopropyl 89 stationary phases. 32 Elution of three ammonium salt analytes on SAX column. 90 (A) propranolol hydrochloride; (B) cetylpyridinium
chloride; (C) benzyltrimethylammonium chloride. 33 Elution of three ammonium salt analytes on amino column 92 with 30% mobile phase modifier. (A) propranolol
hydrochloride; (B) cetylpyridinium chloride; (C) benzyltrimethylammonium chloride.
34 Sequence and monoisotopic molecular mass of each probe 98 peptide. 35 SFC-UV separation of simple peptide mixtures. 101 Key: (B) bradykinin; (M) methionine enkephalin; (P) Pro-
Leu-Gly amide; (L) leupeptin. See section 5.2 for chromatographic conditions.
36 Separations of mixture of Pro-Leu-Gly amide and 103 leupeptin hydrochloride using two different modifier
gradients with UV and mass spectrometric detector of (L) leupeptine and (P) Pro-Leu-Gly amide corresponding to the upper separation. Scan range m/z: 250-450.
37 Illustration of proposed interactions on Ethylpyridine 104 stationary phase. 38 SFC/MS mass chromatograms for the elution of 108 Bradykinin, its fragment 1-8, and fragment 2-9 from the
Ethylpyridine column. (A) pure methanol as modifier; (B) 5-mM TFA in methanol as modifier; (C) 13-mM TFA in methanol as modifier. Scan range m/z: 400-1220.
39 Mass chromatograms of Lys-bradykinin on the 110 Ethylpyridine column. Scan range m/z: 400-1220. Mass
chromatogram selected at m/z 594.5-595.5. 40 Mass chromatograms of lys-bradykinin at different 112 concentrations injected on column. 41 SFC/MS of larger polypeptides with (A) pure methanol; 115 (B) 5 mM TFA/methanol; (C) 13 mM TFA/methanol; and
(D) 13 mM ammonium trifluoroacetate (ATFA)/methanol

xiii
as mobile phase modifier. Scan range m/z: 400-1330 for angiotensins, 400-1420 for urotensins, and 500-2350 for sauvagine.
42 Mass spectra of peptide A and peptide B with scan range 119 from m/z 500-2300 for peptide A and m/z 500-2000 for
peptide B. Modifier: 13-mM TFA/methanol. 43 Mass chromatograms of peptide A and peptide B with 120 modifier variation with 5 cm Ethylpyridine column. See
section 2 for other chromatographic conditions. 44 Mass spectra of peptide C and peptide D with scan range 121 from m/z 500-2300. Modifier: 5 mM TFA/methanol. 45 Mass chromatograms of peptide C and peptide D with 122 modifier variation with 5 cm Ethlpyridine column. 46 HPLC/UV and SFC/MS of peptide E and its deamination 123 products (Oven temperature was 50 ºC for 25-cm
Ethylpyridine column) HPLC-UV conditions: A = 95% water, 5% ACN with 0.1% TFA; B = 5 % water, 95% ACN with 0.1%TFA ; 75% A 50% A in 30 min, 31-36 min 75%A; Phosphate buffer pH 7; sample concentration: 0.45 mg/mL; injection volume: 20 µl; flow rate: 1 mL/min; UV detection wavelength: 210 nm. SFC-MS scan range of m/z: 800-1500.
xiv
List of Tables
Table Description Page 1 Retention Time/Peak Area Reproducibility Data Versus 25 Stationary Phase and Additive (2.5 mM in 15% methanol
modified CO2). 2 Q3 peak intensity per mg of silica and the percentage of 54 free silanol groups covered by ammonium additive. 3 Partial charge distribution on the three ammonium salts 63 calculated with different theories. 4 Retention factor of probe analytes with different mobile 78 phase additives on Deltabond Cyano stationary phase. 5 Average retention time (min.) and the W1/2h (min.) in 106 parenthesis of the four bradykinin peptides with different
modifier composition. ND: not detected. UV detection at 220 nm (n=2)
6 Structural information of the synthetic peptides. 117
1
CHAPTER 1
Introduction
A supercritical fluid is any substance above its critical temperature and critical
pressure (see Figure 1). Supercritical fluids possess both gas- and liquid-like properties.
Mass transfer is rapid with supercritical fluids. They have relatively high diffusivities,
which are more than ten times those of liquids. Their dynamic viscosities are nearer to
those of the gaseous state. On the other hand, their densities allow much greater solvating
power than gases [1].
Supercritical fluid chromatography (SFC) is an intermediate technique between
gas chromatography (GC) and liquid chromatography (LC), using a supercritical fluid as
the mobile phase. In this dissertation, no differentiation will be made between what is
sometimes called subcritical fluid chromatography (subSFC, or sSFC) and SFC. Many of
the same advantages apply to subSFC and SFC, and the same instrumentation is required.
As long as the mobile phase remains in the one-phase region, good chromatographic
performance can be achieved [2].
Supercritical carbon dioxide has a relatively low critical pressure and critical
temperature (73 atm and 31°C). Because of these factors and because of its chemical
inertness and non-flammability, supercritical CO2 has been the most commonly used
mobile phase in SFC. The low viscosity of supercritical carbon dioxide results in: (a) the
use of increased flow rate, providing higher column efficiency per unit time, thus
shortening analysis time; (b) relatively low backpressure, which allows the use of longer
columns and the coupling of columns in series to increase both selectivity and efficiency.
From the environmental and economical point of view, much less organic solvent is used

2
Figure 1. Phase diagram of a pure fluid. (32 °C and 73 atm are the critical temperature and pressure for carbon dioxide.)
Increasing Temperature
Incr
easi
ng P
ress
ure
(32 ºC)
(73
atm
)
Increasing Temperature
Incr
easi
ng P
ress
ure
Increasing Temperature
Incr
easi
ng P
ress
ure
(32 ºC)
(73
atm
)
Solid
Liquid
Gas
3
in SFC than in traditional LC. This provides major ecomomic advantages in preparative
SFC separations. [3]
Solutes must have some solubility in a fluid for that fluid to be an effective
chromatographic mobile phase. Unfortunately, the solvating strength of carbon dioxide
has been shown to be in the same range as liquid hexane [4,5]. In 1978, Stahl et al.[6,7]
demonstrated the solubility of several amino acids and sugars at extremely high
pressures. With carbon dioxide at 40 °C and 2000 bar, solubilities were as follows:
glycine, 0.40 μg/L; L-leucine, 0.55 μg/L; sucrose, 1.5 μg/L; glucose 2 μg/L, and xylose,
3.0 μg/L. These very low solubilities suggested that successful chromatography of
biomolecules with carbon dioxide alone would not be practical. The weak solvating
power of pure CO2 has thus limited the application of SFC to intermediate polar and non-
polar compounds. [6-8] Furthermore, conventional HPLC packed columns are not
sufficiently deactivated for the separation of polar analytes with non-polar CO2 as the
mobile phase.
Deactivated stationary phases have been studied to extend the application of
packed column SFC [9-11]. Ashraf-Khorassani et al. [11] and Berger et al. [12] reported
that less active phases provided a significant improvement in peak shape compared to
similar, but non-deactivated, phases for the elution of phenols, anilines, and
benzylamines. Not only was deactivation of the stationary phases important, but the right
polarity match between the stationary phase, solute, and mobile phase was also thought to
be critical.
To increase the solvating power of carbon dioxide, researchers have explored the
use of polar modifiers. Both inorganic and organic polar solvents have been studied.
4
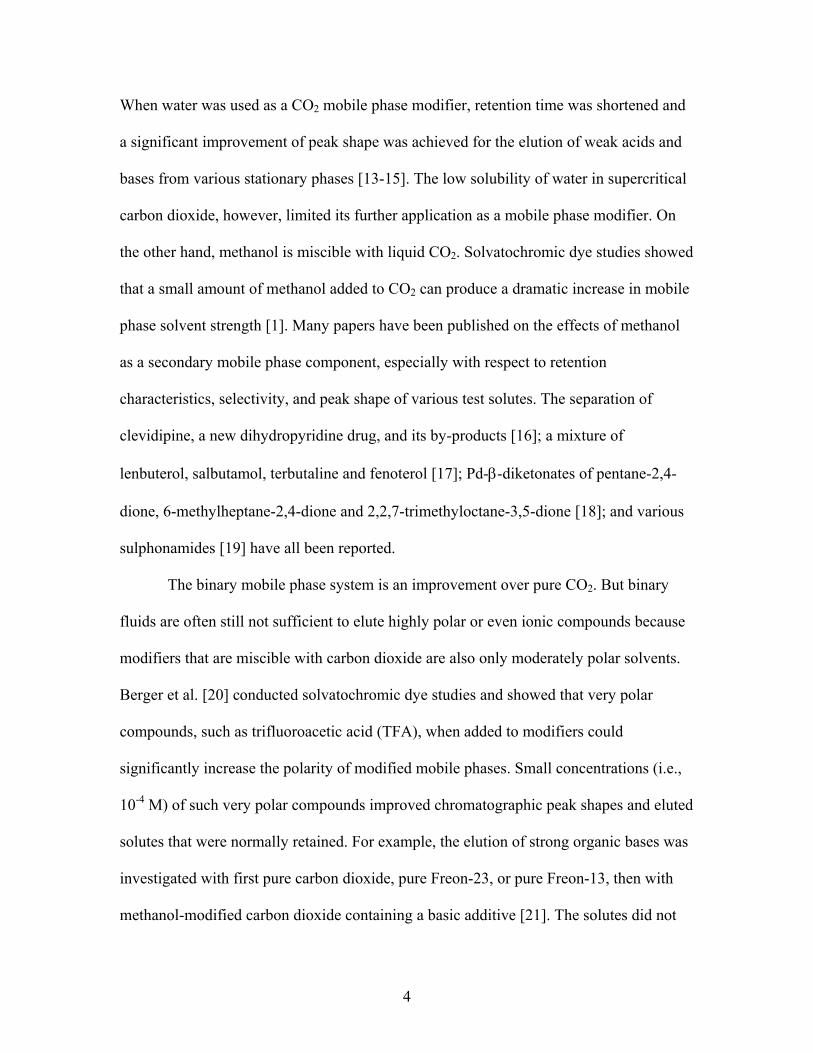
When water was used as a CO2 mobile phase modifier, retention time was shortened and
a significant improvement of peak shape was achieved for the elution of weak acids and
bases from various stationary phases [13-15]. The low solubility of water in supercritical
carbon dioxide, however, limited its further application as a mobile phase modifier. On
the other hand, methanol is miscible with liquid CO2. Solvatochromic dye studies showed
that a small amount of methanol added to CO2 can produce a dramatic increase in mobile
phase solvent strength [1]. Many papers have been published on the effects of methanol
as a secondary mobile phase component, especially with respect to retention
characteristics, selectivity, and peak shape of various test solutes. The separation of
clevidipine, a new dihydropyridine drug, and its by-products [16]; a mixture of
lenbuterol, salbutamol, terbutaline and fenoterol [17]; Pd-β-diketonates of pentane-2,4-
dione, 6-methylheptane-2,4-dione and 2,2,7-trimethyloctane-3,5-dione [18]; and various
sulphonamides [19] have all been reported.
The binary mobile phase system is an improvement over pure CO2. But binary
fluids are often still not sufficient to elute highly polar or even ionic compounds because
modifiers that are miscible with carbon dioxide are also only moderately polar solvents.
Berger et al. [20] conducted solvatochromic dye studies and showed that very polar
compounds, such as trifluoroacetic acid (TFA), when added to modifiers could
significantly increase the polarity of modified mobile phases. Small concentrations (i.e.,
10-4 M) of such very polar compounds improved chromatographic peak shapes and eluted
solutes that were normally retained. For example, the elution of strong organic bases was
investigated with first pure carbon dioxide, pure Freon-23, or pure Freon-13, then with
methanol-modified carbon dioxide containing a basic additive [21]. The solutes did not

5
elute with pure solvent from a packed column (Figure 2A). They were eluted but with
poor peak shapes when only methanol was added (Figure 2B) to the CO2. The addition
of a base to the mobile phase dramatically improved the peak shapes of the solutes that
included three benzylamines (Figure 2C). Ion suppression of the analytes by the basic
additive was believed to be the retention mechanism involved in this work. Other workers
have reported the application of various organic acids and bases as mobile phase
additives in SFC [20,22-32].
Generally, acidic additives are needed to improve the peak shapes of acidic
solutes. Basic additives are needed to improve the peak shapes of basic solutes. Berger
has speculated, “Additives will provide a key to the separation of more polar solutes by
SFC.” [1]
The purpose of this research is to extend the application of SFC to ionic, fully
ionic, and even to biologically important, amphoteric polypeptides with up to 4500 Da
molecular weight by introducing ionizable additives and novel stationary phases. The
retention mechanisms of ionic analytes with ionic additives has also been studied.
Chapter 2 deals with the elution of sodium para-normal dodecylbenzene sulfonate,
sodium 4-octylbenzene sulfonate, and sodium p-toluene sulfonate from three stationary
phases that vary in degrees of deactivation by using various ammonium salts as mobile
phase additives. The ammonium salts that were studied include ammonium acetate,
tetramethylammonium acetate, tetrabutylammonium acetate, ammonium chloride and
lithium acetate. The three stationary phases applied were bare silica, end-capped
Cyanopropyl silica phase, and deactivated, polymer-coated Deltabond Cyano silica
phase. In Chapter 3, the retention mechanism of these sodium aryl sulfonates with

6
Figure 2. (A) Benzylamines eluted from a Deltabond octyl column using pure carbon dioxide as the mobile phase. 100×2mm, 5μm, 0.5mL/min, 40oC, 182 bar. (B) Separation of three benzylamines on Diol column, using 5% methanol in carbon dioxide; Nucleosil Diol 100×2mm, 7μm, 0.5mL/min, 40 oC, 182 bar. (C) Separation of the same three benzylamines using a ternary mobile phase of 2% methanol (containing 0.1% t-butylammonium hydroxide) in carbon dioxide; Deltabond CN column 100×2mm, 5μm, 0.5 mL/min, 40 oC, 182 bar. Solutes in order of retention are: (T) tribenzylamine, (D) dibenzylamine, and (B) benzylamine. [21]
A
B
C
7
various ammonium additives were investigated using solid state 29Si NMR and
computational calculations. We focused on the different behavior of the ammonium
additives on the active bare silica column and the deactivated Deltabond Cyano stationary
phase. Ammonium acetate, tetramethylammonium acetate, and tetrabutylammonium
acetate were evaluated. The success of eluting ionic sulfonate salts by using ammonium
salt additives suggested the use of sulfonate salts as mobile phase additives to elute
ammonium salt analytes. Chapter 4 demonstrates the successful application of
chromatographic reciprocity. Propranolol hydrochloride and two quaternary ammonium
salts (cetylpyridinium chloride and benzyltrimethylammonium chloride) were
successfully eluted from a Deltabond Cyano column using either sodium ethanesulfonate,
sodium 1-heptanesulfonate, or sodium 1-decanesulfonate as additive. The retention
mechanisms were also discussed. Beyond the the Deltabond Cyano column, three silica-
based stationary phases, an Ethylpyridine column, a strong anion exchange column, and
an aminopropyl column, were also evaluated. Finally in Chapter 5, four groups of
polypeptides that contain a large variety of amino acid groups, with up to 40 mers and
with more than 4500 Dalton, have been investigated using CO2/methanol based mobile
phase. The compatibility of the SFC mobile phase with mass spectrometry was also
discussed.

8
CHAPTER 2
Effect of Ionic Additives on the Elution of Sodium Aryl Sulfonates in Supercritical
Fluid Chromatography
2.1 INTRODUCTION
Many papers [13-15] have been published on the effects of methanol as a
secondary mobile phase component, especially with respect to retention characteristics,
selectivity, and peak shapes of various test solutes [16-19]. Lee et al. [33] for example
resolved free bases of rac-propranolol, rac-pindolol, and rac-metoprolol as well as HCl
salts of rac-betaxolol and rac-cicloprolol with Chiralcel OD and CH3OH/CO2 (20/80,
v/v). Direct, preparative, enantioselective chromatography of rac-propranolol
hydrochloride was later reported [34] using a Chiralpak AD stationary phase and
CH3OH/CO2 mobile phase without the use of basic or acidic additives. After the
separation, isolated fractions of the hydrochloride salts were positively identified by mass
spectrometry. More recently these investigators have demonstrated [35] on-line
polarimetric detection with SFC instrumentation for the enantio-separation of the same
HCl salts.
While common binary mobile phases significantly improve the elution of polar
analytes in SFC, in general, highly polar or ionic compounds are still not eluted because
the organic modifiers that are miscible with liquid carbon dioxide are also only
moderately polar cosolvents. Berger et al.[20] conducted solvatochromic dye studies and
showed that very polar compounds, such as trifluoroacetic acid (TFA), when added to
9
SFC modifiers, could significantly increase the solvating power of modified mobile
phases. Small concentrations (i.e., 10-4 M) of such very polar compounds, called
additives, improved chromatographic peak shapes and allowed the elution of solutes that
were normally very strongly retained. Berger speculated that “additives will provide a
key to the separation of more polar solutes by SFC”. [20]
Various investigations in this regard have been reported in which weak organic
acids and bases have been employed as mobile phase additives. Generally, acidic
additives such as trifluoroacetic acid are needed to improve the peak shapes of acidic
solutes. Basic additives such as isopropylamine are needed to improve the peak shapes of
basic solutes. Berger and Deye [12,21] believed that, in most cases, the mechanism of
action involved suppression of analyte ionization by the additive. A less conventional
additive, tetramethylammonium hydroxide (TMAOH), was later studied by other workers
[22,23] that may suggest a role for the additive other than ion suppression. Specifically,
the SFC separation of 24 PTH-amino acids was facilitated with a mobile phase of
supercritical CO2, the additive, and methanol. No modifier was required for the elution
of neutral PTH – amino acid derivatives, but the addition of TMAOH and methanol to the
mobile phase played a major role in the elution of both acidic and basic PTH amino
acids. Peak tailing was minimized and the elution order of several peaks was altered by
incorporation of this additive into the mobile phase. The base was thought to interact
with, or block active sites on, the stationary phase to significantly improve peak tailing.
The use of ion-pairing principles in SFC has been demonstrated to a limited
degree. [24,25] The influence on the selectivity of sodium heptane sulfonate and
dimethyloctyl amine (DMOA) with cyano and diol bonded phase columns has been

10
investigated. The limited solubility of ion-pairing agents in CO2-modifier mixtures was
noted as being a problem in ion-pair SFC. Elution of propranolol with 25 mM sodium
heptane sulfonate in CH3OH/CO2 was reported; whereas, the analyte failed to elute from
the cyano packed column without sodium heptane sulfonate. As a rule of thumb, the
paper suggested that the best choice of initial conditions when starting an optimization of
the separation of ionizable compounds is to use a diol phase, tributylamine, and acetate
ion in methanol as the ion-pairing agent.
Pinkston et al. recently reported the application of mass-spectrometry compatible,
volatile ammonium salts as mobile phase additives in SFC. [36] Ammonium acetate,
ammonium formate, and ammonium carbonate were used to elute several cationic
(quaternary ammonium salts) and anionic (sulfonic acid salts) organic ions under SFC
conditions. With the addition of 1.1 mM ammonium acetate in methanol as mobile phase
modifier, analytes that were very strongly or irreversibly retained without additive (at the
same percentage of methanol) were successfully eluted from a Deltabond Cyano
stationary phase. A three-descriptor model was developed in this study where one
descriptor, the “relative negative charged surface”, explained 61% of the variance in the
retention value.
In this work, we have systematically studied the effect of the nature and
concentration of mobile phase ionic additives on the elution of sodium 4-dodecylbenzene
sulfonate from two cyano bonded silica phases and bare silica itself. Two other
sulfonates, sodium 4-octylbenzene sulfonate, and sodium p-toluene sulfonate have also
been studied in this work.
11
2.2 EXPERIMENTAL
2.2.1 Chemicals
Methanol was HPLC grade, (EMD, Durham, NC, USA). The carbon dioxide was
SFE/SFC grade (Air Products and Chemicals, Inc., Allentown, PA, USA) with no helium
head pressure. Lithium acetate (99+%, ACS grade), ammonium acetate (99%, ACS
grade), tetramethylammonium acetate (90%, tech. grade), and tetrabutylammonium
acetate (97%) were obtained from Sigma Aldrich (Milwaukee,WI, USA). Ammonium
chloride (ACS grade) was obtained from J.T.Baker (Phillipsburg, NJ, USA).
Sodium para-normal dodecylbenzene sulfonate (tech. grade) (Ι), 4-octylbenzene
sulfonic acid sodium salt (97%) (ΙΙ), and sodium p-toluene sulfonate (95%) (ΙΙΙ) were
purchased from Sigma Aldrich (Milwaukee,WI), Figure 3. A solution of each sample
was prepared in methanol at a concentration of approximately 0.5 mg/mL.
2.2.2 SFC/UV Instrumentation
The SFC system was a Berger MiniGram SFC with a Varian 320 Variable
Wavelength UV/VIS Detector (Varian,Inc., Walnut Creek, CA), and Berger Instruments
SFC ProNToTM MiniGram software, running on a Dell Dimension 2350 computer. In the
middle of the experiment, due to the failure of the detector, we switched to a Berger
Instruments Analytical SFC Instrument (Berger Instruments, Newark, DE) with a Hewlett
Packard Model 1050 Diode Array Detector (DAD), which employed a 13 μL high
pressure flow cell (10 mm path length) and Berger Instruments 3D SFC ChemStation
software, version 3.4.

12
CH3
Na+
(CH2)11
SO3-
CH3
Na+
(CH2)7
SO3-
Ι ΙΙ
Na+
SO3
CH3
-
ΙΙΙ Figure 3. Structures of (I) sodium para-normal 4-dodecylbenzene sulfonate; (II) sodium 4-octylbezene sulfonate; (III) sodium p-toluene sulfonate
13
The chromatographic columns were Deltabond Cyano (Thermo Hypersil-
Keystone, Bellefonte, PA)*, Supelcosil LC-PCN, and Supelcosil LC-Si (both Supelco;
Bellefonte, PA). The column dimensions were 25 cm length and 4.6 mm ID, with a
particle size of 5 μm for all three stationary phases. Supelcosil LC-PCN and Supelcosil
LC-Si had a pore size of 120 Å, while Deltabond Cyano had a pore size of 200 Å.
Unless otherwise specified, the standard chromatographic conditions were:
solution injection volume 10 μL, mobile phase flow rate 2mL/min (measured in the
liquid state), column outlet pressure 120 bar, and column oven temperature 40°C.
The isocratic mobile phase composition was 15% modifier in CO2, unless specified. The
modifier consisted of either pure methanol, or methanol with 2.5 mM lithium acetate,
ammonium acetate, tetramethylammonium acetate, tetrabutylammonium acetate, or
ammonium chloride.
Between each switch of the mobile phase additive, the modifier line leading from
the modifier bottle to the pump was first purged with the next additive solution. The
system was then equilibrated for about 10 minutes by pumping the new mobile phase
though the column. Finally, a blank injection of 10 µL of pure methanol through the
column was made with the new mobile phase modifier composition, in order to make
sure that no analyte was retained on the stationary phase from previous injections.
2.2.3 SFC/MS instrumentation
The SFC-MS system consisted of a Model G1205A (Agilent, Wilmington, DE
USA) fluid control module upgraded to a Model FCM-1200, an autosampler, and Version
* The vendor no longer supplies this stationary phase.
14
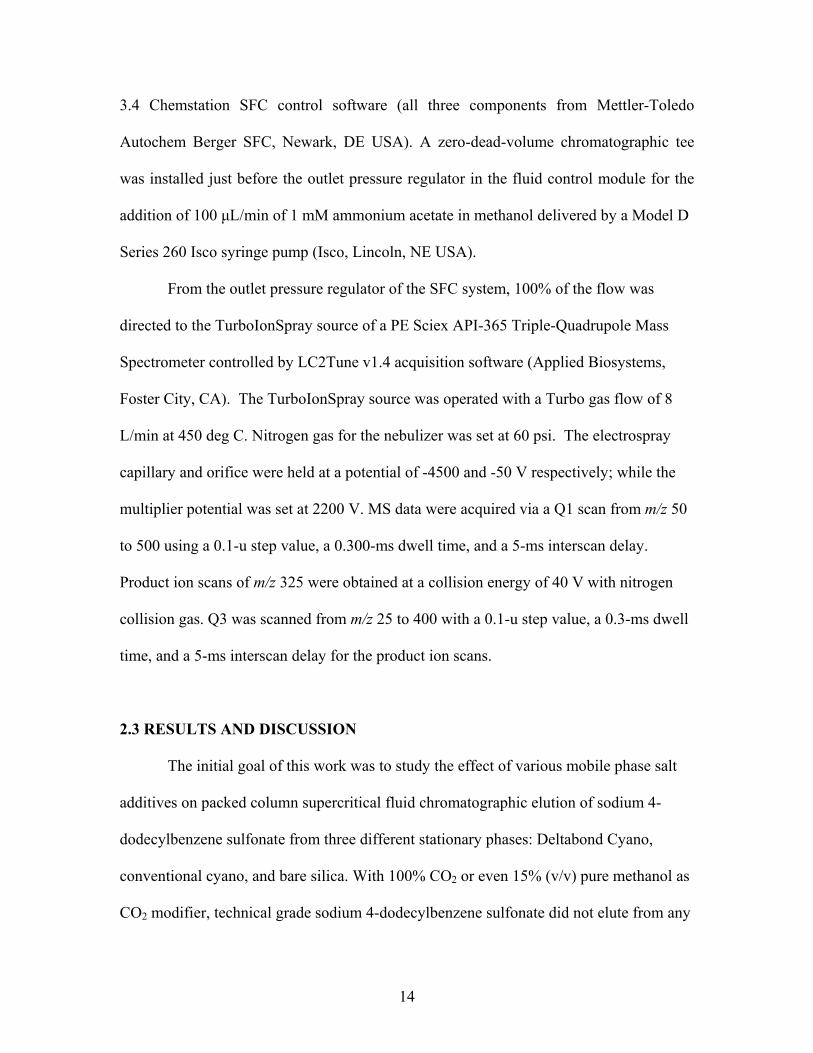
3.4 Chemstation SFC control software (all three components from Mettler-Toledo
Autochem Berger SFC, Newark, DE USA). A zero-dead-volume chromatographic tee
was installed just before the outlet pressure regulator in the fluid control module for the
addition of 100 μL/min of 1 mM ammonium acetate in methanol delivered by a Model D
Series 260 Isco syringe pump (Isco, Lincoln, NE USA).
From the outlet pressure regulator of the SFC system, 100% of the flow was
directed to the TurboIonSpray source of a PE Sciex API-365 Triple-Quadrupole Mass
Spectrometer controlled by LC2Tune v1.4 acquisition software (Applied Biosystems,
Foster City, CA). The TurboIonSpray source was operated with a Turbo gas flow of 8
L/min at 450 deg C. Nitrogen gas for the nebulizer was set at 60 psi. The electrospray
capillary and orifice were held at a potential of -4500 and -50 V respectively; while the
multiplier potential was set at 2200 V. MS data were acquired via a Q1 scan from m/z 50
to 500 using a 0.1-u step value, a 0.300-ms dwell time, and a 5-ms interscan delay.
Product ion scans of m/z 325 were obtained at a collision energy of 40 V with nitrogen
collision gas. Q3 was scanned from m/z 25 to 400 with a 0.1-u step value, a 0.3-ms dwell
time, and a 5-ms interscan delay for the product ion scans.
2.3 RESULTS AND DISCUSSION
The initial goal of this work was to study the effect of various mobile phase salt
additives on packed column supercritical fluid chromatographic elution of sodium 4-
dodecylbenzene sulfonate from three different stationary phases: Deltabond Cyano,
conventional cyano, and bare silica. With 100% CO2 or even 15% (v/v) pure methanol as
CO2 modifier, technical grade sodium 4-dodecylbenzene sulfonate did not elute from any

15
of the three stationary phases. Introduction of 2.5 mM ammonium acetate into the 15%
methanol mobile phase modifier with each of the three stationary phases, however, had a
dramatic effect on the chromatography. Figure 4 shows SFC/UV chromatograms of
sodium 4-dodecylbenzene sulfonate elution with 15 % 2.5 mM NH4OAc in methanol as
the CO2 modifier on Deltabond Cyano, conventional cyanopropyl, and bare silica
stationary phases. When ammonium acetate was used as additive, the analyte eluted
within 6 minutes with reasonable peak shape under isocratic conditions from each
properly conditioned stationary phase. With just methanol modifier, no analyte peaks
were detected; thus only a noisy baseline was observed.
A shoulder or split peak is apparent with all three stationary phases. This is likely
due to the presence of alkyl chains that are shorter/longer than twelve carbons in the
technical grade sodium 4-dodecylbenzene sulfonate [37]. To gain a better perspective on
the nature of the split peak, mass spectrometric detection was incorporated into the SFC
experiment with a new bare silica stationary phase, Figure 5. The UV trace with the new
column gave a broader peak with a longer retention time than previously observed,
Figure 5A. A second new bare silica column was then tested to confirm the earlier
results. The initial injection indeed yielded a broad peak with retention time in excess of
10 minutes. Subsequent injections gave a much narrower peak with retention time less
than 10 minutes that was clearly split. The MS contour plot (Figure 5B) shows clear
evidence that the technical grade sulfonate we had been using was in fact a distribution of
alkyl groups on the aryl portion ranging from C7 to C15. Thus, this homologous series of
sulfonates was only partially separated on the silica phase. Next, an analogous
experiment was conducted with the Deltabond Cyano phase. Figure 6 shows the UV

16
Figure 4. SFC/UV chromatograms (λ = 230 nm) of sodium 4-dodecylbenzene sulfonate with 15% 2.5 mM NH4OAc in methanol as mobile phase modifier modified CO2 employing various stationary phases
Deltabond Cyano Phase
Conventional Cyano Phase
Silica Phase
9876543210
6 5
6 0
5 5
5 0
4 5
4 0
3 5
3 0
2 5
2 0
1 5
1 0
5
0
µV
1 0987654321
9 59 08 58 07 57 06 56 05 55 04 54 03 53 02 52 01 51 0
50
- 5
µV
9876543210
6 5
6 0
5 5
5 0
4 5
4 0
3 5
3 0
2 5
2 0
1 5
1 0
5
0
µV
17
Figure 5. SFC/UV (230nm) trace (A) and SFC/MS contour plot (B) for the elution of sodium 4-dodecylbenzene sulfonate on a silica column. Additive concentration in methanol was 2.5 mM. See Experimental Section for other chromatographic conditions
2 4 6 8 10 12 14 16 18 20 22 24 26 28
Time, min
80 120 160 200 240 280 320 360 400 440 480
m/z, amu
Dodecylbenzenesulfonate
Heptylbenzenesulfonate
Pentadecylbenzenesulfonate
Fragment Ion
B
A
18
Figure 6. SFC/UV trace (230 nm) and mass chromatogram of m/z 325 [M-H]- ion for the elution of sodium 4-dodecylbenzene sulfonate on Deltabond Cyano column. Additive concentration in methanol was 2.5 mM. See Experimental Section for other chromatographic conditions
8.56e6 cpsXIC of –Q1: f rom 325.0 amu f rom SFC04_211, smoothed 5 times
1343
69
137165 229 263 327 413
606
725
9451099
1223
2 4 6 8 10 12 14 16 18 20 22 24 26 28Time, min
5.0e5
1.0e6
1.5e6
2.0e6
2.5e6
3.0e6
3.5e6
4.0e6
4.5e6
5.0e6
5.5e6
6.0e6
6.5e6
7.0e6
7.5e6
8.0e6
8.5e6
Intensity, cps
1.0e6
2.0e6
3.0e6
4.0e6
5.0e6
6.0e6
7.0e6
8.0e6
2 4 6 8 10 12 14 16 18 20 22 24 26 28 Time, min0
8.56e6 cpsXIC of –Q1: f rom 325.0 amu f rom SFC04_211, smoothed 5 times
1343
69
137165 229 263 327 413
606
725
9451099
1223
2 4 6 8 10 12 14 16 18 20 22 24 26 28Time, min
5.0e5
1.0e6
1.5e6
2.0e6
2.5e6
3.0e6
3.5e6
4.0e6
4.5e6
5.0e6
5.5e6
6.0e6
6.5e6
7.0e6
7.5e6
8.0e6
8.5e6
Intensity, cps
1.0e6
2.0e6
3.0e6
4.0e6
5.0e6
6.0e6
7.0e6
8.0e6
1.0e6
2.0e6
3.0e6
4.0e6
5.0e6
6.0e6
7.0e6
8.0e6
2 4 6 8 10 12 14 16 18 20 22 24 26 28 Time, min0 2 4 6 8 10 12 14 16 18 20 22 24 26 282 4 6 8 10 12 14 16 18 20 22 24 26 28 Time, min0
Inte
nsity
, cps
UV
m/z 325
19
absorbance chromatogram at 230 nm and the mass chromatogram for m/z 325, which
corresponds to the [M-H]- ion for the major component of the mixture, 4-
dodecylbenzenesulfonic acid. The UV trace again clearly indicates a mixture of
components. The MS data, however, expanded the suspected multiplicity of components
because two peaks with the same mass were observed which suggested the presence of
isomeric components. Slightly different product ion spectra for different isomers of
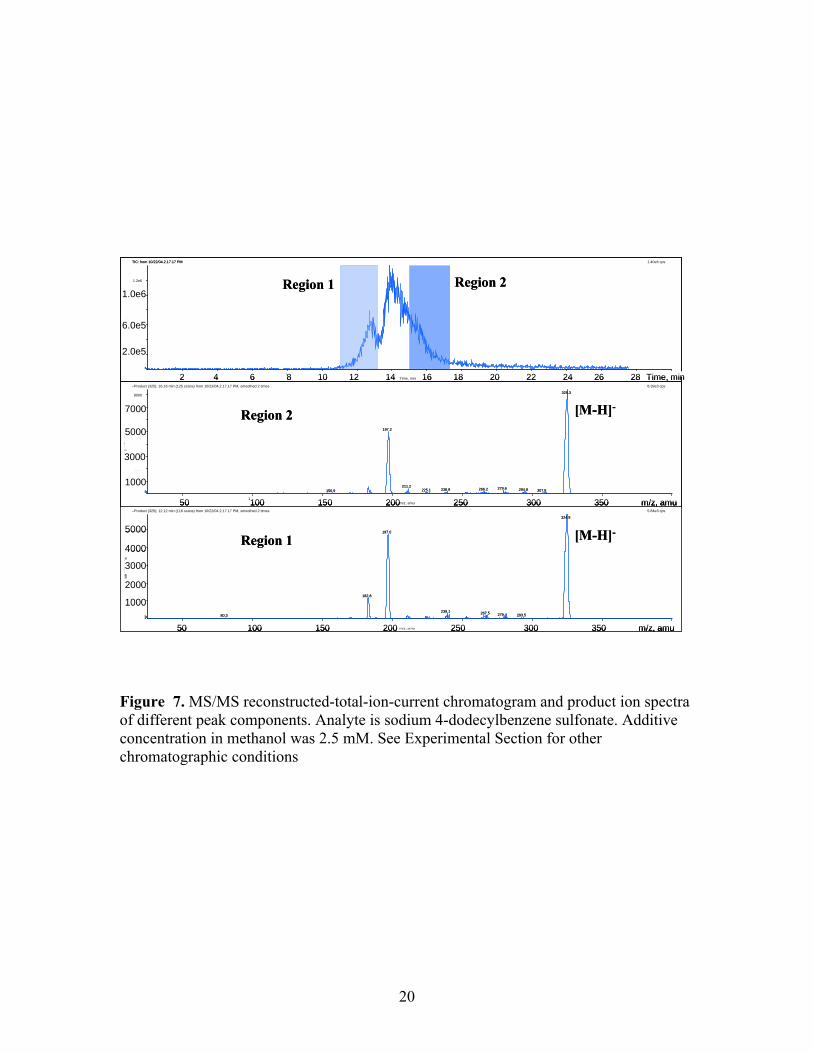
sodium 4-dodecylbenzenesulfonate might be expected. Figure 7 shows that, in this case,
the differences are apparent but subtle. Specifically, only a small change in the relative
abundance of one of the products of m/z 325 was evident. The data discussed above help
confirm that the chromatographic peak characteristics we have observed are originating
from various components in the sample rather than an undesirable chromatographic event
(or mechanism).
Good reproducibility for three injections onto each properly conditioned
stationary phase was observed. The highest relative standard deviation (n=3) for retention
time was less than 1%. The analyte eluted fastest from the most deactivated stationary
phase, Deltabond Cyano, and was retained the longest on the most active stationary
phase, silica.
Tetramethylammonium acetate (TMAA), tetrabutylammonium acetate (TBAA),
ammonium chloride, and lithium acetate were chosen to augment and evaluate the effect
of different salts as mobile phase additives. The same isobaric and isocratic conditions
were applied as in the ammonium acetate case to provide clearer information concerning
the effect of various additives and stationary phases. Figure 8 shows the effect of
different additives on the elution from the Deltabond Cyano column. While the positive
20
Figure 7. MS/MS reconstructed-total-ion-current chromatogram and product ion spectra of different peak components. Analyte is sodium 4-dodecylbenzene sulfonate. Additive concentration in methanol was 2.5 mM. See Experimental Section for other chromatographic conditions
1.40e6 cpsTIC: from 10/22/04.2.17.17 PM
2 4 6 8 10 12 14 16 18 20 22 24 26 28Time, min
2.0e5
4.0e5
6.0e5
8.0e5
1.0e6
1.2e6
Inte
nsity
, cps
5.84e3 cps–Product (325): 12.12 min (116 scans) from 10/22/04.2.17.17 PM, smoothed 2 times
80.3
182.8
197.0
239.1 267.5 279.4 293.5
324.9
50 100 150 200 250 300 350m/z, amu
1000
2000
3000
4000
5000
Inte
nsity
, cps
8.39e3 cps–Product (325): 16.16 min (125 scans) from 10/22/04.2.17.17 PM, smoothed 2 times
156.9
197.2
211.2225.1 238.9 266.2 279.6 294.8 307.8
325.3
50 100 150 200 250 300 350m/z, amu
1000
2000
3000
4000
5000
6000
7000
8000
Inte
nsity
, cps
[M-H]-
[M-H]-
Region 1 Region 2
Region 1
Region 2
6.0e5
1.0e6
2.0e5
5000
7000
3000
1000
4000
5000
2000
3000
1000
2 4 6 8 10 12 14 16 18 20 22 24 26 28 Time, min
50 100 150 200 250 300 350 m/z, amu
50 100 150 200 250 300 350 m/z, amu
1.40e6 cpsTIC: from 10/22/04.2.17.17 PM
2 4 6 8 10 12 14 16 18 20 22 24 26 28Time, min
2.0e5
4.0e5
6.0e5
8.0e5
1.0e6
1.2e6
Inte
nsity
, cps
5.84e3 cps–Product (325): 12.12 min (116 scans) from 10/22/04.2.17.17 PM, smoothed 2 times
80.3
182.8
197.0
239.1 267.5 279.4 293.5
324.9
50 100 150 200 250 300 350m/z, amu
1000
2000
3000
4000
5000
Inte
nsity
, cps
8.39e3 cps–Product (325): 16.16 min (125 scans) from 10/22/04.2.17.17 PM, smoothed 2 times
156.9
197.2
211.2225.1 238.9 266.2 279.6 294.8 307.8
325.3
50 100 150 200 250 300 350m/z, amu
1000
2000
3000
4000
5000
6000
7000
8000
Inte
nsity
, cps
[M-H]-
[M-H]-
Region 1 Region 2
Region 1
Region 2
6.0e5
1.0e6
2.0e5
5000
7000
3000
1000
4000
5000
2000
3000
1000
2 4 6 8 10 12 14 16 18 20 22 24 26 28 Time, min
50 100 150 200 250 300 350 m/z, amu50 100 150 200 250 300 350 m/z, amu
50 100 150 200 250 300 350 m/z, amu50 100 150 200 250 300 350 m/z, amu
21
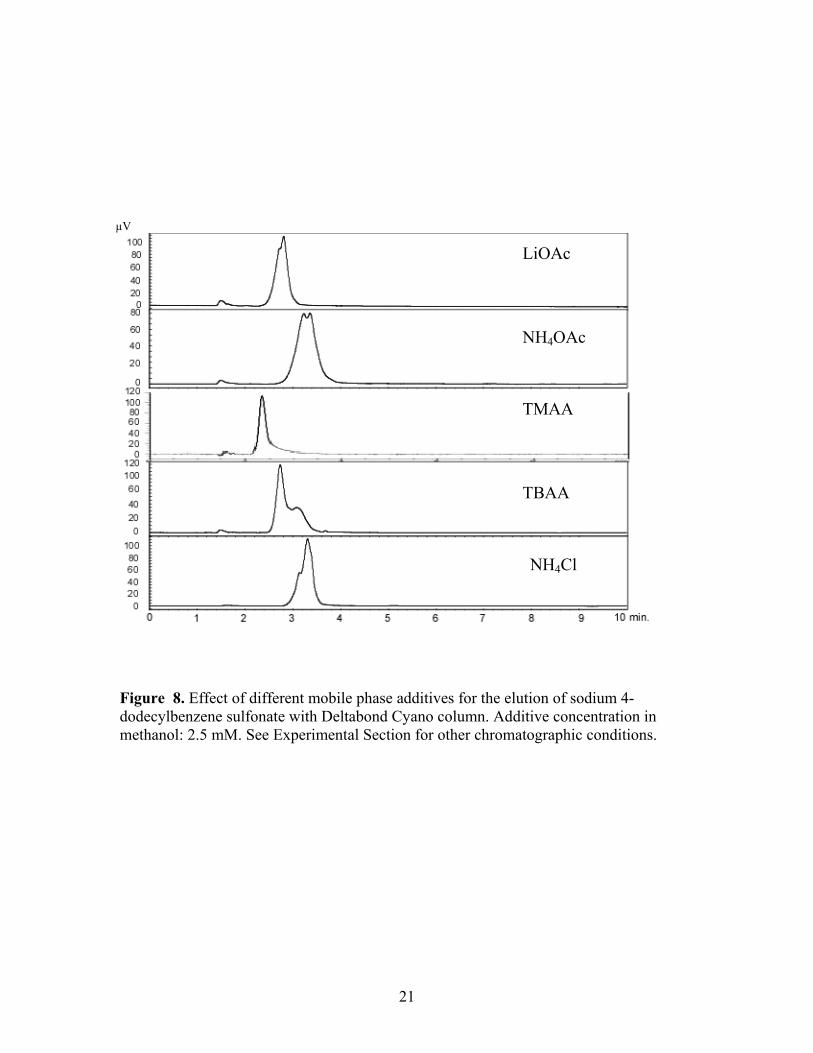
Figure 8. Effect of different mobile phase additives for the elution of sodium 4-dodecylbenzene sulfonate with Deltabond Cyano column. Additive concentration in methanol: 2.5 mM. See Experimental Section for other chromatographic conditions.
LiOAc
NH4OAc
TMAA
TBAA
NH4Cl
µV

22
effect of ammonium acetate was expected from previous reports, results for the other
additive salts were not expected and suggested a general phenomenon that seems to be
neither cation (e.g. ammonium, tetraalkylammonium, and lithium) nor anion (e.g. acetate
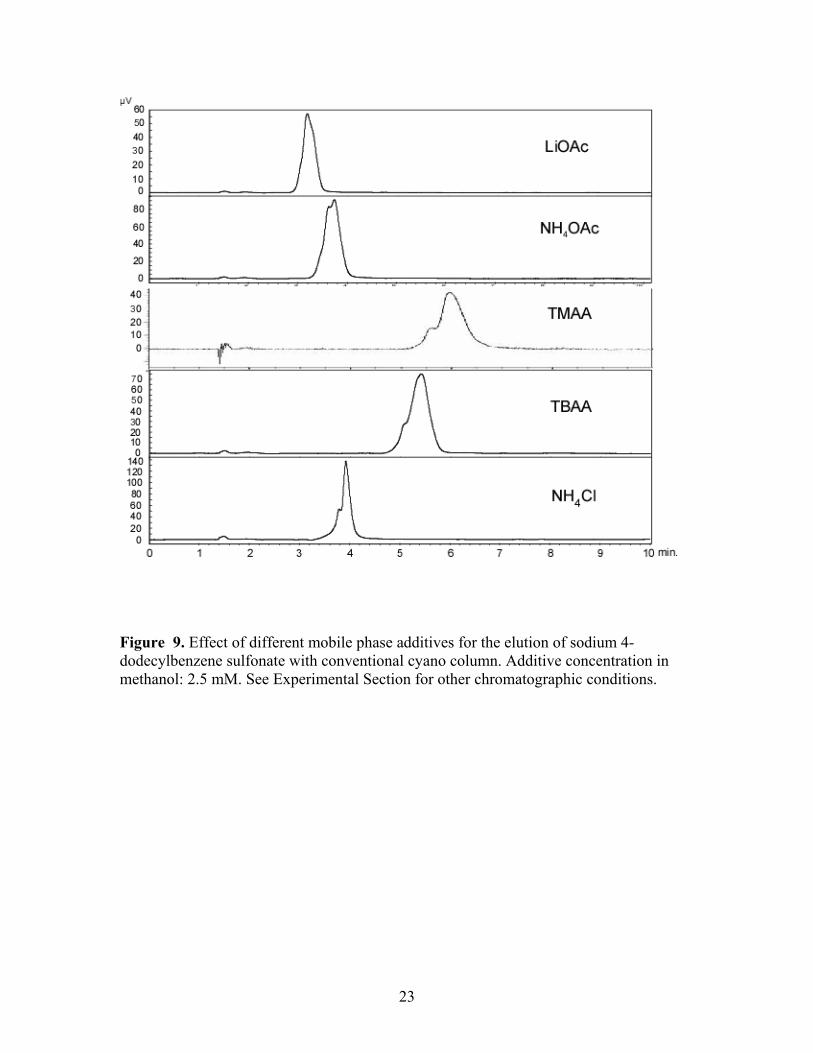
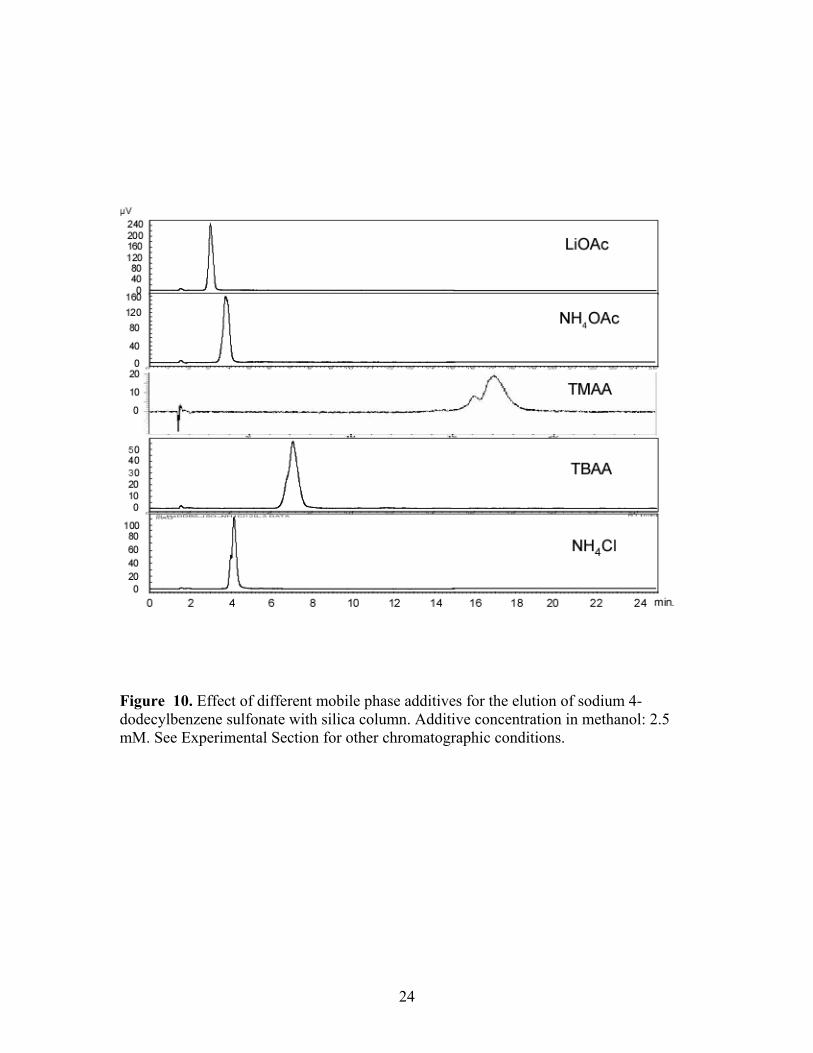
and chloride) specific. A similar effect on elution of the sulfonate from the conventional
cyanopropyl and silica columns with each additive was observed, Figures 9 and 10.
With the exception of TMAA on the silica column, the analyte was successfully and
isocratically eluted within 10 minutes in all situations. Interestingly, TMAA provided the
fastest elution on the Deltabond stationary phase among the five additives, but the longest
retention on the silica phase. Evidence for split peaks was observed in some instances as
was the case with ammonium acetate. The Deltabond Cyano phase and TBAA showed
the best resolution of the target analyte and its congeners under isocratic conditions.
The fact that bare silica yielded analogous results to the two bonded phases
suggests some alteration of the stationary phase by the additive is strategically involved.
Table 1 shows the average retention time and peak area of each analyte for each additive
on the three stationary phases with percent relative standard deviation (RSD) in
parenthesis. Good reproducibility was achieved since the highest RSD for retention time
was 2.35%. Although not shown, reproducibility with tetramethylammonium acetate was
equally good. From the highly deactivated Deltabond Cyano phase to the highly active
silica phase, the sulfonate was retained longer on the more active phase with the same
additive present. This is probably due to interaction between the negatively charged
sulfonate ion and the partial positive proton charge of residual, active silanol sites on the
solid support of the stationary phase.
23
Figure 9. Effect of different mobile phase additives for the elution of sodium 4-dodecylbenzene sulfonate with conventional cyano column. Additive concentration in methanol: 2.5 mM. See Experimental Section for other chromatographic conditions.
24
Figure 10. Effect of different mobile phase additives for the elution of sodium 4-dodecylbenzene sulfonate with silica column. Additive concentration in methanol: 2.5 mM. See Experimental Section for other chromatographic conditions.
25
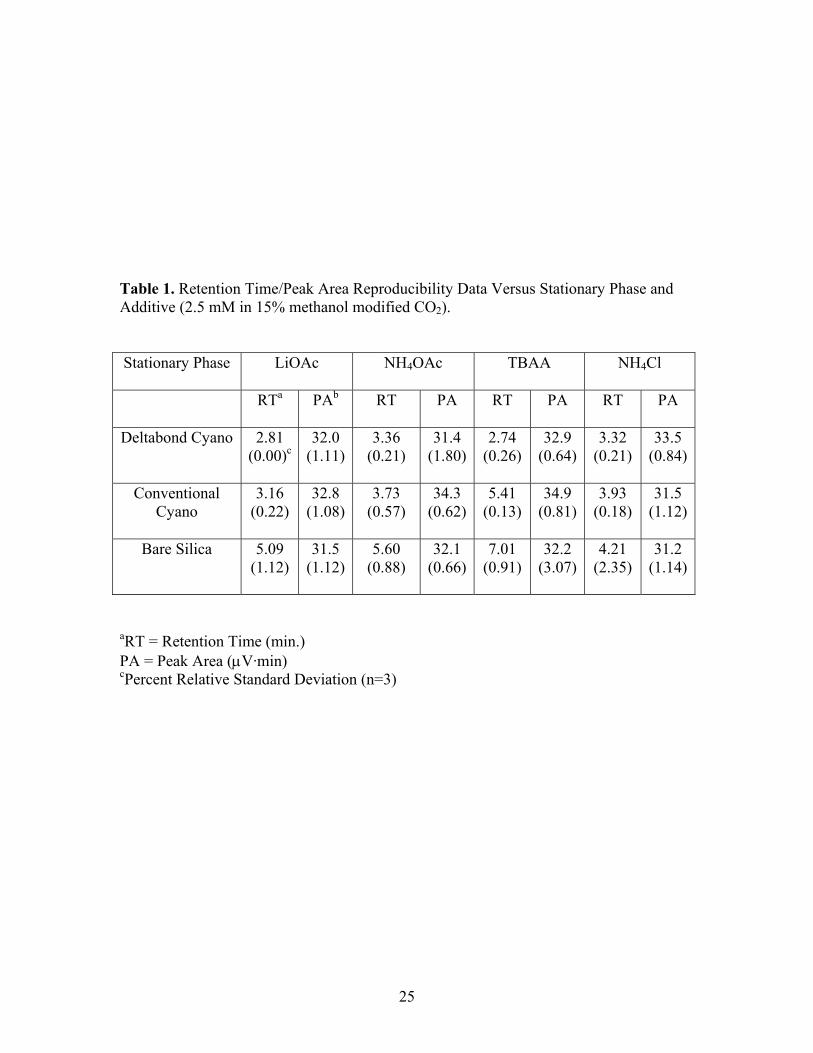
Table 1. Retention Time/Peak Area Reproducibility Data Versus Stationary Phase and Additive (2.5 mM in 15% methanol modified CO2).
Stationary Phase LiOAc NH4OAc TBAA NH4Cl
RTa PAb RT PA RT PA RT PA
Deltabond Cyano 2.81 (0.00)c
32.0 (1.11)
3.36 (0.21)
31.4 (1.80)
2.74 (0.26)
32.9 (0.64)
3.32 (0.21)
33.5 (0.84)
Conventional
Cyano 3.16
(0.22) 32.8
(1.08)3.73
(0.57) 34.3
(0.62)5.41
(0.13) 34.9
(0.81) 3.93
(0.18) 31.5
(1.12)
Bare Silica 5.09 (1.12)
31.5 (1.12)
5.60 (0.88)
32.1 (0.66)
7.01 (0.91)
32.2 (3.07)
4.21 (2.35)
31.2 (1.14)
aRT = Retention Time (min.) PA = Peak Area (μV·min) cPercent Relative Standard Deviation (n=3)

26
We also studied the effect of column outlet pressure on the elution of sodium 4-
dodecylbenzene sulfonate with the three stationary phases and five additives. In each
case, the analyte eluted slightly earlier at higher pressure than it did at lower pressure. We
believe this may be due to the greater solvating power of the mobile phase at higher
pressure.
In Pinkston’s previous work [36], 1.1 mM ammonium acetate was dissolved in
the modifier in order to elute highly polar compounds. We therefore decided to use
ammonium acetate to investigate any additive concentration effect with the Deltabond
column. Sodium 4-dodecylbenzene sulfonate did not elute with 0.01 mM or with 0.1 mM
NH4OAc in 25 minutes. The analyte, however, started to elute with methanol modifier
containing 0.25 mM NH4OAc as a very broad peak at about 11 minutes. With increased
concentration of additive in methanol, the analyte eluted faster and with a sharper peak
shape. At 2.5 mM, the analyte eluted at about 3 minutes compared to 11 minutes with
0.25 mM. We thought that it would be interesting to do the same concentration study
with bare silica. The analyte again did not elute with mobile phase modifier containing
0.1 mM NH4OAc, but started to elute with 0.25 mM NH4OAc. Interestingly, we found
that the sulfonate was retained more strongly on the silica column when the concentration
of NH4OAc in methanol was increased, which was the inverse of the trend we observed
with the Deltabond Cyano phase. These results suggested that different elution
mechanisms might dominate with the Deltabond Cyano and the silica phases.
When ionic salts are introduced into the primary modifier which is then added to
the nonpolar CO2, it is very important that the salts remain dissolved in the resulting
ternary mobile phase. Among the five additives we studied, ammonium chloride had the

27
worst solubility in methanol. When we tried, for example, to introduce methanol
containing 10.0 mM NH4Cl into the CO2 mobile phase, a significant increase in inlet
pressure was observed, which suggested the precipitation of the salt in column.
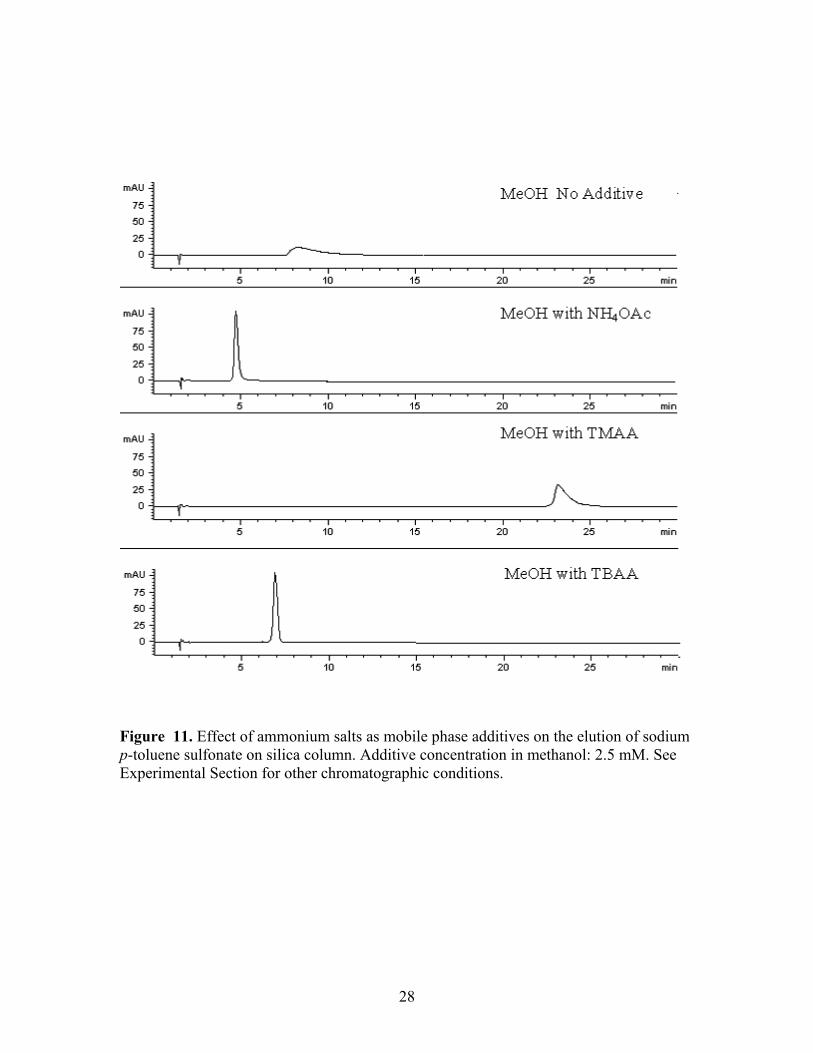
The effect of salt additives on the elution of two much purer congeners of sodium
4-dodecylbenzene sulfonate (e.g. sodium 4-octylbenzene sulfonate (OSNa) and sodium
p-toluene sulfonate (TSNa) was studied with the silica phase. The less complex
sulfonates either did not elute (OSNa) or eluted with poor peak shape (TSNa) when pure
methanol (15%) was used as the CO2 modifier, but both compounds eluted with good
peak shape when ammonium salts (2.5 mM) were added to the methanol. Each sulfonate
sodium salt eluted readily from the silica phase with either ammonium acetate, TMAA,
or TBAA as the mobile phase additive. The trend was very similar to the findings
obtained with sodium 4-dodecylbenzene sulfonate. TMAA provided the longest retention
time among the three ammonium salts; whereas both sulfonates eluted fastest with
ammonium acetate. Since these two sodium sulfonates were more pure than sodium 4-
dodecylsulfonate, as might be expected, the former two components yielded more narrow
chromatographic peaks. The results for TSNa are illustrated in Figure 11, for example.
The elution mechanisms envisioned in this study involve (1) modification of the
stationary phase by the ionic additive and (2) ion-pair formation between additive and
analyte. On the silica surface modification of the stationary phase may actually convert
the silica to an ion-exchange phase. This observation is prompted by the fact that when
higher concentrations of ammonium acetate were introduced (e.g. more sites were
modified by ammonium cations), the sulfonate was retained longer. On the other hand,
ion-pairing formation may be the dominating elution mechanism on the Deltabond Cyano
28
Figure 11. Effect of ammonium salts as mobile phase additives on the elution of sodium p-toluene sulfonate on silica column. Additive concentration in methanol: 2.5 mM. See Experimental Section for other chromatographic conditions.
29
phase since there should be fewer accessible silanol sites on the particle surface. In this
case, higher concentrations of ammonium acetate should result in more ion-pairing
between ammonium cation and sulfonate anions. Our results with the bonded phase
indicated that the analyte eluted faster at a higher concentration of additive. This bimodal
behaviour is most dramatically seen with the results afforded by tetramethylammonium
acetate.
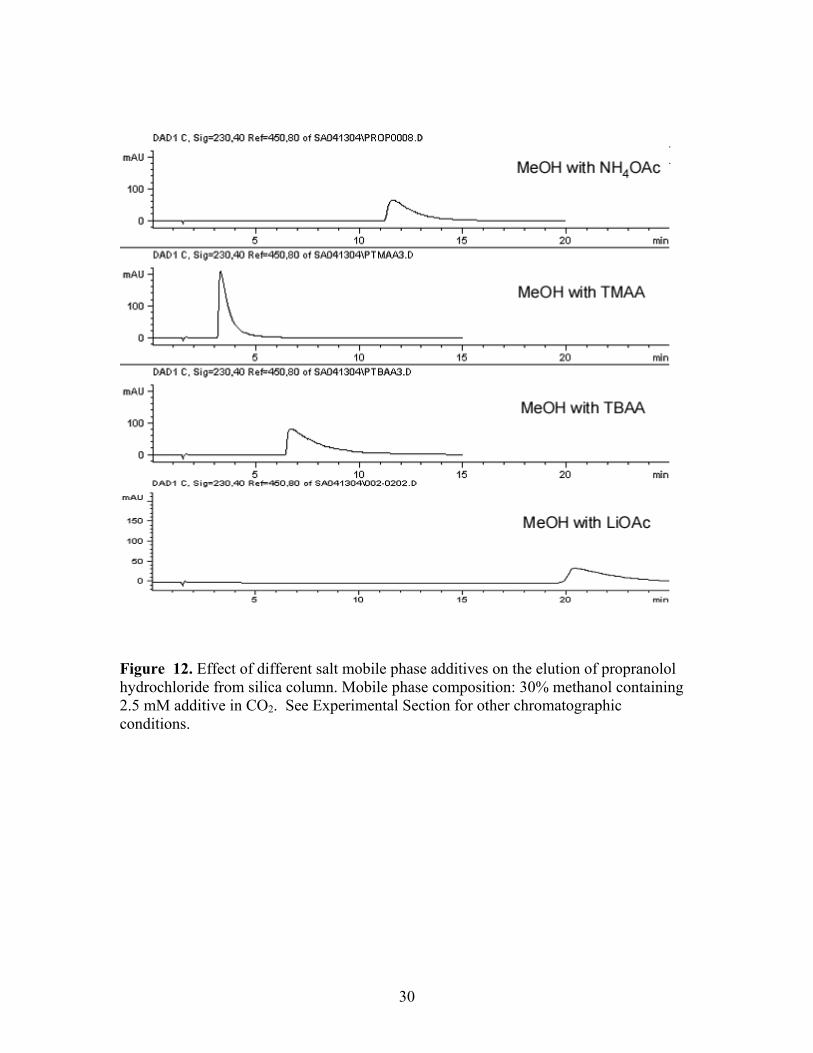
To gain a more thorough understanding of the general effect of salt additives in
the mobile phase, the elution of a secondary ammonium hydrochloride salt, propranolol
hydrochloride, on a silica phase was also studied. The cationic amine did not elute with
pure methanol as modifier even at concentrations as high as 40% methanol. Elution,
albeit with peak tailing, was achieved with 30% methanol containing 2.5 mM ammonium
acetate in CO2. The effect of various salts (2.5 mM) on the elution of the amine
hydrochloride on the silica phase is shown in Figure 12. In this case, TMAA provided
the fastest elution, and lithium acetate provided the longest retention of the analyte.
Ammonium acetate provided the strongest retention among the three quaternary
ammonium acetate salts. Importantly, the retention trend was opposite to that observed
for negatively charged sulfonate analytes in that TMAA gave the shortest retention time
for the amine hydrochloride. Unfortunately, this analyte, unlike the sulfonate salts, did
not yield sharp peaks on silica with any of the additives under isocratic conditions which
suggests that a different type of ionic additive may be required for elution of cationic
species.
30
Figure 12. Effect of different salt mobile phase additives on the elution of propranolol hydrochloride from silica column. Mobile phase composition: 30% methanol containing 2.5 mM additive in CO2. See Experimental Section for other chromatographic conditions.
31
2.4 CONCLUSIONS
In future work, we plan to use NMR and other spectroscopic methods to study the
interaction between additives and the stationary phases. We will also compare the various
salt additives using computational modelling methods. These methods, in combination
with the data presented here, may help shed more light on the retention and elution
mechanisms which dominate the CO2/modifier/salt additive/silica stationary phase
system.
The elution mechanisms envisioned in this study involve modification of the
stationary phase by the ionic additive and/or ion-pair formation between additive and
analyte. The exact elution mechanism for this study remains uncertain at this time.
Nevertheless, the data reported in this work are noteworthy: the ionic analytes were
eluted with a CO2-based mobile phase from a highly active packed column stationary
phase. Up to now, this achievement under these conditions would have been thought to
be highly unlikely. The exact role of the additive appears critical since each of the ionic
analytes was irreversibly retained on each of the same stationary phases with only
methanol as the modifier.

32
CHAPTER 3
Study of the Elution Mechanism of Sodium Aryl Sulfonates on Bare Silica and a
Cyano Bonded Phase with Methanol-Modified Carbon
Dioxide Containing an Ionic Additive
3.1 INTRODUCTION
Traditionally, the application of packed column supercritical fluid
chromatography (SFC) was thought to be limited to non-polar and moderately polar
analytes because of (a) the weak solvating power of the mobile phase, which typically
was supercritical carbon dioxide, and (b) the strong irreversible interaction between
analytes and residual active silanol groups associated with silica-based bonded stationary
phases.
The active silanol sites on silica-based stationary phases can irreversibly adsorb
highly polar solutes, especially when the mobile phase does not have sufficient solvating
power. End-capping with trimethylchlorosilane has been used to reduce the number of
residual silanol sites. Due primarily to steric hindrance and a highly porous solid support,
all silanol sites on the silica surface cannot be removed by this treatment. Polymer-
coated, bonded stationary phases have been shown to provide a higher degree of
deactivation. Berger et al.[12] and Ashraf-Khorassani et al.[11], for example, reported
that a polymer-coated cyanopropyl (e.g. Deltabond) phase significantly improved
chromatographic peak shapes of eluted phenols, anilines, and benzylamines compared to
33
a non-deactivated cyanopropyl phase. This was thought to be due to the presence of
fewer accessible active silanol sites on the polymer-coated phase.
An alternative strategy in this chromatographic area has been to increase the
solvating power of supercritical CO2 by the addition of small amounts of polar organic
mobile phase modifiers, such as methanol, 1-propanol, and acetonitrile [16-19,38].
While these binary mobile phases significantly improved the elution of polar analytes in
SFC, they are still not sufficiently solvating to elute highly polar or ionic compounds due
to the fact that the organic solvents that are miscible with carbon dioxide are not
sufficiently polar.
The addition of a small amount of a very polar component to the mobile phase
modifier has been shown to further enhance chromatographic performance. More
specifically, solvatochromic studies showed that, for example, a low concentration of
trifluoroacetic acid (TFA) dramatically improved the solvating power of methanol-
modified CO2 [20]. Such very polar, low molecular weight compounds, called additives,
improved chromatographic peak shape and allowed the elution of solutes that would
otherwise be very strongly retained by silica-based packed column stationary phases.
Both low molecular weight organic acids and bases have been utilized as mobile phase
additives in SFC to facilitate elution of moderately acidic and basic analytes [20-23,27-
31]. In addition to enhancing the solvating strength of the mobile phase, suppression of
analyte ionization by the polar additive was believed to be a competing mechanism of
action [12,21].
In addition to (1) enhancing the solvating power of the mobile phase and (2)
deactivating the stationary phase, ion-pairing of the ionic analyte with the additive in the
34
supercritical fluid mobile phase has been successfully demonstrated to a limited degree
[24,25]. Successful elution of propranolol hydrochloride from a cyano packed column
with 25 mM sodium heptane sulfonate (HSNa) in methanol-modified CO2 has been
reported. Without HSNa in the mobile phase, the analyte failed to elute. Solubility of the
ion-pairing reagent (i.e. additive) in the mobile phase was suggested to be a critical
feature in the success of the ion-pair SFC elution mechanism.
In another study, ammonium acetate, ammonium formate, and ammonium
carbonate were each recently reported to be effective SFC mobile phase additives for the
successful elution of several organic ions from packed columns, which up to that point
were either very strongly or irreversibly retained on the stationary phase [36]. The
authors suggested two possible roles for the ammonium salts: (1) charge neutralization
via ion-pairing formation between the solute and additive and (2) charge introduction to
the stationary phase by exchange of silanol hydrogen for ammonium ion followed by
anion exchange of the analyte.
In our previous research [39], we successfully eluted three sodium aryl sulfonates
with various ammonium salts added to the primary modifier at a concentration of 2.5 mM
from Deltabond cyanopropyl, conventional cyanopropyl, and bare silica phases. In some
cases, we found that lithium acetate as an additive was even effective in promoting
elution. We discovered that different stationary phases yielded different analyte retention
properties when the same mobile phase additive was used. Moreover, with the same
analyte and stationary phase, various ammonium salts gave rise to different analyte
retention times. This study addresses our desire to understand more thoroughly the

35
retention and elution mechanisms of ionic sulfonates on both a deactivated cyano phase
and a bare silica phase with ionic mobile phase additives.
Solid state nuclear magnetic resonance (NMR) spectroscopy, with the help of
cross polarization and magic angle spinning (CP-MAS), has been widely used to provide
valuable structural information concerning the surface of bare and bonded silica
stationary phases [40-44]. Three types of silicon atoms can be identified on the bare silica
surface by solid state 29Si NMR (i.e., silicon bonded to two, one, or no hydroxyls). Thus,
we decided to use this technique to investigate the interaction between ionic mobile phase
additives and the silica stationary phase.
In this work, we have studied the elution mechanism of sodium sulfonates on both
Deltabond cyanopropyl and bare silica phases with three ammonium salts as the mobile
phase additive. Solid state 29Si NMR spectroscopy provided some insight concerning the
interaction of the mobile phase additive with the silica-based stationary phase.
Computational calculations concerning the charge distribution on various ammonium
salts were also performed in an effort to explain the elution behavior of ionic sulfonates
observed with the various additives. To support our hypothesis of the retention
mechanism, the acidity of CO2 and methanol mixture solvent was also discussed.
3.2 EXPERIMENTAL
3.2.1 Chemicals
Methanol was HPLC grade, (EMD, Durham, NC USA). The carbon dioxide was
SFE/SFC grade (Air Products and Chemicals, Inc., Allentown, PA USA) with no helium

36
head pressure. Ammonium acetate (AA) (99%, ACS grade), tetramethylammonium
acetate (TMAA) (90%, tech. grade), and tetrabutylammonium acetate (TBAA) (97%)
were obtained from Sigma Aldrich (Milwaukee,WI USA). Ammonium chloride was
purchase from J.T. Baker Inc. (Phillipsburg, NJ USA). Silica packing material with a
particle size of 5 μm was donated by Supelco (Bellefonte, PA USA). Universal indicator
solution with pH range 4-10 (It consists with four indicators: phenolphthalein disodium
salt, bromothymol blue sodium salt, methyl red sodium salt, and thymol blue sodium
salt.) and bromocresol green solution (0.04%, aqueous) with pH range of 4.0-5.4 were
obtained from Fisher Scientific (Fair Lawn, NJ USA). Methyl red sodium salt solution
(0.1%, aqueous) with pH range of 3.1-4.4 was obtained from LabChem, Inc. (Pittsburgh,
PA USA).
Sodium para-normal dodecylbenzene sulfonate (tech. grade), sodium 4-
octylbenzene sulfonate (97%), and sodium para-toluene sulfonate were purchased from
Sigma Aldrich. A solution of each sample was prepared in methanol at a concentration of
approximately 0.5 mg/mL.
3.2.2 SFC/UV Instrumentation
The SFC system was a Berger Instruments Analytical SFC Instrument (Newark,
DE USA) with a Hewlett Packard (Little Creek, DE USA) Model 1050 Diode Array
Detector, which employed a 13-μL high pressure flow cell (10-mm path length) and
Berger Instruments 3D SFC ChemStation software, version 3.4.
The chromatographic columns were Deltabond Cyano (Thermo Hypersil-
Keystone, Bellefonte, PA USA), and Supelcosil LC-Si. The column dimensions were 25
37
cm in length and 4.6 mm ID, with a particle size of 5 μm for each stationary phase.
Supelcosil LC-Si had a pore size of 120 Å, while Deltabond Cyano had a pore size of 200
Å.
Unless otherwise specified, chromatographic conditions were: injection volume
10 μL, mobile phase flow rate 2 mL/min (measured in the liquid state), column outlet
pressure 120 bar, and column oven temperature 40°C. The isocratic mobile phase
composition was 15% modifier in CO2, unless specified. The modifier consisted of either
pure methanol or methanol with 2.5 mM ammonium salt.
Between each change of mobile phase additive, the stationary phase was
regenerated with 90% pure methanol for about fifteen minutes (about nine column
volumes) in order to purge previous additive solution from the system, or to remove
analyte that had interacted with the stationary phase. After this time period, the next
additive solution was introduced to the SFC system, and the column was equilibrated
again for 30 minutes prior to injection.
3.2.3 Solid State CP-MAS NMR Spectroscopy
29Si CP-MAS spectroscopy was performed on a Bruker MSL300 operating at
59.601 MHz. Magic Angle Spinning parameters were 45° pulse with proton decoupling
and a recycle delay of 15 s. For CP-MAS, a recycle delay of 5 s and a contact time of 4
ms were used.
The weights of samples placed in the rotor were as follows: 143.1 mg for
untreated silica gel; 169.3 mg of silica gel treated with methanol/NH4OAc; 205.8 mg of

38
silica gel treated with methanol/TMAA, and 227.5 mg of silica gel treated with
methanol/TBAA. All NMR spectra employed a fixed number of scans (27 000).
The supercritical fluid treated samples were prepared by packing a 2.5 mL
extraction vessel about 40 % full with silica packing material. The rest of the space was
filled with a glass rod. The vessel was flushed for one hour with supercritical CO2
containing 15% or 20% modifier (e.g. pure methanol or methanol containing 2.5 mM of
additive) with an outlet pressure of 120 bar and an oven temperature of 40 ºC.
3.2.4 Computational Chemistry
The structures of three ammonium additives, AA, TMAA, and TBAA, were
sketched into the CAChe Worksystem Pro Version 6.1 (Fujitsu CAChe Group,
Beaverton, OR USA) on a Dell Dimension 2350 computer running Microsoft Windows
2000 operating system. The optimized geometry of the molecules was calculated based
on the postulate that the molecules take the form with the lowest energy. The optimized
geometry of individual atom was generated by three different methods: AM1 geometry;
AM1 geometry including solvent (water) effect; and B88-LYP DFT geometry. The first
two methods are semi-empirical methods and the third one is a DGauss calculation that
provides an approximate solution to the Schrödinger equation using only mathematical
approximation [45].
3.2.5 Study of the Acidity of CO2/methanol Mixed Solvent
A stable flow of CO2 gas at atmospheric pressure was provided by the waste
outlet of the Berger SFC system. Before this source of CO2 was used, the SFC system
39
was flushed with CO2/methanol (v/v 10/90) at 40 ºC and 60 bar for about 15 minutes to
remove any possible residue of additives or analytes from the SFC system, then pure CO2
was pumped through the system at 2 mL/min (measured as a liquid at the pump) for
sufficient time to remove the methanol.
Three pH indicators were used: a “universal indicator”, methyl red, and
bromocresol green. They were in aqueous solution, and we knew that CO2 would react
with the water from the indicator solution to give a color shift to the acidic range. After
dropping about 0.5 mL of each indicator into three flasks, water was removed by mild
heating on a hot plate and a stream of N2 gas. One hundred milliliters of methanol was
then added to two flasks containing the dried pH indicator. One hundred milliliters of
water was placed in the third flask with the indicator solution. One of the methanol
solutions served as a blank to compare to the methanol mixed with CO2 and water mixed
with CO2.
Gaseous CO2 was then bubbled into one flask containing the methanolic solution
and the flask containing the aqueous solution. Sufficient time was allowed for the color to
stabilize. Once the color stabilized, we assumed that the solvents were saturated with
CO2.
To give a better estimation of the pH value of CO2/methanol, an ammonium
chloride aqueous solution was made with universal indicator to match the color of CO2-
saturated methanol. A Corning pH meter 320 (Corning, New York USA) was used to
measure the pH value of the NH4Cl aqueous solution.
3.3 RESULTS AND DISCUSSION
40
3.3.1 Additive Concentration Study
Due to the fact that ionic compounds have been shown not to elute in SFC even
with methanol-modified CO2 as the mobile phase [36], we wanted to determine the
lowest concentration of ionic additive whereby the ionic sulfonates would elute. We
chose sodium dodecylbenzene sulfonate as the probe analyte and ammonium acetate as
the probe additive.
A systematic study concerning the elution of the probe analyte with various
concentrations of ammonium acetate in methanol was performed on both Deltabond
Cyano and bare silica columns. Sodium dodecylbenzene sulfonate did not elute in 25
minutes from either stationary phase with 15% modifier containing either 0.01 mM or 0.1
mM NH4OAc. The analyte, however, eluted isocratically from the Deltabond Cyano
column with 15% methanol modifier containing 0.25 mM NH4OAc as a very broad peak
at about 11 minutes, Figure 13. With increased concentration of additive in 15%
methanol, the analyte eluted even earlier from the bonded phase column and with a
sharper peak shape. For example, at 2.5 mM additive the analyte eluted in about 3
minutes compared to 11 minutes with 0.25 mM additive. Interestingly, we found that the
sulfonate analyte eluted much earlier with 0.25 mM additive on the silica column than on
the bonded-phase column. In contrast on silica, retention actually increased to a point and
levelled off when the concentration of NH4OAc in methanol was increased. For example
at 15% methanol containing 0.25 mM additive, elution from the bare silica column was
slightly less than four minutes. While at 15% methanol containing 2.5 mM additive,
elution of the analyte increased to approximately six minutes.

41
Figure 13. Retention time of sodium dodecylbenzenesulfonate on bare silica and Deltabond Cyano columns with different concentrations of ammonium acetate as mobile phase additive. Outlet pressure: 120 bar; oven temperature: 40 ºC; flow rate: 2 mL/min.
Concentration of ammonium acetate in modifier (mM)
0
2
4
6
8
10
12
0 0.5 1 1.5 2 2.5 3
Deltabond Cyano Silica
Ret
entio
n Ti
me
(min
.)
42
In order to attempt an explanation of these findings a consideration of the factors
that influence retention in the absence of ammonium acetate should be initially made. We
envision at least two contributors to retention: (1) an irreversible interaction of the
sulfonate analyte with the bare silica or the silica support in the Deltabond column case
and (2) a dispersion (nonpolar-nonpolar/dipole-induced dipole) interaction of the alkyl
chain and/or aryl ring of the analyte with the cyano groups and the siloxane polymer of
the cyano-modified polysiloxane coating on the Deltabond phase.
On the Deltabond Cyano column after all the silanol protons that would cause
irreversible retention are exchanged for ammonium salts, ion-pairing formation between
the sulfonate and ammonium cation may be the dominant mechanism. In this case, higher
additive concentrations may lead to formation of more ion-pairs and thus faster elution
would be achieved. Alternatively, as the ammonium acetate concentration in the mobile
phase rises, it increasingly interacts with the cyano-modified polysiloxane coating. Cyano
groups (e.g. permanent dipoles) would interact with ammonium cations, which then
would interact with acetate ions. From the analyte's perspective, the stationary phase
would present fewer and fewer bare cyano groups and more and more cyano units that
are associated with ammonium cations. The cyano groups would be less available to
interact directly with the analyte and thus cause retention via the alkyl/aryl part of the
sulfonate to decrease.
On the other hand, with a bare silica phase, modification of the stationary phase
by the additive may be the dominant mechanism, Figure 14. In other words, an
ammonium cation might displace a proton and attach itself to the silanol oxygen thereby
deactivating the silica stationary phase. We then speculate that sulfonate anion would
43
then form weaker ion pairs with the partially charged ammonium-modified stationary
phase than with the fully protonated silanol site. As the ammonium acetate concentration
increases in the mobile phase, one soon reaches the point where all the silanol protons
that would cause irreversible retention are exchanged for ammonium salts. Irreversible
retention no longer takes place and analytes elute with good peak shape. The ammonium
ions bound to the silanols still retain a partial positive charge, and likely interact with
acetate and/or sulfonate analyte ions in the mobile phase. The relatively large amount of
acetate anion in the mobile phase is then hypothesized to replace any sulfonate from the
ammonium-modified stationary phase resulting in elution of the sulfonate as shown again
in Figure 14. Unlike the irreversible interaction that probably exists between the
sulfonate and the bare silica surface silanols, the interaction between NH4+ (or
tetraalkylammonium ion) that is attached to the silica stationary phase and the sulfonate
is more reversible.
In the silica study, the higher concentration of ammonium acetate in the mobile
phase led to a longer retention time for the sulfonate in contrast to the similar study just
discussed with the Deltabond Cyano phase. An explanation for this phenomenon is not
straightforward. As the ammonium acetate concentration increases further, we likely
form a pseudo-bonded phase (or layer) of acetates that interact with stationary phase
“bound” ammonium ions. The nonpolar acetate tails would interact with the analytes by
dispersion. This would cause retention to increase slightly until all the silica surface is
covered by this pseudo-phase. An alternate hypothesis is that more than a monolayer of
ammonium ion coverage on the silica is possible via interaction with the layer of acetates
that cover the pseudo-stationary phase. Subsequent layers of ammonium ion would carry
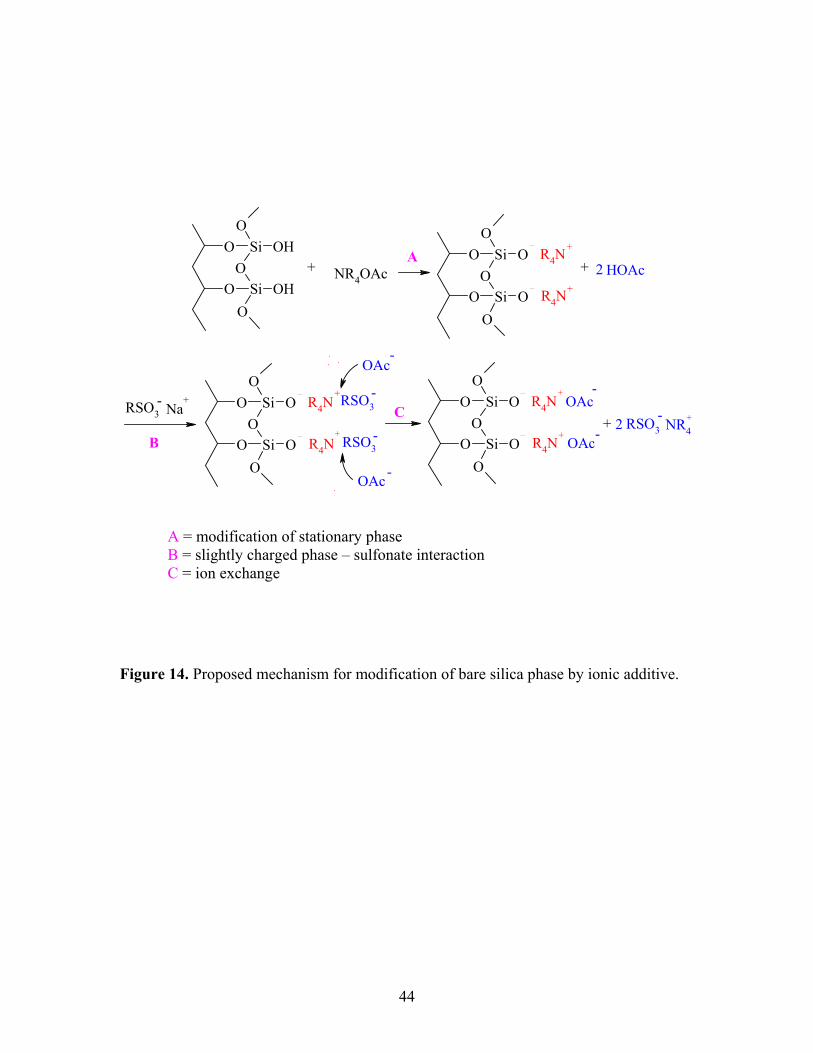
44
A = modification of stationary phase B = slightly charged phase – sulfonate interaction C = ion exchange
Figure 14. Proposed mechanism for modification of bare silica phase by ionic additive.
RSO3
O
O
Si
SiO
O
OOH
OHNR4OAc HOAc
O
O
Si
SiO
O
OO
O
O
O
Si
SiO
O
OO
O
O
O
Si
SiO
O
OO
O
R4N
R4N
RSO3R4N
RSO3R4N
R4N
R4N
OAc
OAc
OAc
OAc
RSO3 Na+
NR4
+ +
+
+
+
-+
-+
+
+
-
-
-
--
-
2
2
A
C
B
+
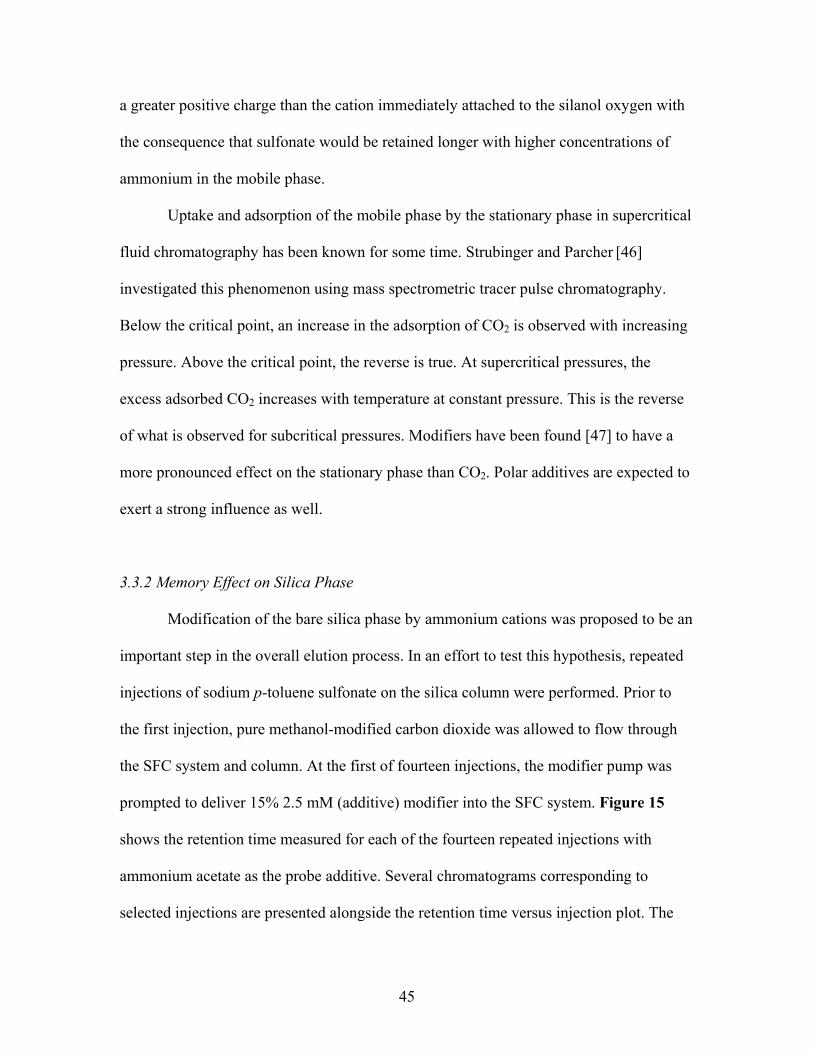
45
a greater positive charge than the cation immediately attached to the silanol oxygen with
the consequence that sulfonate would be retained longer with higher concentrations of
ammonium in the mobile phase.
Uptake and adsorption of the mobile phase by the stationary phase in supercritical
fluid chromatography has been known for some time. Strubinger and Parcher [46]
investigated this phenomenon using mass spectrometric tracer pulse chromatography.
Below the critical point, an increase in the adsorption of CO2 is observed with increasing
pressure. Above the critical point, the reverse is true. At supercritical pressures, the
excess adsorbed CO2 increases with temperature at constant pressure. This is the reverse
of what is observed for subcritical pressures. Modifiers have been found [47] to have a
more pronounced effect on the stationary phase than CO2. Polar additives are expected to
exert a strong influence as well.
3.3.2 Memory Effect on Silica Phase
Modification of the bare silica phase by ammonium cations was proposed to be an
important step in the overall elution process. In an effort to test this hypothesis, repeated
injections of sodium p-toluene sulfonate on the silica column were performed. Prior to
the first injection, pure methanol-modified carbon dioxide was allowed to flow through
the SFC system and column. At the first of fourteen injections, the modifier pump was
prompted to deliver 15% 2.5 mM (additive) modifier into the SFC system. Figure 15
shows the retention time measured for each of the fourteen repeated injections with
ammonium acetate as the probe additive. Several chromatograms corresponding to
selected injections are presented alongside the retention time versus injection plot. The
46
Figure 15. (A) Retention times for fourteen repeated injections of a sodium p-toluene sulfonate solution on a silica column. Injections 1-5: modifier contained 2.5 mM ammonium acetate; Injections 6-14: modifier was pure methanol. (B) Selected chromatograms from the fourteen separations.
0
2
4
68
10
12
14
0 5 10 15
Run Number
Ret
entio
n Ti
me
(min
.)
2.5 mM NH4OAc in MeOH as modifier
Pure MeOH as modifier
0
2
4
68
10
12
14
0 5 10 15
Run Number
Ret
entio
n Ti
me
(min
.)
0
2
4
68
10
12
14
0 5 10 15
Run Number
Ret
entio
n Ti
me
(min
.)
2.5 mM NH4OAc in MeOH as modifier
Pure MeOH as modifier
Run #1
Run #2
Run #5
Run #7
Run #12
Run #14
Run #1
Run #2
Run #5
Run #7
Run #12
Run #14
A
B
47
retention time quickly decreased from 12.79 minutes for the first injection to 8.66
minutes for injections 2-5. This suggested that it took about 15 minutes (i.e. run time of
one injection) for the column and mobile phase to reach equilibrium. At the beginning of
the sixth injection, pure methanol modifier was re-introduced to the SFC system. When
we changed the modifier, the tubing that connected modifier bottle and the system was
not filled with new modifier. Thus, it took about 8 minutes for the new modifier (i.e. pure
methanol) to get into the column under the experimental conditions. This means that
when the 6th injection was made, the mobile phase in the column was still 15% 2.5 mM
(additive) methanol, therefore the sulfonate still eluted around eight minutes at the sixth
injection. With subsequent injections, retention time increased to approximately ten
minutes and levelled off. Even though the retention time did not change appreciably after
ammonium acetate was removed, the peak shapes were degraded and tailed badly without
the additive in the mobile phase. Failure of the retention time to return to its original near
13 minutes suggested that NH4OAc not only modified the silica surface, but was retained
on it. If necessary the silica column could be regenerated with 90% methanol/10% carbon
dioxide for 15 minutes. After this treatment, however, the sulfonate failed to elute with
pure methanol as the modifier, which suggested that the additive eventually could be
displaced. At lower concentrations of methanol-modifier, the additive probably can be
removed, but more column volumes are needed.
Similar experiments were performed on the silica column with the
tetraalkylammonium acetate salts as mobile phase additives, TBAA and TMAA. Figure
16 shows the measured retention time for the 14 repeated injections with TBAA as probe
additive. As in the previous case, TBAA was initially introduced to the modifier pump at

48
Figure 16. (A) Retention times for fourteen repeated injections of a sodium p-toluene sulfonate solution on a silica column. Injections 1-5: the modifier contained 2.5 mM TBAA; Injections 6-14: modifier was pure methanol. (B) Selected chromatograms from the fourteen injections.
02468
101214161820
0 2 4 6 8 10 12 14 16
Run Number
Ret
entio
n Ti
me
(min
.)
2.5 mM TBAA in MeOH as modifier
Pure MeOH as modifier
02468
101214161820
0 2 4 6 8 10 12 14 16
Run Number
Ret
entio
n Ti
me
(min
.)
2.5 mM TBAA in MeOH as modifier
Pure MeOH as modifier Run #1
Run #2
Run #5
Run #7
Run #12
Run #14
Run #1
Run #2
Run #5
Run #7
Run #12
Run #14
A
B

49
the first injection and was removed at the sixth injection. The p-toluene sulfonate analyte
isocratically eluted at about 18 minutes for the first injection. The retention time was
shortened to about 9.5 minutes and fairly good reproducibility was achieved with the
third, fourth, and fifth injections. This may suggest that it takes about thirty minutes for
the column and the mobile phase to reach equilibrium. After TBAA was removed from
the mobile phase, a strong memory effect similar to that found with ammonium acetate
was observed. Retention time slightly increased from near 9.3 minutes to only 10 minutes
for the subsequent nine injections. The greatest change in retention time after the removal
of the TBAA additive was between injections 6 and 8 (e.g. 9.35 to 9.92 minutes).
Figure 17 shows the memory effect observed with TMAA as mobile phase
additive on the silica column. From our previous study [39] , TMAA was observed to
provide the longest retention time for selected sulfonates on the silica column. This could
be due to the greater residual surface charge on TMAA as opposed to TBAA and the
ammonium ion, vide infra. A greater surface charge on the stationary phase would result
in a slightly longer sulfonate retention time. When equilibrium was reached in this case,
retention time for p-toluene sulfonate was about 16.6 minutes. However, it took a much
longer time for the column and mobile phase to reach equilibrium with TMAA as the
additive than with ammonium acetate or TBAA. When TMAA was removed from the
modifier after the fifth injection, a memory effect was again observed as with the other
two additives such that sulfonate analyte could be eluted with pure methanol as the
modifier.
Similar experiments involving repeated injections were performed on the
Deltabond Cyano column with ammonium acetate as the ionic additive (Figure 18).

50
Figure 17. (A) Retention times for twelve repeated injections of a sodium p-toluene sulfonate solution on a silica column. Injections1-5: the modifier contained 2.5 mM TMAA; Injections 6-12: modifier was pure methanol. (B) Selected chromatograms from the fourteen injections.
Run #1
Run #2
Run #5
Run #7
Run #12
Run #14
Run #1
Run #2
Run #5
Run #7
Run #12
Run #14
0
5
10
15
20
25
0 2 4 6 8 10 12 14
Run Number
Ret
entio
n Ti
me
(Min
.)
2.5 mM TMAA in MeOH as modifier
Pure MeOH as modifier
0
5
10
15
20
25
0 2 4 6 8 10 12 14
Run Number
Ret
entio
n Ti
me
(Min
.)
2.5 mM TMAA in MeOH as modifier
Pure MeOH as modifier
B
A

51
Figure 18. Repeated injections of sodium p-toluene sulfonate on a Deltabond Cyano column. Injections 1-5: the modifier contained 2.5 mM ammonium acetate; Injections 6-14: modifier was pure methanol.
Run # 7
Run # 6
Run # 5
Run # 4
Run # 3
Run # 2
Run # 1

52
After purging the modifier pump with methanol, 15% 2.5 mM NH4OAc in methanol
modifier was introduced as soon as the first injection was initiated. Once reproducible
chromatograms were achieved, the mobile phase modifier was changed back to pure
methanol (after the fifth run). Again, due to the modifier delay time, the mobile phase in
the column contained NH4OAc such that the sulfonate eluted in run 6 in similar fashion
to the previous injection. By the seventh injection, however, the mobile phase on the
column no longer contained NH4OAc, and sulfonate no longer eluted. Thus, no memory
effect was observed with the Deltabond Cyano phase, in striking contrast to the bare
silica phase. In this case, ion-pairing formation between the analyte and NH4OAc is a
reasonable elution mechanism.
3.3.3 Solid State NMR Study of Silica Phase
Solid state NMR of bare silica was studied to provide some insight concerning the
additive-stationary phase interaction. By using magic angle spinning (MAS) with cross
polarization, proton magnetization can be transferred to diluted hetero nuclei such as 29Si.
This allows various surface species on silica to be distinguished. Structural elements of
bare silica consist of Q2, Q3, Q4 species where the superscripts indicate the number of Si-
O-Si linkages (Figure 19). These three species can be easily distinguished by their
corresponding chemical shifts at -92, -101, and -110 ppm, respectively [42]. Since all of
the spectra were obtained using a fixed number of scans, the peak intensity can be used to
compare the abundance of each group. The S/N ratio of Q3 (-Si-OH groups) was
measured and was normalized to the peak intensity per mg of each sample. The result is
found in Table 2. After being flushed with supercritical CO2 modified by 15% methanol
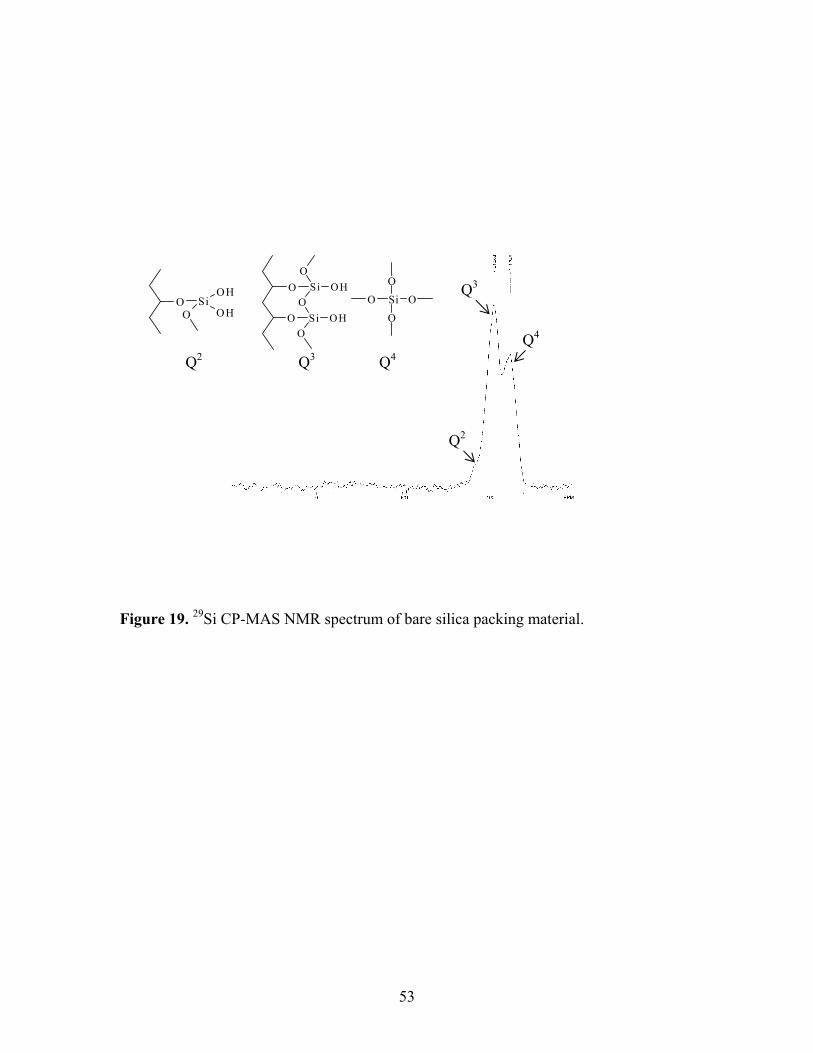
53
Figure 19. 29Si CP-MAS NMR spectrum of bare silica packing material.
Si
O
O
O
O
Q4 Q3
O SiO
OOH
Si OHO
O
Q2
O SiO
OH
OH
Q2
Q3
Q4

54
Table 2. Q3 peak intensity per mg of silica and the percentage of free silanol groups covered by ammonium additive.
Q3 peak intensity I=S/N
Q3 peak intensity/mg of sample (×10-2)
% of modified Si-OH groups
Untreated silica 31.1 21.7 -- Silica treated with
AA 26.4 15.6 28%
Silica treated with TMAA
33.3 16.2 25%
Silica treated with TBAA
38.5 16.9 22%

55
containing 2.5 mM ammonium acetate for about 60 minutes, the protons on about 28% of
total Si-OH groups were no longer detected. The corresponding values for
tetramethylammonium acetate and tetrabutylammonium acetate were 25% and 22%,
respectively. We presume that the protons were no longer detected because they were
exchanged with ammonium ions. All other chromatographic conditions were the same as
previously mentioned. Ammonium acetate modified the largest percentage of free silanol
groups and TBAA modified the smallest percentage. This might be explained by steric
effects since TBAA is the largest cation, and ammonium the smallest.
3.3.4 Acidity of Supercritical CO2/methanol Mobile Phase
As methyl alcohol is methyl substituted H2O, it has some similarity to water. The
pka of methanol in water at 25 °C has been reported to be 15.5 [48], compared to 14 for
H2O. This indicated that methanol should have similar acid-base properties as water. It is
known that when CO2 dissolves in water it reacts to form carbonic acid. Lancaster [49]
has studied the extraction of an iron complex with H2O-modified supercritical CO2. The
author suggested that the acidity of the extracting fluid breaks down the complex and thus
provided a low extraction recovery. Methanol was then used as modifier instead of water
in this study. Higher extraction recovery was achieved, however, it was still lower than
50%, which indicated that methanol-modified supercritical CO2 was also acidic, but less
acidic than H2O/CO2.
Wen et al. [50] studied the pH of methanol/H2O/CO2 liquid mixtures under high
pressure via UV/visible absorption spectra of several pH indicators. The pH was reported
to be 4.73 at methanol/H2O/CO2 mole ratio of 55.7/25.1/19.2.

56
The direct pH measurement of a methanol/supercritical CO2 mixture has not been
reported, to our knowledge. Pinkston and Chester [51] attempted to observe the effect of
high pressure CO2 on a pH indicator, sudan III, dissolved in methanol. The methanol
solution was placed in a high pressure view cell. A CO2 tank was attached to the bottom
of the cell, and air was purged by bubbling gaseous CO2 through the cell. The top of the
cell was then sealed. The cell was pressurized with CO2 from the tank. The color of the
indicator changed to a more acidic color as the CO2 was introduced. As the pressure of
CO2 rose to 60 bar, the color of the fluid switched to an even more acidic range. The
exact pH value was not measured.
Due to the instrumental limitation, we were not able to carry out Pinkston and
Chester’s experiment. We performed somewhat similar experiments at room temperature
and atmospheric pressure.
The three pH indicator solutions used were 1) “universal pH indicator”, which
consisted of four indicators: phenolphthalein disodium salt, bromothymol blue sodium
salt, methyl red sodium salt, and thymol blue sodium salt, 2) methyl red sodium salt
solution, and 3) bromocresol green sodium salt solution. The color change range for these
indicators are 6.2-7.6 for bromothymol blue, 4.2-6.3 for methyl red, 8.0-9.6 for thymol
blue, 8.3-10.0 for phenolphthalein, and 3.8-5.4 for bromocresol green [52]. Figure 20
shows the change of color with universal indicator before, during, and after CO2 was
introduced to methanol and to water. We allowed sufficient time to saturate the
CO2/methanol and CO2/H2O mixtures with CO2 until the color remained stable. The shift
to a more acidic color range is clearly evident for both methanol and water. As we had
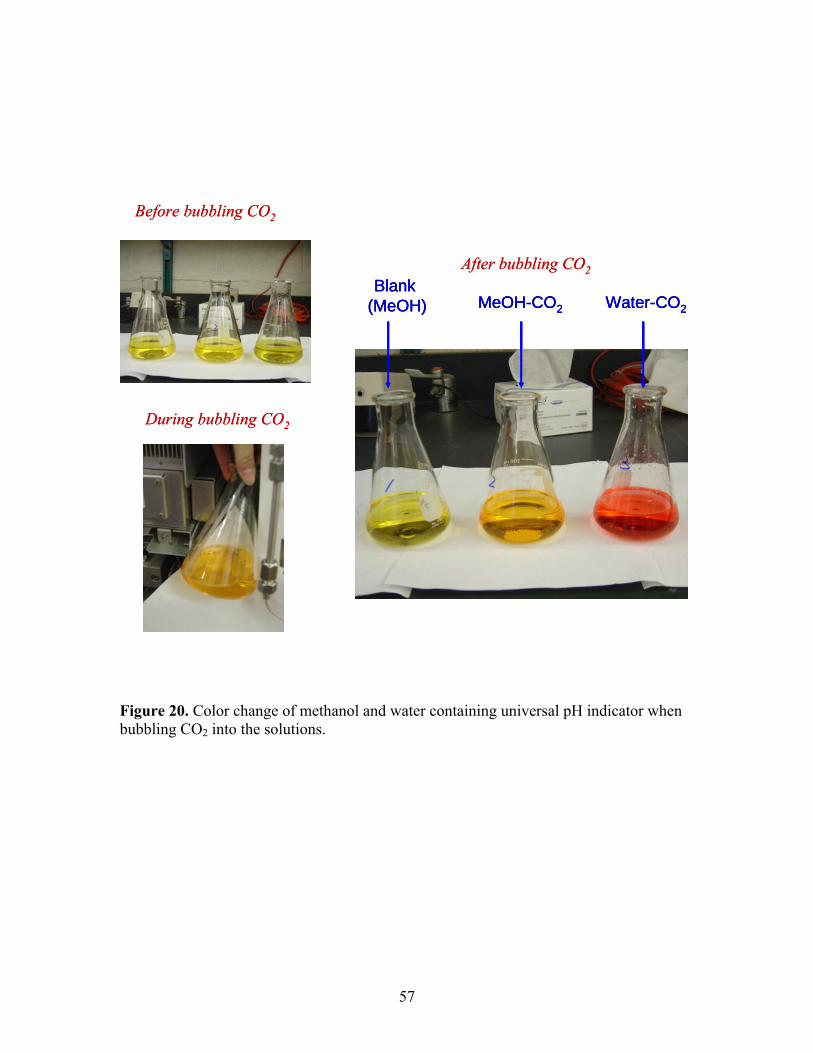
57
Figure 20. Color change of methanol and water containing universal pH indicator when bubbling CO2 into the solutions.
Before bubbling CO2Before bubbling CO2
During bubbling CO2During bubbling CO2
Blank (MeOH) MeOH-CO2 Water-CO2
After bubbling CO2Blank
(MeOH) MeOH-CO2 Water-CO2
Blank (MeOH) MeOH-CO2 Water-CO2
After bubbling CO2

58
expected, the color shift of the indicator was not as dramatic with the CO2/methanol
mixture as with the CO2/H2O solvent.
Assuming the dissociation constants (pKI) of the indicators are similar in water
and in methanol, and that the absorbance properties of the indicators in the two solvents
are similar, the pH of saturated CO2/methanol under ambient conditions was estimated to
be 5.5 with the color chart of the universal indicator. An ammonium chloride aqueous
solution was made with the same indicator to match the color of saturated CO2/methanol
solution. The measured pH value of the NH4Cl aqueous solution gave a value of 5.32
which was close to what we estimated visually.
The other two indicators supported the conclusions that were drawn from our
work with the universal indicator. When either methyl red or bromocresol green were
used as indicators, the color change of the methanol and water solutions after saturation
with CO2 gas was visually distinguishable. We therefore estimated the pH value for
CO2/methanol under atmospheric pressure to be 5.5, which falls in the color change range
of methyl red (pH 4.2-6.3) [52]. Various colors were observed for the three solutions:
bright yellow for pure methanol, orange for CO2/methanol, and red for CO2/water, as
shown in Figure 21. These distinct differences in color clearly support a shift of the
methanol solution to a more acidic pH when it is saturated with CO2.
We believe that high pressure CO2/methanol would be even more acidic than
atmospheric pressure CO2/methanol, as more CO2 will dissolve in methanol at high
pressure. As the silanol group has a pKa <2 in an aqueous environment [53], it might
have a larger pKa under methanol/CO2 environment, but it would still be lower than 5.
Therefore it is not surprising that silanol groups would dissociate in the methanol-
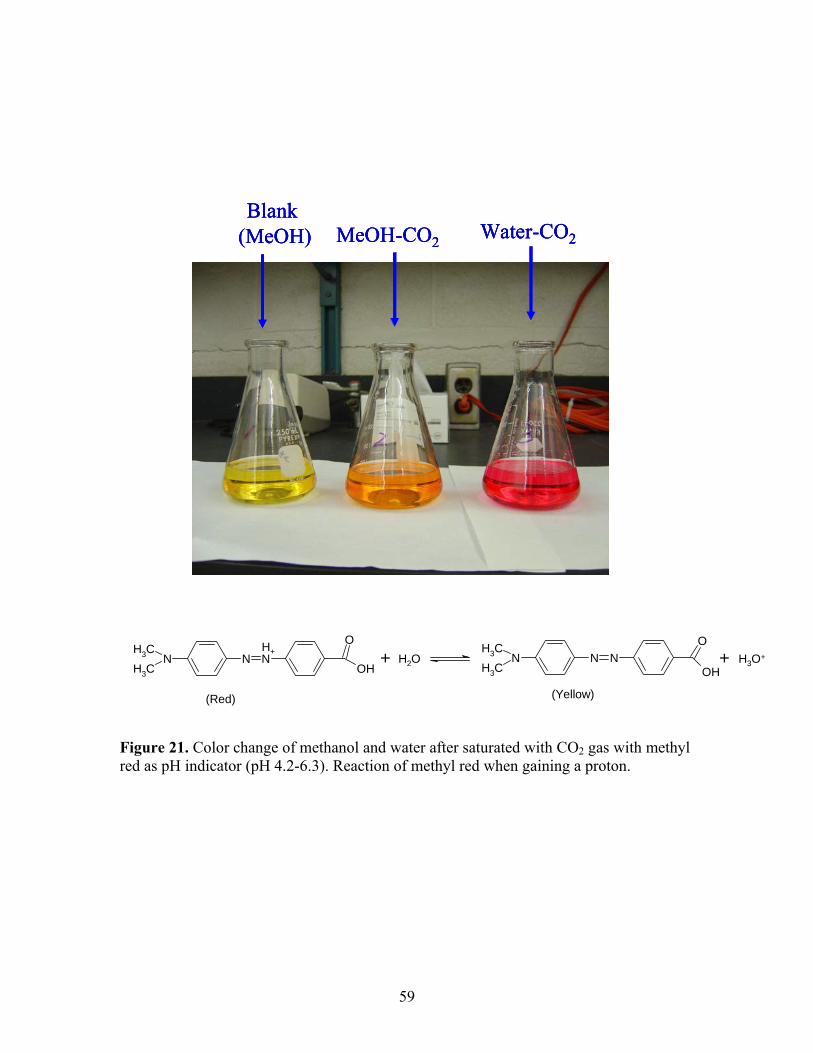
59
Figure 21. Color change of methanol and water after saturated with CO2 gas with methyl red as pH indicator (pH 4.2-6.3). Reaction of methyl red when gaining a proton.
NN N+CH3
CH3 OH
ONN N
CH3
CH3
O
OH
H
(Red) (Yellow)
+ H2O + H3O+
Blank (MeOH) MeOH-CO2 Water-CO2
Blank (MeOH)Blank
(MeOH) MeOH-CO2MeOH-CO2 Water-CO2Water-CO2
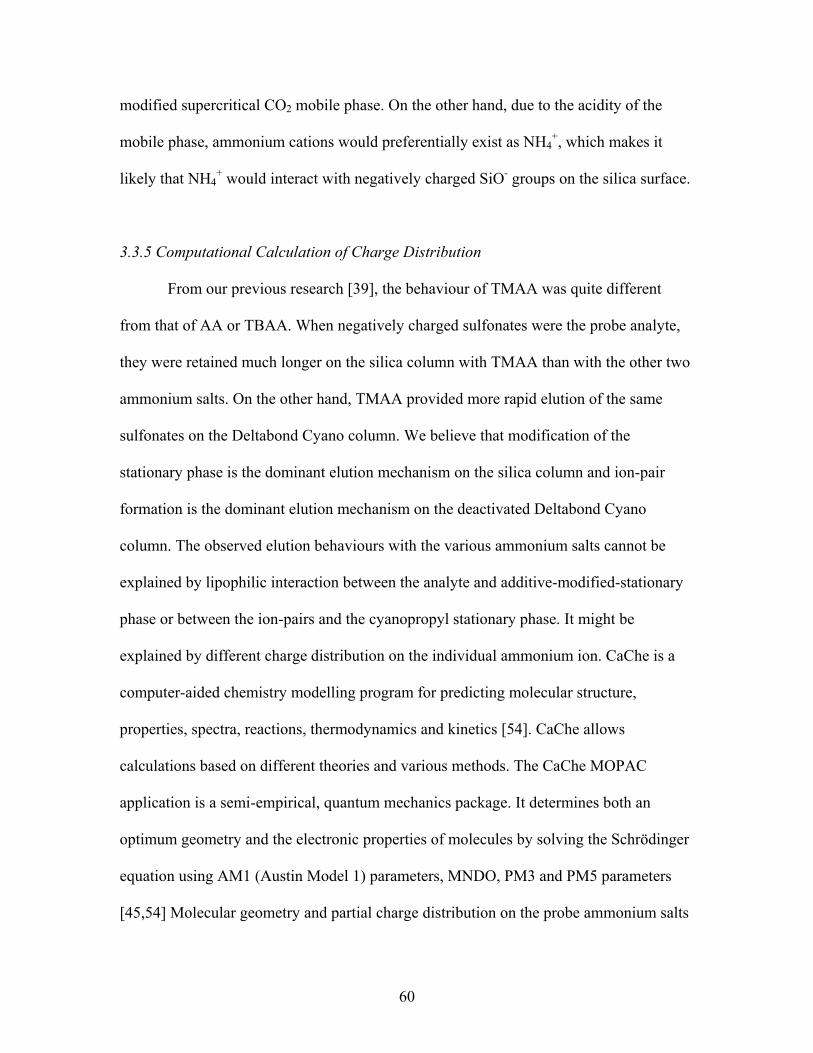
60
modified supercritical CO2 mobile phase. On the other hand, due to the acidity of the
mobile phase, ammonium cations would preferentially exist as NH4+, which makes it
likely that NH4+ would interact with negatively charged SiO- groups on the silica surface.
3.3.5 Computational Calculation of Charge Distribution
From our previous research [39], the behaviour of TMAA was quite different
from that of AA or TBAA. When negatively charged sulfonates were the probe analyte,
they were retained much longer on the silica column with TMAA than with the other two
ammonium salts. On the other hand, TMAA provided more rapid elution of the same
sulfonates on the Deltabond Cyano column. We believe that modification of the
stationary phase is the dominant elution mechanism on the silica column and ion-pair
formation is the dominant elution mechanism on the deactivated Deltabond Cyano
column. The observed elution behaviours with the various ammonium salts cannot be
explained by lipophilic interaction between the analyte and additive-modified-stationary
phase or between the ion-pairs and the cyanopropyl stationary phase. It might be
explained by different charge distribution on the individual ammonium ion. CaChe is a
computer-aided chemistry modelling program for predicting molecular structure,
properties, spectra, reactions, thermodynamics and kinetics [54]. CaChe allows
calculations based on different theories and various methods. The CaChe MOPAC
application is a semi-empirical, quantum mechanics package. It determines both an
optimum geometry and the electronic properties of molecules by solving the Schrödinger
equation using AM1 (Austin Model 1) parameters, MNDO, PM3 and PM5 parameters
[45,54] Molecular geometry and partial charge distribution on the probe ammonium salts
61
were thus calculated using CaChe MOPAC with AM1 parameters, Figure 22. This
calculation is based on gas state parameters. Another method that also uses MOPAC with
AM1 parameters but in aqueous solution was also used to calculate the charge
distribution on AA, TMAA, and TBAA. This might be a better approximation than the
gas-state-based calculations. The use of AM1 parameters neglects the diatomic
differential overlap. To gain a more accurate calculation, a DGauss/B88-LYP calculation
was performed. DGauss calculations use DFT (density functional theory) methods that
provide an approximate solution to the Schrödinger equation using only mathematical
approximations. This method is more computationally intensive than MOPAC. The
results of the calculations of charge distribution on the probe ammonium cations are
listed in Table 3.
All three methods indicated that the tetramethylammonium cation has the largest
surface charge of the three ammonium salts. These results helped to explain the
chromatographic behaviour. On the silica column, ammonium cations may cause the
stationary phase to become positively charged. Since TMAA has the largest surface
charge, TMAA-modified silica may retain negatively charged sulfonate analytes longer
than silica modified with the other ammonium salts. On the deactivated Deltabond Cyano
phase, TMAA may form stronger ion-pairs with sulfonate analytes and help to elute them
more rapidly.
The above chromatographic experiments, 29Si solid state NMR on the pressurized
fluid treated stationary phase, and computational calculations on the three ammonium
salts have shed light on the elution and retention mechanisms of, specifically, sodium p-

62
Figure 22. Optimized geometry of AA, TMAA, and TBAA molecules and partial charges on each atom.

63
Table 3. Partial charge distribution on the three ammonium salts calculated with different theories.
Additive MOPAC/AM1 gas phase
MOPAC/AM1 in water DGAUSS/B88-LYP
Ammonium 1.096* 1.076* 1.792*
Tetramethylammonium 1.716 1.732 3.144
Tetrabutylammonium 1.067 0.956 2.562
* Sum of the charges on the terminal hydrogen atoms.

64
toluene sulfonate with ammonium salts as CO2-based mobile phase additives. The
adsorption of ammonium cations on the active silanol sites of the stationary phase has
been demonstrated to be a major contributor to the overall mechanism. On bare silica,
where abundant silanol sites are present, modification of the stationary phase may be the
dominant effect, while ammonium ion-induced dipole interaction with the cyano function
may be dominant with the more deactivated Deltabond Cyano phase.
On the other hand, it is a different situation for the elution of propranolol
hydrochloride from the silica column with different ammonium additives. As propranolol
HCl is a secondary ammonium salt, it would interact with the active silanol sites in the
same manner as the ammonium additives do, which means that the cationic analyte might
compete with the additive cations for silanol sites. As the TMAA cation carries a larger
positive charge than the other ammonium additive cations, it was not surprising that
propranolol hydrochloride eluted faster with TMAA than with AA or TBAA, as shown in
Figure 12. Therefore, when ammonium additives were used to elute ammonium analytes
from bare silica phase, an ion-exchange mechanism was taking place on the active silanol
sites.
65
CHAPTER 4
Elution of Amine Salts with and without Sulfonate Additives by Packed Column
Supercritical Fluid Chromatography
4.1 INTRODUCTION
Historically, to elute highly polar, potentially ionizable analytes by supercritical
fluid chromatography (SFC), a small amount of a highly polar organic acid or base has
been added to the CO2-based mobile phase modifier which has most often been methanol.
As suppression of ionization was believed to the role of the secondary modifier (i.e.
additive), organic acids were used to elute acidic analytes and organic bases were used to
elute basic analytes [20-23,28,29]. Only recently has much attention been directed toward
fully ionic analytes such as sodium sulfonates and alkylammonium halides. No doubt the
lack of chromatographic study in this area for so many years was due to the long-held
opinion that CO2–based mobile phases would have little solvating power for cationic or
anionic organic salts.
Even though an ion-pairing principle has been recognized for some time in
HPLC, it has not been fully realized in the SFC field [25,32,36,55] as a strategy for
elution of fully ionic analytes. The notion of ion-pairing was first introduced to SFC by
Steuer et al. many years ago [25]. In this study, 25 mM sodium heptanesulfonate in 20%
methanol-modified, pressurized CO2 (225 bar, 60oC) was used to achieve fast elution of
propranolola, IV, from a cyano stationary phase (100 mm x 4.6 mm i.d.), which otherwise
failed to elute from this column without the mobile phase additive. See Figure 23 for
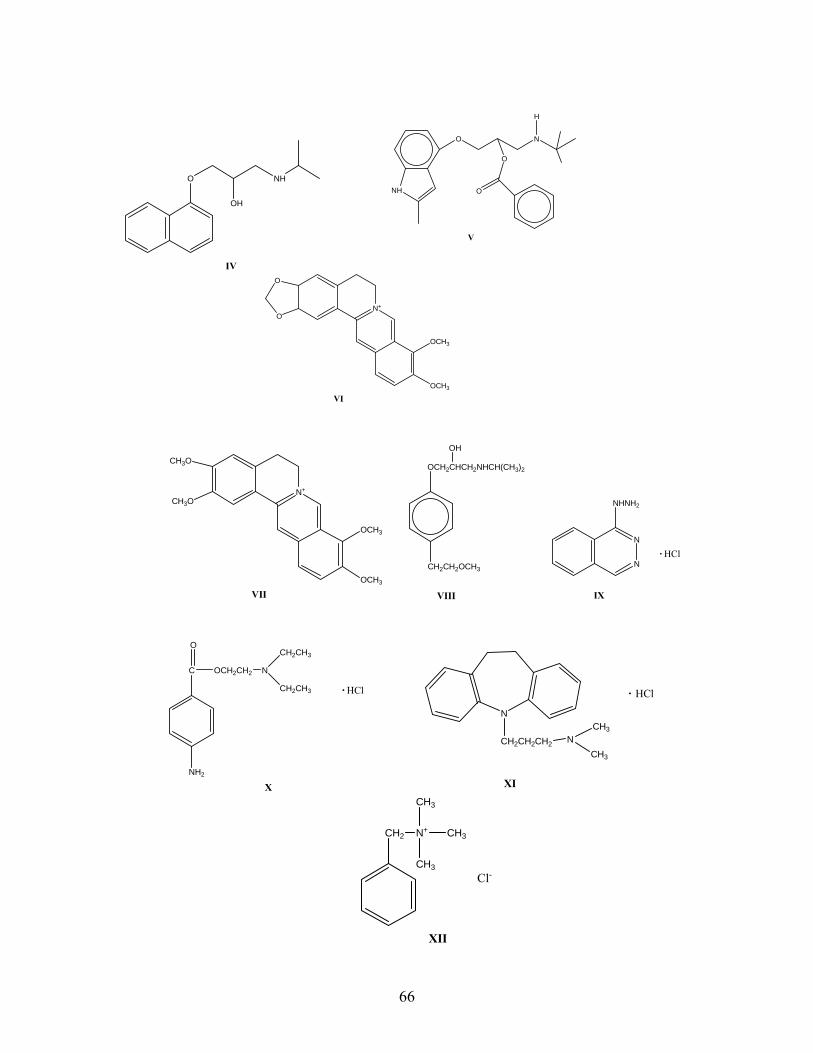
66
OH
O NH
IV
NH
O N
O
O
V
H
O
ON+
OCH3
OCH3
VI
CH3O
CH3ON+
OCH3
OCH3
VII
OCH2CHCH2NHCH(CH3)2
CH2CH2OCH3
VIII
OH
N
N
NHNH2
IX
HCl
C OCH2CH2
O
NH2
N
CH2CH3
CH2CH3
X
HCl
N
CH2CH2CH2 NCH3
CH3
XI
HCl
CH2 N+
CH3
CH3
CH3
Cl-
XII
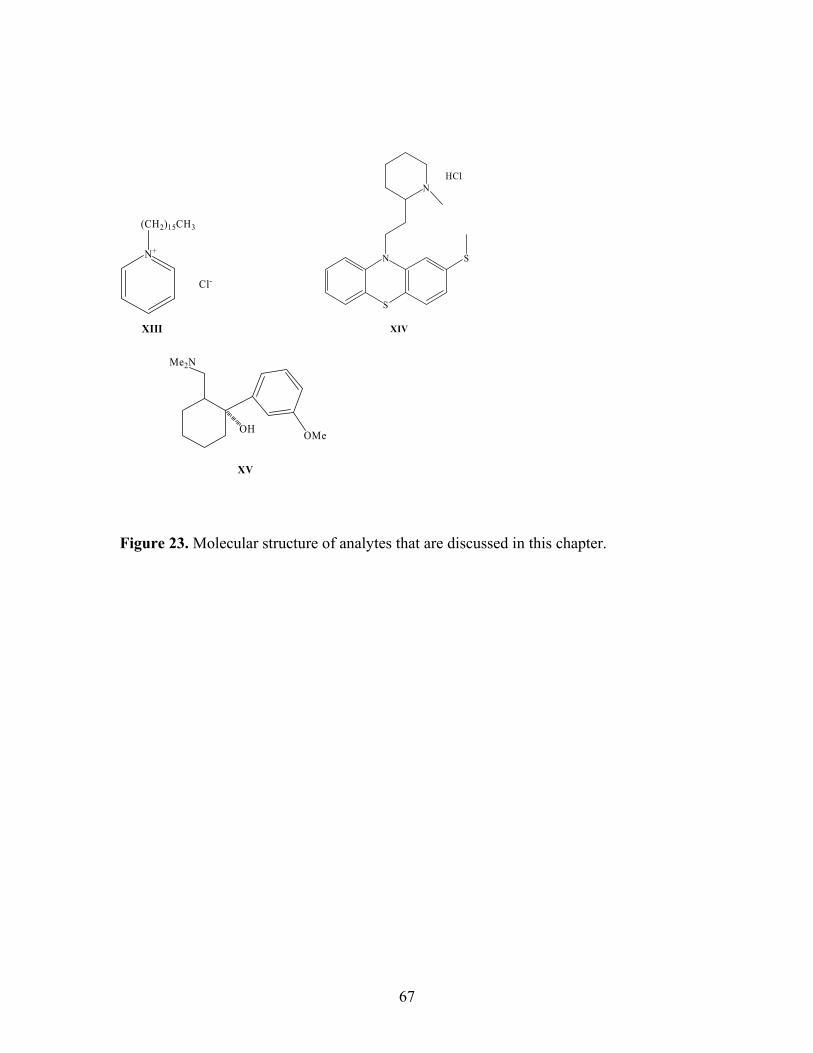
67
N+
(CH2)15CH3
Cl-
XIII
N
N
S
S
HCl
XIV
OH
Me2N
XV
OMe
Figure 23. Molecular structure of analytes that are discussed in this chapter.

68
molecular structures. †Bopindolol, V, and its precursor were also successfully separated
on a diol column when 20 mM of both tributylamine and acetic acid (e.g.
tributylammonium acetate) were present in the modifier (methanol). The solubility of
ion-pairing reagents in the carbon dioxide-modifier mixture was suggested to be a critical
limitation concerning the success of the ion-pair SFC elution mechanism.
Some years later, another ion-pair reagent, dioctyl sodium sulfosuccinate, was
used to extract (IP-SFE) and analyze (IP-SFC ) cationic berberine, VI, and palmatine,
VII, from Phellodendri Cortex in an on-line coupled experiment [55]. The mobile phase
composition for IP-SFC was 100 mM dioctyl sodium sulfosuccinate in 15% (v/v)
methanol-modified pressurized CO2. A bare silica phase yielded satisfactory trapping
after SFE and successful chromatographic separation via SFC of analytes with a
comparatively short retention time; while an amino column did not retain the alkaloids
under the test conditions.
In another study, an SFC method has been reported for separation of both
metoprolol tartrate, VIII, and metoprolol succinate from their analogous hydrochlorides
in both the bulk drug substance and the finished tablet on a 4 mm i.d. Diol-bonded silica
column with UV detection (273 nm) [32]. The mobile phase modifier was 10% (v/v)
methanol containing 0.35 M acetic acid and 0.07 M triethylamine. The excess acid was
added to promote the stability of the silica-based column. The main advantage of the SFC
method was that it was possible to separate and detect isomers that otherwise eluted close
to the metoprolol peak in liquid chromatographic systems.
† Although the paper never confirmed it, we assume that propranolol and bopindolol are each the
hydrochloride salt.
69
More recently, ammonium acetate, ammonium formate, and ammonium
carbonate were reported to be effective as mobile phase additives in SFC to separate a
group of polar and ionic compounds, including alkaloids, acids, di-acids, hydroxyl- and
amino-acids, and nitro-compounds [36]. Amine hydrochlorides and quaternary amines
that were studied included hydralazine HCl, IX, procaine HCl, X, imipramine HCl, XI,
and benzotrimethylammonium chloride, XII. The authors suggested that ion-pairing
formation between the ionic solute and additive was one of the possible roles of the
ammonium additives.
In our previous research, [39,56] we successfully eluted via SFC three sodium
aryl sulfonates with various alkylammonium acetate additives incorporated into the
primary modifier at a concentration of 2.5 mM. Ammonium chloride and lithium acetate
were also found to be effective ionic additives. Elution could be successfully carried out
from Deltabond cyanopropyl, conventional cyanopropyl, and, surprisingly, bare silica
stationary phases. The elution mechanism was suggested to be a combination of (1) ion-
pairing formation between the cationic additives and the anionic solutes and (2) a
dispersive interaction of the analyte and bonded stationary phase. In the case of bare
silica, exchange of silanol hydrogen for alkylammonium cation was suggested to be
important. While ion-pairing formation would be predicted to take place in the mobile
phase no matter what stationary phase was used, on more active stationary phases the
modification of silanol groups by the alkylammonium additives would prevent the
expected strong interaction between the solutes (or the ion-pairs formed) and the active
stationary phase silanol sites. The ion-pairing formation might be more dominant on the
deactivated Deltabond cyano phase, since there are anticipated to be less active silanol

70
sites on the stationary phase. On the other hand, the modification of silanol groups would
be more dominant on the active bare silica phase. These interpretations were supported
by 29Si solid state NMR and the observation that memory effects on the silica phase were
more dominant than on the Deltabond cyano phase.
Many amine salts have been shown to be active pharmaceutical ingredients.
Unfortunately, many of them were thought in the past to be too polar to be analyzed by
SFC, especially for quaternary ammonium salts. Cetylpyridinium chloride is a quaternary
ammonium salt which has been analyzed by IP-HPLC [57,58]. Tomlinson et al.,
however, have preliminarily reported a packed column SFC/MS/MS method for
cetylpyridinium chloride, on a Deltabond Cyano column, with 35% 2.5 mM ammonium
acetate/methanol as modifier. [59] Since we have demonstrated that ion-pairing
formation is an effective means to elute sodium aryl sulfonates with ammonium salts as
an additive in SFC, we have tested herein the use of sulfonate salts in the mobile phase to
provide elution of ammonium analytes in SFC by the principle of reciprocity. In this
paper, we have explored the elution of propranolol hydrochloride, IV,
benzyltrimethylammonium chloride, XII, and cetylpyridinium chloride, XIII, in
conjunction with sodium alkylsulfonates as mobile phase additives in methanol-modified
pressurized CO2.
4.2 EXPERIMENTAL
4.2.1 Chemicals

71
Methanol was HPLC grade, (EMD, Durham, NC, USA). The carbon dioxide was
SFE/SFC grade (Air Products and Chemicals, Inc., Allentown, PA, USA) with no helium
head pressure. Ammonium acetate (99%, ACS grade), sodium methanesulfonate (98%),
sodium ethanesulfonate (97%), sodium 1-decanesulfonate (98%), ethanesulfonic acid
(95%), and isopropylamine (99.5+%) were obtained from Sigma Aldrich
(Milwaukee,WI, USA). Sodium 1-heptanesulfonate (≥99%) was purchased from Fluka
(Milwaukee,WI, USA). Propranolol hydrochloride (99%), benzyltrimethylammonium
chloride (97%), and cetylpyridinium chloride (99%) were purchased from Sigma Aldrich.
A solution of each sample for chromatographic injection was prepared in methanol at a
concentration of approximately 0.5 mg/mL.
4.2.2 SFC/UV Instrumentation
The SFC system was a Berger Instruments Analytical SFC (Newark, DE, USA)
with a Hewlett Packard (Little Creek, DE, USA) Model 1050 Diode Array Detector,
which employed a 13-μL high pressure flow cell (10-mm path length) and Berger
Instruments 3D SFC ChemStation software, version 3.4.
The chromatographic columns were Deltabond Cyano (Thermo Hypersil-
Keystone, Bellefonte, PA, USA), Supelcosil LC-Silica, Supelcosil LC-SAX1 (Supelco;
Bellefonte, PA, USA), Berger Pyridine (Berger Instruments Inc.) and Princeton SFC
Amino (Princeton Chromatography Inc., Cranburry, NJ, USA). The column dimensions
were 25 cm in length and 4.6 mm i.d., with a particle size of 5 μm for each stationary
phase. Supelcosil LC-Silica and Supelcosil LC-SAX1 both had a pore size of 120 Å;

72
Berger Pyridine had a pore size of 60 Å, while Deltabond Cyano had a pore size of 200
Å.
Unless otherwise specified, chromatographic conditions were as follows: injection
volume 10 μL, mobile phase flow rate 2 mL/min (measured in the liquid state), column
outlet pressure 120 bar, and column oven temperature 40°C. An isocratic mobile phase
composition was employed: 15% modifier in CO2 for propranolol hydrochloride and 30%
for the other hydrochloride analytes, unless specified. The modifier consisted of either
pure methanol or methanol with 2.5 mM additive. Each column was equilibrated with the
modified mobile phase which contained the additive under study for 30 minutes at a flow
rate of 2 mL/min prior to injection of the ammonium analyte. Between each change of
mobile phase additive, the stationary phase was regenerated with 90% pure methanol at 1
mL/min for fifteen minutes (e.g. approximately nine column volumes) in order to purge
the previous additive solution from the system and/or to remove analyte that had
interacted with the stationary phase.
4.3 RESULTS AND DISCUSSION
4.3.1 Deltabond Cyano Stationary Phase
This study concerns the elution of positively charged nitrogen-containing analytes
from silica-derived stationary phases using CO2-based mobile phases that contain an
ionic additive. One analyte was a dialkylammonium chloride (Structure IV, Figure 20),
one was a tetra-alkylammonium chloride (Structure XII), and one analyte was an
alkylpyridinium chloride (Structure XIII). Each of these analytes failed to elute from a

73
Deltabond Cyano column with 40% methanol-modified CO2. The addition of a sodium
alkylsulfonate to the methanol modifier, however, allowed the elution of each analyte.
Figure 24 shows the elution trace for propranolol hydrochloride on a Deltabond
Cyano column with pressurized CO2 modified with 15% methanol that contained either
2.5 mM sodium ethanesulfonate, sodium 1-heptanesulfonate, sodium 1-decanesulfonate,
ethanesulfonic acid, or ammonium acetate. Each additive facilitated elution of
propranolol hydrochloride with varying degrees of efficiency. The analyte eluted fastest
and with the best peak shape with the three sodium alkyl sulfonate additives.
Ethanesulfonic acid as an additive afforded a much later eluting, considerably broader
chromatographic peak. This observation suggested the operation of an ion-pairing elution
mechanism with the Deltabond Cyano column for the three organo ammonium salts when
sulfonate salts were used as mobile phase additives. Since the sodium sulfonate salts
should give rise to more sulfonate ions than the neutral sulfonic acid, at the same
concentration, more ion-pairs would be expected to form between the nitrogen-containing
cationic analyte and the sulfonate anion, and thus give rise to a sharper, earlier eluting
peak. A comparison of the three equal molar sulfonate additives revealed that sodium 1-
decanesulfonate provided the fastest elution time/sharpest peak and sodium
ethanesulfonate provided the latest elution/broadest peak. The ion-pairs formed by
sodium 1-decanesulfonate with the propranolol cation would be expected to have the
greatest solubility in the mobile phase since this additive has the greatest non-polar
character. Thus, the cationic analyte (ion paired with the decanesulfonate) would be
predicted to elute from the column in the shortest time. With sodium ethanesulfonate as
the additive, which has the least hydrophobicity, propranolol ion eluted last. This

74
Figure 24. Elution of propranolol hydrochloride from a Deltabond Cyano column with different mobile phase additives. Outlet pressure: 120 bar; oven temperature: 40 ºC; flow rate: 2 mL/min. UV detector: 215 nm.
15% 2.5 mM sodium ethanesulfonate
15% 2.5 mM sodium 1-heptanesulfonate
15% 2.5 mM sodium 1-decanesulfonate
15% 2.5 mM ethanesulfonic acid
15% 2.5 mM ammonium acetate
75
hypothesis was tested further by using sodium methanesulfonate as a mobile phase
additive. Unfortunately, when this additive was incorporated into the mobile phase at 2.5
mM concentration in methanol (i.e. 15% modifier in mobile phase), the inlet pressure
dramatically increased, and the analyte failed to elute. Poor solubility of the
methanesulfonate in the mobile phase is believed to account for this chromatographic
result.
Propranolol hydrochloride could also be successfully eluted from the Deltabond
Cyano column with ammonium acetate incorporated into the methanol modifier. The
peak, however, tailed badly, Figure 24. This result was somewhat surprising as an
ammonium additive was used to elute an ammonium analyte. One explanation for this
observation is that ion-pairing between the ammonium analyte and the acetate anions is
occurring. The peak eluted later and was broader than the peaks obtained with the sodium
sulfonate additives. We suggest that these two results with ionic additives are the result of
two different elution mechanisms. With sulfonate additives the mechanism is dominated
by ion pairing, while with ammonium additives the stationary phase becomes modified.
Ion-pair formation is believed to be more effective than modification of the stationary
phase.
Benzyltrimethylammonium chloride failed to elute from the Deltabond Cyano
column within 20 minutes with 15% of modifier containing 2.5 mM sodium
ethanesulfonate as additive. Cetylpyridinium chloride, however, eluted at about 11
minutes with a broad peak shape under the same condition. These analytes, however,
eluted around 3.5 minutes when the concentration of modifier increased to 30% with 2.5
mM additive. As these two analytes are quaternary ammonium salts, they would be
76
expected to have a stronger interaction with the polar bonded Cyano phase via ion-dipole
interaction. A higher concentration of modifier (30%) thus was necessary to achieve
acceptable retention times and peak shapes for these two analytes.
The elution traces of cetylpyridinium chloride with various sulfonate mobile
phase additives are shown in Figure 25. Again, sodium 1-decanesulfonate provided the
fastest elution among all the additives that were studied due to the higher solubility of the
ion-pairs formed by the analyte and the sulfonate additive with a longer aliphatic carbon
chain. Again, ammonium acetate afforded analyte elution, but the peak shape was poor.
Similar behaviour with various sulfonate additives was observed for elution of
benzyltrimethylammonium chloride from the Deltabond Cyano column.
Reproducibility of the chromatographic method for each of the analytes was also
investigated, Table 4. Good precision in retention factor was achieved with the highest
RSD being 2.18%.
4.3.2 Bare Silica Stationary Phase
In our previous research [56], we found that cationic ammonium mobile phase
additives covered a fraction of the surface active silanol groups on the silica support. We,
consequently, wondered if sulfonate anionic additives could interact with the stationary
phase in a somewhat analogous manner. First, we studied the elution of propranolol
hydrochloride from a bare silica column with pure methanol, then with sodium
ethanesulfonate in methanol, and finally with ethanesulfonic acid in methanol as mobile
phase modifier, Figure 26. The analyte did not elute with 30% pure methanol as
modifier. It did, on the other hand, elute with 2.5 mM sodium ethanesulfonate as the
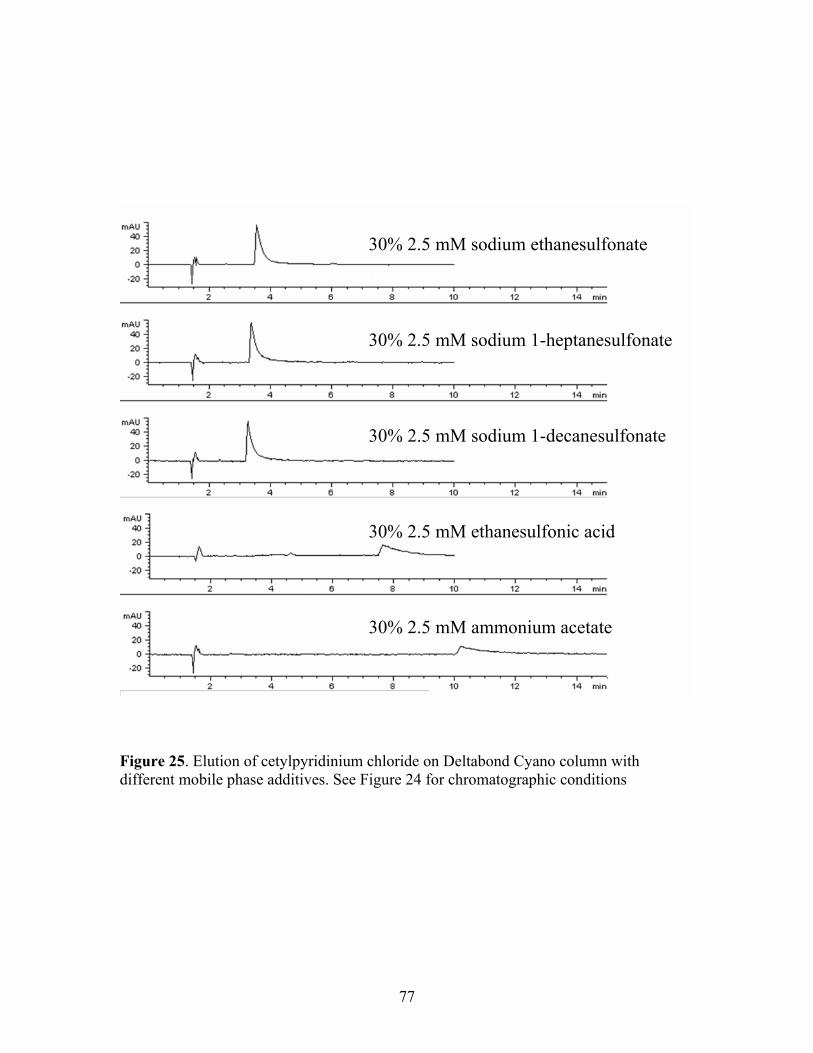
77
Figure 25. Elution of cetylpyridinium chloride on Deltabond Cyano column with different mobile phase additives. See Figure 24 for chromatographic conditions
30% 2.5 mM sodium ethanesulfonate
30% 2.5 mM sodium 1-heptanesulfonate
30% 2.5 mM sodium 1-decanesulfonate
30% 2.5 mM ethanesulfonic acid
30% 2.5 mM ammonium acetate
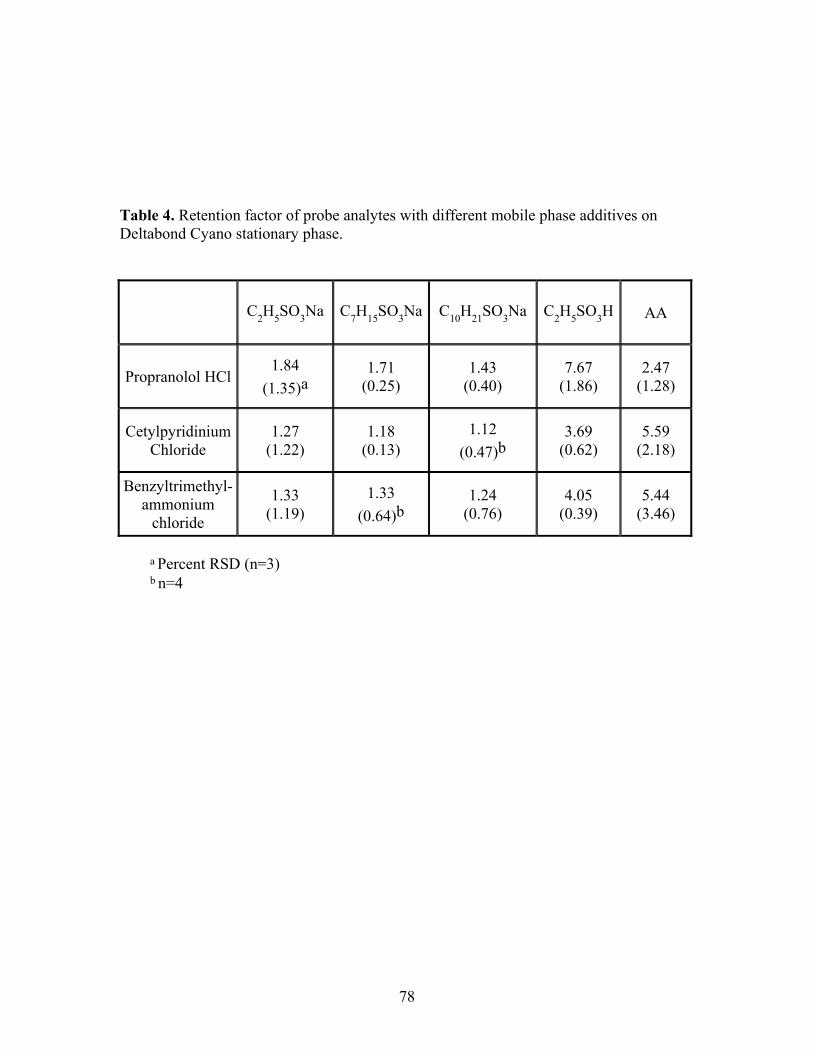
78
Table 4. Retention factor of probe analytes with different mobile phase additives on Deltabond Cyano stationary phase.
C2H5SO3Na C7H15SO3Na C10H21SO3Na C2H5SO3H AA
Propranolol HCl 1.84
(1.35)a 1.71
(0.25) 1.43
(0.40) 7.67
(1.86) 2.47
(1.28)
Cetylpyridinium Chloride
1.27 (1.22)
1.18 (0.13)
1.12 (0.47)b
3.69 (0.62)
5.59 (2.18)
Benzyltrimethyl-ammonium
chloride
1.33 (1.19)
1.33 (0.64)b
1.24 (0.76)
4.05 (0.39)
5.44 (3.46)
a Percent RSD (n=3)b n=4

79
Figure 26. Elution of propranolol hydrochloride on a silica column. See Figure 24 for chromatographic conditions
30% pure methanol
30% 2.5 mM sodium ethanesulfonate
30% 2.5 mM ethanesulfonic acid
80
mobile phase modifier. We feel that this is probably due to ion-pairing between the
analyte and the sulfonate additive rather than modification of the stationary phase by the
sulfonate ion, vide infra. On the silica column, propranolol hydrochloride eluted in about
eleven minutes, with 30% modifier (methanol containing 2.5 mM sodium
ethanesulfonate) in the mobile phase, compared to a four-minute elution from Deltabond
Cyano, with 15% modifier in the mobile phase. This later elution from silica indicated a
relatively strong interaction between the ion-pairs formed by the analyte and the sulfonate
and the active bare silica stationary phase. We, thus, were not surprised by the fact that
with ethanesulfonic acid, the propranolol hydrochloride eluted even later and tailed more
than with sodium ethanesulfonte. In other words, it was expected that a greater number of
active silanol sites should exist on the bare silica phase with the more acidic mobile phase
additive.
In our previous SFC study of sulfonate with ammonium salt mobile phase
additives [56], probe aryl sulfonate analytes continued to elute from the bare silica phase
even after the additive was removed from the mobile phase, which indicated a certain
degree of silica phase modification by the ammonium additive. We have performed a
series of repeated injections of propranolol hydrochloride on the bare silica phase with
first sodium ethanesulfonate additive in the mobile phase and then with it removed in
order to ascertain if a memory effect was operational. Pure methanol was introduced to
(or additive was removed from) the mobile phase at the beginning of run #5. Due to a
slight delay of modifier reaching the column, the sulfonate additive remained in the
mobile phase during run #5. Thus, the sulfonate was completely replaced with pure
methanol prior to run # 6. Immediately, propranolol hydrochloride failed to elute. This
81
observation suggested again that sodium ethanesulfonate probably did not modify the
silica stationary phase. Alternatively, these results may indicate that the analyte formed
an ion-pair with the sulfonate additive, the solubility of the ion-pair in the mobile phase
thus increased, and the analyte was thereafter eluted.
Elution of the three probe analytes with different concentrations of sodium 1-
heptanesulfonate in methanol was also studied. The experimental retention factors are
plotted in Figure 27. All the organo ammonium analytes eluted faster with increasing
concentration of additive in methanol up to 2.5 mM. Since a higher concentration of
additive could lead to more ion-pairs and these ion-pairs would have greater solubility in
the mobile phase than the original organo ammonium salts, it is therefore reasoned that
the analytes would be expected to elute faster with higher concentrations of additives.
4.3.3 Ethylpyridine Silica Stationary Phase
Elution of amine hydrochloride salts from polysaccharide coated silica stationary
phases without additives was reported. Geiser, et al. [34] have described the direct,
preparative enantioselective chromatography of racemic hydrochlorides of propranolol,
IV, and thioridazine, XIV, using a rather expensive Chiralpak AD stationary phase and
CO2 modified with only methanol. Isolated fractions of propranolol hydrochloride were
positively identified. More recently, this investigation has been extended to the resolution
of tramadol, XV, hydrochloride with polarimetric detection on a Chiralpak AD-H
stationary phase without the use of either basic or acidic additives [34,35].
We were interested to know if a newly developed ethyl pyridine-bonded, silica-
supported phase would afford elution of amine salts without mobile phase ionic additive.

82
Figure 27. Retention factors for three organo ammonium analytes on Deltabond Cyano column with different concentrations of sodium 1-heptanesulfonate as additive.
0.002.004.006.008.00
10.0012.00
0 0.5 1 1.5 2 2.5 3
Additive Concentration (mM)
Cap
acity
Fac
tor Propranolol Hydrochloride
Cetylpyridinium Chloride
BenzyltrimethylammoniumChloride
83
Successful elution of all three organic amine salts that were studied earlier in this
manuscript was achieved on this phase without the use of sulfonate additives, Figure 28.
Surprisingly, cetylpyridinium chloride and benzyltrimethylammonium chloride were
eluted faster than propranolol hydrochloride with only 20% methanol modifier. On the
Deltabond Cyano phase, they either did not elute or eluted with very broad peak shape
under the same chromatographic mobile phase conditions as described earlier. If the
modifier composition was increased to 30%, all three ammonium salts eluted without
retention from the pyridine column. Initially, we thought that the surface silanol groups
on the stationary phase had been internally deactivated by the basic pyridine functional
group. However, anionic analytes, such as sodium dodecylbenzene sulfonate and sodium
p-toluene sulfonate, did not elute from the ethylpyridine column even with 30% pure
methanol as the modifier. This suggested to us that a fraction of the pyridine functional
groups associated with the stationary phase were possibly protonated and positively
charged during the chromatography. If so, the stationary phase would be less attractive to
the positively charged amine salt cation than the anionic sulfonate (i.e. elution of the
cationic amine and retention of the sulfonate anion). This hypothesis may also explain
why the permanently charged quaternary ammonium analytes would be eluted from the
stationary phase faster than propranolol hydrochloride which is in equilibrium with its
neutral form. Some support for protonation of the pyridine phase is found in a recent
report by Jessop, et al.[60], where in it was reported that exposure of a 1:1 mixture of two
non-ionic liquids, namely 1,8-diazabicyclo-[5.4.0]-undec-7-ene and 1-hexanol, to
gaseous CO2 at one atmosphere and at room temperature causes conversion of the liquid
mixture to an ionic liquid. The equilibrium shown in Figure 29 is readily converted back
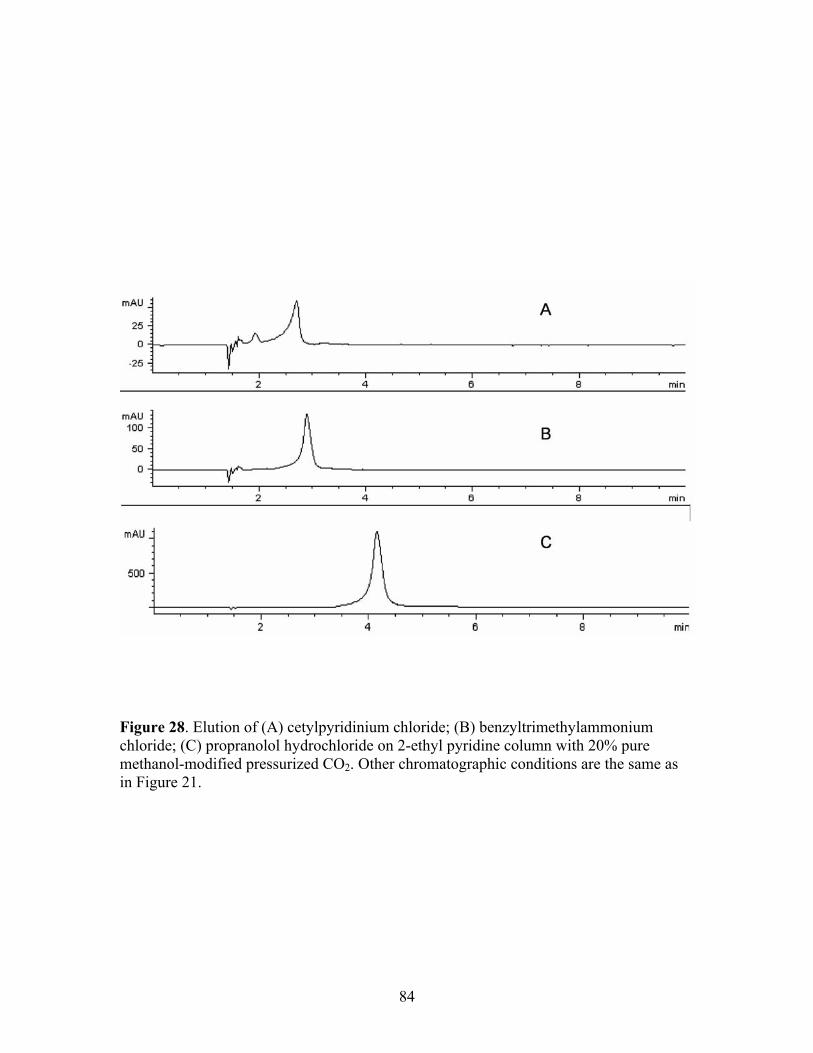
84
Figure 28. Elution of (A) cetylpyridinium chloride; (B) benzyltrimethylammonium chloride; (C) propranolol hydrochloride on 2-ethyl pyridine column with 20% pure methanol-modified pressurized CO2. Other chromatographic conditions are the same as in Figure 21.
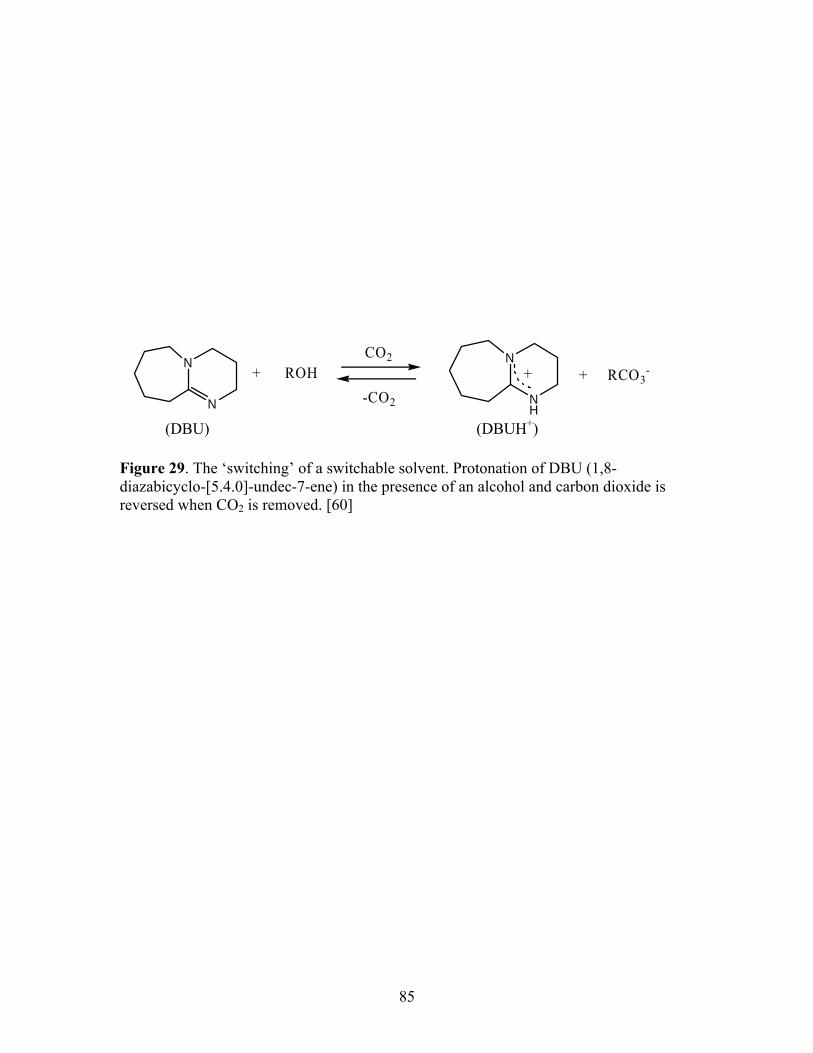
85
N
N
+ RCO3-
-CO2
CO2 N
NH
++ ROH
Figure 29. The ‘switching’ of a switchable solvent. Protonation of DBU (1,8-diazabicyclo-[5.4.0]-undec-7-ene) in the presence of an alcohol and carbon dioxide is reversed when CO2 is removed. [60]
(DBU) (DBUH+)

86
into a non-ionic liquid by bubbling N2 or argon through the liquid at room temperature.
We observed fronting peak shapes for all three analytes, Figure 30, which usually
indicates column overloading. In an attempt to eliminate the peak fronting, we decreased
the sample concentration to 0.25 mg/mL and kept the injection volume at 10 µL. The
same peak shapes were however obtained. It is difficult to imagine overloading of the
column under these conditions as the column dimensions were 250 in length × 4.6mm i.d.
Peak fronting here, we believe, indicates repulsion between the protonated pyridine
stationary phase (promoted by the high pressure CO2/methanol) and the organo-amine
salt analytes.
To test our hypothesis, a basic additive, isopropylamine, was used as a mobile
phase additive. Figure 30 shows the elution of the three ammonium analytes on the
pyridine column with 20% methanol containing 0.5% isopropylamine (A) and 20%
methanol containing 2.5 mM ammonium acetate (B) as modifier. The neutral basic
additive was believed to suppress the ionization of basic analytes and provide a less
charged active stationary phase. Interestingly, isopropylamine (IPA) did not improve the
peak shape of the two quaternary ammonium analytes. Cetylpyridinium chloride and
benzyltrimethylammonium chloride eluted with broad peak shapes and tailed badly. An
ionic additive, ammonium acetate, provided better peak shapes than IPA for these two
quaternary ammonium salts. This observation suggested that when IPA is present in the
mobile phase, since it is a stronger base than pyridine, it suppresses the protonation of the
pyridine functional groups on the stationary phase. Thus, there is less electrostatic
repulsion between the stationary phase and the cationic analytes, so that the analytes
eluted with tailing peak shapes. Alternatively, ammonium acetate would not prevent the

87
Figure 30. Elution of the three ammonium analytes on 2-ethylpyridine column with (A) 20% methanol containing 0.5% IPA; (B) 20% methanol containing 2.5 mM ammonium acetate as the mobile phase modifier with 80% CO2. Other chromatographic conditions are the same as in Figure 24.
Propranolol hydrochloride Propranolol hydrochloride
Cetylpyridinium chloride Cetylpyridinium chloride
Benzyltrimethylammonium chloride
Benzyltrimethylammonium chloride
A B

88
protonation of pyridine and thus it provided better peak shapes for these two quaternary
ammonium salts.
These observations supported our hypothesis that the ethylpyridine stationary
phase may be partially protonated in the presence of a CO2/methanol mobile phase, and
the positively charged ammonium salt analytes were eluted by electrostatic repulsion
between the partially protonated stationary phase and the analytes.
4.3.4 Strong Anion Exchange Stationary Phase
Suspected protonation of the ethylpyridine column in the CO2/methanol based
mobile phase, prompted us to study a strong anion ion exchange (SAX) stationary phase
with SFC. The structures of ethylpyridine, SAX and aminopropyl stationary phases are
shown in Figure 31. This SAX phase carried a permanent positively charged
propyltrimethylammonium cationic functional group. While ion exchange columns have
been widely used in HPLC, this is the first report of using a SAX column in SFC of
which we are aware. Surprisingly, the three amine salts were successfully eluted from the
SAX phase without the need of a mobile phase additive (e.g. 30 - 40% methanol), Figure
32. The peak shapes for cetylpyridinium chloride and benzyltrimethylammonium
chloride again exhibited fronting. These two quaternary ammonium salts eluted faster
than propranolol hydrochloride, as was the case on the ethylpyridine column. These
observations are consistent with repulsive interaction between the positively charged
SAX stationary phase and the positively charged analytes. When 2.5 mM ammonium
acetate in methanol was used as a mobile phase modifier, the analytes were again eluted
from the SAX phase with good peak shape, however there was little change in retention
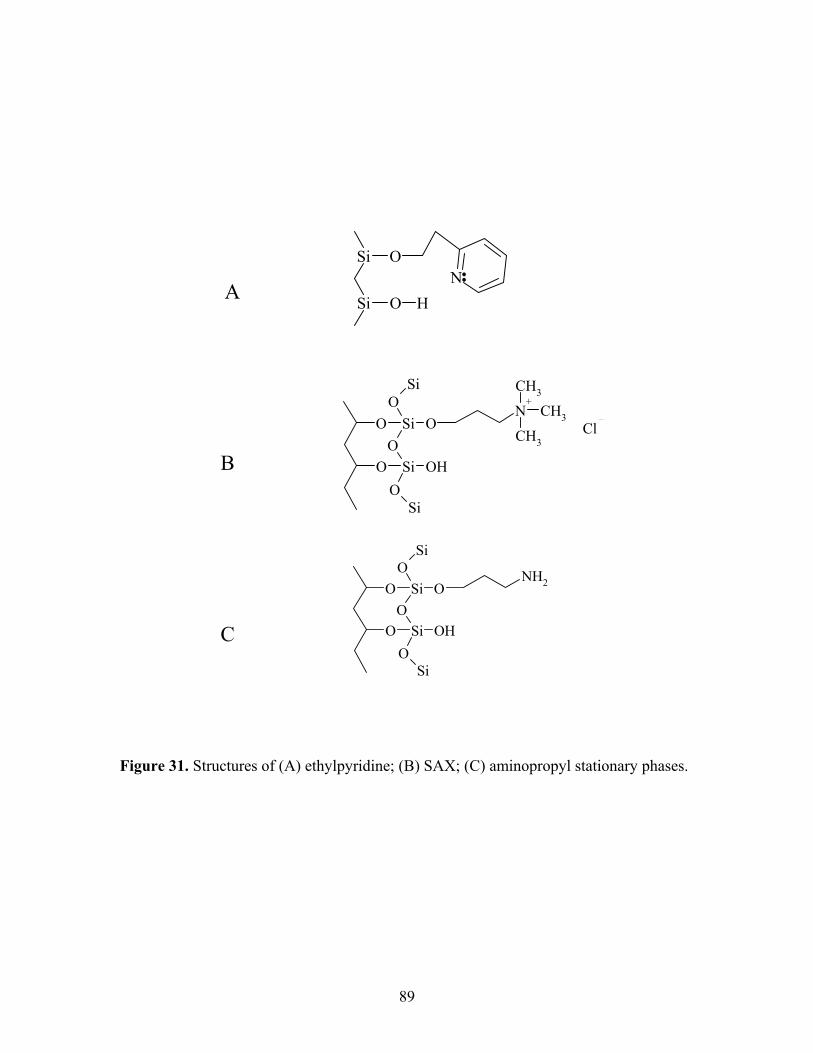
89
A B C Figure 31. Structures of (A) ethylpyridine; (B) SAX; (C) aminopropyl stationary phases.
NH2O
O
Si
SiO
O
OO
OH
Si
Si
ClN
+CH3
CH3
CH3
O
O
Si
SiO
O
OO
OH
Si
Si
N Si
Si O H
O

90
Figure 32. Elution of three ammonium salt analytes on SAX column. (A) propranolol hydrochloride; (B) cetylpyridinium chloride; (C) benzyltrimethylammonium chloride.
150
100
50
0
400
300
200
100
0
mAU
20
10
0
-10
-20
100806040200
-20
mAU
10(min.)
9876543210
120
80
40
0
20100
-10-20
mAU
No Additive
30% modifier
2.5mM AA
2.5mM AA
2.5mM AA
80706050403020100
150
100
50
0
mAU
403020100
-10
10(min.)
9876543210
250200150100
500
mAU
800
600
400
200
0
120
80
40
0
mAU
40% modifier
2.5mM AA
2.5mM AA
2.5mM AA
80706050403020100
150
100
50
0
mAU
403020100
-10
10(min.)
9876543210
250200150100
500
mAU
800
600
400
200
0
120
80
40
0
mAU
40% modifier
2.5mM AA
2.5mM AA
2.5mM AA
No Additive
No Additive No Additive
No Additive
No Additive
Fronting
Fronting
Tailing
Tailing
Fronting
Tailing

91
time, Figure 32. This is probably due to interaction of ammonium acetate with both the
active silanol sites present on the ethylpyridine stationary phase and also with the
propyltrimethylammonium groups on the SAX column. Compared to the ethylpyridine
column, the SAX column seemed to be a more active stationary phase, thus accounting
for the poorer peak shapes without the ammonium acetate additive. Peak fronting and the
elution order of the three analytes on both columns support our hypothesis of protonation
of the ethylpyridine functional group in the presence of the CO2/methanol mobile phase.
4.3.5 Aminopropyl Silica Stationary Phase
If it is true that the pyridine functional groups on the stationary phase are
protonated by methanol-modified CO2, we would expect to observe a similar effect with
an aminopropyl silica phase as the primary amino groups provide a more basic site than
the pyridine moiety. The three cationic organic amines were studied on the amino column
with 30% methanol and 2.5 mM ammonium acetate in methanol as mobile phase
modifiers, Figure 33. All three analytes eluted without additive and all yielded fronting
peak shapes as was observed with the ethylpyridine and SAX columns. Introduction of
ammonium acetate to the mobile phase, afforded much less peak fronting. More
symmetric peak shapes indicates a greater interaction between analytes and the stationary
phase. These phenomena support our hypothesis that basic functional groups on the
stationary phase may be protonated by a mixture of supercritical CO2 and methanol.
These positively charged stationary phases showed advantages for the elution of basic (or
positively charged) analytes in SFC.
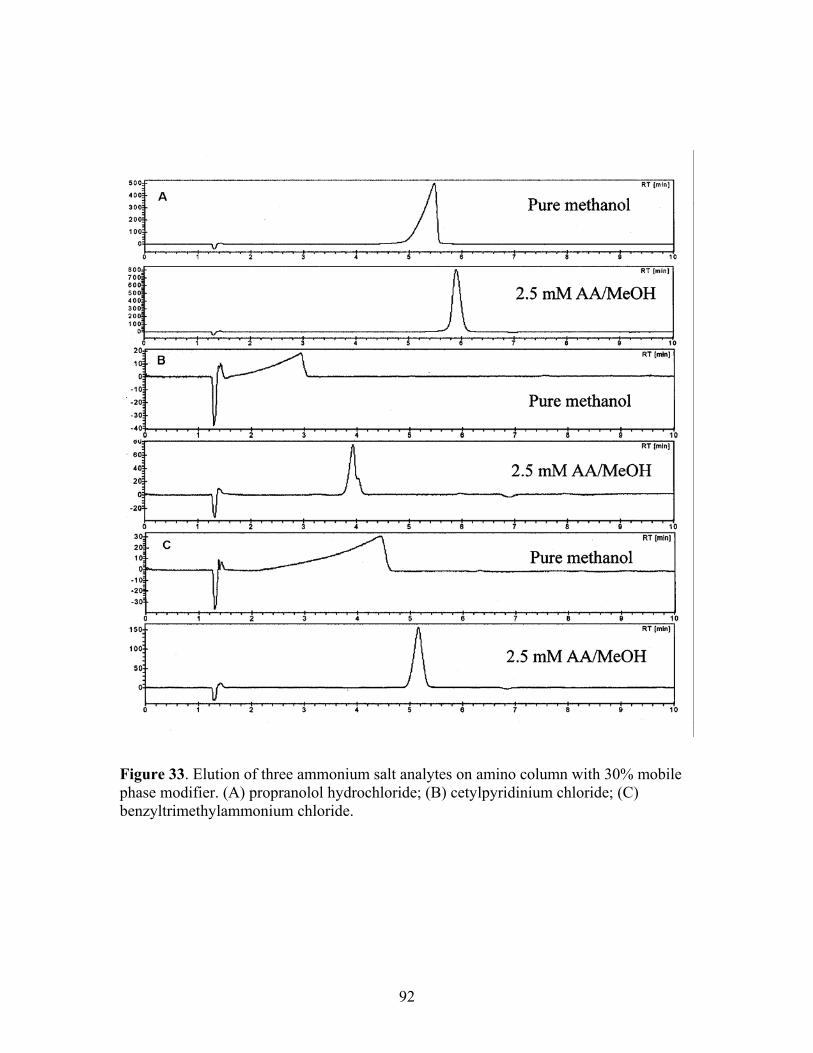
92
Figure 33. Elution of three ammonium salt analytes on amino column with 30% mobile phase modifier. (A) propranolol hydrochloride; (B) cetylpyridinium chloride; (C) benzyltrimethylammonium chloride.

93
4.4 CONCLUSIONS
An ion-pair principle was utilized to elute ionizable ammonium analytes from a
Deltabond cyano stationary phase with sodium sulfonate additives. The lack of any
stationary phase memory effect suggested that there was little or no modification of the
stationary phase. Analytes eluted faster as the additive concentration increased from 0.25
mM to 2.5 mM. Ethylpyridine silica, aminopropyl silica, and SAX stationary phases were
found to be effective for the elution of the same cationic analytes but without the need of
mobile phase additives. A series of experiments provided evidence for the protonation of
at lease some of the pyridine (or amino) functional groups on the stationary phases
thereby generating a positively charged stationary phase in each case within the
CO2/methanol mixture. A similar electrostatic repulsion mechanism was also observed
with the strong anion exchange column. The three probe analytes were eluted from the
SAX column without the need of additive. The addition of ammonium acetate, however,
helped to achieve better peak shapes for the analytes with each stationary phase.

94
CHAPTER 5
Advances in the Elution of Polypeptides with SFC/MS
5.1 INTRODUCTION
The low viscosity and high diffusivity of the mobile phase in supercritical fluid
chromatography (SFC) affords higher flow rates and lower pressure drops along a packed
chromatographic column than is possible in traditional high performance liquid
chromatography (HPLC). SFC is a “green” technology since it requires a smaller amount
of organic solvent than is required in LC. This is especially appealing for preparative
scale chromatography since less time and energy are required to remove solvent and
isolate the analytes. Fluids that are commonly used in SFC, such as CO2, are relatively
non-polar. As a result, SFC has been generally limited to separations of non-polar and
relatively low polarity compounds.
Researchers have sought to extend the applicability of SFC to a wider range of
polar analytes. These strategies included: (1) using more polar pure fluids, such as
ammonia [61], sulfur dioxide [62], nitrous oxide [63], and Freon-23 [12], (2) adding a
polar organic solvent (i.e. “modifier”) to CO2 to improve the solvating power of the
mobile phase [64], and (3) adding a highly polar or ionic component to the modifier (i.e.
“additive”) to further increase the solvating power of supercritical CO2 and/or to
deactivate the stationary phase [20,21].
Mass spectrometry is an informative and universal detection method for
chromatographic separation. LC/MS has, thus, been widely adopted in the analysis of
organic molecules.

95
Various interfaces between SFC and atmospheric pressure ionization (API) mass
spectrometry have been studied [65]. Both electrospray ionization (ESI) and atmospheric
pressure chemical ionization (APCI) have been widely used in SFC/MS [66,67]. The
SFC mobile phase is more volatile than an aqueous-based HPLC mobile phase, which
allows a substantially higher proportion of the column effluent to be directed to the API
interface. Fast, accurate, and quantitative results have been achieved using bioanalytical
SFC/MS [68,69]
Kalinoski et al. provided one of the earliest reports of the characterization of high
molecular weight, biologically active compounds using SFC/chemical ionization-MS.
[70] In work specifically related to the analysis of peptides, these authors analyzed a
cyclic undecapeptide, Cyclosporin A, using a packed microbore C-18 column using
methanol-modified CO2 mobile phase or using a fused-silica capillary column with
isopropanol as modifier. Cyclosporin A was also purified from a mycelial extract via
preparative SFC [71]. Use of far less organic solvent in SFC than in LC provided a
dramatic economic advantage in this preparative scale SFC work. It should be noted that
cyclosporin A is a hydrophobic peptide. Bolanos et al. [72] later reported the separation
of three forms of hydrophobic gramicidin (B, C, and A) by both SFC/ UV and SFC/ESI-
MS with a modifier of methanol containing either 2% water, 0.01 M acetic acid (AA),
and 0.4% isopropylamine or 0.5% trifluoroethanol on a Phenomenex Luna Cyano
column. However, under these conditions, more hydrophilic peptides, such as angiotensin
II, did not provide good peak shapes. The mobile phase composition was complex, and
not very user friendly for positive-ion mode mass spectrometry when isopropylamine was
used as the additive. Blackwell et al. [73] studied the elution of a group of polypeptides
96
containing 4-9 amino acid units on a divinylbenzene polymeric column with a modifier
of either ethanol, or 2-methoxyethanol, containing 50 mM of either methanesulfonic acid,
trifluoromethanesulfonic acid, or heptadecafluorooctane-sulfonic acid. The authors
claimed that the acidity of the additive was critical and that an acid stronger than
trifluoroacidic acid would be required for elution of these peptides. Bradykinin, which
contained the largest number of amino acid residues (two of which were basic arginine
groups), was retained the longest and gave the broadest peak among the chosen peptides
using the same chromatographic conditions.
The goal of our work was to develop supercritical fluid chromatographic methods
which could elute a wide variety of polypeptides, both larger than those eluted in
previous reports, and containing a wider variety of hydrophilic, basic, and acidic amino
acid residues. Furthermore, it was important that the mobile phase be simple and
compatible with mass spectrometric detection. Our ultimate goal is to bring the
advantages of SFC/MS to the characterization of all peptides.
5.2 EXPERIMENTAL
5.2.1 Chemicals
Methanol was HPLC grade, (Sigma-Aldrich, Milwaukee, WI USA). The carbon
dioxide was SFC grade (Matheson Tri-Gas, Morrow, GA USA) with no helium head
pressure. Ammonium acetate (AA) (97+%, ACS grade) and ammonium trifluoroacetate
(ATFA) were obtained from Sigma-Aldrich. Formic acid (FA) (96+%, ACS grade) was

97
obtained from Alfa Aesar (Ward Hill, MA USA). Trifluoroacetic acid (TFA) was
purchased from Perbio (Rockford, IL USA).
Pro-Leu-Gly amide, leupeptin hydrochloride, methionine enkephalin, bradykinin,
bradykinin fragment 1-8, bradykinin fragment 2-9, lys-bradykinin, angiotensin І, human
(acetate salt), angiotensin ІІ, human (acetate salt), and [Val4] angiotensin ІІІ‡, human
(acetate salt) were purchased from Sigma-Aldrich. Sauvagine and urotensin ІІ, human
(hydrochloride salt) were purchased from AnaSpec, Inc. (San Jose, CA USA). Figure 34
shows the sequences and monoisotopic mass of each peptide. A solution of each sample
was prepared in methanol at a concentration of approximately 0.5 mg/mL, unless
specified otherwise.
5.2.2 SFC-UV Instrumentation
The analytical SFC system was from Berger Instruments (Newark, DE USA) with
an Agilent (Palo Alto, CA USA) Model 1100 Diode Array Detector (DAD), which
employed a 1.7-μL high pressure flow cell (6-mm path length) and SFC Pronto software.
UV detection was at 220 nm.
The chromatographic columns were Supelcosil LC-SAX1 (Supelco, Bellefonte,
PA USA), SFC Ethylpyridine-bonded silica, and SFC Amino-bonded silica (Princeton
Chromatography Inc., Cranbury, NJ USA). The Ethylpyridine and Amino columns were
not end-capped. The column dimensions were 25 cm in length and 4.6-mm i.d., with a
particle size of 5 μm for each stationary phase. The Supelcosil LC-SAX1 column had a
pore size of 120 Å; while both Princeton columns had a pore size of 60 Å.
‡ [Val4] Angiotensin ІІІ will be referred to as angiotensin III in future text.

98
Pro-Leu-Gly amide HPro-Leu-GlyNH2 M.M. = 284.2 Da
Leupeptin hydrochloride Acetyl-Leu-Leu-Arg-al•HCl
M.M. = 426.3 Da
Methionine Enkephalin HTyr-Gly-Gly-Phe-MetOH M.M. = 573.2 Da
Bradykinin HArg-Pro-Pro-Gly-Phe-Ser-Pro-Phe-ArgOH M.M. = 1059.6 Da
Bradykinin fragment 1-8 HArg-Pro-Pro-Gly-Phe-Ser-Pro-PheOH M.M. = 903.5 Da Bradykinin fragment 2-9 HPro-Pro-Gly-Phe-Ser-Pro-Phe-ArgOH M.M. = 903.5 Da Lys-Bradykinin HLys-Arg-Pro-Pro-Gly-Phe-Ser-Pro-Phe-ArgOH
M.M. = 1187.7 Da
Angiotensin І, human (acetate salt) HAsp-Arg-Val-Tyr-Ile-His-Pro-Phe-His-LeuOH M.M. =1295.7 Da
Angiotensin ІІ, human (acetate salt) HAsp-Arg-Val-Tyr-Ile-His-Pro-PheOH
M.M. = 1045.5 Da
[Val4] Angiotensin ІІІ, human (acetate salt) HArg-Val-Tyr-Val-His-Pro-PheOH M.M. = 916.5 Da
Sauvagine PyrGPPISIDLSLELLRKMIEIEKQEKEKQQAANNRLLLDTI-NH2 M.M. = 4599.4 Da
Urotensin ІІ, human (hydrochloride salt) H-Glu-Thr-Pro-Asp-Cys-Phe-Trp-Lys-Tyr-Cys-
Val-OH•HCl M.M. = 1388.6 Da
Figure 34. Sequence and monoisotopic molecular mass of each probe peptide.

99
Unless otherwise specified, chromatographic conditions were: injection volume
10 μL, mobile phase flow rate 2 mL/min (measured in the liquid state), column outlet
pressure 120 bar, and column oven temperature 40°C. The mobile phase composition
gradient was: 5% modifier in CO2 for 1 minute after injection, modifier concentration
increased to 50% at 5% per minute, and held for 5 minutes at 50%. The modifier
consisted of either pure methanol or methanol with 5 mM or 13 mM additive.
Between each change of mobile phase additive, the stationary phase was washed
with pure methanol at 1 mL/min for sixty minutes (about 20 column volumes) in order to
either purge previous additive solution from the column or to remove analyte that was
strongly retained on the stationary phase. After this time period, the next additive solution
was introduced to the SFC system, and the column was equilibrated again for 30 minutes
prior to injection.
5.2.3 SFC/MS instrumentation
A zero-dead-volume chromatographic tee was installed immediately after the
analytical column and before the inlet to the UV-DAD detector. A 15-cm long, 50-µm
i.d. Peaksil tube (Upchurch Scientific, Oak Harbor, WA USA) was installed in the tee
and used as a flow splitter before the UV-DAD detector. The tube maintained the
pressure at the end of the column and it directed approximately 1/10 of the flow to the
TurboIonSpray source of a PE Sciex API-165 Single Quadrupole Mass Spectrometer
(Thornhill, Ontario, Canada). The remainder of the effluent was directed to the UV-DAD
detector. The mass spectrometer was controlled by LC2Tune version 1.4 acquisition
software (Applied Biosystems, Foster City, CA). The TurboIonSpray source was

100
operated with a Turbo gas flow of 8 L/min at 400 ºC. The nitrogen gas supply for the
TurboIonSpray nebulizer and curtain gases was set at 50 psi, with Control Panel settings
of 10 and 7 arbitrary units, respectively. The electrospray capillary, orifice, and ring
voltages were held at +4000 V, +35 V, and +240 V, respectively. The electron multiplier
was held at 2700 V. Scan rage was different for each analyte, and is indicated in the
appropriate Figure caption. In most cases, Q1 scans were acquired using a 0.2 u step
value, a 0.5 ms dwell time, and a 5 ms interscan delay.
5.3 RESULTS AND DISCUSSION
5.3.1 Separation of Simple Peptides
Four peptides that have amino acid residues within the range of 3-9 mers were
investigated first. Mixture 1 was composed of methionine enkephalin and bradykinin.
Mixture 2 was composed of Pro-Leu-Gly amide and leupeptin hydrochloride. Figure 35
shows the SFC-UV traces for the separation of these two mixtures with pure methanol,
with 5-mM TFA in methanol, and with 5-mM ammonium acetate in methanol on an
Ethylpyridine column. The modifier gradient was: 5% modifier in CO2 for 1 minute after
injection, modifier concentration increased to 50% at 5% per minute, and held for 5
minutes at 50%. Both mixtures were baseline separated with pure methanol as the mobile
phase modifier. When either TFA or ammonium acetate was used as an additive, Pro-
Leu-Gly amide and leupeptin co-eluted. Changing the modifier (5 mM TFA in methanol)
gradient to a 5% hold for 1 min. followed by a 2%/min. increase to 30%, followed by a 5-
minute hold, improved chromatographic resolution between this pair, as shown in Figure

101
Figure 35. SFC-UV separation of simple peptide mixtures Key: (B) bradykinin; (M) methionine enkephalin; (P) Pro-Leu-Gly amide; (L) leupeptin. See section 5.2 for chromatographic conditions.
Time (min.) Time (min.)

102
36. Selected ion chromatograms are also shown for Pro-Leu-Gly amide and leupeptin
under the original modifier gradient. Fronting peak shapes are clearly demonstrated in
both mass chromatograms. Note that “leupeptin hydrochloride” likely dissociated during
the separation. The component ions, therefore, are believed to have associated with other
counter ions available in abundance in the mobile phase. Consequently, we have used the
term “leupeptin” rather than “leupeptin hydrochloride” in this report.
An interesting observation was the change in peak shape of bradykinin,
methionine enkephalin, and leupeptin with changing mobile phase composition. The
bradykinin and methionine enkephalin peaks fronted with 5 mM TFA/MeOH as modifier,
but tailed with pure methanol or with 5 mM ammonium acetate/ MeOH as modifier. On
the other hand, leupeptin gave fronting peak shapes with both pure methanol and 5 mM
TFA/MeOH (as the mass chromatograms showed in Figure 36), but a tailing peak with 5
mM AA/MeOH. These observations were not apparent with Pro-Leu-Gly amide.
Symmetric peak shapes were obtained with all three modifiers. This is probably because
Pro-Leu-Gly amide is a small (3 residues), relatively hydrophobic peptide. Even with
pure methanol, it eluted with good peak shape.
In our previous study concerning the elution of quaternary ammonium salt
analytes [74] we proposed that there might be at least three retention mechanisms
operating in conjunction with the Ethylpyridine phase: (1) the nitrogen on the pyridine
functional group attached to the stationary phase might form hydrogen bonds with silanol
sites and provide a less active phase; (2) the pyridine aromatic ring might sterically
hinder access to active sites on the stationary phase, as illustrated in Figure 37A; and (3)
a fraction of the pyridine functional group might be protonated by the MeOH/CO2 mobile

103
Figure 36. Separations of mixture of Pro-Leu-Gly amide and leupeptin hydrochloride using two different modifier gradients with UV and mass spectrometric detector of (L) leupeptine and (P) Pro-Leu-Gly amide corresponding to the upper separation. Scan range m/z: 250-450. See section 5.2 for chromatographic conditions.
Mass Chromatogram m/z: 285.0-286.0
Mass Chromatogram m/z: 427.0-428.0
5% hold for 1 min.;5%/min. to 50%, hold for 5 min.; 50%/min. to 5%
LP P
L
6 8 10
1e7
2e7
3e7
4e7
6 8 10Time, min
1e7
2e7
3e7
4e7
5e7
8.11
8.18Time (min.)
5% hold for 1 min.;5%/min. to 50%, hold for 5 min.; 50%/min. to 5%
LP P
L
6 8 10
1e7
2e7
3e7
4e7
6 8 10Time, min
1e7
2e7
3e7
4e7
5e7
8.11
8.18
5% hold for 1 min.;5%/min. to 50%, hold for 5 min.; 50%/min. to 5%
LP5% hold for 1 min.;5%/min. to 50%, hold for 5 min.; 50%/min. to 5%
LP P
L
6 8 10
1e7
2e7
3e7
4e7
6 8 10Time, min
1e7
2e7
3e7
4e7
5e7
8.11
8.18
P
L
6 8 10
1e7
2e7
3e7
4e7
6 8 10Time, min
1e7
2e7
3e7
4e7
5e7
8.11
8.18Time (min.)
5% hold for 1 min.;2%/min. to 30% hold for 5 min.; 50%/min. to 5%
LP
Time (min.)
5% hold for 1 min.;2%/min. to 30% hold for 5 min.; 50%/min. to 5%
LP
Time (min.)
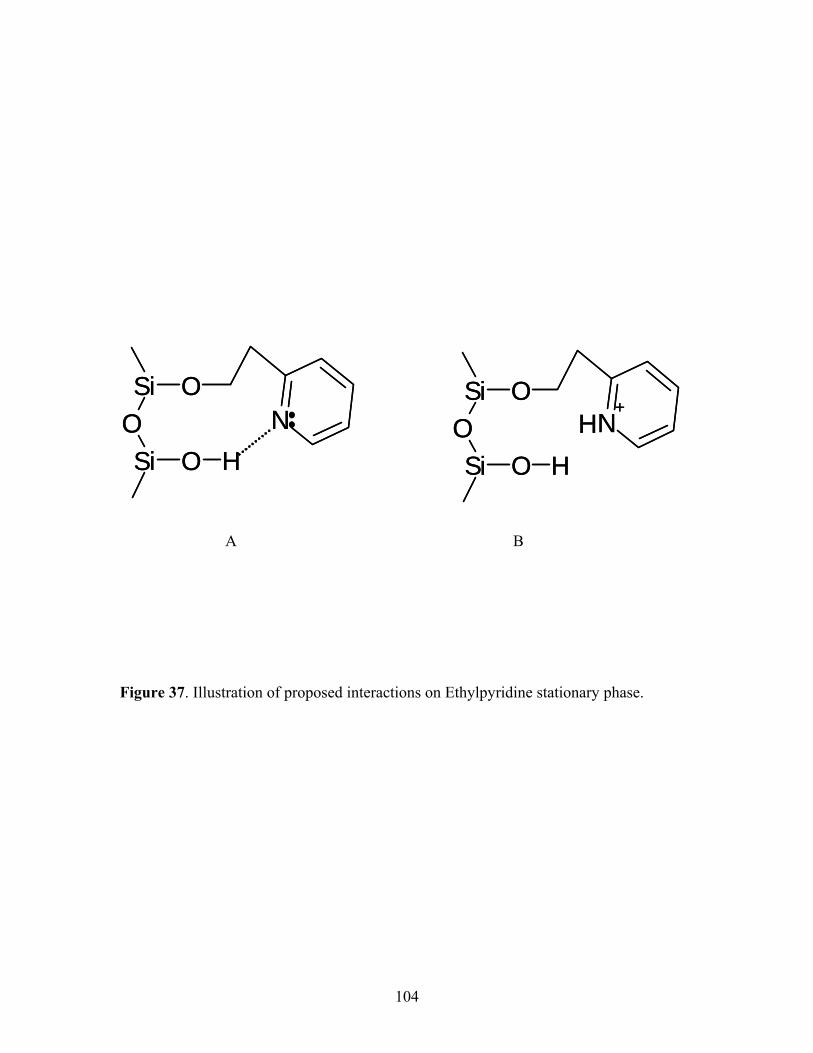
104
Figure 37. Illustration of proposed interactions on Ethylpyridine stationary phase.
A B
SiOSi O H
ON
+HN
SiOSi O H
O SiOSi O H
ON
+HN
SiOSi O H
O

105
phase, as shown in Figure 37B. If the analyte carried a positive charge, for example,
there would tend to be less interaction between the analyte and a protonated pyridine
bound to the solid support. This lack of interaction between the analyte and stationary
phase would result in fronting, “overloaded” peaks. This could possibly explain why
leupeptin provided fronting peak shapes with pure methanol and with 5 mM TFA/MeOH
as modifier. In the acidic environment (5 mM TFA/MeOH), bradykinin and methionine
enkephalin could also be protonated. They were also eluted with a fronting peak shape.
On the other hand, ammonium acetate as an additive would not result in protonation of
the peptides. On the other hand, ammonium acetate ions would likely interact with the
active sites on the solid support, as we have discussed in a previous research report [75],
as well as with the peptides by forming ion pairs, thus allowing more interaction between
the stationary phase and the analytes. This might be the reason that no fronting peak
shapes were observed with ammonium acetate as additive.
5.3.2 Separation of Basic Polypeptides
Bradykinin, bradykinin fragment 1-8, bradykinin fragment 2-9, and lys-
bradykinin contain one or more basic amino acid residues, such as lysine and arginine.
These four basic bradykinins were studied with the Ethylpyridine column using pure
methanol, 5 mM TFA/MeOH, 13 mM TFA/MeOH, 13 mM AA/MeOH, and 13 mM
formic acid/MeOH as modifier. Table 5 shows the retention times and the peak widths at
half height after UV detection at 220 nm. Bradykinin appeared to not elute with 13 mM
AA/MeOH and 13 mM FA/MeOH. As it was detected by ESI-MS, we believe that the
signal was under the limit of detection (LOD) of UV detection. For the same reason, lys-
bradykinin was only detected with UV absorbance detection when 13 mM TFA/MeOH

106
Table 5. Average retention time (min.) and the W1/2h (min.) in parenthesis of the four Bradykinin peptides with different modifier composition. ND: not detected. UV detection at 220 nm (n=2)
Sample Solvent Bradykinin Bradykinin F 1-8 Bradykinin F 2-9 Lys-bradykinin
Pure methanol 9.17 (0.49) 9.13 (0.53) 9.58 (0.39) ND
5 mM TFA/methanol
9.31 (0.36) 9.22 (0.45) 9.56 (0.28) ND
13 mM TFA/methanol
9.63 (0.23) 9.76 (0.26) 9.68 (0.23) 10.13 (0.14)
13 mM AA/methanol
ND 9.73 (0.31) 9.80 (0.13) ND
13 mM FA/methanol
ND 9.07 (0.60) 9.35 (0.70) ND
107
was used as modifier. These observations indicated that the bradykinin and lys-
bradykinin were strongly retained with the other mobile phase compositions. Brakykinin
fragment 2-9 was eluted with the sharpest peak shape in most of the cases.
Figure 38 shows SFC/MS mass chromatograms for the elution of bradykinin, its
fragment 1-8, and 2-9 from the Ethylpyridine column with pure methanol (Figure 38A),
5 mM TFA/MeOH (Figure 38B), and 13 mM TFA/MeOH (Figure 38C) as modifier.
The peak shapes of the bradykinins became sharper and displayed more fronting
asymmetry with increasing concentration of TFA.
Bradykinin has two basic amino acid residues, two arginines. It exhibited tailing
peak shape with pure methanol containing 5 mM TFA and fronting peak shape with
methanol containing 13 mM TFA. Both bradykinin fragment 1-8 and bradykinin
fragment 2-9 contain a single arginine. They were less strongly retained by the stationary
phase, and exhibited more symmetric peak shapes, than bradykinin, even with pure
methanol.
Even though fragment 1-8 and fragment 2-9 are structural isomers, they displayed
different retention behavior. Fragment 2-9 gave a sharper peak than the other three
peptides with pure methanol and with 5 mM TFA in methanol as modifier (Table 5).
This indicated that the terminal amino acid group played a role in the retention
mechanism. Proline, containing a secondary α-amino group, is on the amino end of
fragment 2-9. The secondary amino group is less basic than a primary group, therefore,
the interaction between proline’s amino group and the column’s silanol groups should be
weaker. When a more concentrated TFA/methanol solution was used, there was not much
difference in peak width among the four peptides.
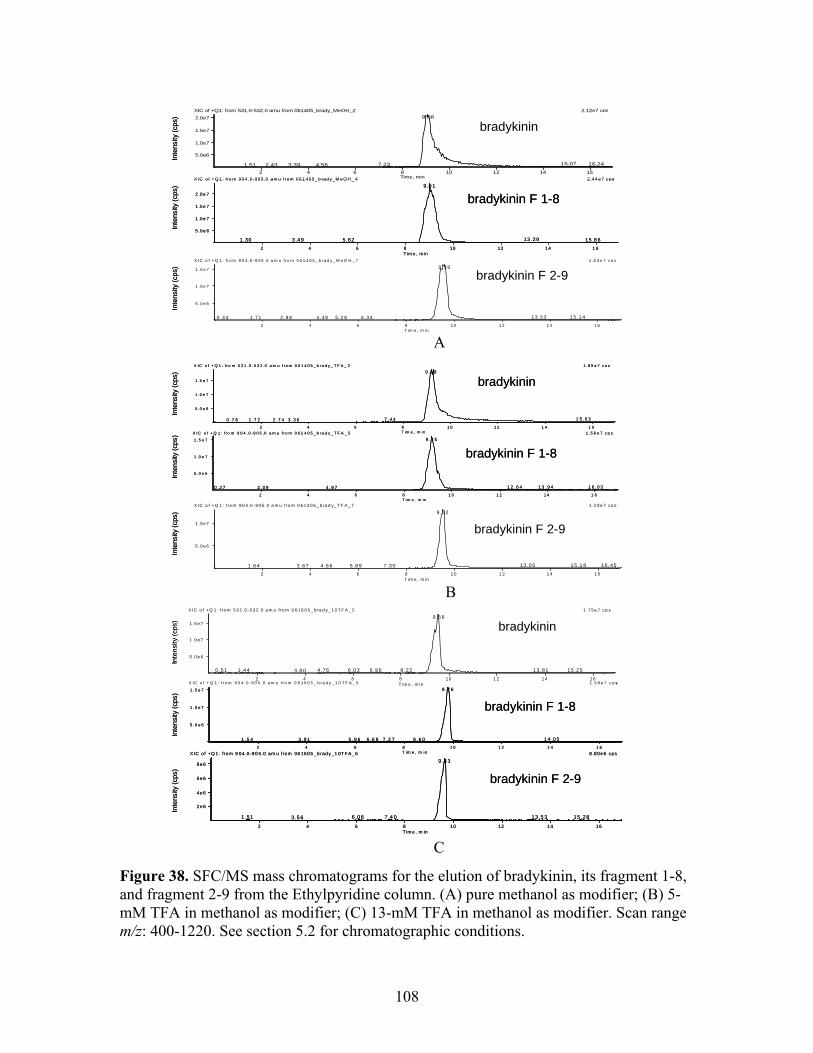
108
Figure 38. SFC/MS mass chromatograms for the elution of bradykinin, its fragment 1-8, and fragment 2-9 from the Ethylpyridine column. (A) pure methanol as modifier; (B) 5-mM TFA in methanol as modifier; (C) 13-mM TFA in methanol as modifier. Scan range m/z: 400-1220. See section 5.2 for chromatographic conditions.
1 .7 5 e 7 cp sX IC o f + Q 1 : f ro m 5 3 1 .0 -5 3 2 .0 a m u fro m 0 6 1 6 0 5 _ b ra d y_ 1 0 T F A _ 2
0 .51 1 .4 4 3 .8 0 4 .76 6 .03 6 .9 6 8 .22
9 .5 6
1 3.81 15 .2 5
2 4 6 8 1 0 1 2 1 4 1 6T im e , m in
5 .0 e 6
1 .0 e 7
1 .5 e 7
8.80e6 cpsX IC of +Q 1 : from 9 04.0 -90 5.0 am u from 061605 _b rady_1 0TFA _6
1.51 3.5 6 6 .0 6 7 .4 0
9 .6 3
13 .5 3 15 .28
2 4 6 8 10 12 14 16T im e , m in
2e6
4e6
6e6
8e6
1 .5 8 e 7 c p sX IC o f + Q 1 : f r o m 9 0 4 .0 - 9 0 5 .0 a m u fr o m 0 6 1 6 0 5 _ b ra d y _ 1 0 T F A _ 5
1 .5 4 3 . 9 1 5 .9 6 6 .6 8 7 .3 7 8 .6 0
9 .7 6
1 4 .0 5
2 4 6 8 1 0 1 2 1 4 1 6T im e , m in
5 .0 e 6
1 .0 e 7
1 .5 e 7
bradykinin
bradykinin F 1-8
bradykinin F 2-9
Inte
nsity
(cps
)In
tens
ity (c
ps)
Inte
nsity
(cps
)
1 .8 9 e 7 c p sX IC o f + Q 1 : f ro m 5 3 1 .0 - 5 3 2 .0 a m u f r o m 0 6 1 4 0 5 _ b ra d y _ T F A _ 2
0 .7 6 1 .7 2 2 . 7 4 3 . 3 6 7 .4 4
9 . 1 8
1 5 . 6 3
2 4 6 8 1 0 1 2 1 4 1 6T im e , m in
5 .0 e 6
1 .0 e 7
1 .5 e 7
1 .5 8 e 7 c p sX IC o f + Q 1 : f ro m 9 0 4 .0 -9 0 5 .0 a m u f ro m 0 6 1 4 0 5 _ b ra d y _ T F A _ 5
0 . 2 7 2 .0 9 4 . 9 7
9 .1 5
1 2 .6 4 1 3 . 9 4 1 6 . 0 3
2 4 6 8 1 0 1 2 1 4 1 6T im e , m in
5 .0 e 6
1 .0 e 7
1 .5 e 7
1 .2 9 e 7 cp sX IC o f + Q 1 : f ro m 9 0 4 .0 -9 0 5 .0 a m u fro m 0 6 1 4 0 5 _ b ra d y_ T F A _ 7
1 .6 4 3 .67 4 .6 6 5 .8 9 7 .3 0
9 .52
13 .0 5 1 5 .1 8 16 .45
2 4 6 8 1 0 1 2 1 4 1 6T im e , m in
5 .0 e 6
1 .0 e 7
bradykinin
bradykinin F 1-8
bradykinin F 2-9
Inte
nsity
(cps
)In
tens
ity (c
ps)
Inte
nsity
(cps
)
2.12e7 cpsXIC of +Q1: from 531.0-532.0 amu from 061405_brady_MeOH_2
1.51 2.43 3.39 4.56 7.23
9.08
15.07 16.24
2 4 6 8 10 12 14 16Time, min
5.0e6
1.0e7
1.5e7
2.0e7
bradykinin
2.44 e 7 cpsX IC of + Q 1 : fro m 904 .0-905 .0 am u f rom 06 1 405_b rady_M e O H _ 4
1 .30 3 .4 9 5 .62
9 .0 1
13 .29 15 .8 62 4 6 8 10 12 14 1 6
T im e , m in
5 .0e 6
1 .0e 7
1 .5e 7
2 .0e 7
1 .6 3 e 7 c p sX IC o f + Q 1 : f ro m 9 0 4 .0 -9 0 5 .0 a m u fro m 0 6 1 4 0 5 _ b ra d y _ M e O H _ 7
0 .3 4 1 .7 1 2 .9 8 4 .4 9 5 .2 8 6 .3 4
9 .5 9
1 3 .5 3 1 5 .1 4
2 4 6 8 1 0 1 2 1 4 1 6T im e , m in
5 .0 e 6
1 .0 e 7
1 .5 e 7
bradykinin F 1-8
bradykinin F 2-9
Inte
nsity
(cps
)In
tens
ity (c
ps)
Inte
nsity
(cps
)
C
B
A

109
Mass chromatograms of doubly charged lys-bradykinin with various mobile phase
compositions are shown in Figure 39. The addition of TFA as additive improved the
peak shapes of the peptide. Again, the sharpest peak shape was obtained at the highest
concentration of TFA (13 mM). The other two additives, 13 mM AA in methanol and 13
mM formic acid in methanol, provided longer retention time and strongly tailing peak
shapes for lys-bradykinin, compared to 13 mM TFA in methanol as modifier. These two
additives were also studied for bradykinin and its two fragments. AA and FA gave poor
peak shapes and long retention time for bradykinin. On the other hand, acceptable, yet
tailing peak shapes were achieved for the two fragments with 13 mM AA and FA.
Among the four bradykinins, lys-bradykinin was retained the longest with 13 mM
TFA. This is reasonable because it has the largest number of basic residues: one lysine
and two arginines. Without the presence of mobile phase additive, these basic amino acid
residues would tend to interact strongly with active silanol groups on the solid support,
resulting in strong retention. With the presence of 13 mM TFA as additive, a sharper and
slightly fronted peak shape was observed compared with results seen with a lower
concentration (5 mM) or with other additives, such as ammonium acetate and formic
acid. This observation suggested that the acidity of the SFC mobile phase is crucial in
obtaining good peak shapes.
Again, fronting peak shapes were observed with 13 mM TFA in methanol, but not
with pure methanol or other modifiers. This also provided evidence to support our
hypothesis that TFA might protonate the four peptides, as well as some fraction of the
pyridine functional groups on the stationary phase. Repulsion between any protonated
pyridine groups on the stationary phase and the protonated analyte would reduce
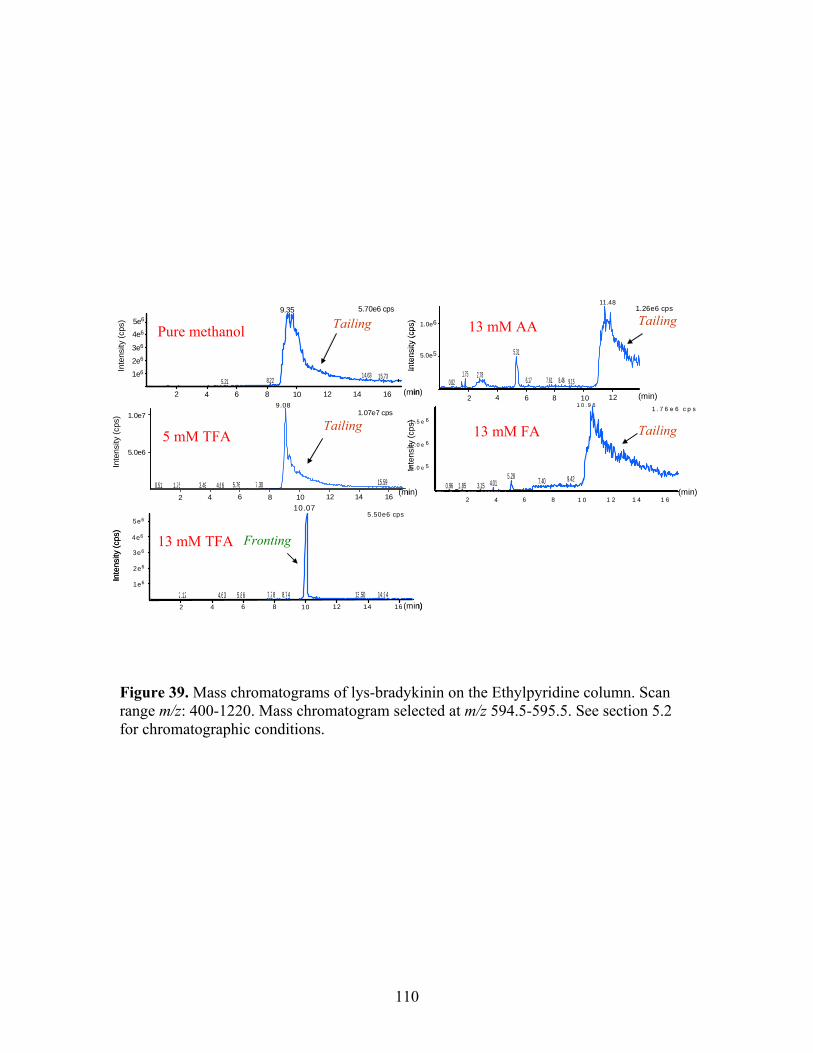
110
Figure 39. Mass chromatograms of lys-bradykinin on the Ethylpyridine column. Scan range m/z: 400-1220. Mass chromatogram selected at m/z 594.5-595.5. See section 5.2 for chromatographic conditions.
1.07e7 cps
2 4 6 8 10 12 14 16
5.0e6
1.0e7
0.51 1.75 3.49 4.66 5.76 7.30 15.59
9.08
2.12 4.63 5.86 7.78 8.74 13.50 14.942 4 6 8 10 12 14 16
1e6
2e6
3e6
4e6
5e6
10.075.50e6 cps
5.21 8.2214.63 15.73
2 4 6 8 10 12 14 16
1e6
2e6
3e6
4e6
5e69.35 5.70e6 cps
0.821.75 2.78
5.31
6.17 7.61 8.46 9.15
2 4 6 8 10 12
1.0e6
5.0e5
11.481.26e6 cps
0.96 1.85 3.15 4.015.28 7.40 9.42
2 4 6 8 1 0 1 2 1 4 1 6
1 .5 e 6
1 .0 e 6
5 .0 e 5
1 0 . 9 61 . 7 6 e 6 c p s
Pure methanol
5 mM TFA
13 mM TFA
13 mM AA
13 mM FA
Inte
nsity
(cps
)In
tens
ity (c
ps)
Inte
nsity
(cps
)
Inte
nsity
(cps
)In
tens
ity (c
ps)
(min)
(min)
(min)
(min)
(min)
Fronting
Tailing
Tailing
Tailing
Tailing1.07e7 cps
2 4 6 8 10 12 14 16
5.0e6
1.0e7
0.51 1.75 3.49 4.66 5.76 7.30 15.59
9.08
2.12 4.63 5.86 7.78 8.74 13.50 14.942 4 6 8 10 12 14 16
1e6
2e6
3e6
4e6
5e6
10.075.50e6 cps
5.21 8.2214.63 15.73
2 4 6 8 10 12 14 16
1e6
2e6
3e6
4e6
5e69.35 5.70e6 cps
0.821.75 2.78
5.31
6.17 7.61 8.46 9.15
2 4 6 8 10 12
1.0e6
5.0e5
11.481.26e6 cps
0.96 1.85 3.15 4.015.28 7.40 9.42
2 4 6 8 1 0 1 2 1 4 1 6
1 .5 e 6
1 .0 e 6
5 .0 e 5
1 0 . 9 61 . 7 6 e 6 c p s
Pure methanol
5 mM TFA
13 mM TFA
13 mM AA
13 mM FA
Inte
nsity
(cps
)In
tens
ity (c
ps)
Inte
nsity
(cps
)
Inte
nsity
(cps
)In
tens
ity (c
ps)
(min)
(min)
(min)
(min)
(min)
Fronting
Tailing
Tailing
Tailing
Tailing

111
retention, and result in fronting peak shapes. Without TFA, unwanted interactions
between the basic groups of the peptides and the stationary-phase silanol groups came
into play and caused peak tailing.
Note that the SFC/MS peak intensity with 13-mM TFA was lower than with 5-
mM TFA, even though a sharper peak shape was obtained in the former case. This
indicated that higher concentrations of TFA result in ionization suppression of lys-
bradykinin. This is a well-known phenomenon in ESI mass spectrometry [76].
A preliminary limit-of-detection (LOD) study with lys-bradykinin was performed.
Figure 40 shows the mass chromatograms for different concentrations of lys-bradykinin
injected on column. Initially, the study was conducted in full-scan mode. The scan range
was from mass-to-charge ratio (m/z) 500 to 1300 with 0.2-u step size, 0.5-ms dwell time,
and 5-ms pause time between each scan. The time required for each scan under these
conditions was 2.01 s. Peaks became narrower as lower concentrations were injected, but
the full-scan acquisition rate was too low to adequately capture the peak shape.
Therefore, we changed from full-scan to single ion monitoring (SIM) mode. We
monitored two m/z ranges during SIM operation: m/z 594.8-595.2 and m/z 1188.6-
1189.0, with a step size of 0.1 u, a dwell time of 20.0 ms, and a 5-ms pause time. Under
these SIM conditions, the scan cycle time was 0.21 s, which provided far better definition
of peak shape than in the full-scan mode. The extracted mass chromatograms displayed in
Figure 40 for injection of 0.5 µg/µL and 0.1 µg/µL were obtained under full-scan mode.
Injections of 0.05 µg/µL and 0.01 µg/µL were in the SIM mode. Sharper peak shapes at
the lower concentrations suggested that overload of the column was achieved for
injection at the highest concentration. We estimated the LOD in full-scan mode to be
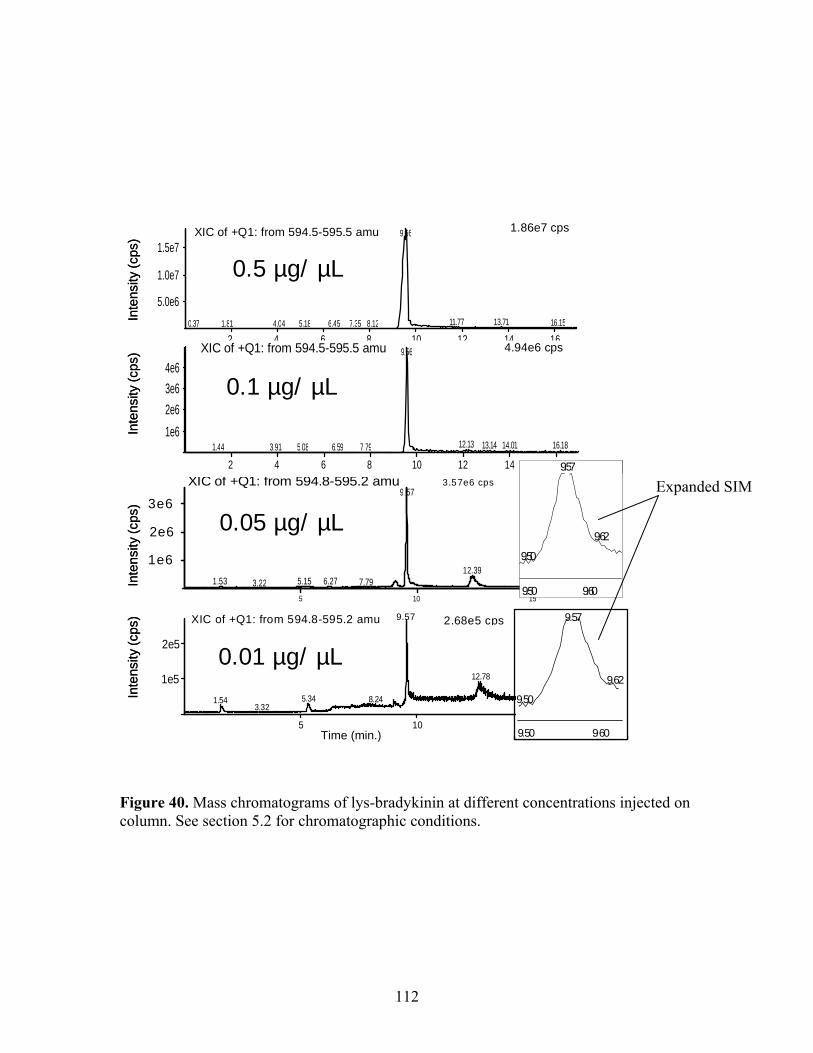
112
Figure 40. Mass chromatograms of lys-bradykinin at different concentrations injected on column. See section 5.2 for chromatographic conditions.
2.68e5 cpsXIC of +Q1: from 594.8-595.2 amu
1.543.32
5.34 8.24
12.78
5 10 15
1e5
2e5
9.57
1.53 3.22 5.15 6.27 7.79
9.57
12.39
5 10 15
1e6
2e6
3e6
XIC of +Q1: from 594.8-595.2 amu 3.57e6 cps
0.37 1.81 4.04 5.18 6.45 7.35 8.12
9.56
11.77 13.71 16.15
5.0e6
1.0e7
1.5e7
2 4 6 8 10 12 14 16
1.86e7 cpsXIC of +Q1: from 594.5-595.5 amu
1.44 3.91 5.08 6.59 7.79
9.56
12.13 13.14 14.01 16.181e62e63e64e6
XIC of +Q1: from 594.5-595.5 amu
2 4 6 8 10 12 14 16
4.94e6 cps
0.5 µg/ µL
0.1 µg/ µL
0.05 µg/ µL
0.01 µg/ µL
Inte
nsity
(cps
)In
tens
ity (c
ps)
Inte
nsity
(cps
)In
tens
ity (c
ps)
9.50
9.62
9.50 9.60
9.57
9.50
9.62
9.50 9.60
9.572.68e5 cpsXIC of +Q1: from 594.8-595.2 amu
1.543.32
5.34 8.24
12.78
5 10 15
1e5
2e5
9.57
1.53 3.22 5.15 6.27 7.79
9.57
12.39
5 10 15
1e6
2e6
3e6
XIC of +Q1: from 594.8-595.2 amu 3.57e6 cps
0.37 1.81 4.04 5.18 6.45 7.35 8.12
9.56
11.77 13.71 16.15
5.0e6
1.0e7
1.5e7
2 4 6 8 10 12 14 16
1.86e7 cpsXIC of +Q1: from 594.5-595.5 amu
1.44 3.91 5.08 6.59 7.79
9.56
12.13 13.14 14.01 16.181e62e63e64e6
XIC of +Q1: from 594.5-595.5 amu
2 4 6 8 10 12 14 16
4.94e6 cps
0.5 µg/ µL
0.1 µg/ µL
0.05 µg/ µL
0.01 µg/ µL
Inte
nsity
(cps
)In
tens
ity (c
ps)
Inte
nsity
(cps
)In
tens
ity (c
ps)
9.50
9.62
9.50 9.60
9.57
9.50
9.62
9.50 9.60
9.57
Expanded SIM
Time (min.)

113
approximately 0.01-µg/µL (for a signal-to-noise ratio (S/N) of ~10). This corresponds to
100 ng for a 10-µL injection volume with about 10 ng going to the TurboIonSpray source
of mass spectrometer. In SIM mode, the LOD was estimated to be 50 ng of lys-
bradykinin. Note that we used the mass chromatogram of the doubly-charged ion to
estimate these values. Our results again show 13-mM TFA in methanol suppresses the
ionization of the analyte. This is not surprising given previous results with electrospray
ionization [76]. However, the improved peak shape with 13-mM TFA in methanol
compensated for the ionization suppression, and still provided the best results.
Some of our earlier results with quaternary amine salts suggest some similarity between
the propylamino and strong anion exchange (SAX) columns and the Ethylpyridine
column [74]. Therefore, we tried to elute the bradykinin analogues from these two
columns under the same conditions. However, none of the bradykinins eluted from either
phase, even with 13-mM TFA in methanol, under the same chromatographic conditions
as described previously. This might be explained by the hypothesized deactivation of
active silanol sites by the pyridine functional groups on the Ethylpyridine stationary
phase.
5.3.3 Separation of Larger Polypeptides
A group of larger polypeptides, with up to 40 amino acid residues, was also
studied. The probe peptides were angiotensin І, human (acetate salt), angiotensin ІІ,
human (acetate salt), angiotensin ІІІ, human (acetate salt), sauvagine, and urotensin ІІ,
human (hydrochloride salt) (sequences shown in Figure 34). Angiotensin І and
angiotensin ІІ do not dissolve in methanol. Angiotensin І, however, does dissolve if 10
114
µL of either acetic acid or TFA is added to 8 mL of a 0.5-mg/mL methanol solution.
Angiotensin ІІ, human was dissolved by adding 10 µL of TFA to 8 mL of a 0.5-mg/mL
methanol suspension. No problems were encountered in dissolving the other three
peptides in methanol.
Sample solutions of angiotensin ІІІ, angiotensin ІІІ plus acetic acid, angiotensin І
plus acetic acid, angiotensin І plus TFA, angiotensin ІІ plus TFA, urotensin II and
sauvagine were prepared. The acid concentration in the sample solutions was
approximately 0.1% (v/v) where applicable. Figure 41 shows mass chromatograms of the
above five polypeptides with various mobile phase modifiers. Adding acetic acid to the
sample solution did not significantly affect the elution of angiotensin ІІІ. Although not
shown in the Figure, there were no significant differences between the chromatograms of
solutions of angiotensin І containing either acetic acid or TFA. Therefore, while addition
of the acids helped dissolve some of the larger peptides, it had little effect on the
chromatography. All three angiotensins gave the sharpest peak shapes with 13 mM TFA
in methanol as modifier. As angiotensin І and ІІ required 0.1% TFA in methanol for
dissolution, it was not surprising that this level of TFA would be required in the mobile
phase for good chromatographic behavior. With 13 mM ATFA as additive, better peak
shapes were obtained compared to 5 mM TFA in methanol. But 13 mM TFA in
methanol modifier still provided the best peak shape.
Urotensin II eluted the fastest and provided the best peak shape with 13 mM TFA
in methanol as modifier. 5 mM TFA in methanol modifier provided better peak shape
than pure methanol. With the salt of TFA, ATFA, the peptide was retained strongly.
Sauvagine did not elute from the Ethylpyridine column with either pure methanol

115
Figure 41. SFC/MS of larger polypeptides with (A) pure methanol; (B) 5 mM TFA/Methanol; (C) 13 mM TFA/Methanol; and (D) 13 mM ammonium trifluoroacetate (ATFA)/Methanol as mobile phase modifier. Scan range m/z: 400-1330 for angiotensins, 400-1420 for urotensins, and 500-2350 for sauvagine. See section 5.2 for chromatographic conditions.
4.90 5.93 8.36 8.98
10.48
16.07
2 4 6 8 10 12 14 16
2e6
4e6
6e6
X IC o f +Q1 : fro m 9 1 7.0 -9 1 8 .0 a m u
Min.
0.66 1.90 3.03 4.89 5.87 7.30 8.78 9.75
11.7712.66
2e5
4e5
6e5XIC o f + Q 1: fro m 10 46 .0 -10 47 .0 am u
2 4 6 8 10 12 14 16 Min.
1.53 2.60 3.71 4.39 5.32 7.28 8.22 9.03 10.27 12.52
13.72
2e5
4e5
6e5
X IC o f + Q 1 : f ro m 1 3 8 8 . 0 -1 3 8 9 . 0 a m u
2 4 6 8 10 12 14 16 Min.
0.39 2.02 3.81 7.30 8.97
10.64
16.551e62e63e64e65e6
2 4 6 8 10 12 14 16
XIC of +Q 1: from 917.0-918.0 am u
Min.
0.31 1.59 2.767.30 8.90
11.58
15.695.0e5
1.0e6
1.5e6
2 4 6 8 10 12 14 16
XIC of +Q1: from 649.0-950.0 amu
Min.
ang. III
ang. III+HOAc
ang. I+TFA
ang. II+TFA
urotensin II
Inte
nsity
(cps
)In
tens
ity (c
ps)
Inte
nsity
(cps
)In
tens
ity (c
ps)
Inte
nsity
(cps
)
0.31 1.20 2.76 4.35 6.768.16 8.97
10.68
12.9715.38 16.20
5.0e4
1.0e5
1.5e5
2 4 6 8 10 12 14 16
XIC of +Q1: from 1046.0-1047.0 am u
Min.
1.36 3.73 5.55 8.12
9.87
16.04
2 4 6 8 10 12 14 16
1e62e63e64e65e6
X IC o f + Q 1 : f r o m 9 1 7 .0 -9 1 8 .0 a m u
Min.
0.70 1.51 3.96 5.21 7.42 8.55
9.83
14.57 15.581e62e63e64e6
XIC of +Q1: from 917.0-918.0 amu
2 4 6 8 10 12 14 16 Min.
ang. III
ang. III+HOAc
ang. I+TFA
ang II+TFA
urotensin II
Inte
nsity
(cps
)In
tens
ity (c
ps)
Inte
nsity
(cps
)In
tens
ity (c
ps)
Inte
nsity
(cps
)
Min.0.66 1.75 2.60 3.42 6.37 9.17
11.15
1e6
2e6
3e6XIC of +Q1: from 649.0-650.0 amu
2 4 6 8 10 12 14 16
1.66 3.15 3.84 5.28 6.22 7.93 8.73 10.69
11.89
5.0e5
2 4 6 8 10 12 14 16
XIC o f +Q 1: from 138 8.0 -138 9.0 a mu
Min.
4.90 5.93 8.36 8.98
10.48
16.07
2 4 6 8 10 12 14 16
2e6
4e6
6e6
X IC o f +Q1 : fro m 9 1 7.0 -9 1 8 .0 a m u
Min.4.90 5.93 8.36 8.98
10.48
16.07
2 4 6 8 10 12 14 16
2e6
4e6
6e6
X IC o f +Q1 : fro m 9 1 7.0 -9 1 8 .0 a m u
Min.
0.66 1.90 3.03 4.89 5.87 7.30 8.78 9.75
11.7712.66
2e5
4e5
6e5XIC o f + Q 1: fro m 10 46 .0 -10 47 .0 am u
2 4 6 8 10 12 14 16 Min.
1.53 2.60 3.71 4.39 5.32 7.28 8.22 9.03 10.27 12.52
13.72
2e5
4e5
6e5
X IC o f + Q 1 : f ro m 1 3 8 8 . 0 -1 3 8 9 . 0 a m u
2 4 6 8 10 12 14 16 Min.
0.39 2.02 3.81 7.30 8.97
10.64
16.551e62e63e64e65e6
2 4 6 8 10 12 14 16
XIC of +Q 1: from 917.0-918.0 am u
Min.0.39 2.02 3.81 7.30 8.97
10.64
16.551e62e63e64e65e6
2 4 6 8 10 12 14 16
XIC of +Q 1: from 917.0-918.0 am u
Min.
0.31 1.59 2.767.30 8.90
11.58
15.695.0e5
1.0e6
1.5e6
2 4 6 8 10 12 14 16
XIC of +Q1: from 649.0-950.0 amu
Min.
0.31 1.59 2.767.30 8.90
11.58
15.695.0e5
1.0e6
1.5e6
2 4 6 8 10 12 14 16
XIC of +Q1: from 649.0-950.0 amu
Min.
ang. III
ang. III+HOAc
ang. I+TFA
ang. II+TFA
urotensin II
ang. III
ang. III+HOAc
ang. I+TFA
ang. II+TFA
urotensin II
Inte
nsity
(cps
)In
tens
ity (c
ps)
Inte
nsity
(cps
)In
tens
ity (c
ps)
Inte
nsity
(cps
)
0.31 1.20 2.76 4.35 6.768.16 8.97
10.68
12.9715.38 16.20
5.0e4
1.0e5
1.5e5
2 4 6 8 10 12 14 16
XIC of +Q1: from 1046.0-1047.0 am u
Min.
0.31 1.20 2.76 4.35 6.768.16 8.97
10.68
12.9715.38 16.20
5.0e4
1.0e5
1.5e5
2 4 6 8 10 12 14 16
XIC of +Q1: from 1046.0-1047.0 am u
Min.
1.36 3.73 5.55 8.12
9.87
16.04
2 4 6 8 10 12 14 16
1e62e63e64e65e6
X IC o f + Q 1 : f r o m 9 1 7 .0 -9 1 8 .0 a m u
Min.1.36 3.73 5.55 8.12
9.87
16.04
2 4 6 8 10 12 14 16
1e62e63e64e65e6
X IC o f + Q 1 : f r o m 9 1 7 .0 -9 1 8 .0 a m u
Min.
0.70 1.51 3.96 5.21 7.42 8.55
9.83
14.57 15.581e62e63e64e6
XIC of +Q1: from 917.0-918.0 amu
2 4 6 8 10 12 14 16 Min.0.70 1.51 3.96 5.21 7.42 8.55
9.83
14.57 15.581e62e63e64e6
XIC of +Q1: from 917.0-918.0 amu
2 4 6 8 10 12 14 16 Min.
ang. III
ang. III+HOAc
ang. I+TFA
ang II+TFA
urotensin II
Inte
nsity
(cps
)In
tens
ity (c
ps)
Inte
nsity
(cps
)In
tens
ity (c
ps)
Inte
nsity
(cps
)
Min.0.66 1.75 2.60 3.42 6.37 9.17
11.15
1e6
2e6
3e6XIC of +Q1: from 649.0-650.0 amu
2 4 6 8 10 12 14 16 Min.0.66 1.75 2.60 3.42 6.37 9.17
11.15
1e6
2e6
3e6XIC of +Q1: from 649.0-650.0 amu
2 4 6 8 10 12 14 16
1.66 3.15 3.84 5.28 6.22 7.93 8.73 10.69
11.89
5.0e5
2 4 6 8 10 12 14 16
XIC o f +Q 1: from 138 8.0 -138 9.0 a mu
Min.1.66 3.15 3.84 5.28 6.22 7.93 8.73 10.69
11.89
5.0e5
2 4 6 8 10 12 14 16
XIC o f +Q 1: from 138 8.0 -138 9.0 a mu
Min.
A B
C
1.49 2.77 4.05 5.24 7.03 7.71
11.29
14.87
5.0e5
1.0e6
1.5e6
2.0e6XIC of +Q1: from 1388.0-1389.0 amu
2 4 6 8 10 12 14 16 Min.
0.88 1.95 3.89 5.65 6.63 7.55 8.94 9.87
11.72
16.22
2e5
4e5
6e5
XIC of +Q1: from 1534.0-1535.0 amu
2 4 6 8 10 12 14 16 Min.
0.742.92
4.636.77
10.43
12.00
13.72
16.08
20000
40000
60000 X IC o f + Q 1 : fro m 1 5 3 4 .0 -1 5 3 5 .0 a m u
2 4 6 8 10 12 14 16
0.64 2.56 6 .64 8.69 10.78 12.10 13 .16 14 .99
16.4 4
2e5
4e5
6e5 XIC o f +Q 1: from 694.5-69 5.5 a mu
2 4 6 8 10 12 14 16 Min.
1.59 2 .56 3.30 5.21 6.02 7 .73 8 .43 10.92
12.62
14 .22
16.281e6
2e6XIC of +Q1: from 532.5-524.5 amu
2 4 6 8 10 12 14 16 Min.
1.98 2.72 4.62 5.75 6.60 8.169.67
11.96
16.595.0e51.0e61.5e62.0e6
X IC o f + Q 1 : fro m 64 9. 0-6 50 .0 am u
2 4 6 8 10 12 14 16 Min.
0 .47 1.59 4.58 6.22 8.16
11.73
16.24
1e6
2e6
3e6XIC of +Q1: from 917.0-918.0 amu
2 4 6 8 10 12 14 16 Min.
1.13 2 .52 4.70 5.52 7 .50 8.78
10.22
14.9 6
2e6
4e6
6e6XIC of +Q1: from 1046.0-1047.0 amu
2 4 6 8 10 12 14 16 Min.
1.32 2.84 4.20 5.36 8.24
10.26
13.05 14.96 16.31
1e6
2e6
3e6
4e6XIC of +Q1: from 1296.5-1297.5 amu
2 4 6 8 10 12 14 16 Min.
0 .58 1.83 3.61 4.47 5.24 6.53 8.86
9.98
13.98 15.58 16.55
5.0e6
1.0e7 XIC of +Q1: from 917.0-918.0 amu
2 4 6 8 10 12 14 16 Min.
0.35 1.32 2.72 4.27 6.25 7.89
10.02
16.00
2 4 6 8 10 12 14 16
5.0e6
1.0e7
1.5e7XIC of +Q1: from 917.0-918.0 amu
Min.
ang. III
ang. III+HOAc
ang. I+TFA
ang. II+TFA
urotensin II
sauvagine
ang. III
ang. I+TFA
ang. II+TFA
urotensin II
sauvagine
Min.
Inte
nsity
(cps
)In
tens
ity (c
ps)
Inte
nsity
(cps
)In
tens
ity (c
ps)
Inte
nsity
(cps
)
Inte
nsity
(cps
)In
tens
ity (c
ps)
Inte
nsity
(cps
)In
tens
ity (c
ps)
Inte
nsity
(cps
)
Inte
nsity
(cps
)
1 .49 2.77 4.05 5.24 7.03 7.71
11.29
14.87
5.0e5
1.0e6
1.5e6
2.0e6XIC of +Q1: from 1388.0-1389.0 amu
2 4 6 8 10 12 14 16 Min.1.49 2.77 4.05 5.24 7.03 7.71
11.29
14.87
5.0e5
1.0e6
1.5e6
2.0e6XIC of +Q1: from 1388.0-1389.0 amu
2 4 6 8 10 12 14 16 Min.
0.88 1.95 3.89 5.65 6.63 7.55 8.94 9.87
11.72
16.22
2e5
4e5
6e5
XIC of +Q1: from 1534.0-1535.0 amu
2 4 6 8 10 12 14 16 Min.0.88 1.95 3.89 5.65 6.63 7.55 8.94 9.87
11.72
16.22
2e5
4e5
6e5
XIC of +Q1: from 1534.0-1535.0 amu
2 4 6 8 10 12 14 16 Min.
0.742.92
4.636.77
10.43
12.00
13.72
16.08
20000
40000
60000 X IC o f + Q 1 : fro m 1 5 3 4 .0 -1 5 3 5 .0 a m u
2 4 6 8 10 12 14 16
0.64 2.56 6 .64 8.69 10.78 12.10 13 .16 14 .99
16.4 4
2e5
4e5
6e5 XIC o f +Q 1: from 694.5-69 5.5 a mu
2 4 6 8 10 12 14 16 Min.
0 .64 2.56 6 .64 8.69 10.78 12.10 13 .16 14 .99
16.4 4
2e5
4e5
6e5 XIC o f +Q 1: from 694.5-69 5.5 a mu
2 4 6 8 10 12 14 16 Min.
1.59 2 .56 3.30 5.21 6.02 7 .73 8 .43 10.92
12.62
14 .22
16.281e6
2e6XIC of +Q1: from 532.5-524.5 amu
2 4 6 8 10 12 14 16 Min.
1.59 2 .56 3.30 5.21 6.02 7 .73 8 .43 10.92
12.62
14 .22
16.281e6
2e6XIC of +Q1: from 532.5-524.5 amu
2 4 6 8 10 12 14 16 Min.
1.98 2.72 4.62 5.75 6.60 8.169.67
11.96
16.595.0e51.0e61.5e62.0e6
X IC o f + Q 1 : fro m 64 9. 0-6 50 .0 am u
2 4 6 8 10 12 14 16 Min.1.98 2.72 4.62 5.75 6.60 8.16
9.67
11.96
16.595.0e51.0e61.5e62.0e6
X IC o f + Q 1 : fro m 64 9. 0-6 50 .0 am u
2 4 6 8 10 12 14 16 Min.
0 .47 1.59 4.58 6.22 8.16
11.73
16.24
1e6
2e6
3e6XIC of +Q1: from 917.0-918.0 amu
2 4 6 8 10 12 14 16 Min.0 .47 1.59 4.58 6.22 8.16
11.73
16.24
1e6
2e6
3e6XIC of +Q1: from 917.0-918.0 amu
2 4 6 8 10 12 14 16 Min.
1.13 2 .52 4.70 5.52 7 .50 8.78
10.22
14.9 6
2e6
4e6
6e6XIC of +Q1: from 1046.0-1047.0 amu
2 4 6 8 10 12 14 16 Min.1.13 2 .52 4.70 5.52 7 .50 8.78
10.22
14.9 6
2e6
4e6
6e6XIC of +Q1: from 1046.0-1047.0 amu
2 4 6 8 10 12 14 16 Min.
1.32 2.84 4.20 5.36 8.24
10.26
13.05 14.96 16.31
1e6
2e6
3e6
4e6XIC of +Q1: from 1296.5-1297.5 amu
2 4 6 8 10 12 14 16 Min.1.32 2.84 4.20 5.36 8.24
10.26
13.05 14.96 16.31
1e6
2e6
3e6
4e6XIC of +Q1: from 1296.5-1297.5 amu
2 4 6 8 10 12 14 16 Min.
0 .58 1.83 3.61 4.47 5.24 6.53 8.86
9.98
13.98 15.58 16.55
5.0e6
1.0e7 XIC of +Q1: from 917.0-918.0 amu
2 4 6 8 10 12 14 16 Min.0 .58 1.83 3.61 4.47 5.24 6.53 8.86
9.98
13.98 15.58 16.55
5.0e6
1.0e7 XIC of +Q1: from 917.0-918.0 amu
2 4 6 8 10 12 14 16 Min.
0.35 1.32 2.72 4.27 6.25 7.89
10.02
16.00
2 4 6 8 10 12 14 16
5.0e6
1.0e7
1.5e7XIC of +Q1: from 917.0-918.0 amu
Min.0.35 1.32 2.72 4.27 6.25 7.89
10.02
16.00
2 4 6 8 10 12 14 16
5.0e6
1.0e7
1.5e7XIC of +Q1: from 917.0-918.0 amu
Min.
ang. III
ang. III+HOAc
ang. I+TFA
ang. II+TFA
urotensin II
sauvagine
ang. III
ang. I+TFA
ang. II+TFA
urotensin II
sauvagine
Min.
Inte
nsity
(cps
)In
tens
ity (c
ps)
Inte
nsity
(cps
)In
tens
ity (c
ps)
Inte
nsity
(cps
)
Inte
nsity
(cps
)In
tens
ity (c
ps)
Inte
nsity
(cps
)In
tens
ity (c
ps)
Inte
nsity
(cps
)
Inte
nsity
(cps
)
D

116
or 5-mM TFA in methanol as modifier. We were not surprised by these results due to the
fact that it contains 40 residues, having a molecular mass of over 4500 Da, including four
basic amino acid groups and seven acidic amino acid groups. Only when 13-mM (~0.1%)
TFA in methanol was used as modifier, did sauvagine elute with sharp, symmetrical peak
shape. Sauvagine did elute with 13 mM ATFA in methanol as modifier, but it exhibited
broad, tailing peak shape.
Thirteen millimolar ammonium trifluoroacetate (ATFA) provided better peak
shapes in some cases, but did not provide the good chromatographic behavior provided
by 13 mM TFA additive. This indicated that ion-pair formation was not the only player
here. The acidity of TFA was also important in the elution of these polypeptides.
Fronting peak shapes were generated with 13 mM TFA/MeOH, but not with less
acidic or salt additives. These observations strengthen our hypothesis that suppressing the
dissociation of carboxylic acid groups of the peptides and protonating the amino groups
on the basic amino acid residues is necessary to elute the polypeptides with good peak
shape.
5.3.4 Synthetic Polypeptides
Five synthetic polypeptides were also studied via the SFC/MS method. The
monoisotopic mass, the number of residues, and the number of acidic and basic residues
are listed in Table 6. All five of them have more than 30 residues, molecular mass of
more than 3000 Da, and have a variety of acidic and basic amino acid residues. Due to
the large size and the high polarity of these peptides, they were strongly retained on the
250×4.6-mm i.d., 5-µm Ethylpyridine column. A shorter, 5-cm-long column was
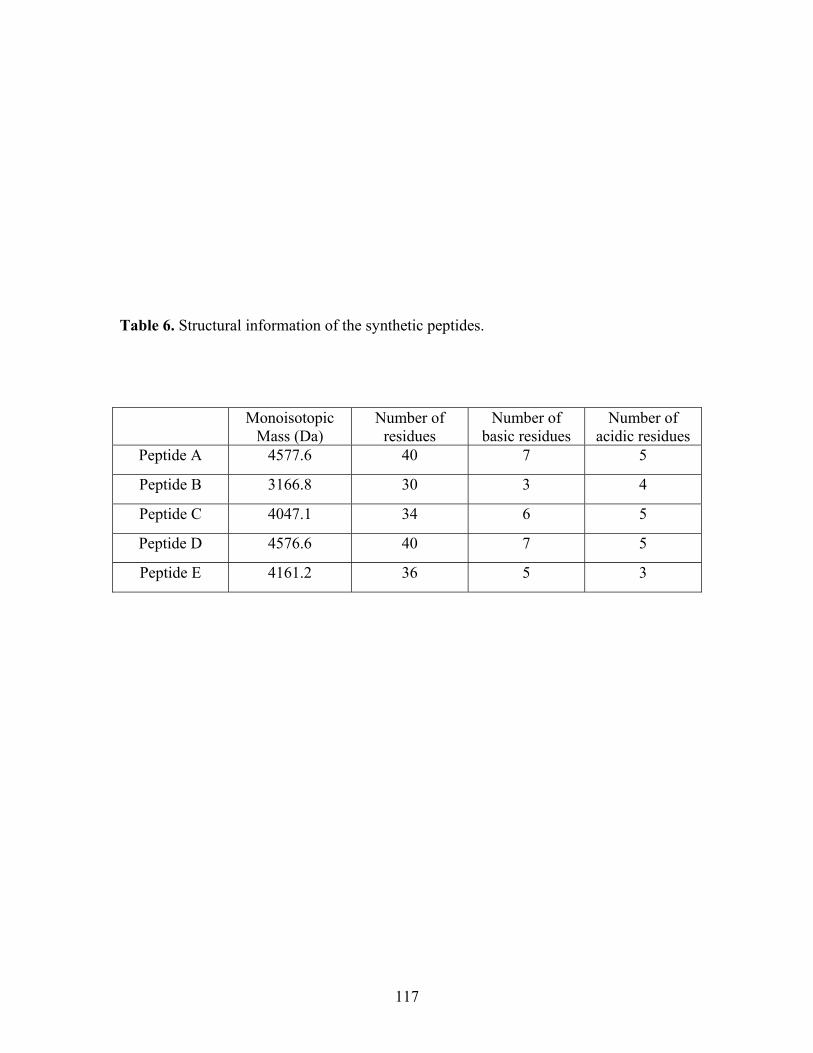
117
Table 6. Structural information of the synthetic peptides.
Monoisotopic
Mass (Da) Number of
residues Number of
basic residues Number of
acidic residues Peptide A 4577.6 40 7 5
Peptide B 3166.8 30 3 4
Peptide C 4047.1 34 6 5
Peptide D 4576.6 40 7 5
Peptide E 4161.2 36 5 3

118
therefore used to enable a greater number of chromatographic conditions to be studied.
The on-line mass spectra of peptide A and peptide B are shown in Figure 42, with
13 mM TFA/methanol as modifier. Ions carrying four and three charges are the most
intense peaks in the spectra, respectively. The mass chromatograms of the +4 (m/z 1146)
and +3 (m/z 1057) ions for peptide A and B, respectively, are shown in Figure 43.
Modifiers of pure methanol, 5 mM TFA/methanol, and 13 mM TFA/methanol were used.
Again, the fastest elution and the sharpest peak shape were achieved with 13 mM
TFA/methanol. The peaks exhibited fronting at the higher concentration of TFA, which is
not a surprise based upon our previous results. Nevertheless, these data are impressive
when one realizes that the peptides have molecular masses ranging to over 4500 Da and a
CO2-based mobile phase is being employed.
The on-line mass spectra of peptide C and peptide D are shown in Figure 44, with
5 mM TFA/methanol as the modifier. Mass chromatograms of the peptides (m/z 1013 for
C and m/z 916 for D) using the 5-cm Ethylpyridine column, with pure methanol or 5 mM
TFA/methanol as modifier are shown in Figure 45. The peptides were retained strongly,
with broad peak shapes when pure methanol was used, but eluted with nice peak shapes
with 5 mM TFA/methanol. When the TFA concentration in the modifier was increased
beyond 5 mM, no significant improvement in chromatographic behavior was observed
for these peptides.
Peptide E was first studied by RP-HPLC/UV and LC/MS. Some impurity peaks
were observed to co-elute with the major peptide. A monolithic C18 column (100×4.6
mm i.d.) provided the best resolution the researchers (see Acknowledgements) could
obtain between peptide E and its oxidation products, as shown in Figure 46. LC/MS

119
Figure 42. Mass spectra of peptide A and peptide B with scan range from m/z 500-2300 for peptide A and m/z 500-2000 for peptide B. Modifier: 13-mM TFA/methanol.
1.89e5 cps+Q1: 8.94 min (7 scans) from 080305_PGP_13TFA_3, subtracted (scans 98 to 143)
561.0 697.0
917.4
1146.2
1528.2
1840.8 2082.4 2188.4 2291.4
600 800 1000 1200 1400 1600 1800 2000 2200m/z, amu
20
40
60
80
7.81e5 cps+Q1: 8.59 min (8 scans) from 080305_PGP_13TFA_5, subtracted (scans 77 to 198)
567.0
799.0
933.6
1057.6
1281.0 1450.81585.2
600 800 1000 1200 1400 1600 1800m/z, amu
20
40
60
80
[M+4H]4+
[M+3H]3+[M+5H]5+
[M+4H]4+
[M+3H]3+
[M+2H]2+
% In
tens
ity%
Inte
nsity
1.89e5 cps+Q1: 8.94 min (7 scans) from 080305_PGP_13TFA_3, subtracted (scans 98 to 143)
561.0 697.0
917.4
1146.2
1528.2
1840.8 2082.4 2188.4 2291.4
600 800 1000 1200 1400 1600 1800 2000 2200m/z, amu
20
40
60
80
7.81e5 cps+Q1: 8.59 min (8 scans) from 080305_PGP_13TFA_5, subtracted (scans 77 to 198)
567.0
799.0
933.6
1057.6
1281.0 1450.81585.2
600 800 1000 1200 1400 1600 1800m/z, amu
20
40
60
80
[M+4H]4+
[M+3H]3+[M+5H]5+
[M+4H]4+
[M+3H]3+
[M+2H]2+
% In
tens
ity%
Inte
nsity

120
Figure 43. Mass chromatograms of peptide A and peptide B with modifier variation with 5 cm Ethylpyridine column. See section 2 for other chromatographic conditions.
0.32 3.43 5.75 7.28 8.06
9.69
11.59 14.32 15.62
2 4 6 8 10 12 14 16
2e5
4e5
6e57.30e5 cpsXIC of +Q1: from 1146.0-1147.0 amu 8.07e6 cpsXIC of +Q1: from 1057.0-1058.0 amu
1.01 2.11 3.61 4.70 5.53 7.59
8.98
12.67 15.15
2 4 6 8 10 12 14 16
2e6
4e6
6e6
8.57e5 cpsXIC of +Q1: from 1146.0-1147.0 amu
0.32 2.09 3.94 6.90 8.11
9.64
11.82 14.13 16.03
2 4 6 8 10 12 14 16
2e5
4e5
6e5
8e51 .05e7 cpsXIC of +Q1: from 1057.0-1058.0 amu
1.05 2.07 3.95 5.30 6.92
8.95
11.16 13.04 15.19
2 4 6 8 10 12 14 16
5.0e6
1.0e7
1.76e6 cpsXIC of +Q1: from 1146.0-1147.0 amu
0.33 2.41 3.48 6.21
8.94
10.06 12.14 13.30 15.71
2 4 6 8 10 12 14 16
5.0e5
1.0e6
1.5e69.77e6 cpsXIC of +Q1: from 1057.0-1058.0 amu
0.34 2.59 5.71
8.61
10.53 11.58 12.41 14.21 15.71
2 4 6 8 10 12 14 16
2e64e66e6
8e6
MeOH
5 mM TFA
13 mM TFA
MeOH
5 mM TFA
13 mM TFA
[M+4H] 4+ [M+3H] 3+
Peptide A Peptide B
Time, min Time, min
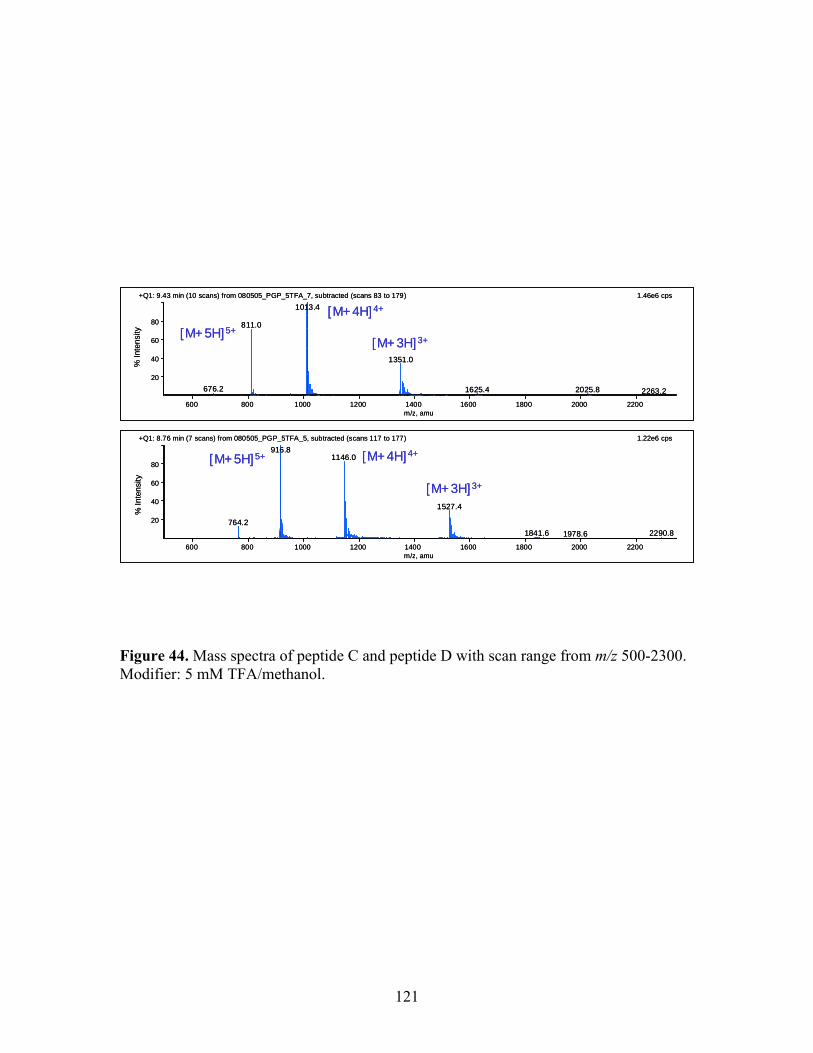
121
Figure 44. Mass spectra of peptide C and peptide D with scan range from m/z 500-2300. Modifier: 5 mM TFA/methanol.
% In
tens
ity
1.22e6 cps+Q1: 8.76 min (7 scans) from 080505_PGP_5TFA_5, subtracted (scans 117 to 177)
764.2
916.81146.0
1527.4
1841.6 1978.6 2290.8
600 800 1000 1200 1400 1600 1800 2000 2200m/z, amu
20
40
60
80
1.46e6 cps+Q1: 9.43 min (10 scans) from 080505_PGP_5TFA_7, subtracted (scans 83 to 179)
676.2
811.0
1013.4
1351.0
1625.4 2025.8 2263.2600 800 1000 1200 1400 1600 1800 2000 2200
m/z, amu
20
40
60
80
% In
tens
ity
[M+4H]4+
[M+3H]3+[M+5H]5+
[M+4H]4+
[M+3H]3+
[M+5H]5+
% In
tens
ity
1.22e6 cps+Q1: 8.76 min (7 scans) from 080505_PGP_5TFA_5, subtracted (scans 117 to 177)
764.2
916.81146.0
1527.4
1841.6 1978.6 2290.8
600 800 1000 1200 1400 1600 1800 2000 2200m/z, amu
20
40
60
80
1.46e6 cps+Q1: 9.43 min (10 scans) from 080505_PGP_5TFA_7, subtracted (scans 83 to 179)
676.2
811.0
1013.4
1351.0
1625.4 2025.8 2263.2600 800 1000 1200 1400 1600 1800 2000 2200
m/z, amu
20
40
60
80
% In
tens
ity
[M+4H]4+
[M+3H]3+[M+5H]5+
[M+4H]4+
[M+3H]3+
[M+5H]5+
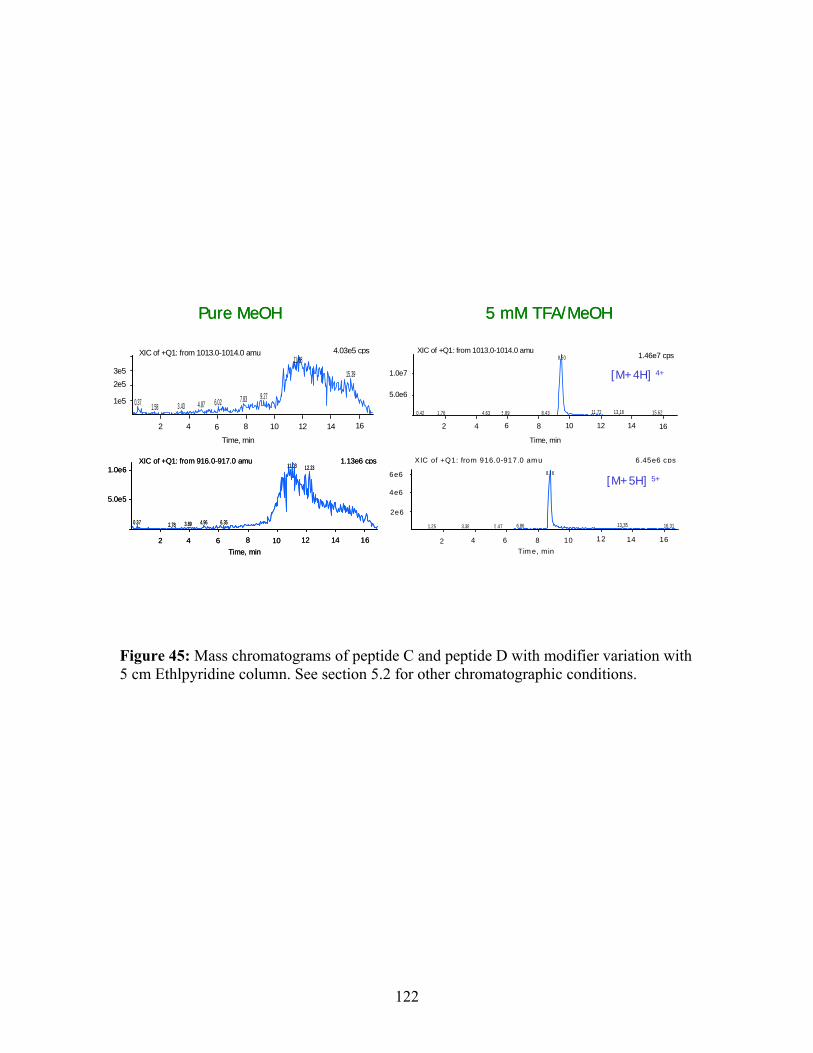
122
Figure 45: Mass chromatograms of peptide C and peptide D with modifier variation with 5 cm Ethlpyridine column. See section 5.2 for other chromatographic conditions.
0.42 1.76 4.63 5.89 8.43
9.50
11.72 13.16 15.62
XIC of +Q1: from 1013.0-1014.0 amu
2 4 6 8 10 12 14 16
Time, min
5.0e6
1.0e7
1.46e7 cps
5 mM TFA/MeOH
[M+4H] 4+
6.45e6 cps
1.25 3.38 5.47 6.86
8.76
13.35 16.31
XIC of +Q1: from 916.0-917.0 am u
2 4 6 8 10 12 14 16Tim e, min
2e6
4e6
6e6[M+5H] 5+
4.03e5 cpsXIC of +Q1: from 1013.0-1014.0 amu
0.37 1.58 3.43 4.87 6.02 7.83 9.27
11.68
15.39
2 4 6 8 10 12 14 16
Time, min
1e5
2e53e5
Pure MeOH
1.13e6 cpsXIC of +Q1: from 916.0-917.0 amu
0.37 2.78 3.89 4.96 6.35
11.03 12.23
2 4 6 8 10 12 14 16
5.0e5
1.0e6
Time, min

123
Figure 46. HPLC/UV and SFC/MS of peptide E and its deamination products (Oven temperature was 50 ºC for 25-cm Ethylpyridine column) HPLC-UV conditions: A = 95% water, 5% ACN with 0.1% TFA; B = 5 % water, 95% ACN with 0.1%TFA ; 75% A
50% A in 30 min, 31-36 min 75%A; Phosphate buffer pH 7; sample concentration: 0.45 mg/mL; injection volume: 20 µl; flow rate: 1 mL/min; UV detection wavelength: 210 nm. SFC-MS scan range m/z: 800-1500.
HPLC/UV assay SFC/MS assay
0.30
0.20
0.10
0.00
12.00 13.00 14.00 15.00 16.00 17.00
(Min.)
AU
4162.2 Da
+1+2+3
25 cm PYD column10% hold 1 min.5%/min. to 50%
[M+4H] 4+
1.01e6 cps
XIC of +Q1: from m/z 1040.0-1043.09.60
9.95
8.0 9.0 10.0 11.0 12.0Time, min
1.00e5
3.00e5
5.00e5
7.00e5
9.00e5
Inte
nsity
, cps
0.30
0.20
0.10
0.00
12.00 13.00 14.00 15.00 16.00 17.00
(Min.)
AU
4162.2 Da
+1+2+3
0.30
0.20
0.10
0.00
12.00 13.00 14.00 15.00 16.00 17.00
(Min.)
AU
0.30
0.20
0.10
0.00
12.00 13.00 14.00 15.00 16.00 17.00
(Min.)
AU
4162.2 Da
+1+2+3
25 cm PYD column10% hold 1 min.5%/min. to 50%
[M+4H] 4+
1.01e6 cps
XIC of +Q1: from m/z 1040.0-1043.09.60
9.95
8.0 9.0 10.0 11.0 12.0Time, min
1.00e5
3.00e5
5.00e5
7.00e5
9.00e5
Inte
nsity
, cps
25 cm PYD column10% hold 1 min.5%/min. to 50%
[M+4H] 4+
1.01e6 cps
XIC of +Q1: from m/z 1040.0-1043.09.60
9.95
8.0 9.0 10.0 11.0 12.0Time, min
1.00e5
3.00e5
5.00e5
7.00e5
9.00e5
Inte
nsity
, cps

124
substantiated that these impurity peaks contained species with one, two, and three mass
units more than the target peptide. This could be explained by the deamination of
asparagines or glutamines as the target peptide contains two asparagines and three
glutamines. It is not clear at this point which residues might be de-aminated.
We decided to see whether our SFC/MS system might provide a better separation
of these closely-related impurities from the main target peptide. Using the 5-cm
Ethylpyridine column, the reconstructed-total-ion-current chromatogram simply showed
a shoulder after the major peak. Then we decided to use a longer column (25 cm) and, by
optimizing the modifier gradient and the oven temperature, we achieved a separation
similar to that provided by HPLC. Three impurity peaks were clearly distinguished from
the target peptide. With SFC, the separation was achieved in a shorter analysis time than
with HPLC (Figure 46). The use of long, coupled columns and high flow rates in SFC is
a practical approach to achieve chromatographic resolution of tough-to-separate mixtures
[77]. We believed this would be a reasonable approach to achieve better resolution of
peptides mixtures.
5.4 CONCLUSIONS
Using relatively simple and mass-spectrometry-compatible mobile phases, we
were able to extend SFC to the elution of polypeptides. The polypeptides were up to 40
residues in length, and contained a variety of acidic and basic residues. We used
trifluoroacetic acid, a relatively strong acid, as additive in the CO2/methanol mobile
phase to suppress ionization of the peptides’ carboxylic acid groups and to protonate the

125
peptides’ amino groups. The TFA likely protonates some fraction of the pyridine
functional groups on the Ethylpyridine stationary phase. We observed fronting peak
shapes and lower retention when higher concentrations of TFA were used. This behavior
supports our hypothesis that electrostatic repulsion between the protonated peptides and
some fraction of the stationary-phase functional groups is occurring.
We investigated three silica-based stationary phases: a strong anion exchange, an
Amino, and an Ethylpyridine stationary phase. The Ethylpyridine was the only one from
which we were able to successfully elute the peptides. This was probably due to
deactivation of the active silanol groups (as the stationary phase was not end capped) by
hydrogen bonding between the pyridine functional groups on the stationary phase and the
silanols, as well limited access to the silica surface due to steric hindrance caused by the
pyridine aromatic ring.
We believe that SFC and SFC/MS may hold great promise for the characterization
of peptide mixtures. Peptide separations are of great economic, human, and
environmental importance in the pharmaceutical and other industries. SFC/MS may
allow faster determinations of targeted “biologics” (i.e., peptide-based pharmaceuticals)
in physiological fluids. Protein degradation studies often lead to complex mixtures of
peptides which are studied using high resolution or 2-dimensional separations. The long-
column capabilities of SFC may be useful in resolving these complex mixtures. In
addition, coupled with reversed-phase HPLC, the more normal-phase elution
characteristics of SFC may provide a rapid, orthogonal second dimension in 2-D
separations. Finally, and of perhaps far greater economic impact, preparatory scale SFC
may provide a more cost-effective route to the purification of important peptides.
126
CHAPTER 6
CONCLUSIONS AND FUTURE WORK
The ionic sodium aryl sulfonate salts were successfully eluted from bare silica,
conventional Cyano, and Deltabond Cyano stationary phases using various ammonium
salts as additives employing methanol modified-mobile phase. Sodium dodecylbenzene
sulfonate was retained longer with the more active stationary phases. This was true with
each ionic additive that was studied. This observation can be explained by more
irreversible interaction between the anionic analyte and the active silanol sites present on
more active stationary phases. An interesting observation was tetramethylammonium
acetate provided the fastest elution on Deltabond Cyano column and the longest retention
on the conventional cyano and bare silica columns among the ionic additives that have
been studied. The same statement was true with the other two sodium aryl sulfonate
analytes. When a cationic analyte—Propranolol hydrochloride—was studied on silica
phase with AA, TMAA, TBAA, or LiOAc as additive, the TMAA eluted the analyte the
fastest.
Solid state 29Si NMR and computational calculation were applied to help us
further understand the interactions involved when ammonium salts were used as
additives. The decreasing intensity of the 29Si signal under CP-MAS NMR suggested that
some of the protons of the silanol groups were removed after the silica packing material
was flushed under the same chromatographic conditions as used in the separation. Most
likely they were replaced by the ammonium cations that were present in the mobile phase
as additives. We sought a deeper understanding of the unique behavior of TMAA,
compared to the other two ammonium additives, AA and TBAA. The surface charge of

127
each ammonium cation was calculated by CaChe software, using three different methods.
All the three methods gave a consistent result: TMAA carries a larger positive charge on
its surface than AA and TBAA do. This would lead one to expect that TMAA-modified
silica phase has a stronger interaction with anionic sulfonate analytes, therefore providing
a stronger retention. On the other hand, due to its stronger interaction with silanol sites,
TMAA provided faster elution of cationic analytes – Propranolol HCl –than did the other
two ammonium additives on silica phase by an ion-exchange type mechanism.
Additionally, the memory effect of ammonium salt additives on the silica phase indicated
strong interactions of the additives and the silica stationary phase. The lack of memory
effect on the Deltabond Cyano phase, on the other hand, indicated that the interaction was
weaker on a more deactivated column. Ion-pair formation was believed to be the
dominant retention mechanism involved with the Deltabond Cyano phase.
Due to the reciprocity of ion pair mechanism, three ammonium analytes –
Propranolol HCl, cetylpyridine chloride, and benzyltrimethyl chloride – were
successfully eluted with fast elution time and good peak shapes with sodium sulfonate
salts as mobile phase additives. The sulfonate salts used were sodium ethanesulfonate,
sodium 1-heptanesulfonate, and sodium 1-decanesulfonate. The long chain sulfonate
provided slightly faster elution than the ones with shorter chains. We believed that it is
due to greatest solubility of the ion-pairs formed by sodium 1-decanesulfonate and the
analyte in CO2 based mobile phase. A higher concentration of modifier was necessary to
achieve acceptable retention times and peak shapes for cetylpyridine chloride and
benzyltrimethyl chloride than for Propranolol HCl. This is probably because these two
analytes are quaternary ammonium salts. They would be expected to have a stronger

128
interaction with the polar bonded Cyano phase via ion-dipole interactions. A memory
effect was not observed on the bare silica phase with sodium ethanesulfonate as additive,
which suggested that the interaction between the sulfonate additives and active silanol
sites are not as significant as those with ammonium additives.
A novel stationary phase, 2-ethylpyridine bonded silica column, successfully
eluted the three ammonium salt analytes with pure methanol as modifier. The fronting
peak shapes and faster elution of the two quaternary ammonium salts compared to
Propranolol HCl suggests that a fraction of the pyridine functional groups is protonated.
Therefore, the stationary phase might carry a fractional positive charge. Electrostatic
repulsion between the stationary phase and the cationic analytes yielded the results we
observed. Our hypothesis was strengthened by similar observations with the SAX and
aminopropyl phases. The addition of ammonium acetate as additive helped to suppress
the fronting of the peaks by providing more interaction between the stationary phases and
the analytes.
Four groups of polypeptides were successfully eluted from the Ethylpyridine
stationary phase by using 0.1% TFA in methanol-modified CO2. This was the first report
of which we are aware that polypeptides with up to 40 mers, with more than 4500 Da in
molecular mass, and containing several hydrophilic amino acid groups, were eluted using
a mobile phase containing a significant majority of CO2. The mobile phase composition
in this work was simple and also compatible with mass spectrometry. We observed
fronting peak shapes and less retention when higher concentrations of TFA were used.
This observation supported our hypothesis that TFA likely protonates some fraction of
the pyridine functional groups on the Ethylpyridine stationary phase, suppresses the

129
protonation of the carboxylic acid groups on the polypeptides, and protonates the basic
amino groups on the peptides. Electrostatic repulsion between the protonated peptides
and some fraction of the stationary-phase functional groups helps to elute the peptides
from the stationary phase.
Elution of the peptides from the strong anion exchange and the aminopropyl
stationary phase was also studied. The Ethylpyridine was the only one from which we
were able to successfully elute the peptides. This was probably due to deactivation of the
active silanol groups by hydrogen bonding between the pyridine functional groups on the
stationary phase and the silanols, as well limited access to the silica surface due to steric
hindrance caused by the pyridine aromatic ring.
In the past two decades, there has been much discussion concerning the promise
of supercritical fluid chromatography. The speed and the environmental benefits of SFC
are well documented for the analysis of non-polar compounds. The limitation of polarity
of compounds that can be analyzed by SFC was considered to be one of the major
drawbacks of SFC. Our research has dramatically extended the application of SFC to
highly polar and ionic compounds, as well as relatively large biologically active
polypeptides. These compounds were generally considered to be impossible for analysis
by SFC before we started this project. We have seen a breakthrough in the application of
SFC to a much wider range of analytes by choosing the right mobile phase compositions
and stationary phases. One of the more significant findings of this work is evidence for
the existence of the stationary phase’s ionic interactions with CO2/methanol mobile
phase. It is reasonable to consider extending the research to ion chromatography in
supercritical mobile phases.
130
A more complete fundamental understanding of the factors responsible for these
separations is desirable. As the 2-ethylpyridine phase has exhibited advantages in
analysis of amine salt analytes, it would be interesting to study the 3- or 4- ethylpyridine
phase to gain a better understanding of the role of the functional group. Novel stationary
phases with various polar functional groups, such as benzamide, propyl acetamide, et al.
are promising in providing different selectivity than conventional SFC columns.
Peptide separations are of great importance in pharmaceutical and other
industries. As the analysis of polypeptides by SFC has not been thoroughly studied, there
is great potential in this area. By adjusting chromatographic conditions, better resolution
between similar peptides may be achieved with the result that peptides with larger size
may be successfully analyzed. The exploration of other stationary phases in the
separation of peptides is also worthwhile.
Scale-up of the separations and extension to chiral stationary phases are two
obvious topics for future work. We are confident that with the right stationary phase and
suitable mobile phase composition, SFC has a bright future for analysis and purification
of a wide range of analytes.

131
REFERENCES
[1] T.A. Berger, "Packed Column SFC", Royal Society of Chemistry, London, 1995. [2] J.W. Ziegler, J.G. Dorsey, T.L. Chester, D.P. Innis, Anal. Chem. 67 (1995) 456. [3] T.L. Chester, J.D. Pinkston, Anal. Chem. 76 (2004) 4606. [4] C.R. Yonker, S.L. Frye, D.R. Kalkwarf, R.D. Smith, J. Phys. Chem. 90 (1986)
3022. [5] J.F. Deye, T.A. Berger, A.G. Anderson, Anal. Chem. 62 (1990) 615. [6] E. Stahl, W. Schilz, Chem. -Ing. -Tech. 50 (1978) 535. [7] E. Stahl, W. Schilz, E. Schuetz, E. Willing, Angew. Chem. 90 (1978) 778. [8] E. Stahl, J. Chromatogr. 142 (1977) 15. [9] K.M. Payne, B.J. Tarbet, J.S. Bradshaw, K.E. Markides, M.L. Lee, Anal. Chem.
62 (1990) 1379. [10] M. De Weerdt, C. Dewaele, M. Verzele, P. Sandra, J. High Resolut. Chromatogr.
13 (1990) 40. [11] M. Ashraf-Khorassani, L.T. Taylor, R.A. Henry, Anal. Chem. 60 (1988) 1529. [12] T.A. Berger, J.F. Deye, J. Chromatogr. Sci. 29 (1991) 390. [13] F.O. Geiser, S.G. Yocklovich, S.M. Lurcott, J.W. Guthrie, E.J. Levy, J.
Chromatogr. 459 (1988) 173. [14] H. Engelhardt, A. Gross, R. Mertens, M. Petersen, J. Chromatogr. 477 (1989)
169. [15] J.E. France, J.M. Snyder, J.W. King, J. Chromatogr. 540 (1991) 271. [16] O. Gyllenhaal, A. Karlsson, J. Vessman, J. Chromatogr. A 862 (1999) 95. [17] D.C. Jones, K. Dost, G. Davidson, M.W. George, Analyst 124 (1999) 827. [18] K.R. Jahn, B.W. Wenclawiak, Fresenius' J. Anal. Chem. 330 (1988) 243. [19] J.R. Perkins, D.E. Games, J.R. Startin, J. Gilbert, J. Chromatogr. 540 (1991) 239. [20] T.A. Berger, J.F. Deye, J. Chromatogr. 547 (1991) 377.

132
[21] T.A. Berger, J.F. Deye, J. Chromatogr. Sci. 29 (1991) 310. [22] T.A. Berger, J.F. Deye, M. Ashraf-Khorassani, L.T. Taylor, J. Chromatogr. Sci.
27 (1989) 105. [23] M. Ashraf-Khorassani, M.G. Fessahaie, L.T. Taylor, T.A. Berger, J.F. Deye, J.
High Resolut. Chromatogr. Chromatogr. Commun. 11 (1988) 352. [24] W. Steuer, M. Schindler, G. Schill, F. Erni, J. Chromatogr. 447 (1988) 287. [25] W. Steuer, J. Baumann, F. Erni, J. Chromatogr. 500 (1990) 469. [26] T.A. Berger, J.F. Deye, J. Chromatogr. Sci. 29 (1991) 26. [27] T.A. Berger, J.F. Deye, J. Chromatogr. Sci. 29 (1991) 54. [28] T.A. Berger, W.H. Wilson, J. Pharm. Sci. 83 (1994) 281. [29] T.A. Berger, W.H. Wilson, J. Pharm. Sci. 83 (1994) 287. [30] T.A. Berger, W.H. Wilson, J. Pharm. Sci. 84 (1995) 489. [31] Z. Liu, S. Zhao, R. Wang, G. Yang, J. Chromatogr. Sci. 37 (1999) 155. [32] O. Gyllenhaal, J. Vessman, J. Chromatogr. A 839 (1999) 141. [33] C.R. Lee, J.P. Porziemsky, M.C. Aubert, A.M. Krstulovic, J. Chromatogr. 539
(1991) 55. [34] F. Geiser, M. Schultz, L. Betz, M. Shaimi, J. Lee, W. Champion, J. Chromatogr.
A 865 (1999) 227. [35] F. Geiser, R. Shah, Chirality 16 (2004) 263. [36] J.D. Pinkston, D.T. Stanton, D. Wen, J. Sep. Sci. 27 (2004) 115. [37] J.D. Pinkston. Private Communication. [38] J.M. Levy, W.M. Ritchey, J. Chromatogr. Sci. 24 (1986) 242. [39] J. Zheng, L.T. Taylor, J.D. Pinkston, M.L. Mangels, J. Chromatogr. A 1082
(2005) 220. [40] K. Albert, R. Brindle, P. Martin, I.D. Wilson, J. Chromatogr. A 665 (1994) 253. [41] M. Pursch, L.C. Sander, K. Albert, Anal. Chem. 71 (1999) 733A.

133
[42] K. Albert, J. Sep. Sci. 26 (2003) 215. [43] M.D. Bruch, H.O. Fatunmbi, J. Chromatogr. A 1021 (2003) 61. [44] K. Krupczynska, B. Buszewski, P. Jandera, Anal. Chem. 76 (2004) 226A. [45] J.H. Warren, A Guide to Molecular Mechanics and Quantum Chemical
Calculations, Wavefunction, Inc., 2003. [46] J.R. Strubinger, J.F. Parcher, Anal. Chem. 61 (1989) 951. [47] C.R. Yonker, R.D. Smith, Anal. Chem. 61 (1989) 1348. [48] D.F. DeTar, J. Am. Chem. Soc. 104 (1982) 7205. [49] E.D. Lancaster, Ph.D. Thesis, Department of Chemistry, Virginia Polytechnic
Institute and State University Blacksburg, VA, 1996, p. 98. [50] D. Wen, S.V. Olesik, Anal. Chem. 72 (2000) 475. [51] J.D. Pinkston, Private Communication. [52] D.A. Skoog, D.M. West, F.J. Holler, "Fundamentals of Analytical Chemistry",
Saunders College Publishing, Orlando, FL, 1996. [53] M.B. McBride, "Environmental Chemistry of Soils", Oxford University Press,
New York, NY, 1994. [54] J.J.P. Stewart, MOPAC 2002 Manual, Fujitsu Ltd., 2001. [55] K. Suto, S. Kakinuma, Y. Ito, K. Sagara, H. Iwasaki, H. Itokawa, J. Chromatogr.
A 786 (1997) 371. [56] J. Zheng, T. Glass, L.T. Taylor, J.D. Pinkston, J. Chromatogr. A 1090 (2005) 155. [57] X. Zhou, A. Handie, H. Salari, E.K. Figer, P.J. Breen, J. Chromatogr. B 728
(1999) 273. [58] J. Wang, J. Lu, L. Zhang, Y. Hu, J. Pharm. Biomed. Anal. 32 (2003) 381. [59] J.A. Tomlinson, T.H. Eichhold, R.E. Barron, S.H. Hoke, in 50th ASMS
Conference on Mass Spectrometry and Allied Topics, Orlando, Florida, 2002. [60] P.G. Jessop, D.J. Heldebrant, X. Li, C.A. Eckert, C.L. Liotta, Nature 436 (2005)
1102.

134
[61] J.C. Giddings, M.N. Myers, L. McLaren, R.A. Keller, Science 162 (1968) 67. [62] E. Leren, K.E. Landmark, T. Greibrokk, Chromatographia 31 (1991) 535. [63] H.H. Lauer, D. McManigill, R.D. Board, Anal. Chem. 55 (1983) 1370. [64] T.A. Berger, J.F. Deye, Anal. Chem. 62 (1990) 1181. [65] J.D. Pinkston, Eur. J. Mass Spectrom. 11 (2005) 189. [66] J.D. Pinkston, T.L. Chester, Anal. Chem. 67 (1995) 650A. [67] M.C. Ventura, W.P. Farrell, C.M. Aurigemma, M.J. Greig, Anal. Chem. 71
(1999) 2410. [68] S.H. Hoke, II, J.D. Pinkston, R.E. Bailey, S.L. Tanguay, T.H. Eichhold, Anal.
Chem. 72 (2000) 4235. [69] S.H. Hoke, II, J.A. Tomlinson, R.D. Bolden, K.L. Morand, J.D. Pinkston, K.R.
Wehmeyer, Anal. Chem. 73 (2001) 3083. [70] H.T. Kalinoski, B.W. Wright, R.D. Smith, Biomed. Environ. Mass Spectrom. 15
(1988) 239. [71] A. Olli, M. Alkio, J. Lundell, S. Ruohonen, L. Parvinen, V. Suoninen, Biopharm
Eur. (1998) XLII. [72] B. Bolanos, M. Greig, M. Ventura, W. Farrell, C.M. Aurigemma, H. Li, T.L.
Quenzer, K. Tivel, J.M.R. Bylund, P. Tran, C. Pham, D. Phillipson, Int. J. Mass Spec. 238 (2004) 85.
[73] J.A. Blackwell, R.W. Stringham, J. High Resol. Chromatogr. 22 (1999) 74. [74] J. Zheng, L.T. Taylor, J.D. Pinkston, J. Chromatogr. A (2005) submitted. [75] J. Zheng, T. Glass, L.T. Taylor, J.D. Pinkston, J. Chromatogr. A 1090 (2005) 155. [76] J.B. Fenn, M. Mann, C.K. Meng, S.F. Wong, C.M. Whitehouse, Mass Spectrom.
Rev. 9 (1990) 37. [77] J.D. Pinkston, S.B. Marapane, G.T. Jordan, B.D. Clair, J. Am. Soc. Mass
Spectrom. 13 (2002) 1195.