Embed Size (px)
Citation preview
Surface Science 606 (2012) 344–355
Contents lists available at SciVerse ScienceDirect
Surface Science
j ourna l homepage: www.e lsev ie r .com/ locate /susc
A chemical approach to understanding oxide surfaces
James A. Enterkin a,b,c, Andres E. Becerra-Toledo d, Kenneth R. Poeppelmeier a,b,c, Laurence D. Marks c,d,⁎a Chemical Sciences and Engineering Division, Argonne National Laboratory, 9700 South Cass Avenue, Argonne, 60439, IL, United Statesb Department of Chemistry, Northwestern University, 2145 Sheridan Road, Evanston, 60208, IL, United Statesc Institute for Catalysis in Energy Processes and Center for Catalysis and Surface Science, Northwestern University, 2137 Sheridan Road, Evanston, 60208, IL, United Statesd Department of Materials Science and Engineering, Northwestern University, 2220 Campus Drive, Evanston, 60208, IL, United States
⁎ Corresponding author at: Institute for Catalysis in ECatalysis and Surface Science, Northwestern University,60208, IL, United States. Tel.: +1 847 491 3996; fax: +
E-mail address: [email protected] (L.D. Ma
0039-6028/$ – see front matter © 2011 Elsevier B.V. Alldoi:10.1016/j.susc.2011.10.018
a b s t r a c t
a r t i c l e i n f oArticle history:Received 5 July 2011Accepted 21 October 2011Available online 28 October 2011
Keywords:Bond valence sumCoordinationChemical bondSurface structureMetal oxide
Chemical bonding has often been ignored in favor of physics based energetic considerations in attempts tounderstand the structure, stability, and reactivity of oxide surfaces. Herein, we analyze the chemical bondingin published structures of the SrTiO3, MgO, and NiO surfaces using bond valence sum (BVS) analysis. Thesesimple chemical bonding theories compare favorably with far more complex quantum mechanical calcula-tions in assessing surface structure stability. Further, the coordination and bonding of surface structuresexplains the observed stability in a readily comprehensible manner. Finally, we demonstrate how simplechemical bonding models accurately predict the adsorption of foreign species onto surfaces, and how suchmodels can be used to predict changes in surface structures.
© 2011 Elsevier B.V. All rights reserved.
1. Introduction
A long outstanding challenge has been understanding in a generalfashion, ideally with predictive power, the structure of solid surfaces.Oxide surfaces in particular have proven difficult to understand, oftenviewed as inherently different from the bulk. Theories about the driv-ing forces behind surface structure formation include the minimiza-tion of “dangling bonds”[1] or reduction of Coulomb forces [2].Many believe that polar surfaces must be different from the bulksince they require “charge compensation” (see for instance [3-5]and references therein). Recent results reveal that surface structuresshare more in common with the bulk than previously believed [6].
Two fundamental approaches exist for understanding bulk struc-tures: physical and chemical. The former generally consists of mini-mizing the potential energy of a structure, and the latter ofunderstanding the localized chemical bonds. In bulk structures,these methods are complimentary, not opposed. The physical theo-ries are often more rigorous, but in their rigor may obscure critical in-sights that are readily apparent in a chemical bonding model. Each,therefore, provides useful and important information necessary for amore complete understanding of bulk structures.
The physics approach has dominated attempts to understand sur-face structures, with little attention paid to a chemical bonding ap-proach. Solid state inorganic chemistry considerations may prove agreat companion to the physics based investigations, potentially
nergy Processes and Center for2137 Sheridan Road, Evanston,1 847 491 7820.rks).
rights reserved.
leading to predictions of what surface structures may form andwhat reactions may occur, just as one can often predict what willform in bulk reactions.
The bond valence sum (BVS) model is commonly used to analyzecoordination and bonding in solid state chemistry [7–9]. It stems fromPauling's second crystal rule [10] and it provides a good understand-ing of structural chemistry and chemical bonding. A bond valence isassigned to each bond, dependent only on the ions involved and thebond distance. Shorter bonds have higher valence, with the bondvalence being relative to the typical bond length between the twoionic species involved. The bond valence for each bond is calculated as:
BV ¼ exp R0 � Rð Þ=bð Þ ð1Þ
where R is the bond distance, R0 is a standard bond distance for thetypes of ions involved, and b is an empirically derived constant, normal-ly a universal constant of 0.37. R0 values are empirically derived fromstructural analysis of multiple known materials. The BVS for an ion isequal to the sum of the bond valences for all the bonds surroundingthe ion, with positive values for cations and negative values for anions:
BVSj j ¼ ∑all bonds
BV ð2Þ
Lower values indicate reduced species and higher values indicatemore oxidized species, while lower absolute values indicate lower co-ordination and higher absolute values indicate higher coordination.
One very important clarification needs to made, as there is cur-rently substantial confusion in the literature. Valence is a measureof electrons and bonds surrounding an atom and should not be con-fused with the charge on an atom, as the two are very different.
345J.A. Enterkin et al. / Surface Science 606 (2012) 344–355
For instance, SrTiO3 would be written in terms of the valence asSr2+Ti4+O2−
3 whereas in terms the charges on the atoms it is closerto Sr+1.6Ti+2.2O−1.2
3 if the charges are evaluated by Bader's method[11]. Valence is, in fact, what is measured by most spectroscopies,such as XPS and XANES. Charge should be reserved to describe a trueelectrostatic potential contribution. Charge and valence are only thesame in a completely ionic model which is inappropriate for oxides.(Pauling used the term “charge” in his original papers, but it has beenreplaced by valence in current usage.) For polar oxide surfaces and in-terfaces the real issue is to find the appropriate valence neutral surfacewhich is neither oxidized (ions substantially higher than their normalvalence, e.g. Mg3+, O1−) nor reduced (ions too low a valence,e.g. Mg1+, O3−).
The distinction between valence and charge is easily seen in or-ganic chemistry. In organic molecules, carbon is tetravalent, nitrogentrivalent, oxygen and sulfur divalent, and halogens and hydrogenmonovalent. While the BVS formulation is not used, the same princi-ples account for valence and bonding: triple bonds are shorter thandouble bonds, which are shorter than conjugated double bonds,which are shorter than single bonds. While organic carbon is tetrava-lent, it is not highly charged, and certainly neither +4 nor −4.
Continuing the introduction, a useful metric in BVS based structuralanalysis is the global instability index (GII), the root mean square of thedeviation of the BVSs from the expected values for all atoms in the unitcell:
GII ¼ffiffiffiffiffiffiffiffiffiffiffiffiffiffiffiffiffiffiffiffiffiffiffiffiffiffiffiffiffiffiffiffiffiffiffiffiffiffiffi∑N
1 ðBVS−BVS0Þ2q
Nð3Þ
where N is the number of atoms in the unit cell and BVS0 is the expectedBVS. In general, a lower GII is preferred, with room temperature bulkstructures typically having GIIb0.2 [12,8].
Structural validation is themost commonuse for BVSs, and there areliterally thousands of examples in the literature. Examples of otheruses include the analysis of incommensurate structures, [13-15]electronegativities, [16] ligand field strengths, [17] nonlinear opticalproperties, [18,19] and thermoluminescence; [20,21] determinationof whether NiAl2O4 was a normal or inverse spinel, [22] and inter-pretation of multiple experimental methods, including NMR [23]and XAFS [24]. More relevant to our later analysis it has been usedfor solid–liquid and other interfaces [25-30]. Additional informationcan be found in several reviews [7,12,8,9].
Despite these demonstrated uses in bulk structures, we are awareof only two times when bond valence has been applied to surfacestructures. The first was in Ruberto and coworkers’ examination ofthe κ-Al2O3 (001)/(00–1) surfaces, [31,32] who confuse BVS withcharge and consider only the bulk BVS in a discussion of polarity com-pensation. As neither the BVS of individual atoms nor the atomic co-ordinates are published, it will not be discussed further. The second isour analysis of a homologous series of structures on the SrTiO3 (110)surface [6].
In this work, we first review the bond valence method and showhow such sums canwork in a complementarymannerwith DFT surfacecalculations, similar to how they are known to complement bulk DFTcalculations. We then review several known and proposed surfacestructures on the perovskite strontium titanate (SrTiO3) and the rocksalts magnesium oxide (MgO) and nickel oxide (NiO), from a bondvalence perspective. (In many cases structures are published in theliterature without making the full structure and atomic positionspublically available, preventing a full bond valence. Lacking theresources to repeat each experiment or calculation, we are only ableto analyze those few structures which have beenmade publically avail-able [33,6] or to which we have access [34-36].) Finally, we will exam-ine a few cases where, similar to solid–liquid interfaces, adsorbatesfrom the atmosphere may be interacting with oxide surfaces.
For simplicity, this work focuses solely on structures where eachsurface atom is in its optimal oxidation state. BVS is well equippedto deal with oxidation and reduction, and such analyses can be donein the future on a case-by-case basis as we believe the method willbe equally useful for many other surfaces. BVS has been especiallyuseful in bulk structures where an element occurs in multiple oxida-tion states within the same structure, as it provides an excellent way(sometimes the only way) to assign oxidation state to each occur-rence of the element [9]. In many cases values for R0 are available inthe literature which do quite well for a range of different valencestates, e.g. for Ti an R0 value of 1.79 has been used adequately for Tiin coordination complexes with valences ranging from 2+ to 4+[37]. More commonly, one will calculate the BVS of an atom usingthe R0 for each possible oxidation state of that element, and the BVScalculated using the R0 for the correct oxidation state is usually signif-icantly closer to the expected whole number value than calculationsusing R0 values for other oxidation states. If no R0 gives a BVS closeto the expected whole number value, this often indicates a mixedvalence compound. Although this use of BVS should also be extendableto surfaces, it would add another level of complexity to this paper andwill therefore be saved for a future work.
2. Methods
BVSs were calculated using the KDist program in the Kalvadosprogram suite [38]. For structures from DFT calculations with latticeparameters different from the experimental values, the volume waschanged isotropically to obtain the correct lattice parameter. Bondinginteractions up to 3.5 Å were included in the calculation. A value ofb=0.37 was used in all cases. R0 values of 1.693 Å for Mg2+–O2−,1.654 Å for Ni2+–O2−, 2.118 Å for Sr2+–O2−, and 1.815 Å for Ti4+–O2−, [7] were used.
Hydrogen bonding creates a slight difficulty, requiring differentparameters for R0 and perhaps even b for hydrogen bonds of differentlengths due to the asymmetry of X–H···X bonds, which is best mod-eled by different values for the short and long portions of the hydro-gen bond (see Brown [9] Section 21 for more details). It is unclearwhich of the various iterature values for R0 is best. For this work,we use R0=0.957 Å, the length of a O–H bond in gaseous H2O. Wechose this as gas phase H2O, similar to the surfaces being considered,has no significant H···X interactions. For ease of calculation, b=0.37was maintained. While determining a R0 value from a single parame-ter is far from an optimal solution, it is sufficient for the small numberof hydroxylated surface structures considered here.
The GII and surface instability index (SII) were calculated by handfrom the BVSs and the atomic multiplicities; the SII is calculated sim-ilar to the GII, except that only the atoms in the outermost surface andthe first bulk layer are included. The top bulk layer is included inorder to capture the instability associated with the strain imposedupon the bulk by the surface. Since strain decays exponentially fromthe surface (Saint-Venant's principle; strictly speaking an analyticalsolution can be written exploiting the form given for spherical har-monics by Love Section 172 [39] as a sum of the two biharmonicsz·exp(−−g|z+ig·ρ) and exp(−−g|z+ig·ρ) with z normal to thesurface [40] and g an in-plane reciprocal lattice vector), using thetop two layers (surface plus top bulk layer) should provide the mostinformation about the stability. (With very large unit cells where |g|may be small one might need more than two layers.) This was con-firmed empirically: instability indices for the surface only, and forthe top three layers were calculated for each structure. Neither wasfound to be as representative of the surface stability as the SII usingthe top two layers. For completeness, there is other evidence thatnear the surface bond lengths can converge relatively fast, [41] con-sistent with our use of just the outermost two layers. A bulk instabil-ity index (BII) was also calculated for the central most stoichiometricunit in the model. In all cases the expected whole number values
346 J.A. Enterkin et al. / Surface Science 606 (2012) 344–355
were used for BVS0 and N represents the total number of atoms in-cluded in the instability index calculation.
For the SrTiO3 (100) surface structures, DFT structural relaxationswere performed using the all-electronWien2k [42] code with an aug-mented plane wave basis set and were based upon a general gradientapproximation (GGA) defined by the PBE functional [43]. For theSrTiO3 (110) TiO faceted model with too few layers and SrTiO3
(111) model 8 with more layers, an on-site PBE0 functional withexact-exchange TPSSh hybrid for final energy calculation was used,to maintain consistency with the calculations from the original publi-cations [33,6]. All other structures analyzed were the previouslypublished structures, and calculation parameters may be found inthe original publications.
CIFs are available for all structures analyzed herein; for furtherdetails see Supplemental Information.
3. The bond valence sum method and DFT structural relaxations
The bond valence model provides complementary information todensity functional theory calculations for bulk structures. For instance,it has been used to correct DFT bond lengths, [27] and GII follows thesame trends DFT calculated energy for bulk structural instabilities [44].
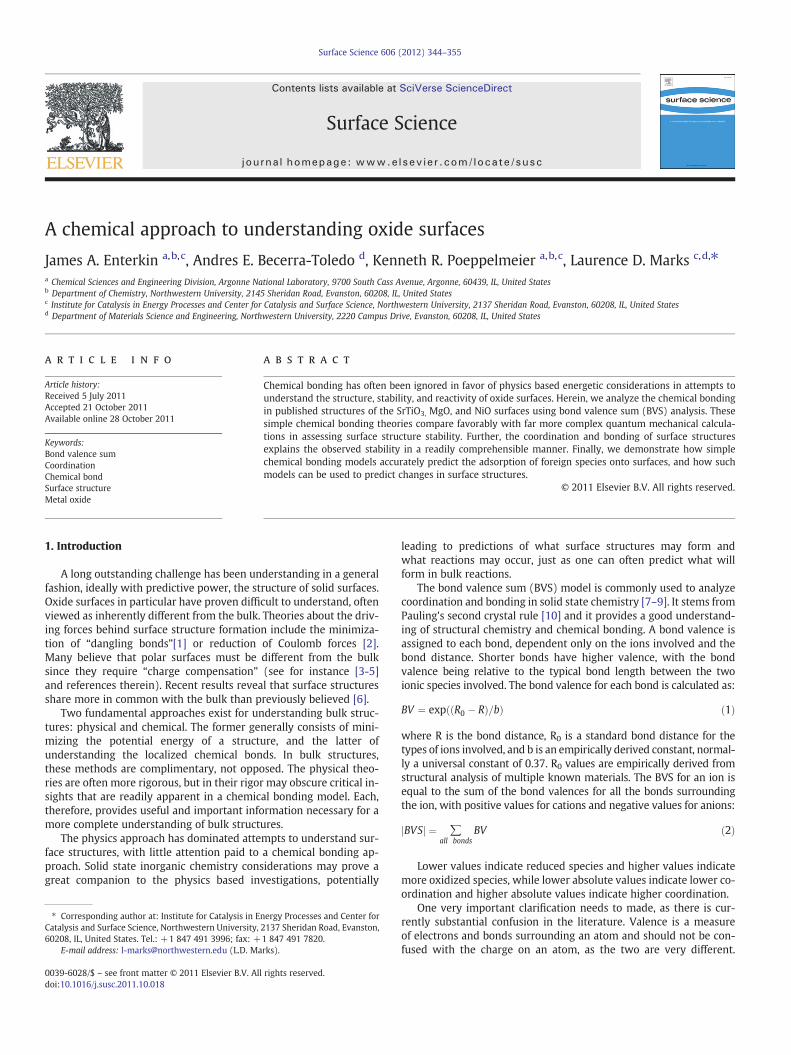
The bond valence model also works well for surface analysis, as in-dicated by the complementary nature of BVSs and DFT structural con-vergence. Fig. 1 shows data during a DFT structural minimization of ahydroxylated MgO (111) surface structure [45]. The GII and DFT calcu-lated energy have nearly identical trends, demonstrating that most ofthe energy reduction can be attributed to optimization of local bonding.The improved bonding occurs primarily at the surface, as indicated bythe SII. The bulk instability index increases as expected; long-rangestrains from the surface rearrangements perturb the bonding in thecenter of the slab.
A technical digression. A standard method with ab-initio calcula-tions is to look at the surface stress of different configurations/partsof the structure, for instance that of the surface monolayer. Thismethod stems in large part from an epitaxial approach. This is easysince most pseudopotential codes give the stress for free. One canthen compare energetics with a nominal expansion/contractionand show how the surface stress can be used to explain transitions.The surface stress is a derivative (in the appropriate units, see [46]) ofthe energy with respect to strain, which can be decomposed into achain-rule sum of derivatives of individual bond-lengths in a localbond-valence method. Hence an overcontracted or overexpandedsurface will show a large surface stress contribution to the energy, andnon-ideal BVS values at a surface. Even for the lowest energy configura-tion the outermost atomic layer can implicitly apply tractions to the
Fig. 1. Global, surface, and bulk instability indices and energy plotted as a function ofgeometry optimization step for a hydroxylated MgO (111) surface from [45]. Energyis relative to the final energy.
layers below. In a classical formulation this would lead to oscillatoryrelaxations biharmonically decaying into the bulk as mentionedabove; in a BVS formulation it shows up as a deviation of the BII fromits optimum value as seen in Fig. 1.
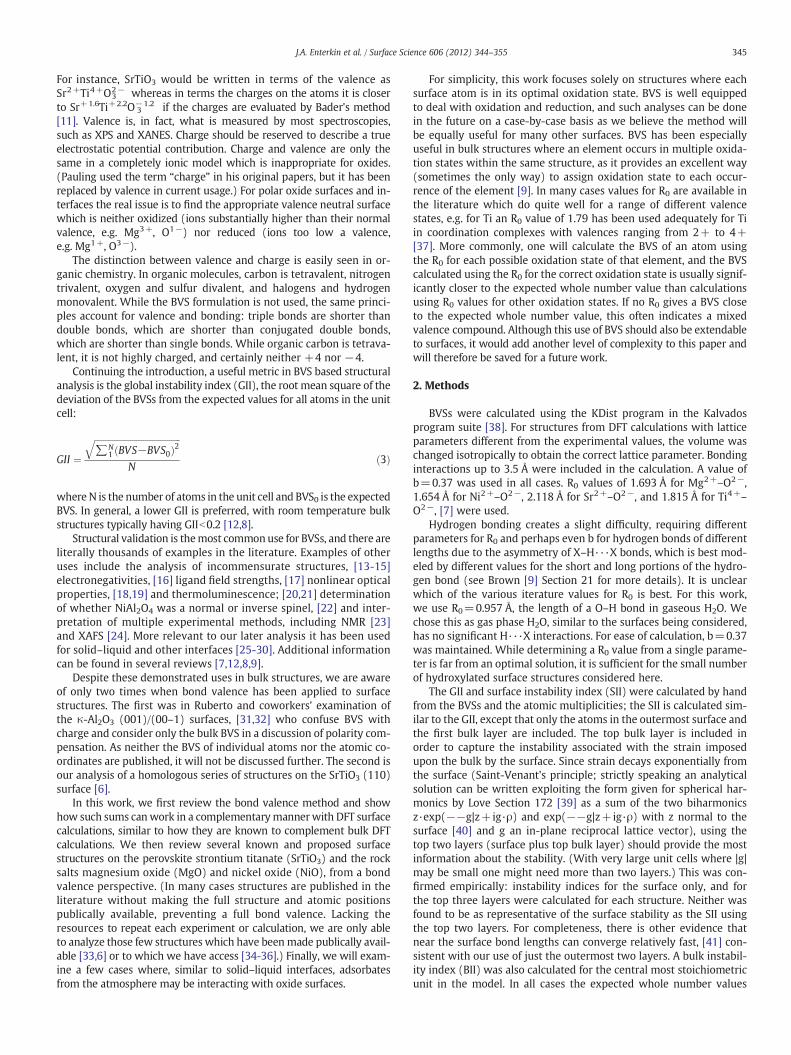
BVSs can also determine if sufficient layers have been used in theDFT surface calculations. If so, then the center of the slab will haveBVSs the same as the bulk structure; otherwise the BVSs will differfrom those of the bulk structure.
As an example, a model of the SrTiO3 (110) TiO faceted structurewas originally optimized with only three bulk SrTiO4+ and fourbulk O2
4− layers, before expanding the calculations to five bulkSrTiO4+ and six bulk O2
4− [6]. In the former case, the number of layerswas too few as shown from a BVS analysis (Fig. 2). To further thecomparison, a case with only one bulk SrTiO4− and two O2
4− was cal-culated as well. While the BVSs of the surface species were improvedfor models with smaller numbers of layers, the bulk coordination wasfar from the bulk BVSs. A necessary, but not sufficient, condition foran accurate model is that the atoms at the central layer have BVSssimilar to the bulk.
Additionally, we have found that performing a structural optimi-zation by minimizing the GII prior to performing a DFT structuralrelaxation can significantly decrease the cost of the DFT calculation.This can be done by hand, changing the position of a few atoms inan initial structural model so they have reasonable BVS values. Inprinciple a BVS based structural optimization could be carried out ina matter of seconds on a standard laptop computer even for largestructures, although at present we are not aware of a code for this.Such a program may also provide a particularly useful alternative toforce-field type calculations of surfaces and defects, as good force-fields for surfaces and defects are often lacking.
Finally, BVS may provide a check on the accuracy of a DFT func-tional. Because current DFT methods have problems in accurately cal-culating solid materials in general and solid surfaces in particular,much work has been undertaken to develop more accurate functionalfor solids and solid surfaces [47-49]. Since BVS parameters are empir-ically derived from crystal structures and are universal, they shouldprovide a good check on these new functionals. A more accurate func-tional should give BVS values for bulk structures that are closer tothose derived from crystal structures. Similarly, such a functionalwould be expected to give a lower SII for surface structures experi-mentally known to be stable, at least as compared to those whichare known from experiment to be unstable.
4. Bond valence sums of model oxide surfaces
We now turn to specific surface examples, discussing the SrTiO3
(110), (111), and (100); MgO (111); and NiO (111) surfaces.
Fig. 2. Change in SII and BII with number of layers in calculation slab for the SrTiO3 (110)halfO2 surface.
Fig. 3. Changes in coordination of surface species in (n×1) series as a function of excessTiO2.
347J.A. Enterkin et al. / Surface Science 606 (2012) 344–355
4.1. SrTiO3 (110)
The only other published example of BVSs of a surface is for theSTO (110) surface [6]. There, a homologous series of (n×1) structureswas compared to a few other proposed surface structures, and the ex-perimentally observed structures had both the lowest DFT calculatedenergy and BVSs closest to the expected whole number values. Usingthis as a starting point, we re-calculate the BVSs of the (n×1) homol-ogous series, and some that were considered for comparison. Thestructures here analyzed include the (n×1) series (n=2, 3, 4, 5, 6, ∞),two structure types terminated by a half-filled O2 layer, and two Sr-terminated models.
The structure of the homologous series consists of chains of cornersharing TiO4 tetrahedra, which are interspersed by rings of similarcorner sharing TiO4 tetrahedra after every n chain tetrahedra. Half-O2 type A is terminated in a bulk-like O2 layer, but with half of theO removed. Two versions of this were considered, with the O re-moved in straight lines [50-58] or in zig-zags forming a (2×1) unit[56,6]. Heifets et. al. [50-52,55,56] also considered another type ofhalf-O2 termination (type B), which has a single O per unit cell, butbridging between two Sr atoms instead of in a bulk-like position.The Sr facet model is a Sr-adatom in a bulk-like position [50-58]. Bot-tin et. al.,[57] proposed more deeply faceted models similar to thefirst Sr model forming (1×n) supercells, the first two members ofwhich are considered here.
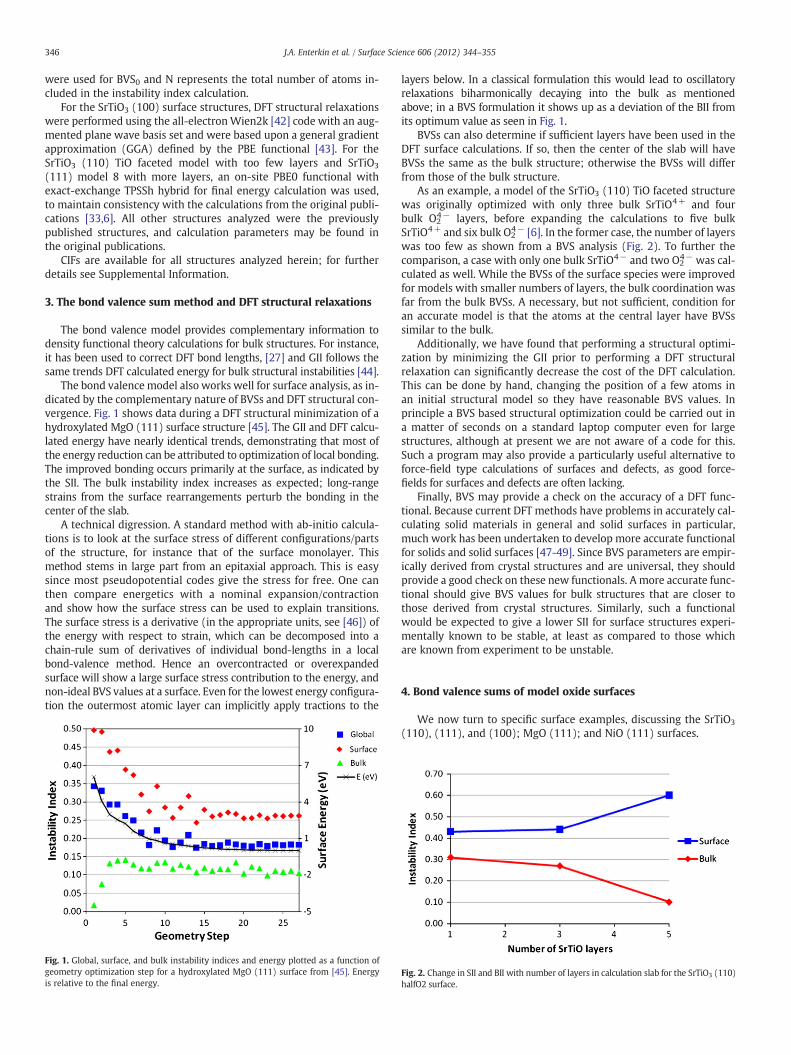
BVSs of the homologous series of n×1 structures were discussedin [6], here we have used a slightly larger cut-off distance, and there-fore get slightly different values (Table 1). The n=3 and n=4 struc-tures have the best BVSs, while the BVSs gradually get worse as nincreases or decreases. The BVSs absolute values decrease as n in-creases (Fig. 3). This is not surprising, as the excess TiO2 at the surfacealso decreases with increasing n: the lower the value of n, the more Tiand O atoms are packed into the same area. The O at the middle of thering has, in all cases, the highest coordination of the surface O. Its BVSdrops close to expected levels as n increases above 3, and the BVSs ofother atoms which are part of the ring remain close to expectedvalues, but at the same time the BVSs of those atoms which are notpart of the ring drop below the expected values. In the end limit ofthe series (n=∞) the BVS of the Ti drops to 3.19 and that of O to−1.21, closer to Ti3+ and O1- than to Ti4+ and O2−. Additionally,the O directly below the ring center becomes increasingly under-coordinated as n increases. At the other end of the series, n=2, thestructure becomes over-coordinated. Most notably, the O in the mid-dle of the ring is very over-coordinated (BVS=−2.39), as is the O inthe middle of the chain (which for n=2 has shrunk to a ring as well,
Table 1BVSs and multiplicity of SrTiO3 (110) (n×1) structures.
SII 2×1 3×1 4×1
0.13 0.07 0.07
Atom Mult BVS Atom Mult BVS Atom Mult
Surface Ti1 2 4.08 Ti1 2 4.08 Ti1 2Ti2 2 4.04 Ti2 2
Ti2 2 4.12Ti3 1 4.04 Ti3 2
O1 2 −1.99 O1 2 −2.03 O1 2 −O2 2 −
O2 2 −2.05 O2 2 −2.02 O3 2 −O3 1 −2.21 O3 1 −2.19O4 1 −2.39 O4 2 −2.04 O4 1 −
O5 1 −Linking O2 layer O5 2 −1.95 O5 2 −2.11 O6 2 −
O6 2 −1.99 O7 2 −O6 2 −2.01 O7 1 −2.06 O8 2 −
O8 1 −2.01 O9 2 −
BVS=−2.21). This leads to a higher SII for the n=2 structure thanfor the n=3,4 or 5 structures.
The structure composed only of rings is over-coordinated, andmight be difficult to form. This fits with the DFT energy calculationswhere, even though it is on the convex hull by default as the mostTiO2 rich structure calculated, the 2×1 structure is significantlyhigher in energy than the other members of the homologous series[6]. Conversely, structures with mostly straight TiO chains areunder-coordinated, and therefore unstable. The optimum BVSs arereached when the TiO chains are broken up by rings at regular inter-vals. This again agrees with the DFT energy calculations (Fig. 4),where the (3×1) and (4×1) structures, which have the overall bestcoordination and surface instability indices, lie on the convex hull,but higher n structures are above the convex hull. The (5×1) and(6×1) structures are only slightly above the convex hull (within cal-culation error), but the energy and surface instability indices are onsteep upward trends and the (∞×1) structure is above the convexhull by more than 1 eV.
These findings bear many similarities to the TiO2 anatase (001) re-constructions analyzed by Lazzeri and Selloni [59]. They describe ahomologous series of surface structures of (1×n) structures(n=3,4,5,6,∞) (although they do not term it such) which differ inhow frequently a row of TiO2 units is added to the bulk termination(the (1×1) being the n=∞ case). While they do not mention BVS,they report that the bond lengths increased as n increased, which
5×1 6×1 ∞×1
0.10 0.17 0.57
BVS Atom Mult BVS Atom Mult BVS Atom Mult BVS
4.07 Ti1 2 4.04 Ti1 2 4.03 Ti1 1 3.193.97 Ti2 2 3.97 Ti2 2 3.96
Ti3 2 3.85 Ti3 2 3.803.94 Ti4 1 3.82 Ti4 2 3.682.03 O1 1 −2.10 O1 1 −2.09 O1 1 −1.212.02 O2 2 −2.02 O2 2 −2.021.94 O3 2 −2.03 O3 2 −2.03
O4 2 −1.902.13 O4 2 −1.93 O5 2 −1.631.84 O5 2 −1.75 O6 1 −1.572.10 O6 2 −2.10 O7 2 −1.95 O2 2 −2.06
O7 2 −1.96 O8 2 −2.091.95 O8 2 −1.97 O9 2 −1.952.04 O9 2 −2.08 O10 2 −2.072.11 O10 1 −2.02 O11 2 −2.02
O11 1 −2.12 O12 2 −2.13
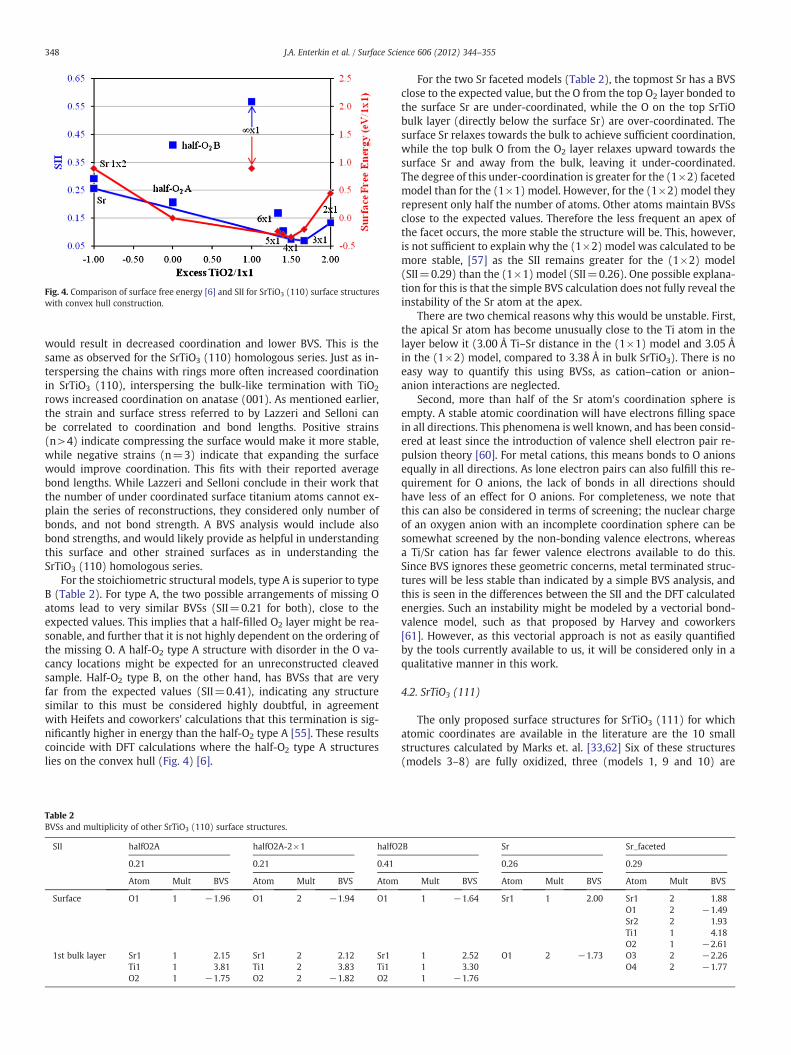
Fig. 4. Comparison of surface free energy [6] and SII for SrTiO3 (110) surface structureswith convex hull construction.
348 J.A. Enterkin et al. / Surface Science 606 (2012) 344–355
would result in decreased coordination and lower BVS. This is thesame as observed for the SrTiO3 (110) homologous series. Just as in-terspersing the chains with rings more often increased coordinationin SrTiO3 (110), interspersing the bulk-like termination with TiO2
rows increased coordination on anatase (001). As mentioned earlier,the strain and surface stress referred to by Lazzeri and Selloni canbe correlated to coordination and bond lengths. Positive strains(n>4) indicate compressing the surface would make it more stable,while negative strains (n=3) indicate that expanding the surfacewould improve coordination. This fits with their reported averagebond lengths. While Lazzeri and Selloni conclude in their work thatthe number of under coordinated surface titanium atoms cannot ex-plain the series of reconstructions, they considered only number ofbonds, and not bond strength. A BVS analysis would include alsobond strengths, and would likely provide as helpful in understandingthis surface and other strained surfaces as in understanding theSrTiO3 (110) homologous series.
For the stoichiometric structural models, type A is superior to typeB (Table 2). For type A, the two possible arrangements of missing Oatoms lead to very similar BVSs (SII=0.21 for both), close to theexpected values. This implies that a half-filled O2 layer might be rea-sonable, and further that it is not highly dependent on the ordering ofthe missing O. A half-O2 type A structure with disorder in the O va-cancy locations might be expected for an unreconstructed cleavedsample. Half-O2 type B, on the other hand, has BVSs that are veryfar from the expected values (SII=0.41), indicating any structuresimilar to this must be considered highly doubtful, in agreementwith Heifets and coworkers' calculations that this termination is sig-nificantly higher in energy than the half-O2 type A [55]. These resultscoincide with DFT calculations where the half-O2 type A structureslies on the convex hull (Fig. 4) [6].
Table 2BVSs and multiplicity of other SrTiO3 (110) surface structures.
SII halfO2A halfO2A-2×1 halfO
0.21 0.21 0.41
Atom Mult BVS Atom Mult BVS Atom
Surface O1 1 −1.96 O1 2 −1.94 O1
1st bulk layer Sr1 1 2.15 Sr1 2 2.12 Sr1Ti1 1 3.81 Ti1 2 3.83 Ti1O2 1 −1.75 O2 2 −1.82 O2
For the two Sr faceted models (Table 2), the topmost Sr has a BVSclose to the expected value, but the O from the top O2 layer bonded tothe surface Sr are under-coordinated, while the O on the top SrTiObulk layer (directly below the surface Sr) are over-coordinated. Thesurface Sr relaxes towards the bulk to achieve sufficient coordination,while the top bulk O from the O2 layer relaxes upward towards thesurface Sr and away from the bulk, leaving it under-coordinated.The degree of this under-coordination is greater for the (1×2) facetedmodel than for the (1×1) model. However, for the (1×2) model theyrepresent only half the number of atoms. Other atoms maintain BVSsclose to the expected values. Therefore the less frequent an apex ofthe facet occurs, the more stable the structure will be. This, however,is not sufficient to explain why the (1×2) model was calculated to bemore stable, [57] as the SII remains greater for the (1×2) model(SII=0.29) than the (1×1) model (SII=0.26). One possible explana-tion for this is that the simple BVS calculation does not fully reveal theinstability of the Sr atom at the apex.
There are two chemical reasons why this would be unstable. First,the apical Sr atom has become unusually close to the Ti atom in thelayer below it (3.00 Å Ti–Sr distance in the (1×1) model and 3.05 Åin the (1×2) model, compared to 3.38 Å in bulk SrTiO3). There is noeasy way to quantify this using BVSs, as cation–cation or anion–anion interactions are neglected.
Second, more than half of the Sr atom's coordination sphere isempty. A stable atomic coordination will have electrons filling spacein all directions. This phenomena is well known, and has been consid-ered at least since the introduction of valence shell electron pair re-pulsion theory [60]. For metal cations, this means bonds to O anionsequally in all directions. As lone electron pairs can also fulfill this re-quirement for O anions, the lack of bonds in all directions shouldhave less of an effect for O anions. For completeness, we note thatthis can also be considered in terms of screening; the nuclear chargeof an oxygen anion with an incomplete coordination sphere can besomewhat screened by the non-bonding valence electrons, whereasa Ti/Sr cation has far fewer valence electrons available to do this.Since BVS ignores these geometric concerns, metal terminated struc-tures will be less stable than indicated by a simple BVS analysis, andthis is seen in the differences between the SII and the DFT calculatedenergies. Such an instability might be modeled by a vectorial bond-valence model, such as that proposed by Harvey and coworkers[61]. However, as this vectorial approach is not as easily quantifiedby the tools currently available to us, it will be considered only in aqualitative manner in this work.
4.2. SrTiO3 (111)
The only proposed surface structures for SrTiO3 (111) for whichatomic coordinates are available in the literature are the 10 smallstructures calculated by Marks et. al. [33,62] Six of these structures(models 3–8) are fully oxidized, three (models 1, 9 and 10) are
2B Sr Sr_faceted
0.26 0.29
Mult BVS Atom Mult BVS Atom Mult BVS
1 −1.64 Sr1 1 2.00 Sr1 2 1.88O1 2 −1.49Sr2 2 1.93Ti1 1 4.18O2 1 −2.61
1 2.52 O1 2 −1.73 O3 2 −2.261 3.30 O4 2 −1.771 −1.76
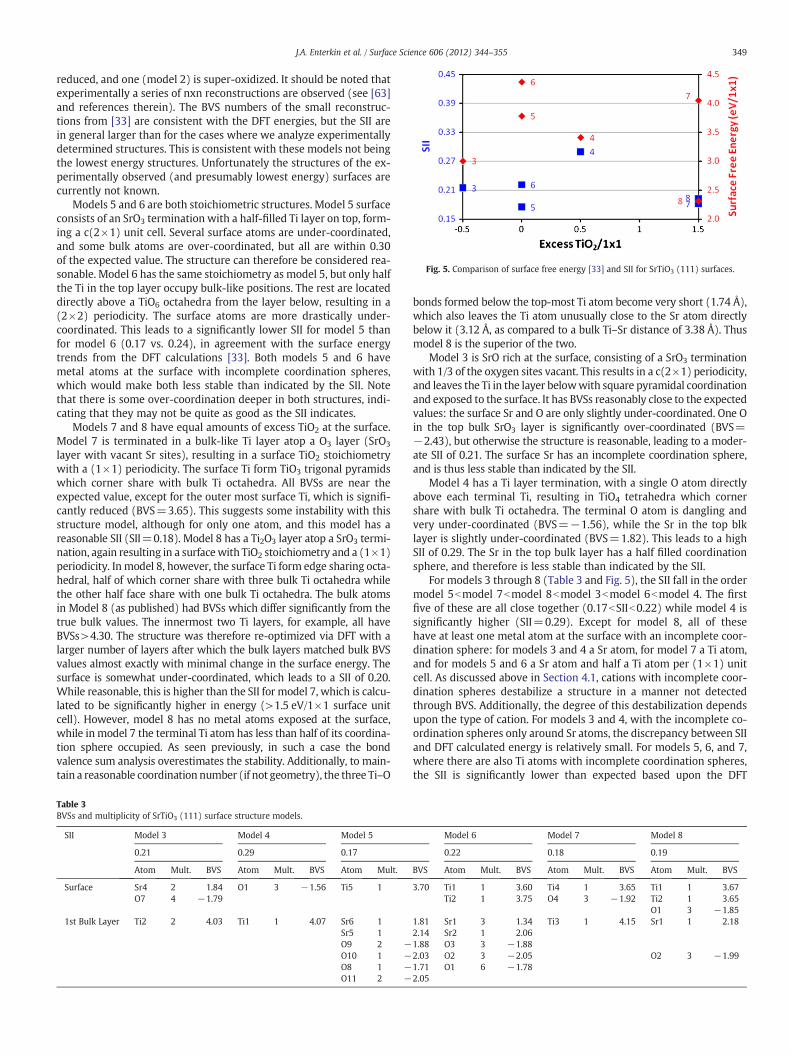
Fig. 5. Comparison of surface free energy [33] and SII for SrTiO3 (111) surfaces.
349J.A. Enterkin et al. / Surface Science 606 (2012) 344–355
reduced, and one (model 2) is super-oxidized. It should be noted thatexperimentally a series of nxn reconstructions are observed (see [63]and references therein). The BVS numbers of the small reconstruc-tions from [33] are consistent with the DFT energies, but the SII arein general larger than for the cases where we analyze experimentallydetermined structures. This is consistent with these models not beingthe lowest energy structures. Unfortunately the structures of the ex-perimentally observed (and presumably lowest energy) surfaces arecurrently not known.
Models 5 and 6 are both stoichiometric structures. Model 5 surfaceconsists of an SrO3 termination with a half-filled Ti layer on top, form-ing a c(2×1) unit cell. Several surface atoms are under-coordinated,and some bulk atoms are over-coordinated, but all are within 0.30of the expected value. The structure can therefore be considered rea-sonable. Model 6 has the same stoichiometry as model 5, but only halfthe Ti in the top layer occupy bulk-like positions. The rest are locateddirectly above a TiO6 octahedra from the layer below, resulting in a(2×2) periodicity. The surface atoms are more drastically under-coordinated. This leads to a significantly lower SII for model 5 thanfor model 6 (0.17 vs. 0.24), in agreement with the surface energytrends from the DFT calculations [33]. Both models 5 and 6 havemetal atoms at the surface with incomplete coordination spheres,which would make both less stable than indicated by the SII. Notethat there is some over-coordination deeper in both structures, indi-cating that they may not be quite as good as the SII indicates.
Models 7 and 8 have equal amounts of excess TiO2 at the surface.Model 7 is terminated in a bulk-like Ti layer atop a O3 layer (SrO3
layer with vacant Sr sites), resulting in a surface TiO2 stoichiometrywith a (1×1) periodicity. The surface Ti form TiO3 trigonal pyramidswhich corner share with bulk Ti octahedra. All BVSs are near theexpected value, except for the outer most surface Ti, which is signifi-cantly reduced (BVS=3.65). This suggests some instability with thisstructure model, although for only one atom, and this model has areasonable SII (SII=0.18). Model 8 has a Ti2O3 layer atop a SrO3 termi-nation, again resulting in a surfacewith TiO2 stoichiometry and a (1×1)periodicity. In model 8, however, the surface Ti form edge sharing octa-hedral, half of which corner share with three bulk Ti octahedra whilethe other half face share with one bulk Ti octahedra. The bulk atomsin Model 8 (as published) had BVSs which differ significantly from thetrue bulk values. The innermost two Ti layers, for example, all haveBVSs>4.30. The structure was therefore re-optimized via DFT with alarger number of layers after which the bulk layers matched bulk BVSvalues almost exactly with minimal change in the surface energy. Thesurface is somewhat under-coordinated, which leads to a SII of 0.20.While reasonable, this is higher than the SII for model 7, which is calcu-lated to be significantly higher in energy (>1.5 eV/1×1 surface unitcell). However, model 8 has no metal atoms exposed at the surface,while in model 7 the terminal Ti atom has less than half of its coordina-tion sphere occupied. As seen previously, in such a case the bondvalence sum analysis overestimates the stability. Additionally, to main-tain a reasonable coordination number (if not geometry), the three Ti–O
Table 3BVSs and multiplicity of SrTiO3 (111) surface structure models.
SII Model 3 Model 4 Model 5
0.21 0.29 0.17
Atom Mult. BVS Atom Mult. BVS Atom Mult.
Surface Sr4 2 1.84 O1 3 −1.56 Ti5 1O7 4 −1.79
1st Bulk Layer Ti2 2 4.03 Ti1 1 4.07 Sr6 1Sr5 1O9 2 −O10 1 −O8 1 −O11 2 −
bonds formed below the top-most Ti atom become very short (1.74 Å),which also leaves the Ti atom unusually close to the Sr atom directlybelow it (3.12 Å, as compared to a bulk Ti–Sr distance of 3.38 Å). Thusmodel 8 is the superior of the two.
Model 3 is SrO rich at the surface, consisting of a SrO3 terminationwith 1/3 of the oxygen sites vacant. This results in a c(2×1) periodicity,and leaves the Ti in the layer belowwith square pyramidal coordinationand exposed to the surface. It has BVSs reasonably close to the expectedvalues: the surface Sr and O are only slightly under-coordinated. One Oin the top bulk SrO3 layer is significantly over-coordinated (BVS=−2.43), but otherwise the structure is reasonable, leading to a moder-ate SII of 0.21. The surface Sr has an incomplete coordination sphere,and is thus less stable than indicated by the SII.
Model 4 has a Ti layer termination, with a single O atom directlyabove each terminal Ti, resulting in TiO4 tetrahedra which cornershare with bulk Ti octahedra. The terminal O atom is dangling andvery under-coordinated (BVS=−1.56), while the Sr in the top blklayer is slightly under-coordinated (BVS=1.82). This leads to a highSII of 0.29. The Sr in the top bulk layer has a half filled coordinationsphere, and therefore is less stable than indicated by the SII.
For models 3 through 8 (Table 3 and Fig. 5), the SII fall in the ordermodel 5bmodel 7bmodel 8bmodel 3bmodel 6bmodel 4. The firstfive of these are all close together (0.17bSIIb0.22) while model 4 issignificantly higher (SII=0.29). Except for model 8, all of thesehave at least one metal atom at the surface with an incomplete coor-dination sphere: for models 3 and 4 a Sr atom, for model 7 a Ti atom,and for models 5 and 6 a Sr atom and half a Ti atom per (1×1) unitcell. As discussed above in Section 4.1, cations with incomplete coor-dination spheres destabilize a structure in a manner not detectedthrough BVS. Additionally, the degree of this destabilization dependsupon the type of cation. For models 3 and 4, with the incomplete co-ordination spheres only around Sr atoms, the discrepancy between SIIand DFT calculated energy is relatively small. For models 5, 6, and 7,where there are also Ti atoms with incomplete coordination spheres,the SII is significantly lower than expected based upon the DFT
Model 6 Model 7 Model 8
0.22 0.18 0.19
BVS Atom Mult. BVS Atom Mult. BVS Atom Mult. BVS
3.70 Ti1 1 3.60 Ti4 1 3.65 Ti1 1 3.67Ti2 1 3.75 O4 3 −1.92 Ti2 1 3.65
O1 3 −1.851.81 Sr1 3 1.34 Ti3 1 4.15 Sr1 1 2.182.14 Sr2 1 2.061.88 O3 3 −1.882.03 O2 3 −2.05 O2 3 −1.991.71 O1 6 −1.782.05
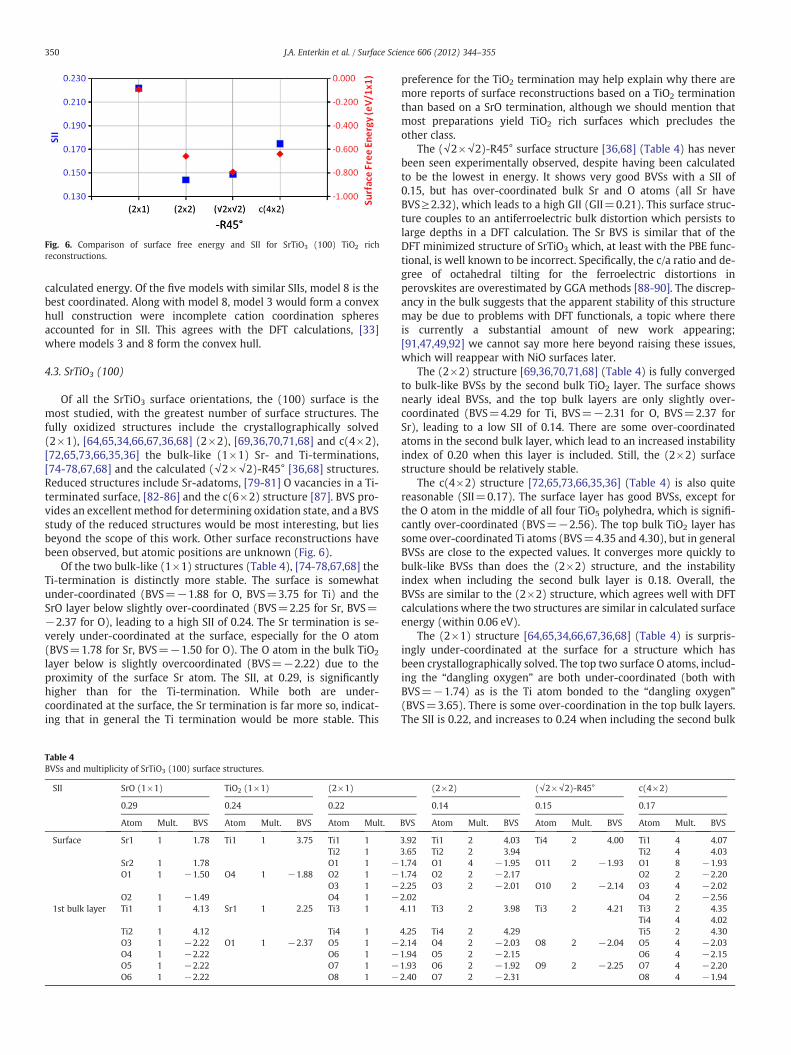
Fig. 6. Comparison of surface free energy and SII for SrTiO3 (100) TiO2 richreconstructions.
350 J.A. Enterkin et al. / Surface Science 606 (2012) 344–355
calculated energy. Of the five models with similar SIIs, model 8 is thebest coordinated. Along with model 8, model 3 would form a convexhull construction were incomplete cation coordination spheresaccounted for in SII. This agrees with the DFT calculations, [33]where models 3 and 8 form the convex hull.
4.3. SrTiO3 (100)
Of all the SrTiO3 surface orientations, the (100) surface is themost studied, with the greatest number of surface structures. Thefully oxidized structures include the crystallographically solved(2×1), [64,65,34,66,67,36,68] (2×2), [69,36,70,71,68] and c(4×2),[72,65,73,66,35,36] the bulk-like (1×1) Sr- and Ti-terminations,[74-78,67,68] and the calculated (√2×√2)-R45° [36,68] structures.Reduced structures include Sr-adatoms, [79-81] O vacancies in a Ti-terminated surface, [82-86] and the c(6×2) structure [87]. BVS pro-vides an excellent method for determining oxidation state, and a BVSstudy of the reduced structures would be most interesting, but liesbeyond the scope of this work. Other surface reconstructions havebeen observed, but atomic positions are unknown (Fig. 6).
Of the two bulk-like (1×1) structures (Table 4), [74-78,67,68] theTi-termination is distinctly more stable. The surface is somewhatunder-coordinated (BVS=−1.88 for O, BVS=3.75 for Ti) and theSrO layer below slightly over-coordinated (BVS=2.25 for Sr, BVS=−2.37 for O), leading to a high SII of 0.24. The Sr termination is se-verely under-coordinated at the surface, especially for the O atom(BVS=1.78 for Sr, BVS=−1.50 for O). The O atom in the bulk TiO2
layer below is slightly overcoordinated (BVS=−2.22) due to theproximity of the surface Sr atom. The SII, at 0.29, is significantlyhigher than for the Ti-termination. While both are under-coordinated at the surface, the Sr termination is far more so, indicat-ing that in general the Ti termination would be more stable. This
Table 4BVSs and multiplicity of SrTiO3 (100) surface structures.
SII SrO (1×1) TiO2 (1×1) (2×1)
0.29 0.24 0.22
Atom Mult. BVS Atom Mult. BVS Atom Mult.
Surface Sr1 1 1.78 Ti1 1 3.75 Ti1 1Ti2 1
Sr2 1 1.78 O1 1 −O1 1 −1.50 O4 1 −1.88 O2 1 −
O3 1 −O2 1 −1.49 O4 1 −
1st bulk layer Ti1 1 4.13 Sr1 1 2.25 Ti3 1
Ti2 1 4.12 Ti4 1O3 1 −2.22 O1 1 −2.37 O5 1 −O4 1 −2.22 O6 1 −O5 1 −2.22 O7 1 −O6 1 −2.22 O8 1 −
preference for the TiO2 termination may help explain why there aremore reports of surface reconstructions based on a TiO2 terminationthan based on a SrO termination, although we should mention thatmost preparations yield TiO2 rich surfaces which precludes theother class.
The (√2×√2)-R45° surface structure [36,68] (Table 4) has neverbeen seen experimentally observed, despite having been calculatedto be the lowest in energy. It shows very good BVSs with a SII of0.15, but has over-coordinated bulk Sr and O atoms (all Sr haveBVS≥2.32), which leads to a high GII (GII=0.21). This surface struc-ture couples to an antiferroelectric bulk distortion which persists tolarge depths in a DFT calculation. The Sr BVS is similar that of theDFT minimized structure of SrTiO3 which, at least with the PBE func-tional, is well known to be incorrect. Specifically, the c/a ratio and de-gree of octahedral tilting for the ferroelectric distortions inperovskites are overestimated by GGA methods [88-90]. The discrep-ancy in the bulk suggests that the apparent stability of this structuremay be due to problems with DFT functionals, a topic where thereis currently a substantial amount of new work appearing;[91,47,49,92] we cannot say more here beyond raising these issues,which will reappear with NiO surfaces later.
The (2×2) structure [69,36,70,71,68] (Table 4) is fully convergedto bulk-like BVSs by the second bulk TiO2 layer. The surface showsnearly ideal BVSs, and the top bulk layers are only slightly over-coordinated (BVS=4.29 for Ti, BVS=−2.31 for O, BVS=2.37 forSr), leading to a low SII of 0.14. There are some over-coordinatedatoms in the second bulk layer, which lead to an increased instabilityindex of 0.20 when this layer is included. Still, the (2×2) surfacestructure should be relatively stable.
The c(4×2) structure [72,65,73,66,35,36] (Table 4) is also quitereasonable (SII=0.17). The surface layer has good BVSs, except forthe O atom in the middle of all four TiO5 polyhedra, which is signifi-cantly over-coordinated (BVS=−2.56). The top bulk TiO2 layer hassome over-coordinated Ti atoms (BVS=4.35 and 4.30), but in generalBVSs are close to the expected values. It converges more quickly tobulk-like BVSs than does the (2×2) structure, and the instabilityindex when including the second bulk layer is 0.18. Overall, theBVSs are similar to the (2×2) structure, which agrees well with DFTcalculations where the two structures are similar in calculated surfaceenergy (within 0.06 eV).
The (2×1) structure [64,65,34,66,67,36,68] (Table 4) is surpris-ingly under-coordinated at the surface for a structure which hasbeen crystallographically solved. The top two surface O atoms, includ-ing the “dangling oxygen” are both under-coordinated (both withBVS=−1.74) as is the Ti atom bonded to the “dangling oxygen”(BVS=3.65). There is some over-coordination in the top bulk layers.The SII is 0.22, and increases to 0.24 when including the second bulk
(2×2) (√2×√2)-R45° c(4×2)
0.14 0.15 0.17
BVS Atom Mult. BVS Atom Mult. BVS Atom Mult. BVS
3.92 Ti1 2 4.03 Ti4 2 4.00 Ti1 4 4.073.65 Ti2 2 3.94 Ti2 4 4.031.74 O1 4 −1.95 O11 2 −1.93 O1 8 −1.931.74 O2 2 −2.17 O2 2 −2.202.25 O3 2 −2.01 O10 2 −2.14 O3 4 −2.022.02 O4 2 −2.564.11 Ti3 2 3.98 Ti3 2 4.21 Ti3 2 4.35
Ti4 4 4.024.25 Ti4 2 4.29 Ti5 2 4.302.14 O4 2 −2.03 O8 2 −2.04 O5 4 −2.031.94 O5 2 −2.15 O6 4 −2.151.93 O6 2 −1.92 O9 2 −2.25 O7 4 −2.202.40 O7 2 −2.31 O8 4 −1.94
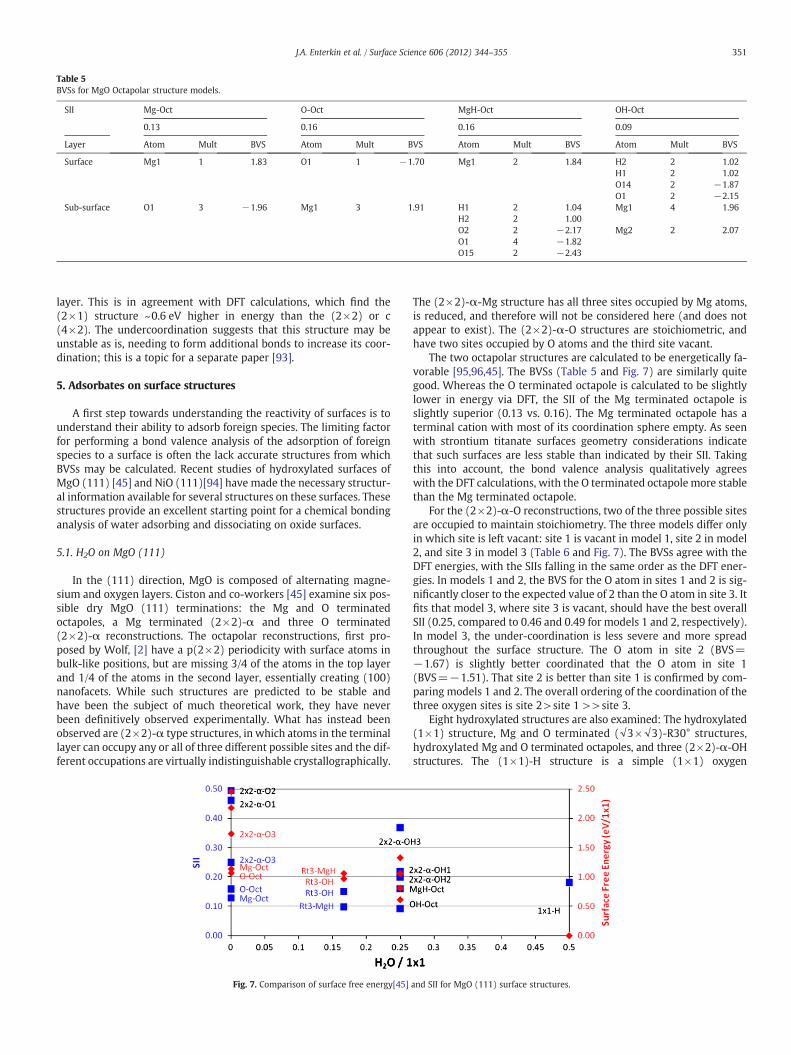
Table 5BVSs for MgO Octapolar structure models.
SII Mg-Oct O-Oct MgH-Oct OH-Oct
0.13 0.16 0.16 0.09
Layer Atom Mult BVS Atom Mult BVS Atom Mult BVS Atom Mult BVS
Surface Mg1 1 1.83 O1 1 −1.70 Mg1 2 1.84 H2 2 1.02H1 2 1.02O14 2 −1.87O1 2 −2.15
Sub-surface O1 3 −1.96 Mg1 3 1.91 H1 2 1.04 Mg1 4 1.96H2 2 1.00O2 2 −2.17 Mg2 2 2.07O1 4 −1.82O15 2 −2.43
351J.A. Enterkin et al. / Surface Science 606 (2012) 344–355
layer. This is in agreement with DFT calculations, which find the(2×1) structure ~0.6 eV higher in energy than the (2×2) or c(4×2). The undercoordination suggests that this structure may beunstable as is, needing to form additional bonds to increase its coor-dination; this is a topic for a separate paper [93].
5. Adsorbates on surface structures
A first step towards understanding the reactivity of surfaces is tounderstand their ability to adsorb foreign species. The limiting factorfor performing a bond valence analysis of the adsorption of foreignspecies to a surface is often the lack accurate structures from whichBVSs may be calculated. Recent studies of hydroxylated surfaces ofMgO (111) [45] and NiO (111)[94] have made the necessary structur-al information available for several structures on these surfaces. Thesestructures provide an excellent starting point for a chemical bondinganalysis of water adsorbing and dissociating on oxide surfaces.
5.1. H2O on MgO (111)
In the (111) direction, MgO is composed of alternating magne-sium and oxygen layers. Ciston and co-workers [45] examine six pos-sible dry MgO (111) terminations: the Mg and O terminatedoctapoles, a Mg terminated (2×2)-α and three O terminated(2×2)-α reconstructions. The octapolar reconstructions, first pro-posed by Wolf, [2] have a p(2×2) periodicity with surface atoms inbulk-like positions, but are missing 3/4 of the atoms in the top layerand 1/4 of the atoms in the second layer, essentially creating (100)nanofacets. While such structures are predicted to be stable andhave been the subject of much theoretical work, they have neverbeen definitively observed experimentally. What has instead beenobserved are (2×2)-α type structures, in which atoms in the terminallayer can occupy any or all of three different possible sites and the dif-ferent occupations are virtually indistinguishable crystallographically.
Fig. 7. Comparison of surface free energy[45]
The (2×2)-α-Mg structure has all three sites occupied by Mg atoms,is reduced, and therefore will not be considered here (and does notappear to exist). The (2×2)-α-O structures are stoichiometric, andhave two sites occupied by O atoms and the third site vacant.
The two octapolar structures are calculated to be energetically fa-vorable [95,96,45]. The BVSs (Table 5 and Fig. 7) are similarly quitegood. Whereas the O terminated octapole is calculated to be slightlylower in energy via DFT, the SII of the Mg terminated octapole isslightly superior (0.13 vs. 0.16). The Mg terminated octapole has aterminal cation with most of its coordination sphere empty. As seenwith strontium titanate surfaces geometry considerations indicatethat such surfaces are less stable than indicated by their SII. Takingthis into account, the bond valence analysis qualitatively agreeswith the DFT calculations, with the O terminated octapole more stablethan the Mg terminated octapole.
For the (2×2)-α-O reconstructions, two of the three possible sitesare occupied to maintain stoichiometry. The three models differ onlyin which site is left vacant: site 1 is vacant in model 1, site 2 in model2, and site 3 in model 3 (Table 6 and Fig. 7). The BVSs agree with theDFT energies, with the SIIs falling in the same order as the DFT ener-gies. In models 1 and 2, the BVS for the O atom in sites 1 and 2 is sig-nificantly closer to the expected value of 2 than the O atom in site 3. Itfits that model 3, where site 3 is vacant, should have the best overallSII (0.25, compared to 0.46 and 0.49 for models 1 and 2, respectively).In model 3, the under-coordination is less severe and more spreadthroughout the surface structure. The O atom in site 2 (BVS=−1.67) is slightly better coordinated that the O atom in site 1(BVS=−1.51). That site 2 is better than site 1 is confirmed by com-paring models 1 and 2. The overall ordering of the coordination of thethree oxygen sites is site 2>site 1 >>site 3.
Eight hydroxylated structures are also examined: The hydroxylated(1×1) structure, Mg and O terminated (√3×√3)-R30° structures,hydroxylated Mg and O terminated octapoles, and three (2×2)-α-OHstructures. The (1×1)-H structure is a simple (1×1) oxygen
and SII for MgO (111) surface structures.
Table 6Comparison of BVSs for MgO (2×2)-α surface sites.
SII 2×2-α-O1 2×2-α-O2 2×2-α-O3 2×2-α-OH1 2×2-α-OH2 2×2-α-OH3
0.46 0.49 0.25 0.22 0.20 0.37
Atom BVS Atom BVS Atom BVS Atom BVS Atom BVS Atom BVS
Surface Site 1 O1 −1.83 O1 −1.51 O8 −1.59 H1 0.99 H2 1.00O8 −2.12 O8 −2.23
Site 2 O1 −2.02 O2 −1.67 H1 1.00 O1 −1.77 H1 1.00O1 −2.28 O1 −2.42
Site 3 O2 −0.92 O2 −0.89 H2 1.03 H2 1.03 O2 −0.90O2 −1.93 O2 −1.94
Table 7BVSs for MgO 1×1-H, and √3×√3-R30° structural models.
SII 1×1-H √3×√3-R30°-OH √3×√3-R30°-MgH
0.18 0.15 0.10
Atom Mult BVS Atom Mult BVS Atom Mult BVS
Surface H1 1 1.03 H1 1 1 Mg1 1 1.82O1 1 −2.35
O4 1 −2.30 O2 1 −1.73Sub-Surface Mg4 1 2.22 Mg1 3 1.99 H1 1 1.03
O1 1 −2.13O3 1 −1.87O2 1 −1.92
352 J.A. Enterkin et al. / Surface Science 606 (2012) 344–355
termination, with a hydrogen bound to each O atom. The (√3×√3)-R30°-MgH structure has a single Mg per (√3×√3) unit cell atop an ox-ygen termination, with one of the O atoms in the sub-surface layer hy-droxylated. The (√3×√3)-OH structure has one O atom and one OHgroup per (√3×√3) unit cell atop a magnesium termination. TheMgH octapole is like the dry Mg octapole, with an OH group in the va-cant O position in the second layer, and one other O atom in that layeralso hydroxylated. In the OH octapole, the terminal O is hydroxylated,and additional OH group bridges two Mg atoms from the secondlayer. The (2×2)-α-OH structures are similar to the (2×2)-α-O struc-tures, but all three sites in theα phase are occupied: two by OH groupsand one by an O.
The three (2×2)-α-OH structures are similar to the (2×2)-α-Ostructures (Table 6 and Fig. 7). All three oxygen sites are occupied,and two of three are hydroxylated. The O site stability revealed inthe BVS analysis of the (2×2)-α-O structures predicts a stability forthe hydroxylated structures of model 2>model 1>>model 3. Thisis exactly what is observed. Model 3, with under-coordinated site 3not hydroxylated (BVS=−0.90), has the highest DFT calculated en-ergy and the highest SII. In the models where site 3 is hydroxylated,the O atom there is stabilized (BVS=−1.93 or −1.94 for models 1and 2, respectively). Model 2 is slightly better than model 1 interms of both SII and DFT energy largely because the non-hydroxylated site in model 2 (BVS=−1.77) is less under-coordinated than the non-hydroxylated site in model 1 (BVS=−1.59).
The bond valence analysis of the dry and hydroxylated (2×2)-αstructures agree that if water were to adsorb and dissociate on thesurface, the hydroxyl groups would bond most strongly to site 3,and slightly prefer site 1 over site 2. Removal of an H2O group, con-versely, would most likely remove the O from site 3. The bond valenceanalysis indicates both where water molecules will adsorb and disso-ciate, and where they are likely to re-associate and desorb. One couldeven predict from the bond valence sums that heating a MgO (111)(2×2)-α-OH structure to drive off water would cause it to recon-struct to another structure with site 3 unoccupied.
The (√3×√3)-R30° structures are low both in energy, lying onlyslightly above the convex hull, and in SII (SII=0.15 and SII=0.10for the O and Mg terminations, respectively). In DFT calculations,the O termination is lower in energy, while the Mg termination hasBVSs closer to the expected values (Table 7 and Fig. 7). However,the terminal Mg ion has less than half of its coordination sphere occu-pied, and is unstable according to geometric considerations. The oxy-gen termination has the terminal O atom only in sites equivalent tosite 2 (the most favorable site) of the (2×2) structures, and half arehydroxylated. Ciston and coworkers found (√3×√3)-R30°-OH struc-ture was formed when the (2×2)-α-OH structure was annealed, andconcluded that this transition occurred through dehydration and ox-ygen rearrangement [45]. This is consistent with removal of waterfrom site 3 and the preference for occupancy of site 2 predicted inthe (2×2)-α BVS analysis.
The (1×1)-H structure is calculated to be relatively stable,[45]consistent with the bond valence analysis (Table 7 and Fig. 7). The
MgH and OH terminated octapoles are calculated to be low in energy,with the O termination the lower of the two. This agrees well with thebond valence analysis, where they SII is low for both structures butlower for the O termination (SII=0.09 vs. 0.16, Table 5). Geometricconsiderations suggest that the MgH octapole is even less stable.
5.2. H2O on NiO (111)
Ciston and coworkers also examine several structures on the NiO(111) surface, and find that it behaves similarly to the MgO (111) sur-face [94]. Five dry structures are considered (Ni and O terminatedoctapoles and three (2×2)-α-O structures), all of which are analo-gous to an MgO structure described above. Additionally, six of sevenhydroxylated structures considered (Ni and O terminated √3×√3-R30° structures, three (2×2)-α-OH structures, and a (1×1)-H struc-ture) are analogous to MgO structures considered above, with thefinal structure considered being the (2×2)-vac structure consideredfirst in Erdman et al.[97] This final structure we will set aside fornow, as we briefly compare the NiO (111) surface bonding to thatof MgO (111).
Before describing the results, one important point needs to bemade: NiO is a difficult material for DFT. While relatively high-levelmethods were used (on-site hybrid exact exchange) they still onlyhave limited accuracy so it should not be a surprise that the BVS insuch cases (with DFT calculated positions) is further from theexpected value than it is for MgO, despite the strong chemical similar-ities of the two.
Similar to the MgO (111) surface, among the dry structures, theoctapoles have the lowest DFT calculated surface energy and alsohave the best BVSs (Table 8 and Fig. 8). Also like the MgO surface,the O terminated octapole is lower in energy, while the Ni terminatedoctapole has a lower SII, but is unstable by geometric considerations.Despite the octapoles having better coordination than any other drysurface, they are still significantly under-coordinated, which resultsin SIIs higher than observed for any stable SrTiO3 or MgO surface.
The (2×2)-α-O models (Table 9 and Fig. 8) are similar to those forthe MgO (111) surface, in that in each model two of the three surfaceoxygen sites are occupied, with one vacant. As with the MgO surface,the O sites can be ordered in terms of providing sufficient oxygen
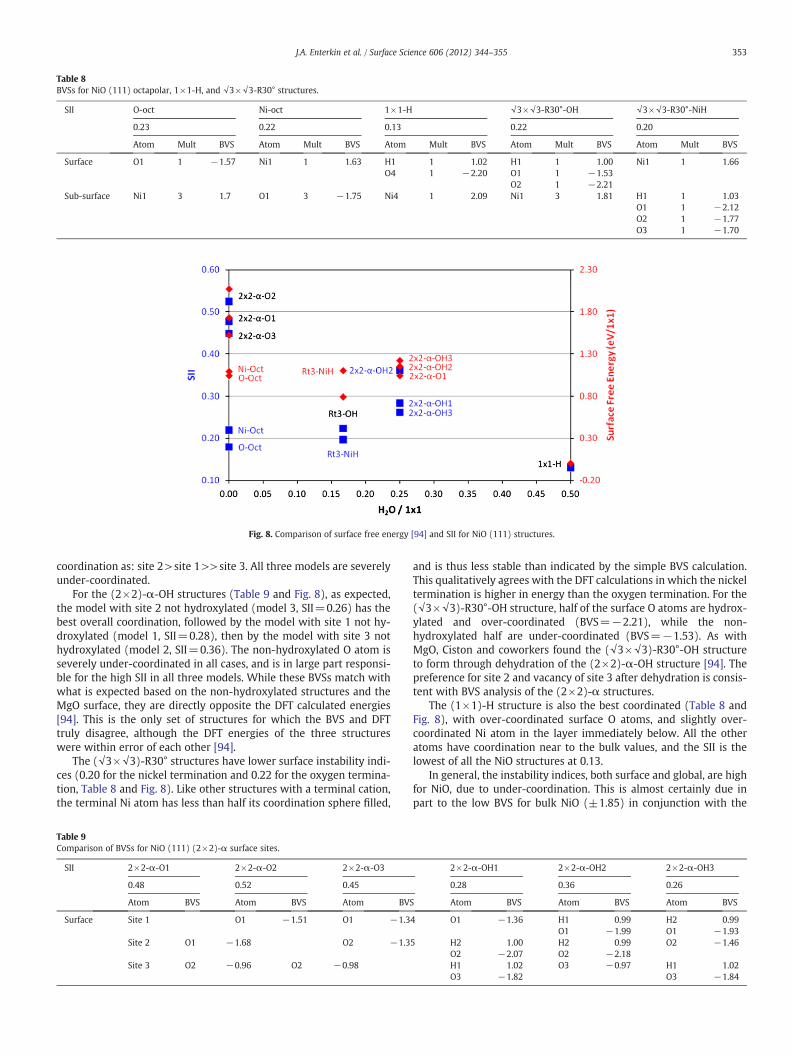
Table 8BVSs for NiO (111) octapolar, 1×1-H, and √3×√3-R30° structures.
SII O-oct Ni-oct 1×1-H √3×√3-R30°-OH √3×√3-R30°-NiH
0.23 0.22 0.13 0.22 0.20
Atom Mult BVS Atom Mult BVS Atom Mult BVS Atom Mult BVS Atom Mult BVS
Surface O1 1 −1.57 Ni1 1 1.63 H1 1 1.02 H1 1 1.00 Ni1 1 1.66O4 1 −2.20 O1 1 −1.53
O2 1 −2.21Sub-surface Ni1 3 1.7 O1 3 −1.75 Ni4 1 2.09 Ni1 3 1.81 H1 1 1.03
O1 1 −2.12O2 1 −1.77O3 1 −1.70
Fig. 8. Comparison of surface free energy [94] and SII for NiO (111) structures.
353J.A. Enterkin et al. / Surface Science 606 (2012) 344–355
coordination as: site 2>site 1>>site 3. All three models are severelyunder-coordinated.
For the (2×2)-α-OH structures (Table 9 and Fig. 8), as expected,the model with site 2 not hydroxylated (model 3, SII=0.26) has thebest overall coordination, followed by the model with site 1 not hy-droxylated (model 1, SII=0.28), then by the model with site 3 nothydroxylated (model 2, SII=0.36). The non-hydroxylated O atom isseverely under-coordinated in all cases, and is in large part responsi-ble for the high SII in all three models. While these BVSs match withwhat is expected based on the non-hydroxylated structures and theMgO surface, they are directly opposite the DFT calculated energies[94]. This is the only set of structures for which the BVS and DFTtruly disagree, although the DFT energies of the three structureswere within error of each other [94].
The (√3×√3)-R30° structures have lower surface instability indi-ces (0.20 for the nickel termination and 0.22 for the oxygen termina-tion, Table 8 and Fig. 8). Like other structures with a terminal cation,the terminal Ni atom has less than half its coordination sphere filled,
Table 9Comparison of BVSs for NiO (111) (2×2)-α surface sites.
SII 2×2-α-O1 2×2-α-O2 2×2-α-O3
0.48 0.52 0.45
Atom BVS Atom BVS Atom BVS
Surface Site 1 O1 −1.51 O1 −1.3
Site 2 O1 −1.68 O2 −1.3
Site 3 O2 −0.96 O2 −0.98
and is thus less stable than indicated by the simple BVS calculation.This qualitatively agrees with the DFT calculations in which the nickeltermination is higher in energy than the oxygen termination. For the(√3×√3)-R30°-OH structure, half of the surface O atoms are hydrox-ylated and over-coordinated (BVS=−2.21), while the non-hydroxylated half are under-coordinated (BVS=−1.53). As withMgO, Ciston and coworkers found the (√3×√3)-R30°-OH structureto form through dehydration of the (2×2)-α-OH structure [94]. Thepreference for site 2 and vacancy of site 3 after dehydration is consis-tent with BVS analysis of the (2×2)-α structures.
The (1×1)-H structure is also the best coordinated (Table 8 andFig. 8), with over-coordinated surface O atoms, and slightly over-coordinated Ni atom in the layer immediately below. All the otheratoms have coordination near to the bulk values, and the SII is thelowest of all the NiO structures at 0.13.
In general, the instability indices, both surface and global, are highfor NiO, due to under-coordination. This is almost certainly due inpart to the low BVS for bulk NiO (±1.85) in conjunction with the
2×2-α-OH1 2×2-α-OH2 2×2-α-OH3
0.28 0.36 0.26
Atom BVS Atom BVS Atom BVS
4 O1 −1.36 H1 0.99 H2 0.99O1 −1.99 O1 −1.93
5 H2 1.00 H2 0.99 O2 −1.46O2 −2.07 O2 −2.18H1 1.02 O3 −0.97 H1 1.02O3 −1.82 O3 −1.84
354 J.A. Enterkin et al. / Surface Science 606 (2012) 344–355
artifact of the DFT positions as mentioned above. However, the generaltrends of the BVS do correlate well with the trends of the DFT energies,what is found for MgO and the experimental data. The (2×2)-α-OHresults disagreewith DFT, but agreewith the (2×2)-α-O andMgO (111)results. This implies that BVS analysis may work better than DFT forassessing surface stability, at least for materials which are difficult todeal with via DFT.
6. Conclusions
Chemical bonding goes far in explaining surface structure stability,with a simple BVS calculation capable of illuminating much of this. Itis not a perfect method, but neither is DFt nor any other method. Asseen for the MgO-(2×2)-α surfaces, a simple BVS analysis has thepower to predict where water is likely to adsorb and dissociate on asurface. Structural models that are most likely to exist as-is are thosewith the best overall BVSs, i.e. the best SII. Structures with BVSs thatare too high (over-coordinated) can certainly form, especially if only asmall portion of the structure is over-coordinated, as is demonstratedby the SrTiO3 (100) c(4×2) surface structure. Structures which aresomewhat under-coordinated may likewise form, although such struc-tures are likely to adsorb foreign species. A structure without anyunder-coordinated species on the surface might be more robust andless likely to adsorb any foreign species. Conversely, something on anover-coordinated surface structure might dissociate in order to lowerthe coordination. Cases where the SII are all rather high are probablynot those of lowest energy, as the numbers indicate for the SrTiO3 (111)surface. Note that from the DFT energies alone one could not reachsuch a conclusion.
Chemical bonding models of surfaces generally agree with physicsbased calculations and with experiment, just as they do for bulkstructures. In most cases where the SII and DFT calculated energy dis-agree, other chemical bonding theories which account for geometryhelp explain this discrepancy. Additionally, the bond valence modelhas been shown to easily describe concepts, such as polar surfaces,which have been most difficult to deal with from a purely physicsbased approach. In some cases BVS may help for systems which aredifficult for DFT. In the most difficult cases, it may prove necessaryto use chemical and physics based methods in conjunction to achievethe most complete understanding of a surface. For instance, the factthat in DFT the (√2×√2)-R45° (001) SrTiO3 surface has the lowestenergy, but it does not have the lowest SII implies that there mightbe a problem with this surface where DFT (without exact-exchangeon the oxygen atoms) is underestimating the oxygen-oxygen non-bonded repulsions.
It is clear that, moving forward, a chemical bonding approachshould be considered as a part of any surface study. The complemen-tary nature of the chemistry and physics based models can lead to agreatly enhanced understanding of surface structure, chemistry, andreactivity. As with bulk materials, the best way to move forward isto consider the chemistry and physics simultaneously, with each pro-viding insight that is difficult to reach from the alternate approach.
Acknowledgements
This work was supported primarily by the Institute for Catalysis inEnergy Processing, a collaborative research effort between the North-western University Center for Catalysis and Surface Science andArgonne National Laboratory, funded through the US Department ofEnergy, Office of Basic Energy Science (award number DE-FG02-03-ER15457). AEB acknowledges support by the Department of Entergyon Grant Number DE-FG02-01ER45945. We also acknowledge fundingfor a computational cluster for the DFT calculations from the NationalScience Foundation on Grant Number DMR 0906306 and theDepartment of Entergy on Grant Number DE-FG02-01ER45945. JAEacknowledges support from Argonne National Laboratory. The
submittedmanuscript has been created by ArgonneNational Laboratory,a U.S. Department of Energy Office of Science Laboratory, operated byUChicagoArgonne, LLC. TheU.S. Government retains for itself, and othersacting on its behalf, a paid-up nonexclusive, irrevocable worldwidelicense in said article to reproduce, prepare derivative works, distributecopies to the public, and perform publicly and display publicly, by oron behalf of the Government.
Appendix A. Supplementary data
Supplementary data to this article can be found online at doi:10.1016/j.susc.2011.10.018.
References
[1] M.D. Pashley, Phys. Rev. B: Condens. Matter 40 (1989).[2] D. Wolf, Phys. Rev. Lett. 68 (1992).[3] C. Noguera, J. Phys. Condens. Matter 12 (2000).[4] D.S. Deak, Mater. Sci. Technol. 23 (2007).[5] J. Goniakowski, F. Finocchi, C. Noguera, Rep. Prog. Phys. 71 (2008) 016501.[6] J.A. Enterkin, A.K. Subramanian, B.C. Russell, M.R. Castell, K.R. Poeppelmeier, L.D.
Marks, Nat. Mater. 9 (2010).[7] I.D. Brown, D. Altermatt, Acta Crystallogr., Sect. B: Struct. Sci. 41 (1985).[8] I.D. Brown, The chemical bond in inorganic chemistry : the bond valence model,
Oxford; New York, Oxford University Press, 2002.[9] I.D. Brown, Chem. Rev. 109 (2009).
[10] L. Pauling, J. Am. Chem. Soc. 51 (1929) 1010.[11] R.F.W. Bader, Chemical Reviews, 91, 1991.[12] I.D. Brown, Acta Crystallogr., Sect. B: Struct. Sci. 48 (1992).[13] M. Isobe, M. Onoda, T. Ohta, F. Izumi, K. Kimoto, E. Takayama-Muromachi, A.W.
Hewat, K. Ohoyama, Phys. Rev. B: Condens. Matter 62 (2000).[14] R. Tamazyan, S. van Smaalen, I.G. Vasilyeva, H. Arnold, Acta Crystallogr., Sect. B:
Struct. Sci. 59 (2003).[15] S. van Smaalen, R. Dinnebier, M. Sofin, M. Jansen, Acta Crystallogr., Sect. B: Struct.
Sci. 63 (2007).[16] D.F. Xue, S. Zuo, H. Ratajczak, Physica B 352 (2004).[17] R.Q. Albuquerque, G.B. Rocha, O.L. Malta, P. Porcher, Chem. Phys. Lett. 331 (2000).[18] D.F. Xue, S.Y. Zhang, Physica B 262 (1999).[19] D. Xue, K. Betzler, H. Hesse, Appl. Phys. A Mater. Sci. Process. 74 (2002).[20] V.M. Holovey, V.I. Sidey, V.I. Lyamayev, M.M. Birov, J. Phys. Chem. Solids 68
(2007).[21] V.M. Holovey, V.I. Sidey, V.I. Lyamayev, P.P. Puga, J. Lumin. 126 (2007).[22] Y. Tabira, R.L. Withers, Phys. Chem. Miner. 27 (1999).[23] S. Adams, J. Swenson, Ionics 10 (2004).[24] M. Newville, Phys. Scr. T115 (2005).[25] T. Hiemstra, W.H. Vanriemsdijk, G.H. Bolt, J. Colloid Interface Sci. 133 (1989).[26] T. Hiemstra, P. Venema, W.H. VanRiemsdijk, J. Colloid Interface Sci. 184 (1996).[27] B.R. Bickmore, K.M. Rosso, K.L. Nagy, R.T. Cygan, C.J. Tadanier, Clays Clay Miner. 51
(2003).[28] B.R. Bickmore, C.J. Tadanier, K.M. Rosso, W.D. Monn, D.L. Eggett, Geochim. Cosmo-
chim. Acta 68 (2004).[29] M. Schindler, A. Mutter, F.C. Hawthorne, A. Putnis, Can. Mineral. 42 (2004).[30] B.R. Bickmore, K.M. Rosso, C.J. Tadanier, E.J. Bylaska, D. Doud, Geochim. Cosmochim.
Acta 70 (2006).[31] C. Ruberto, Y. Yourdshahyan, B.I. Lundqvist, Phys. Rev. Lett. 88 (2002) 226101.[32] C. Ruberto, Y. Yourdshahyan, B.I. Lundqvist, Phys. Rev. B: Condens. Matter 67
(2003) 195412.[33] L.D. Marks, A.N. Chiaramonti, F. Tran, P. Blaha, Surf. Sci. 603 (2009).[34] N. Erdman, K.R. Poeppelmeier, M. Asta, O. Warschkow, D.E. Ellis, L.D. Marks, Nature
419 (2002).[35] N. Erdman, O. Warschkow, M. Asta, K.R. Poeppelmeier, D.E. Ellis, L.D. Marks, J. Am.
Chem. Soc. 125 (2003) 10050.[36] O. Warschkow, M. Asta, N. Erdman, K.R. Poeppelmeier, D.E. Ellis, L.D. Marks, Surf.
Sci. 573 (2004) 446.[37] G.J. Palenik, Inorg. Chem. 36 (1997).[38] K. Knížek, Kalvados, 2010.[39] A.E.H. Love, A Treatise on the Mathematical Theory of Elasticity, Dover Publications,
1892.[40] L.D. Marks, P. Xu, D.N. Dunn, Surf. Sci. 294 (1993).[41] S.J. Thompson, S.P. Lewis, Phys. Rev. B: Condens. Matter 73 (2006).[42] P. Blaha, K. Schwarz, G.K.H. Madsen, D. Kvasnicka, J. Luitz, WIEN2k, An Augmented
PlaneWave Plus Local Orbitals Program for Calculating Crystal Properties, TechnicalUniversity of Vienna, Vienna, 2001.
[43] J.P. Perdew, K. Burke, M. Ernzerhof, Phys. Rev. Lett. 77 (1996) 3865.[44] I. Etxebarria, J.M. Perez-Mato, A. Garcia, P. Blaha, K. Schwarz, J. Rodriguez-Carvajal,
Phys. Rev. B: Condens. Matter 72 (2005) 174108.[45] J. Ciston, A. Subramanian, L.D. Marks, Phys. Rev. B: Condens. Matter 79 (2009)
085421.[46] P. Muller, A. Saul, Surf. Sci. Rep. 54 (2004).[47] J.P. Perdew, A. Ruzsinszky, G.I. Csonka, O.A. Vydrov, G.E. Scuseria, L.A. Constantin,
X.L. Zhou, K. Burke, Phys. Rev. Lett. 100 (2008) 136406.[48] A. Stroppa, G. Kresse, New J. Phys. 10 (2008).
355J.A. Enterkin et al. / Surface Science 606 (2012) 344–355
[49] J.P. Perdew, A. Ruzsinszky, G.I. Csonka, L.A. Constantin, J.W. Sun, Phys. Rev. Lett.103 (2009).
[50] E. Heifets, E.A. Kotomin, G. Borstel, Surf. Rev. Lett. 6 (1999).[51] E. Heifets, E.A. Kotomin, Thin Solid Films 358 (2000).[52] E. Heifets, E.A. Kotomin, J. Maier, Surf. Sci. 462 (2000).[53] F. Bottin, F. Finocchi, C. Noguera, Phys. Rev. B: Condens. Matter 68 (2003).[54] F. Bottin, F. Finocchi, C. Noguera, Surf. Sci. 532 (2003) 468.[55] E. Heifets, W.A. Goddard, E.A. Kotomin, R.I. Eglitis, G. Borstel, Phys. Rev. B: Condens.
Matter 69 (2004).[56] E.A. Kotomin, E. Heifets, S. Dorfman, D. Fuks, A. Gordon, J. Maier, Surf. Sci. 566
(2004).[57] F. Bottin, F. Finocchi, C. Noguera, Surf. Sci. 574 (2005).[58] R.I. Eglitis, D. Vanderbilt, Phys. Rev. B: Condens. Matter 77 (2008) 195408.[59] M. Lazzeri, A. Selloni, Phys. Rev. Lett. 87 (2001).[60] R.J. Gillespie, R.S. Nyholm, Q. Rev. Chem. Soc. 11 (1957) 339.[61] M.A. Harvey, S. Baggio, R. Baggio, Acta Crystallogr., Sect. B: Struct. Sci. 62 (2006).[62] L.D. Marks, A.N. Chiaramonti, F. Tran, P. Blaha, CIF depository for "The small unit
cell reconstructions of SrTiO3 (111), 2009.[63] A.N. Chiaramonti, C.H. Lanier, L.D. Marks, P.C. Stair, Surf. Sci. 602 (2008).[64] M. Naito, H. Sato, Physica C 229 (1994).[65] M.R. Castell, Surf. Sci. 505 (2002).[66] N. Erdman, L.D. Marks, Surf. Sci. 526 (2003).[67] K. Johnston, M.R. Castell, A.T. Paxton, M.W. Finnis, Phys. Rev. B: Condens. Matter
70 (2004) 085415.[68] N. Iles, F. Finocchi, K.D. Khodja, J. Phys. Condens. Matter 22 (2010).[69] Q.D. Jiang, J. Zegenhagen, Surf. Sci. 338 (1995).[70] R. Herger, P.R. Willmott, O. Bunk, C.M. Schleputz, B.D. Patterson, B. Delley, Phys.
Rev. Lett. 98 (2007) 076102.[71] R. Herger, P.R. Willmott, O. Bunk, C.M. Schleputz, B.D. Patterson, B. Delley, V.L.
Shneerson, P.F. Lyman, D.K. Saldin, Phys. Rev. B: Condens. Matter 76 (2007)195435.
[72] Q.D. Jiang, J. Zegenhagen, Surf. Sci. 425 (1999).[73] M.R. Castell, Surf. Sci. 516 (2002).[74] E. Heifets, S. Dorfman, D. Fuks, E. Kotomin, A. Gordon, J. Phys. Condens. Matter 10
(1998).
[75] Z.Q. Li, J.L. Zhu, C.Q. Wu, Z. Tang, Y. Kawazoe, Phys. Rev. B: Condens. Matter 58(1998).
[76] G. Charlton, S. Brennan, C.A.Muryn, R. McGrath, D. Norman, T.S. Turner, G. Thornton,Surf. Sci. 457 (2000).
[77] C. Cheng, K. Kunc, M.H. Lee, Phys. Rev. B: Condens. Matter 62 (2000).[78] E. Heifets, R.I. Eglitis, E.A. Kotomin, J. Maier, G. Borstel, Phys. Rev. B: Condens. Matter
64 (2001) 235417.[79] T. Kubo, H. Nozoye, Phys. Rev. Lett. 86 (2001).[80] T. Kubo, H. Nozoye, Surf. Sci. 542 (2003).[81] L.M. Liborio, C.G. Sanchez, A.T. Paxton, M.W. Finnis, J. Phys. Condens. Matter 17
(2005).[82] H. Tanaka, T. Matsumoto, T. Kawai, S. Kawai, Jpn. J. Appl. Phys., Part 1 32 (1993).[83] T. Matsumoto, H. Tanaka, K. Kouguchi, T. Kawai, S. Kawai, Surf. Sci. 312 (1994).[84] S. Kimura, M. Tsukada, Appl. Surf. Sci. 121 (1997).[85] D.K. Seo, K. Perdue, J. Ren, M.H. Whangbo, Surf. Sci. 370 (1997).[86] A. Stashans, F. Erazo, J. Ortiz, P. Valverde, Philos. Mag. B 81 (2001).[87] C.H. Lanier, A. van de Walle, N. Erdman, E. Landree, O. Warschkow, A. Kazimirov,
K.R. Poeppelmeier, J. Zegenhagen, M. Asta, L.D. Marks, Phys. Rev. B: Condens. Matter76 (2007) 045421.
[88] S. Tinte, M.G. Stachiotti, C.O. Rodriguez, D.L. Novikov, N.E. Christensen, Phys. Rev.B: Condens. Matter 58 (1998).
[89] Z.G. Wu, R.E. Cohen, D.J. Singh, Phys. Rev. B: Condens. Matter 70 (2004).[90] E. Heifets, E. Kotomin, V.A. Trepakov, J. Phys. Condens. Matter 18 (2006).[91] R. Armiento, A.E. Mattsson, Phys. Rev. B: Condens. Matter 72 (2005) 085108.[92] L. Schimka, J. Harl, G. Kresse, J. Chem. Phys. 134 (2011) 024116.[93] A.E. Becerra-Toledo, J.A. Enterkin, D. Kienzle, L.D. Marks, Water adsorption on
SrTiO3(001): II. water, water, everywhere, Surf. Sci. (submitted for publication).Manuscript Number: SUSC-D-11-00528R1.
[94] J. Ciston, A. Subramanian, D. Kienzle, L.D. Marks, Surf. Sci. 604 (2010) 155.[95] F. Finocchi, A. Barbier, J. Jupille, C. Noguera, Phys. Rev. Lett. 92 (2004).[96] W.B. Zhang, B.Y. Tang, J. Phys. Chem. C 112 (2008).[97] N. Erdman, O. Warschkow, D.E. Ellis, L.D. Marks, Surf. Sci. 470 (2000).
![Chemical Bonding 1. What is a chemical bond? 2. How do ... · Draw electron dot diagrams for the ionic compounds magnesium oxide, calcium fluoride, aluminum oxide [ ] Chapters 8 &](https://img.pdfslide.us/doc/110x75/5eda17f5b3745412b570c057/chemical-bonding-1-what-is-a-chemical-bond-2-how-do-draw-electron-dot-diagrams.jpg)


![Chemical Information Profile for Ceric Oxide [CAS No. … · Chemical Information Profile for Ceric Oxide [CAS No. 1306-38-3] Supporting Nomination for Toxicological Evaluation by](https://img.pdfslide.us/doc/110x75/5ad1074e7f8b9a86158b9a83/chemical-information-profile-for-ceric-oxide-cas-no-information-profile-for.jpg)


![Preparation of sulfonated reduced graphene oxide …41-44]-06.pdf · Preparation of sulfonated reduced graphene oxide by radiation-induced chemical reduction of sulfonated graphene](https://img.pdfslide.us/doc/110x75/5b63b5747f8b9a2e308c6dd0/preparation-of-sulfonated-reduced-graphene-oxide-41-44-06pdf-preparation-of.jpg)