Embed Size (px)
Citation preview
Journal of Nanoparticle Research 3: 385–400, 2001.© 2001 Kluwer Academic Publishers. Printed in the Netherlands.
Copper and copper oxide nanoparticle formation by chemical vapornucleation from copper (II) acetylacetonate
Albert G. Nasibulin1, P. Petri Ahonen1, Olivier Richard1, Esko I. Kauppinen1,∗ and Igor S. Altman2
1VTT Chemical Technology, Aerosol Technology Group, P.O. Box 1401, FIN-02044 VTT, Finland;2Institute of Combustion & Advanced Technologies, Odessa National University, Dvoryanskaya 2,Odessa, 65026, Ukraine; ∗Author for correspondence (Tel.: +358 9 456 6165; Fax: +358 9 456 7021;E-mail: [email protected])
Received 22 January 2001; accepted in revised form 20 June 2001
Key words: Cu, Cu2O, nanoparticle, copper acetylacetonate, thermal vapor decomposition, chemical nucleation
Abstract
Crystalline nanometer-size copper and copper (I) oxide particle formation was studied by thermal decomposition ofcopper acetylacetonate Cu(acac)2 vapor using a vertical flow reactor at ambient nitrogen pressure. The experimentswere performed in the precursor vapor pressure range of Pprec = 0.06 to 44 Pa at furnace temperatures of 431.5◦C,596.0◦C, and 705.0◦C. Agglomerates of primary particles were formed at Pprec > 0.1 Pa at all temperatures. At431.5◦C the number mean size of the primary particles increased from Dp = 3.7 nm (with geometric standarddeviation σg = 1.42) to Dp = 7.2 nm (σg = 1.33) with the increasing precursor vapor particle pressure from 1.8 to16 Pa. At 705.0◦C the primary particle size decreased from Dp = 24.0 nm (σg = 1.57) to Dp = 7.6 nm (σg = 1.54),respectively.
At furnace temperatures of 431.5◦C and 596.0◦C only crystalline copper particles were produced. At 705.0◦C thecrystalline product of the decomposition depended on the precursor vapor pressure: copper particles were formedat Pprec > 10 Pa, copper (I) oxide at Pprec ≤ 1 Pa, and a mixture of the metal and its oxide at intermediate vaporpressures. A kinetic restriction on copper particle growth was shown, which leads to the main role of Cu2 moleculeparticipation in the particle formation. The formation of copper (I) oxide particles occurs due to the surface reactionof the decomposition products (mainly carbon dioxide). For the explanation of the experimental results, a model isproposed to build a semiempirical phase diagram of the precursor decomposition products.
Introduction
Copper and copper oxide particles are of significanttechnological interest. Applications for copper pow-der include bronze self-lubricating bearings, conduc-tive epoxys, metal-bonded abrasive wheels and cuttingtools, and braking systems. Ultra-fine copper particlesare a base for developing technologies such as metalinjection molding as well as for electronics, ceram-ics and for thick/thin-film applications. Copper oxideshave applications in thin-film oxygen pressure sensors,as a binder in pastes for thick-film microelectronic
circuits, as a p-type semiconductor and they exhibitluminescence (Majumdar et al., 1996; Holzschuh &Suhr, 1990).
The importance of producing copper and copperoxide particles is exemplified by applications such ashigh surface area catalysts that are used in diversechemical processes, for example, the water-gas shiftreaction (Campbell et al., 1987), the butanol dehydro-genation reaction (Shiau & Tsai, 1997) and the car-bon monoxide oxidation (Van der Meijden, 1981; Duet al., 1997). Copper-based catalysts are used as a keyintermediate in the industrial synthesis of methanol
386
(Klier, 1982; Campbell et al., 1987; Yurieva et al.,1993; Klenov et al., 1998), which is promising asan environmentally friendly fuel for the power indus-try. In addition, copper and copper-based materialshave applications as catalysts in traditional and neworganic syntheses, for example, the condensation ofaromatic halides, known as Ullmann reaction (Dhaset al., 1998), synthesis of cyclic amines from amino-alcohols and their alkyl derivatives (Hammerschmidtet al., 1986; Kijenski et al., 1989), synthesis of methy-lamines (Gredig et al., 1997), thermal cracking of plas-tics and many others (Kijenski et al., 1984; Runeberget al., 1985; Vultier et al., 1987; Pereia et al., 1994;Shannon et al., 1996). Copper has been also identi-fied as a good catalyst for the combustion of methane(Tijburg, 1989) and selective oxidation of hydrocar-bons (Adams & Jennings, 1964; Voge & Adams,1967).
Thus, studies of the formation of copper and cop-per oxide particles are important. Accordingly, it hasbeen a subject of much research during the last decades.Copper and copper oxide particle formation havebeen studied by solution reaction: reduction of cop-per (II) acetate in ethanol (Ayaappan et al., 1997)and in water and 2-ethoxyethanol using hydrazine(Huang et al., 1997), the reaction of copper (II)chloride with organolithium compounds (Takahashiet al., 1988), reduction of copper dodecylsulfate bysodium borohydrate (Lisieski et al., 1996), by usingreverse micelles (Lisieski & Pileni, 1993; 1995),thermal and sonochemical reductions of copper (II)hydrazine carboxylate (Dhas et al., 1998), chem-ical deposition in two-phase system octane–water(Vorobyova et al., 1997), by means of electrolysis(Folmanis & Uglov, 1991; Kirchheim et al., 1991;Pietrikova & Kapusanska, 1991) and others (Herleyet al., 1989). Ding et al. (1996) prepared coppernanoparticles by a mechanochemical process andstudied the influence of milling conditions on par-ticle structure and size. Nanocrystalline copper wasprepared by consolidation of mechanically milledpowder by Weins et al. (1997). Copper oxide for-mation was studied via oxidation of copper par-ticles (Kaito et al., 1973; 1993; Kellerson et al.,1995).
Much work has been devoted to the investigation ofaerosol formation of copper or its oxide particles byphysical methods, including molecular beams (Bowleset al., 1981), direct laser vaporization (Moini and Eyler,1988), by using gas evaporation (Kashu et al., 1974;
Peoples et al., 1988; Xu et al., 1992), sputtering(Haas & Birringer, 1992), melting in a cryogenicliquid (Champion & Bigot, 1996) and others (Long& Petford-Long, 1986; Girardin & Maurer, 1990;Bouland et al., 1992). Another and a very attractive wayto obtain aerosol particles is via the chemical route.This method might be the least expensive for aerosolparticle formation under controlled conditions. Littlework has been devoted to copper and its oxide for-mation by chemical vapor nucleation. Majumdar et al.(1996) generated CuO powder by spray-pyrolysis fromCu(NO3)2 solution. Daroczi et al. (1998) studied theproduction of copper and iron nanocomposites by ther-mal decomposition of copper–ferrocyanide in an openvertical tube. The obvious advantage of the chemicalvapor nucleation method is the possibility to producenanosized particles at relatively low temperatures andambient pressure.
The current work is devoted to the investigationof copper and copper oxide particle formation frommetal–organic compound, copper (II) acetylacetonate(Cu(acac)2). A suitable equilibrium vapor pressure(P = 13.1 Pa at t = 150.0◦C) and a convenientdecomposition temperature (tdec = 286◦C) were thereasons for the choice of this precursor. The selectionof this metal–organic substance was also based on itspopularity as a precursor for chemical vapor deposi-tion processes (e.g., Pelletier et al., 1991; Pauleau &Fasasi, 1991; Gerfin et al., 1993; Marzouk et al., 1994;Hammadi et al., 1995; Maruyama & Shirai, 1995) andon the knowledge of decomposition reaction kinetics(Tsyganova et al., 1992). The goals of the investigationare to produce copper and/or copper oxide nanoparti-cles at ambient pressure and at a temperature as lowas possible, to characterize the obtained nanoparticlessynthesized with various reactor conditions, and todiscuss nanoparticle formation based on experimentalresults.
Experimental
Materials
For this study copper (II) acetylacetonate, Cu(acac)2,(Aldrich Chemical Company, 97%) has been used asa precursor. The decomposition of Cu(acac)2 vaporleads to the formation of copper vapor that is supersat-urated at the experimental conditions. The Cu(acac)2
387
decomposition reaction can be presented as
CH3
HC Cu CH
CH3 CH3
CH3
O O
O O∆T
38.0
Cu + CuO + H2C CH2(CO)36.0 22.3
O
+ CO2 + H3C C CH3
3.2 0.3
O
+ H2O + H3C C C2H5, (1)
where numbers below the decomposition reactionproducts indicate molar percentage fraction of thegaseous reaction products which were measured usingmass-spectrometry analysis by Tsyganova et al. (1992).Such reaction products indicate significant destruc-tion of the ligand, acetylacetone, which is possiblyformed on the initial stage of the thermal decomposi-tion. The Cu(acac)2 vapor decomposition was studiedusing the manometric method in static conditions inclear ampoules at 290–335◦C and at initial pressures of98–173 hPa (Tsyganova et al., 1992).
In our study two sources of nitrogen (AGA,99.9 vol.% and 99.999 vol.%) have been used as acarrier gases. Inert nitrogen was used in order to pre-vent the additional reoxidation of the formed cop-per vapor by atmospheric oxygen. The compaction ofCu(acac)2 powder in a saturator and hence, blocking theflow were prevented by mixing the powder with inertchromatographic carrier, silicon dioxide, SiO2 (BalzersMaterials, 99.9%) with a grain size of 0.2–0.7 mm.
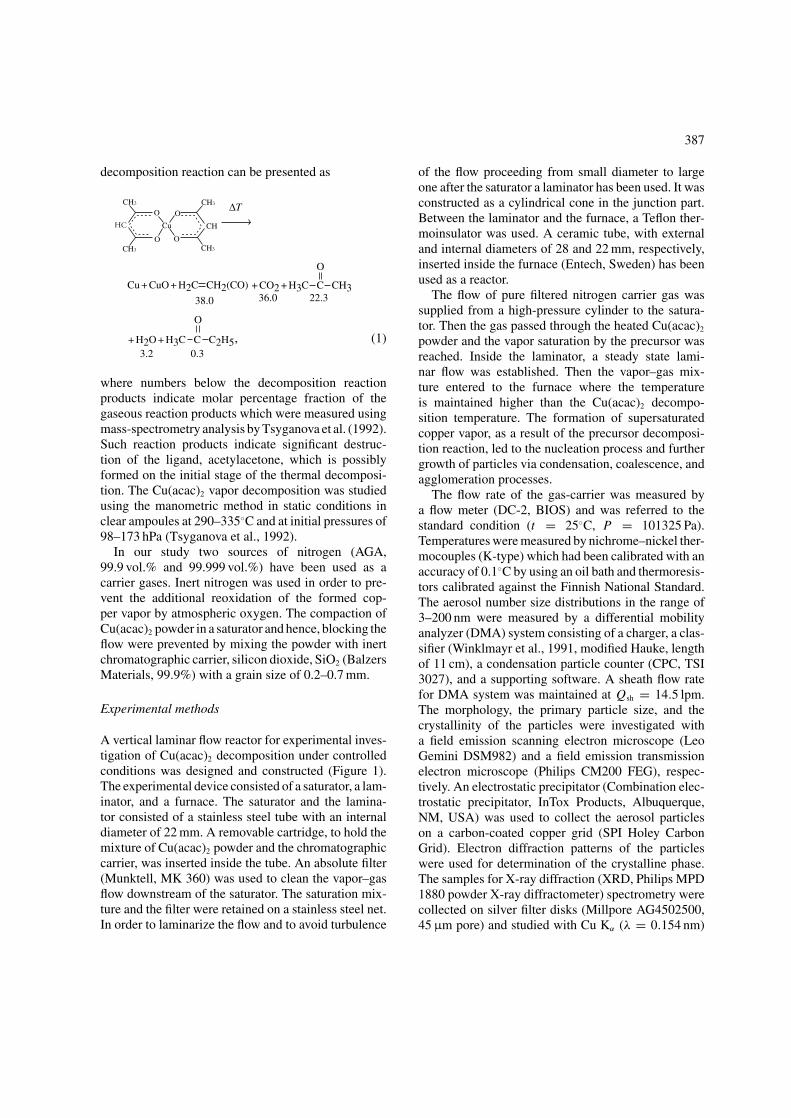
Experimental methods
A vertical laminar flow reactor for experimental inves-tigation of Cu(acac)2 decomposition under controlledconditions was designed and constructed (Figure 1).The experimental device consisted of a saturator, a lam-inator, and a furnace. The saturator and the lamina-tor consisted of a stainless steel tube with an internaldiameter of 22 mm. A removable cartridge, to hold themixture of Cu(acac)2 powder and the chromatographiccarrier, was inserted inside the tube. An absolute filter(Munktell, MK 360) was used to clean the vapor–gasflow downstream of the saturator. The saturation mix-ture and the filter were retained on a stainless steel net.In order to laminarize the flow and to avoid turbulence
of the flow proceeding from small diameter to largeone after the saturator a laminator has been used. It wasconstructed as a cylindrical cone in the junction part.Between the laminator and the furnace, a Teflon ther-moinsulator was used. A ceramic tube, with externaland internal diameters of 28 and 22 mm, respectively,inserted inside the furnace (Entech, Sweden) has beenused as a reactor.
The flow of pure filtered nitrogen carrier gas wassupplied from a high-pressure cylinder to the satura-tor. Then the gas passed through the heated Cu(acac)2
powder and the vapor saturation by the precursor wasreached. Inside the laminator, a steady state lami-nar flow was established. Then the vapor–gas mix-ture entered to the furnace where the temperatureis maintained higher than the Cu(acac)2 decompo-sition temperature. The formation of supersaturatedcopper vapor, as a result of the precursor decomposi-tion reaction, led to the nucleation process and furthergrowth of particles via condensation, coalescence, andagglomeration processes.
The flow rate of the gas-carrier was measured bya flow meter (DC-2, BIOS) and was referred to thestandard condition (t = 25◦C, P = 101325 Pa).Temperatures were measured by nichrome–nickel ther-mocouples (K-type) which had been calibrated with anaccuracy of 0.1◦C by using an oil bath and thermoresis-tors calibrated against the Finnish National Standard.The aerosol number size distributions in the range of3–200 nm were measured by a differential mobilityanalyzer (DMA) system consisting of a charger, a clas-sifier (Winklmayr et al., 1991, modified Hauke, lengthof 11 cm), a condensation particle counter (CPC, TSI3027), and a supporting software. A sheath flow ratefor DMA system was maintained at Qsh = 14.5 lpm.The morphology, the primary particle size, and thecrystallinity of the particles were investigated witha field emission scanning electron microscope (LeoGemini DSM982) and a field emission transmissionelectron microscope (Philips CM200 FEG), respec-tively. An electrostatic precipitator (Combination elec-trostatic precipitator, InTox Products, Albuquerque,NM, USA) was used to collect the aerosol particleson a carbon-coated copper grid (SPI Holey CarbonGrid). Electron diffraction patterns of the particleswere used for determination of the crystalline phase.The samples for X-ray diffraction (XRD, Philips MPD1880 powder X-ray diffractometer) spectrometry werecollected on silver filter disks (Millpore AG4502500,45 µm pore) and studied with Cu Kα (λ = 0.154 nm)
388
Figure 1. Schematic presentation of the experimental setup.
radiation. A Mettler Toledo TA8000 system equippedwith TGA850 thermobalance was used for thermo-gravimetric analysis (TGA) of the samples underflowing nitrogen atmosphere with the heating rate of10◦C/min for sample sizes of approximately 3 mg.
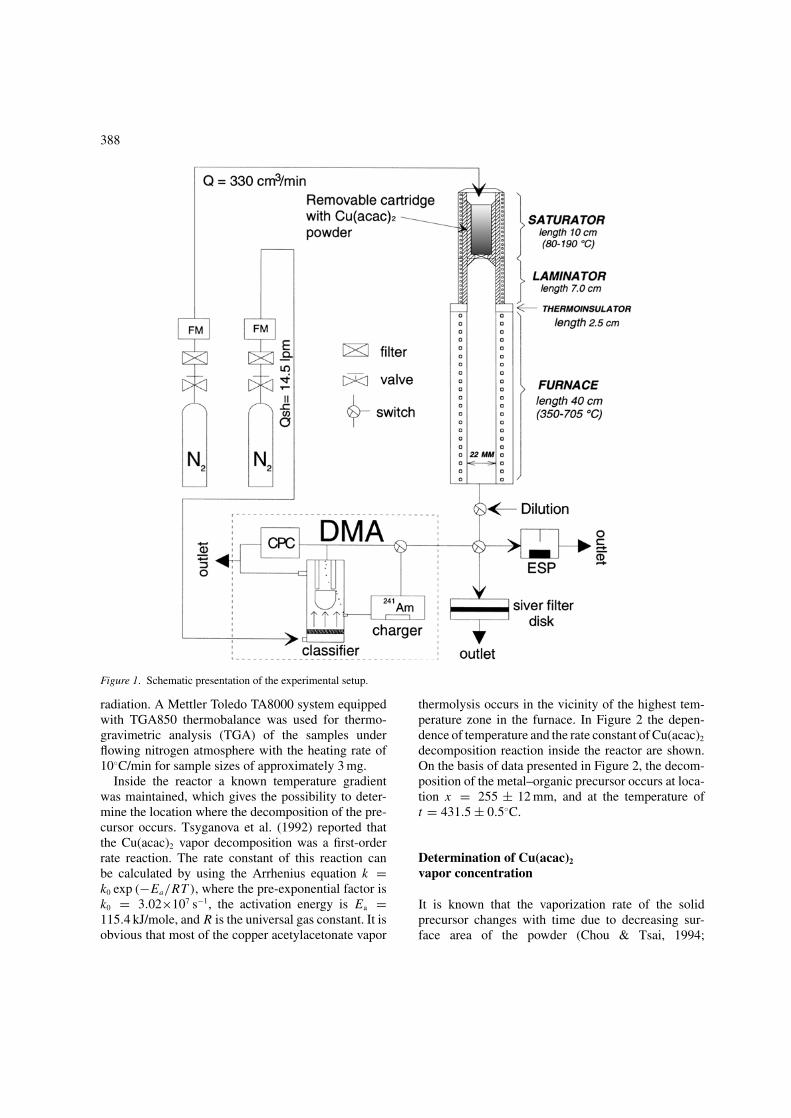
Inside the reactor a known temperature gradientwas maintained, which gives the possibility to deter-mine the location where the decomposition of the pre-cursor occurs. Tsyganova et al. (1992) reported thatthe Cu(acac)2 vapor decomposition was a first-orderrate reaction. The rate constant of this reaction canbe calculated by using the Arrhenius equation k =k0 exp (−Ea/RT ), where the pre-exponential factor isk0 = 3.02×10⁷ s−1, the activation energy is Ea =115.4 kJ/mole, and R is the universal gas constant. It isobvious that most of the copper acetylacetonate vapor
thermolysis occurs in the vicinity of the highest tem-perature zone in the furnace. In Figure 2 the depen-dence of temperature and the rate constant of Cu(acac)2
decomposition reaction inside the reactor are shown.On the basis of data presented in Figure 2, the decom-position of the metal–organic precursor occurs at loca-tion x = 255 ± 12 mm, and at the temperature oft = 431.5 ± 0.5◦C.
Determination of Cu(acac)2
vapor concentration
It is known that the vaporization rate of the solidprecursor changes with time due to decreasing sur-face area of the powder (Chou & Tsai, 1994;
389
Figure 2. The dependence of temperature and the rate constant of Cu(acac)2 decomposition reaction inside the reactor.
Figure 3. The dependence of the evaporation rate at different conditions.
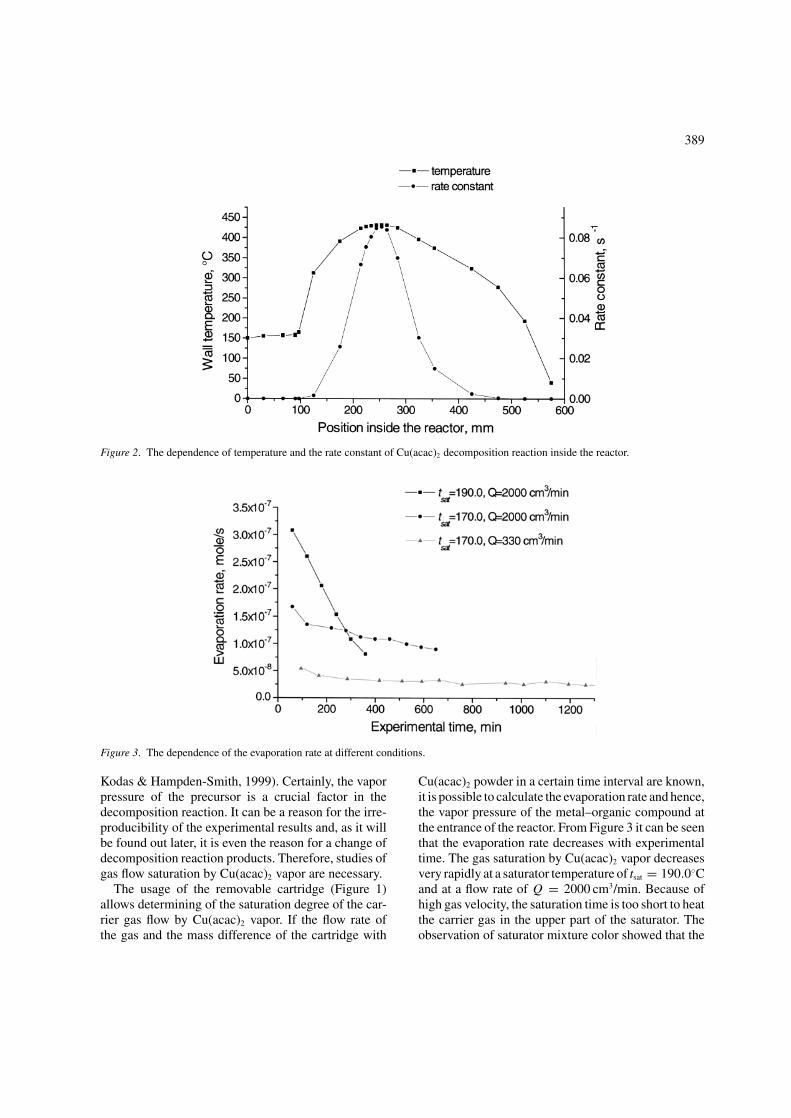
Kodas & Hampden-Smith, 1999). Certainly, the vaporpressure of the precursor is a crucial factor in thedecomposition reaction. It can be a reason for the irre-producibility of the experimental results and, as it willbe found out later, it is even the reason for a change ofdecomposition reaction products. Therefore, studies ofgas flow saturation by Cu(acac)2 vapor are necessary.
The usage of the removable cartridge (Figure 1)allows determining of the saturation degree of the car-rier gas flow by Cu(acac)2 vapor. If the flow rate ofthe gas and the mass difference of the cartridge with
Cu(acac)2 powder in a certain time interval are known,it is possible to calculate the evaporation rate and hence,the vapor pressure of the metal–organic compound atthe entrance of the reactor. From Figure 3 it can be seenthat the evaporation rate decreases with experimentaltime. The gas saturation by Cu(acac)2 vapor decreasesvery rapidly at a saturator temperature of tsat = 190.0◦Cand at a flow rate of Q = 2000 cm3/min. Because ofhigh gas velocity, the saturation time is too short to heatthe carrier gas in the upper part of the saturator. Theobservation of saturator mixture color showed that the
390
precursor was consumed in the lower part where gastemperature reached the saturator temperature. At theflow rate of Q = 330 cm3/min and at tsat = 170◦C,the evaporation decreases less rapidly and depends onthe decrease of the powder surface area. Decreasingthe saturator temperature down to 150◦C leads to thesignificant decrease of the evaporation rate dependenceon time. Four days of continuous operation using theflow rate of Q = 330 cm3/min revealed that a signif-icant change in the results (concentration and numbersize distribution of agglomerated particles) was foundonly after the first 24 h period.
The effect of the composition of the copper acety-lacetonate and silicon dioxide mixture on the evapora-tion rate was also investigated. Variation of the massratio of Cu(acac)2 and SiO2 from 1 : 3 to 1 : 150 didnot significantly affect on the precursor vapor pres-sure at the entrance to the reactor. The influence ofusing a small precursor fraction (1 : 150 relation) wasfound only after about 7 h because of the exhaustionof Cu(acac)2 material, while duration of an experi-ment was only about 30–40 min. During the follow-ing experiments only newly prepared powder mixturesconsisting of 4 g (1.53×10⁻² mole) of copper (II) acety-lacetonate and 16 g (0.27 mole) of silicon dioxide havebeen used as the saturator mixture.
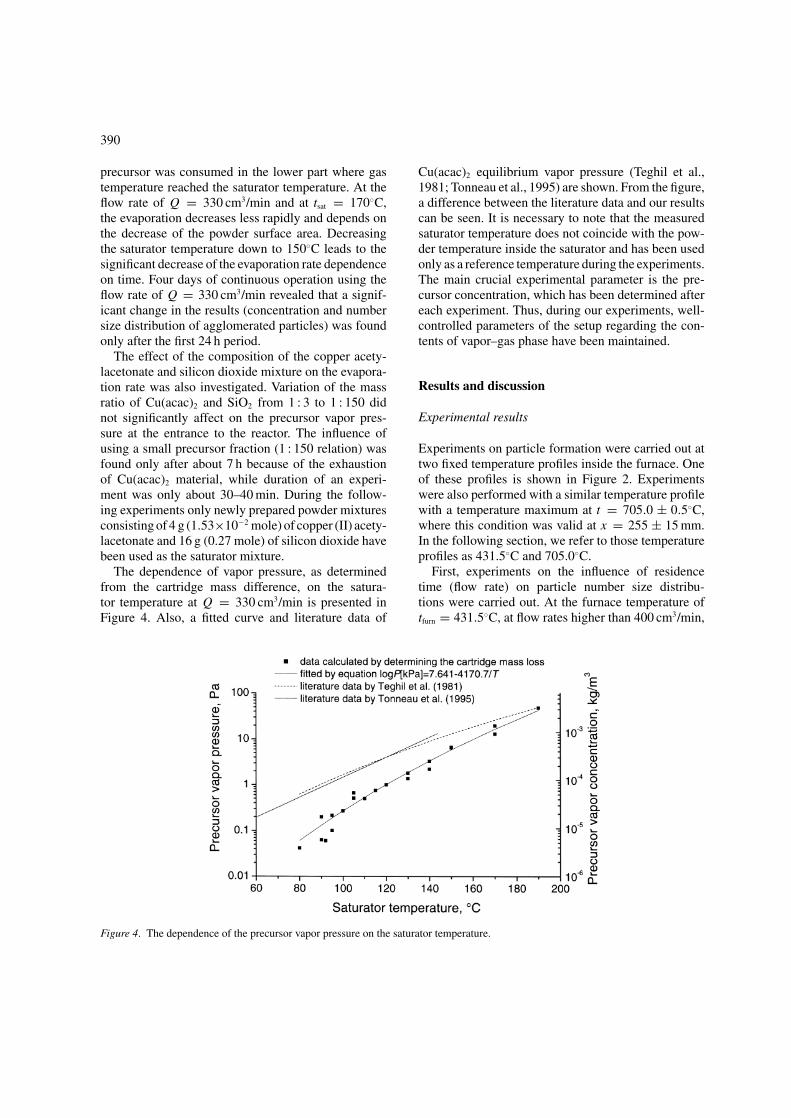
The dependence of vapor pressure, as determinedfrom the cartridge mass difference, on the satura-tor temperature at Q = 330 cm3/min is presented inFigure 4. Also, a fitted curve and literature data of
Figure 4. The dependence of the precursor vapor pressure on the saturator temperature.
Cu(acac)2 equilibrium vapor pressure (Teghil et al.,1981; Tonneau et al., 1995) are shown. From the figure,a difference between the literature data and our resultscan be seen. It is necessary to note that the measuredsaturator temperature does not coincide with the pow-der temperature inside the saturator and has been usedonly as a reference temperature during the experiments.The main crucial experimental parameter is the pre-cursor concentration, which has been determined aftereach experiment. Thus, during our experiments, well-controlled parameters of the setup regarding the con-tents of vapor–gas phase have been maintained.
Results and discussion
Experimental results
Experiments on particle formation were carried out attwo fixed temperature profiles inside the furnace. Oneof these profiles is shown in Figure 2. Experimentswere also performed with a similar temperature profilewith a temperature maximum at t = 705.0 ± 0.5◦C,where this condition was valid at x = 255 ± 15 mm.In the following section, we refer to those temperatureprofiles as 431.5◦C and 705.0◦C.
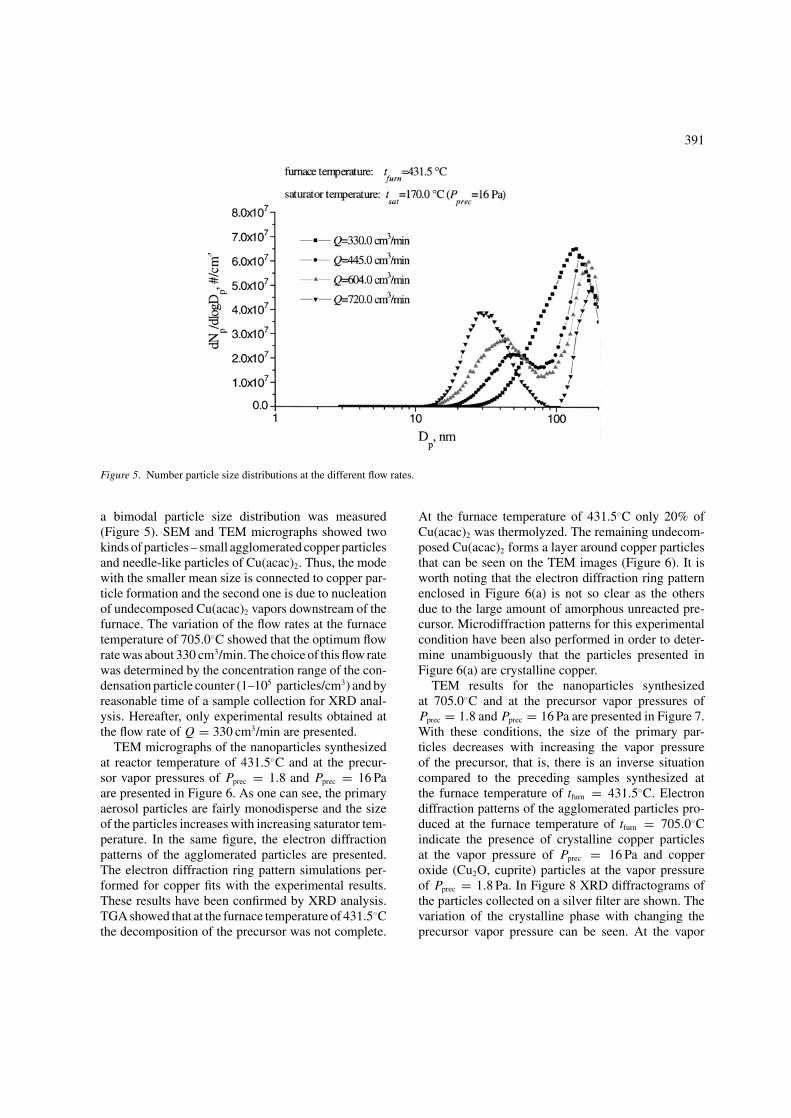
First, experiments on the influence of residencetime (flow rate) on particle number size distribu-tions were carried out. At the furnace temperature oftfurn = 431.5◦C, at flow rates higher than 400 cm3/min,
391
Figure 5. Number particle size distributions at the different flow rates.
a bimodal particle size distribution was measured(Figure 5). SEM and TEM micrographs showed twokinds of particles – small agglomerated copper particlesand needle-like particles of Cu(acac)2. Thus, the modewith the smaller mean size is connected to copper par-ticle formation and the second one is due to nucleationof undecomposed Cu(acac)2 vapors downstream of thefurnace. The variation of the flow rates at the furnacetemperature of 705.0◦C showed that the optimum flowrate was about 330 cm3/min. The choice of this flow ratewas determined by the concentration range of the con-densation particle counter (1–105 particles/cm3) and byreasonable time of a sample collection for XRD anal-ysis. Hereafter, only experimental results obtained atthe flow rate of Q = 330 cm3/min are presented.
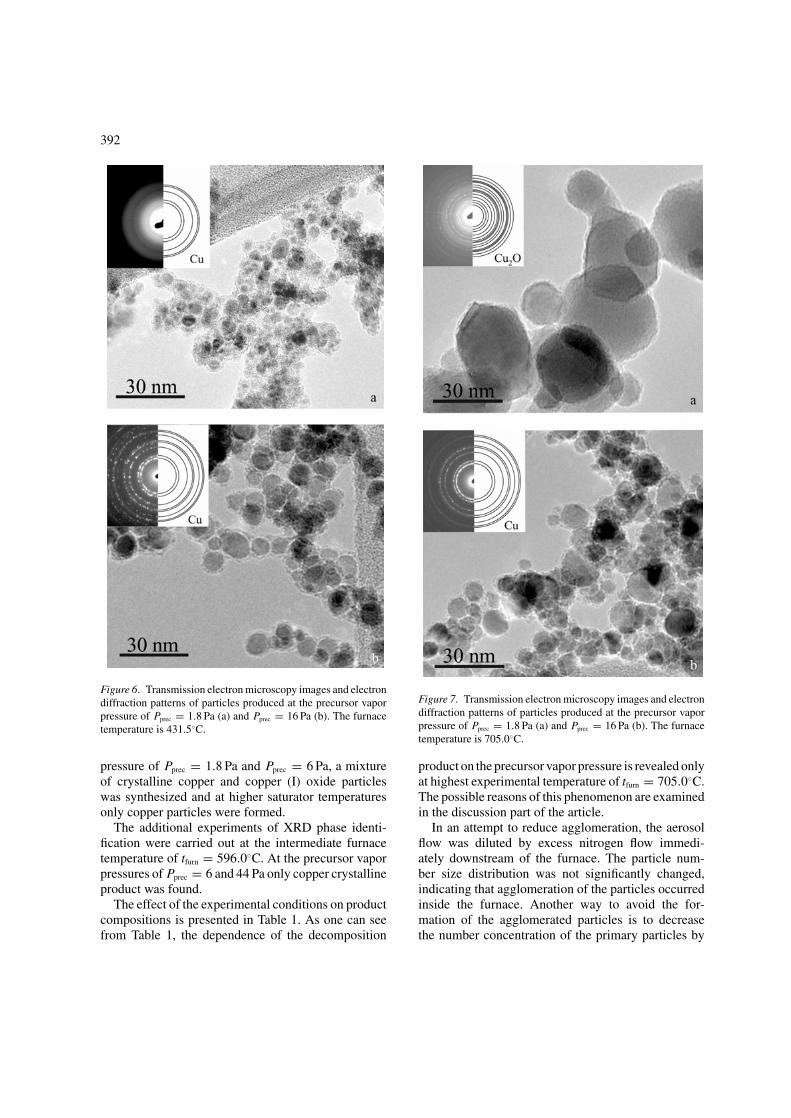
TEM micrographs of the nanoparticles synthesizedat reactor temperature of 431.5◦C and at the precur-sor vapor pressures of Pprec = 1.8 and Pprec = 16 Paare presented in Figure 6. As one can see, the primaryaerosol particles are fairly monodisperse and the sizeof the particles increases with increasing saturator tem-perature. In the same figure, the electron diffractionpatterns of the agglomerated particles are presented.The electron diffraction ring pattern simulations per-formed for copper fits with the experimental results.These results have been confirmed by XRD analysis.TGA showed that at the furnace temperature of 431.5◦Cthe decomposition of the precursor was not complete.
At the furnace temperature of 431.5◦C only 20% ofCu(acac)2 was thermolyzed. The remaining undecom-posed Cu(acac)2 forms a layer around copper particlesthat can be seen on the TEM images (Figure 6). It isworth noting that the electron diffraction ring patternenclosed in Figure 6(a) is not so clear as the othersdue to the large amount of amorphous unreacted pre-cursor. Microdiffraction patterns for this experimentalcondition have been also performed in order to deter-mine unambiguously that the particles presented inFigure 6(a) are crystalline copper.
TEM results for the nanoparticles synthesizedat 705.0◦C and at the precursor vapor pressures ofPprec = 1.8 and Pprec = 16 Pa are presented in Figure 7.With these conditions, the size of the primary par-ticles decreases with increasing the vapor pressureof the precursor, that is, there is an inverse situationcompared to the preceding samples synthesized atthe furnace temperature of tfurn = 431.5◦C. Electrondiffraction patterns of the agglomerated particles pro-duced at the furnace temperature of tfurn = 705.0◦Cindicate the presence of crystalline copper particlesat the vapor pressure of Pprec = 16 Pa and copperoxide (Cu2O, cuprite) particles at the vapor pressureof Pprec = 1.8 Pa. In Figure 8 XRD diffractograms ofthe particles collected on a silver filter are shown. Thevariation of the crystalline phase with changing theprecursor vapor pressure can be seen. At the vapor
392
Figure 6. Transmission electron microscopy images and electrondiffraction patterns of particles produced at the precursor vaporpressure of Pprec = 1.8 Pa (a) and Pprec = 16 Pa (b). The furnacetemperature is 431.5◦C.
pressure of Pprec = 1.8 Pa and Pprec = 6 Pa, a mixtureof crystalline copper and copper (I) oxide particleswas synthesized and at higher saturator temperaturesonly copper particles were formed.
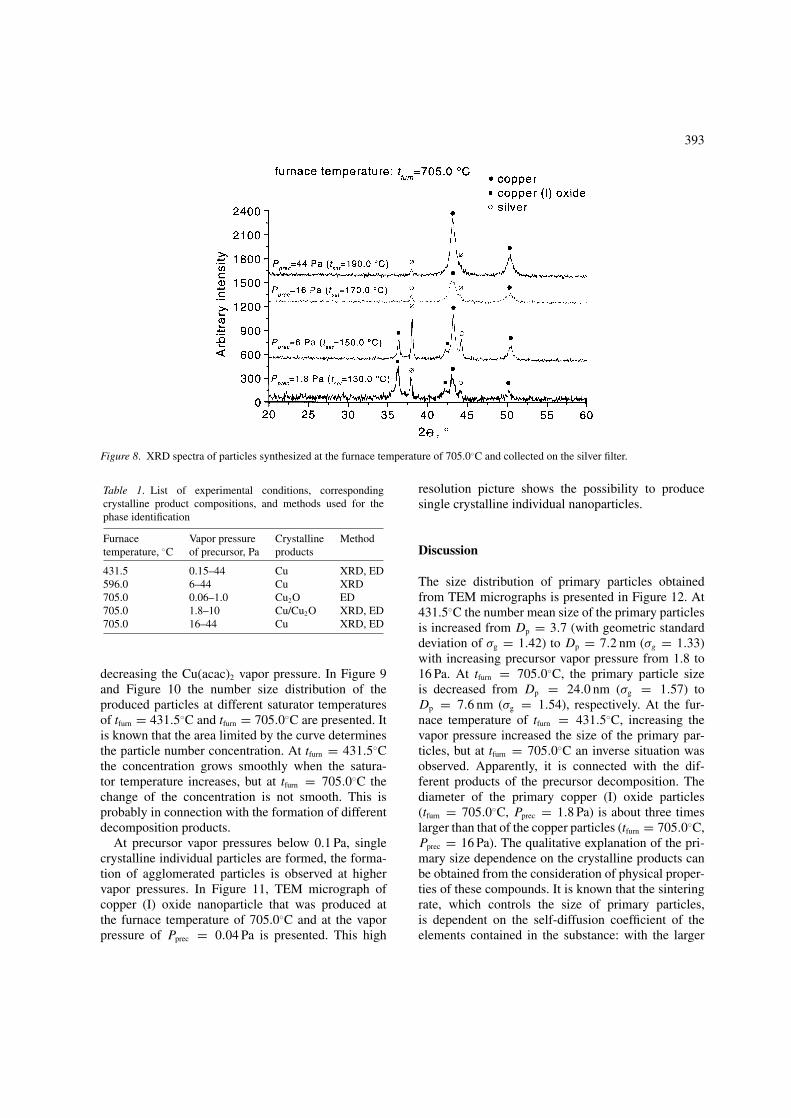
The additional experiments of XRD phase identi-fication were carried out at the intermediate furnacetemperature of tfurn = 596.0◦C. At the precursor vaporpressures of Pprec = 6 and 44 Pa only copper crystallineproduct was found.
The effect of the experimental conditions on productcompositions is presented in Table 1. As one can seefrom Table 1, the dependence of the decomposition
Figure 7. Transmission electron microscopy images and electrondiffraction patterns of particles produced at the precursor vaporpressure of Pprec = 1.8 Pa (a) and Pprec = 16 Pa (b). The furnacetemperature is 705.0◦C.
product on the precursor vapor pressure is revealed onlyat highest experimental temperature of tfurn = 705.0◦C.The possible reasons of this phenomenon are examinedin the discussion part of the article.
In an attempt to reduce agglomeration, the aerosolflow was diluted by excess nitrogen flow immedi-ately downstream of the furnace. The particle num-ber size distribution was not significantly changed,indicating that agglomeration of the particles occurredinside the furnace. Another way to avoid the for-mation of the agglomerated particles is to decreasethe number concentration of the primary particles by
393
Figure 8. XRD spectra of particles synthesized at the furnace temperature of 705.0◦C and collected on the silver filter.
Table 1. List of experimental conditions, correspondingcrystalline product compositions, and methods used for thephase identification
Furnace Vapor pressure Crystalline Methodtemperature, ◦C of precursor, Pa products
431.5 0.15–44 Cu XRD, ED596.0 6–44 Cu XRD705.0 0.06–1.0 Cu2O ED705.0 1.8–10 Cu/Cu2O XRD, ED705.0 16–44 Cu XRD, ED
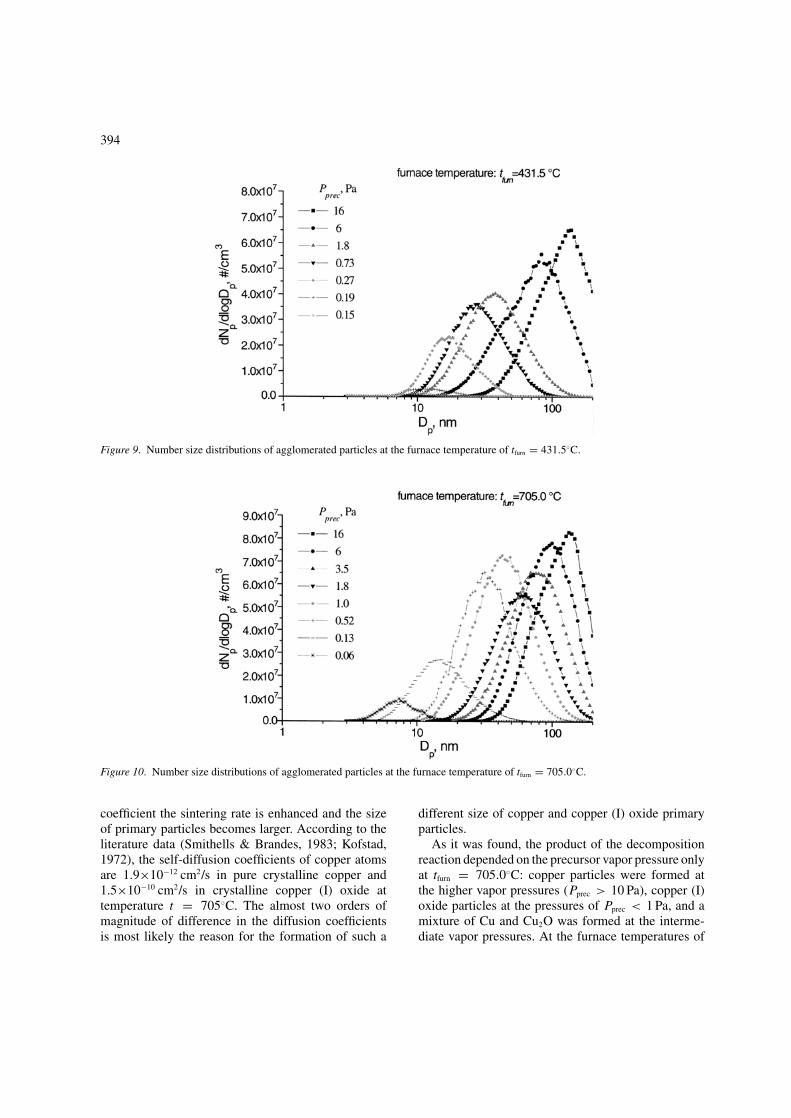
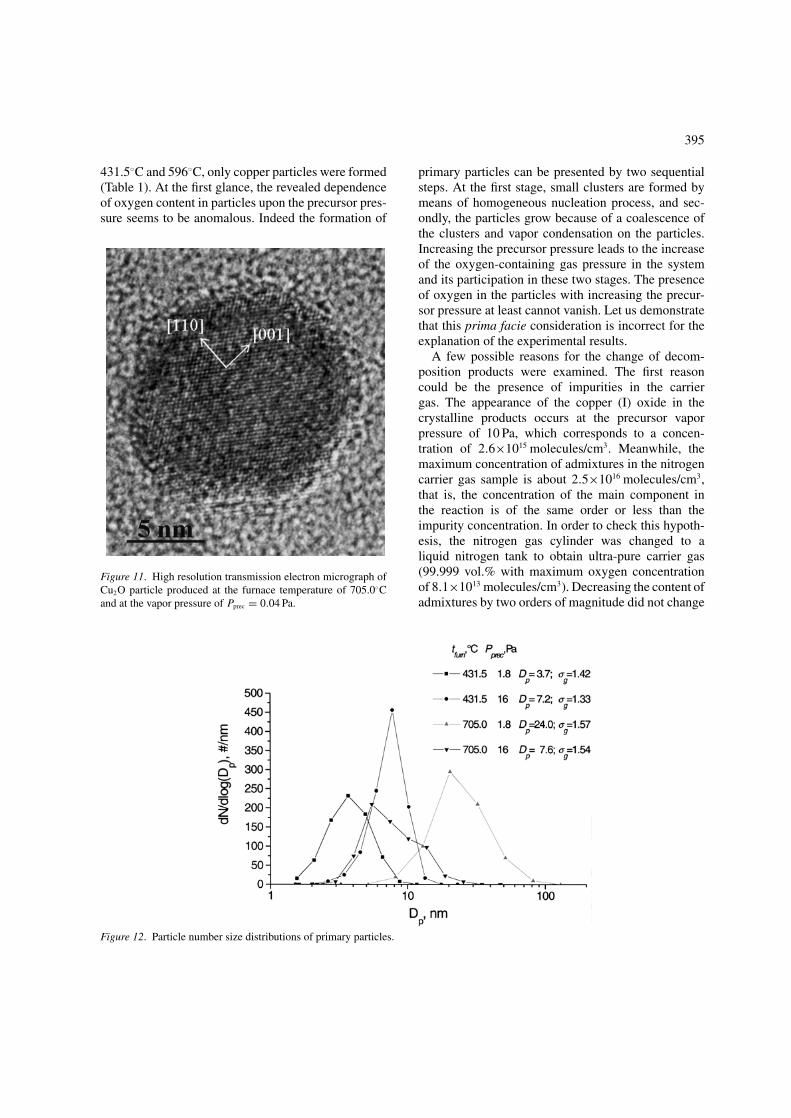
decreasing the Cu(acac)2 vapor pressure. In Figure 9and Figure 10 the number size distribution of theproduced particles at different saturator temperaturesof tfurn = 431.5◦C and tfurn = 705.0◦C are presented. Itis known that the area limited by the curve determinesthe particle number concentration. At tfurn = 431.5◦Cthe concentration grows smoothly when the satura-tor temperature increases, but at tfurn = 705.0◦C thechange of the concentration is not smooth. This isprobably in connection with the formation of differentdecomposition products.
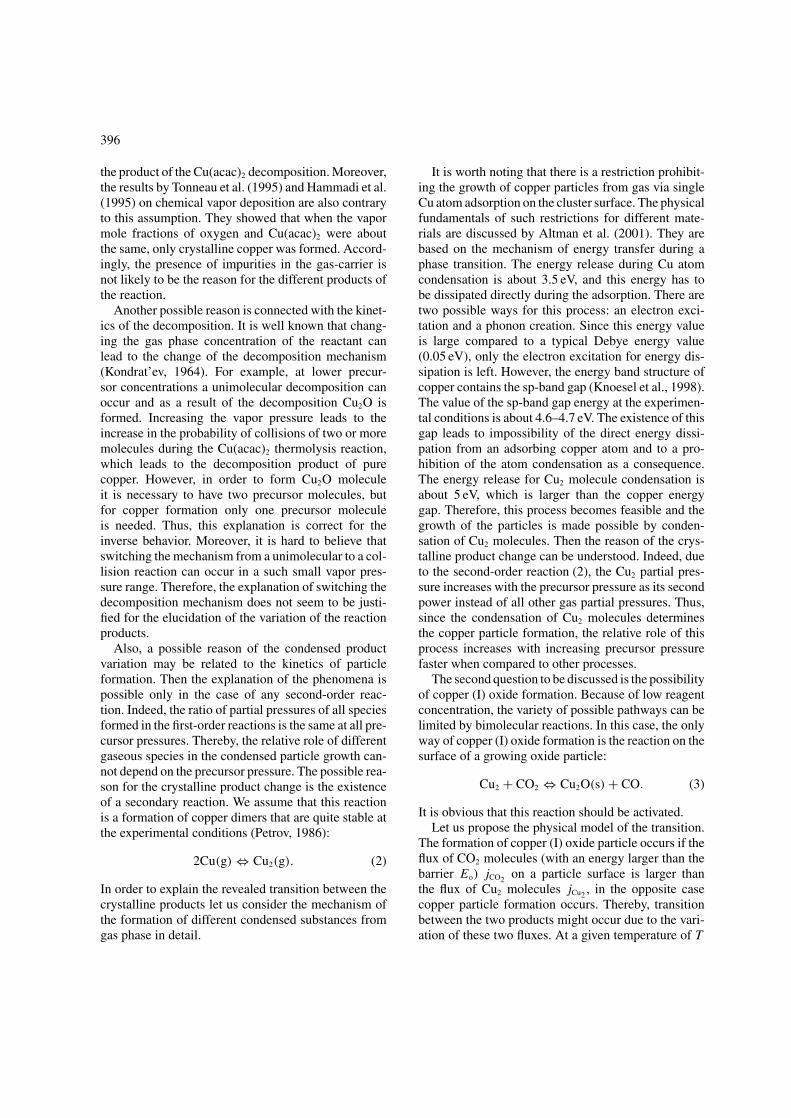
At precursor vapor pressures below 0.1 Pa, singlecrystalline individual particles are formed, the forma-tion of agglomerated particles is observed at highervapor pressures. In Figure 11, TEM micrograph ofcopper (I) oxide nanoparticle that was produced atthe furnace temperature of 705.0◦C and at the vaporpressure of Pprec = 0.04 Pa is presented. This high
resolution picture shows the possibility to producesingle crystalline individual nanoparticles.
Discussion
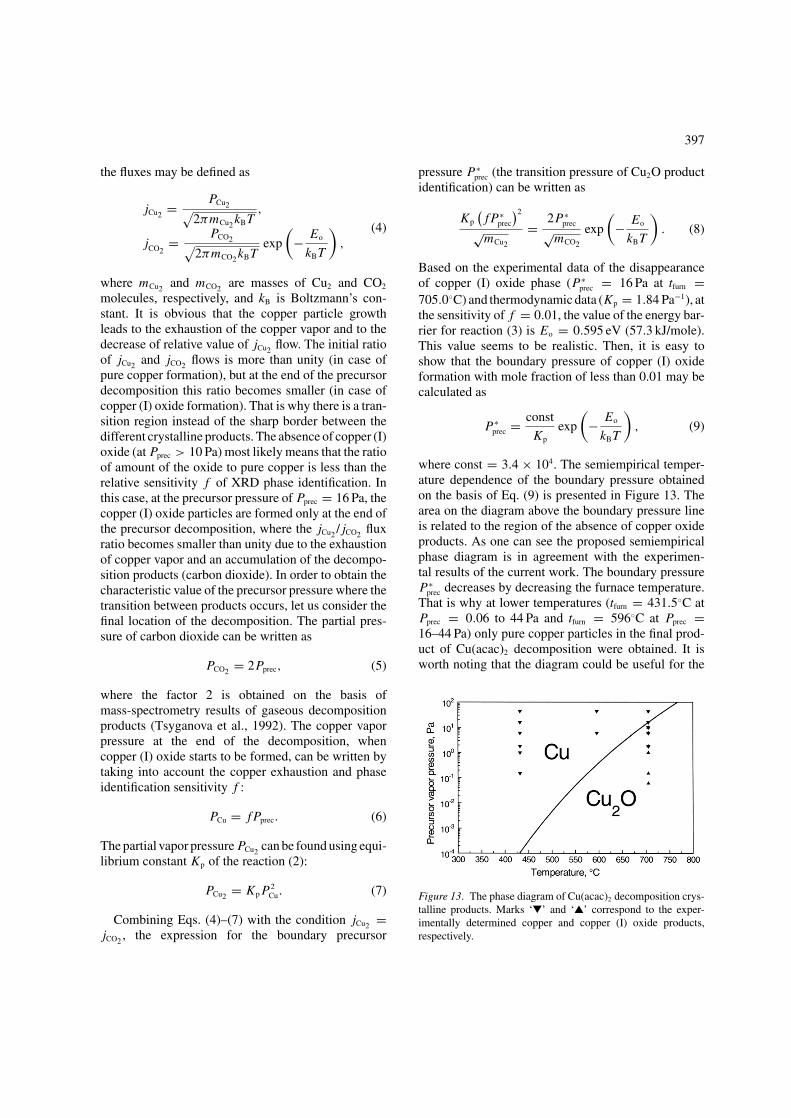
The size distribution of primary particles obtainedfrom TEM micrographs is presented in Figure 12. At431.5◦C the number mean size of the primary particlesis increased from Dp = 3.7 (with geometric standarddeviation of σg = 1.42) to Dp = 7.2 nm (σg = 1.33)with increasing precursor vapor pressure from 1.8 to16 Pa. At tfurn = 705.0◦C, the primary particle sizeis decreased from Dp = 24.0 nm (σg = 1.57) toDp = 7.6 nm (σg = 1.54), respectively. At the fur-nace temperature of tfurn = 431.5◦C, increasing thevapor pressure increased the size of the primary par-ticles, but at tfurn = 705.0◦C an inverse situation wasobserved. Apparently, it is connected with the dif-ferent products of the precursor decomposition. Thediameter of the primary copper (I) oxide particles(tfurn = 705.0◦C, Pprec = 1.8 Pa) is about three timeslarger than that of the copper particles (tfurn = 705.0◦C,Pprec = 16 Pa). The qualitative explanation of the pri-mary size dependence on the crystalline products canbe obtained from the consideration of physical proper-ties of these compounds. It is known that the sinteringrate, which controls the size of primary particles,is dependent on the self-diffusion coefficient of theelements contained in the substance: with the larger
394
Figure 9. Number size distributions of agglomerated particles at the furnace temperature of tfurn = 431.5◦C.
Figure 10. Number size distributions of agglomerated particles at the furnace temperature of tfurn = 705.0◦C.
coefficient the sintering rate is enhanced and the sizeof primary particles becomes larger. According to theliterature data (Smithells & Brandes, 1983; Kofstad,1972), the self-diffusion coefficients of copper atomsare 1.9×10⁻¹² cm2/s in pure crystalline copper and1.5×10−10 cm2/s in crystalline copper (I) oxide attemperature t = 705◦C. The almost two orders ofmagnitude of difference in the diffusion coefficientsis most likely the reason for the formation of such a
different size of copper and copper (I) oxide primaryparticles.
As it was found, the product of the decompositionreaction depended on the precursor vapor pressure onlyat tfurn = 705.0◦C: copper particles were formed atthe higher vapor pressures (Pprec > 10 Pa), copper (I)oxide particles at the pressures of Pprec < 1 Pa, and amixture of Cu and Cu2O was formed at the interme-diate vapor pressures. At the furnace temperatures of
395
431.5◦C and 596◦C, only copper particles were formed(Table 1). At the first glance, the revealed dependenceof oxygen content in particles upon the precursor pres-sure seems to be anomalous. Indeed the formation of
Figure 11. High resolution transmission electron micrograph ofCu2O particle produced at the furnace temperature of 705.0◦Cand at the vapor pressure of Pprec = 0.04 Pa.
Figure 12. Particle number size distributions of primary particles.
primary particles can be presented by two sequentialsteps. At the first stage, small clusters are formed bymeans of homogeneous nucleation process, and sec-ondly, the particles grow because of a coalescence ofthe clusters and vapor condensation on the particles.Increasing the precursor pressure leads to the increaseof the oxygen-containing gas pressure in the systemand its participation in these two stages. The presenceof oxygen in the particles with increasing the precur-sor pressure at least cannot vanish. Let us demonstratethat this prima facie consideration is incorrect for theexplanation of the experimental results.
A few possible reasons for the change of decom-position products were examined. The first reasoncould be the presence of impurities in the carriergas. The appearance of the copper (I) oxide in thecrystalline products occurs at the precursor vaporpressure of 10 Pa, which corresponds to a concen-tration of 2.6×10¹⁵ molecules/cm3. Meanwhile, themaximum concentration of admixtures in the nitrogencarrier gas sample is about 2.5×10¹⁶ molecules/cm3,that is, the concentration of the main component inthe reaction is of the same order or less than theimpurity concentration. In order to check this hypoth-esis, the nitrogen gas cylinder was changed to aliquid nitrogen tank to obtain ultra-pure carrier gas(99.999 vol.% with maximum oxygen concentrationof 8.1×10¹³ molecules/cm3). Decreasing the content ofadmixtures by two orders of magnitude did not change
396
the product of the Cu(acac)2 decomposition. Moreover,the results by Tonneau et al. (1995) and Hammadi et al.(1995) on chemical vapor deposition are also contraryto this assumption. They showed that when the vapormole fractions of oxygen and Cu(acac)2 were aboutthe same, only crystalline copper was formed. Accord-ingly, the presence of impurities in the gas-carrier isnot likely to be the reason for the different products ofthe reaction.
Another possible reason is connected with the kinet-ics of the decomposition. It is well known that chang-ing the gas phase concentration of the reactant canlead to the change of the decomposition mechanism(Kondrat’ev, 1964). For example, at lower precur-sor concentrations a unimolecular decomposition canoccur and as a result of the decomposition Cu2O isformed. Increasing the vapor pressure leads to theincrease in the probability of collisions of two or moremolecules during the Cu(acac)2 thermolysis reaction,which leads to the decomposition product of purecopper. However, in order to form Cu2O moleculeit is necessary to have two precursor molecules, butfor copper formation only one precursor moleculeis needed. Thus, this explanation is correct for theinverse behavior. Moreover, it is hard to believe thatswitching the mechanism from a unimolecular to a col-lision reaction can occur in a such small vapor pres-sure range. Therefore, the explanation of switching thedecomposition mechanism does not seem to be justi-fied for the elucidation of the variation of the reactionproducts.
Also, a possible reason of the condensed productvariation may be related to the kinetics of particleformation. Then the explanation of the phenomena ispossible only in the case of any second-order reac-tion. Indeed, the ratio of partial pressures of all speciesformed in the first-order reactions is the same at all pre-cursor pressures. Thereby, the relative role of differentgaseous species in the condensed particle growth can-not depend on the precursor pressure. The possible rea-son for the crystalline product change is the existenceof a secondary reaction. We assume that this reactionis a formation of copper dimers that are quite stable atthe experimental conditions (Petrov, 1986):
2Cu(g) ⇔ Cu2(g). (2)
In order to explain the revealed transition between thecrystalline products let us consider the mechanism ofthe formation of different condensed substances fromgas phase in detail.
It is worth noting that there is a restriction prohibit-ing the growth of copper particles from gas via singleCu atom adsorption on the cluster surface. The physicalfundamentals of such restrictions for different mate-rials are discussed by Altman et al. (2001). They arebased on the mechanism of energy transfer during aphase transition. The energy release during Cu atomcondensation is about 3.5 eV, and this energy has tobe dissipated directly during the adsorption. There aretwo possible ways for this process: an electron exci-tation and a phonon creation. Since this energy valueis large compared to a typical Debye energy value(0.05 eV), only the electron excitation for energy dis-sipation is left. However, the energy band structure ofcopper contains the sp-band gap (Knoesel et al., 1998).The value of the sp-band gap energy at the experimen-tal conditions is about 4.6–4.7 eV. The existence of thisgap leads to impossibility of the direct energy dissi-pation from an adsorbing copper atom and to a pro-hibition of the atom condensation as a consequence.The energy release for Cu2 molecule condensation isabout 5 eV, which is larger than the copper energygap. Therefore, this process becomes feasible and thegrowth of the particles is made possible by conden-sation of Cu2 molecules. Then the reason of the crys-talline product change can be understood. Indeed, dueto the second-order reaction (2), the Cu2 partial pres-sure increases with the precursor pressure as its secondpower instead of all other gas partial pressures. Thus,since the condensation of Cu2 molecules determinesthe copper particle formation, the relative role of thisprocess increases with increasing precursor pressurefaster when compared to other processes.
The second question to be discussed is the possibilityof copper (I) oxide formation. Because of low reagentconcentration, the variety of possible pathways can belimited by bimolecular reactions. In this case, the onlyway of copper (I) oxide formation is the reaction on thesurface of a growing oxide particle:
Cu2 + CO2 ⇔ Cu2O(s) + CO. (3)
It is obvious that this reaction should be activated.Let us propose the physical model of the transition.
The formation of copper (I) oxide particle occurs if theflux of CO2 molecules (with an energy larger than thebarrier Eo) jCO2
on a particle surface is larger thanthe flux of Cu2 molecules jCu2
, in the opposite casecopper particle formation occurs. Thereby, transitionbetween the two products might occur due to the vari-ation of these two fluxes. At a given temperature of T
397
the fluxes may be defined as
jCu2= PCu2√
2πmCu2kBT
,
jCO2= PCO2√
2πmCO2kBT
exp
(− Eo
kBT
),
(4)
where mCu2and mCO2
are masses of Cu2 and CO2
molecules, respectively, and kB is Boltzmann’s con-stant. It is obvious that the copper particle growthleads to the exhaustion of the copper vapor and to thedecrease of relative value of jCu2
flow. The initial ratioof jCu2
and jCO2flows is more than unity (in case of
pure copper formation), but at the end of the precursordecomposition this ratio becomes smaller (in case ofcopper (I) oxide formation). That is why there is a tran-sition region instead of the sharp border between thedifferent crystalline products. The absence of copper (I)oxide (at Pprec > 10 Pa) most likely means that the ratioof amount of the oxide to pure copper is less than therelative sensitivity f of XRD phase identification. Inthis case, at the precursor pressure of Pprec = 16 Pa, thecopper (I) oxide particles are formed only at the end ofthe precursor decomposition, where the jCu2
/jCO2flux
ratio becomes smaller than unity due to the exhaustionof copper vapor and an accumulation of the decompo-sition products (carbon dioxide). In order to obtain thecharacteristic value of the precursor pressure where thetransition between products occurs, let us consider thefinal location of the decomposition. The partial pres-sure of carbon dioxide can be written as
PCO2= 2Pprec, (5)
where the factor 2 is obtained on the basis ofmass-spectrometry results of gaseous decompositionproducts (Tsyganova et al., 1992). The copper vaporpressure at the end of the decomposition, whencopper (I) oxide starts to be formed, can be written bytaking into account the copper exhaustion and phaseidentification sensitivity f :
PCu = fPprec. (6)
The partial vapor pressurePCu2can be found using equi-
librium constant Kp of the reaction (2):
PCu2= KpP
2Cu. (7)
Combining Eqs. (4)–(7) with the condition jCu2=
jCO2, the expression for the boundary precursor
pressure P ∗prec (the transition pressure of Cu2O product
identification) can be written as
Kp
(fP ∗
prec
)2
√mCu2
= 2P ∗prec√
mCO2
exp
(− Eo
kBT
). (8)
Based on the experimental data of the disappearanceof copper (I) oxide phase (P ∗
prec = 16 Pa at tfurn =705.0◦C) and thermodynamic data (Kp = 1.84 Pa−1), atthe sensitivity of f = 0.01, the value of the energy bar-rier for reaction (3) is Eo = 0.595 eV (57.3 kJ/mole).This value seems to be realistic. Then, it is easy toshow that the boundary pressure of copper (I) oxideformation with mole fraction of less than 0.01 may becalculated as
P ∗prec = const
Kp
exp
(− Eo
kBT
), (9)
where const = 3.4 × 10⁴. The semiempirical temper-ature dependence of the boundary pressure obtainedon the basis of Eq. (9) is presented in Figure 13. Thearea on the diagram above the boundary pressure lineis related to the region of the absence of copper oxideproducts. As one can see the proposed semiempiricalphase diagram is in agreement with the experimen-tal results of the current work. The boundary pressureP ∗
prec decreases by decreasing the furnace temperature.That is why at lower temperatures (tfurn = 431.5◦C atPprec = 0.06 to 44 Pa and tfurn = 596◦C at Pprec =16–44 Pa) only pure copper particles in the final prod-uct of Cu(acac)2 decomposition were obtained. It isworth noting that the diagram could be useful for the
Figure 13. The phase diagram of Cu(acac)2 decomposition crys-talline products. Marks ‘�’ and ‘�’ correspond to the exper-imentally determined copper and copper (I) oxide products,respectively.
398
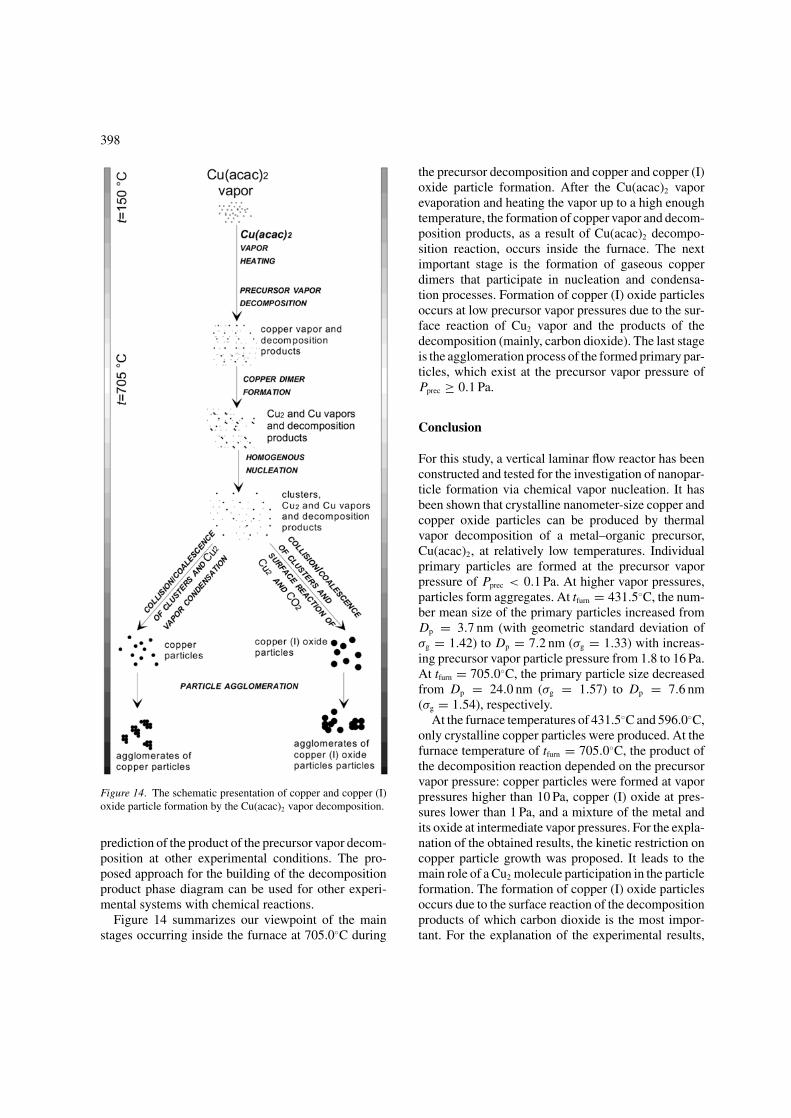
Figure 14. The schematic presentation of copper and copper (I)oxide particle formation by the Cu(acac)2 vapor decomposition.
prediction of the product of the precursor vapor decom-position at other experimental conditions. The pro-posed approach for the building of the decompositionproduct phase diagram can be used for other experi-mental systems with chemical reactions.
Figure 14 summarizes our viewpoint of the mainstages occurring inside the furnace at 705.0◦C during
the precursor decomposition and copper and copper (I)oxide particle formation. After the Cu(acac)2 vaporevaporation and heating the vapor up to a high enoughtemperature, the formation of copper vapor and decom-position products, as a result of Cu(acac)2 decompo-sition reaction, occurs inside the furnace. The nextimportant stage is the formation of gaseous copperdimers that participate in nucleation and condensa-tion processes. Formation of copper (I) oxide particlesoccurs at low precursor vapor pressures due to the sur-face reaction of Cu2 vapor and the products of thedecomposition (mainly, carbon dioxide). The last stageis the agglomeration process of the formed primary par-ticles, which exist at the precursor vapor pressure ofPprec ≥ 0.1 Pa.
Conclusion
For this study, a vertical laminar flow reactor has beenconstructed and tested for the investigation of nanopar-ticle formation via chemical vapor nucleation. It hasbeen shown that crystalline nanometer-size copper andcopper oxide particles can be produced by thermalvapor decomposition of a metal–organic precursor,Cu(acac)2, at relatively low temperatures. Individualprimary particles are formed at the precursor vaporpressure of Pprec < 0.1 Pa. At higher vapor pressures,particles form aggregates. At tfurn = 431.5◦C, the num-ber mean size of the primary particles increased fromDp = 3.7 nm (with geometric standard deviation ofσg = 1.42) to Dp = 7.2 nm (σg = 1.33) with increas-ing precursor vapor particle pressure from 1.8 to 16 Pa.At tfurn = 705.0◦C, the primary particle size decreasedfrom Dp = 24.0 nm (σg = 1.57) to Dp = 7.6 nm(σg = 1.54), respectively.
At the furnace temperatures of 431.5◦C and 596.0◦C,only crystalline copper particles were produced. At thefurnace temperature of tfurn = 705.0◦C, the product ofthe decomposition reaction depended on the precursorvapor pressure: copper particles were formed at vaporpressures higher than 10 Pa, copper (I) oxide at pres-sures lower than 1 Pa, and a mixture of the metal andits oxide at intermediate vapor pressures. For the expla-nation of the obtained results, the kinetic restriction oncopper particle growth was proposed. It leads to themain role of a Cu2 molecule participation in the particleformation. The formation of copper (I) oxide particlesoccurs due to the surface reaction of the decompositionproducts of which carbon dioxide is the most impor-tant. For the explanation of the experimental results,
399
a model is proposed to build a semiempirical phase dia-gram of the precursor decomposition crystalline prod-ucts. The phase diagram, showing the boundary of theappearance of copper (I) oxide, is in agreement withthe experimental results.
Acknowledgements
This work has been supported by TEKES, Finlandand VTT Chemical Technology via the MATRAresearch program. Mr. P. Raisanen, Dr. M. Ritala andProf. M. Leskela are gratefully acknowledged for helpduring the XRD analyses and Mr. Timo Hatanpaafor carrying out TGA analysis. The authors thankDr. J.K. Jokiniemi, Dr. P.V. Pikhitsa, Dr. V. Mikheevand Prof. T. Ward for fruitful discussions and Dr.D.P. Brown for discussions and proofreading themanuscript.
References
Adams C.R. & T.J. Jennings, 1964. Mechanism studies of thecatalytic oxidation of propylene. J. Catal. 3, 549.
Altman I.S., P.V. Pikhitsa & M. Choi, 2001. Key effects atnanoparticle formation by combustion techniques. In: Kish L.,Granqvist C.G., Marlow W., Siegel R.W. eds. Fundamentals ofGas-Phase Nanotechnology (in press).
Ayaappan S., R.S. Gopalan, G.N. Subbanna & C.N.R. Rao, 1997.Nanoparticles of Ag, Au, Pd, and Cu Produced by AlcoholReduction of the Salts. J. Mater. Res. 12, 398.
Bouland D., J.C. Chouard, A. Briand, F. Chartier, J.L. Lacour,P. Mauchien & J.M. Mermet, 1992. Experimental study ofaerosol production by laser ablation. J. Aerosol Sci. 23(1), 225.
Bowles R.S., J.J. Kolstad, J.M. Calo & R.P. Andres, 1981.Generation of molecular clusters of controlled size. Surf. Sci.106, 117.
Campbell C.T., K.A. Daube & J.M. White, 1987. Cu/ZnO(0001)and Cu(111): Model Catalysts for Methanol Synthesis. Surf.Sci. 182, 458.
Champion Y. & J. Bigot, 1996. Characterization of nanocrys-talline copper powders preparing by melting in a cryogenicliquid. Mater. Sci. Eng. A217/218, 58.
Chou K.-S. & G.-J. Tsai, 1994. Dynamic evaporation behaviourof diketonate compounds of yttrium, copper and barium.Thermochim. Acta 240, 129.
Daroczi L., M.T. Beck, D.L. Beke, M. Kis-Varga, L. Harasztosi &N. Takacs, 1998. Production of Fe and Cu nanocrystalline par-ticles by thermal decomposition of ferro- and copper-cyanides.Mat. Sci. Forum 269–272, 319.
Dhas N.A., C.P. Raj & A. Gedanken, 1998. Synthesis, characteri-zation, and properties of metallic copper nanoparticles. Chem.Mater. 10, 1446.
Ding J., T. Tsuzuki, P.G. McCormick & R. Street, 1996. UltrafineCu articles prepared by mechanical process. J. Alloys andComp. 234, L1.
Du F.-L., Z.-L. Cui, Z.-K. Zhang & S.-Y. Chen, 1997. Behaviorof supported nano-copper catalyst in CO oxidation. J. Nat. GasChem. 6, 135.
Folmanis G.E. & V.A. Uglov, 1991. Nanocrystalline copper pow-der produced by electrolysis. Poroshkovaya Metallurgiya 2, 5.
Gerfin T., M. Becht & K.-H. Dahmen, 1993. Preparation of cop-per and copper oxide film by metal-organic chemical vapourdeposition using β-ketoiminato complexes. Mater. Sci. Eng.B17, 97.
Girardin D. & M. Maurer, 1990. Ultrafine metallic powders pre-pared by high pressure plasma: synthesis and characterization.Mat. Res. Bull. 25, 119.
Gredig S.V., R.A. Koppel & A. Baiker, 1997. Synthesis of methy-lamines from carbon dioxide, hydrogen and ammonia over sup-ported copper catalysts. Influence of support. J. Mol. Catal. A:Chemical 127, 133.
Haas V. & R. Birringer, 1992. The morphology and size of nanostructured Cu, Pd, and W generated by sputtering. Nanostruct.Mater. 1, 491.
Hammadi Z., B. Lecohier & H. Dallaporta, 1993. Chemical vapordeposition of metallic copper film in the presence of oxygen.J. Appl. Phys. 73, 5213.
Hammerschmidt W., A. Baiker, A. Wokaun & W. Fluhr, 1986.Copper catalyzed synthesis of cyclic amines from amino-alcohols. Appl. Catal. 20, 305.
Herley P.J., W. Jones & G.R. Millward, 1989. Electron beamdecomposition of copper hydride and the generation of ultra-fine particles of copper. J. Mater. Sci. Lett. 8, 1013.
Holzschuh H. & H. Suhr, 1990. Deposition of copper oxide(Cu2O, CuO) thin films at high temperatures by plasma-enhanced CVD. Appl. Phys. A51, 486.
Huang H.H., F.Q. Yan, Y.M. Kek, C.H. Chew, G.Q. Xu, W. Ji,P.S. Oh & S.H. Tang, 1997. Synthesis, characterization, andnonlinear optical properties of copper nanoparticles. Langmuir13, 172.
Kaito C., K. Fujita & H. Hashimoto, 1973. Electron-microscopystudy of oxidation processes by metal fine particles. Jpn. J.Appl. Phys. 12, 489.
Kaito C., T. Watanabe, K. Ochtsuka, F. Chen & Y. Saito, 1993.A new study on the production of clusters from copper ultrafineparticles. J. Cryst. Growth 128, 267.
Kashu S., M. Nagase, C. Hayashi, R. Uyeda, N. Wada & A. Tasaki,1974. Preparation and properties of ultrafine metal powders.Proc. 6th Int. Vac. Congr. 1974. Jpn. J. Appl. Phys. 14 (Suppl.2), 491.
Kellerson A., E. Knozinger, W. Langel & M. Giersig, 1995. Cu2Oquantum-dot particles prepared from nanostructured copper.Adv. Mater. 7, 652.
Kijenski J., J. Burger & A. Baiker, 1984. Copper catalyzed dispro-portionation of benzylamine methyl derivatives. Appl. Catal.11, 295.
Kijenski J., P.J. Niedzielski & A. Baiker, 1989. Synthesis of cyclicamines and their alkyl derivatives from amino-alcohols oversupported copper catalysts. Appl. Catal. 53, 107.
Kirchheim R., X.Y. Huang, P. Cui, R. Birriner & H. Gleiter, 1991.Free energy of active atoms in grain boundaries of nanocrys-talline copper, nickel and palladium. Nanostruct. Mater. 1, 167.
Klenov D.O., G.N. Kryukova & L.M. Plyasova, 1998. Localiza-tion of copper atoms in the structure of the ZnO catalyst formethanol synthesis. J. Mater. Chemistry 8, 1665.
400
Klier K., 1982. Methanol synthesis. Adv. Catal. 31, 243.Knacke O., O. Kubaschewski & K. Hesselmann, 1991.
Thermochemical Properties of Inorganic Substances.Springer-Verlag, Berlin.
Knoesel E., A. Hotzel & M. Wolf, 1998. Temperature dependenceof surface state lifetimes, dephasing rates and binding energieson Cu(111) studies with time-resolved photoemission. J. Elect.Spectr. Rel. Phen. 88–91, 577.
Kodas T.T. & M.J. Hampden-Smith, 1999. Aerosol Processing ofMaterials. Wiley-VCH, New York.
Kofstad P., 1972. Nonstoichiometry, Diffusion, and ElectricalConductivity in Binary Metal Oxides. Wiley-Interscience,New York.
Kondrat’ev V.N., 1964. Chemical Kinetics of Gas Reactions.Persimmon Press Oxford, London.
Kulikov I.S., 1969. Thermal Dissociation of Compounds.(Termicheskaja dissociatciya soedinenij) Metallurgia, Moscow(in Russian).
Lisieski I. & M.P. Pileni, 1993. Synthesis of copper clusters usingreverse micelles as microreactors. J. Am. Chem. Soc. 115,3887.
Lisieski I. & M.P. Pileni, 1995. Copper metallic particles synthe-sized “in situ” in reverse micelles: influence of various param-eters on the size of particles. J. Phys. Chem. 99, 5077.
Lisieski I., F. Billoudet & M.P. Pileni, 1996. Control of the shapeand the size of copper metallic particles. J. Phys. Chem. 100,4160.
Long N.J. & A.K. Petford-Long, 1986. In situ Electron-beam-induced reduction of CuO: a study of phase transformation incupric oxide. Ultramicroscopy 20, 151.
Majumdar D., T.A. Shefelbine, T.T. Kodas & H.D. Glicksman,1996. Copper (I) oxide powder generation by spray pyrolysis.J. Mater. Res. 11, 2861.
Maruyama T. & T. Shirai, 1995. Copper thin film prepared bychemical vapour deposition from copper (II) acetylacetonate.J. Mater. Sci. 30, 5551.
Marzouk H.A., J.S. Kim, P.J. Reucroft, R.J. Jacob,J.D. Robertson & C. Eloi, 1994. Evaluation of copperchemical-vapor-deposition films on glass and Si(100)substrates. Appl. Phys. A58, 607.
Moini M. & J.R. Eyler, 1988. Formation of small negative andpositive cluster ions of gold, silver, and copper by direct laservaporization. J. Chem. Phys. 88, 5512.
Pauleau Y. & A.Y. Fasasi, 1991. Kinetics of sublimation ofcopper (II) acetylacetonate complex used for chemical vapordeposition of copper films. Chem. Mater. 3, 45.
Pelletier J., R. Pantel, C. Oberlin, Y. Pauleau & P. Gouy-Pialler,1991. Preparation of copper films at ambient temperatureby microwave plasma-enhanced chemical vapor depositionfrom the copper (II) acetylacetonate-argon-hydrogen system.J. Appl. Phys. 70, 3862.
Peoples S.M., J.F. McCarthy, L.C. Chen, D. Eppelsheimer &M.O. Amdur 1988. Copper oxide aerosol: generation andcharacterization. Am. Ind. Hyg. Assoc. J. 49, 271.
Pereia R., M. Rufo & U. Schuchardt, 1994. Copper (II) catalyzedoxidation of cyclohexane by tert-butyl hydroperoxide. J. Braz.Chem. Society 5, 83.
Petrov Yu.I., 1986. Clusters and Small Particles. (Klastery i malyechastitcy) Nauka, Moscow (in Russian).
Pietrikova A. & E. Kapusanska, 1991. Production of very finecopper powder and control of its properties. Metallic Mater.29, 626.
Runeberg J., A. Baiker & J. Kijenski, 1985. Copper catalyzedamination of ethylene glycole. Appl. Catal. 17, 309.
Shannon I.J., F. Rey, G. Sankar, J.M. Thomas, T. Maschmeyer,A.M. Waller, A.E. Palomares, A. Corma, A.J. Dent &G.N. Greaves, 1996. Hydrotalcite-derived mixed oxides con-taining copper: catalysts for the removal of nitric oxide.J. Chem. Soc. Farad. Trans. 92, 4331.
Shiau C.-Y. & J.C. Tsai, 1997. Cu/r-Al2O3 Catalyst prepared byelectrolyses method. J. Chin. Ist. Chem. Eng. 28, 55.
Smithells C.J. & E.A. Brandes, 1983. Smithells Metals ReferenceBook. Butterworths, London.
Takahashi T., J. Suzuki, M. Saburi & Y. Uchida, 1988. Selectivepreparation of copper, copper (I) oxide, or copper (II) oxidefine particles from organocopper compounds. J. Mater. Sci.Let. 7, 1251.
Teghil R., D. Ferro, L. Bencivenni & M. Pelino, 1981. A thermo-dynamic study of the sublimation processes of aluminium andcopper acetylacetonates. Thermochim. Acta 44, 213.
Tijburg I.I.M., Ph.D. Thesis, Utrecht, The Netherlands, 1989.Tonneau D., R. Pierrisnard, H. Dallaporta & W. Marine, 1995.
Growth kinetics of copper films from photoassisted CVD ofcopper acetylacetonate. Journal de Physique IV 5(C5), 629.
Tsyganova E.I., G.A. Mazurenko, V.N. Drobotenko,L.M. Dyagileva & Yu.A. Aleksandrov, 1992. Kinetic regulari-ties of thermolysis of yttrium, barium, copper acetylacetinates.J. Gen. Chem. 62, 407 (Translated from Zh. Obshch. Khim.(USSR) 62, 499).
Voge H.H. & C.R. Adams, 1967. Catalytic oxidation of olefins.Adv. Catal. 17, 151.
Vorobyova S.A., V.V. Mushinsky & A.I. Lesnikovich, 1997.Copper oxide produced by two-phase synthesis in “octane-water” system. Dokl. Acad. Sci. Belarus 41, 62.
Vultier R., A. Baiker & A. Wokaun, 1987. Copper catalyzedamination of 1,6-hexanediol. Appl. Catal. 30, 167.
Van der Meijden J., Ph.D. Thesis, Utrecht, The Netherlands, 1981.Weins W.N., J.D. Makinson, R.J. De Angelis & S.C. Axtell,
1997. Low-frequency internal friction studies of nanocrys-talline copper. Nanostruct. Mater. 9, 509.
Winklmayr W., G.P. Reischl, A.O. Linder & A. Berner, 1991.A new electromobility spectrometer for the measurement ofaerosol size distributions in the size range from 1 to 100 nm.J. Aerosol Sci. 22, 289.
Xu J., X. Sun, W. Chen, X. Fan & W. Wei, 1992. Synthesisof copper ultrafine particles by using gas evaporation. CailiaoKexue Jinzhan 6, 209.
Yurieva T.M., L.M. Plyasova, T.A. Krieger, V.I. Zaikovskii,O.V. Makarova & T.P. Minyukova, 1993. State of copper con-taining catalyst for methanol synthesis in the reaction medium.React. Kinet. Catal. Lett. 51, 495.