Embed Size (px)
Citation preview

www.ssoar.info
A century of change: trends in the composition inthe italian labour force, 1881-1981Zamagni, Vera
Veröffentlichungsversion / Published VersionZeitschriftenartikel / journal article
Zur Verfügung gestellt in Kooperation mit / provided in cooperation with:GESIS - Leibniz-Institut für Sozialwissenschaften
Empfohlene Zitierung / Suggested Citation:Zamagni, V. (1987). A century of change: trends in the composition in the italian labour force, 1881-1981. HistoricalSocial Research, 12(4), 36-97. https://doi.org/10.12759/hsr.12.1987.4.36-97
Nutzungsbedingungen:Dieser Text wird unter einer CC BY Lizenz (Namensnennung) zurVerfügung gestellt. Nähere Auskünfte zu den CC-Lizenzen findenSie hier:https://creativecommons.org/licenses/by/4.0/deed.de
Terms of use:This document is made available under a CC BY Licence(Attribution). For more Information see:https://creativecommons.org/licenses/by/4.0
Diese Version ist zitierbar unter / This version is citable under:https://nbn-resolving.org/urn:nbn:de:0168-ssoar-34505

A CENTURY OF CHANGE: TRENDS IN THE COMPOSITION OF THE ITALIAN LABOUR FORCE,
1881-1981
VERA ZAMAGNI (*)(1)
Abstract: Popula t ion and i n d u s t r i a l c e n s u s e s in I t a ly suffer from remarkab le shor tcomings when a d iacronic view is super imposed upon them, because on t h e one hand t h e y a r e no t d ivided to respond to r e q u i r e m e n t s of comparabi l i ty th rough time and on t h e o t h e r hand t h e changes t h e y depic t a re sometimes so r ad ica l to f r u s t r a t e efforts aiming at an homogeniza t ion of d a t a . The purpose of t h i s paper is 1) to d i scuss t h e most impor tan t c a u s e s of d i sc repancy among t h e v a r i o u s censuse s and to formulate ways of ad jus t ing d a t a to e l imina te such causes and 2) to gain and comment impor tan t i n s i g h t s which can help to i n t e r p r e t e t h e r e s u l t s .
Monthly s u r v e y s on employment and unemployment s t a r t e d in I t a ly only a t t h e beg inn ing of t h e 1950s, (2) while some p a r t i a l d a t a of t h i s t ype a r e a lso a v a i l a b l e for t h e 1920s and 1930s with re fe rence to t h e i n d u s t r i a l sec to r . (3 ) A long view of t h e t r e n d of sec to ra l employment in I ta ly , the re fore , must i n e v i t a b l y re ly on popu la t ion and i n d u s t r i a l c e n s u s e s . Prior to any use of c e n s u s e s is , however , a d i scuss ion of t h e concep t of " labour force" employed by them. There is no doubt t h a t , u n t i l v e r y r e c e n t l y , t h e ques t ion asked by I t a l i an popula t ion c e n s u s e s was: "what i s your profess ion?" , t h e answer d i s regard ing whe the r o r no t t h a t profess ion was a c t u a l l y exe rc i sed , which implies t h a t popula t ion c e n s u s e s " labour force" inc luded unemployed people . I ndus t r i a l c e n s u s e s , i n s t e a d , r equ i red firms to a s s e s s t h e i r a c t u a l employment in t h e day t h e census was t a k e n , which, as a m a t t e r of p r inc ip le , exc luded unemployed people . This is one r eason why I cons ider both t y p e s of c ensus in t h e i r own r igh t usefu l to c o n s t r u c t a long run view of sec to ra l (and reg iona l ) employment in I t a ly (o the r r e a s o n s will be ment ioned l a t e r on). I nev i t ab l y , c e n s u s e s suffer from remarkab le shor tcomings when a d iacronic view is super imposed upon them, because on t h e one hand t hey a r e no t dev ided to respond to r e q u i r e m e n t s of comparabi l i ty th rough time and in t h e o t h e r h a n d t h e changes t h e y dep ic t a r e sometimes so rad ica l to f r u s t r a t e efforts aiming at an homogeniza t ion of d a t a . The purpose of t h i s pape r is f i rs t of all to d i scuss t h e most impor t an t c a u s e s of d i s c r epancy among t h e v a r i o u s censuse s adminis te red in I t a ly and to formula te ways of ad jus t ing d a t a to e l imina te such causes , whenever poss ib le . In t h e p rocess of so doing, impor t an t i n s i g h t s a re gained which can help to i n t e r p r e t t h e r e s u l t s , t h e most r e l e v a n t of which will be s e l ec t ive ly commented upon in t h e l a s t s ec t ion of t he paper .
C) Address all communicat ions to: Vera Zamagni, Unive r s i t à Degli S tudi di Bologna, Dipar t imento di Scienze Economiche, Via Boldrini, 6, 1-40126 Bologna, I t a ly . '
37
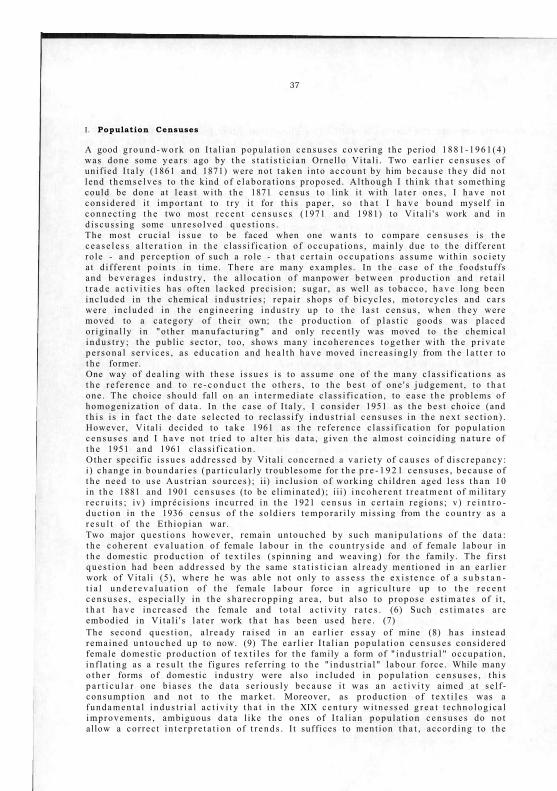
I. Population Censuses
A good g r o u n d - w o r k on I t a l i an popu la t ion c e n s u s e s cover ing t h e per iod 1 8 8 1 - 1 9 6 1 ( 4 ) was done some y e a r s ago by t h e s t a t i s t i c i a n Ornello Vi ta l i . Two e a r l i e r c e n s u s e s of uni f ied I t a ly (1861 and 1871) were no t t a k e n in to a c c o u n t by him b e c a u s e t h e y did no t lend t h e m s e l v e s to t h e kind of e l a b o r a t i o n s proposed. Al though I t h i n k t h a t someth ing could be done a t l e a s t wi th t h e 1871 census to l ink i t wi th l a t e r ones , I h a v e no t cons ide red i t i m p o r t a n t to t r y i t for t h i s paper , so t h a t I h a v e bound myself in c o n n e c t i n g t h e two most r e c e n t c e n s u s e s (1971 and 1981) to Vi ta l i ' s work and in d i s c u s s i n g some u n r e s o l v e d q u e s t i o n s . The most c ruc ia l i s sue to be faced when one w a n t s to compare c e n s u s e s i s t h e c e a s e l e s s a l t e r a t i o n in t h e c l a s s i f i ca t ion of occupa t i ons , main ly due to t h e d i f fe ren t ro le - and pe rcep t ion of such a role - t h a t c e r t a i n o c c u p a t i o n s a s sume wi th in soc ie ty a t d i f f e ren t po in t s in t ime. There a r e many examples . In t h e case of t h e foodstuffs and b e v e r a g e s i n d u s t r y , t h e a l loca t ion of manpower be tween p roduc t ion and r e t a i l t r a d e a c t i v i t i e s h a s of ten lacked prec is ion; sugar , a s well a s tobacco , h a v e long been inc luded in t h e chemical i n d u s t r i e s ; r epa i r shops of b icyc les , motorcyc les and ca r s were inc luded in t h e eng inee r ing i n d u s t r y up to t h e l a s t c e n s u s , when t h e y were moved to a ca t egory of t h e i r own; t h e p roduc t ion of p l a s t i c goods was p laced o r ig ina l ly in "o ther manufac tu r ing" and only r e c e n t l y was moved to t h e chemical i n d u s t r y ; t h e publ ic sec to r , too, shows many i ncohe r e n c e s t o g e t h e r wi th t h e p r i v a t e p e r s o n a l s e r v i c e s , a s educa t ion and h e a l t h h a v e moved i n c r e a s i n g l y from t h e l a t t e r to t h e former. One way of dea l ing with t h e s e i s s u e s is to assume one of t h e many c l a s s i f i c a t i ons as t h e r e f e r ence and to r e - c o n d u c t t h e o t h e r s , t o t h e b e s t o f one ' s j udgemen t , t o t h a t one . The choice should fall on an i n t e r m e d i a t e c l a s s i f i ca t ion , to e a s e t h e problems of homogeniza t ion of d a t a . In t h e case of I t a ly , I cons ider 1951 as t h e b e s t choice (and t h i s i s i n fac t t h e d a t e s e l ec t ed to rec lass i fy i n d u s t r i a l c e n s u s e s i n t h e n e x t s e c t i o n ) . However, Vi ta l i decided to t a k e 1961 as t h e r e fe rence c l a s s i f i ca t ion for popu la t i on c e n s u s e s and I h a v e not t r i ed to a l t e r h is d a t a , g iven t h e a lmost co inc id ing n a t u r e of t h e 1951 and 1961 c l a s s i f i ca t ion . O the r specif ic i s s u e s a d d r e s s e d by Vital i concerned a v a r i e t y of c a u s e s of d i s c r epancy : i ) c h a n g e in b o u n d a r i e s ( p a r t i c u l a r l y t roublesome for t h e p r e - 1 9 2 1 c e n s u s e s , b e c a u s e of t h e need to use A u s t r i a n sources ) ; ii) inc lus ion of working ch i ld ren aged l e s s t h a n 10 in t h e 1881 and 1901 c e n s u s e s ( to be e l imina ted) ; iii) i n c o h e r e n t t r e a t m e n t of mi l i t a ry r e c r u i t s ; iv) impréc is ions incur red in t h e 1921 c e n s u s in c e r t a i n r eg ions ; v ) r e i n t r o duc t ion in t h e 1936 c e n s u s of t h e so ld ie rs t empora r i ly miss ing from t h e c o u n t r y as a r e s u l t of t h e E th iop ian war. Two major q u e s t i o n s however , remain u n t o u c h e d by such m a n i p u l a t i o n s of t h e d a t a : t h e c o h e r e n t e v a l u a t i o n of female l abour in t h e c o u n t r y s i d e and of female l abou r in t h e domest ic p roduc t ion of t e x t i l e s ( sp inn ing and weaving) for t h e family. The f i r s t q u e s t i o n had been add re s sed by t h e same s t a t i s t i c i a n a l r e a d y men t ioned in an e a r l i e r work of Vi ta l i (5), where he was able no t only to a s s e s s t h e e x i s t e n c e of a s u b s t a n t i a l u n d e r e v a l u a t i o n of t h e female l abour force in a g r i c u l t u r e up to t h e r e c e n t c e n s u s e s , e spec ia l ly in t h e sha rec ropp ing a r e a , b u t a l so to propose e s t i m a t e s o f i t , t h a t h a v e i n c r e a s e d t h e female and t o t a l a c t i v i t y r a t e s . (6) Such e s t i m a t e s a r e embodied in Vi ta l i ' s l a t e r work t h a t h a s been used h e r e . (7) The second ques t i on , a l r e a d y ra i sed in an e a r l i e r e s s a y of mine (8) h a s i n s t e a d remained u n t o u c h e d up to now. (9) The e a r l i e r I t a l i a n p o p u l a t i o n c e n s u s e s cons ide red female domest ic p roduc t ion of t e x t i l e s for t h e family a form of " i n d u s t r i a l " occupa t ion , i n f l a t i n g as a r e s u l t t h e f igures re fe r r ing to t h e " i n d u s t r i a l " l abou r force. While many o t h e r forms of domest ic i n d u s t r y were a lso inc luded in popu l a t i on c e n s u s e s , t h i s p a r t i c u l a r one b i a se s t h e d a t a s e r ious ly b e c a u s e i t was an a c t i v i t y aimed a t se l f -consumpt ion and no t to t h e marke t . Moreover, as p roduc t ion of t e x t i l e s was a f u n d a m e n t a l i n d u s t r i a l a c t i v i t y t h a t i n t h e XIX c e n t u r y w i tne s sed g r e a t t echno log ica l improvemen t s , ambiguous d a t a l ike t h e ones of I t a l i an popu la t ion c e n s u s e s do no t allow a co r rec t i n t e r p r e t a t i o n of t r e n d s . I t suff ices to ment ion t h a t , accord ing to t h e

38
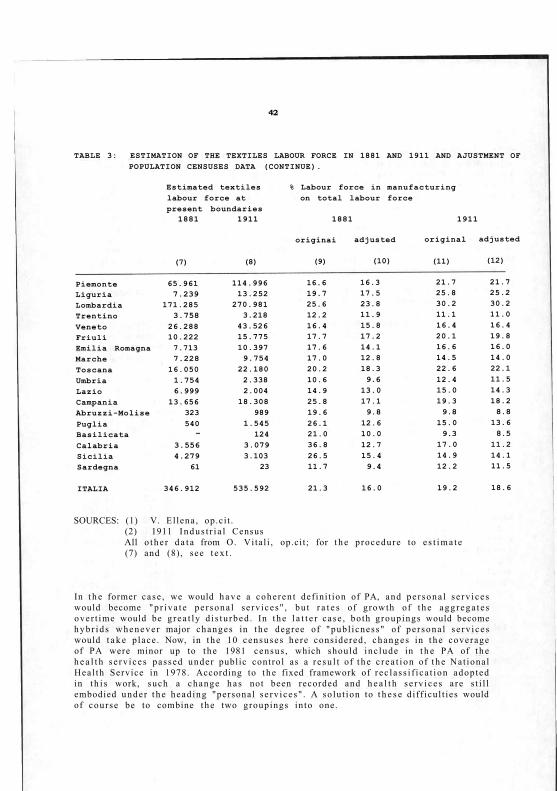
or ig ina l d a t a , t h e t e x t i l e s labour force declined from 1.337.108 u n i t s in 1881 to 783.253 u n i t s in 1901 , to r each 673.968 u n i t s in 1911 (a t t h e b o u n d a r i e s of t h e t ime, t h a t did no t change in t h i s per iod) . This in p resence of a s i zeab le boom in t h e co t ton and wool i n d u s t r i e s in t h e two decades a f te r t he i n t roduc t ion of t h e p r o t e c t i v e ta r i f f in 1887, boom t h a t is po r t r ayed in t ab l e 1. Between 1876 and 1911, co t ton sp ind les i nc r ea sed more t h a n 5 t imes and co t ton looms t h a n 10 t imes ; be tween 1876 and 1907, wool sp ind le s a lmost doubled and wool looms increased by 50%. I t is t r u e t h a t be tween 1876 and 1904, s i lk sp ind les ha lved and silk bas ins dec reased by 25% - which a re c lear s igns of t h e e x h a u s t i o n of t h e silk wave in sp i t e of t h e doubl ing of s i lk looms - bu t t h i s could not cause by i t se l f t h e enormous fall in t h e t e x t i l e l abour force r evea l ed by popu la t ion c e n s u s e s . The same d a t a assembled in t ab l e 1 shows qu i t e c lear ly , a l r e a d y in 1876, t h e g e o g r a phica l po la r i za t ion of t h e t e x t i l e i n d u s t r y : silk was c o n c e n t r a t e d in Lombardia, co t ton in Lombard ia -P iemonte and wool in P i emon te -Vene to . Almost no mach ine ry ex i s t ed in t h e South , wi th t h e except ion of Campania. To propose an ad jus tment of popula t ion censuses d a t a re fe r r ing to t h e t e x t i l e i n d u s t r y , I h a v e explored t h e r e l a t ion between popula t ion and i n d u s t r i a l c e n s u s e s over a long period of t ime. The r e s u l t s a re assembled in t a b l e 2. I t can be seen t h a t from t h e 1930s onwards t h e r e i s a s t a b l e r e l a t i onsh ip of t h e t y p e : i n d u s t r i a l c e n s u s / p o p u la t ion census JS 90%, while in t h e period before t h e 1st World War t h e r e l a t i o n s h i p did no t ex i s t . I t must be ment ioned t h a t t he two i n d u s t r i a l s u r v e y s before 1911 were not c e n s u s e s , b u t t h e y were qu i t e a c c u r a t e in te rms of inc lud ing t r u l y " i n d u s t r i a l " u n i t s and t h e i r r e s u l t s agree with all t h e q u a l i t a t i v e l i t e r a t u r e a v a i l a b l e on t h e deve lopment of t h e t e x t i l e i n d u s t r y a t t h e t ime. I h a v e the re fore decided to p roduce an e s t i m a t e of t h e " indus t r i a l " l abour force in t e x t i l e s for 1881,1901 (10) and 1911 on t h e bas i s of t h e following procedure appl ied by regions : I h a v e t a k e n 110% of t h e i n d u s t r i a l c ensus f igure , to allow for some "physiological" d i sc repancy , w h e n e v e r t h i s did no t exceed t h e popu la t ion census figure (in which case , t he l a t t e r h a s been r e t a i n e d ) . Some of t h e s t e p s of t h i s e s t ima t ing procedure h a v e been r epo r t ed in t ab l e 3 , t o g e t h e r with a few e l abo ra t i ons of t h e r e s u l t s . I t can f i r s t of al l be no t i ced t h a t t h e ad jus ted t e x t i l e labour force r i ses from 346.912 u n i t s in 1881 to 441.018 u n i t s in 1901 and 535.592 u n i t s in 1911. The adjus ted s h a r e of t h e l abour force in m a n u f a c t u r i n g by reg ions (col. 10 and 12 of t ab l e 3) appea r s more in l ine wi th wha t is expec t ed . Let me make an ex t reme example: Calabr ia was (and is) t h e poores t of all t h e I t a l i a n reg ions , wi th some t r a d i t i o n in t h e product ion of raw silk t h a t in t h e second ha l f of t h e XIX c e n t u r y was , however , dying away. (11) No twi ths t and ing , t h e popu la t i on census of 1881 r eg i s t e r ed 224.002 employees in t e x t i l e s , of which 99% were women. This r a i sed t h e s h a r e of employment in manufac tu r ing on t o t a l to an inc red ib le 36.8%, much more t h a n t h e 25.6% of Lombardia, and t h e a c t i v i t y r a t e s to 62.9% ( a g a i n s t an I t a l i an a v e r a g e of 52.1%)! The adjus ted f igures bring the " indus t r i a l " employment in t e x t i l e s down to only 3.519 u n i t s (a t t h e boundar i e s of t h e t ime) , which de f l a t e s t h e s h a r e of employment in manufac tu r ing to 12.7% and t h e a c t i v i t y r a t e to 45.6%. We c a n n o t conclude , however , t h a t t he procedure used in t ab l e 3 y i e lds an implici t e s t i m a t e of reg iona l domest ic employment in t e x t i l e s , because i t i s v e r y l ike ly t h e case t h a t d i f fe ren t a r e a s of t h e coun t r i e s gave dif ferent answer s to t h e q u e s t i o n s of t h e popu la t ion s u r v e y , as it is s t rong ly sugges ted by an i n spec t ion of coll. 3 and 4 of t a b l e 3, and more women might h a v e been sp inning and weav ing at home in Lombardia t h a n t h e popu la t ion census in fact r evea led .
P a r t i c u l a r l y r emarkab le i s t h a t t he adjus ted f igures cance l t h e p r e v i o u s l y inexp l icab le fal l in i n d u s t r i a l a c t i v i t y between t h e 1881 and 1901 c e n s u s e s , a fall t h a t was p r a c t i c a l l y completely due to t h e behav iou r of t e x t i l e s and , being c o n c e n t r a t e d in t h e s o u t h , had induced some wr i te r s to t a lk of "de indus t r i a l i z a t i on" of t h e South . I t is now poss ib le to say t h a t i t was not a process of " d e i n d u s t r i a l i z a t i o n " t h a t took place b u t a g r a d u a l d i s a p p e a r a n c e of domestic i ndus t ry s u p p l a n t e d by foreign t e x t i l e s a t f i r s t and t h e n by t h e t e x t i l e s of n o r t h e r n i ndus t ry . (12)

TABLE 1: DATA ON THE MACHINERY EMPLOYED IN THE ITALIAN TEXTILE INDUSTRY, 1876-1911
SILK 1876 1904
number of / J t. number of basins spindles looms basins K 1 spindles looms (1) (2) (3) (4) (5) (6)
Piemonte/Val 17 427 357.038 828 7 .533 154 822 947 d'Aosta Liguria 390 12.660 34 64 1 170 -Lombardia 38 881 1.637.961 6.549 37 .746 786 190 14.697 Veneto 14 729 54.067 74 11 .048 10 880 105 Emilia-Romagna 1 717 3.422 53 - -Marche 2 776 6.264 - 2 . 4 2 6 { a ) - 20 Toscana 2 414 2.460 73 1 .606 - 48 Umbria 368 - - ... - -Lazio 85 12 65 - - -Campania 341 8.293 271 Abruzzi Molise 56 - -Puglia - - - 1 .474 1 250 345 Basilicata - - -Calabria 3 071 150 16 Sicilia 781 841 96 342 - -Sardegna - - - ... - -
ITALIA 83 036 2.083.168 8.059 63 .151 954 312 16.162
(a)
COTTON
1876 1911 number of number of
spindles looms spindles looms (7) (8) (9) (10)
Piemonte/Val 310.174 3.790 1.253.400 30.400 d'Aosta Liguria 130.500 2.048 193.800 6.100 Lombardia 208.434 4.125 2.206.400 93.100 Veneto 37.040 513 551.600 6.350 Emilia-Romagna 350 170 23.300 . 1.000 Marche - - 28.600 ( a ) 300 Toscana 350 86 49.100 4.100 Umbria - ... ... Lazio - 2 - 50 Campania 85.556 1.514 Abruzzi Molise - -Puglia - 40 26.300 4.150 Basilicata - -Calabria - -Sicilia - 160 15.500 200 Sardegna - - - -
ITALIA 715.304 12.478 4.582.000 145.780
NOTES: (a) including Umbria (b) all these regions together had 17.355 spindles, or 3.5% of the total (c) all these regions together had 1.602 looms, or 12.8% of the total (d) 1913

TABLE 1: DATA ON THE MACHINERY EMPLOYED IN THE ITALIAN TEXTILES INDUSTRY, 1876-1911 (CONTIN.)
NOTES: (a) inc luding Umbria (b) al l t h e s e regions t oge the r had 17.355 sp ind le s , or 3.5% of t h e t o t a l (c) all t h e s e regions t oge the r had 1.602 looms, or 12.8% of t h e t o t a l (d) 1913
SOURCES: O. Vita l i , op.ci t . ; V. Zamagni, Indus t r i a l i zzaz ione e squ i l ib r i reg iona l i in I t a l i a , Bologna, Il Mulino, 1978; M. Romani, S tor ia economica d ' I t a l i a nel secolo XIX, v. II, Milano, Giuffre, 1976; V. El lena , "La s t a t i s t i c a di a lcune i n d u s t r i e i t a l i ane" , in: Annal i di S t a t i s t i c a , 2nd s e r i e s , v. 13, Rome, 1880.
Table 2: DATA ON THE TEXTILE INDUSTRY 1876-1981 (at the boundaries of the time)
Industrial Census Population Census (l)/(2) X 100 (1) (2) (3)
1876/1881 295.700 1.337.108 22 1903/1901 408.404 783.253 52 1911 508.076 673.968 75 1927/1931 645.358 704.674 92 1937-39/1936 604.556 662.440 91 1951 650.866 726.475 90 1961 598.565 665.075 90 1971 541.030 631.373 86 1981 493.470 561.268 88
SOURCE: I n d u s t r i a l and popula t ion censuses ; for 1876, V. El lena , op.ci t ; for 1903 MAIC, Riassun to delle not iz ie su l le condizioni i n d u s t r i a l i del Regno Roma 1906, p a r t III.

41
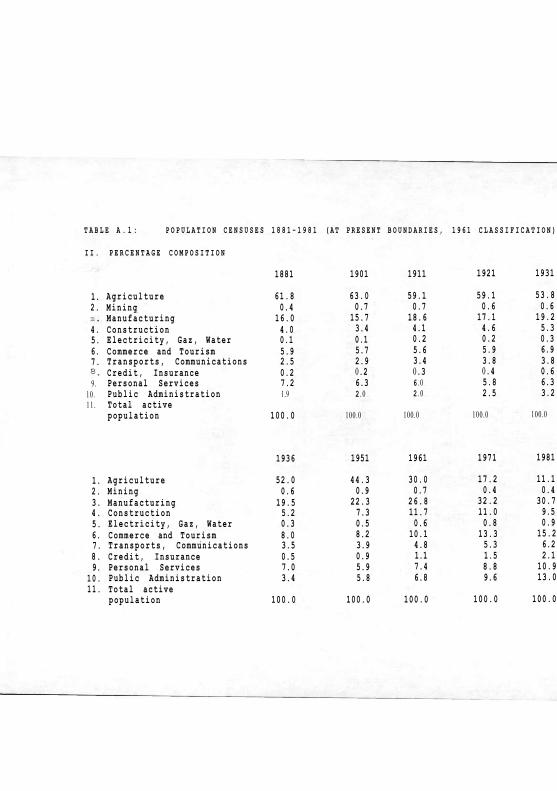
Tab le s A.l - A.6 of t h e Appendix repor t s ec to ra l f igures embodying al l the described a d j u s t m e n t s a t t h e n a t i o n a l l eve l for t h e 10 popu la t ion c e n s u s e s be tween 1881 and 1981 (in 1891 no c e n s u s was t a k e n ) and a t t he reg iona l l eve l for t h e 1881 , 1911, 1936, 1961 and 1981 c e n s u s e s . Out of t h e 10 s ec to r s cons idered , p e r h a p s t h e l a s t two, named r e s p e c t i v e l y "persona l s e r v i c e s " and "public a d m i n i s t r a t i o n " a r e t h e l e a s t c o h e r e n t . The r a t i o n a l e of t h e grouping "public admin i s t r a t ion" should be t h a t of i nc lud ing al l the publ ic ly suppl ied pe r sona l s e r v i c e s . However, as t h e cove rage of publ ic s erv ices changed over t ime, t h e dilemma faced by anybody who t r i e s to homogenize census f igures i s e i t h e r to s t i ck to t h e def in i t ion and inc lude in PA e n t i r e s e c t o r s previously l i s t ed u n d e r p e r s o n a l s e r v i c e s wheneve r t hey fall u n d e r publ ic con t ro l or to a s sume t h e de f in i t ion of PA e x i s t i n g at t h e re fe rence c e n s u s ( in t h i s c a s e 1961) and keep in PA only t h o s e s e c t o r s t h a t were public a t such d a t e . (13)
TABLE 3: ESTIMATION OF THE TEXTILES LABOUR FORCE IN 1881 AND 1911 AND AJUST-MENT OF POPULATION CENSUSES DATA.
Industrial Employment in textiles
1876 1911
(1) (2)
% Industrial Employment on population census employment
1876/1881 1911/1911
(3) (4)
Textiles labour force at present boundaries (Vitalis Data)
1881 1911
(5) (6)
Piemonte 58.924 107.026 84.8 93.4 70.698 114.996 Liguria 6.421 11.765 32.7 67.8 20.107 17.763 Lombardia 152.205 268.282 70.0 99.0 222.448 270.981 Trentino - - - - 4.698 3.575 Veneto 27.421 51.646 67.6 90 .1 35.381 43.526 Friuli - - - - 12.777 17.528 Emilia Romagna 6.285 8.905 11.9 47.1 58.875 20.071 Marche 6.323 8.846 19.0 68.1 34.583 13.023 Toscana 13.802 20.359 33.1 64.0 44.093 31.505 Umbria 1 .731 2.207 33.3 35 .9 4.792 5.920 Lazio 1.780 1.236 28.5 21.8 22.290 8.351 Campania 12.926 17.435 7.5 44 .5 164.532 37.440 Abruzzi-Molise 302 966 0.4 9.7 80.633 9.331 Puglia 478 1.376 0.4 8.0 135.105 17.554 Basilicata - 114 - 5.0 37.068 2.262 Calabria 3.199 2.814 1.4 5.6 222.240 50.475 Sicilia 3.848 2.807 2.0 16.8 194.510 16.775 Sardegna 55 22 0.8 1.0 7.605 2.312
ITALIA 295.700 505.806 22.1 75.0 1.372.435 683.388
SOURCES: (1) V. Ellena, op.cit. (2) 1911 Industrial Census All other data from 0. Vitali, op.cit; for the procedure to estimate (7) and (8), see text.
42
TABLE 3: ESTIMATION OF THE TEXTILES LABOUR FORCE IN 1881 AND 1911 AND AJUSTMENT OF POPULATION CENSUSES DATA (CONTINUE).
Estimated textiles % Labour force in manufacturing labour force at on total labour force present boundaries
1881 1911 1881 1911
originai adjusted original adjusted
(7) (8) (9) (10) (11) (12)
Piemonte 65.961 114.996 16.6 16.3 21.7 21.7 Liguria 7.239 13.252 19.7 17.5 25.8 25.2 Lombardia 171.285 270.981 25.6 23.8 30.2 30.2 Trentino 3.758 3.218 12.2 11.9 11.1 11.0 Veneto 26.288 43.526 16.4 15.8 16.4 16.4 Friuli 10.222 15.775 17.7 17.2 20.1 19.8 Emilia Romagna 7.713 10.397 17.6 14.1 16.6 16.0 Marche 7.228 9.754 17.0 12.8 14.5 14.0 Toscana 16.050 22.180 20.2 18.3 22.6 22.1 Umbria 1.754 2.338 10.6 9.6 12.4 11.5 Lazio 6.999 2.004 14.9 13.0 15.0 14.3 Campania 13.656 18.308 25.8 17.1 19.3 18.2 Abruzzi-Molise 323 989 19.6 9.8 9.8 8.8 Puglia 540 1.545 26.1 12.6 15.0 13.6 Basilicata - 124 21.0 10.0 9.3 8.5 Calabria 3.556 3.079 36.8 12.7 17.0 11.2 Sicilia 4.279 3.103 26.5 15.4 14.9 14.1 Sardegna 61 23 11.7 9.4 12.2 11.5
ITALIA 346.912 535.592 21.3 16.0 19.2 18.6
SOURCES: (1) V. El lena , op.ci t . (2) 1911 Indus t r i a l Census All o t h e r d a t a from O. Vita l i , op.cit ; for t h e p rocedure to e s t i m a t e (7) and (8), see t e x t .
In t h e former case , we would h a v e a coheren t def in i t ion of PA, and pe r sona l s e rv i ce s would become "p r iva t e pe r sona l se rv ices" , bu t r a t e s of growth of t h e agg rega t e s over t ime would be g r ea t l y d i s tu rbed . In t h e l a t t e r case , bo th groupings would become h y b r i d s wheneve r major changes in t h e degree of "publ icness" of pe r sona l s e rv i ce s would t a k e p lace . Now, in t h e 10 censuse s he re cons idered , changes in t h e coverage of PA were minor up to t h e 1981 census , which should inc lude in t h e PA of t h e h e a l t h s e rv i ce s passed unde r public control as a r e s u l t of t h e c r e a t i o n of t h e Nat iona l Hea l th Service in 1978. According to t h e fixed framework of r ec l a s s i f i ca t ion adopted in t h i s work, such a change h a s not been recorded and h e a l t h s e r v i c e s a re s t i l l embodied unde r t h e head ing "personal se rv ices" . A so lu t ion to t h e s e d i f f icul t ies would of course be to combine t h e two groupings in to one.

43
TABLE 3: ESTIMATION OF THE TEXTILES LABOUR FORCE IN 1881 AND 1911 AND ADJUSTMENT OF POPULATION CENSUSES DATA (CONTINUE).
Activity Rates
1881 1911
originai adjusted originai adjusted
(13) (14) (15) (16)
Piemonte 57.6 57.5 58.6 58.6 Liguria 53.0 51.5 49.8 49.4 Lombardia 59.0 57.6 54.4 54.4 Trentino 57.6 57.4 54.7 54.7 Veneto 52.2 51.8 49.4 49.4 Friuli 56.7 56.3 48.6 48.5 Emilia Romagna 56.1 53.8 53.8 53.5 Marche 60.9 57.9 54.8 54.5 Toscana 55.8 54.5 54.3 54.0 Umbria 57.9 56.4 55.1 54.5 Lazio 55.4 54.2 48.2 47.8 Campania 54.3 58.6 48.1 47.4 Abruzzi-Molise 58.0 51.7 52.8 52.2 Puglia 53.9 45.5 44.1 43.4 Basilicata 57.8 50.8 51.9 51.5 Calabria 62.9 45.6 51.2 47.9 Sicilia 49.7 43.2 38.9 38.5 Sardegna 42.9 41.8 38.6 38.3
ITALIA 55.6 52.1 50.4 50.0
SOURCES: (1) V. El lena , op.ci t . (2) 1911 I n d u s t r i a l Census All o t h e r d a t a from O. Vi ta l i , op.ci t ; for t h e p rocedure to e s t i m a t e (7) and (8), see t e x t .
II. Industrial Censuses
I n d u s t r i a l c e n s u s e s s t a r t e d in I t a ly in 1911, a l t hough , a s we h a v e s e e n in t h e p r e v i o u s p a r a g r a p h , e a r l i e r s u r v e y s of i n d u s t r i a l employment and ho r se power i n s t a l l e d in c e r t a i n b r a n c h e s of i n d u s t r y do ex i s t . A close s c r u t i n y of t h e 1911 c e n s u s t h a t I conduc ted some y e a r s ago (14) r evea l ed q u i t e c lea r ly t h a t much work had to be done before a d iac ron ic use of i n d u s t r i a l c e n s u s e s could be made. This work of h o m o g e n i z a -t ion of d a t a h a s been now accomplished by t h e wr i t e r (15) with t h e only exc lus ion of change in b o u n d a r i e s (both a t t h e n a t i o n a l and a t t h e r eg iona l l eve l ) (16 ) . I t h a s , however , been poss ib le t o e s t i m a t e t h a t , a t t h e n a t i o n a l l eve l , t h e a r e a s added t o I t a l y a f t e r t h e 1st World War accoun ted in 1927 (17) for 3.8% of t o t a l employment and t h e a r e a s s u b t r a c t e d from I t a ly a f t e r t h e 2nd World War accoun ted in 1951 (18) for 1.7% of t o t a l employment . A rough ad jus tment of t h e n a t i o n a l l y a g g r e g a t e f igures to p r e s e n t b o u n d a r i e s would t he re fo re e n t a i l t h e add i t ion of 2 .1% employment to t h e 1911 f igures and t h e s u b t r a c t i o n of 1.7% employment from t h e two i n t e r w a r c e n s u s e s , 1927 and 1 9 3 7 - 3 9 . But s e c t o r a l and reg ional (19) ad jus tmen t s a r e obv ious ly much more complex.

44
I n t e r - c e n s o r i a l changes in c lass i f i ca t ion of p rofess ions h a v e been e l imina ted a long t h e l i nes of wha t h a s been done for popu la t ion c e n s u s e s , t h e 1951 c l a s s i f i ca t ion being t a k e n as t h e re fe rence with minor ad jus tmen t s as a l r e a d y ment ioned . A problem h a s a r i s e n wi th t h e 1911 c e n s u s , because of i t s r equ i r emen t of s u r v e y i n g only u n i t s wi th two or more people a c t i v e in i t . This r equ i remen t , e v i d e n t l y i n t roduced to avoid t h e inc lus ion of domest ic work, was not r e t a i n e d in t h e s u b s e q u e n t c e n s u s e s , which c a u s e s some degree of incomparab i l i ty . An effort to dea l wi th t h i s problem h a s been made only a t t h e n a t i o n a l l eve l , adding an e s t ima te , produced on t h e bas i s o f l a t e r c e n s u s e s , of s ec to r a l employment in u n i t s with only one worker (see t a b l e A.7, 1911 (b)) . As a n t i c i p a t e d in t h e in t roduc t ion , i n d u s t r i a l c e n s u s e s s u r v e y e d t h e a c t u a l l abour force employed a t t h e d a t e of t h e s u r v e y (20) in i n d u s t r y and c ra f t s , d i s r ega rd ing u n e m ployment and all domestic employment even when produc t ion was no t for s e l f - c o n sumpt ion , bu t for c l i en t s , shops or firms. They g ive , t he re fo re , a much cohe ren t p i c t u r e of t h e evo lu t ion of - " i n d u s t r i a l " - employment proper t h a n popu la t ion c e n s u s e s do - in s p i t e of t h e ad jus tmen t s t h a t we h a v e in t roduced in t h e p reced ing p a r a g raph - at l e a s t up to 1981. To b e t t e r i l l u s t r a t e t h i s s t a t e m e n t and to gain some fu r the r i n s i g h t s on t h e n a t u r e of t h e popu la t ion c e n s u s e s (PCs) and of t h e i n d u s t r i a l c e n s u s e s (ICs), I propose some compar isons be tween t h e two. I t must be ment ioned in t h i s connec t ion t h a t t h e r e a re two ca se s in which ICs and PCs were not t a k e n at t h e same t ime and bo th happen to be in t h e i n t e rwa r y e a r s . Moreover, t h e second of t h e i n t e r w a r ICs was s t r e c h e d over t h r e e y e a r s - 1 9 3 7 - 3 9 - a l t hough most s ec to r s were s u r v e y e d in 1938, (21) and aimed a t recording employment a t t h e d a t e in which i t was s e a s o n a l l y h i g h e s t . The PC/IC comparabi l i ty for t h e i n t e r w a r - y e a r s is , t he re fo re , imperfect , p a r t i c u l a r l y for c e r t a i n s ec to r s , as we sha l l see l a t e r . The f i r s t comparison proposed h a s been worked out in t a b l e 4 . I t can be seen t h a t t h e coverage of PCs and ICs with r e l a t i on to t h e manufac tu r ing s ec to r s t e a d i l y conve rges , with only one case ou t of t r end , namely t h e 1 9 3 7 - 3 9 IC t h a t , as expec ted , is t he re fo re confirmed to h a v e been a more i nc lus ive census . I t is a l so poss ib le to show t h a t t h e sec to r s r e spons ib le for most of t h e d i sc repancy be tween PCs and ICs a r e p rec i se ly t h o s e where domest ic l abour and underemployment were more widespread . This can be seen in t ab l e 5, where t e x t i l e s , me ta l lu rgy (with t h e excep t ion of 1911), eng inee r ing , chemicals , b r i c k s - g l a s s - c e m e n t p roduc t ion show a h igh degree of c o i n c i dence be tween PCs and ICs. while c lo th ing , l e a t h e r and f u r n i t u r e show a v e r y low in i t i a l degree , though s t e a d i l y inc reas ing over t ime up to t h e 1981 c e n s u s , when t h e y converge towards a common p a t t e r n . (22) A spec ia l case is r e p r e s e n t e d by c o n s t r u c t i o n , where t h e d i sc repancy be tween PC and IC was enormous in 1911, bu t remained ve ry high a lso l a t e r . Beside t h e u s u a l , f a c t o r s of "domest ic" l abour (here r e p r e s e n t e d by s ingle workers doing mainly a p a r t m e n t s r epa i r s ) and of t empora ry
TABLE 4: SHARE OF ACTIVE POPULATION IN MANUFACTURING ACCORDING TO PC AND IC
IC (1)
PC (2)
(IC/PC) x 100 (3)
1911 1927/1931 1937-39/1936
12.7 14.2 16.7 17.3 22.5 28.1 29.8
18.6 19.2 19.5 22.3 26.8 32.2 30.7
68 74 86 78 84 87 97
1951 1961 1971 1981
SOURCES: TABLES A.l and A.7, with boundaries made compatible whenever needed.

45
TABLE 5: SELECTED SECTORIAL COMPARISONS BETWEEN ICs AND PCs (IC/PC x 100 SELECTED DATES)
employment , o t h e r c a u s e s of d i sc repancy could be a widespread "black economy" , bo th in t h e form of i l legal s u b c o n t r a c t i n g t h a t permi t s firms to n o t dec l a r e p a r t of t h e i r workers and in t h e form of small a r t i s a n u n i t s no t dec l a r ing h e l p e r s . As i t was done for popu la t ion c e n s u s e s , I h a v e co l lec ted in a t a b l e of t h e Appendix ( t ab l e A.7) t h e r e s u l t s of al l t h e e l a b o r a t i o n s performed on t h e s e v e n i n d u s t r i a l c e n s u s e s o f unif ied I t a ly a t t h e n a t i o n a l l eve l , while four a d d i t i o n a l t a b l e s ( A . 8 -A . l l ) r epo r t r eg iona l b reakdowns for t h e 1911 ,1937/39 , 1961 and 1981 c e n s u s e s . The r ig id i ty of t h e 1951 re fe rence c lass i f i ca t ion does no t a p p e a r to h a v e produced much d i s loca t ion in t h e s e c t o r a l a g g r e g a t e s excep t for one c a s e . The p roduc t ion of p l a s t i c goods was p laced in 1951 in to "o ther manufac tu r ing" , be ing a small b r anch of u n c e r t a i n a f f i l i a t ion . I t t h e n became firmly connec ted wi th t h e chemical i n d u s t r y and i t i n c r e a s e d s u b s t a n t i a l l y , up to becoming in 1981 a b o u t 2% of t o t a l employment in m a n u f a c t u r i n g . I t s inc lus ion in o t h e r manufac tu r ing i n f l a t e s u n d u l y t h i s agg rega t e , whi le i t r e s t r i c t s t h e chemical i n d u s t r y ' s s h a r e of employment .
III. A Century of Change: The Unbalanced Pattern of Modernization of Italy
The c e n t u r y e lapsed be tween 1881 and 1981 did no t w i t n e s s a l a rge i n c r e a s e in t h e I t a l i a n l abour force (a t c o n s t a n t bounda r i e s ) , only 1/3 l a r g e r a t t h e end of t h e per iod, wi th p r a c t i c a l l y all t h e i n c r e a s e t a k i n g p lace in t h e f i r s t 50 y e a r s . This i s due to a no t too f a s t i n c r e a s e in popu la t ion (i t l e s s t h a n doub led) , coupled wi th a dec l ine in a c t i v i t y r a t e s , slow a t t h e beginning , rapid be tween 1936 and 1971 , wi th some s l igh t s ign of i n v e r s i o n of t h e t r end in 1981 (due to a h ighe r women p a r t i c i p a t i o n r a t e ) (see t a b l e A . l ) . The s e c t o r a l b reakdown of t h i s l abour force, i n s t e a d , changed d rama t i ca l l y , a l t hough much of t h i s change a p p e a r s c o n c e n t r a t e d in t h e second ha l f of t h e per iod. Ce r t a in ly t h e most impress ive fac tor of t h e change h a s been t h e s h r i n k i n g of t h e l abour force in a g r i c u l t u r e from 6 2 - 6 3 % of t h e a c t i v e popu la t ion to 11%. This , accompanied by a g r e a t l y i nc r ea sed o u t p u t of t h e sec to r , g ives an impress ive measu re no t only of t h e t echno log ica l improvement , bu t of t h e g r e a t amount of underemployment t h a t h a s
1911 1937-39/1936 1951 1961 1981
Textiles Metallurgy Engineering Chemicals Bricks, glass, etc.
75 52
1 1 7 ( a ) 82
91 77
100 98 84
90 81 76 90 85
90 83 82
1 0 9 ( a )
88 97 93
1 0 8 ( a )
Clothing Leather Furniture
29 46 56
50 60 63
55 65 63
62 77 72
96 1 0 1 ( a )
92
Construction 19 54 36 38 66
SOURCES: My e l a b o r a t i o n s from O. Vita l i , Aspe t t i e t c . , c i t . , Tab le A.7 and t h e 1981 Popula t ion Census .
NOTE: (a) These i n c o h e r e n t f igures a r e due to impréc i s ions in t h e inc lus ion of workers in t h e comparable c a t e g o r i e s .

46
a lways ex i s t ed in I t a l i an ag r i cu l t u r e up to r e c e n t t imes . The downward t r e n d of a g r i c u l t u r a l employment proceeded in i t i a l ly by two s t e p s , one be tween 1901 and 1911, co r respond ing to t he boom in manufac tu r ing of t h e "Giol i t t ian era" , and t h e second be tween 1921 and 1931, implying an expans ion in p r a c t i c a l l y al l o t h e r s e c t o r s (with t h e excep t ion of manufac tu r ing , t h a t had to r ecover from a t empora ry r eg res s ion in 1921). I t l a t e r con t inued wi thou t i n t e r r u p t i o n s a t much f a s t e r r a t e s t h a n before 1931.
The expans ion of manufac tu r ing is no t so eas i ly dep ic ted . According to popu la t ion c e n s u s e s , a f te r t he boom of t h e f i rs t decade of t h e XXth c e n t u r y and t h e regress ion in 1921 , t h e r e a p p e a r s to be a n o t h e r jump forward be tween 1936 and 1951 , followed by an u n i n t e r r u p t e d i nc rea se up to 1971 and t h e n by a fall from 32.2% to 30.7% of t h e l abour force. I ndus t r i a l c e n s u s e s , however ( t ab le A.7), t e l l t h a t t h e i n c r e a s e in i n d u s t r i a l employment proper h a s been con t inuous from a round 13% of t h e a c t i v e popu la t i on in 1911 to 30% in 1981, ind ica t ing t h a t t h e f ac to r s r e spons ib l e for d i s t u r bing such a s t e ad i l y upward t r end in t h e popula t ion c e n s u s e s a r e to be ident i f ied in domest ic labour , unemployment and underemployment r a t h e r t h a n in more s t r u c t u r a l c a u s e s . The r a t e of expans ion of manufac tu r ing employment , in a n y case , a p p e a r s to h a v e been f a s t e r be tween 1951 and 1971 also in t h e i n d u s t r i a l c e n s u s e s . S t ick ing to t h e i n d u s t r i a l c ensuse s to a n a l y s e t h e composi t ion of manufac tu r ing employment , we can f i rs t of all obse rve t h a t t e x t i l e s r emained t h e most impor t an t b r anch of i n d u s t r y only up to t h e 1929 c r i s i s , while eng inee r ing , t h e second b ranch up to t h e n , r eached 25% of manufac tu r ing employment a l r e a d y in 1938 and t h e n con t inued to grow up to as much as 40% in 1981. If we add t h e s h a r e of employment in me ta l lu rgy , t h a t more t h a n doubled from 1.9% to 4.3% we h a v e in 1981 almost half of t h e manufac tu r ing labour force engaged in meta l and mach ine ry making. The o the r b ranch of modern i n d u s t r y t h a t we expec t to h a v e grown dur ing t h i s per iod, namely chemica ls , did in fact grow, bu t s t a r t i n g from a ve ry low l eve l of 2.6%. As I h a v e a l r e a d y ment ioned , i t i s no t cor rec t to conclude t h a t i t s growth s topped in 1961, g iven t h e inc lus ion of p l a s t i c goods in o the r manufac tu r ing , bu t c e r t a i n l y i t s most rap id period of growth is to be loca ted be tween 1927 and 1961 , when i t s s h a r e in m a n u f a c t u r i n g employment more t h a n doubled. The wellknown w e a k n e s s of t h e b ranch in I t a ly compared with t h e o the r i n d u s t r i a l a c t i v i t i e s i s r e v e a l e d a lso by t h e s e gene ra l l y low employment f igures . On t h e o the r hand , t h e s h a r e of employment in t r a d i t i o n a l i n d u s t r i e s h a s decl ined, in a p a r t i c u l a r l y d r a s t i c way in t h e food and b e v e r a g e s b ranch (from 14% to 6.5%). I t might be no t iced , however , t h a t t h e decl ine in c lo th ing h a s no t been ve ry la rge , because of t h e conver s ion of such sec to r in t h e l a s t two decades to high qua l i t y product ion for t h e i n t e r n a l and foreign m a r k e t s . Coming back to popula t ion c e n s u s e s and d i s rega rd ing mining, n e v e r impor t an t in I ta ly , we can see t h a t publ ic u t i l i t i e s inc reased s t ead i ly , while c o n s t r u c t i o n shows a fall be tween 1881 and 1901, due to a se r ious cr i s i s of t h e s e c t o r t h a t produced much d i s loca t ion in t h e bank ing sec tor , t h e n s t a r t e d growing, a t a p a r t i c u l a r l y f a s t r a t e be tween 1936 and 1961, to end up with a fall in t h e l a s t decade . Here aga in if one would use t h e f igures of t h e i n d u s t r i a l census , t h e p i c t u r e would be s l i gh t ly di f ferent : a s u b s t a n t i a l i nc r ea se in t h e sec to r is loca ted in t h e ICs be tween 1927 and 1937/39 and t h e n in t h e 1950s, which makes more sense , while no fal l is r evea l ed in t h e 1970s. I t might be ment ioned in t h i s connec t ion t h a t in t h e l a s t decade t h e r e was a c t u a l l y a fall in cons t ruc t i on a c t i v i t y , which ce r t a in ly caused a fal l in t h e t o t a l l abour force a v a i l a b l e , bu t not in t h a t p a r t of t h e l abour force belonging to t h e more e s t a b l i s h e d and l a rge r firms reckoned in i n d u s t r i a l c e n s u s e s , t h a t on t h e c o n t r a r y rose 27% (23).
Some comments , f inal ly , on t h e se rv ice sec tor . Taken as a whole, t h e s e rv i ce s ec to r ' s s h a r e of t h e l abour force remained p rac t i ca l l y s t e a d y a round 17 - 18% up to 1921, i n c r e a s i n g at a r a t h e r slow pace up to 24.7% in 1951 and t h e n at a s t e a d i l y f a s t e r pace up to 47.4% - almost half of t h e l abour force - 1981 . Breaking t h e sec to r down in s u b s e c t o r s , one can see t h a t , while t r a n s p o r t a t i o n and bank ing employment shows a r a t h e r c o n t i n u o u s growth t h r o u g h o u t t h e c e n t u r y cons idered he re , (24) t h e r i se o f t he employment s h a r e of commerce- tour i sm and public a d m i n i s t r a t i o n is l a rge ly confined to

47
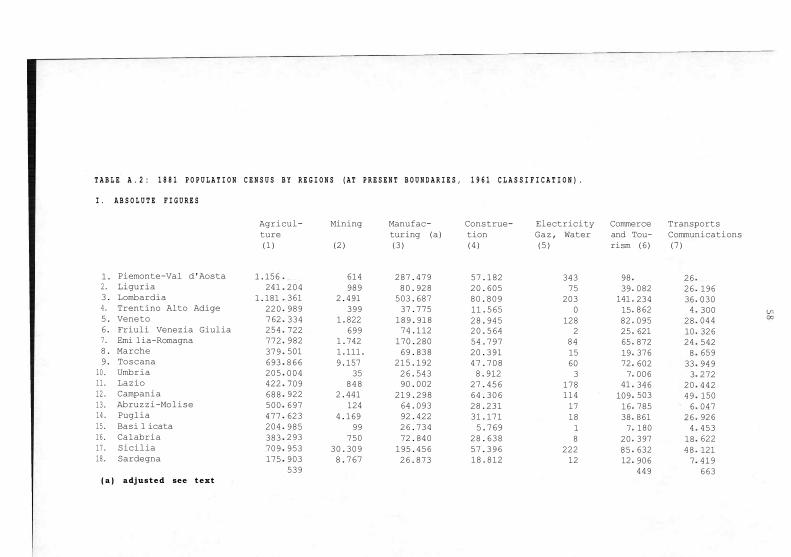
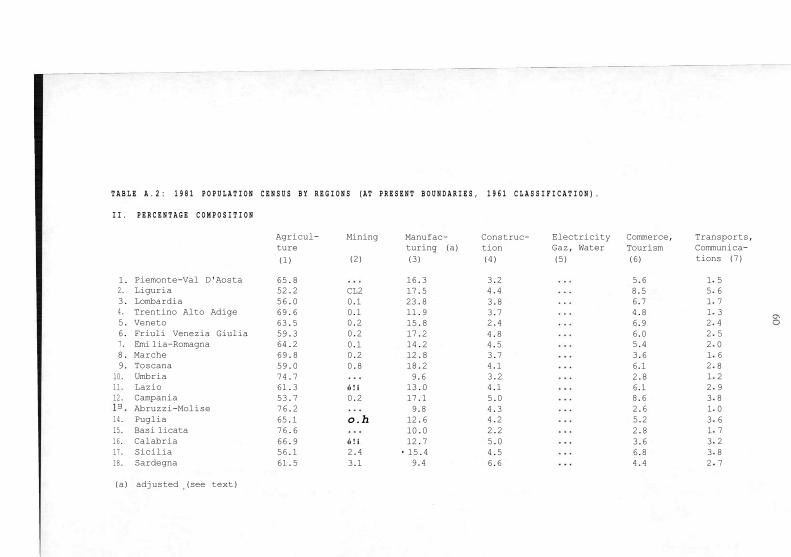
t h e pos t -Wor ld War II period, which is marked by an exp los ion of p r i v a t e consumpt ion p r e v i o u s l y v e r y compressed, and by t h e growth of t h e g o v e r n m e n t s e c t o r due to t h e diffusion of e d u c a t i o n (which is l a rge ly publ ic in I t a l y ) , t h e mu l t i p l i c a t i on of civi l s e r v a n t s (not beyond European l eve l s , however) and t h e e n l a r g e m e n t o f t h e welfare s e r v i c e s . The r a t h e r pecu l i a r b e h a v i o u r of t h e remain ing s u b s e c t o r of s e r v i c e s , namely p e r s o n a l s e r v i c e s , f l u c t u a t i n g a round 6 -7% up to 1971 and t h e n i n c r e a s i n g rap id ly , i s no t e a s i l y exp la ined a t t h i s l eve l of aggrega t ion of t h e d a t a , b e c a u s e t h e n a t u r e of p e r s o n a l s e r v i c e s h a s profoundly changed and old s e r v i c e s , l ike t h o s e offered by s e r v a n t s , h a v e been s u b s t i t u t e d by o t h e r k inds of s e r v i c e s - l a u n d r y , h a i r d r e s s i n g , b e a u t y shops - up to t h e r e c e n t boom in l e i su re s e r v i c e s coupled wi th t h e r i se of new s e r v i c e s to firms (sof tware , eng inee r ing projec ts , model l ing, a d v e r t i s i n g , and t h e l ike) (25) . The p r e v i o u s broad overv iew of t h e changes in t h e composi t ion of t h e I t a l i a n l abour force ove r t h e span of t h e l a s t 100 y e a r s would sugges t t h a t v e r y l i t t l e modern iza t ion took p lace before t h e 1930s. This conclus ion , however , h a s to be cons ide red too h a s t y for a c o u n t r y l ike I t a ly , where t h e geograph ica l po l a r i za t i on of i n d u s t r y in c e r t a i n a r e a s h a s been a l ongs t and ing f e a t u r e of economic growth . We mus t t u r n , t he re fo re , to a r eg iona l a n a l y s i s of PCs and ICs. 1881 is a good s t a r t i n g y e a r to o b s e r v e changes in t h e s t r u c t u r e of employment a t t h e reg iona l l eve l too (see t a b l e A.2). In fact , t h e reg iona l d i f f e r en t i a t i on ex i s t i ng a t t h a t d a t e i s s t i l l embryonic : Lombardia s t a n d s out a l r e a d y as h a v i n g more i n d u s t r i a l l abour force t h a n t h e a v e r a g e , Liguria more employment in commerce and t r a n s p o r t , Lazio more c iv i l s e r v a n t s (Rome), while t h e l i t t l e mining t h a t t h e r e ex i s t ed i s confined to Sici l ia ( s u l p h u r ) , Sa rdegna (zinc, lead) and T o s c a n a (marble , some iron ore in Elba i s l a n d ) . A g r i c u l t u r a l employment is p r e v a i l i n g e v e r y w h e r e : c e r t a i n reg ions show as much as 3/4 of t h e l abour force in a g r i c u l t u r e (Umbria, Abruzz i -Mol i se , Bas i l i c a t a ) ! The p i c t u r e in 1911 ( t ab l e A.3) r e v e a l s q u i t e c l ea r ly w h a t h a s h a p p e n e d meanwhi le : t h e N o r t h - W e s t a r e a o f t h e c o u n t r y (see c h a r t ) h a s a l r e a d y become t h e " i n d u s t r i a l t r i a n g l e " . Ano the r region, namely Toscana , a p p e a r s to h a v e a t t h a t d a t e a h ighe r t h a n a v e r a g e s h a r e of employment in i n d u s t r y , b u t ha l f of i t was in domest ic i n d u s t r y ( e spec ia l ly s t r aw process ing for h a t s ) , while only 1/4 of t h e employment in m a n u f a c t u r i n g of t h e i n d u s t r i a l t r i a n g l e is no t recorded in t h e IC (see t a b l e A.8), and can t h e r e f o r e be cons idered domest ic (or p r eca r i ous ) . The reg iona l b reakdown of t h e 1936 popu la t ion c e n s u s ( t a b l e A.4) , t o g e t h e r with t h e reg iona l b reakdown of t h e 1 9 3 7 - 3 9 i n d u s t r i a l c e n s u s ( t a b l e A.9) confirm t h a t no reg iona l change took p lace in t h e i n t e r w a r y e a r s , wi th t h e i n d u s t r i a l t r i a n g l e firmly e n t r e n c h e d in i t s l ead ing pos i t ion and t h e r e s t o f t h e c o u n t r y lagging beh ind , a l t hough c e r t a i n reg ions r e v e a l b e t t e r c apab i l i t i e s t h a n o t h e r r eg ions in d ive rs i fy ing from a g r i c u l t u r e . I t i s only with t h e 1961 c e n s u s (see t a b l e A.5 and A.10) t h a t someth ing new can be r e g i s t e r e d . While t h e i n d u s t r i a l t r i a n g l e a p p e a r s s t r e n g t h e n e d , wi th Liguria becoming more and more spec ia l ized in commerce - tour i sm and t r a n s p o r t , t h e i n d u s t r i a l t a k e - o f f of a l a rge p a r t of t h e N o r t h - E a s t - C e n t r e a r e a (namely Fr iu l i , Vene to , Emil ia -Romagna, Toscana ) i s an accomplished fac t . No i n d u s t r i a l s p u r t i s r e v e a l e d in t h e South where , wi th t h e excep t ion of Campania, t h e only region in t h e South t h a t h a s t r a d i t i o n a l l y m a i n t a i n e d some i n d u s t r y (cfr. a l so t h e p reced ing c e n s u s e s ) , t h e s h a r e o f m a n u f a c t u r i n g l abour force remains v e r y low. However, some d ive r s i f i c a t i on of t h e s o u t h e r n reg ions from a g r i c u l t u r e can be obse rved . Some i n t e r e s t i n g r emarks a re f ina l ly cal led for th by t h e 1981 c e n s u s e s (cfr. t a b l e s A.6 and A . l l ) . I n d u s t r y h a s become s t r o n g e r in t h e N o r t h - E a s t - C e n t r e a r ea , no t only in t h e reg ions a l r e a d y i n d u s t r i a l i z e d by 1961, bu t a l so in Marche and Umbria. The only e x c e p t i o n s remain T ren t i no , where , however , t h e r e h a s been a boom of tour ism, and Lazio, where t h e predominance of s e r v i c e s ( espec ia l ly commerce and tour ism, pe r sona l s e r v i c e s and publ ic a d m i n i s t r a t i o n ) i s overwhelming. The phenomenon of t h e i n d u s t r i a l i z a t i o n of t h e N o r t h - E a s t - C e n t r e a r e a h a s by 1981 a l r e a d y produced a v a s t amoun t of s t u d i e s where t h e t r a d i t i o n a l N o r t h - S o u t h c o n t r a s t h a s been modified in to a more complex p i c t u r e of " th ree I t a l i e s " . (26) The f i r s t - t h e i n d u s t r i a l t r i a n g l e - of

48
l o n g - s t a n d i n g i n d u s t r i a l i z a t i o n based on h e a v y i n d u s t r y and t e x t i l e s , with a p r e dominan t ly t a y l o r i s t c o rgan iza t ion of t h e labour force; t h e second - t h e N o r t h - E a s t -Cen t re - of more r ecen t i n d u s t r i a l i z a t i o n , based on l igh t i n d u s t r y and m a c h i n e - t o o l , with a decen t r a l i zed and f lexible o rgan iza t ion of l abour (27); and t h e t h i rd - t h e South - s t i l l n o n - i n d u s t r i a l , in sp i t e of t h e la rge publ ic e f for t s to improve i t s lot .
The 1981 c e n s u s e s h a v e , however , made n e c e s s a r y a qua l i f i ca t ion of t h e s e conc lus ions wi th r e fe rence to t h e South. Out of t h e s even s o u t h e r n reg ions , two - Abruzzi and Pugl ia - show, in fact , c lear s igns of hav ing progressed r emarkab ly t owards i n d u s t r i a l i za t ion . There h a s been r e c e n t l y much i n t e r e s t in t h i s "Adr ia t ic way" to i n d u s t r i a l i za t ion (28) c o n t r a s t e d with t h e s t a g n a t i o n of t h e s o u t h e r n reg ions border ing on t h e T i r r e n i a n s ea and much of i t h a s been expla ined with t h e a b s e n c e a long t h e Adr ia t i c coas t of i l legal o rgan iza t ions such as t h e Mafia. (29) I t is in a n y case an e s t a b l i s h e d fac t t h a t t h e I t a l i an South is no longer a compact ly backward a r e a : t h e combined effects of emigra t ion , government i n t e r v e n t i o n , expans ion of tour i sm, i n d u s t r i a l growth and t h e u n e v e n p resence of i l legal o rgan iza t ions h a v e def in i t e ly b roken t h e " sou the rn ques t i on" in to s e v e r a l d i f fe rent ly shaped "ques t ions" . Leaving as ide for lack of space t h e more de ta i l ed a n a l y s i s t h a t can be made of t h e reg iona l s t r u c t u r e on t h e bas i s of t a b l e s A . 8 - A . 1 1 , some gene ra l conc lus ions can now be offered. As we h a v e seen , t h e f i rs t wave of i n d u s t r i a l i z a t i o n was exper ienced by I t a ly a l r e a d y before World War I in t he i n d u s t r i a l t r i a n g l e , bu t it invo lved such a l imited a r e a of t h e coun t ry t h a t n a t i o n a l f igures were ha rd ly af fec ted .Only in t h e 1930s t h e effects of such an i n d u s t r i a l i z a t i o n s t a r t e d sp read ing to some o t h e r a r e a s of t h e coun t ry , where p r e - c o n d i t i o n s were developed for an i n d u s t r i a l s p u r t t h a t a c t u a l l y took p lace a f t e r World War II, when marke t s - domestic and foreign - became more a b s o r p t i v e . The i n d u s t r i a l i z a t i o n of t h e N o r t h - E a s t - C e n t r e in t h e 1950s and 1960s has to be accoun ted , the re fore , as t h e second wave of i n d u s t r i a l i z a t i o n in I t a ly . But i t was only by t h e n t h a t I ta ly became an " indus t r i a l " coun t ry , b e c a u s e only by t h e n a s u b s t a n t i a l a r e a of t h e coun t ry was inc luded in t h e i n d u s t r i a l ba se and n a t i o n a l f igures were c lea r ly affected. Can we also t a lk of a t h i r d wave of i n d u s t r i a l i z a t i o n now u n d e r way in t he South? I t i s too ear ly to come to t h i s conclus ion , bu t m o v e m e n t s in such a d i rec t ion h a v e become a p p a r e n t a t l e a s t in c e r t a i n a r e a s of t h e sou th .
What is c e r t a i n l y t r u e is t h a t t h e process of modern iza t ion of I t a ly h a s proceeded by s u c c e s s i v e waves over such a long s t r e t c h of t ime t h a t t h e c e n t u r y cons idered in t h i s work does not encompass i t a l l . To embody new a r e a s in to t h e m o d e r n - i n d u s t r i a l complex h a s no t been an easy t a sk , b u t n e i t h e r h a s i t been an impossible one . Regional mobil i ty h a s proved to be poss ib le , a l t hough c e r t a i n reg ions , even a f te r a c e n t u r y , do not y e t show good precondi t ions to make such a mobi l i ty an a c t u a l i t y . If one would enqu i re abou t t h e main causes for t h i s profoundly reg iona l p a t t e r n of i n d u s t r i a l growth in I ta ly , i t would be n e c e s s a r y to r e s o r t to t h e medieva l exper ience of communs and t h e s u b s e q u e n t g r ea t d ivers i f i ca t ion of c iv i l i z a t i ons in t h e d i f ferent a r e a s o f t h e c o u n t r y to ident i fy t h e s u b s t r a t u m respons ib l e for t h e h ighly d e c e n t r a l i zed and unba lanced p a t t e r n of growth observed .
NOTES
(1) A p re l iminary vers ion of t h i s paper was p r e s e n t e d at t h e workshop on t h e "History of t h e sec to ra l employment in 20 th c e n t u r y Europe", Berlin, Fre ie U n i v e r s i t ä t , 1 2 - 1 3 May, 1986. I t h a n k all t h e p a r t i c i p a n t s , and p a r t i c u l a r l y Prof. Kaelble , for t h e i r useful comments. The computing a s s i s t a n c e by Feder ico Fur lan i and Marco Dazzi is g ra te fu l ly acknowledged.

49
(2) For s o u r c e s and comments , see V. Valli , L'economia e la po l i t i ca economica I t a l i a n a dal 1945 ad oggi. E t a s Libri , Milano, 1982.
(3) Cfr. Bol le t t ino del Lavoro e del la p r e v i d e n z a soc ia le for t h e 1920s and Bol le t t ino di no t i z i e economiche. 1 9 2 8 - 1 9 3 9 .
(4) O. Vi ta l i , A s p e t t i dello sv i luppo economico i t a l i a n o a l l a luce de l la r i cos t ruz ione de l la popolaz ione . Roma, Tip. Fai l l i , 1970. Demographers h a v e no t gene ra l l y been g r e a t l y i n t e r e s t e d in t h e employment a spec t ; see e.g. M. Livi Bacci, "I f a t t o r i demografici del lo sv i luppo economico", in G. Fua (ed . ) , Lo sv i l uppo economico in I t a l i a , v. II, Milano, Franco Angeli , 1969.
(5) O. Vi ta l i , La popolaz ione a t t i v a in a g r i c o l t u r a a t t r a v e r s o i c ens imen t i i t a l i a n i , Roma^Tip . Fa i l l i , 1968.
(6) Because t h e number of "housewives" be longing to t h e n o n - a c t i v e popu la t ion has been reduced cor responding ly .
(7) No ad ju s tmen t of female l abour in a g r i c u l t u r e h a s been done for t h e 1971 and 1981 c e n s u s e s , b e c a u s e t h e i naccu racy of t h e d a t a had d i s a p p e a r e d by t h e n .
(8) V. Zamagni, " I s t ruz ione e sv i luppo economico. Il caso i t a l i a n o 1 8 6 1 - 1 9 1 3 " , in G. Toniolo (ed . ) , L'economia i t a l i a n a 1 8 6 1 - 1 9 4 0 . Bari , La t e r za , 1978. In t h i s e s s a y I proposed to d i s r ega rd all female employment in t e x t i l e s , which was obvious ly a v e r y rough ad jus tmen t , l ack ing a b e t t e r way of removing t h e d i s t o r t i o n .
(9) O. Vi ta l i re fused to cons ider t h e ques t i on r e l e v a n t , p robab ly b e c a u s e h is i n t e r e s t s were na r rowly demographica l .
(10) The r e s u l t s for 1901 h a v e only been r epo r t ed in t h i s e s s a y a t t h e n a t i o n a l l eve l .
(11) A sign of t h i s t r a d i t i o n might be seen a lso in t h e h igh s h a r e of domest ic looms r e g i s t e r e d in Ca labr ia in both t h e 1876 and 1903 s u r v e y s (see coll . 15 and 16 of t a b l e 1).
(12) As I h a v e a rgued in my a r t i c l e "Cuest ión mer id ional o c u e s t i ó n nac iona l ? Algunas c o n s i d e r a c i o n e s sobre el desequ i l ib r io reg iona l en I t a l i a con e spec ia l r e fe renc ia a los anos 1 8 6 1 - 1 9 5 0 " , in Rev i s t a de His tor ia Economica. 1987, n . l , p . 20.
(13) This i s a c t u a l l y t h e so lu t ion adop ted h e r e for cohe rence wi th t h e r e s t o f t h e work. Publ ic a d m i n i s t r a t i o n inc luded , in 1961 , bes ide c e n t r a l and local civi l s e r v i c e , army and police, publ ic educa t i on and publ ic bodies for workers i n s u r a n c e , s p o r t s and l e i su re a c t i v i t i e s .
(14) See V. Zamagni, I ndus t r i a l i z zaz ione e t c . . c i t .
(15) With t h e he lp of a co l l abora to r , who h a s r e c e n t l y pub l i shed some of t h e r e s u l t s of t h e work: cfr. R. Ch iaven t i , " I cens imen t i i n d u s t r i a l i i t a l i a n i 1 9 1 1 - 1 9 5 1 : p roced imen t i d i s t a n d a r d i z z a z i o n e " , in Riv i s ta di s t o r i a economica. 1987, n o . l .
(16) The exc lus ion is r e g r e t t a b l y due to s h o r t a g e of funds .
(17) F i r s t i n d u s t r i a l c e n s u s a f t e r World War I.
(18) F i r s t i n d u s t r i a l c e n s u s a f t e r World War II.

50
(19) Regional changes were s u b s t a n t i a l for Lazio and Campania , and of some impor t a n c e for Emil ia-Romagna, Toscana , Umbria and Abruzz i -Mol i se be tween 1921 and 1931 and for Veneto a f te r World War II, because it s u r r e n d e r e d t h e p rov ince of Udine to F r i u l i - V e n e z i a Giulia, t h a t in t u r n los t much of i t s t e r r i t o r y to Yugoslavia as a r e s u l t of war e v e n t s . Nat ional changes (a f te r 1881) took place once as a r e s u l t of World War I (acquis i t ion of T r e n t i n o - A l t o Adige and F r i u l i -Venezia Giulia) and a second time af te r World War II ( loss of p a r t of F r i u l i -Venezia Giulia, as a l r eady ment ioned) .
(20) An a c c u r a t e s t u d y h a s been made on t h e poss ib le f ac to r s of d i s to r t i on due to t he changing d a t e s o f t h e c e n s u s e s , bu t i t h a s been concluded t h a t t h e s e a s o n a l choice made was a lways qu i t e wise and produced only a marg ina l impact on t h e q u a l i t y of t h e d a t a col lected. The only excep t ion is in t h e 1937/39 c e n s u s .
(21) This r a t h e r pecu l i a r choice was jus t i f i ed with t h e decis ion of devo t ing g r e a t care to t h e s u r v e y ope ra t i ons in p resence of a s ca r c i t y of means on t h e p a r t of t h e s t a t i s t i c a l office of t h e t ime. In fact , t h i s i s t h e f i r s t I t a l i an i n d u s t r i a l census t h a t col lected d a t a no t only on employment and horse power, b u t on p roduc t ion , v a l u e added and wages as well, and was ve ry a c c u r a t e in record ing small b u s i n e s s e s (domest ic employment was, however , s t i l l exc luded) .
(22) The foodstuffs and beve rages sec to r could not be compared b e c a u s e of t h e spec ia l t r e a t m e n t r e se rved by Vital i to such a sec to r , t h a t he slimmed down cons ide rab ly , t r a n s p o r t i n g much of i t s employment in to r e t a i l t r a d e . I t can, however , be not iced , observ ing t h e sequence of employment in i n d u s t r i a l c e n s u s e s a lone , t h a t t h e procedure used in t h e 1 9 3 7 - 3 9 c e n s u s r e v e a l e d much more s e a s o n a l employment t h a n u sua l , including a t l e a s t some 130.000 e x t r a workers .
(23) More a c c u r a t e f iscal cont ro ls might also h a v e inc reased t h e number of bui ld ing firms compelled to legal ize t h e i r s t a t u s and the re fo re to dec la re t h e i r " t rue" employment l eve l s .
(24) This s t e a d y growth accompanies t h e growth in manufac tu r ing and c o n s t r u c t i o n .
(25) The a p p e a r a n c e of t h e s e new t y p e s of s e rv i ce s to firms makes t h e head ing "persona l s e rv i ce s " no t a l t o g e t h e r correc t .
(26) Th i s h a s become a common express ion s ince t he pub l i ca t ion of t h e book by A. Bagnasco, Tre I t a l i e . La problemat ica t e r r i t o r i a l e dello sv i luppo i t a l i a n o , Bologna, Il Mulino, 1977.
(27) For an i n t e r e s t i n g desc r ip t ion and i n t e r p r e t a t i o n of t h e growth of t h e "second" I t a ly , see G. Fuà and C. Zacchia (eds . ) , I ndus t r i a l i z zaz ione senza f r a t t u r e . Bologna, Il Mulino, 1987.
(28) See among t h e many pub l i ca t ions , G. Lizzeri (ed.) , Mezzogiorno poss ib i le . Dati pe r un a l t r o sv i luppo . Milan, F. Angeli , 1983; E. Pontaro l lo , Tendenze del la n u o v a imprend i to r i a nel Mezzogiorno degli anni '70. Milan, F. Angeli , 1981; M. D 'Anton io , , I l Mezzogiorno degli ann i '80: dal lo sv i luppo imi t a t i vo allo sv i luppo a u t o c e n t r a t o . Milan, F. Angeli , 1985. I t i s no t i ceab le t h a t Abruzzi and Puglia h a v e overcome in te rms of s h a r e of manufac tu r ing employment t h e t r a d i t i o n a l l y more i n d u s t r i a l Campania.
(29) On t h e n e g a t i v e impact upon the local economy of t h e p r e sence of mafia, see P. Ar lach i , La mafia imprendi t r ice . L 'et ica mafiosa e lo sp i r i t o del cap i ta l i smo. Bologna, Il Mulino, 1983.

51
APPENDIX
The t a b l e s a p p e a r i n g in t h i s append ix a re my e l a b o r a t i o n s based on t h e following s o u r c e s :
R. CHIAVENTI (1987) , "I c ens imen t i i n d u s t r i a l i i t a l i a n i : 1911 - 1951: p roced iment i di s t a n d a r d i z z a z i o n e " , R iv i s t a d i s t o r i a economica, n . l .
O. VITALI (1970) , A s p e t t i del lo sv i luppo economico i t a l i a n o a l l a luce de l la r i c o s t r u zione de l la popolaz ione a t t i v a , Roma, Tip. Fai l l i .
11 Cens imento g e n e r a l e de l la popolaz ione , 24 o t t o b r e 1971 , Roma, 1977. 12 Cens imento g e n e r a l e de l la popolazione, 25 o t t o b r e 1981, Roma, 1985. Cens imento degl i opifici e de l le imprese i n d u s t r i a l i al 10 giugno 1911, Roma 1 9 1 3 -
1914. Cens imento degli e se rc iz i i n d u s t r i a l i e commerciali al 15 o t t o b r e 1927, Roma 1932. Cens imento i n d u s t r i a l e e commerciale 1 9 3 7 - 4 0 , Roma 1932. Cens imento g e n e r a l e d e l l ' i n d u s t r i a e del commercio, 15 nov. 1951 Roma. Cens imento g e n e r a l e d e l l ' i n d u s t r i a e del commercio, 16 o t t o b r e 1961, Roma 1965. Cens imento g e n e r a l e d e l l ' i n d u s t r i a e del commercio, 25 o t t o b r e 1971, Roma 1975. Cens imento g e n e r a l e d e l l ' i n d u s t r i a , del commercio, dei s e rv iz i e d e l l ' a r t i g i a n a t o , 26
o t t o b r e 1981 , Roma 1985.
CONVERSION TABLE FOR POPULATION CENSUSES
The t a b l e s of conve r s ion r e l a t i v e to t h e 1 8 8 1 - 1 9 5 1 c e n s u s e s a p p e a r in O. Vitel i , A s p e t t i e t c . , c i t . , pp . 2 2 1 - 2 3 5 .
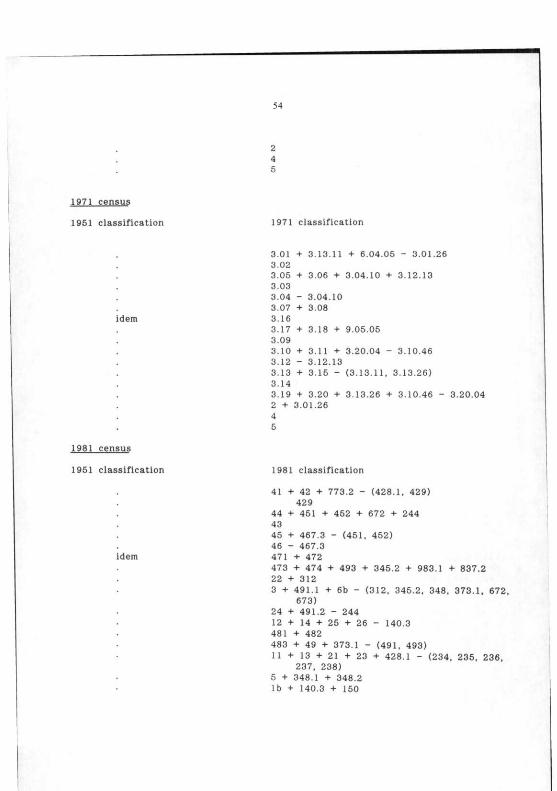
1971 Census
1961 c l a s s i f i ca t i on 1971 c lass i f i ca t ion
1 1 2 2 3 3 + 9.05.05 + 6.04.05 4 4 5 5 + 7.01.08 6 6 + 9.02.05 - (6 .02 .43 , 6 .04.05, 6 .05 .03 , 6.05.04) 7 7 + 6.05.03 + 6.05.04 - 7.01.08 8 8 9 9 + 6.02.43 - (9 .02.05, 9 .04 .01 , 9 .04 .03 , 9.05.05)
10 10 + 9.04.01 + 9.04.03
1981 Census
1961 c l a s s i f i ca t i on 1981 c lass i f i ca t ion
1 0 + 8 4 1 2 1 1 + 1 3 + 2 1 + 2 3 3 3 + 4 + 140.1 + 140.2 + 12 + 22 + 24 + 25 + 26 +
6b + 773.2 + 837.2 + 983.1 - 348.1 4 5 + 348.1 5 140.3 + 150 + 16 + 17 + 724 6 6 + 773.1 + 979.1 + 8.42 + 8.43 + 8.46 + 8.47 -
(666, 643 , 6b)

52
CONVERSION TABLE FOR INDUSTRIAL CENSUSES

53
54

55
CHART OF THE ITALIAN REGIONS
1 - 2 - 3 I n d u s t r i a l Tr iang le - North West 1 - 2 - 3 - 4 - 5 - 6 - 7 North 4 - 5 - 6 - 7 N o r t h - E a s t 8 - 9 - 1 0 - 1 1 Cent re 1 2 - 1 3 - 1 4 - 1 5 - 1 6 - 1 7 - 1 8 South
1. P iemonte - Val d 'Aos ta 10. Umbria 2. Liguria 11. Lazio
CO Lombardia to
Campania 4. T r e n t i n o - Alto Adige 13. Abruzz i -Mol ise 5. Vene to 14. Puglia 6. Fr iu l i - Venezia Guilia 15. Bas i l i ca ta 7. Emi l ia -Romagna 16. Calabr ia 8. Marche 17. Sicil ia 9. Toscana Sardegna
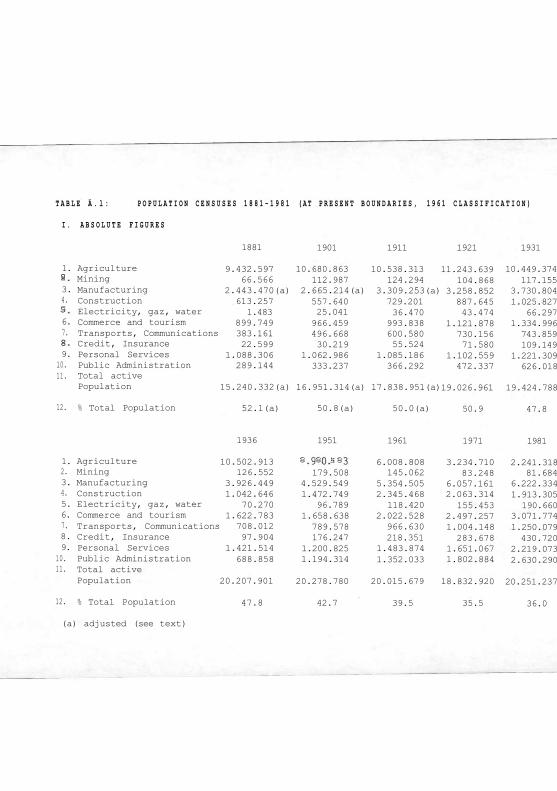
T A B L E Ä . l : P O P U L A T I O N C E N S U S E S 1 8 8 1 - 1 9 8 1 ( A T P R E S E N T B O U N D A R I E S , 1 9 6 1 C L A S S I F I C A T I O N )
I . A B S O L U T E F I G U R E S
1881
1. Agriculture 9.432.597 CXI Mining 66.566 3. Manufacturing 2.443.470(a) 4. Construction 613.257 LT) Electricity, gaz, water 1.483 6. Commerce and tourism 899.749 7. Transports, Communications 383.161
OO Credit, Insurance 22.599
9. Personal Services 1.088.306 10. Public Administration 289.144 11. Total active
Population 15.240.332(a)
12. % Total Population 52.1(a)
1936
1. Agriculture 10.502.913 2. Mining 126.552 3. Manufacturing 3.926.449 4. Construction 1.042.646 5. Electricity, gaz, water 70.270 6. Commerce and tourism 1.622.783 7. Transports, Communications 708.012 8. Credit, Insurance 97.904 9. Personal Services 1.421.514
10. Public Administration 688.858 11. Total active
Population 20.207.901
12. % Total Population 47.8
(a) adjusted (see text)
1901 1911 1921 1931
10.680.863 10.538.313 11.243.639 10.449.374 112.987 124.294 104.868 117.155
2.665.214(a) 3.309.253(a) 3.258.852 3.730.804 557.640 729.201 887.645 1.025.827 25.041 36.470 43.474 66.297 966.459 993.838 1.121.878 1.334.996 496.668 600.580 730.156 743.859 30.219 55.524 71.580 109.149
1.062.986 1.085.186 1.102.559 1.221.309 333.237 366.292 472.337 626.018
16.951.314(a) 17.838.951(a) 19.026.961 19.424.788
50.8(a) 50.0(a) 50.9 47.8
1951 1961 1971 1981
co LT)
co co 6.008.808 3.234.710 2.241.318 179.508 145.062 83.248 81.684
4.529.549 5.354.505 6.057.161 6.222.334 1.472.749 2.345.468 2.063.314 1.913.305
96.789 118.420 155.453 190.660 1.658.638 2.022.528 2.497.257 3.071.774 789.578 966.630 1.004.148 1.250.079 176.247 218.351 283.678 430.720
1.200.825 1.483.874 1.651.067 2.219.073 1.194.314 1.352.033 1.802.884 2.630.290
20.278.780 20.015.679 18.832.920 20.251.237
42.7 39.5 35.5 36.0
T A B L E A . l : P O P U L A T I O N C E N S U S E S 1 8 8 1 - 1 9 8 1 ( A T P R E S E N T B O U N D A R I E S , 1 9 6 1 C L A S S I F I C A T I O N )
I I . P E R C E N T A G E C O M P O S I T I O N
1881
1. Agriculture 61.8 2. Mining 0.4
LO Manufacturing 16.0
4. Construction 4.0 5. Electricity, Gaz, Water 0.1 6. Commerce and Tourism 5.9 7. Transports, Communications 2.5 co Credit, Insurance 0.2 9. Personal Services 7.2
10. Public Administration 1.9 1 1 . Total active
population 100.0
1901 1911 1921 1931
63.0 59.1 59.1 53.8 0.7 0.7 0.6 0.6
15.7 18.6 17.1 19.2 3.4 4.1 4.6 5.3 0.1 0.2 0.2 0.3 5.7 5.6 5.9 6.9 2.9 3.4 3.8 3.8 0.2 0.3 0.4 0.6 6.3 6 . 0 5.8 6.3 2 . 0 2 . 0 2.5 3.2
100.0 100.0 100.0 100.0
1936
1. Agriculture 52.0 2. Mining 0.6 3. Manufacturing 19.5 4. Construction 5.2 5. Electricity, Gaz, Water 0.3 6. Commerce and Tourism 8.0 7. Transports, Communications 3.5 8. Credit, Insurance 0.5 9. Personal Services 7.0
10. Public Administration 3.4 11. Total active
population 100.0
1951 1961 1971 1981
44.3 30.0 17.2 11.1 0.9 0.7 0.4 0.4
22.3 26.8 32.2 30.7 7.3 11.7 11.0 9.5 0.5 0.6 0.8 0.9 8.2 10.1 13.3 15.2 3.9 4.8 5.3 6.2 0.9 1.1 1.5 2.1 5.9 7.4 8.8 10.9 5.8 6.8 9.6 13.0
100.0 100.0 100.0 100.0
T A B L E A . 2 : 1 8 8 1 P O P U L A T I O N C E N S U S B Y R E G I O N S ( A T P R E S E N T B O U N D A R I E S , 1 9 6 1 C L A S S I F I C A T I O N ) .
I . A B S O L U T E F I G U R E S
Agricul- Mining Manufac- Construe- Electricity Commerce Transports ture turing (a) tion Gaz, Water and Tou- Communications (1) (2) (3) (4) (5) rism (6) (7)
1. Piemonte-Val d'Aosta 1.156 204
614 287.479 57.182 343 98 082
26 196 2. Liguria 241
361 989 80.928 20.605 75 39
234 26
030 3. Lombardia 1.181 989
2.491 503.687 80.809 203 141 862
36 300 4. Trentino Alto Adige 220
334 399 37.775 11.565 0 15
095 4 044 5. Veneto 762
722 1.822 189.918 28.945 128 82
621 28
326 6. Friuli Venezia Giulia 254 982
699 74.112 20.564 2 25 872
10 542 7. Emi 1ia-Romagna 772
501 1.742 170.280 54.797 84 65
376 24
659 8. Marche 379 866
1.111. 69.838 20.391 15 19 602
8 949 9. Toscana 693
004 9.157 215.192 47.708 60 72
006 33
272 10. Umbria 205 709
35 26.543 8.912 3 7 346
3 442 11. Lazio 422
922 848 90.002 27.456 178 41
503 20
150 12. Campania 688 697
2.441 219.298 64.306 114 109 785
49 047 13. Abruzzi-Molise 500
623 124 64.093 28.231 17 16
861 6 926 14. Puglia 477
985 4.169 92.422 31.171 18 38
180 26
453 15. Basi 1 icata 204 293
99 26.734 5.769 1 7 397
4 622 16. Calabria 383
953 750 72.840 28.638 8 20
632 18
121 17. Sicilia 709 903
30.309 195.456 57.396 222 85 906
48 419 18. Sardegna 175
539 8.767 26.873 18.812 12 12
449 7 663
( a ) adjusted see text
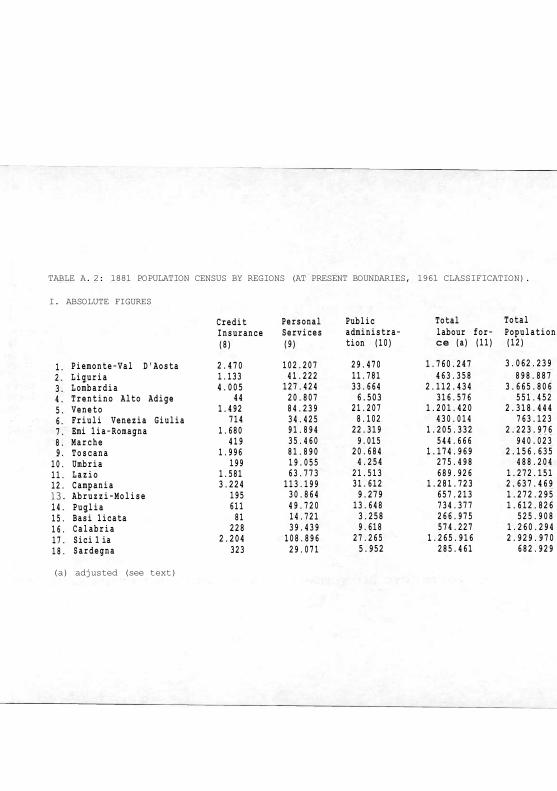
TABLE A. 2: 1881 POPULATION CENSUS BY REGIONS (AT PRESENT BOUNDARIES, 1961 CLASSIFICATION).
I. ABSOLUTE FIGURES
Credit Personal Public Total Total Insurance Services administra labour for Population (8) (9) tion (10) ce (a) (11) (12)
1. Piemonte-Val D'Aosta 2.470 102.207 29.470 1.760.247 3.062.239 2. Liguria 1.133 41.222 11.781 463.358 898.887 3. Lombardia 4.005 127.424 33.664 2.112.434 3.665.806 4. Trentino Alto Adige 44 20.807 6.503 316.576 551.452 5. Veneto 1.492 84.239 21.207 1.201.420 2.318.444 6. Friuli Venezia Giulia 714 34.425 8.102 430.014 763.123 7. Emi 1ia-Romagna 1.680 91.894 22.319 1.205.332 2.223.976 8. Marche 419 35.460 9.015 544.666 940.023 9. Toscana 1.996 81.890 20.684 1.174.969 2.156.635
10. Umbria 199 19.055 4.254 275.498 488.204 11. Lazio 1.581 63.773 21.513 689.926 1.272.151 12. Campania 3.224 113.199 31.612 1.281.723 2.637.469
Abruzzi-Molise 195 30.864 9.279 657.213 1.272.295 14. Puglia 611 49.720 13.648 734.377 1.612.826 15. Basi 1icata 81 14.721 3.258 266.975 525.908 16. Calabria 228 39.439 9.618 574.227 1.260.294 17. Sici 1 ia 2.204 108.896 27.265 1.265.916 2.929.970 18. Sardegna 323 29.071 5.952 285.461 682.929
(a) adjusted (see text)
T A B L E A . 2 : 1 9 8 1 P O P U L A T I O N C E N S U S B Y R E G I O N S ( A T P R E S E N T B O U N D A R I E S , 1 9 6 1 C L A S S I F I C A T I O N ) .
I I . P E R C E N T A G E C O M P O S I T I O N
Agricul Mining Manufac Construc Electricity Commerce, Transports, ture turing (a) tion Gaz, Water Tourism Communica(1) (2) (3) (4) (5) (6) tions (7)
1. Piemonte-Val D'Aosta 65.8 16.3 3.2 5.6 1 5 2. Liguria 52.2 CL2 17.5 4.4 8.5 5 6 3. Lombardia 56.0 0.1 23.8 3.8 6.7 1 7 4. Trentino Alto Adige 69.6 0.1 11.9 3.7 4.8 1 3 5. Veneto 63.5 0.2 15.8 2.4 6.9 2 4 6. Friuli Venezia Giulia 59.3 0.2 17.2 4.8 6.0 2 5 7. Emi 1ia-Romagna 64.2 0.1 14.2 4.5 5.4 2 0 8. Marche 69.8 0.2 12.8 3.7 3.6 1 6 9. Toscana 59.0 0.8 18.2 4.1 6.1 2 8
10. Umbria 74.7 9.6 3.2 2.8 1 2 11. Lazio 61.3 ó ! i 13.0 4.1 6.1 2 9 12. Campania 53.7 0.2 17.1 5.0 8.6 3 8 m Abruzzi-Molise 76.2 9.8 4.3 2.6 1 0 14. Puglia 65.1 o.h 12.6 4.2 5.2 3 6 15. Basi 1icata 76.6 10.0 2.2 2.8 1 7 16. Calabria 66.9 ó ! i 12.7 5.0 3.6 3 2 17. Sicilia 56.1 2.4 • 15.4 4.5 6.8 3 8 18. Sardegna 61.5 3.1 9.4 6.6 4.4 2 7
(a) adjusted (see text)

TABLE A.2: 1881 POPULATION CENSUS BY REGIONS (AT PRESENT BOUNDARIES, 1961 CLASSIFICATION).
I. PERCENTAGE COMPOSITION
Credit Insurance (8)
1. Piemonte-Val D'Aosta 0.1 2. Liguria 0.2 3. Lombardia 0.2 4. Trentino Alto Adige 5. Veneto ò l i 6. Friuli Venezia Giulia 0.2 7. Emi 1ia-Romagna 0.1 8. Marche 0.1 9. Toscana 0.2
10. Umbr i a 0.1 11. Lazio 0.2 12. Campania 0.3 13. Abruzzi-Molise 14. Puglia ò ! i 15. Basi 1 icata 16. Calabria 17. Sicilia CL2 18. Sardegna 0.1
Personal Public Total Services administra- labour (9) tion (10) force (a) (11)
5.8 1.7 100 8.9 2.5 100 6.0 1.6 100 6.6 2.0 100 7.0 1.7 100 8.0 1.8 100 7.6 1.9 100 6.5 1.7 100 7.0 1.8 100 6.9 1.6 100 9.2 3.1 100 8.8 2.5 100 4.7 1.4 100 6.8 1.8 100 5.5 1.2 100 6.9 1.6 100 8.6 2.2 100
10.2 2.0 100
(a) adjusted (see text)

T A B L E A . 3 : 1 9 1 1 P O P U L A T I O N C E N S U S B Y R E G I O N S ( A T P R E S E N T B O U N D A R I E S , 1 9 6 1 C L A S S I F I C A T I O N ) .
I . A B S O L U T E F I G U R E S
Agriculture ( 1 )
Mining
( 2 )
Manufacturing (a) ( 3 )
Construction ( 4 )
Electricity Gaz, Water ( 5 )
Commerce and Tourism ( 6 )
Transports Communications ( 7 )
1 . Piemonte-Val d'Aosta 1 . 1 6 7 . 3 7 0 9 . 5 6 3 4 3 4 . 5 1 6 7 9 . 5 4 9 4 . 7 1 8 1 0 5 . 2 9 5 5 2 . 6 4 2 2 . Liguria 2 3 1 . 9 0 4 2 . 7 2 2 1 4 9 . 2 4 7 3 2 . 2 5 5 2 . 6 9 3 5 3 . 6 4 0 4 3 . 8 5 4 3 . Lombardia 1 . 2 2 8 . 7 1 0 7 . 4 1 1 7 8 3 . 7 0 8 1 2 3 . 6 2 1 1 0 . 1 7 2 1 6 8 . 7 9 6 6 7 . 2 4 6 4 . Trentino Alto Adige 2 2 8 . 2 1 8 1 . 0 3 3 3 7 . 8 8 1 1 2 . 9 2 1 4 5 3 2 3 . 6 5 4 8 . 1 4 5 5 . Veneto 9 2 0 . 0 5 0 3 . 0 3 0 2 3 4 . 8 2 4 4 7 . 8 7 6 2 . 2 1 4 8 4 . 4 1 4 3 8 . 6 4 8 6 . Friuli Venezia Giulia 2 5 5 . 3 7 5 2 . 3 8 0 9 7 . 2 1 0 2 2 . 7 0 4 1 . 4 3 2 3 7 . 4 6 8 2 0 . 2 6 6 7 . Emi 1ia-Romagna 9 3 7 . 9 1 6 2 . 5 3 9 2 3 5 . 8 4 5 7 4 . 8 1 4 2 . 2 7 5 7 2 . 8 7 5 3 8 . 9 4 9 co Marche 4 2 6 . 5 2 8 1 . 3 8 5 8 3 . 7 5 2 1 6 . 1 2 1 8 3 5 1 7 . 4 0 9 1 3 . 8 1 2 9 . Toscana 8 0 8 . 3 8 1 2 1 . 3 1 2 3 1 3 . 5 0 0 5 1 . 2 4 3 2 . 9 7 5 6 8 . 4 6 3 4 8 . 1 9 7
1 0 . Umbria 2 4 0 . 6 3 7 1 . 3 2 3 3 7 . 0 5 3 9 . 2 6 4 2 9 1 8 . 4 8 2 5 . 8 2 4 1 1 . Lazio 4 6 3 . 7 6 9 2 . 2 7 2 1 1 8 . 0 4 0 3 8 . 4 1 0 1 . 4 0 9 4 6 . 7 7 5 3 7 . 3 6 1 1 2 . Campania 7 8 4 . 9 3 0 4 . 2 9 0 2 5 9 . 9 8 9 5 5 . 5 5 8 2 . 5 8 5 9 9 . 3 6 3 6 3 . 5 6 5
OJ Abruzzi-Molise 5 7 9 . 0 7 7 1 . 1 6 8 6 3 . 5 4 0 1 3 . 4 2 2 5 4 4 1 7 . 9 0 2 1 1 . 8 4 0
1 4 . Puglia 6 0 8 . 9 5 0 5 . 6 5 5 1 2 6 . 9 1 4 4 0 . 7 9 8 1 . 4 0 3 4 3 . 9 0 2 3 7 , 9 3 3 1 5 . Basi 1icata 1 9 3 . 2 1 9 6 6 8 2 0 . 9 4 0 6 . 1 1 7 8 8 6 . 8 1 8 4 . 6 7 2 1 6 . Calabria 4 9 5 . 7 7 4 1 . 0 3 3 7 5 . 3 7 0 1 9 . 7 0 7 3 4 2 1 9 . 4 4 3 1 9 . 3 8 1 1 7 . Sicilia 7 6 8 . 8 2 3 4 0 . 4 1 2 1 9 9 . 2 6 6 7 2 . 1 9 4 1 . 7 1 7 1 0 6 . 1 2 4 7 7 . 5 2 6
co
Sardegna 1 9 8 . 6 8 2 1 6 . 0 9 2 3 7 . 6 5 8 1 2 . 6 2 7 3 2 4 1 3 . 0 1 5 1 0 . 7 1 9
(a) adjusted (see text)

TABLE A.3: 1911 POPULATION CENSUS BY REGIONS (AT PRESENT BOUNDARIES, 1961 CLASSIFICATION)
I. ABSOLUTE FIGURES
Credit Personal Public Total Total Insurance Services administra labour for Population (8) (9) tion (10) ce (a) (11) (12)
1. Piemonte-Val D'Aosta 4.371 102.606 37.746 1.998.376 3.411.745 2. Liguria 3.860 51.984 19.278 591.437 1.196.237 3. Lombardia 8.145 161.356 39.738 2.598.803 4.781.202 4. Trentino Alto Adige 580 20.909 9.251 343.045 627.282 5. Veneto 3.664 73.479 24.727 1.432.926 2.902.017 6. Friuli Venezia Giulia 3.683 36.283 14.966 491.767 1.014.617 7. Emi 1ia-Romagna 3.125 76.733 25.832 1.470.903 2.750.117 8. Marche 1.167 24.969 10.416 596.394 1.093.940 9. Toscana 4.518 78.258 24.392 1.421.245 2.634.249
10. Umbria 753 14.332 5.561 323.520 594.125 11. Lazio 4.144 76.151 34.700 823.031 1.721.396 12. Campania 6.503 116.833 36.852 1.430.468 3.016.101 13. Abruzzi-Molise 981 23.424 9.599 721.497 1.381.335 14. Pugl ia 2.119 49.162 17.783 934.619 2.154.460 15. Basi 1icata 233 9.389 2.945 245.089 476.109 16. Calabria 1.020 30.309 10.302 672.681 1.405.396 17. Sicilia 5.919 110.888 34.077 1.416.946 3.679.450 18. Sardegna 839 28.121 8.127 326.204 851.952
(a) adjusted (see text)

T A B L E A . 3 : 1 9 1 1 P O P U L A T I O N C E N S U S B Y R E G I O N S ( A T P R E S E N T B O U N D A R I E S , 1 9 6 1 C L A S S I F I C A T I O N )
I I . P E R C E N T A G E C O M P O S I T I O N
Agricul Mining Manufac Construc Electricity Commerce, Transports, ture turing (a) tion Gaz, Water Tourism Communica(1) (2) (3) (4) (5) (6) tions (7)
1. Piemonte-Val D'Aosta 58.4 0.5 21.7 4 0 0.2 5.3 2 6 2. Liguria 39.2 0.5 25.2 5 5 0.5 9.1 7 4
co Lombardia 47.3 0.3 30.2 4 7 0.4 6.5 2 6 4. Trentino Alto Adige 66.5 0.3 11.4 3 7 0.1 6.8 2 4
5. Veneto 64.2 0.2 16.4 3 3 0.2 5.9 2 7 6. Friuli Venezia Giulia 51.9 0.5 19.8 4. 6 0.3 7.6 4 2 7. Emi 1ia-Romagna 63.8 0.2 16.0 5. 1 0.1 5.0 2 6 8. Marche 71.6 0.2 14.0 2. 7 0.1 2.9 2 3 9. Toscana 56.9 1.5 22.1 3. 6 0.2 4.8 3 4 10. Umbria 74.3 0.4 11.5 2. 9 0.1 2.6 1 8 11. Lazio 56.3 0.3 14.3 4 7 0.2 5.7 4 5 12. Campania 54.9 0.3 18.2 3. 9 0.2 6.9 4 4
13. Abruzzi-Molise 80.3 0.2 8.8 1. 9 0.1 2.5 1 6 14. Puglia 65.2 0.6 13.6 4. 4 0.1 4.7 4 0 15. Basi 1icata 78.8 0.3 8.6 2. 5 2.8 1 9 16. Calabria 73.7 0.2 11.2 2. 9 2.9 2 9 17. Sicilia 54.3 2.8 14.1 5. 1 7.5 5 5 cô Sardegna 60.9 4.9 11.5 3. 9 4.0 3 3 (a) adjusted (see text)

T A B L E A . 3 : 1 9 1 1 P O P U L A T I O N C E N S U S B Y R E G I O N S ( A T P R E S E N T B O U N D A R I E S . 1 9 6 1 C L A S S I F I C A T I O N )
I I . P E R C E N T A G E C O M P O S I T I O N
1. Piemonte-Val D'Aosta
Credit Insurance (8)
0.2
Personal Services (9)
5.2
Public administration (10)
1.9
Total labour
force (a) (11)
100 2. Liguria 0.7 8.8 3.1 100 3. Lombardia 0.3 6.2 1.5 100 4. Trentino Alto Adige 0.2 6.0 2.6 100 5. Veneto 0.3 5.1 1.7 100 6. Friuli Venezia Giulia 0.7 7.4 3.0 100 7. Emilia-Romagna 0.2 5.2 1.8 100 8. Marche 0.2 4.2 1.8 100 9. Toscana 0.3 5.5 1.7 100 10. Umbria 0.2 4.4 1.8 100 11. Lazio 0.5 9.3 4.2 100 12. Campania 0.4 8.2 2.6 100 13. Abruzzi-Molise 0.1 3.2 1.3 100 14. Puglia 0.2 5.3 1.9 100 15. Basilicata 0.1 3.8 1.2 100 16. Calabria 0.2 4.5 1.5 100 17. Sicilia 0.4 7.8 2.4 100 18. Sardegna 0.3 8.6 2.6 100
(a) adjusted (see text)

T A B L E A . 4 : 1 9 3 6 P O P U L A T I O N C E N S U S B Y R E G I O N S ( A T P R E S E N T B O U N D A R I E S , 1 9 6 1 C L A S S I F I C A T I O N ) .
I . A B S O L U T E F I G U R E S
Agricul Mining Manufac Construc Electricity Commerce Transports ture turing tion Gaz, Water and Tou Communica(1) (2) (3) (4) (5) rism (6) tions (7)
1. Piemonte-Val d'Aosta 974.513 9.926 543.755 90.743 8.722 174.781 55.422 2. Liguria 209.252 3.759 188.065 46.491 4.397 93.247 60.198 3. Lombardia 1.023.051 9.989 1.085.925 169.720 13.221 299.124 81.070 4. Trentino Alto Adige 213.565 2.055 45.004 25.617 1.390 34.930 9.994 5. Veneto 973.584 7.496 290.600 85.197 4.501 132.774 48.309 6. Friuli Venezia Giulia 269.731 2.753 104.914 49.527 2.159 53.584 26.163 7. Emilia-Romagna 1.121.246 3.920 248.503 78.415 4.628 121.693 48.493 8. Marche 466.565 3.699 83.054 22.986 1.378 29.853 13.751 9. Toscana 804.369 25.152 291.514 63.620 4.422 115.654 53.857
10. Umbria 269.140 1.707 50.902 12.026 1.049 15.497 7.682 11. Lazio 579.631 4.673 166.089 86.061 5.424 107.591 56.107 12. Campania 780.635 5.279 260.384 71.761 6.343 139.426 73.888 13. Abruzzi-Molise 582.684 1.375 61.839 21.277 1.948 30.224 13.078 14. Puglia 557.366 10.157 182.139 60.097 3.620 73.893 41.591 15. Basi 1icata 200.287 239 20.829 9.445 488 8.780 4.529 16. Calabria 520.800 1.226 75.860 33.822 1.379 35.804 23.359 17. Sicilia 731.511 21.387 186.874 90.717 4.056 130.694 74.803 18. Sardegna 224.983 12.002 40.299 25.324 1.146 25.234 15.758

T A B L E A . 4 : 1 9 3 6 P O P U L A T I O N C E N S U S B Y R E G I O N S ( A T P R E S E N T B O U N D A R I E S , 1 9 6 1 C L A S S I F I C A T I O N )
I . A B S O L U T E F I G U R E S
Credit Personal Public Total Total Insurance Services administra labour for Population (8) (9) tion (10) ce (11) (12)
1. Piemonte-Val D'Aosta 9.487 133.197 57.013 2.057.559 3.525.546 2. Liguria 6.265 75.201 31.633 718.266 1.482.866
Lombardia 22.529 247.725 79.505 3.031.759 5.805.008 4. Trentino Alto Adige 1.598 29.466 15.697 379.316 693.478 5. Veneto 6.749 104.689 45.755 1.699.654 3.546.462 6. Friuli Venezia Giulia 3.998 44.739 25.383 582.951 1.124.752 7. Emi 1ia-Romagna 7.334 101.275 48.027 1.783.534 3.326.736
CD Marche 3.152 30.954 17.960 672.352 1.262.166
9. Toscana 7.128 98.710 46.499 1.510.725 2.965.520 10. Umbr i a 945 18.674 9.812 387.433 720.771 11. Lazio 12.103 147.444 95.840 1.260.963 2.683.544 12. Campania 5.894 118.030 59.146 1.520.786 3.679.060 13. Abruzzi-Molise 1.436 27.015 18.874 759.750 1.554.880 14. Puglia 2.641 60.837 35.435 1.027.736 2.643.560 15. Basilicata 358 8.502 6.226 259.683 538.141 16. Calabria 1.304 36.169 19.589 749.312 1.741.551 17. Sicilia 5.011 107.230 58.200 1.410.483 3.970.988
CO Sardegna 972 31.657 18.264 395.639 1.036.170
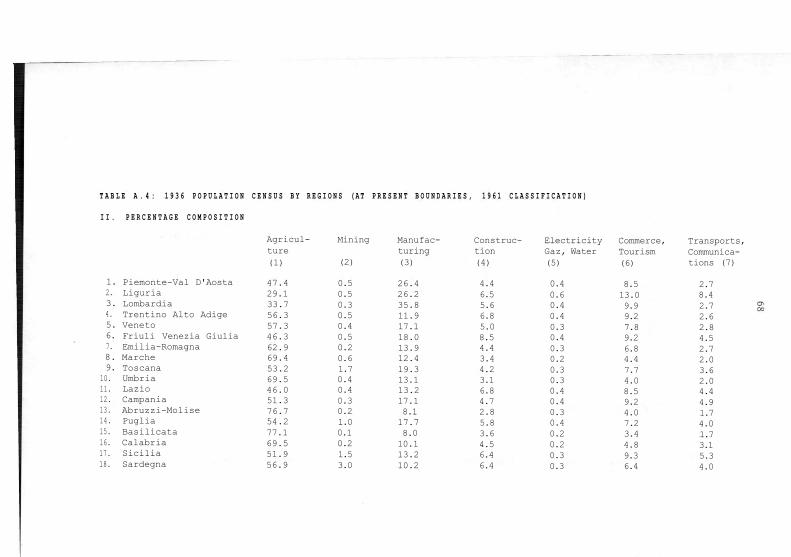
T A B L E A . 4 : 1 9 3 6 P O P U L A T I O N C E N S U S B Y R E G I O N S ( A T P R E S E N T B O U N D A R I E S , 1 9 6 1 C L A S S I F I C A T I O N )
I I . P E R C E N T A G E C O M P O S I T I O N
Agricul Mining Manufac Construc Electricity Commerce, Transports, ture turing tion Gaz, Water Tourism Communica(1) (2) (3) (4) (5) (6) tions (7)
1. Piemonte-Val D'Aosta 47.4 0.5 26.4 4.4 0.4 8.5 2.7 2. Liguria 29.1 0.5 26.2 6.5 0.6 13.0 8.4 3. Lombardia 33.7 0.3 35.8 5.6 0.4 9.9 2.7 4. Trentino Alto Adige 56.3 0.5 11.9 6.8 0.4 9.2 2.6 5. Veneto 57.3 0.4 17.1 5.0 0.3 7.8 2.8 6. Friuli Venezia Giulia 46.3 0.5 18.0 8.5 0.4 9.2 4.5 7. Emilia-Romagna 62.9 0.2 13.9 4.4 0.3 6.8 2.7 8. Marche 69.4 0.6 12.4 3.4 0.2 4.4 2.0 9. Toscana 53.2 1.7 19.3 4.2 0.3 7.7 3.6
10. Umbria 69.5 0.4 13.1 3.1 0.3 4.0 2.0 11. Lazio 46.0 0.4 13.2 6.8 0.4 8.5 4.4 12. Campania 51.3 0.3 17.1 4.7 0.4 9.2 4.9 13. Abruzzi-Molise 76.7 0.2 8.1 2.8 0.3 4.0 1.7 14. Puglia 54.2 1.0 17.7 5.8 0.4 7.2 4.0 15. Basilicata 77.1 0.1 8.0 3.6 0.2 3.4 1.7 16. Calabria 69.5 0.2 10.1 4.5 0.2 4.8 3.1 17. Sici1ia 51.9 1.5 13.2 6.4 0.3 9.3 5.3 18. Sardegna 56.9 3.0 10.2 6.4 0.3 6.4 4.0
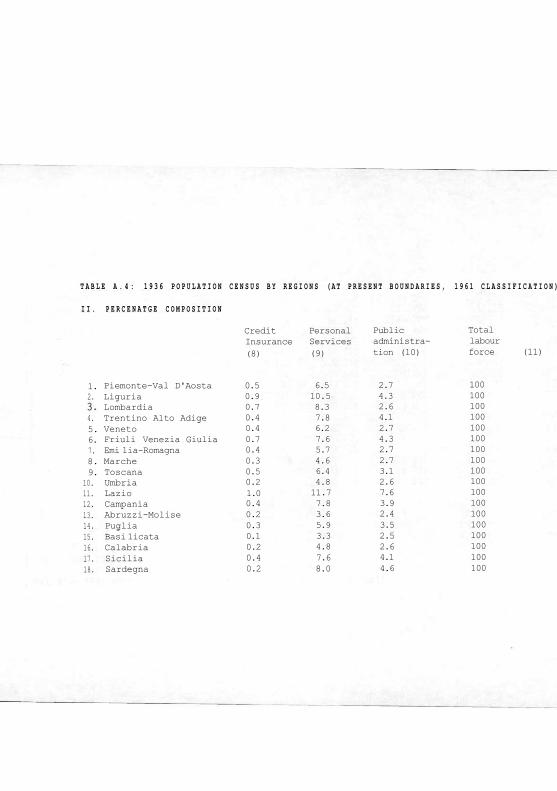
T A B L E A . 4 : 1 9 3 6 P O P U L A T I O N C E N S U S B Y R E G I O N S ( A T P R E S E N T B O U N D A R I E S , 1 9 6 1 C L A S S I F I C A T I O N )
I I . P E R C E N A T G E C O M P O S I T I O N
Credit Personal Public Total Insurance Services administra labour (8) (9) tion (10) force (11)
1. Piemonte-Val D'Aosta 0.5 6.5 2.7 100 2. Liguria 0.9 10.5 4.3 100
Lombardia 0.7 8.3 2.6 100 4. Trentino Alto Adige 0.4 7.8 4.1 100 5. Veneto 0.4 6.2 2.7 100 6. Friuli Venezia Giulia 0.7 7.6 4.3 100 7. Emi 1ia-Romagna 0.4 5.7 2.7 100 8. Marche 0.3 4.6 2.7 100 9. Toscana 0.5 6.4 3.1 100
10. Umbria 0.2 4.8 2.6 100 11. Lazio 1.0 11.7 7.6 100 12. Campania 0.4 7.8 3.9 100 13. Abruzzi-Molise 0.2 3.6 2.4 100 14. Puglia 0.3 5.9 3.5 100 15. Basi 1icata 0.1 3.3 2.5 100 16. Calabria 0.2 4.8 2.6 100 17. Sicilia 0.4 7.6 4.1 100 18. Sardegna 0.2 8.0 4.6 100

T A B L E A . 5 : 1 9 6 1 P O P U L A T I O N C E N S U S B Y R E G I O N S ( 1 9 6 1 C L A S S I F I C A T I O N ) .
I . A B S O L U T E F I G U R E S
Agricul Mining Manufac Construc Electricity Commerce Transports ture turing tion Gaz, Water and Tou Communica(1) (2) (3) (4) (5) rism (6) tions (7)
1. Piemonte-Val d'Aosta 442.883 8.137 752, .871 143.878 14.044 188.632 73.634 2. Liguria 81.922 3.039 190, .791 74.574 5.578 101.392 78.526 3. Lombardia 428.013 12.903 1.525, .318 308.451 24.769 378.219 126.119 4. Trentino Alto Adige 101.929 3.384 66, .172 35.669 3.320 49.805 13.041 5. Veneto 446.178 9.083 459, .533 181.055 9.235 175.270 68.236 6. Friuli Venezia Giulia 96.197 3.557 136, .673 77.076 3.309 63.656 31.669 7. Emi 1ia-Romagna 584.180 5.987 415, .814 162.333 7.925 185.747 73.848 8. Marche 264.788 3.578 113, .424 59.070 2.178 44.376 21.747 9. Toscana 350.909 23.092 415, ,860 128.862 6.928 151.251 69.830
10. Umbria 146.240 1.950 65. ,983 37.749 1.431 23.949 13.062 11. Lazio 275.597 7.109 243, ,790 204.291 10.889 168.737 96.639 12. Campania 584.875 6.145 318. ,279 227.698 9.074 151.837 96.700 13. Abruzzi-Molise 285.159 3.942 78. ,360 98.118 2.296 40.864 21.107 14. Puglia 663.419 12.283 222. ,555 121.506 4.708 88.615 49.692 15. Basilicata 151.850 573 24. ,401 44.582 827 10.935 6.637 16. Calabria 328.176 2.780 76. ,449 149.568 2.129 42.220 29.184 17. Sicilia 610.333 18.480 199. ,426 222.889 7.710 119.640 74.361 18. Sardegna 166.160 19.040 49. ,106 68.099 2.610 37.383 22.598
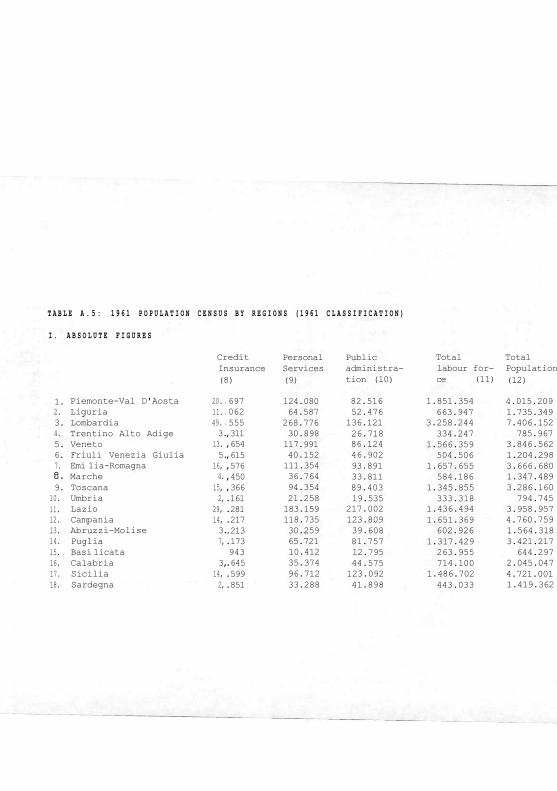
T A B L E A . 5 : 1 9 6 1 P O P U L A T I O N C E N S U S B Y R E G I O N S ( 1 9 6 1 C L A S S I F I C A T I O N )
I . A B S O L U T E F I G U R E S
Credit Personal Public Total Total Insurance Services administra labour for Population (8) (9) tion (10) ce (11) (12)
1. Piemonte-Val D'Aosta 20. 697 124.080 82.516 1.851.354 4.015.209 2. Liguria 11. 062 64.587 52.476 663.947 1.735.349 3. Lombardia 49. 555 268.776 136.121 3.258.244 7.406.152 4. Trentino Alto Adige 3. ,311 30.898 26.718 334.247 785.967 5. Veneto 13. ,654 117.991 86.124 1.566.359 3.846.562 6. Friuli Venezia Giulia 5. ,615 40.152 46.902 504.506 1.204.298 7. Emi 1ia-Romagna 16, ,576 111.354 93.891 1.657.655 3.666.680
CD Marche 4. ,450 36.764 33.811 584.186 1.347.489
9. Toscana 15, ,366 94.354 89.403 1.345.855 3.286.160 10. Umbria 2, .161 21.258 19.535 333.318 794.745 11. Lazio 29, .281 183.159 217.002 1.436.494 3.958.957 12. Campania 14, .217 118.735 123.809 1.651.369 4.760.759 13. Abruzzi-Molise 3. .213 30.259 39.608 602.926 1.564.318 14. Puglia 7, .173 65.721 81.757 1.317.429 3.421.217 15. Basi 1icata 943 10.412 12.795 263.955 644.297 16. Calabria 3, .645 35.374 44.575 714.100 2.045.047 17. Sicilia 14, .599 96.712 123.092 1.486.702 4.721.001 18. Sardegna 2, .851 33.288 41.898 443.033 1.419.362

T A B L E A . 5 : 1 9 6 1 P O P U L A T I O N C E N S U S B Y R E G I O N S ( 1 9 6 1 C L A S S I F I C A T I O N )
I I . P E R C E N T A G E C O M P O S I T I O N
Agricul Mining Manufac Construc Electricity Commerce, Transports, ture turing tion Gaz, Water Tourism Communica(1) (2) (3) (4) (5) (6) tions (7)
1. Piemonte-Val D'Aosta 23.9 0.4 40.7 7.8 0.8 10.2 4.0 2. Liguria 12.3 0.5 28.8 11.2 0.8 15.3 11.8
GO Lombardia 31.1 0.4 46.8 9.5 0.8 11.6 3.9
4. Trentino Alto Adige 30.5 1.0 19.8 10.7 1.0 14.9 3.9 5. Veneto 28.5 0.6 29.3 11.5 0.6 11.2 4.4 6. Friul i Venezia Giulia 19.1 0.7 27.0 15.3 0.6 12.6 6.3 7. Emi 1ia-Romagna 35.2 0.4 25.1 9.8 0.5 11.2 4.5 8. Marche 45.3 0.6 19.4 10.1 0.4 7.6 3.7
Toscana 26.1 1.7 30.9 9.6 0.5 11.2 5.2 10. Umbria 43.9 0.6 19.8 11.3 0.4 7.2 3.9 11. Lazio 19.2 0.5 17.0 14.2 0.8 11.7 6.7 12. Campania 35.4 0.4 19.3 13.8 0.5 9.2 5.9 13. Abruzzi-Molise 47.3 0.7 13.0 16.3 0.4 6.8 3.5 14. Pug lia 50.4 0.9 16.9 9.2 0.4 6.7 3.8 15. Basilicata 57.5 0.2 9.3 16.9 0.3 4.2 2.5 16. Calabria 46.0 0.4 10.7 20.9 0.3 5.9 4.1 17. Sicilia 41.1 1.2 13.4 15.0 0.5 8.0 5.0 CO* Sardegna 37.5 4.3 11.1 15.3 0.6 8.4 5.1

TABLE A.5: 1961 POPULATION CENSUSBY REGIONS (1961 CLASSIFICATION)
II. PERCENTAGE COMPOSITION
Credit Personal Public Total Insurance Services administra labour (8) (9) tion (10) force (11)
1. Piemonte-Val D'Aosta 1.1 6.7 4.4 100 2. Liguria 1.7 9.7 7.9 100 3. Lombardia 1.5 8.2 4.2 100 4. Trentino Alto Adige 1.0 9.2 8.0 100 5. Veneto 0.9 7.5 5.5 100 6. Friuli Venezia Giulia 1.1 8.0 9.3 100 7. Emi 1ia-Romagna 1.0 6.7 5.6 100 cô Marche 0.8 6.3 5.8 100 9. Toscana 1.1 7.0 6.7 100
10. Umbria 0.6 6.4 5.9 100 11. Lazio 2.0 12.8 15.1 100 12. Campania 0.9 7.1 7.5 100 13. Abruzzi-Molise 0.5 5.0 6.5 100 14. Puglia 0.5 5.0 6.2 100 15. Basi 1icata 0.4 4.0 4.8 100 16. Calabria 0.5 5.0 6.2 100 17. Sici 1 ia 1.0 6.5 8.3 100 co* Sardegna 0.6 7.5 9.6 100

T A B L E A . 6 : 1 9 8 1 P O P U L A T I O N C E N S U S B Y R E G I O N S ( 1 9 6 1 C L A S S I F I C A T I O N ) .
I . A B S O L U T E F I G U R E S
Agricul Mining Manufac Construc Electricity Commerce Transports ture turing tion Gaz, Water and Tou Communica( 1 ) (2) (3) (4) (5) rism (6) tions (7)
1 . Piemonte-Val d'Aosta 1 5 0 . 4 3 3 5 .862 7 8 8 . 1 8 6 1 3 1 . 0 1 9 1 9 . 4 1 0 273 .821 99 .841 2 . Liguria 3 2 . 6 8 7 1 . 9 8 3 1 4 9 . 7 2 7 5 2 . 0 8 7 8 . 1 6 4 130 .700 73 .721
LO Lombardia 1 4 0 . 7 0 0 1 1 . 3 2 0 1 . 6 3 5 . 6 3 6 2 7 8 . 2 9 0 33 .542 574 . 174 180 . 174
4 . Trentino Alto Adige 3 7 . 2 0 2 1 . 9 7 7 7 6 . 1 4 7 3 6 . 1 0 2 3 .422 79 .299 17 .779 5. Veneto 1 4 4 . 2 6 6 4 . 6 2 9 6 4 0 . 3 8 8 1 5 1 . 7 3 8 1 5 . 3 4 5 280 .889 92 .677 6. Friuli Venezia Giulia 2 7 . 3 4 7 1 . 4 3 7 1 4 2 . 9 5 9 4 7 . 8 5 8 4 . 3 3 8 8 4 . 8 9 3 33 .824 7. Emi 1ia-Romagna 2 1 5 . 0 3 2 4 . 4 5 5 5 7 4 . 1 4 8 1 4 0 . 6 0 9 1 2 . 7 1 0 278 .459 92 .923 8 . Marche 6 5 . 1 1 5 1 . 7 7 8 207 .226 5 1 . 2 3 5 4 . 0 6 8 78 .080 28 .448 9. Toscana 9 4 . 0 4 0 8 . 5 2 8 5 1 8 . 1 7 3 1 0 4 . 3 5 7 3 .045 233 .204 8 4 . 9 5 3
1 0 . Umbria 3 2 . 1 3 8 1 . 0 1 8 9 8 . 1 3 9 3 1 . 1 0 7 1 2 . 3 0 8 40 . 758 17 .361 1 1 . Lazio 1 0 6 . 9 4 1 7 . 1 1 8 326 .248 1 4 8 . 0 0 7 20 .050 263 . 140 150 .074 1 2 . Campania 2 6 6 . 7 3 3 5 .023 329 .541 1 4 8 . 6 7 5 13 . 507 189 . 3 14 1 14 . 870
to Abruzzi-Molise 8 8 . 4 7 9 2 . 7 0 5 1 1 7 . 8 4 0 7 0 . 2 0 3 4 .596 7 1 . 2 7 8 26 .603
1 4 . Puglia 3 1 0 . 4 0 5 5 .956 2 3 6 . 2 1 1 1 2 5 . 0 6 2 9 .337 1 4 7 . 4 1 6 67 .831 1 5 . Basi 1icata 5 6 . 0 1 8 613 2 6 . 7 6 5 3 7 . 4 2 7 2 . 1 3 2 18 .798 8 .053 1 6 . Calabria 1 4 4 . 2 2 2 1 . 7 9 8 6 7 . 6 5 1 1 0 3 . 2 0 2 5 .054 64 .951 40 .269 1 7 . Sicilia 2 6 7 . 4 1 5 8 . 7 2 3 2 0 7 . 5 0 5 1 8 6 . 8 9 3 1 3 . 2 8 1 1 8 7 . 1 1 1 8 9 . 1 5 9 1 8 . Sardegna 6 2 . 1 4 5 6 .761 79 .844 6 9 . 4 3 4 6 .351 75 .489 3 1 . 5 1 9

T A B L E A . 6 : 1 9 8 1 P O P U L A T I O N C E N S U S B Y R E G I O N S ( 1 9 6 1 C L A S S I F I C A T I O N )
I . A B S O L U T E F I G U R E S
Credit Personal Public Total Total Insurance Services administra labour for Population ( 8 ) ( 9 ) tion ( 1 0 ) ce ( 1 1 ) ( 1 2 )
1 . Piemonte-Val D'Aosta 4 0 . 5 3 4 1 9 5 . 8 0 7 1 6 9 . 6 1 4 1 . 8 7 4 . 5 2 7 4 . 5 9 1 . 3 8 4 2 . Liguria 1 6 . 9 3 7 8 3 . 9 9 9 8 7 . 7 7 2 6 3 7 . 7 7 7 1 . 8 0 7 . 8 9 3 3 . Lombardia 1 0 2 . 1 8 8 4 3 2 . 0 9 9 2 9 7 . 2 8 2 3 . 6 8 5 . 4 0 5 8 . 8 9 1 . 6 5 2 4 . Trentino Alto Adige 7 . 2 7 4 4 1 . 8 0 1 4 5 . 0 3 3 3 4 6 . 0 3 6 8 7 3 . 4 1 3 5 . Veneto 2 9 . 1 0 1 1 7 3 . 7 6 9 1 6 3 . 3 5 8 1 . 6 9 6 . 1 6 0 4 . 3 4 5 . 0 4 7 6 . Friuli Venezia Giulia 1 0 . 7 2 7 5 5 . 9 8 2 6 6 . 4 6 5 4 7 5 . 8 3 0 1 . 2 3 3 . 9 8 4 7 . Emi 1ia-Romagna 3 7 . 1 8 1 1 8 8 . 3 6 9 1 6 9 . 3 8 4 1 . 7 1 3 . 2 7 0 3 . 9 5 7 . 5 1 3 8 . Marche 9 . 5 7 6 5 2 . 8 4 8 6 6 . 1 0 9 5 6 4 . 4 8 3 1 . 4 1 2 . 4 0 4 9 . Toscana 3 1 . 2 9 4 1 4 5 . 3 9 9 1 7 5 . 9 7 5 1 . 4 0 8 . 2 3 1 3 . 5 8 1 . 0 5 1
1 0 . Umbria 5 . 1 0 1 3 3 . 3 4 0 4 2 . 4 3 0 3 0 4 . 4 3 7 8 0 7 . 5 5 2 1 1 . Lazio 6 1 . 8 6 8 2 5 3 . 9 1 0 3 5 8 . 6 7 1 1 . 6 9 6 . 0 2 7 5 . 0 0 1 . 6 8 4 1 2 . Campania 2 0 . 9 7 9 1 5 7 . 4 2 0 2 6 2 . 5 6 1 1 . 5 0 8 . 6 2 3 5 . 4 6 3 . 1 3 4 1 3 . Abruzzi-Molise 6 . 4 2 7 4 6 . 8 7 1 8 0 . 4 0 3 5 1 5 . 4 0 5 1 . 5 4 6 . 1 6 2 1 4 . Puglia 1 3 . 8 4 0 1 1 0 . 1 6 0 1 8 3 . 1 3 7 1 . 2 0 9 . 3 5 5 3 . 8 7 1 . 6 1 7 1 5 . Basi 1icata 1 . 8 6 5 1 3 . 2 8 1 3 4 . 9 0 5 1 9 9 . 8 5 7 6 1 0 . 1 8 6 1 6 . Calabria 6 . 6 1 3 4 7 . 1 5 9 1 1 5 . 3 6 7 5 9 6 . 2 8 6 2 . 0 6 1 . 1 8 2 1 7 . Sicilia 2 2 . 5 6 0 1 3 3 . 7 3 0 2 2 4 . 7 5 4 1 . 3 4 1 . 1 3 1 4 . 9 0 6 . 8 7 8 oo Sardegna 6 . 6 5 5 5 3 . 1 2 9 8 7 . 0 7 0 4 7 8 . 3 9 7 1 . 5 9 4 . 1 7 5

T A B L E A . 6 : 1 9 8 1 P O P U L A T I O N C E N S U S B Y R E G I O N S ( 1 9 6 1 C L A S S I F I C A T I O N )
I I . P E R C E N T A G E C O M P O S I T I O N
Agricul Mining Manufac Construc Electricity Commerce, Transports, ture turing tion Gaz, Water Tourism Communica(1) (2) (3) (4) (5) (6) tions (7)
1. Piemonte-Val D'Aosta 8.0 0.3 42.0 7.0 1.0 14.6 5.3 2. Liguria 5.1 0.3 23.5 8.2 1.3 20.5 11.6 3. Lombardia 3.8 0.3 44.4 7.6 0.9 15.6 4.9 4. Trentino Alto Adige 10.7 0.6 22.0 10.4 1.0 22.9 5.1 5. Veneto 8.5 0.3 37.8 8.9 0.9 16.6 5.5 6. Friuli Venezia Giulia 5.7 0.3 30.0 10.1 0.9 17.8 7.1 7. Emi 1ia-Romagna 12.6 0.3 33.5 8.2 0.7 16.2 5.4
Marche 11.5 0.3 36.7 9.1 0.7 13.8 5.0 9. Toscana 6.7 0.6 36.8 7.4 0.9 16.6 6.0
10. Umbria 10.6 0.3 32.2 10.2 1.0 13.4 5.7 11. Lazio 6.3 0.4 19.2 8.7 1.2 15.5 8.8 12. Campania 17.7 0.3 21.8 9.9 0.9 12.5 7.6 13. Abruzzi-Molise 17.2 0.5 22.9 13.6 0.9 13.8 5.2 14. Puglia 25.7 0.5 19.5 10.3 0.8 12.2 5.6 15. Basi 1icata 28.0 0.3 13.4 18.7 1.1 9.4 4.0 16. Calabria 24.2 0.3 11.3 17.3 0.8 10.9 6.7 17. Sicilia 19.9 0.6 15.5 13.9 1.0 13.9 6.6
00 Sardegna 13.0 1.4 16.7 14.5 1.3 15.8 6.6

T A B L E A . 6 : 1 9 8 1 P O P U L A T I O N C E N S U S B Y R E G I O N S ( 1 9 6 1 C L A S S I F I C A T I O N )
I I . P E R C E N T A G E C O M P O S I T I O N
Credit Personal Public Total Insurance Services administra labour force (8) (9) tion (10) (11)
1. Piemonte-Val D'Aosta 2.2 10.5 9.0 100 2. Liguria 2.7 13.2 13.8 100 3. Lombardia 2.8 11.7 8.1 100 4. Trentino Alto Adige 2.1 12.1 13.0 100 5. Veneto 1.7 10.2 9.6 100 6. Friuli Venezia Giulia 2.2 11.8 14.0 100 7. Emi 1ia-Romagna 2.2 11.0 9.9 100 8. Marche 1.7 9.4 11.7 100 9. Toscana 2.2 10.3 12.5 100
10. Umbria 1.7 10.9 13.9 100 11. Lazio 3.7 15.0 21.1 100 12. Campania 1.4 10.4 17.4 100 13. Abruzzi-Molise 1.2 9.1 15.6 100 14. Puglia 1.1 9.1 15.1 100 15. Basi 1icata 0.9 6.6 17.5 100 16. Calabria 1.1 7.9 19.4 100 17. Sici 1 ia 1.7 10.0 16.8 100 18. Sardegna 1.4 11.1 18.2 100

T A B L E A . 7 : I N D U S T R I A L C E N S U S E S 1 9 1 1 - 1 9 8 1 ( 1 9 5 1 C L A S S I F I C A T I O N , A T T H E B O U N D A R I E S O F T H E T I M E )
I . A B S O L U T E F I G U R E S
1911 1927 1937-39 (a) (b)
1. Food and beverages 284.232 307.151 317.922 480.859 2. Tobacco 20.336 20.341 25.512 48.745
Leather, Shoes 120.282 168.356 209.108 215.528 4. Textiles 505.806 508.076 645.358 604.556 5. Clothing 167.669 198.147 304.306 284.689 6. Furniture 220.673 264.332 282.950 283.576 7. Paper 36.102 36.432 45.749 56.127 8. Printing, 47.328 48.124 65.225 80.521
Photographing 9. Metallurgy 42.663 42.706 89.158 103.175
10. Engineering 345.791 369.844 503.676 854.798 11. Bricks, Glass, 182.701 187.171 171.922 206.762
Tyles 12. Chemicals 57.071 57.649 83.573 153.042 13. Rubber 2.720 2.731 15.251 26.064 14. Other 10.297 11.271 41.478 33.306
15. Manufacturing 2.043.671 2 .222.371 2.801.188 3.431.748
16. Mining 98.362 99.362 98.778 137.404 17. Construction 128.182 134.279 331.386 558.544 co Electricity, Gaz 34.187 35.128 58.502 42.221
water
19. Industry, Total 2.304.402 2 .491.140 3.289.854 4.169.917
( a ) e x c l u d i n g u n i t s w i t h 1 w o r k e r ( b ) i n c l u d i n g u n i t s w i t h 1 w o r k e r

T A B L E A . 7 : I N D U S T R I A L C E N S U S E S 1 9 1 1 - 1 9 8 1 ( 1 9 5 1 C L A S S I F I C A T I O N , A T T H E B O U N D A R I E S O F T H E T I M E )
I . A B S O L U T E F I G U R E S
1951 1961 1971 1981
1. Food and beverages 360.058 396.947 374.307 395.072 2. Tobacco 52.496 26.561 21.133 19.039 3. Leather, Shoes 200.203 227.388 232.881 299.249 4. Textiles 650.866 598.565 541.030 493.470 5. Clothing 249.901 335.899 414.025 467.580 6. Furniture 293.570 381.251 396.594 446.128 7. Paper 63.449 84.208 94.256 98.800 8. Printing, 85.550 131.822 166.579 216.555
Photographing 9. Metallurgy 145.071 191.794 245.648 256.797
10. Engineering 909.261 1.399.902 1.937.812 2.408.364 11. Bricks, Glass, 206.668 318.730 328.891 338.098
Tyles 12. Chemicals 199.811 270.900 317.346 322.590 13. Rubber 40.127 53.759 84.568 85.909 14. Other 41.189 77.798 144.616 186.621
15. Manufacturing 3.498.220 4.495.584 5.299.686 6.034.272
16. Mining 118.662 104.150 78.788 67.245 17. Construction 532.055 894.407 997.534 1.264.609 18. Electricity, Gaz 92.964 116.046 155.156 177.124
water
19. Industry, Total 4.241.901 5.610.187 6.531.164 7.543.250

T A B L E A . 7 : I N D U S T R I A L C E N S U S E S 1 9 1 1 - 1 9 8 1 ( 1 9 5 1 C L A S S I F I C A T I O N , A T T H E B O U N D A R I E S O F T H E T I M E )
I I . P E R C E N T A G E F I G U R E S 1911 1927 1937-39
(a) (b) 1. Food and beverages 13.9 13.8 11.4 14.0 2. Tobacco 1.0 0.9 0.9 1.4 3. Leather, Shoes S3 7.6 7.5 6.3 4. Textiles 24.8 22.9 23.0 17.6 5. Clothing 8.2 8.9 10.9 8.3 6. Furniture 10.8 11.9 10.1 8.3 7. Paper 1.8 1.6 1.6 1.6 8. Printing, 2.3 2.1 2.3 2.4
Photographing 9. Metallurgy 2.1 1.9 3.2 3.0 10. Engineering 16.9 16.7 18.0 24.9 11. Bricks, Glass, 8.9 8.5 6.1 6.0
Tyles 12. Chemicals 2.8 2.6 3.0 4.5 13. Rubber 0.1 0.1 0.5 0.7 14. Other 0.5 0.5 1.5 1.0
Total Manufacturing 100.0 100.0 100.0 100.0
15. Manufacturing 88.7 89.2 85.2 82.3 16. Mining 4.3 4.0 3.0 3.3 17. Construction 5.5 5.4 10.0 13.4 18. Electricity, Gaz, 1.5 1.4 1.8 1.0
Water
19. Industry, Total 100.0 100.0 100.0 100.0
15. as a% of active population
--- 12.7(c) 14.2(c) 16.7(c)
19. as a% of active population — 14.3(c) 16.6(c) 20.3(c)
( a ) e x c l u d i n g u n i t s w i t h 1 w o r k e r ( b ) i n c l u d i n g u n i t s w i t h 1 w o r k e r ( c ) t h e a d j u s t m e n t s u g g e s t e d i n t h e t e x t h a s b e e n m a d e t o e l i m i n a t e t h e e f f e c t s
o f c h a n g e i n b o u n d a r i e s ; t h e s e p e r c e n t a g e s , t h e r e f o r e , a r e r e f f e r e d t o p r e s e n t b o u n d a r i e s .

T A B L E A . 7 : I N D U S T R I A L C E N S U S E S 1 9 1 1 - 1 9 8 1 ( 1 9 5 1 C L A S S I F I C A T I O N , A T T H E B O U N D A R I E S O F T H E T I M E )
I I . P E R C E N T A G E F I G U R E S
1951 1961 1971 1981
1. Food and beverages 10.3 8.8 7.1 6.5 2. Tobacco 1.5 0.6 0.4 0.3 3. Leather, Shoes 5.7 5.7 4.4 5.0 4. Textiles 18.6 13.1 10.2 8.2 5. Clothing 7.1 7.5 7.8 7.6 6. Furniture 8.4 8.5 7.5 7.4 7. Paper 1.8 1.9 1.8 1.6 8. Printing, 2.4 2.9 3.1 3.6
Photographing 4.3 4.6 9. Metallurgy 4.2 4.3 4.6 4.3
10. Engineering 26.0 31.1 36.6 40.0 11. Bricks, Glass, 5.9 7.1 6.2 5.6
Tyles 6.0 5.3 12. Chemicals 5.7 6.0 6.0 5.3
13. Rubber 1.1 1.2 1.6 1.5 14. Other 1.8 1.7 2.7 3.1
Total Manufacturing 100.0 100.0 100.0 100.0
15. Manufacturing 82.5 80.1 81.1 80.0 16. Mining 2.8
CTi 1.2 0.9 17. Construction 12.5 15.9 15.3 16.8 18. Electricity, Gaz 2.2 2.1 2.4 2.3
water
19. Industry, Total 100.0 100.0 100.0 100.0
15. as a% of active popu 17.3 22.5 28.1 29.8 lation
19. as a% of active popu 20.9 28.0 34.7 37.3 lation

T A B L E A . 8 : 1 9 1 1 I N D U S T R I A L C E N S U S B Y R E G I O N S ( 1 9 5 1 C L A S S I F I C A T I O N , A T T H E B O U N D A R I E S O F T H E T I M E )
I . A B S O L U T E F I G U R E S
Food, Tobacco Leather, Textiles Clothing Furniture Paper Printing, Metal Engineering beverages shoes photography Food, Tobacco Leather, Textiles Clothing Furniture Paper Printing, Metal Engineering beverages shoes photography
1. Piemonte-Val d'Aosta 25.491 1.517 12.392 107.026 27.064 27.688 7.479 5.657 4.948 53.478 2. Liguria 13.763 1.332 5.630 11.765 10.047 11.573 1.228 2.479 8.591 40.423 3. Lombardia 44.100 2.619 19.903 268.282 41.941 43.094 10.646 13.451 10.562 92.231 4. Trentino Alto Adige 13.451 10.562 92.231 5. Veneto 23.400 1.079 7.176 51.646 13.508 24.409 3.762 3.108 1.178 27.049 « 6. Friuli Venezia Giulia 3.108 1.178 27.049 « 7. Emi 1ia-Romagna 28.714 1.883 7.168 8.905 13.471 18.814 1.534 3.047 620 23.830 8. Marche 6.198 1.212 3.956 7.409 4.302 5.308 1.910 812 238 5.335 9. Toscana 18.907 3.878 9.816 20.359 11.073 21.838 3.134 4.773 5.949 24.801 10. Umbria 5.348 49 2.553 3.646 1.750 2.103 204 792 4.119 3.817 11. Lazio 9.458 769 4.979 1.238 8.339 8.109 2.095 5.888 355 10.001 12. Campania 27.543 2.298 13.369 17.437 12.767 17.364 3.439 3.247 4.603 31.140 13. Abruzzi-Molise 8.812 0 4.454 966 3.378 4.226 119 482 302 3.910 14. Puglia 27.548 1.556 6.610 1.378 5.695 11.799 123 1.274 465 11.578 LO
Basi 1 icata 3.185 0 1.505 114 964 1.315 2 92 0 1.164 16. Calabria 11.518 0 5.667 2.814 4.260 5.283 131 282 12 3.003 17. Sicilia 24.938 1.456 12.539 2.807 8.096 14.505 245 1.641 590 11.366 CO Sardegna 5.309 688 2.545 14 1.014 3.245 51 303 131 2.665
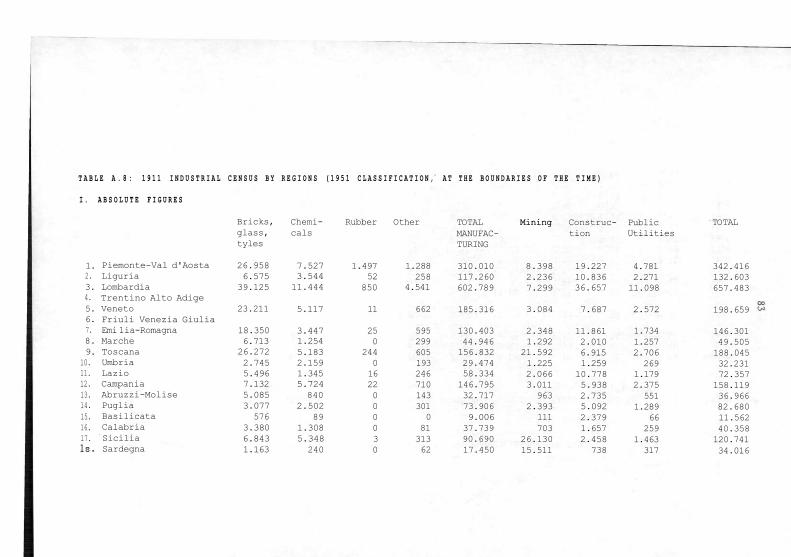
T A B L E A . 8 : 1 9 1 1 I N D U S T R I A L C E N S U S B Y R E G I O N S ( 1 9 5 1 C L A S S I F I C A T I O N , A T T H E B O U N D A R I E S O F T H E T I M E )
I . A B S O L U T E F I G U R E S
Bricks, Chemi Rubber Other TOTAL Mining Construc Public TOTAL glass, cals MANUFAC
Mining tion Utilities
tyles TURING
1. Piemonte-Val d'Aosta 26.958 7.527 1.497 1.288 310.010 8.398 19.227 4.781 342.416 2. Liguria 6.575 3.544 52 258 117.260 2.236 10.836 2.271 132.603 3. Lombardia 39.125 11.444 850 4.541 602.789 7.299 36.657 11.098 657.483 4. Trentino Alto Adige 5. Veneto 23.211 5.117 11 662 185.316 3.084 7.687 2.572 198.659 6. Friuli Venezia Giulia 7. Emi 1ia-Romagna 18.350 3.447 25 595 130.403 2.348 11.861 1.734 146.301 8. Marche 6.713 1.254 0 299 44.946 1.292 2.010 1.257 49.505 9. Toscana 26.272 5.183 244 605 156.832 21.592 6.915 2.706 188.045
10. Umbria 2.745 2.159 0 193 29.474 1.225 1.259 269 32.231 11. Lazio 5.496 1.345 16 246 58.334 2.066 10.778 1.179 72.357 12. Campania 7.132 5.724 22 710 146.795 3.011 5.938 2.375 158.119 13. Abruzzi-Molise 5.085 840 0 143 32.717 963 2.735 551 36.966 14. Puglia 3.077 2.502 0 301 73.906 2.393 5.092 1.289 82.680 15. Basilicata 576 89 0 0 9.006 111 2.379 66 11.562 16. Calabria 3.380 1.308 0 81 37.739 703 1.657 259 40.358 17. Sicilia 6.843 5.348 3 313 90.690 26.130 2.458 1.463 120.741
CO Sardegna 1.163 240 0 62 17.450 15.511 738 317 34.016

T A B L E A . 8 : 1 9 1 1 I N D U S T R I A L C E N S U S B Y R E G I O N S ( 1 9 5 1 C L A S S I F I C A T I O N , A T T H E B O U N D A R I E S O F T H E T I M E )
I I . P E R C E N T A G E C O M P O S I T I O N
Food, Tobacco Leather, Textiles Clothing Furniture Paper Printing, Metal Engineering beverages shoes photography
Engineering
1. Piemonte-Val D'Aosta 7.44 0.44 3.62 31.26 7.90 8.09 2.18 1.65 1.45 15.62 C\J Liguria 10.38 1.00 4.25 8.87 7.58 8.73 0.93 1.87 6.48 30.48 3. Lombardia 6.70 0.40 3.03 40.78 6.38 6.55 1.62 2.04 1.61 14.02 4. Trentino Alto Adige 5. Veneto 11.78 0.54 3.61 26.00 6.80 12.29 1.89 1.56 0.59 13.62 6. Friuli Venezia Giulia 7. Emi 1ia-Romagna 19.63 1.29 4.90 6.09 9.21 12.86 1.05 2.08 0.42 16.29
00 Marche 12.52 2.45 7.99 14.97 8.69 10.72 3.86 1.64 0.48 10.78
9. Toscana 10.05 2.06 5.22 10.83 5.89 11.61 1.67 2.54 3.16 13.19 10. Umbria 16.59 0.15 7.92 11.31 5.43 6.52 0.63 2.46 12.78 11.84 11. Lazio 13.07 1.06 6.88 1.71 11.52 11.21 2.90 8.14 0.49 13.82 12. Campania 17.42 1.45 8.46 11.03 8.07 10.98 2.17 2.05 2.91 19.69 13. Abruzzi-Molise 23.84 0.00 12.05 2.61 9.14 11.43 0.32 1.30 0.82 10.58 14. Puglia 33.32 1.88 7.99 1.67 6.89 14.27 0.15 1.54 0.56 14.00 15. Basiiicata 27.55 0.00 13.02 0.99 8.34 11.37 0.02 0.80 0.00 10.07 16. Calabria 28.54 0.00 14.04 6.97 10.56 13.09 0.32 0.70 0.03 7.44 17. Sicilia 20.65 1.21 10.39 2.32 6.71 12.01 0.20 1.36 0.49 9.41 18. Sardegna 15.61 2.02 7.54 0.04 2.98 9.54 0.15 0.89 0.39 7.83

T A B L E A . 8 : 1 9 1 1 I N D U S T R I A L C E N S U S B Y R E G I O N S ( 1 9 5 1 C L A S S I F I C A T I O N , A T T H E B O U N D A R I E S O F T H E T I M E )
I I . P E R C E N T A G E C O M P O S I T I O N
Bricks, Chemi Rubber Other TOTAL Mining Construc Public TOTAL glass, cals MANUFAC tion Utilities tyles TURING
1. Piemonte-Val d'Aosta 7.87 2.20 0.44 0.38 90.54 2.45 5.62 1.40 100.00 2. Liguria 4.96 2.67 0.04 0.19 88.43 1.69 8.17 1.71 100.00
co Lombardia 5.95 1.74 0.13 0.69 91.63 1.11 5.57 1.69 100.00
4. Trentino Alto Adige 5. Veneto 11.68 2.58 0.01 0.33 93.28 1.55 3.87 1.29 100.00 6. Friuli Venezia Giulia 7. Emi 1ia-Romagna 12.54 2.36 0.02 0.41 89.13 1.60 8.08 1.19 100.00 8. Marche 13.56 2.53 0.00 0.60 90.79 2.61 4.06 2.54 100.00 9. Toscana 13.97 2.76 0.13 0.32 83.40 11.48 3.68 1.44 100.00
10. Umbria 8.52 6.70 0.00 0.60 91.46 3.80 3.91 0.83 100.00 11. Lazio 7.60 1.86 0.02 0.34 80.62 2.86 14.90 1.63 100.00 12. Campania 4.51 3.62 0.01 0.45 92.84 1.90 3.76 1.50 100.00
co Abruzzi-Molise 13.76 2.27 0.00 0.39 88.51 2.61 7.40 1.49 100.00
14. Puglia 3.72 3.03 0.00 0.36 89.39 2.89 6.16 1.56 100.00 15. Basi 1icata 4.98 0.77 0.00 0.00 77.89 0.96 20.58 0.57 100.00 16. Calabria 8.38 3.24 0.00 0.20 93.51 1.74 4.11 0.64 100.00 17. Sicilia 5.67 4.43 0.00 0.26 75.11 21.64 2.04 1.21 100.00 18. Sardegna 3.42 0.71 0.00 0.18 51.30 45.60 2.17 0.93 100.00

T A B L E A . 9 : 1 9 3 7 - 3 9 I N D U S T R I A L C E N S U S B Y R E G I O N S ( 1 9 5 1 C L A S S I F I C A T I O N , A T T H E B O U N D A R I E S O F T H E T I M E )
I . A B S O L U T E F I G U R E S
Food, Tobacco Leather, Textiles Clothing Furniture Paper Printing, Metal Engineering beverages shoes photography
Engineering
1. Piemonte-Val d'Aosta 42.697 1.802 22.235 134.234 37.127 27.321 9.807 9.446 21.824 145.328 2. Liguria 18.180 0 5.849 11.240 9.910 8.879 1.462 3.200 14.272 74.843 3. Lombardia 68.689 2.090 48.299 282.886 69.959 60.968 19.304 23.120 31.438 297.092 4. Trentino Alto Adige 5.071 1.001 2.927 3.212 3.709 7.847 1.113 849 1.818 5.792
Veneto 50.614 1.485 16.522 75.597 21.705 29.059 6.668 5.251 5.204 46.121 Friuli Venezia Giulia 11.017 2.761 2.989 4.745 7.370 7.302 1.032 1.490 1.537 34.100
/. Emi 1ia-Romagna 62.030 3.796 14.229 12.951 24.953 17.790 3.324 4.562 387 54.231
i oc
Marche 10.098 1.595 6.872 7.955 8.979 7.071 1.421 962 50 10.605 9. Toscana 29.105 4.690 16.515 36.686 23.158 25.632 3.902 5.732 12.739 47.883
10. Umbria 7.818 1.180 3.147 4.341 3.069 4.512 430 1.419 4.717 14.305 11. Lazio 19.729 1.507 7.739 2.184 13.007 11.144 5.780 14.556 358 34.634 12. Campania 42.378 7.099 18.520 15.956 18.036 20.841 1.401 3.882 6.313 38.286 13. Abruzzi-Molise 12.689 1.677 6.059 2.862 6.636 5.969 131 819 0 5.321 14. Puglia 32.259 15.903 10.898 3.476 12.097 12.213 157 1.606 430 19.818 15. Basi 1icata 3.509 5 3.159 501 2.017 3.256 0 133 0 1.666
i cr Calabria 13.917 17 6.684 1.719 6.403 10.268 18 435 419 3.835
17. Sicilia 40.441 1.410 19.163 3.044 12.590 16.578 134 2.544 4 16.358 18. Sardegna 10.618 727 3.722 967 3.964 6.926 43 515 1.665 4.598
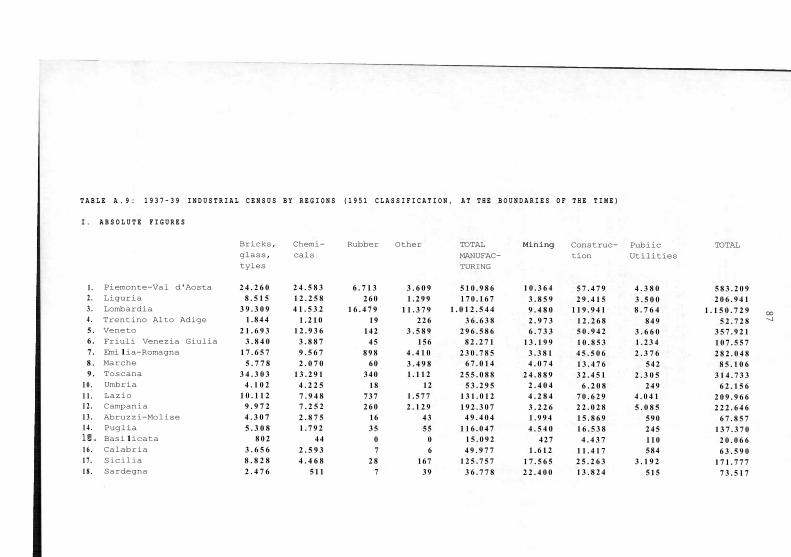
T A B L E A . 9 : 1 9 3 7 - 3 9 I N D U S T R I A L C E N S U S B Y R E G I O N S ( 1 9 5 1 C L A S S I F I C A T I O N , A T T H E B O U N D A R I E S O F T H E T I M E )
I . A B S O L U T E F I G U R E S
Bricks, Chemi Rubber Other TOTAL Mining Construc Pubiic TOTAL glass, cals MANUFAC
Mining tion Utilities
tyles TURING
1 . Piemonte-Val d'Aosta 2 4 . 2 6 0 2 4 . 5 8 3 6 . 7 1 3 3 . 6 0 9 5 1 0 . 9 8 6 1 0 . 3 6 4 5 7 . 4 7 9 4 . 3 8 0 5 8 3 . 2 0 9 2 . Liguria 8 . 5 1 5 1 2 . 2 5 8 2 6 0 1 . 2 9 9 1 7 0 . 1 6 7 3 . 8 5 9 2 9 . 4 1 5 3 . 5 0 0 2 0 6 . 9 4 1 3 . Lombardia 3 9 . 3 0 9 4 1 . 5 3 2 1 6 . 4 7 9 1 1 . 3 7 9 1 . 0 1 2 . 5 4 4 9 . 4 8 0 1 1 9 . 9 4 1 8 . 7 6 4 1 . 1 5 0 . 7 2 9 4 . Trentino Alto Adige 1 . 8 4 4 1 . 2 1 0 19 2 2 6 3 6 . 6 3 8 2 . 9 7 3 1 2 . 2 6 8 8 4 9 5 2 . 7 2 8 5 . Veneto 2 1 . 6 9 3 1 2 . 9 3 6 1 4 2 3 . 5 8 9 2 9 6 . 5 8 6 6 . 7 3 3 5 0 . 9 4 2 3 . 6 6 0 3 5 7 . 9 2 1 6 . Friuli Venezia Giulia 3 . 8 4 0 3 . 8 8 7 4 5 156 8 2 . 2 7 1 1 3 . 1 9 9 1 0 . 8 5 3 1 . 2 3 4 1 0 7 . 5 5 7 7 . Emi 1ia-Romagna 1 7 . 6 5 7 9 . 5 6 7 8 9 8 4 . 4 1 0 2 3 0 . 7 8 5 3 . 3 8 1 4 5 . 5 0 6 2 . 3 7 6 2 8 2 . 0 4 8 8 . Marche 5 . 7 7 8 2 . 0 7 0 6 0 3 . 4 9 8 6 7 . 0 1 4 4 . 0 7 4 1 3 . 4 7 6 5 4 2 8 5 . 1 0 6 9 . Toscana 3 4 . 3 0 3 1 3 . 2 9 1 3 4 0 1 . 1 1 2 2 5 5 . 0 8 8 2 4 . 8 8 9 3 2 . 4 5 1 2 . 3 0 5 3 1 4 . 7 3 3
1 0 . Umbria 4 . 1 0 2 4 . 2 2 5 18 12 5 3 . 2 9 5 2 . 4 0 4 6 . 2 0 8 2 4 9 6 2 . 1 5 6 1 1 . Lazio 1 0 . 1 1 2 7 . 9 4 8 7 3 7 1 . 5 7 7 1 3 1 . 0 1 2 4 . 2 8 4 7 0 . 6 2 9 4 . 0 4 1 2 0 9 . 9 6 6 1 2 . Campania 9 . 9 7 2 7 . 2 5 2 2 6 0 2 . 1 2 9 1 9 2 . 3 0 7 3 . 2 2 6 2 2 . 0 2 8 5 . 0 8 5 2 2 2 . 6 4 6 1 3 . Abruzzi-Molise 4 . 3 0 7 2 . 8 7 5 16 4 3 4 9 . 4 0 4 1 . 9 9 4 1 5 . 8 6 9 5 9 0 6 7 . 8 5 7 1 4 . Puglia 5 . 3 0 8 1 . 7 9 2 3 5 55 1 1 6 . 0 4 7 4 . 5 4 0 1 6 . 5 3 8 2 4 5 1 3 7 . 3 7 0
en
Basi 1icata 8 0 2 4 4 0 0 1 5 . 0 9 2 4 2 7 4 . 4 3 7 110 2 0 . 0 6 6 1 6 . Calabria 3 . 6 5 6 2 . 5 9 3 7 6 4 9 . 9 7 7 1 . 6 1 2 1 1 . 4 1 7 5 8 4 6 3 . 5 9 0 1 7 . Sicilia 8 . 8 2 8 4 . 4 6 8 2 8 167 1 2 5 . 7 5 7 1 7 . 5 6 5 2 5 . 2 6 3 3 . 1 9 2 1 7 1 . 7 7 7 1 8 . Sardegna 2 . 4 7 6 5 1 1 7 39 3 6 . 7 7 8 2 2 . 4 0 0 1 3 . 8 2 4 5 1 5 7 3 . 5 1 7

T A B L E A . 9 : 1 9 3 7 - 3 9 I N D U S T R I A L C E N S U S B Y R E G I O N S ( 1 9 5 1 C L A S S I F I C A T I O N , A T T H E B O U N D A R I E S O F T H E T I M E )
I I . P E R C E N T A G E C O M P O S I T I O N
Food, Tobacco Leather, Textiles Clothing Furniture Paper Printing, Metal Engineering beverages shoes photography
1. Piemonte-Val D'Aosta 7.32 0.31 3.81 23.02 6.37 4.68 1.68 1.62 3.74 24.92 2. Liguria 8.79 0.00 2.83 5.43 4.79 4.29 0.71 1.55 6.90 36.17 3. Lombardia 5.97 0.18 4.20 24.58 6.08 5.30 1.68 2.01 2.73 25.82 4. Trentino Alto Adige 9.62 1.90 5.55 6.09 7.03 14.88 2.11 1.61 3.45 10.98 5. Veneto 14.14 0.41 4.62 21.12 6.06 8.12 1.86 1.47 1.45 12.89 6. Friuli Venezia Giulia 10.24 2.57 2.78 4.41 6.85 6.79 0.96 1.39 1.43 31.70 7. Emi 1ia-Romagna 21.99 1.35 5.04 4.59 8.85 6.31 1.18 1.62 0.14 19.23 8. Marche 11.87 1.87 8.07 9.35 10.55 8.31 1.67 1.13 0.06 12.46 9. Toscana 9.25 1.49 5.25 11.66 7.36 8.14 1.24 1.82 4.05 15.21
10. Umbria 12.58 1.90 5.06 6.98 4.94 7.26 0.69 2.28 7.59 23.01 11. Lazio 9.40 0.72 3.69 1.04 6.19 5.31 2.75 6.93 0.17 16.50 12. Campania 19.03 3.19 8.32 7.17 8.10 9.36 0.63 1.74 2.84 17.19
GO Abruzzi-Molise 18.70 2.47 8.93 4.22 9.78 8.80 0.19 1.21 0.00 7.84
14. Puglia 23.48 11.58 7.93 2.53 8.81 8.89 0.11 1.17 0.31 14.43 15. Basi 1icata 17.49 0.02 15.74 2.50 10.05 16.23 0.00 0.66 0.00 8.30
CT) Calabria 21.89 0.03 10.51 2.70 10.07 16.15 0.03 0.68 0.66 6.03
17. Sici 1 ia 23.54 0.82 11.16 1.77 7.33 9.65 0.08 1.48 0.00 9.52 18. Sardegna 14.44 0.99 5.06 1.32 5.39 9.42 0.06 0.70 2.26 6.25

T A B L E A . 9 : 1 9 3 7 - 3 9 I N D U S T R I A L C E N S U S B Y R E G I O N S ( 1 9 5 1 C L A S S I F I C A T I O N , A T H E B O U N D A R I E S O F T H E T I M E )
I I . P E R C E N T A G E C O M P O S I T I O N
Bricks, Chemi Rubber Other TOTAL Mining Construc Public TOTAL glass, cals MANUFAC
Mining tion Utilities
tyles TURING
1. Piemonte-Val d'Aosta 4.16 4.22 1.15 0.62 87 62
1.78 9.86 0.75 100.00 2. Liguria 4.11 5.92 0.13 0.63 82
23 1.86 14.21 1.69 100.00
3. Lombardia 3.42 3.61 1.43 0.99 87 99
0.82 10.42 0.76 100.00 4. Trentino Alto Adige 3.50 ¿.29 0.04 0.43 69
48 5.64 23.27 1.61 100.00
5. Veneto 6.06 3,61 0.04 1.00 82 86
1.88 14.23 1.02 100.00 6. Friuli Venezia Giulia 3.57 3.61 0.04 0.15 76
49 12.27 10.09 1.15 100.00
7. Emi 1ia-Romagna 6.26 3.39 0.32 1.56 81 82
1.20 16.13 0.84 100.00 8. Marche 6.79 2.43 0.07 4.11 78
74 4.79 15.83 0.64 100.00
9. Toscana 10.90 4.22 0.11 0.35 81 05
7.91 10.31 0.73 100.00 10. Umbria 6.60 6.80 0.03 0.02 85
74 3.87 9.99 0.40 100.00
11. Lazio 4.82 3.79 0.35 0.75 62 40
2.04 33.64 1.92 100.00 12. Campania 4.48 3.26 0.12 0.96 86
37 1.45 9.89 2.28 100.00
13. Abruzzi-Molise 6.35 4.24 0.02 0.06 72 81
2.94 23.39 0.87 100.00 14. Puglia 3.86 1.30 0.03 0.04 84
48 3.30 12.04 0.18 100.00
15. Basi 1 icata 4.00 0.22 0.00 0.00 75 21
2.13 22.11 0.55 100.00 16. Calabria 5.75 4.08 0.01 0.01 78
59 2.53 17.95 0.92 100.00
17. Sicilia 5.14 2.60 0.02 0.10 73 21
10.23 14.71 1.86 100.00 18. Sardegna 3.37 0.70 0.01 0.05 50
03 30.47 18.80 0.70 100.00
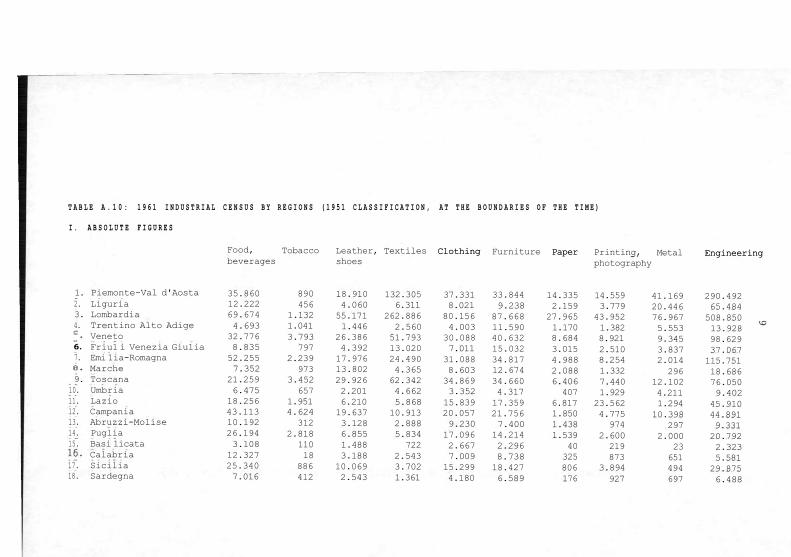
T A B L E A . 1 0 : 1 9 6 1 I N D U S T R I A L C E N S U S B Y R E G I O N S ( 1 9 5 1 C L A S S I F I C A T I O N , A T T H E B O U N D A R I E S O F T H E T I M E )
I . A B S O L U T E F I G U R E S
Food, Tobacco Leather, Textiles Clothing Furniture Paper Printing, Metal Engineering beverages shoes
Clothing Paper photography
Engineering
1. Piemonte-Val d'Aosta 35.860 890 18.910 132.305 37.331 33.844 14.335 14.559 41.169 290.492 2. Liguria 12.222 456 4.060 6.311 8.021 9.238 2.159 3.779 20.446 65.484 3. Lombardia 69.674 1.132 55.171 262.886 80.156 87.668 27.965 43.952 76.967 508.850 4. Trentino Alto Adige 4.693 1.041 1.446 2.560 4.003 11.590 1.170 1.382 5.553 13.928 LO
1 Veneto 32.776 3.793 26.386 51.793 30.088 40.632 8.684 8.921 9.345 98.629 6. Friul i Venezia Giulia 8.835 797 4.392 13.020 7.011 15.032 3.015 2.510 3.837 37.067 7. Emi 1ia-Romagna 52.255 2.239 17.976 24.490 31.088 34.817 4.988 8.254 2.014 115.751
CD Marche 7.352 973 13.802 4.365 8.603 12.674 2.088 1.332 296 18.686 9. Toscana 21.259 3.452 29.926 62.342 34.869 34.660 6.406 7.440 12.102 76.050 10. Umbria 6.475 657 2.201 4.662 3.352 4.317 407 1.929 4.211 9.402 11. Lazio 18.256 1.951 6.210 5.868 15.839 17.359 6.817 23.562 1.294 45.910 12. Campania 43.113 4.624 19.637 10.913 20.057 21.756 1.850 4.775 10.398 44.891 13. Abruzzi-Molise 10.192 312 3.128 2.888 9.230 7.400 1.438 974 297 9.331 14. Puglia 26.194 2.818 6.855 5.834 17.096 14.214 1.539 2.600 2.000 20.792 15. Basi 1icata 3.108 110 1.488 722 2.667 2.296 40 219 23 2.323 Calabria 12.327 18 3.188 2.543 7.009 8.738 325 873 651 5.581 17. Sicilia 25.340 886 10.069 3.702 15.299 18.427 806 3.894 494 29.875 18. Sardegna 7.016 412 2.543 1.361 4.180 6.589 176 927 697 6.488

T A B L E A . 1 0 : 1 9 6 1 I N D U S T R I A L C E N S U S B Y R E G I O N S ( 1 9 5 1 C L A S S I F I C A T I O N , A T T H E B O U N D A R I E S O F T H E T I M E )
I . A B S O L U T E F I G U R E S
Bricks, Chemi Rubber Other TOTAL Mining Construc Public TOTAL glass, cals MANUFAC
Mining tion Utilities
tyles TURING
1. Piemonte-Val d'Aosta 29.568 32.686 13.939 10.404 706.292 7.509 95.995 14.110 823.906 2. Liguria 10.234 16.288 581 1.411 161.054 2.181 50.109 5.078 218.422 3. Lombardia 57.071 110.150 26.297 37.252 1.445.199 10.253 187.541 25.984 1.668.977 4. Trentino Alto Adige 3.113 1.802 133 745 53.159 2.994 21.572 3.717 81.442 5. Veneto 37.519 19.971 1.218 8.203 377.958 5.865 80.580 9.440 473.843 6. Friuli Venezia Giulia 6.183 3.587 1.442 618 107.346 1.954 28.487 2.245 140.032 7. Emi 1ia-Romagna 35.525 19.347 3.507 4.967 355.218 4.416 90,226 8.001 457.861 8. Marche 8.328 2.348 350 6.527 87.724 1.533 22.900 2.107 114.264 9. Toscana 46.104 17.287 1.808 2.572 356.277 20.728 63.390 5.762 446.157
10. Umbr i a 5.817 6.143 149 120 49.842 1.397 11.612 1.624 64.475 11. Lazio 17.443 16.387 2.048 1.192 180.136 5.322 62.660 8.817 256.935 12. Campania 18.001 9.729 808 2.278 212.830 3.527 43.180 7.900 267.437 13. Abruzzi-Molise 8.077 1.196 208 211 54.882 2.038 20.161 2.164 79.245 14. Puglia 10.679 2.233 392 464 113.710 5.911 29.905 5.000 154.526 15. Basi 1icata 1.159 160 28 7 14.350 558 10.957 1.019 26.884 16. Calabria 5.200 1.718 231 270 48.672 1.515 19.346 2.180 71.713 17. Sicilia 15.629 9.292 482 371 134.566 13.179 38.311 7.983 194.039 co" Sardegna 5.080 576 138 186 36.369 13.270 17.475 2.915 70.029
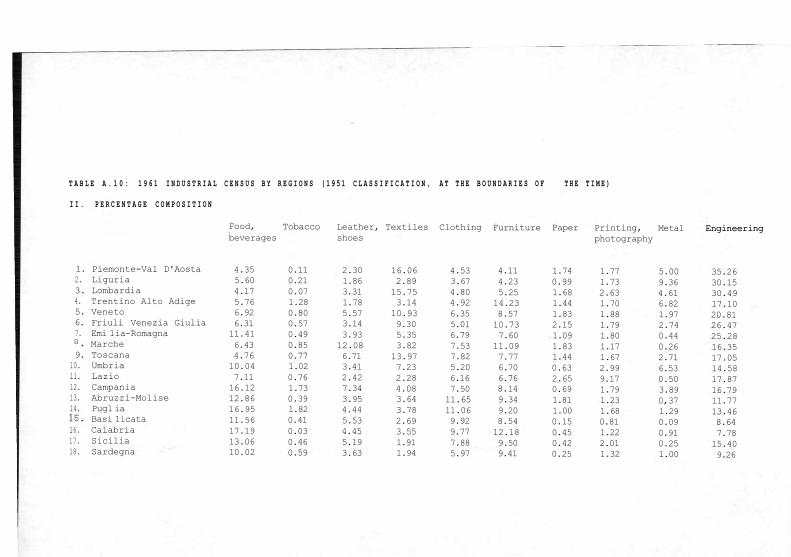
T A B L E A . 1 0 : 1 9 6 1 I N D U S T R I A L C E N S U S B Y R E G I O N S ( 1 9 5 1 C L A S S I F I C A T I O N , A T T H E B O U N D A R I E S O F T H E T I M E )
I I . P E R C E N T A G E C O M P O S I T I O N
Food, Tobacco Leather, Textiles Clothing Furniture Paper Printing, Metal Engineering beverages shoes photography
Engineering
1. Piemonte-Val D'Aosta 4.35 0.11 2.30 16.06 4.53 4.11 1.74 1.77 5.00 35.26 2. Liguria 5.60 0.21 1.86 2.89 3.67 4.23 0.99 1.73 9.36 30.15 3. Lombardia 4.17 0.07 3.31 15.75 4.80 5.25 1.68 2.63 4.61 30.49 4. Trentino Alto Adige 5.76 1.28 1.78 3.14 4.92 14.23 1.44 1.70 6.82 17.10 5. Veneto 6.92 0.80 5.57 10.93 6.35 8.57 1.83 1.88 1.97 20.81 6. Friuli Venezia Giulia 6.31 0.57 3.14 9.30 5.01 10.73 2.15 1.79 2.74 26.47 7. Emi 1ia-Romagna 11.41 0.49 3.93 5.35 6.79 7.60 1.09 1.80 0.44 25.28 CO Marche 6.43 0.85 12.08 3.82 7.53 11.09 1.83 1.17 0.26 16.35 9. Toscana 4.76 0.77 6.71 13.97 7.82 7.77 1.44 1.67 2.71 17.05 10. Umbria 10.04 1.02 3.41 7.23 5.20 6.70 0.63 2.99 6.53 14.58
11. Lazio 7.11 0.76 2.42 2.28 6.16 6.76 2.65 9.17 0.50 17.87 12. Campania 16.12 1.73 7.34 4.08 7.50 8.14 0.69 1.79 3.89 16.79 13. Abruzzi-Molise 12.86 0.39 3.95 3.64 11.65 9.34 1.81 1.23 0,37 11.77 14. Pugl ia 16.95 1.82 4.44 3.78 11.06 9.20 1.00 1.68 1.29 13.46 LO
Basi 1icata 11.56 0.41 5.53 2.69 9.92 8.54 0.15 0.81 0.09 8.64 16. Calabria 17.19 0.03 4.45 3.55 9.77 12.18 0.45 1.22 0.91 7.78 17. Sicilia 13.06 0.46 5.19 1.91 7.88 9.50 0.42 2.01 0.25 15.40 18. Sardegna 10.02 0.59 3.63 1.94 5.97 9.41 0.25 1.32 1.00 9.26

T A B L E A . 1 0 : 1 9 6 1 I N D U S T R I A L C E N S U S B Y R E G I O N S ( 1 9 5 1 C L A S S I F I C A T I O N , A T H E B O U N D A R I E S O F T H E T I M E )
I I . P E R C E N T A G E C O M P O S I T I O N
Bricks, Chemi Rubber Other TOTAL Mining Construc Public TOTAL glass, cals MANUFAC
Mining tion Utilities
tyles TURING
1. Piemonte-Val d'Aosta 3 59
3.97 1.69 1 26
85.72 0.91 11 65
1.71 100.00 2. Liguria 4
69 7.46 0.27 0.65 73.74 1.00 22
94 2.32 100.00 CO Lombardia 3
42 6.60 1.58 2
23 86.59 0.61 11
24 1.56 100.00
4. Trentino Alto Adige 3 82
2.21 0.16 0 91
65.27 3.68 26 49
4.56 100.00 5. Veneto 7
92 4.21 0.26 1
73 79.76 1.24 17
01 1.99 100.00
6. Friuli Venezia Giulia 4 42
2.56 1.03 0 44
76.66 1.40 20 34
1.60 100.00 7. Emi 1ia-Romagna 7
32 4.23 0.77 1
08 77.58 0.96 19
71 1.75 100.00
8. Marche 7 29
2.05 0.31 5 71
76.77 1.34 20 04
1.84 100.00 9. Toscana 10
33 3.87 0.41 0
58 79.85 4.65 14
21 1.29 100.00
10. Umbria 9 02
9.53 0.23 0 19
77.30 2.17 18 01
2.52 100.00 11. Lazio 6
79 6.38 0.80 0
46 70.11 2.07 24
39 3.43 100.00
12. Campania 6 73
3.64 0.30 0 85
79.58 1.32 16 15
2.95 100.00 13. Abruzzi-Molise 10
19 1.51 0.26 0
27 69.26 2.57 25
44 2.73 100.00
14. Puglia 4 91
1.45 0.25 0 30
73.53 3.83 19 35
3.24 100.00 15. Basi 1icata 4
31 0.60 0.10 0
03 53.38 2.08 40
76 3.79 100.00
16. Calabria 7 25
2.40 0.32 0 38
67.87 2.11 26 98
3.04 100.00 17. Sicilia 8
05 4.79 0.25 0
19 69.35 6.79 19
74 4.11 100.00
CO Sardegna 7
25 0.82 0.20 0
27 51.93 18.95 24
95 4.16 100.00

T A B L E A . 1 1 : 1 9 8 1 I N D U S T R I A L C E N S U S B Y R E G I O N S ( 1 9 5 1 C L A S S I F I C A T I O N , A T T H E B O U N D A R I E S O F T H E T I M E )
I . A B S O L U T E F I G U R E S
Food, beverages
Tobacco Leather, shoes
Textiles Clothing Furniture Paper Printing, photograph;
Metal Engineering
1. Piemonte-Val d'Aosta 42.482 392 10.678 72.956 38.907 27.882 13.409 21.475 46.158 413.974 2. Liguria 9.430 0 1.744 2.521 5.120 6.299 1.433 4.615 16.772 73.699 3. Lombardia 73.571 596 44.421 172.890 102.097 90.138 28.546 76.408 78.891 710.492 4. Trentino Alto Adige 5.499 609 862 2.933 3.568 13.149 2.126 2.620 5.121 29.046 5. Veneto 35.076 885 50.113 54.017 72.604 72.526 10.301 18.231 13.155 215.843 6. Friuli Venezia Giulia 8.011 352 3.442 6.979 4.322 30.380 3.990 3.587 6.324 63.893 7. Emi 1ia-Romagna 50.977 1.529 20.552 39.602 47.352 36.758 6.319 16.840 7.832 250.231 co Marche 9.959 757 52.283 7.908 23.669 27.377 3.433 2.771 2.081 47.192 9. Toscana 20.368 1.334 64.615 83.520 53.414 40.855 9.451 10.672 19.181 129.711 10. Umbria 9.650 432 2.455 8.907 13.695 6.692 1.805 2.155 8.685 22.640
11. Lazio 23.721 1.676 4.532 7.907 17.670 19.672 7.269 32.289 3.623 115.298 12. Campania 33.107 5.540 23.853 8.410 24.594 19.070 2.921 7.893 13.765 125.796 13. Abruzzi-Molise 12.793 547 5.271 4.106 18.987 8.824 2.395 1.964 2.007 38.446 14. Pugl ia 21.880 3.199 8.506 10.773 23.483 16.082 2.230 5.185 25.261 67.282 15. Basi 1icata 3.228 119 389 936 2.083 1.724 50 502 426 8.103 16. Calabria 9.397 132 981 2.227 2.855 5.999 339 1.543 1.048 14.153 17. Sicilia 17.476 670 3.787 3.891 11.167 15.312 1.802 5.888 1.860 64.203
i—i
Co Sardegna 8.447 270 765 2.987 1.993 7.389 981 1.917 4.607 18.416

T A B L E A . 1 1 : 1 9 8 1 I N D U S T R I A L C E N S U S B Y R E G I O N S ( 1 9 5 1 C L A S S I F I C A T I O N , A T T H E B O U N D A R I E S O F T H E T I M E )
I . A B S O L U T E F I G U R E S
Bricks, glass, tyles
Chemicals
Rubber Other TOTAL MANUFACTURING
Mining Constructions
Public Ut i1ities
TOTAL
1. Piemonte-Val d'Aosta 20.100 25.250 24.951 24.563 783.177 4.733 105.135 19.589 912.634 2. Liguria 7.100 12.753 806 3.508 145.800 1.291 39.008 7.462 193.561 3. Lombardia 45.908 116.998 24.095 64.041 1.629.092 10.187 223.991 30.446 1.893.716 4. Trentino Alto Adige 3.333 2.602 623 3.265 75.356 2.970 33.571 3.504 115.401 5. Veneto 39.354 25.548 6.267 23.616 637.536 3.754 125.701 14.596 781.587 6. Friuli Venezia Giulia 7.104 3.904 673 2.312 145.219 1.793 49.177 3.948 200.137 7. Emi 1ia-Romagna 62.426 20.677 4.028 18.389 583.512 4.066 126.850 12.231 726.659 8. Marche 7.999 3.477 2.762 11.081 202.749 1.519 45.338 3.845 253.451 9. Toscana 37.986 19.581 2.466 11.752 504.906 8.668 86.958 11.570 612.102
10. Umbria 8.755 5.849 368 1.707 93.795 1.183 23.240 2.833 121.051 11. Lazio 19.410 24.936 7.038 5.193 290.234 5.501 76.796 16.820 389.351 12. Campania 18.564 12.687 2.134 7.009 305.343 2.211 66.158 12.408 386.120 13. Abruzzi-Molise 13.179 3.183 1.428 2.750 115.880 1.544 43.427 4.321 165.172 14. Pugl ia 14.336 7.821 4.031 2.829 212.898 3.869 64.486 7.935 289.188 15. Basi 1icata 2.394 4.046 227 546 24.773 773 20.290 2.172 48.008 16. Calabria 6.340 3.533 675 488 49.710 575 32.856 4.697 87.838 17. Sicilia 16.532 18.310 2.687 2.746 166.331 6.361 64.875 12.866 250.433 18. Sardegna 7.278 11.435 650 826 67.961 6.247 36.752 5.881 166.841

T A B L E A . 1 1 : 1 9 8 1 I N D U S T R I A L C E N S U S B Y R E G I O N S ( 1 9 5 1 C L A S S I F I C A T I O N , A T T H E B O U N D A R I E S O F T H E T I M E )
I I . P E R C E N T A G E C O M P O S I T I O N
Food, Tobacco Leather, Textiles beverages shoes Food, Tobacco Leather, Textiles Clothing Furniture Paper Printing, Metal Engineering beverages shoes photography
Engineering
1. Piemonte-Val D'Aosta 4.65 0.04 1.17 7.99 4.26 3.06 1.47 2.35 5.06 45.36 2. Liguria 4.87 0.00 0.90 1.30 2.65 3.25 0.74 2.38 8.66 38.08 3. Lombardia 3.89 0.03 2.35 9.13 5.39 4.76 1.51 4.03 4.17 37.52 4. Trentino Alto Adige 4.77 0.53 0.75 2.54 3.09 11.39 1.84 2.27 4.44 25.17 5. Veneto 4.49 0.11 6.41 6.91 9.29 9.28 1.32 2.33 1.68 27.62 6. Friuli Venezia Giulia 4.00 0.18 1.72 3.49 2.16 15.18 1.99 1.79 3.16 31.90 7. Emi 1ia-Romagna 7.02 0.21 2.83 5.45 6.52 5.06 0.87 2.32 1.08 34.44 8. Marche 3.93 0.30 20.63 3.12 9.34 10.80 1.35 1.09 0.82 18.62 9. Toscana 3.33 0.22 10.56 13.64 8.73 6.67 1.54 1.74 3.13 21.19
10. Umbria 7.97 0.36 2.03 7.36 11.31 5.53 1.49 1.78 7.17 18.70 11. Lazio 6.09 0.43 1.16 2.03 4.54 5.05 1.87 8.29 0.93 29.61 12. Campania 8.57 1.43 6.18 2.18 6.37 4.94 0.76 2.04 3.56 32.58 13. Abruzzi-Molise 7.75 0.33 3.19 2.49 11.50 5.34 1.45 1.19 1.22 23.28 14. Puglia 7.57 1.11 2.94 3.73 8.12 5.56 0.77 1.79 8.74 23.27 15. Basi 1icata 6.72 0.25 0.81 1.95 4.34 3.59 0.10 1.05 0.89 16.88 16. Calabria 10.70 0.15 1.12 2.54 3.25 6.83 0.39 1.76 1.19 16.11 17. Sicilia 6.98 0.27 1.51 1.55 4.46 6.11 0.72 2.35 0.74 25.64 18. Sardegna 7.23 0.23 0.65 2.56 1.17 6.32 0.84 1.64 3.94 15.76

T A B L E A . 1 1 : 1 9 8 1 I N D U S T R I A L C E N S U S B Y R E G I O N S ( 1 9 5 1 C L A S S I F I C A T I O N , A T T H E B O U N D A R I E S O F T H E T I M E )
I I . P E R C E N T A G E C O M P O S I T I O N
Bricks, glass, tyles
Chemicals
Rubber Other TOTAL MANUFACTURING
Mining Construction
Public Utilities
TOTAL
1. Piemonte-Val d'Aosta 2.20 2.77 2.73 2.69 85.82 0.52 11.52 2.15 100.00 2. Liguria 3.67 6.59 0.42 1.81 75.33 0.67 20.15 3.86 100.00 3. Lombardia 2.42 6.18 1.27 3.38 86.03 0.54 11.83 1.61 100.00 4 . Trentino Alto Adige 2.89 2.25 0.54 2.83 65.30 2.57 29.09 3.04 100.00 5. Veneto 5.04 3.27 0.80 3.02 81.57 0.48 16.08 1.87 100.00 6. Friuli Venezia Giulia 3.55 1.95 0.34 1.16 72.56 0.90 24.57 1.97 100.00 7. Emi 1 ia-Romagna 8.59 2.85 0.55 2.53 80.30 0.56 17.46 1.68 100.00 8. Marche 3.16 1.37 1.09 4.37 80.00 0.60 17.89 1.52 100.00 9. Toscana 6.21 3.20 0.40 1.92 82.49 1.42 14.21 1.89 100.00
10. Umbria 7.23 4.83 0.30 1.41 77.48 0.98 19.20 2.34 100.00 11. Lazio 4.99 6.40 1.81 1.33 74.54 1.41 19.72 4.32 100.00 12. Campania 4.81 3.29 0.55 1.82 79.08 0.57 17.13 3.21 100.00
Abruzzi-Molise 7.98 1.93 0.86 1.66 70.16 0.93 26.29 2.62 100.00 14. Puglia 4.96 2.70 1.39 0.98 73.62 1.34 22.30 2.74 100.00 15. Basi 1icata 4.99 8.43 0.47 1.14 51.60 1.61 42.26 4.52 100.00 16. Calabria 7.22 4.02 0.77 0.56 56.59 0.65 37.41 5.35 100.00 17. Sici 1 ia 6.60 7.31 1.07 1.10 66.42 2.54 25.91 5.14 100.00 18. Sardegna 6.23 9.79 0.56 0.71 58.17 5.35 31.45 5.03 100.00