Embed Size (px)
Citation preview
NBER WORKING PAPER SERIES
A CENTURY OF CAPITAL STRUCTURE:THE LEVERAGING OF CORPORATE AMERICA
John R. GrahamMark T. Leary
Michael R. Roberts
Working Paper 19910http://www.nber.org/papers/w19910
NATIONAL BUREAU OF ECONOMIC RESEARCH1050 Massachusetts Avenue
Cambridge, MA 02138February 2014
We thank Bill Schwert (editor), Malcolm Baker, an anonymous referee; Andy Abel, Effi Benmelech,Charles Calomiris, Murray Frank, Joao Gomes, Boyan Jovanovich, Stew Myers, Ken Singleton, IlyaStrebulaev; seminar participants at Duke University, Georgetown University, Miami University, MIT,Notre Dame, the SEC, Rutgers University, Stanford University, University of Oklahoma, Universityof British Columbia, University of California San Diego, University of Chicago, University of Colorado,University of Illinois, University of Pennsylvania, University of Utah, Vanderbilt University, YaleUniversity; and conference participants at the 2013 American Economics Association, ASU WinterFinance Conference, Financial Management Association, NBER, and SITE for helpful comments.We also thank many research assistants for their help gathering data. Roberts gratefully acknowledgesfinancial support from an Aronson, Johnson and Ortiz Fellowship and Geewax-Terker Fellowship,and support from the Jacobs Levy Equity Management Center for Quantitative Financial Research.The views expressed herein are those of the authors and do not necessarily reflect the views of theNational Bureau of Economic Research.
NBER working papers are circulated for discussion and comment purposes. They have not been peer-reviewed or been subject to the review by the NBER Board of Directors that accompanies officialNBER publications.
© 2014 by John R. Graham, Mark T. Leary, and Michael R. Roberts. All rights reserved. Short sectionsof text, not to exceed two paragraphs, may be quoted without explicit permission provided that fullcredit, including © notice, is given to the source.
A Century of Capital Structure: The Leveraging of Corporate AmericaJohn R. Graham, Mark T. Leary, and Michael R. RobertsNBER Working Paper No. 19910February 2014JEL No. E44,E62,G32
ABSTRACT
Unregulated U.S. corporations dramatically increased their debt usage over the past century. Aggregateleverage – low and stable before 1945 – more than tripled between 1945 and 1970 from 11% to 35%,eventually reaching 47% by the early 1990s. The median firm in 1946 had no debt, but by 1970 hada leverage ratio of 31%. This increase occurred in all unregulated industries and affected firms of allsizes. Changing firm characteristics are unable to account for this increase. Rather, changes in governmentborrowing, macroeconomic uncertainty, and financial sector development play a more prominent role.Despite this increase among unregulated firms, a combination of stable debt usage among regulatedfirms and a decrease in the fraction of aggregate assets held by regulated firms over this period resultedin a relatively stable economy-wide leverage ratio during the 20th century.
John R. GrahamDuke UniversityFuqua School of Business100 Fuqua DriveDurham, NC 27708-0120and [email protected]
Mark T. LearyOlin Business SchoolWashington University in St. LouisCampus Box 1133, One Brookings DriveSt. Louis, MO 63130and [email protected]
Michael R. RobertsThe Wharton SchoolUniversity of Pennsylvania3620 Locust Walk, #2320Philadelphia, PA 19104and [email protected]
1
1. Introduction
This paper sheds light on the evolution and determination of corporate financial policy by
analyzing a unique, panel dataset containing accounting and financial market information for
U.S. nonfinancial publicly-traded firms over the last century. Our analysis is organized around
three questions. First, how have corporate capital structures changed over the past 100 years?
Second, do existing empirical models of capital structure account for these changes? And, third,
if not explained by existing empirical models, what forces are behind variation in financial
policy over the last century?
We begin by showing that the aggregate leverage ratio (i.e., debt-to-capital) of
unregulated firms was low and stable, varying between 10% and 15%, from 1920 to 1945. In
contrast, leverage more than tripled, from 11% to 35%, between 1945 and 1970. Since then,
leverage has remained above 35%, peaking at 47% in 1992. Combined with an increase in non-
debt liabilities, the aggregate corporate balance sheet shifted from 25% liabilities in the 1930s to
over 65% liabilities by 1990.
This change is robust, observed in a variety of leverage measures that reveal additional
insights into the changing nature of financial policy over the last century. For example, we show
that debt gradually substituted for preferred equity between 1920 and 1960, when relatively little
preferred equity remained. We also show that cash holdings exhibited a secular decrease
concomitant with the secular increase in debt usage. In aggregate, cash and short-term
investments accounted for nearly 25% of assets in 1945, but fell to 6% by 1970 when cash began
a moderate climb to just over 10% in 2010. As a result, measuring leverage net of liquid assets
reveals an even more pronounced levering up of unregulated firms during the last century.
2
Further analysis reveals that these aggregate trends are systemic. The leverage series of
each unregulated industry – defined by the Fama and French 12-industry classification – exhibits
a pattern similar to that found in the aggregate. The leverage of each size-based portfolio of firms
– defined by the highest, middle, and lowest quintile of the annual size distribution – also
exhibits a pattern similar to that of the aggregate. The median firm had no debt in its capital
structure in 1946, but by 1970 had a leverage ratio of 31%. Finally, the fraction of investment
financed with debt doubled from approximately 10% in the pre-WW II era to over 20% after
1970.
These patterns are in contrast to those for nonfinancial regulated firms (e.g., utilities,
railroads, and communications), for which the aggregate debt to capital ratio was fairly stable
over the century. The changing relative indebtedness of regulated and unregulated firms, along
with changes in the relative asset sizes of the two sectors, led to a largely stable economy-wide
corporate leverage ratio (Frank and Goyal, 2008) that masked the secular increase experienced
by most unregulated firms. Our paper focuses on this increase in leverage among unregulated
firms.
Having established the dramatic increase in leverage among unregulated firms, we first
ask to what extent this trend can be accounted for by changing firm characteristics identified in
prior studies as capital structure determinants (e.g. Rajan and Zingales, 1995; Frank and Goyal,
2009). The answer is not much, if at all. We estimate regressions of leverage on firm
characteristics using pre-WW II data. Predicted leverage computed using realized firm
characteristics is flat to declining from 1945 through the end of our sample period – in stark
contrast to the increase in observed leverage over this period. Inspection of individual
characteristics reveals that, with the possible exceptions of earnings volatility and firm size, none
3
of the average or aggregate characteristics change over the century in a way that would support
greater debt capacity or higher optimal leverage. Alternative estimation periods and model
extensions, such as time-varying parameters and nonlinear relations, do not improve the out of
sample fit. Thus, any explanation for these secular trends in financial policy must come from
sources of variation not central to the existing capital structure literature.
The inability of firm characteristics to account for the shift in leverage policies over time
suggests either omitted firm characteristics that have yet to be identified, or macroeconomic
factors that altered firms’ propensities to use debt. We therefore turn to our final set of analyses,
which examines macroeconomics factors capturing changes in the economic environment that
are theoretically relevant for financial policy. These factors capture changes to taxes, economic
uncertainty, financial sector development, managerial incentives, and government borrowing.
While a complete investigation into each underlying theory is beyond the scope of this paper, our
results provide suggestive evidence.
Specifically, one of the more robust relations that we find is a negative association
between corporate leverage and government leverage, the latter defined as the ratio of Federal
debt held by the public to GDP. A one standard deviation increase in government leverage is
associated with a one-quarter standard deviation decrease in aggregate corporate leverage. This
marginal effect on capital structure is significantly larger than that of other macroeconomic
factors, such as GDP growth, inflation, and the BAA-AAA corporate bond yield spread, as well
as firm characteristics, such as profit margins, asset growth, and the market-to-book equity ratio.
This negative relation holds not just for the level of debt but also for the flows of debt in the two
sectors. Thus, when the government reduces debt issuance, corporations increase their use of
debt relative to equity, resulting in an increase in corporate leverage.
4
There are several potential mechanisms behind these findings. First, our results are
consistent with government deficit financing crowding out corporate debt financing through
competition for investor funds (Friedman, 1978). Second, and closely related, market
imperfections, such as taxes (McDonald, 1983), informational frictions (Greenwood, Hansen,
and Stein, 2010) and transaction costs (Krishnamurthy and Vissing-Jorgensen, 2012) generate an
imperfectly elastic demand curve for corporate debt, as investors are no longer able to costlessly
transform return streams from corporations to match their consumption needs. Consequently,
fluctuations in the supply of government debt, a substitute for corporate debt, can shift the
demand curve for corporate debt in a manner that affects equilibrium quantities.
Alternatively, the supply of government debt may proxy for latent investment
opportunities. Increases in the supply of Treasuries tend to occur during economic downturns
when firms’ investment opportunities are poor and their need for external capital falls. Because
debt is the primary source of external capital (Gorton and Winton, 2003), corporate leverage
falls. In this case, the relation between leverage and government borrowing may reflect
fluctuations in unmeasured investment opportunities.
We also find a positive relation between corporate financial policy and the output of the
financial sector from business credit and equity (Philippon, 2012). This relation exists with both
leverage and the fraction of investment funded with debt, implying a potentially important role
for the development of financial institutions and markets. However, other measures of financial
market development, such as the fraction of debt and equity held through intermediaries, are not
robustly correlated with aggregate leverage.
While other macroeconomic factors appear related to corporate leverage on visual
inspection, further analysis reveals that these relations are not statistically distinct from a time
5
trend. For example, corporate taxes underwent 30 revisions over the past century and increased
10% to 52% between 1920 and 1950. Yet, we find no significant times-series relation between
taxes and the margin between debt usage and common equity, in large part because of a near
decade long delay in the response of leverage to tax changes. (As detailed below, we do however
find a more robust positive relation between taxes and the use of debt relative to preferred equity
in the early part of the century.) Measures of economic uncertainty and aggregate risk, both of
which proxy for expected distress costs, are negatively correlated with leverage, but show no
relation after controlling for other leverage determinants. Finally, we find little evidence of a
relation between proxies for managerial incentives and leverage in the aggregate.
Our primary data include a comprehensive set of balance sheet and income statement
variables for each industrial firm on CRSP back to 1920. Prior studies use alternative data
sources to examine components of the broader trends and issues explored here. Using aggregate
data, some authors note a fairly stable leverage ratio over time (Sametz, 1964; Wright, 2004;
Frank and Goyal, 2008) while others note varying degrees of increase in the leverage ratio during
the post-WW II era (e.g., Miller, 1977; Taggart, 1981; McDonald, 1983).1 Using Compustat
data, Gordon and Malkiel (1981), Philippon (2009), Strebulaev and Yang (2013), and DeAngelo
and Roll (2013) document an increase in leverage and a decrease in the proportion of
conservatively levered firms in the second half of the 20th century. Finally, Ciccolo (1981) and
DeAngelo and Roll (2013) collect data extending back to the early part of the 20th century for 50
and 24 firms, respectively. The former study finds evidence of increasing debt usage and
substitution of debt in place of preferred stock; the latter emphasizes within-firm variation in
leverage.
1 Other studies documenting varying degrees of aggregate leverage increases beginning in the middle of the 20th century include von Furstenberg (1977) and Holland and Myers (1979). Among these earlier studies identifying leverage increases, there is also disagreement about the permanence of the increase.
6
The unique breadth of our data and the scope of our analyses enable us to make several
contributions to the capital structure literature. First, we provide a more complete picture of
capital structure that identifies three distinct eras in both the aggregate and the cross-sectional
distribution of firms’ financial policies over the last 100 years and highlights a broad-based,
steep increase in leverage in the middle of the 20th century. Second, we identify sharp differences
between regulated and unregulated sectors, and distinct similarities among unregulated industries
and firms of different sizes. Third, we show that traditional empirical models of capital structure
based on firm characteristics fall short in explaining the capital structure trends that we
document. Rather, changes in the broader economic and institutional environments play a more
prominent role in explaining the changes in corporate financial policy over the last century. An
important feature of our data is the ability to avoid the selection biases affecting samples
conditioned on firm survival, such as the pre-1962 Compustat data.2
The remainder of the paper proceeds as follows. In Section 2 we discuss our data and
sample selection. In Section 3 we examine trends in corporate financial policy over the last
century at the aggregate, industry, and firm level. In Section 4 we outline a theoretical
framework for understanding why leverage has undergone such a dramatic change. Section 5
explores the ability of firm characteristics to account for the increase in leverage, while Section 6
focuses on changes in the economic environment. Recognizing that this analysis mostly
documents correlations, we discuss the opportunities and challenges that remain for future
research and conclude in Section 7.
2. Sample selection and summary statistics
2 As many authors (e.g., Opler et al., 1999) note, pre-1962 Compustat data are backfilled to the 1950s and consequently any inferences with these data may be an artifact of survivorship bias. As such, almost all studies ignore pre-1962 Compustat data.

7
Our sample frame begins with all firms listed in the Center for Research in Security
Prices (CRSP) monthly stock files. This frame includes all firms listed on the New York Stock
Exchange (NYSE) since 1925, all firms listed on the American Stock Exchange (AMEX) since
1962, and all firms listed on the NASDAQ since 1972. For these firms, stock market data come
from CRSP. Accounting data are obtained from two sources: Standard and Poor’s (S&P)
Compustat database and data hand-collected from Moody’s Industrial manuals. We exclude
financial firms from all of our analysis. The end result is an unbalanced firm-year panel
beginning in 1920 and ending in 2010.
Because of different institutional environments, we distinguish between two sectors of
the economy that we loosely refer to as regulated (utilities, railroads, and telecommunications)
and unregulated (all other nonfinancial industries). We recognize that regulatory status is
dynamic, heterogeneous, and extends beyond our classification (e.g., airlines). Thus, we
emphasize that these are merely labels used to identify a division in our data. This division
permits us to avoid confounding our results with financial policy that is governed primarily by
the industry-specific regulatory environment, and to maintain consistency with previous capital
structure research. For the most part, we focus our attention on the unregulated sector but discuss
and analyze the regulated sector where relevant.
Table 1 presents summary statistics for the unregulated sector of the economy. In
addition to their descriptive value, these results provide a context for subsequent analysis.3 Panel
A presents aggregate measures of firm characteristics and macroeconomic variables. Aggregate
firm characteristics are computed as the ratio of sums over firms within each year. Panel B
presents results for the firm-year panel. Panel C presents average firm characteristics by decade. 3 Appendix A details the data sources and variable construction.
8
3. Trends in corporate leverage
3.1. Aggregate trends
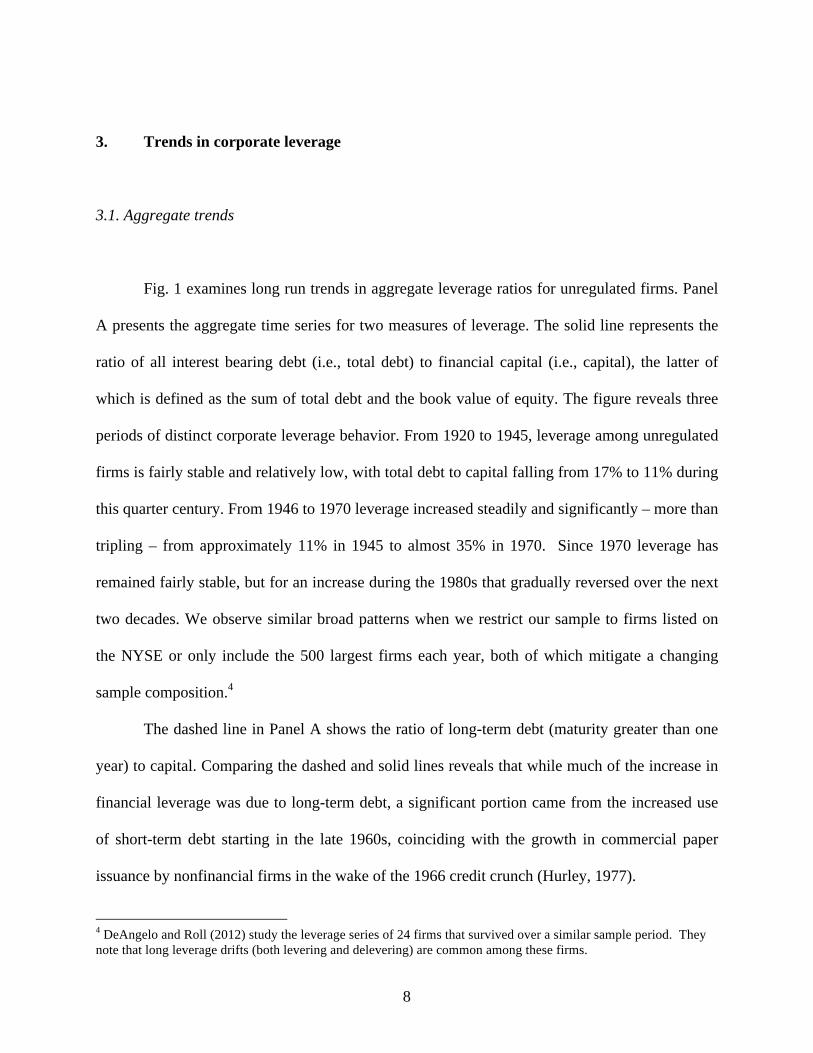
Fig. 1 examines long run trends in aggregate leverage ratios for unregulated firms. Panel
A presents the aggregate time series for two measures of leverage. The solid line represents the
ratio of all interest bearing debt (i.e., total debt) to financial capital (i.e., capital), the latter of
which is defined as the sum of total debt and the book value of equity. The figure reveals three
periods of distinct corporate leverage behavior. From 1920 to 1945, leverage among unregulated
firms is fairly stable and relatively low, with total debt to capital falling from 17% to 11% during
this quarter century. From 1946 to 1970 leverage increased steadily and significantly – more than
tripling – from approximately 11% in 1945 to almost 35% in 1970. Since 1970 leverage has
remained fairly stable, but for an increase during the 1980s that gradually reversed over the next
two decades. We observe similar broad patterns when we restrict our sample to firms listed on
the NYSE or only include the 500 largest firms each year, both of which mitigate a changing
sample composition.4
The dashed line in Panel A shows the ratio of long-term debt (maturity greater than one
year) to capital. Comparing the dashed and solid lines reveals that while much of the increase in
financial leverage was due to long-term debt, a significant portion came from the increased use
of short-term debt starting in the late 1960s, coinciding with the growth in commercial paper
issuance by nonfinancial firms in the wake of the 1966 credit crunch (Hurley, 1977).
4 DeAngelo and Roll (2012) study the leverage series of 24 firms that survived over a similar sample period. They note that long leverage drifts (both levering and delevering) are common among these firms.

9
The measures in Panel A isolate variation in leverage to that associated with changes in
financial liabilities (Welch, 2011). However, the debt-to-capital measure excludes non-debt
liabilities, which, like financial debt, represent a claim on the firm’s assets that is senior to
equity. As such, we examine the ratio of total liabilities to total assets in Panel B.
Complementing the increase in financial leverage observed in Panel A is a secular increase in
non-debt liabilities, such as pensions and accounts payable, beginning in 1970.5 The combined
result is a dramatic shift in the composition of corporate balance sheets. Total liabilities
represented between 20% and 25% of assets in the 1920s and 1930s, but increased to over 65%
of assets by the early 1990s before declining to 56% by 2010.
Fig. 2 presents time series of several alternative leverage measures. Thus far all the
presented measures of leverage are in book, or accounting terms. While book value ratios are
often the focus of financing decisions, particularly as they pertain to credit (Chava and Roberts
(2008)), some authors have argued that market value ratios are more economically meaningful
for some firms (e.g., Welch, 2004).6 As such, the dashed line in Panel A presents a market-based
measure of leverage that replaces the book value of equity in our definition of capital with the
equity market capitalization of the firm. We must still rely on a book value of debt because of
data constraints, but the variation in equity dominates that of debt even in market terms
(Schaeffer and Strebulaev, 2008). The results show a more volatile time-series driven by
fluctuations in equity market valuations but a broadly similar pattern in which initially low
leverage increases to a higher level post-1970. One noticeable difference is in the timing and
duration of the leverage run-up, which in Panel C starts only in the mid-1960s and peaks around
5 The temporary spike in non-debt liabilities in the early 1940s was due mainly to increases in Federal income tax reserves reflecting a sharp increase in war-related tax obligations. 6 On the other hand, if assets in place support more debt capacity than do future investment opportunities (Myers, 1977), book leverage may be the more appropriate measure.

10
1974. Market leverage is fairly stable until the 1960s due to rising equity values in the 1950s,
and experiences a sharp decline coinciding with the bull market of the 1990s.
The solid line in Panel A treats preferred equity as debt and thus includes it in the
numerator and denominator of the debt to capital ratio (e.g., Fama and French, 2005 and Huang
and Ritter, 2009). The ratio of debt plus preferred equity to capital is quite stable between 1940
and 1960, suggesting that much of the increase in leverage over this period was due to
substitution between debt and preferred equity rather than substitution between debt and
common equity. Indeed, preferred stock was over 13% of aggregate assets in the early 1920s, but
only 2% of assets in 1960. While there are several components affecting the timing of this
secular shift, the alternative measures in Panel C continue to show the same broad pattern: a
substantial shift toward higher leverage in the middle of the century.
Finally, Panel B shows that corporate cash holdings also underwent a significant change
over the last century that mirrors the change in leverage. The solid line shows the aggregate ratio
of cash and marketable securities to assets. It has been well documented that corporate cash
holdings have increased over the past three decades (Bates et al., 2009). Notably, looking across
the century, we see that cash holdings peaked at nearly 25% of assets in 1945, and then steadily
declined through 1970, roughly the same period over which leverage increased.7 As a result, the
ratio of net debt (debt minus cash) to assets has changed even more dramatically, from -16% in
1945 to 21% in 1970.
Because of the similarity of results across samples and leverage definitions, we focus our
analysis and discussion on the ratio of total debt to capital. Doing so avoids redundancy in
7 Opler et al. (1999) also note a decline in cash to asset ratios in the 1950s and 1960s for subsamples of small and large firms using Compustat data. However, the authors note that because they are limited to Compustat, they cannot discern whether this trend is an artifact of the aforementioned survivorship bias. Our data allow us to overcome this limitation.

11
exposition. Nonetheless, the majority of our analysis is repeated using the alternative leverage
definitions just discussed, as well as on various subsamples. We note when differences or
similarities in results have a material effect on our inferences.
3.2. Cross-sectional and industry trends
Fig. 3 examines the evolution of the cross-sectional leverage distribution by plotting the
annual quartiles of leverage year-by-year. Evident from Panel A is that the change in aggregate
leverage observed in Fig. 1 reflects a broad-based shift in financial policy. All three quartile
breakpoints move in tandem. Interestingly, the median firm was unlevered in the late-1930s and
the mid-1940s and at least a quarter of the sample firms were unlevered in each year from 1920
through 1950. Thus, the secular increase in leverage was associated with an increase in leverage
across the entire distribution of firms and an increase in the propensity to use debt.
Also apparent is a thickening left tail of the leverage distribution in recent decades for the
full sample (top left plot). While the third quartile has remained fairly stable, the median and
especially first quartile of the Full Sample leverage distribution have steadily declined since
1980. By the end of the sample period, the first quartile is back near its pre-war level of zero.
Contrasting the full sample distribution to that of NYSE listed firms (upper right plot) suggests
that the decline in the median and first quartile of leverage since 1980 might be related to the
entry of smaller, NASDAQ-listed firms. When we restrict our attention to NYSE firms, all three
quartile breakpoints remain fairly stable from 1970 through the end of the sample period. We
explore this phenomenon in more detail in Section 4 below.
12
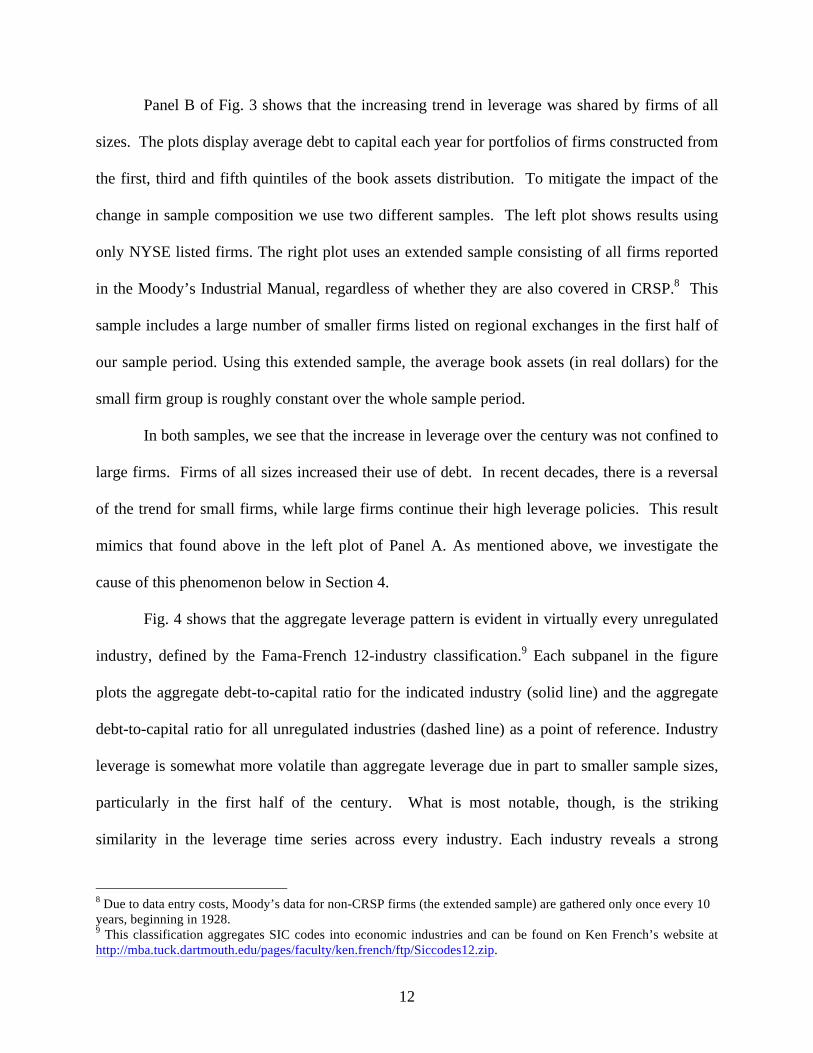
Panel B of Fig. 3 shows that the increasing trend in leverage was shared by firms of all
sizes. The plots display average debt to capital each year for portfolios of firms constructed from
the first, third and fifth quintiles of the book assets distribution. To mitigate the impact of the
change in sample composition we use two different samples. The left plot shows results using
only NYSE listed firms. The right plot uses an extended sample consisting of all firms reported
in the Moody’s Industrial Manual, regardless of whether they are also covered in CRSP.8 This
sample includes a large number of smaller firms listed on regional exchanges in the first half of
our sample period. Using this extended sample, the average book assets (in real dollars) for the
small firm group is roughly constant over the whole sample period.
In both samples, we see that the increase in leverage over the century was not confined to
large firms. Firms of all sizes increased their use of debt. In recent decades, there is a reversal
of the trend for small firms, while large firms continue their high leverage policies. This result
mimics that found above in the left plot of Panel A. As mentioned above, we investigate the
cause of this phenomenon below in Section 4.
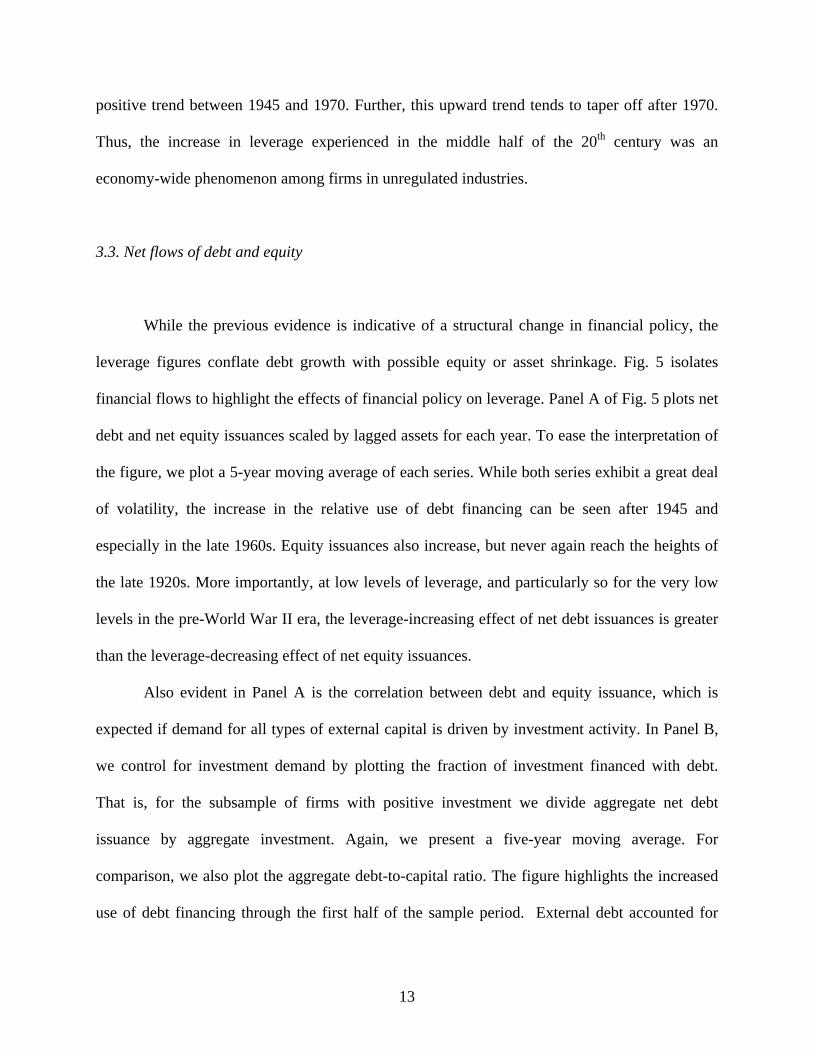
Fig. 4 shows that the aggregate leverage pattern is evident in virtually every unregulated
industry, defined by the Fama-French 12-industry classification.9 Each subpanel in the figure
plots the aggregate debt-to-capital ratio for the indicated industry (solid line) and the aggregate
debt-to-capital ratio for all unregulated industries (dashed line) as a point of reference. Industry
leverage is somewhat more volatile than aggregate leverage due in part to smaller sample sizes,
particularly in the first half of the century. What is most notable, though, is the striking
similarity in the leverage time series across every industry. Each industry reveals a strong
8 Due to data entry costs, Moody’s data for non-CRSP firms (the extended sample) are gathered only once every 10 years, beginning in 1928. 9 This classification aggregates SIC codes into economic industries and can be found on Ken French’s website at http://mba.tuck.dartmouth.edu/pages/faculty/ken.french/ftp/Siccodes12.zip.
13
positive trend between 1945 and 1970. Further, this upward trend tends to taper off after 1970.
Thus, the increase in leverage experienced in the middle half of the 20th century was an
economy-wide phenomenon among firms in unregulated industries.
3.3. Net flows of debt and equity
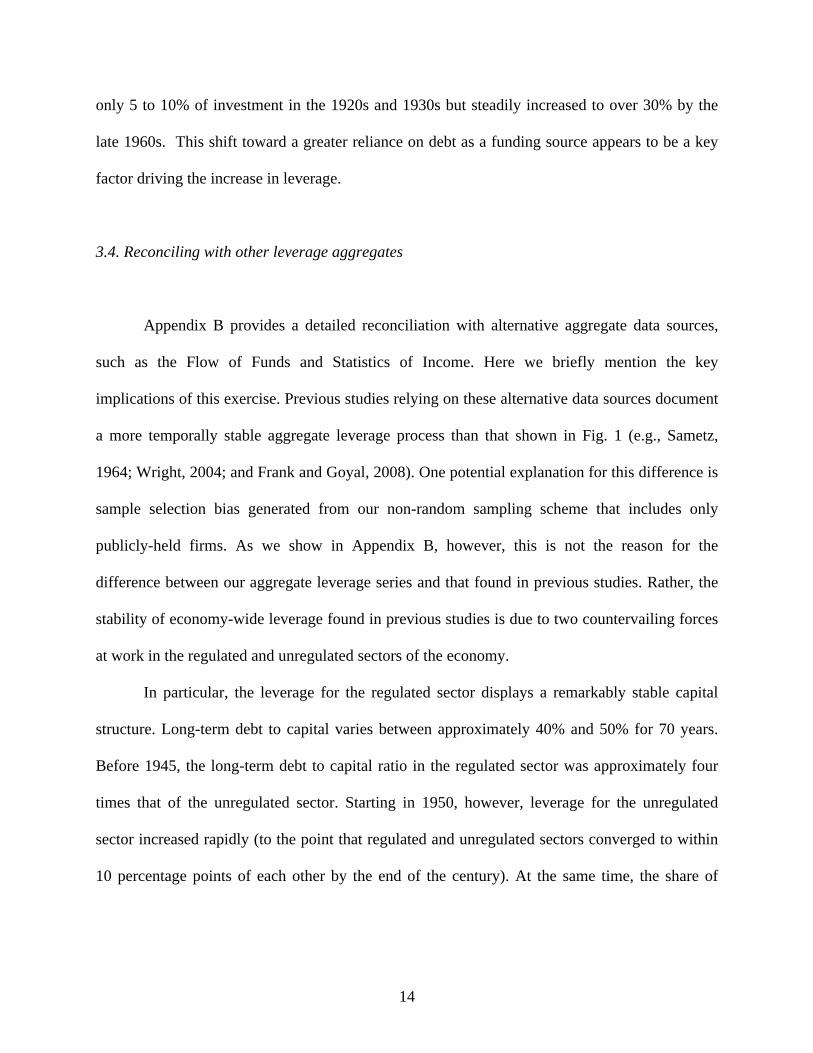
While the previous evidence is indicative of a structural change in financial policy, the
leverage figures conflate debt growth with possible equity or asset shrinkage. Fig. 5 isolates
financial flows to highlight the effects of financial policy on leverage. Panel A of Fig. 5 plots net
debt and net equity issuances scaled by lagged assets for each year. To ease the interpretation of
the figure, we plot a 5-year moving average of each series. While both series exhibit a great deal
of volatility, the increase in the relative use of debt financing can be seen after 1945 and
especially in the late 1960s. Equity issuances also increase, but never again reach the heights of
the late 1920s. More importantly, at low levels of leverage, and particularly so for the very low
levels in the pre-World War II era, the leverage-increasing effect of net debt issuances is greater
than the leverage-decreasing effect of net equity issuances.
Also evident in Panel A is the correlation between debt and equity issuance, which is
expected if demand for all types of external capital is driven by investment activity. In Panel B,
we control for investment demand by plotting the fraction of investment financed with debt.
That is, for the subsample of firms with positive investment we divide aggregate net debt
issuance by aggregate investment. Again, we present a five-year moving average. For
comparison, we also plot the aggregate debt-to-capital ratio. The figure highlights the increased
use of debt financing through the first half of the sample period. External debt accounted for
14
only 5 to 10% of investment in the 1920s and 1930s but steadily increased to over 30% by the
late 1960s. This shift toward a greater reliance on debt as a funding source appears to be a key
factor driving the increase in leverage.
3.4. Reconciling with other leverage aggregates
Appendix B provides a detailed reconciliation with alternative aggregate data sources,
such as the Flow of Funds and Statistics of Income. Here we briefly mention the key
implications of this exercise. Previous studies relying on these alternative data sources document
a more temporally stable aggregate leverage process than that shown in Fig. 1 (e.g., Sametz,
1964; Wright, 2004; and Frank and Goyal, 2008). One potential explanation for this difference is
sample selection bias generated from our non-random sampling scheme that includes only
publicly-held firms. As we show in Appendix B, however, this is not the reason for the
difference between our aggregate leverage series and that found in previous studies. Rather, the
stability of economy-wide leverage found in previous studies is due to two countervailing forces
at work in the regulated and unregulated sectors of the economy.
In particular, the leverage for the regulated sector displays a remarkably stable capital
structure. Long-term debt to capital varies between approximately 40% and 50% for 70 years.
Before 1945, the long-term debt to capital ratio in the regulated sector was approximately four
times that of the unregulated sector. Starting in 1950, however, leverage for the unregulated
sector increased rapidly (to the point that regulated and unregulated sectors converged to within
10 percentage points of each other by the end of the century). At the same time, the share of

15
assets for the regulated sector declined from a peak of 43% in 1934 to 26% by 1950. The net
effect is a relatively stable economy-wide aggregate capital structure.
3.5. Summary of financial policy trends
Our analysis of corporate balance sheet data from 1920 through 2010 reveals the
following stylized facts:
1. The composition of the aggregate balance sheet of the unregulated industrial sector
underwent a transformation over the past century, from less than 25% liabilities in the
1930s to more than 60% by 1990.
2. This shift was largely driven by a systemic change in financial leverage that affected
firms of all sizes and all unregulated industries. The median firm was unlevered in 1945
but had a debt to capital ratio exceeding 30% by 1970.
3. Cash balances fell from nearly 25% of assets at the end of WW II to 6% of assets in
1970, leading to an even greater change in net leverage. The aggregate cash ratio has
rebounded in recent decades but not to previous levels.
4. Preferred stock accounted for 10 - 15% of assets in the 1920s, but all but disappeared
from corporate balance sheets by the 1960s. Corporate debt appears to have replaced this
disappearing preferred equity.
5. By contrast, the leverage ratio and financial policy of the regulated sector has been
remarkably stable, with a long-term debt-to-capital ratio that varies between 40% and
50%. The aggregate debt ratio for the economy also remained relatively stable.
16
Why did regulated industries’ leverage ratios remain both high and stable for so long?
Why did leverage ratios in unregulated industries increase so dramatically? A complete answer
to either question is beyond the scope of any one paper. In the remainder of our study, we focus
attention on the latter, for which existing theory is most applicable and for consistency with the
existing capital structure literature. The former question requires an investigation into the
industry-specific regulatory structures that govern the behavior of regulated industries, such as
railroads and utilities. We postpone this analysis to future research.
4. Theoretical framework
While many theories of capital structure have been developed, most are presented in a
cross-sectional, microeconomic context. Because we are interested in understanding changes in
aggregate leverage, we now discuss a model that highlights predictions in an aggregate context.
Taggart (1985) points out that aggregate leverage is determined by the interaction of the supply
of securities by firms and demands for those securities by investors. Fig. 6 presents some
intuition based on a generalization of Miller (1977). On the horizontal axis is the aggregate
quantity of corporate debt (D), and on the vertical axis is the risk-adjusted return on debt (r*D)
and equity (r*E). Using returns on the y-axis instead of prices implies, as in Miller (1977), that
the slopes of the supply and demand curves are reversed from traditional exposition. Investment
is held fixed so that movements along the horizontal axis correspond to substitutions between
debt and equity.
17
The supply curve represents the willingness of firms to supply debt at different yields.
The determinants of its shape and level have been discussed at length in prior literature. Frank
and Goyal (2008) provide an excellent review. The tax shield and agency benefits of debt shift
the supply curve up. As leverage increases along the horizontal axis, though, firms begin to
incur expected distress and agency costs and expected tax benefits wane, causing the supply
curve to slope down. As a result, the same frictions expected to influence cross-sectional
differences in firm’s leverage decisions also influence aggregate leverage. For example, if firms’
exposures to the agency costs or the distress costs of debt increase on average, we would expect
a steeper slope of the aggregate supply curve and a decline in equilibrium leverage holding fixed
demand.
The demand curve represents investors’ willingness to hold corporate debt at different
yields. Demand for corporate debt securities depends on households’ demands for different
return streams, as well as the transaction costs they face in financial markets. For example, if
investors (through financial intermediaries) can costlessly exchange cash flows from one security
for those of another, they will be unwilling to pay a premium for any particular corporate
security, even if it matches their preferred return profile. Thus, in the presence of both investor
heterogeneity and transaction costs, the demand curve need not be perfectly elastic. For
example, in Miller’s (1977) model, investors face differing personal tax rates and tax arbitrage
restrictions. Low tax bracket investors are willing to hold debt at the same risk-adjusted yield as
equity. Debt investors that face higher personal tax rates on interest income demand higher
yields to compensate for the tax disadvantage of holding debt, leading to an upward-sloping
demand schedule.

18
As discussed by Taggart (1985), taxes are not the only friction capable of producing an
upward sloping demand curve. More generally, any cost that impedes investors from exchanging
return streams from one security for another can lead to an upward sloping demand curve in the
presence of investor heterogeneity. This heterogeneity across investors may come, for example,
from differences in transaction costs, risk aversion, or cash flow expectations.10
An imperfectly elastic demand curve has several implications for the determinants of
aggregate leverage. First, investor characteristics, such as risk preferences and tax rates, may
play a role in determining aggregate leverage. As the segment of the population exhibiting high
degrees of risk aversion, pessimistic cash flow expectations, or low personal tax rates grows, the
demand curve will flatten and the aggregate amount of corporate debt will increase. Second,
when different securities are imperfect substitutes, changes in the supply of competing securities
(e.g., government bonds) may affect relative yields and the equilibrium mix of corporate debt
and equity. Specifically, increases in the supply of competing securities shifts the corporate debt
demand curve up and to the left, leading to a reduction in the equilibrium level of corporate debt.
Third, development of the financial intermediation sector should decrease the cost of
transforming return streams from one security to another. All else equal, we expect the demand
curve to become more elastic (and demand factors to matter less) and corporate debt usage to
increase as financial markets develop.
In sum, the shape and level of the supply and demand curves for corporate debt are
determined by firms’ aggregate exposures to various market frictions, investors’ aggregate
preferences for different return streams, and the transaction costs investors face in financial
markets. In our empirical analysis below, we evaluate these predictions in two steps. We first
10 See Greenwood, Hansen, and Stein (2010) and Krishnamurthy and Vissing-Jorgenson (2012) for recent examples of inelastic demand resulting from alternative sources of investor heterogeneity and arbitrage restrictions.
19
ask whether changes in the characteristics of publicly traded firms increased their willingness to
supply corporate debt as the 20th century progressed. We then examine whether changes in the
economic environment in which firms operate, such as tax rates, supplies of competing
securities, and development of the financial sector, may have shifted the demand curve (or
supply curve, in the case of corporate taxes) in a way that led to an increase in aggregate
leverage.
5. Changes in firm characteristics
In this section we examine the ability of previously identified firm characteristics to
explain the financing trends documented in Section 2. In other words, we ask whether firms have
changed over the last century in a manner that would predict a large increase in leverage.
Previous research has identified a number of firm characteristics that 1) proxy for the frictions
generating an imperfectly elastic supply curve, and 2) correlate with capital structures (e.g.,
Rajan and Zingales, 1995; Frank and Goyal, 2009). Thus, our analysis allows us to comment on
both the empirical relevance of existing models for explaining long-run trends and the role of
supply curve variation in shaping corporate capital structure
5.1. Firm characteristics and leverage trends
We begin with a visual inspection of average firm characteristics in Fig. 7. In light of the
changing sample composition, we report values separately for NYSE, Amex, and NASDAQ
20
firms. We first note that, among NYSE firms, there is a general upward trend in firm size
(measured as log of real sales) through the century. However, relating this trend to the trend in
leverage may be problematic on statistical grounds. With positive economic growth, firm size is
asymptotically non-stationary. We return to this issue in our regressions below. Further, the
increasing size of NYSE firms is offset in recent decades by the introduction of small NASDAQ
firms and the smaller size of Amex firms.
Profitability increased significantly between 1932 and 1950. For NYSE firms,
profitability then declined gradually from 1950 until 1992, after which it has been fairly stable.
The profitability trends for Amex and NASDAQ firms were similar to that of NYSE firms
during the 1960s and 1970s. However, profitability among Amex and NASDAQ firms declined
precipitously between 1980 and 2000. The steady decline in profitability following WWII can
potentially explain the gradual increase in leverage over the same period. There was also a run-
up in profitability leading up to and during the war associated with a modest decline in leverage
over the same period. Notably though, the level of profitability at the start of our sample period
is virtually identical to that at the end of our period, in contrast to leverage.
Asset tangibility, despite large fluctuations in the 1940s and 1950s, generally declined
over the century. Not only does this pattern miss some of the important turning points in
leverage, it is also difficult to reconcile with existing empirical evidence (e.g., Frank and Goyal,
2009) and theory (e.g., Shleifer and Vishny, 1992), which suggests that decreasing asset
tangibility decreases debt capacity because there is less collateral to secure debt. The market-to-
book ratio, despite a sharp drop in the 1970s, was largely flat or modestly increasing over the
century. This pattern is also difficult to reconcile with the large movements in leverage and
existing empirical evidence showing a strong negative correlation between leverage and market-
21
to-book. Finally, earnings volatility declined between 1950 and 1970, the period over which the
bulk of the leverage increase occurred. However, it has increased somewhat since then, and
dramatically so for Amex and NASDAQ firms.
Overall, the plots give little indication that characteristics changed in a manner that would
lead to a sustained increase in corporate debt supply. Nonetheless, we undertake a more formal
regression analysis below to estimate the quantitative impact of changes in firm characteristics
on expected leverage ratios.
5.2. Cross-sectional relationships through time
Table 2 presents the results of panel regressions of the debt-to-capital ratio on firm size
(log of real sales), profitability, tangible assets and the market-to-book assets ratio. To facilitate
comparison of magnitudes, we report marginal effects by multiplying the estimated coefficients
by the standard deviation of each independent variable within each decade. Panel A presents the
results using book leverage as the dependent variable, Panel B using market leverage. This
analysis provides insight into the stability of previously documented relationships.
The first two columns of Panel A indicate that, with the exception of the 1930s, leverage
has had a consistently positive and negative association with firm size and profitability,
respectively. Both relationships strengthened between the 1920s and 1980s before weakening
somewhat in recent decades. By contrast, the positive and negative associations documented by
prior studies between leverage and, respectively, PP&E and market-to-book are robust features
of the data only in more recent decades. Comparison with the results for the NYSE sample
indicates that the cross-sectional relationships between leverage and tangibility and market-to-

22
book are primarily driven by the introduction of NASDAQ firms to the sample. More
specifically, NASDAQ firms have, on average, less tangible assets, higher market-to-book ratios,
and lower leverage than firms on the NYSE. This additional variation appears largely responsible
for the increased importance of these relations in recent decades.
Results in Panel B reveal that these variables are more consistent over time in explaining
market leverage. However, in the case of market-to-book, the negative relationship is likely
dominated by the variation in market equity, which appears in the numerator of the independent
variable and the denominator of the dependent variable.
With few exceptions, the results in Table 2 suggest that the empirical relations between
leverage and its determinants are relatively stable. As such, we examine in Table 3 and Fig. 8 the
ability of these characteristics to account for the temporal variation in leverage documented
above. The first (sixth) column in Table 3 reports the average debt to capital ratio by decade for
our full (NYSE) sample. In the next column, we first estimate a panel regression, with firm fixed
effects, over the period from 1925 – 1945, of leverage on the set of firm characteristics reported
in Fig. 7 and asset growth. Using these estimated coefficients, we calculate a predicted leverage
ratio for each firm-year after 1945 and in the table report the average within each 5-year period
(we report annually in Fig. 8). The short-dashed line in Fig. 8, labeled “Predicted(1),” displays
average predicted leverage when firm size is defined as total real sales. The results indicate that
a small portion of the leverage increase is explained by variation in firm characteristics (about
one third of the increase from 1945 to 1960 is explained, but very little after 1960).
Thus far we have defined firm size in a manner consistent with that found in most
previous research focusing on cross-sectional variation. However, this definition is inappropriate
for our aggregate analysis. As the number of time periods gets large, the relation between

23
leverage and firm size – measured in levels – must converge to zero because these variables have
different orders of integration: leverage is trend-stationary, size is not. So, relating the aggregate
or average level of assets (or sales) with aggregate leverage is theoretically problematic. As a
practical matter, leverage during our sample horizon exhibits a clear trend (see Fig. 1).
Consequently, regressing a trending variable on another trending variable can generate a
spurious correlation, which stems not from a meaningful economic relation but, rather, the
presence of common trends (Granger and Newbold (1974)). Therefore, the long-dashed line
denoted Predicted(2) in Fig. 8 and columns (2) and (7) of Table 3 present results from a
specification in which we scale firm sales by GDP in order to ensure stationarity. (In unreported
results, we examine sales growth and find qualitatively similar results.) The results in columns
(2) and (7) indicate that average predicted leverage is either flat (NYSE sample) or declining
(full sample) from 1945 through 2010. This specification indicates that essentially none of the
increase in leverage over the past century is attributable to changes in characteristics of our
sample firms. Fig. 8 shows that a similar result holds for market leverage.
One limitation of the prior approach is that it assumes stability in the parameters of the
leverage specification between 1945 and the end of the sample period. While this assumption
seems plausible in light of the results of Table 2, some exceptions were noted above. We take
two approaches to address this concern. First, we estimate a panel regression over the entire
sample period 1925 – 2010 and add indicators for each 5-year period after 1945. Columns (4)
and (9) of Table 4 report the coefficients on these indicators, which measure the average residual
in each period (relative to the omitted period 1925 – 45). The results show that the average
residual increases at approximately the same rate as the average actual leverage. Thus, firm-
24
specific information has little ability to explain the temporal patterns in average leverage even
when we do not restrict the parameters to be estimated using only pre-WW II data.
In columns (5) and (10) we alternatively estimate rolling regressions in which the
estimation window is extended for each successive 5-year window. Thus, to predict leverage in
period t to t+4, we estimate the leverage regression over 1925 to t-1. We then calculate the
predicted change in leverage as the average predicted value over t to t+4 minus the average fitted
value from t-5 to t-1. Results are similar. Predicted leverage changes are modest or negative in
each period. In contrast to the observed increased in leverage, cumulative predicted changes over
1945 to 2010 are -8.2% and -3.6% for the full and NYSE samples, respectively.
While changes in firm characteristics are unable to explain the increase in leverage over
time, the evidence in Fig. 7 suggests they may be able to account for the thickening left tail of
the leverage distribution in recent decades documented in Fig. 3. The 1980s and 1990s saw a
large influx of NASDAQ firms into the Compstat/CRSP sample. As shown in Fig. 7, these firms
are substantially smaller, less profitable, have more volatile earnings and higher growth
opportunities but fewer tangible assets than pre-existing firms. Fig. 9 displays how these features
relate to the changes in the leverage distribution since 1980.
Panel A demonstrates the effect of new entrants on the leverage distribution. The left
plot shows the annual quartiles of the leverage distribution for the sample of firms in the
database as of 1980 (including NYSE, Amex and NASDAQ firms). In other words, the sample
consists of all surviving firms and varies over time only because of exit (e.g., bankruptcy,
merger, acquisition, buyout). Despite a slight decline since 2000 – possibly due to the sample
selection criterion – this distribution is quite stable over time. Thus, reduction in the lower end of
the full sample leverage distribution was not the result of low leverage firms levering down.
25
Rather, this decline was driven by new, low-leverage firms entering the sample. The right plot of
Panel A shows the quartiles of the leverage distribution for new entrants into the sample. Thus,
the sample changes each year. Each quartile in almost every year is well below that of the
corresponding quartile for the sample of existing firms.
Panel B of Fig. 9 indicates that these leverage differences are at least partly driven by
differences in firm characteristics. Using the parameters from a panel regression estimated over
1925 – 1979, we calculate predicted leverage for each firm from 1980 through 2010. The left
plot shows predicted leverage quartiles each year based on the sample of firms in the database as
of 1980. The right plot shows quartiles of the distribution of predicted leverage for the sample of
new entrants each year. Comparing the two plots, we note that the quartiles of predicted leverage
for new entrants are significantly lower than those for existing firms. Thus, new entrants
beginning in 1980 had different characteristics than existing firms, leading them to choose
different leverage ratios.
Taken together, our evidence suggests that firm characteristics in general do not explain
the increase in leverage over the past century in the U.S., but do help us understand the
thickening left tail of the leverage distribution in recent decades. The differing characteristics of
new entrants in the 1980s and 1990s led to low predicted leverage for these firms, and offers a
natural explanation for the apparent drop in leverage since 1980 among low-levered firms.
Ignoring these new firms, the distribution of leverage has been stable in recent decades. In
contrast, aggregate or average firm characteristics do not change over time in a way that explains
the across-the-board increase in leverage from 1945-1970.
6. Changes in the economic environment
26
Results in the previous section indicate that changes in firm characteristics have limited
ability to explain the trends in capital structure that we document. In this section, we explore
whether changes in the economic environment (taxes, distress costs, information and agency
frictions, and supplies of competing securities) affected the demand and supply of corporate
debt. While the evidence here is largely descriptive, it is suggestive of the economic forces
behind the thus far unexplained shifts in financial policy.
6.1. Graphical analysis
Fig. 10 presents time series plots of several macroeconomic series that are theoretically
relevant for capital structure. In each figure, we also plot aggregate leverage for comparison.
Panel A displays the (top) corporate tax rate and a measure of the debt tax incentive net of
personal taxes.11 The statutory corporate tax rate underwent 30 changes during the last century.
Rates were relatively low at the start of our sample period, staying below 15% from 1920 until
the late 1930s. By the mid-1950s, however, the corporate income tax rate exceeded 50%. Tax
rates remained near 50% until the mid-1980s, and have been steady near 35% since. The plot
suggests a positive relation between corporate tax rates (or the net tax incentive) and leverage,
particularly in the mid-20th century. Indeed, several past authors have interpreted this visual
association as casual (e.g., Hickman, 1953; Sametz, 1964).
11 Following Taggart (1985), we define the net debt tax incentive as 1 – (1-tc)/(1-tp), where tc is the corporate tax rate and tp the personal income tax rate (on interest income). This formula derives from Miller (1977), with the simplifying assumption that the effective tax rate on income to equityholders is zero. We use the lowest personal tax rate to quantify tp because few investors actually paid the highest tax rate during the middle of the century. (The top personal rate exceeded 90% for 16 out of the 20 years from 1944 through 1963.)
27
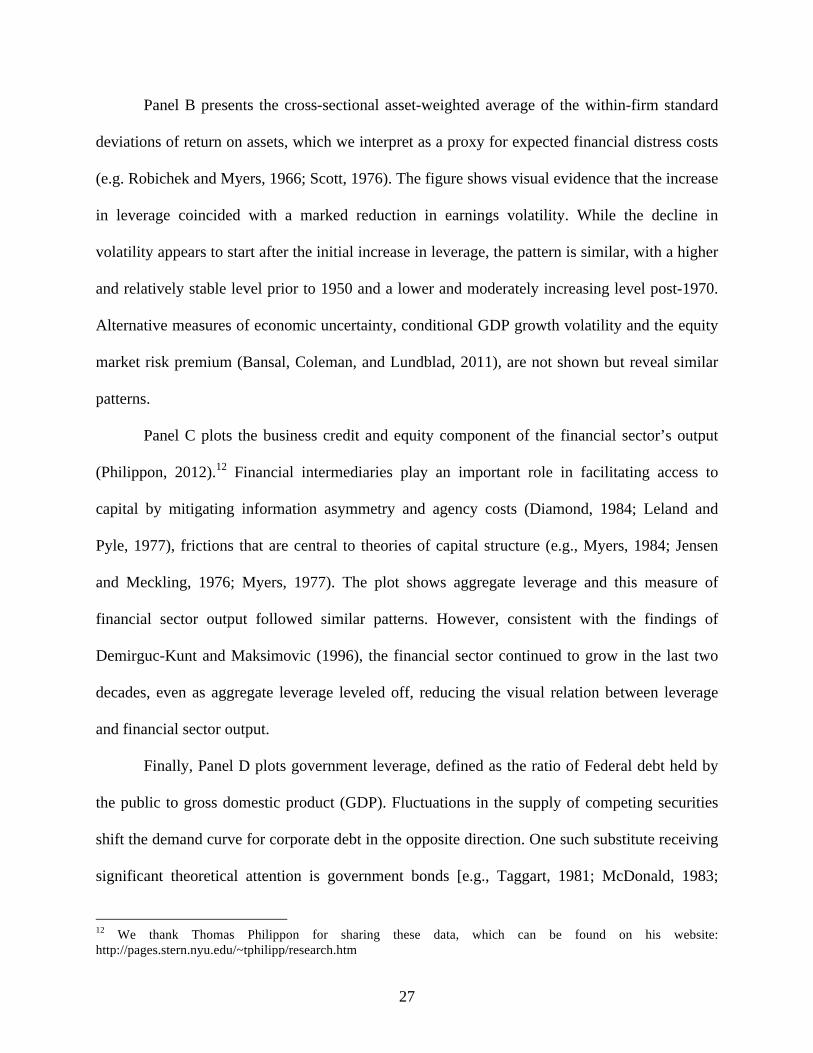
Panel B presents the cross-sectional asset-weighted average of the within-firm standard
deviations of return on assets, which we interpret as a proxy for expected financial distress costs
(e.g. Robichek and Myers, 1966; Scott, 1976). The figure shows visual evidence that the increase
in leverage coincided with a marked reduction in earnings volatility. While the decline in
volatility appears to start after the initial increase in leverage, the pattern is similar, with a higher
and relatively stable level prior to 1950 and a lower and moderately increasing level post-1970.
Alternative measures of economic uncertainty, conditional GDP growth volatility and the equity
market risk premium (Bansal, Coleman, and Lundblad, 2011), are not shown but reveal similar
patterns.
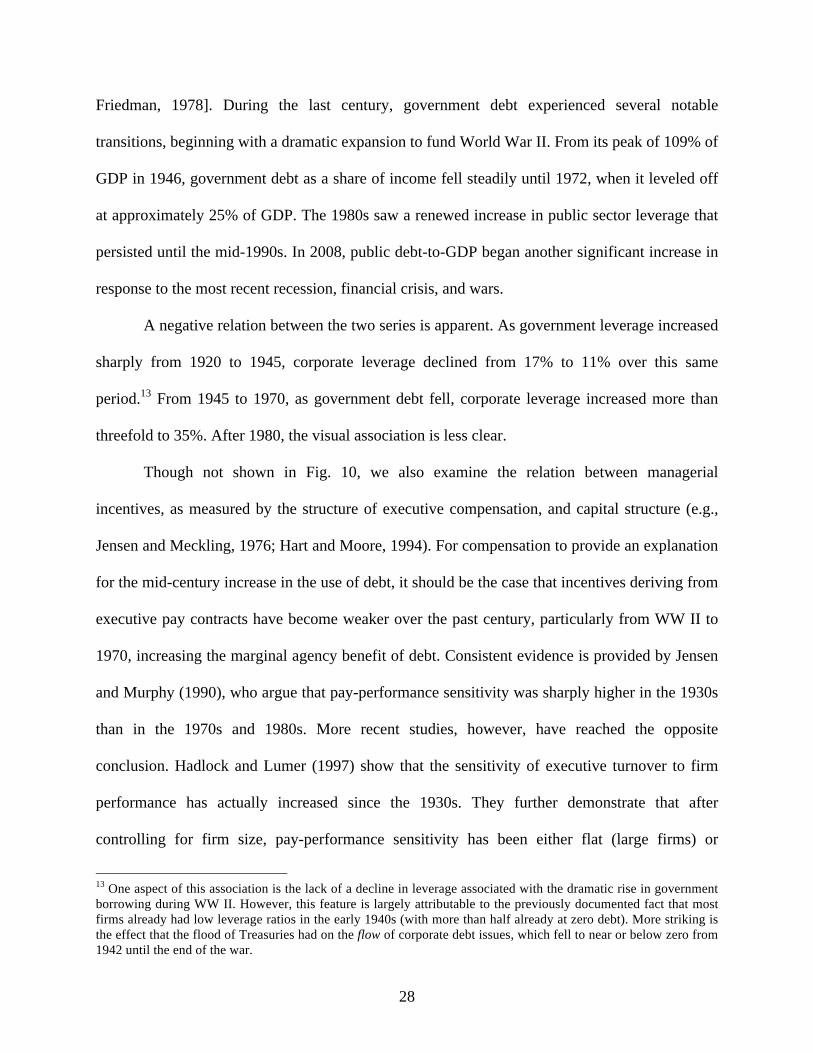
Panel C plots the business credit and equity component of the financial sector’s output
(Philippon, 2012).12 Financial intermediaries play an important role in facilitating access to
capital by mitigating information asymmetry and agency costs (Diamond, 1984; Leland and
Pyle, 1977), frictions that are central to theories of capital structure (e.g., Myers, 1984; Jensen
and Meckling, 1976; Myers, 1977). The plot shows aggregate leverage and this measure of
financial sector output followed similar patterns. However, consistent with the findings of
Demirguc-Kunt and Maksimovic (1996), the financial sector continued to grow in the last two
decades, even as aggregate leverage leveled off, reducing the visual relation between leverage
and financial sector output.
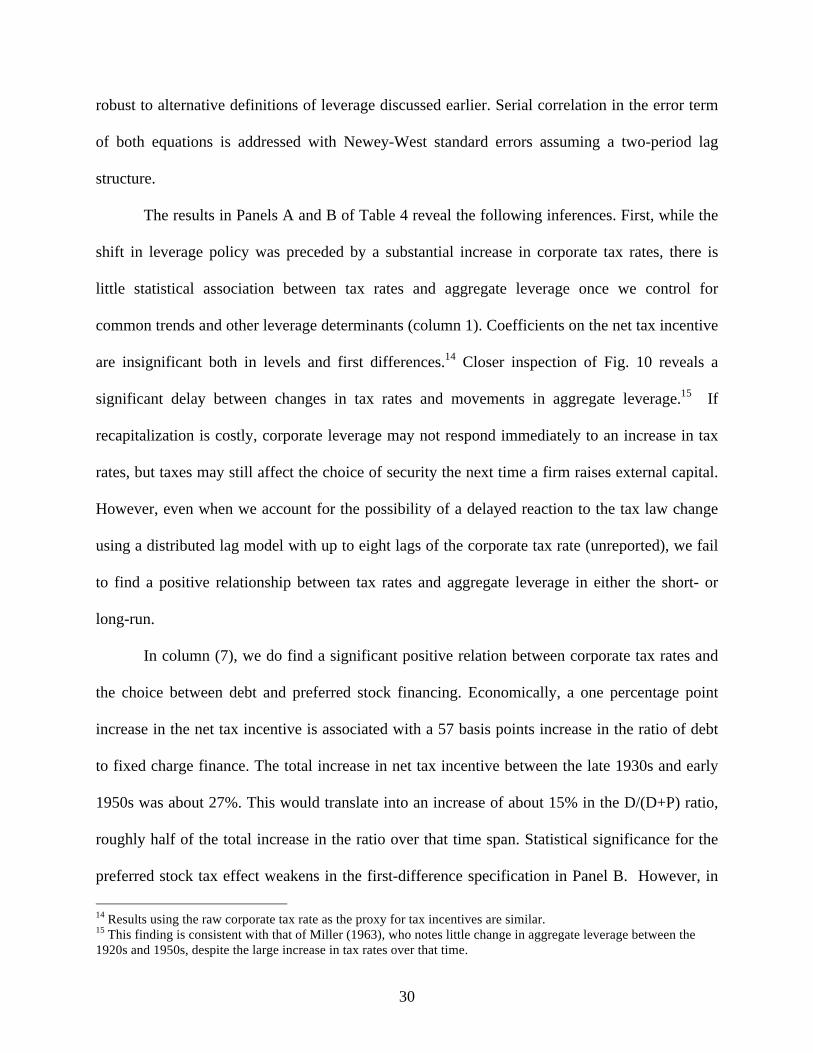
Finally, Panel D plots government leverage, defined as the ratio of Federal debt held by
the public to gross domestic product (GDP). Fluctuations in the supply of competing securities
shift the demand curve for corporate debt in the opposite direction. One such substitute receiving
significant theoretical attention is government bonds [e.g., Taggart, 1981; McDonald, 1983;
12 We thank Thomas Philippon for sharing these data, which can be found on his website: http://pages.stern.nyu.edu/~tphilipp/research.htm
28
Friedman, 1978]. During the last century, government debt experienced several notable
transitions, beginning with a dramatic expansion to fund World War II. From its peak of 109% of
GDP in 1946, government debt as a share of income fell steadily until 1972, when it leveled off
at approximately 25% of GDP. The 1980s saw a renewed increase in public sector leverage that
persisted until the mid-1990s. In 2008, public debt-to-GDP began another significant increase in
response to the most recent recession, financial crisis, and wars.
A negative relation between the two series is apparent. As government leverage increased
sharply from 1920 to 1945, corporate leverage declined from 17% to 11% over this same
period.13 From 1945 to 1970, as government debt fell, corporate leverage increased more than
threefold to 35%. After 1980, the visual association is less clear.
Though not shown in Fig. 10, we also examine the relation between managerial
incentives, as measured by the structure of executive compensation, and capital structure (e.g.,
Jensen and Meckling, 1976; Hart and Moore, 1994). For compensation to provide an explanation
for the mid-century increase in the use of debt, it should be the case that incentives deriving from
executive pay contracts have become weaker over the past century, particularly from WW II to
1970, increasing the marginal agency benefit of debt. Consistent evidence is provided by Jensen
and Murphy (1990), who argue that pay-performance sensitivity was sharply higher in the 1930s
than in the 1970s and 1980s. More recent studies, however, have reached the opposite
conclusion. Hadlock and Lumer (1997) show that the sensitivity of executive turnover to firm
performance has actually increased since the 1930s. They further demonstrate that after
controlling for firm size, pay-performance sensitivity has been either flat (large firms) or
13 One aspect of this association is the lack of a decline in leverage associated with the dramatic rise in government borrowing during WW II. However, this feature is largely attributable to the previously documented fact that most firms already had low leverage ratios in the early 1940s (with more than half already at zero debt). More striking is the effect that the flood of Treasuries had on the flow of corporate debt issues, which fell to near or below zero from 1942 until the end of the war.
29
increasing (small firms) over time. Frydman and Saks (2010) provide the most comprehensive
time-series data on executive compensation to date. They report that the sensitivity of executive
pay to firm performance was similar from the 1930s to the 1980s, a time span that entirely
encompasses the increase in aggregate leverage in our sample.
6.2. Regression analysis
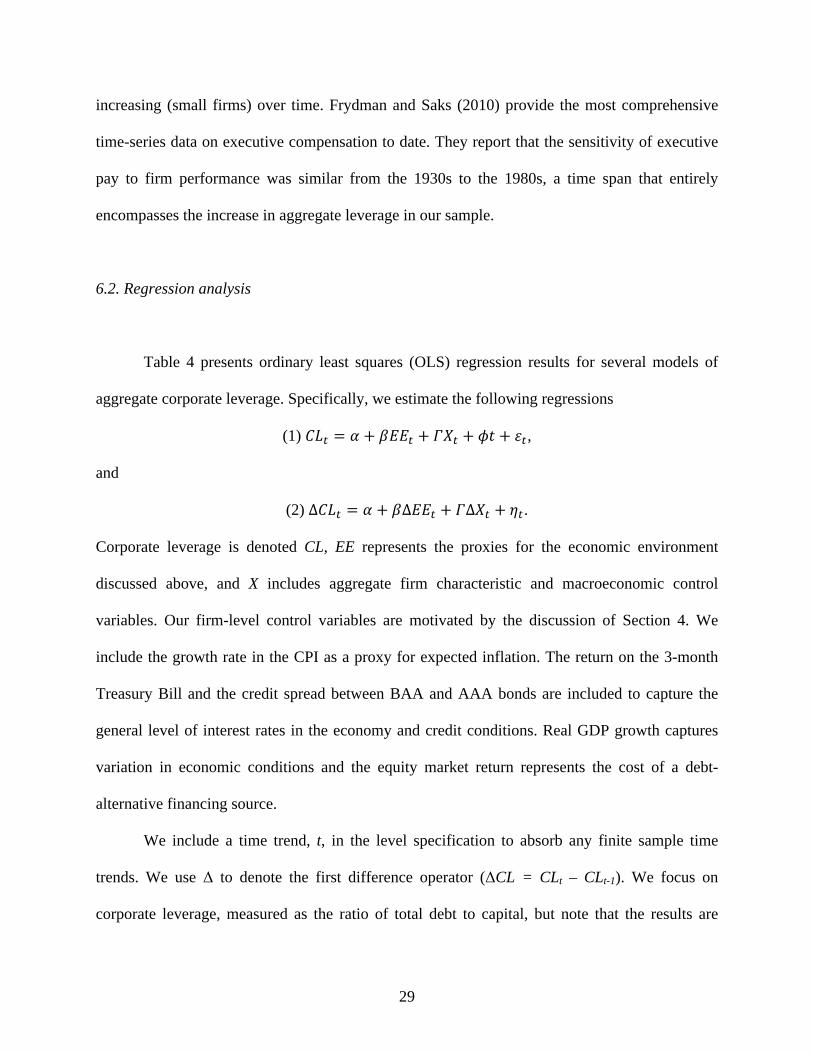
Table 4 presents ordinary least squares (OLS) regression results for several models of
aggregate corporate leverage. Specifically, we estimate the following regressions
(1) 𝐶𝐿! = 𝛼 + 𝛽𝐸𝐸! + 𝛤𝑋! + 𝜙𝑡 + 𝜀!,
and
(2) ∆𝐶𝐿! = 𝛼 + 𝛽∆𝐸𝐸! + 𝛤∆𝑋! + 𝜂!.
Corporate leverage is denoted CL, EE represents the proxies for the economic environment
discussed above, and X includes aggregate firm characteristic and macroeconomic control
variables. Our firm-level control variables are motivated by the discussion of Section 4. We
include the growth rate in the CPI as a proxy for expected inflation. The return on the 3-month
Treasury Bill and the credit spread between BAA and AAA bonds are included to capture the
general level of interest rates in the economy and credit conditions. Real GDP growth captures
variation in economic conditions and the equity market return represents the cost of a debt-
alternative financing source.
We include a time trend, t, in the level specification to absorb any finite sample time
trends. We use Δ to denote the first difference operator (ΔCL = CLt – CLt-1). We focus on
corporate leverage, measured as the ratio of total debt to capital, but note that the results are
30
robust to alternative definitions of leverage discussed earlier. Serial correlation in the error term
of both equations is addressed with Newey-West standard errors assuming a two-period lag
structure.
The results in Panels A and B of Table 4 reveal the following inferences. First, while the
shift in leverage policy was preceded by a substantial increase in corporate tax rates, there is
little statistical association between tax rates and aggregate leverage once we control for
common trends and other leverage determinants (column 1). Coefficients on the net tax incentive
are insignificant both in levels and first differences.14 Closer inspection of Fig. 10 reveals a
significant delay between changes in tax rates and movements in aggregate leverage.15 If
recapitalization is costly, corporate leverage may not respond immediately to an increase in tax
rates, but taxes may still affect the choice of security the next time a firm raises external capital.
However, even when we account for the possibility of a delayed reaction to the tax law change
using a distributed lag model with up to eight lags of the corporate tax rate (unreported), we fail
to find a positive relationship between tax rates and aggregate leverage in either the short- or
long-run.
In column (7), we do find a significant positive relation between corporate tax rates and
the choice between debt and preferred stock financing. Economically, a one percentage point
increase in the net tax incentive is associated with a 57 basis points increase in the ratio of debt
to fixed charge finance. The total increase in net tax incentive between the late 1930s and early
1950s was about 27%. This would translate into an increase of about 15% in the D/(D+P) ratio,
roughly half of the total increase in the ratio over that time span. Statistical significance for the
preferred stock tax effect weakens in the first-difference specification in Panel B. However, in
14 Results using the raw corporate tax rate as the proxy for tax incentives are similar. 15 This finding is consistent with that of Miller (1963), who notes little change in aggregate leverage between the 1920s and 1950s, despite the large increase in tax rates over that time.

31
unreported analysis we find a highly significant long-run multiplier when using the distributed
lag model discussed above.
In column (2) of Panel A, we find a negative relation between GDP growth volatility and
leverage. However, this is not a robust relation. The coefficient becomes statistically and
economically insignificant when we estimate the model in first differences (Panel B) or when
controlling for other measures of the economic environment (column 6). Results using the other
proxies for uncertainty – earnings volatility and the market risk premium – are similar but
statistically even weaker.
Turning to proxies for financial market development, in column (4) we find a significant
relation between aggregate leverage and the output of the financial sector from business credit
and equity issuance. This coefficient is significantly positive in both levels and first differences,
and remains significant when controlling for the other measures of the economic environment in
column (6). This suggests an association between the growth of financial intermediation and
corporate leverage. On the other hand, in column (3) we do not find a robust significant
relationship between leverage and an alternate measure of the extent of intermediation, the
fraction of debt held through intermediaries. While this fraction increased sharply between the
1930s and 1950s, much of the change occurred in the decade prior to the shift in leverage
policies.
Last, we find a robust significant relation between government leverage and corporate
leverage, both in levels and first differences. From column (5) of Panel A, we see that a one
percentage point increase in government leverage is associated with an 8.5 basis point decrease
in corporate leverage. Combined with the summary statistics in Panel A of Table 1, this estimate
32
implies that a one standard deviation increase in government leverage (17.7%) leads to a 1.5%
decline in aggregate corporate leverage.
Table 5 presents analysis of net issuance decisions. In particular, we estimate similar
regressions to those of Table 4, but now the dependent variables are aggregate net debt and net
equity issuances scaled by lagged aggregate assets (Panels A and B, respectively) or aggregate
debt issuance as a fraction of aggregate investment (Panel C). The controls consist of both
macroeconomic factors and firm characteristics found in Table 4. Flow control variables are
contemporaneous with the dependent variable, stock and price control variables are lagged one
year to avoid incorporating any future information on the right hand side.16
Results are generally consistent with those in Table 4. Tax rates, volatility, and the shares
of debt and equity held by intermediaries show no statistically significant relations with debt or
equity issuance decisions. Perhaps unsurprisingly, more output from the financial sector is
associated with more issuance of both debt and equity. More interestingly, in Panel C we find
that firms fund a larger fraction of their investment with debt as the financial sector grows.
In column (5) we examine the relation between corporate debt and equity issuance and
government debt issuance, defined as the change in federal debt held by the public scaled by
lagged GDP. Panel A shows a significant negative relation between corporate and government
net debt issuing activity. A one percent increase in the relative flow of government debt is
associated with a 4.4 basis point reduction in the flow of corporate debt relative to assets. Panel
B shows that net equity issues are also negatively related to government debt issues. However,
this relation is less than half the magnitude as documented in the net debt issuance specification
and becomes statistically insignificant once we control for firm characteristics. Finally, in Panel 16 Flow variables include government debt issuance, output of the financial sector, firm profitability, inflation, market return, and real GDP growth. Stock variables include tax rates, GDP growth volatility, intermediary shares of debt and equity holdings, interest rates, intangible assets and the market-to-book ratio.
33
C we partially control for changing investment opportunities by showing that the fraction of
investment funded by debt is also significantly negatively associated with net debt issuances by
the government.
In sum, we identify several changes in the economic environment that may be relevant
for understanding the large unexplained increase in aggregate corporate leverage – tax rates,
uncertainty, growth in financial intermediation, and variation in government borrowing. Of
these, changes in government borrowing and growth of financial intermediation appear most
statistically robust (although in the latter case, this does not hold for all measures of
intermediation). While a full investigation of these forces is beyond the scope of this paper, the
evidence here suggests these may be fruitful areas for future research.
7. Conclusions and directions for future research
We document a substantial shift in corporate financial policy in US firms over the past
century. Aggregate corporate leverage and the leverage of the regulated sector have remained
quite stable over time. In contrast, leverage of unregulated firms has increased significantly,
approaching the level of indebtedness of regulated firms.
Interestingly, neither changes in the characteristics of firms, nor changes in the
relationships between these characteristics and leverage decisions, are able to explain much, if
any, of the shift in financial policies. Firms appear to have increased their propensity to use debt
financing over the century, with the bulk of this change unexplained by standard leverage
models. We highlight several changes in the economic environment that plausibly increased
firms’ willingness to issue, or investors’ willingness to hold, corporate debt. These include

34
increased corporate tax rates, reductions in aggregate uncertainty, growth in financial
intermediation, and a large reduction in government borrowing in the decades following World
War II. Aggregate regression analysis suggests these latter two relations – those between
leverage and financial intermediation and between corporate debt and supplies of competing
securities – are the most statistically robust and may represent the most promising areas for
future research.
While the lack of evidence in support of taxes questions the relevance of this friction
behind many theoretical models of leverage determination, our results do not necessarily rule out
a role for taxes. The need to control for common trends in time-series regressions may mask the
underlying relationship. Future research examining cross-sectional implications of changes in tax
rates, incorporating more precise measures of tax incentives, and carefully considering the
political economy surrounding tax changes may be fruitful.
The relation between leverage and growth of the financial sector suggests that the
monitoring and information-gathering functions of financial intermediaries may have been
important in expanding firms’ debt capacities. However, the precise channels through which this
association occurs, and the mechanisms behind the association, are unclear. Equally important is
the role of financial regulation, which underwent significant changes during our sample period.
Future research integrating an analysis of the development of the financial sector with the
evolution of financial regulation may provide new insight.
Finally, the negative association documented here between government borrowing and
corporate debt issuance is consistent with the supply of competing securities, such as Treasury
debt, affecting aggregate leverage by shifting the demand curve for corporate debt. Of course,
our evidence cannot entirely rule out contemporaneous debt supply curve shifts or endogenous

35
investment responses. A further unresolved question is which economic mechanisms are behind
the imperfectly elastic demand curve required for a relation between government and corporate
finance to exist. We leave these issues to future research.

36
References Bates, T., Kahle K., Stulz R., 2009. Why do US firms hold so much more cash than they used to? Journal of Finance 64, 1985-2021. Bansal, R., Coleman J., Lundblad C., 2011. Endogenous liquidity supply. Unpublished working paper. Duke University. Chava, S.,. Roberts M., 2008. How does financing impact investment? The role of debt covenants. Journal of Finance 63, 2085-212. Ciccolo Jr., J., 1981. Changing Balance Sheet Relationships in the US Manufacturing Sector. NBER Working Paper No. 702. DeAngelo, H., Roll R., 2012. How Stable Are Corporate Capital Structures?, Journal of Finance, forthcoming. Demirguc-Kunt, A., Maksimovic V., 1996. Stock Market Development, and Firm Financing Choices. World Bank Economic Review, 341-371. Diamond, D., 1984. Financial intermediation and delegated monitoring. Review of Economic Studies 51, 393-414. Fama, E., French K., 1991. The cross-section of expected stock returns. Journal of Finance 47, 427-465. Fama, E., French K., 2005. Financing decisions: Who issues stock? Journal of Financial Economics 76, 549-582. Frank, M., Goyal V., 2008, Trade-off and pecking order theories of capital structure, in Handbook of Corporate Finance: Empirical Corporate Finance, ed. Espen Eckbo, Elsevier. Frank, M., Goyal V., 2009. Capital structure decisions: Which factors are reliably important? Financial Management 38, 1-37. Frydman, C., Saks R., 2010. Executive compensation: A new view from a long-term perspective, 1936-2005. Review of Financial Studies 23, 2099-2138. Graham, J., Leary M., Roberts M., 2012, Financial crowding out, Unpublished working paper. University of Pennsylvania. Goldsmith, R., 1958. Financial Intermediaries in the American Economy Since 1900, UMI. Gordon, R., Malkiel, B., 1981. Taxation and Corporate Finance, in How Taxes Affect Economic Behavior, eds. H. J. Aaron and J. A. Pechman, The Brookings Institution.

37
Gorton, G., Winton A., 2003, Financial intermediation, in the Handbook of the Economics of Finance, eds. George Constantinides, Milton Harris, and Rene Stulz, Elsevier. Granger, C. Newbold P., 1974. Spurious regression in econometrics. Journal of Econometrics 2, 111-120. Greenwood, R., Hanson S., and Stein J., 2010. A gap-filling theory of corporate debt maturity choice. Journal of Finance 65, 993-1028. Holland, D., Myers, S., 1979. Trends in Corporate Profitability and Capital Costs, In: The Nation’s Capital Needs: Three Studies, ed. R. Lindsay, Committee for Economic Development. Hickman, W., 1953. The Volume of Corporate Bond Financing Since 1900. Princeton University Press. Huang, R., Ritter J., 2010, Testing theories of capital structure and estimating the speed of adjustment. Journal of Financial and Quantitative Analysis 44, 237-271. Hurley, E., 1977. The commercial paper market. Federal Reserve Bulletin 63, 525 – 536. Jensen, M., Meckling W., 1976. A theory of the firm: Managerial behavior, agency costs, and ownership structure. Journal of Financial Economics 3, 305-360. Krishnamurthy, A., Vissing-Jorgensen A., 2012. The aggregate demand for Treasury debt. Journal of Political Economy 120, 233-267. Leland, H., Pyle D., 1977. Informational asymmetries, financial structure, and financial intermediation. Journal of Finance 32, 371-387. McDonald, R., 1983. Government debt and private leverage: An extension of the Miller theorem. Journal of Public Economics 22, 303-325. Miller, M., 1963. The Corporation Income Tax and Corporate Financial Policies, In: Commission on Money and Credit, Stabilization Policies, Prentice Hall. Miller, M., 1977. Debt and taxes. Journal of Finance 32, 261-275. Modigliani, F., Miller M., 1958. The cost of capital, corporation finance and the theory of investment. American Economic Review 48, 261-297. Myers, S., 1977. Determinants of corporate borrowing. Journal of Financial Economics 5, 147-175. Newey, W., West K., 1987. A simple, positive-definite, heteroskedasticity and autocorrelation consistent covariance matrix. Econometrica 55, 703-708.

38
Opler, T., Pinkowitz L., Stulz R., Williamson R., 1999. The determinants and implications of corporate cash holdings. Journal of Financial Economics 52, 3 – 46. Philippon, T., 2009. The bond market’s q. Quarterly Journal of Economics 124, 1101-1056. Philippon, T., 2012. Has the US finance industry become less efficient? Unpublished working paper, New York University. Rajan, R., Zingales L., 1995. What do we know about capital structure: Some evidence from international data. Journal of Finance 50, 1421-1460. Robichek, A., Myers S., 1966. Problems in the theory of optimal capital structure. Journal of Financial and Quantitative Analysis 2, 1-35. Sametz, A., 1964. Trends in the volume and composition of equity finance. Journal of Finance 19, 450-469. Scott J., 1976. A theory of optimal capital structure. Bell Journal of Economics and Management Science 7, 33-54. Stein, J., 2003. Agency, information and corporate investment. In: Constantinides G., Harris M., Stulz R. (Ed.), Handbook of the Economics of Finance, Elsevier, Amsterdam, pp 111 – 165. Strebulaev, I. Yang, B., 2013. The mystery of zero-leverage firms. Journal of Financial Economics 109, 1-23. Stulz, R., 1985. An analysis of secured debt. Journal of financial Economics 14, 501-521. Taggart, R., 1985. Secular patterns in corporate finance. In: Friedman B. (Ed.), Corporate Capital Structures in the United States, University of Chicago Press, Chicago, pp. 13 – 80. von Furstenberg, G., 1977. Corporate Investment: Does Market Valuation Matter in the Aggregate? Brookings Papers on Economic Activity 2, 347-397. Welch, I., 2011. Two common problems in capital structure research: The financial debt-to-assets ratio and issuing activity versus leverage changes. International Review of Finance 11, 1-17.
39
Appendix A: Variable Definitions
This appendix provides details on the data sources, sample construction, and variable
construction. We use the acronym GFD for Global Financial Database, a source for many
macroeconomic series.
A.1 Government debt
Government leverage in our analyses is defined as the ratio of Federal debt held by the
public to GDP. We focus on Federal debt because it comprises the majority of total government
debt and is responsible for most of its variation over time. This fact is made apparent in Fig. A.1,
which presents a stacked area chart of government debt divided by GDP. In fact, the estimates of
state and local debt are somewhat misleading. A significant fraction of state and local assets
consists of U.S. Treasuries (on average $0.5 trillion between 2000 and 2010). Thus, state and
local governments can act as a pass-through for Federal debt by issuing their own debt claims
against these assets. We focus on the debt held by the public to avoid including in our measure a
significant fraction of U.S. Treasuries held by other government entities, such as the social
security administration.
A.2 Variable definitions
Gross Domestic Product Implicit Price Deflator: Source = GFD, Series = USGDPD, Annual data
from 1947 to 2010.
United States Annualized Exports of Goods and Services: Source = GFD, Series = USEXPGSQ,
Annual data from 1947 to 2010.
United States Annualized Exports of Goods and Services: Source = GFD, Series = USIMPGSQ,
Annual data from 1947 to 2010.
United States Gross Federal Debt Held by the Public (Bil. of $, NA), Source = GFD, Series =
USFYGFDPUBA, Annual data from 1938 to 2010. This series is extended back in time by
40
assuming that total Federal debt is equal to Federal debt held by the public. Pre-1938 Federal
debt data are obtained from,
http://www.usgovernmentspending.com/Federal_state_local_debt_chart.html.
Corporate Income Tax Rate: This rate corresponds to the top corporate income tax rate. Source = “Corporation Income Tax Brackets and Rates, 1909-2002”, http://www.irs.gov/pub/irs-soi/02corate.pdf. Annual data from 1909 to 2010.
United States M1 Money Stock: Source = GFD, Series = USM1W, Year-end monthly data from
1929 to 2010.
United States M2 Money Stock: Source = GFD, Series = USM2W, Year-end monthly data from
1947 to 2010.
United States State and Local Debt: Source = US government spending
(http://www.usgovernmentspending.com/Federal_state_local_debt_chart.html), Annual data
from 1902 to 2010.
United States Nominal GDP: Source = GFD, Series = GDPUSA, Year-end annual data from
1790 to 2010.
United States Unemployment Rate: Source = GFD, Series = UNUSAM, Year-end annual data
from 1890 to 1928. Year-end monthly data from 1929 to 2010
International Holdings of US Debt: Source = Flow of Funds, Series = Foreign Holdings of U.S.
Treasuries. Annual data from 1945 to 2010. Prior to 1945 we assume that there are no foreign
holdings of US Treasuries.
USA Government 90-day T-Bills Secondary Market: Source = GDP, Series = ITUSA3D, Year-
end monthly data from 1920 to 2010.

41
USA 10-year Bond Constant Maturity Yield: Source GFD, Series, IGUSA10D, Year-end
monthly data from 1790 to 2010.
United States BLS Consumer Price Index NSA: Source GFD, Series, IGUSA10D, Annual data
from 1820 to 1874. Monthly data from 1875 to 2010 collapsed to an annual series by averaging
within years.
Moody's Corporate AAA Yield: Source GFD, Series, MOCAAAD, Year-end monthly data from
1857 to 2010.
Moody's Corporate BAA Yield: Source GFD, Series, MOCBAAD, Year-end monthly data from
1919 to 2010.
Variable Construction
Inflation = [CPI(t) – CPI(t-1)] / CPI(t) where CPI(t) is the consumer price index in year t
computed as the average monthly CPI for the year.
US Net exports = [US exports – US imports] / US GDP
GDP growth = [GDP(t) – GDP(t-1)] / GDP(t-1) where GDP(t) is US gross domestic product in
year t.
Government Leverage = US public debt held by the public in year t / GDP(t)
Net Debt Issuances by the US Government = Change in US public debt held by the public from
year t-1 to t / GDP(t-1)
Book Leverage = Total Debt / Total book value of assets
Market leverage = Total Debt / (Total Debt + Equity Market Capitalization)

42
Net Debt leverage = (Total Debt – Cash) / Total book value of assets
Net Debt Issuance = [Total Debt(t) – Total Debt(t-1)] / Total book value of assets(t-1)
Net Equity Issuance = [Equity issues(t) – Equity repurchases(t)] / Total book value of assets(t-1)
Market-to-Book Equity Ratio = Equity Market Capitalization / Book Equity
Profitability = operating income before depreciation / total book value of assets
Tangibility = net plant property and equipment / total book value of assets
Firm Size = natural log of total sales in constant (1982) dollars.
Relative Firm Size = natural log of the ratio of total sales to U.S. GDP, in basis points
Earnings Volatility = standard deviation of the ratio of EBIT / total book value of assets,
calculated over the trailing 10 years. We require at least 4 years of trailing EBIT data to
calculate the standard deviation. For firms with at least 4, but less than 10 years of available
data, it is calculated over all available trailing years.
Intangible Assets = [Total Assets – (Net PP&E + cash and marketable securities + accounts
receivable + inventories)] / Total Assets
Asset growth = [Total book value of assets(t) - Total book value of assets(t-1)] / Total book
value of assets(t)
Investment = change in (gross) long-term assets plus the change in inventory from the balance
sheet.
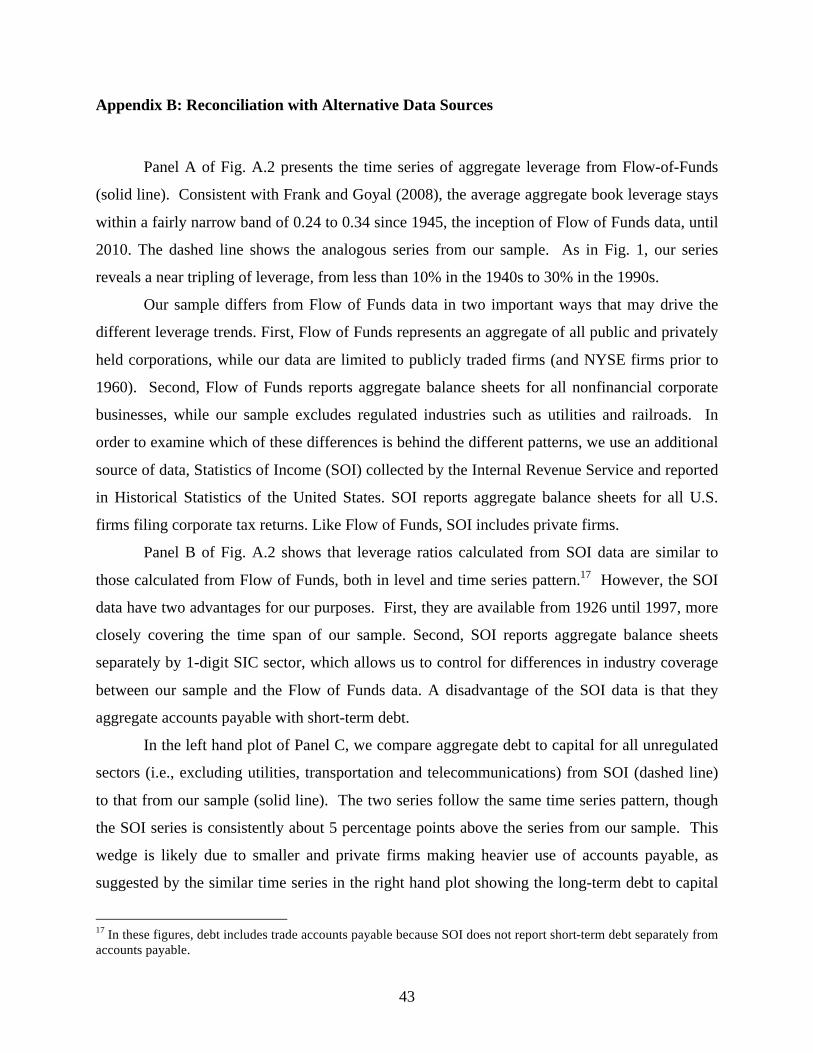
43
Appendix B: Reconciliation with Alternative Data Sources
Panel A of Fig. A.2 presents the time series of aggregate leverage from Flow-of-Funds
(solid line). Consistent with Frank and Goyal (2008), the average aggregate book leverage stays
within a fairly narrow band of 0.24 to 0.34 since 1945, the inception of Flow of Funds data, until
2010. The dashed line shows the analogous series from our sample. As in Fig. 1, our series
reveals a near tripling of leverage, from less than 10% in the 1940s to 30% in the 1990s.
Our sample differs from Flow of Funds data in two important ways that may drive the
different leverage trends. First, Flow of Funds represents an aggregate of all public and privately
held corporations, while our data are limited to publicly traded firms (and NYSE firms prior to
1960). Second, Flow of Funds reports aggregate balance sheets for all nonfinancial corporate
businesses, while our sample excludes regulated industries such as utilities and railroads. In
order to examine which of these differences is behind the different patterns, we use an additional
source of data, Statistics of Income (SOI) collected by the Internal Revenue Service and reported
in Historical Statistics of the United States. SOI reports aggregate balance sheets for all U.S.
firms filing corporate tax returns. Like Flow of Funds, SOI includes private firms.
Panel B of Fig. A.2 shows that leverage ratios calculated from SOI data are similar to
those calculated from Flow of Funds, both in level and time series pattern.17 However, the SOI
data have two advantages for our purposes. First, they are available from 1926 until 1997, more
closely covering the time span of our sample. Second, SOI reports aggregate balance sheets
separately by 1-digit SIC sector, which allows us to control for differences in industry coverage
between our sample and the Flow of Funds data. A disadvantage of the SOI data is that they
aggregate accounts payable with short-term debt.
In the left hand plot of Panel C, we compare aggregate debt to capital for all unregulated
sectors (i.e., excluding utilities, transportation and telecommunications) from SOI (dashed line)
to that from our sample (solid line). The two series follow the same time series pattern, though
the SOI series is consistently about 5 percentage points above the series from our sample. This
wedge is likely due to smaller and private firms making heavier use of accounts payable, as
suggested by the similar time series in the right hand plot showing the long-term debt to capital
17 In these figures, debt includes trade accounts payable because SOI does not report short-term debt separately from accounts payable.
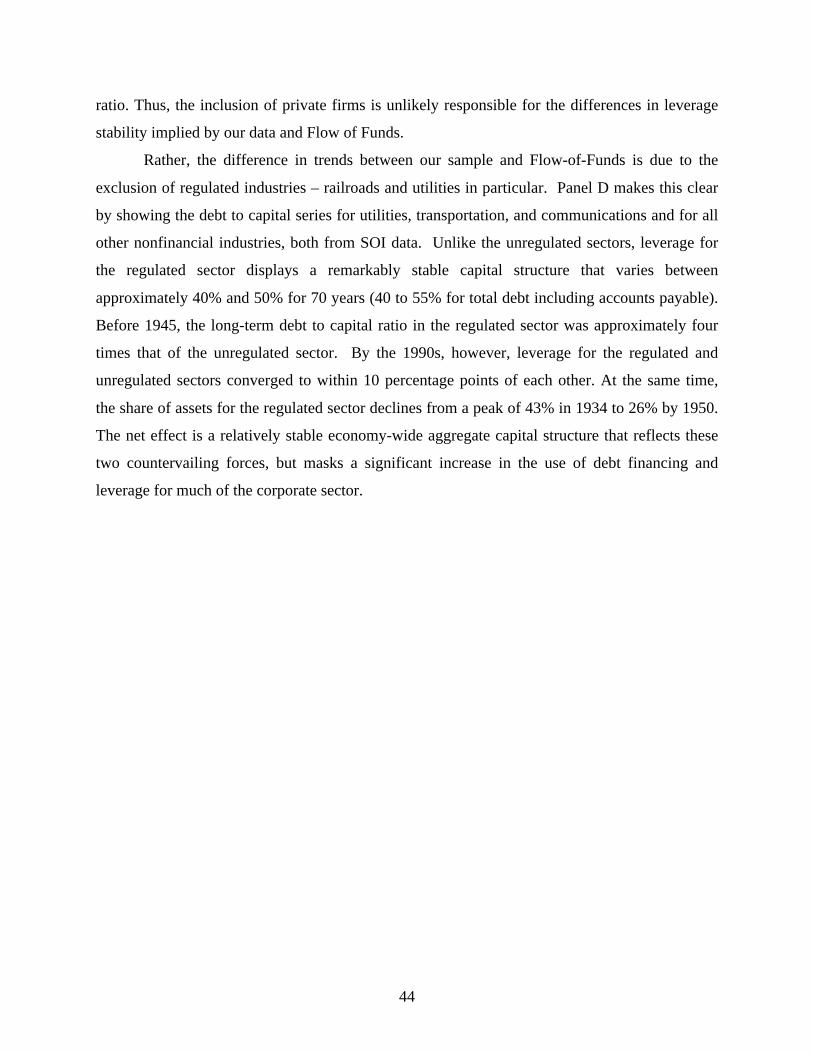
44
ratio. Thus, the inclusion of private firms is unlikely responsible for the differences in leverage
stability implied by our data and Flow of Funds.
Rather, the difference in trends between our sample and Flow-of-Funds is due to the
exclusion of regulated industries – railroads and utilities in particular. Panel D makes this clear
by showing the debt to capital series for utilities, transportation, and communications and for all
other nonfinancial industries, both from SOI data. Unlike the unregulated sectors, leverage for
the regulated sector displays a remarkably stable capital structure that varies between
approximately 40% and 50% for 70 years (40 to 55% for total debt including accounts payable).
Before 1945, the long-term debt to capital ratio in the regulated sector was approximately four
times that of the unregulated sector. By the 1990s, however, leverage for the regulated and
unregulated sectors converged to within 10 percentage points of each other. At the same time,
the share of assets for the regulated sector declines from a peak of 43% in 1934 to 26% by 1950.
The net effect is a relatively stable economy-wide aggregate capital structure that reflects these
two countervailing forces, but masks a significant increase in the use of debt financing and
leverage for much of the corporate sector.
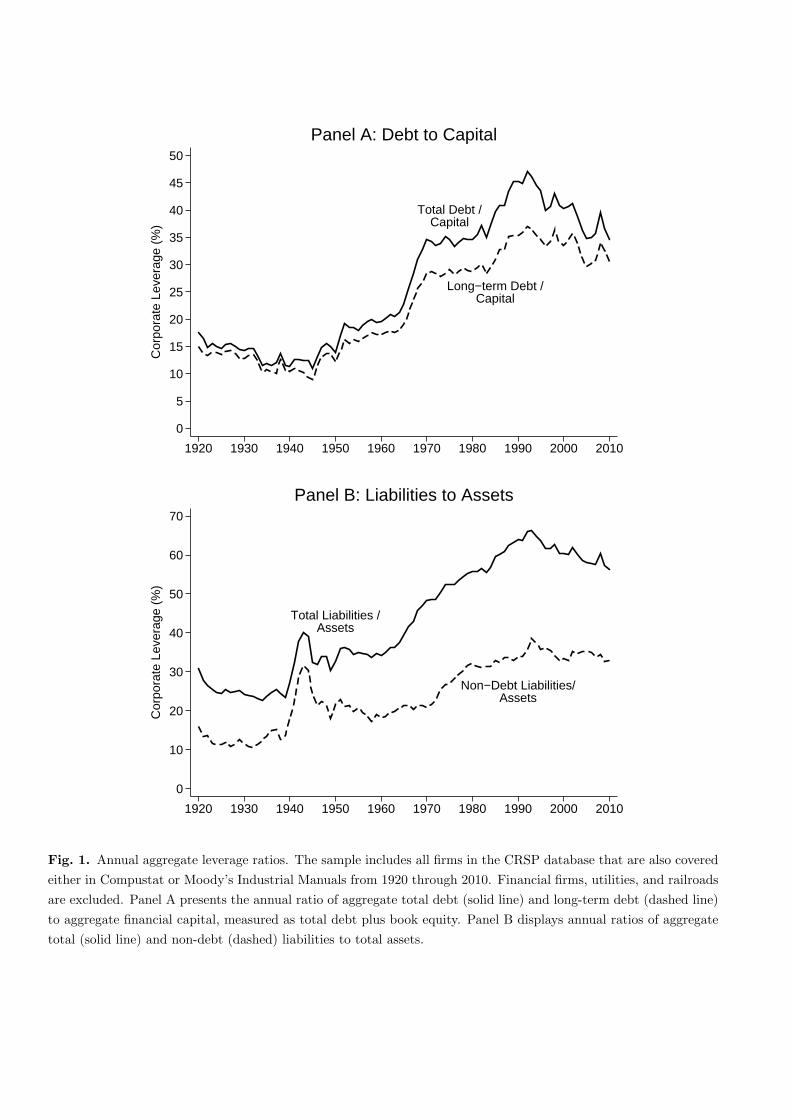
Total Debt /Capital
Long−term Debt /Capital
0
5
10
15
20
25
30
35
40
45
50C
orpo
rate
Lev
erag
e (%
)
1920 1930 1940 1950 1960 1970 1980 1990 2000 2010
Panel A: Debt to Capital
Total Liabilities /Assets
Non−Debt Liabilities/Assets
0
10
20
30
40
50
60
70
Cor
pora
te L
ever
age
(%)
1920 1930 1940 1950 1960 1970 1980 1990 2000 2010
Panel B: Liabilities to Assets
Fig. 1. Annual aggregate leverage ratios. The sample includes all firms in the CRSP database that are also covered
either in Compustat or Moody’s Industrial Manuals from 1920 through 2010. Financial firms, utilities, and railroads
are excluded. Panel A presents the annual ratio of aggregate total debt (solid line) and long-term debt (dashed line)
to aggregate financial capital, measured as total debt plus book equity. Panel B displays annual ratios of aggregate
total (solid line) and non-debt (dashed) liabilities to total assets.
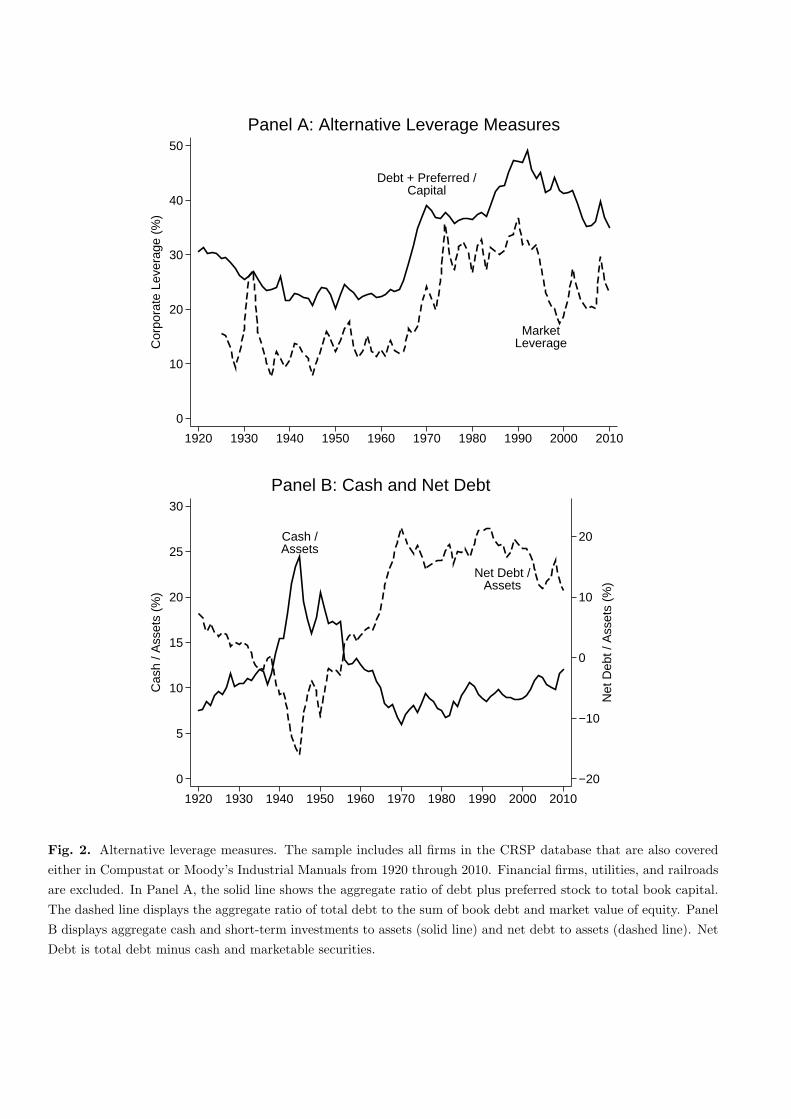
Debt + Preferred /Capital
MarketLeverage
0
10
20
30
40
50C
orpo
rate
Lev
erag
e (%
)
1920 1930 1940 1950 1960 1970 1980 1990 2000 2010
Panel A: Alternative Leverage Measures
Cash /Assets
Net Debt /Assets
−20
−10
0
10
20
Net
Deb
t / A
sset
s (%
)
0
5
10
15
20
25
30
Cas
h / A
sset
s (%
)
1920 1930 1940 1950 1960 1970 1980 1990 2000 2010
Panel B: Cash and Net Debt
Fig. 2. Alternative leverage measures. The sample includes all firms in the CRSP database that are also covered
either in Compustat or Moody’s Industrial Manuals from 1920 through 2010. Financial firms, utilities, and railroads
are excluded. In Panel A, the solid line shows the aggregate ratio of debt plus preferred stock to total book capital.
The dashed line displays the aggregate ratio of total debt to the sum of book debt and market value of equity. Panel
B displays aggregate cash and short-term investments to assets (solid line) and net debt to assets (dashed line). Net
Debt is total debt minus cash and marketable securities.
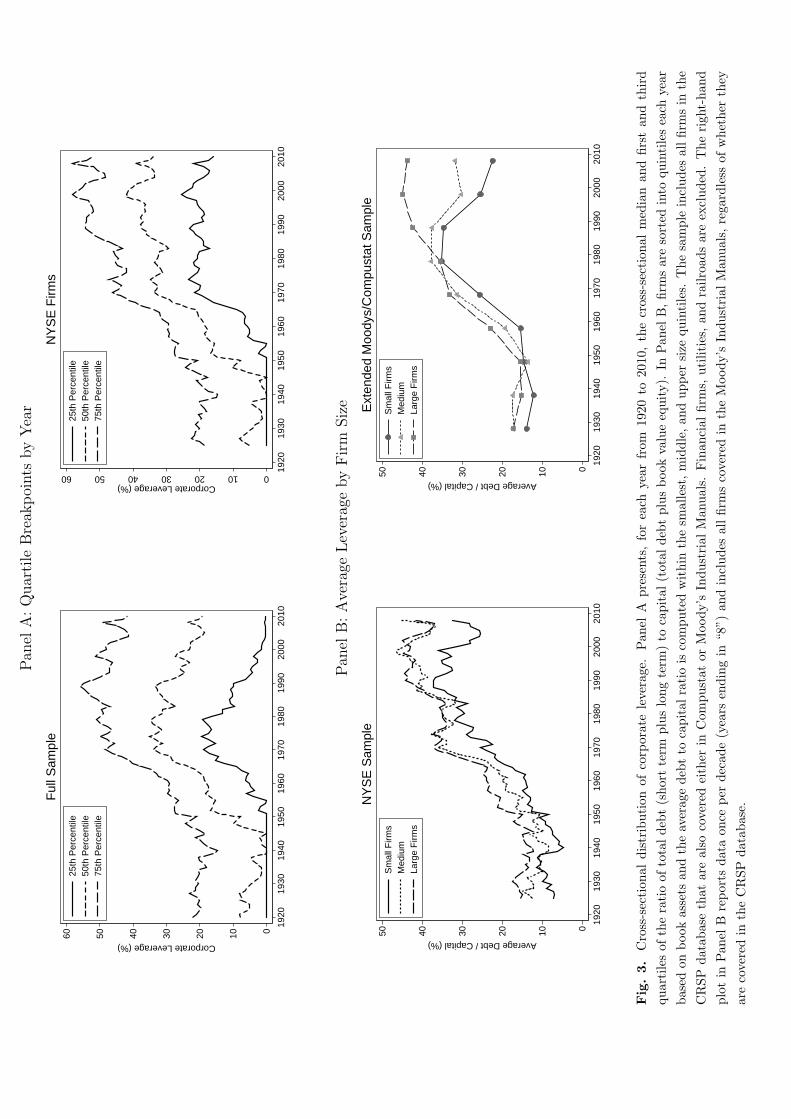
Pan
elA:Quartile
Break
points
byYear
0102030405060
Corporate Leverage (%)
1920
1930
1940
1950
1960
1970
1980
1990
2000
2010
25th
Per
cent
ile50
th P
erce
ntile
75th
Per
cent
ile
Ful
l Sam
ple
0102030405060Corporate Leverage (%)
1920
1930
1940
1950
1960
1970
1980
1990
2000
2010
25th
Per
cent
ile50
th P
erce
ntile
75th
Per
cent
ile
NY
SE
Firm
s
Pan
elB:Average
LeveragebyFirm
Size
01020304050
Average Debt / Capital (%)
1920
1930
1940
1950
1960
1970
1980
1990
2000
2010
Sm
all F
irms
Med
ium
Larg
e F
irms
NY
SE
Sam
ple
01020304050
Average Debt / Capital (%)
1920
1930
1940
1950
1960
1970
1980
1990
2000
2010
Sm
all F
irms
Med
ium
Larg
e F
irms
Ext
ende
d M
oody
s/C
ompu
stat
Sam
ple
Fig.3.
Cross-section
aldistribution
ofcorporate
leverag
e.Pan
elA
presents,foreach
yearfrom
1920
to20
10,thecross-sectional
med
ianan
dfirstandthird
quartilesof
theratioof
totaldebt(short
term
pluslongterm
)to
capital
(total
deb
tplusbook
valueequity).
InPan
elB,firm
saresorted
into
quintileseach
year
based
onbook
assets
andtheaverag
edeb
tto
capital
ratioiscomputedwithin
thesm
allest,middle,an
dupper
size
quintiles.
Thesample
includes
allfirm
sin
the
CRSP
datab
asethat
arealso
coveredeither
inCom
pustat
orMoody’s
Industrial
Man
uals.
Finan
cial
firm
s,utilities,an
drailroad
sareexcluded
.Theright-hand
plotin
Panel
Breports
dataon
ceper
decade(years
endingin
“8”)
andincludes
allfirm
scoveredin
theMoody’s
Industrial
Man
uals,
rega
rdless
ofwhether
they
arecoveredin
theCRSP
datab
ase.
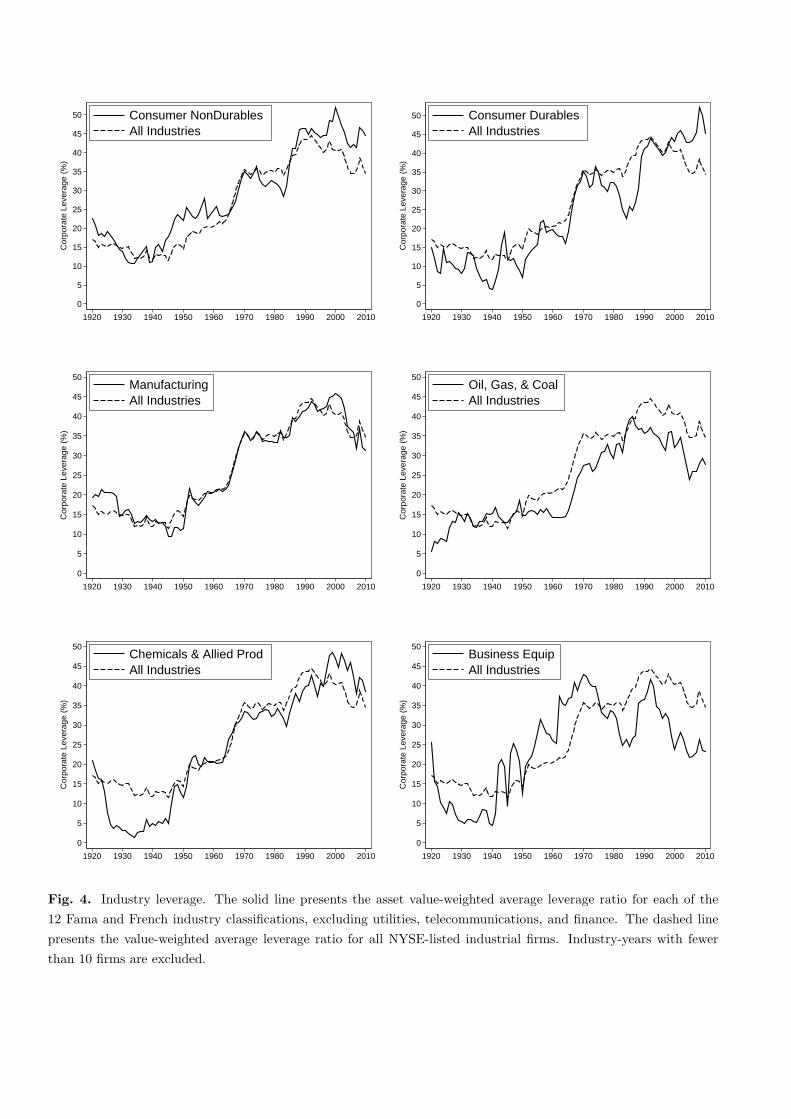
0
5
10
15
20
25
30
35
40
45
50
Cor
pora
te L
ever
age
(%)
1920 1930 1940 1950 1960 1970 1980 1990 2000 2010
Consumer NonDurablesAll Industries
0
5
10
15
20
25
30
35
40
45
50
Cor
pora
te L
ever
age
(%)
1920 1930 1940 1950 1960 1970 1980 1990 2000 2010
Consumer DurablesAll Industries
0
5
10
15
20
25
30
35
40
45
50
Cor
pora
te L
ever
age
(%)
1920 1930 1940 1950 1960 1970 1980 1990 2000 2010
ManufacturingAll Industries
0
5
10
15
20
25
30
35
40
45
50
Cor
pora
te L
ever
age
(%)
1920 1930 1940 1950 1960 1970 1980 1990 2000 2010
Oil, Gas, & CoalAll Industries
0
5
10
15
20
25
30
35
40
45
50
Cor
pora
te L
ever
age
(%)
1920 1930 1940 1950 1960 1970 1980 1990 2000 2010
Chemicals & Allied ProdAll Industries
0
5
10
15
20
25
30
35
40
45
50
Cor
pora
te L
ever
age
(%)
1920 1930 1940 1950 1960 1970 1980 1990 2000 2010
Business EquipAll Industries
Fig. 4. Industry leverage. The solid line presents the asset value-weighted average leverage ratio for each of the
12 Fama and French industry classifications, excluding utilities, telecommunications, and finance. The dashed line
presents the value-weighted average leverage ratio for all NYSE-listed industrial firms. Industry-years with fewer
than 10 firms are excluded.
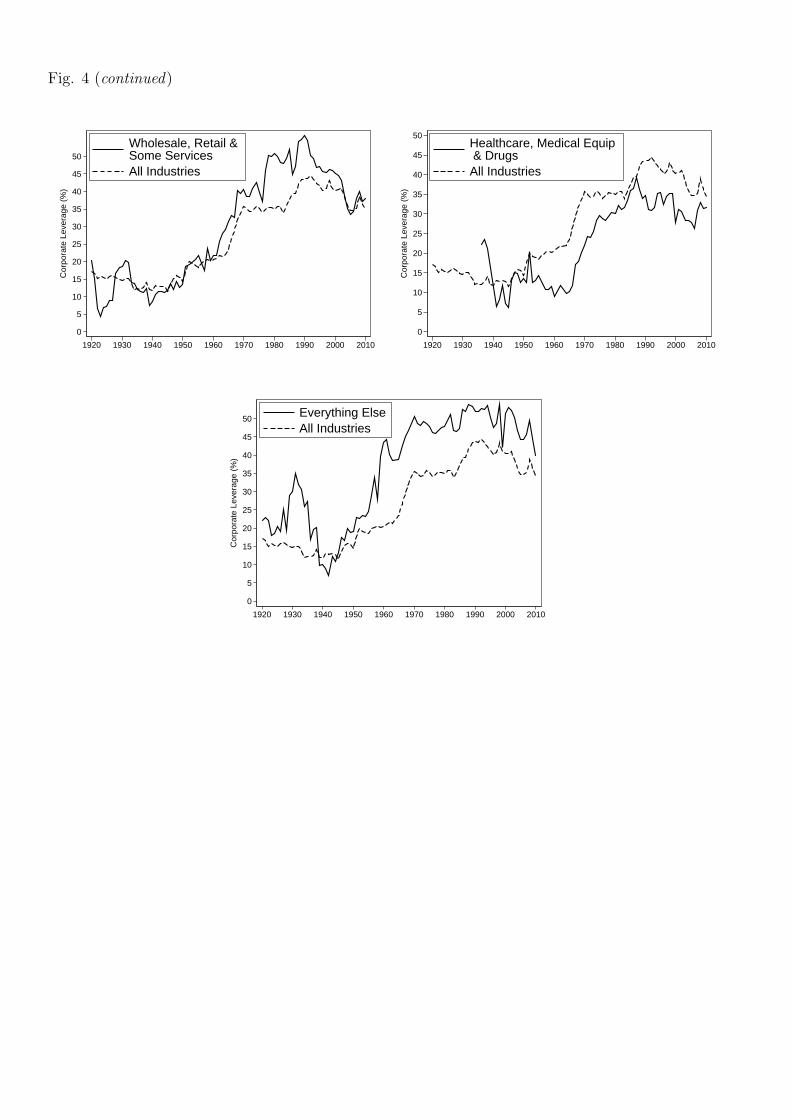
Fig. 4 (continued)
0
5
10
15
20
25
30
35
40
45
50
Cor
pora
te L
ever
age
(%)
1920 1930 1940 1950 1960 1970 1980 1990 2000 2010
Wholesale, Retail &Some ServicesAll Industries
0
5
10
15
20
25
30
35
40
45
50
Cor
pora
te L
ever
age
(%)
1920 1930 1940 1950 1960 1970 1980 1990 2000 2010
Healthcare, Medical Equip & DrugsAll Industries
0
5
10
15
20
25
30
35
40
45
50
Cor
pora
te L
ever
age
(%)
1920 1930 1940 1950 1960 1970 1980 1990 2000 2010
Everything ElseAll Industries
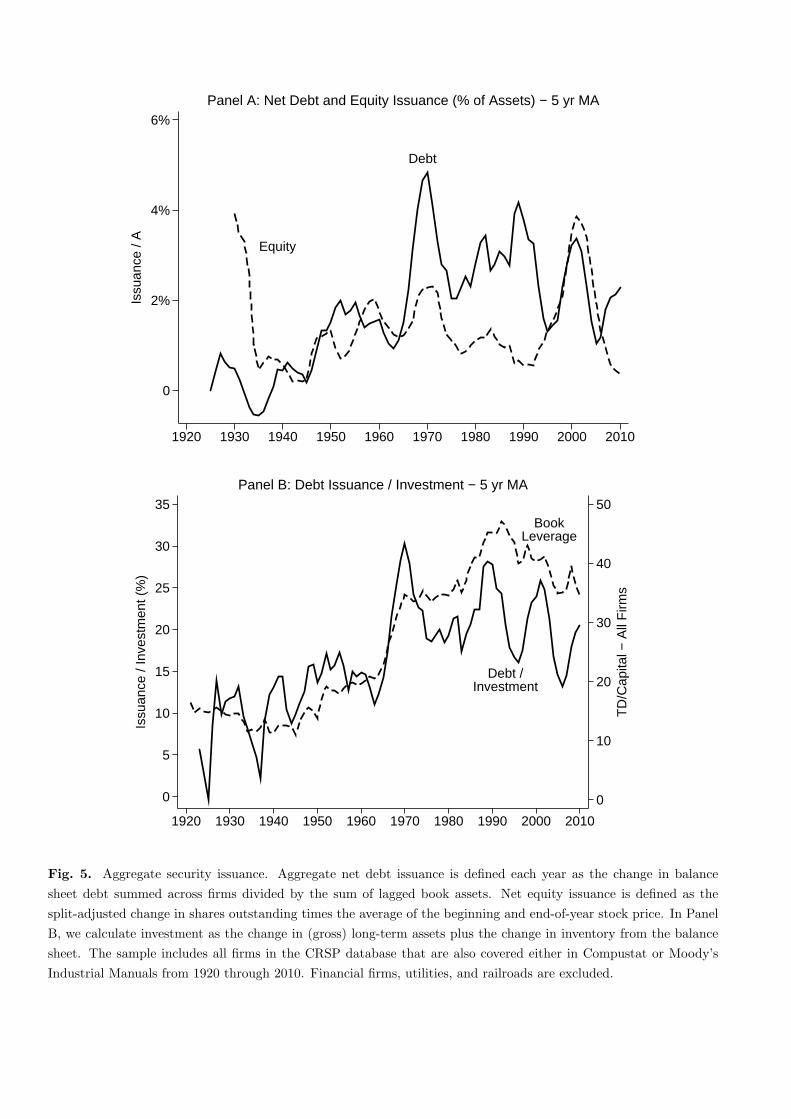
Equity
Debt
0
2%
4%
6%Is
suan
ce /
A
1920 1930 1940 1950 1960 1970 1980 1990 2000 2010
Panel A: Net Debt and Equity Issuance (% of Assets) − 5 yr MA
Debt /Investment
BookLeverage
0
10
20
30
40
50
TD
/Cap
ital −
All
Firm
s
0
5
10
15
20
25
30
35
Issu
ance
/ In
vest
men
t (%
)
1920 1930 1940 1950 1960 1970 1980 1990 2000 2010
Panel B: Debt Issuance / Investment − 5 yr MA
Fig. 5. Aggregate security issuance. Aggregate net debt issuance is defined each year as the change in balance
sheet debt summed across firms divided by the sum of lagged book assets. Net equity issuance is defined as the
split-adjusted change in shares outstanding times the average of the beginning and end-of-year stock price. In Panel
B, we calculate investment as the change in (gross) long-term assets plus the change in inventory from the balance
sheet. The sample includes all firms in the CRSP database that are also covered either in Compustat or Moody’s
Industrial Manuals from 1920 through 2010. Financial firms, utilities, and railroads are excluded.
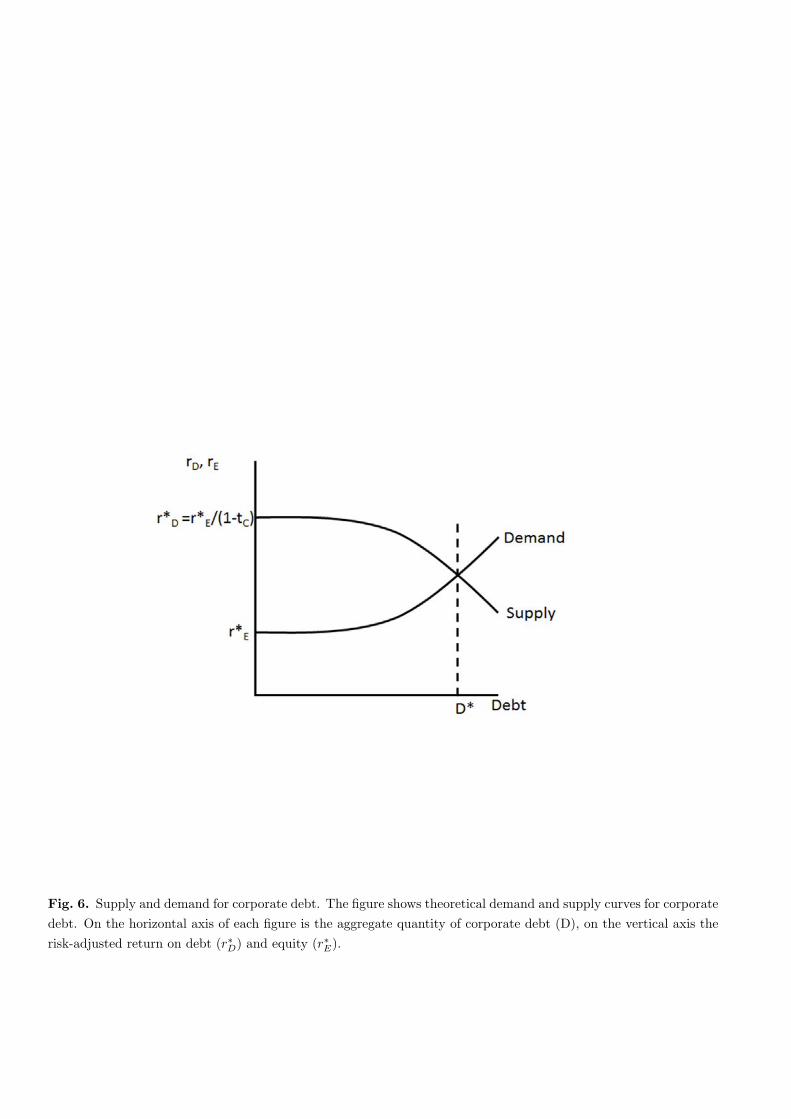
Fig. 6. Supply and demand for corporate debt. The figure shows theoretical demand and supply curves for corporate
debt. On the horizontal axis of each figure is the aggregate quantity of corporate debt (D), on the vertical axis the
risk-adjusted return on debt (r∗D) and equity (r∗E).
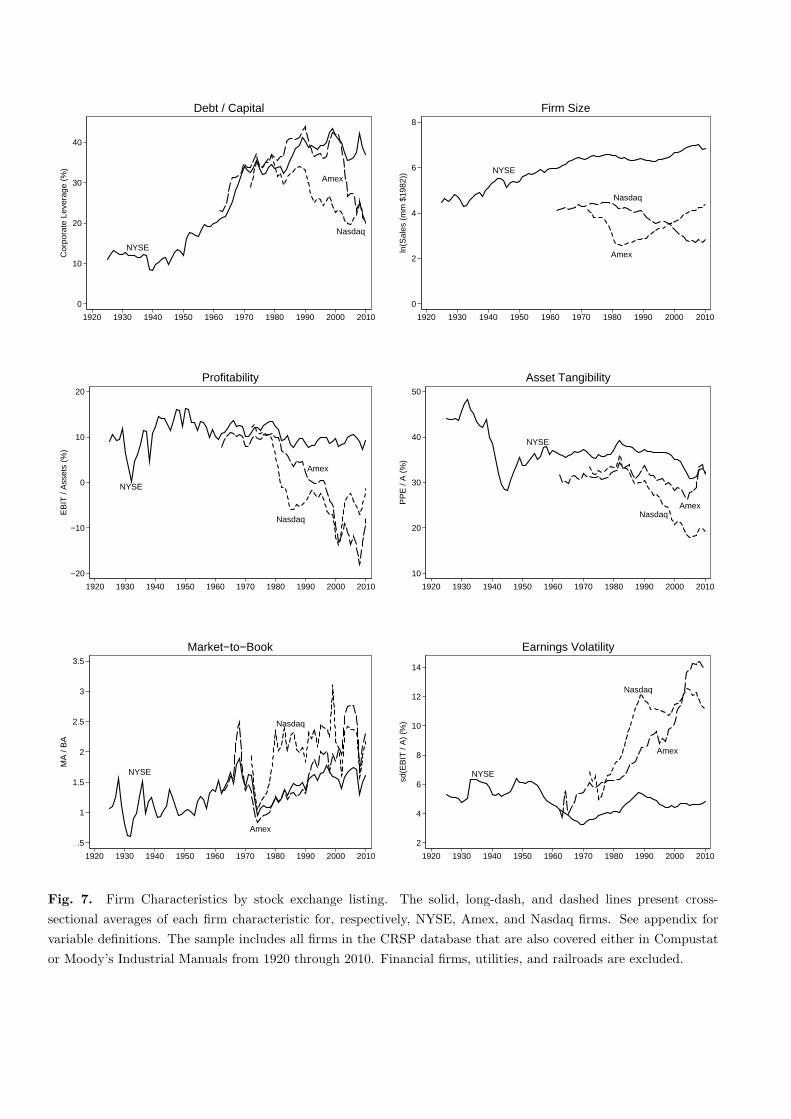
NYSE
Amex
Nasdaq
0
10
20
30
40
Cor
pora
te L
ever
age
(%)
1920 1930 1940 1950 1960 1970 1980 1990 2000 2010
Debt / Capital
NYSE
Amex
Nasdaq
0
2
4
6
8
ln(S
ales
(m
m $
1982
))
1920 1930 1940 1950 1960 1970 1980 1990 2000 2010
Firm Size
NYSE
Amex
Nasdaq
−20
−10
0
10
20
EB
IT /
Ass
ets
(%)
1920 1930 1940 1950 1960 1970 1980 1990 2000 2010
Profitability
NYSE
AmexNasdaq
10
20
30
40
50P
PE
/ A
(%
)
1920 1930 1940 1950 1960 1970 1980 1990 2000 2010
Asset Tangibility
NYSE
Amex
Nasdaq
.5
1
1.5
2
2.5
3
3.5
MA
/ B
A
1920 1930 1940 1950 1960 1970 1980 1990 2000 2010
Market−to−Book
NYSE
Amex
Nasdaq
2
4
6
8
10
12
14
sd(E
BIT
/ A
) (%
)
1920 1930 1940 1950 1960 1970 1980 1990 2000 2010
Earnings Volatility
Fig. 7. Firm Characteristics by stock exchange listing. The solid, long-dash, and dashed lines present cross-
sectional averages of each firm characteristic for, respectively, NYSE, Amex, and Nasdaq firms. See appendix for
variable definitions. The sample includes all firms in the CRSP database that are also covered either in Compustat
or Moody’s Industrial Manuals from 1920 through 2010. Financial firms, utilities, and railroads are excluded.
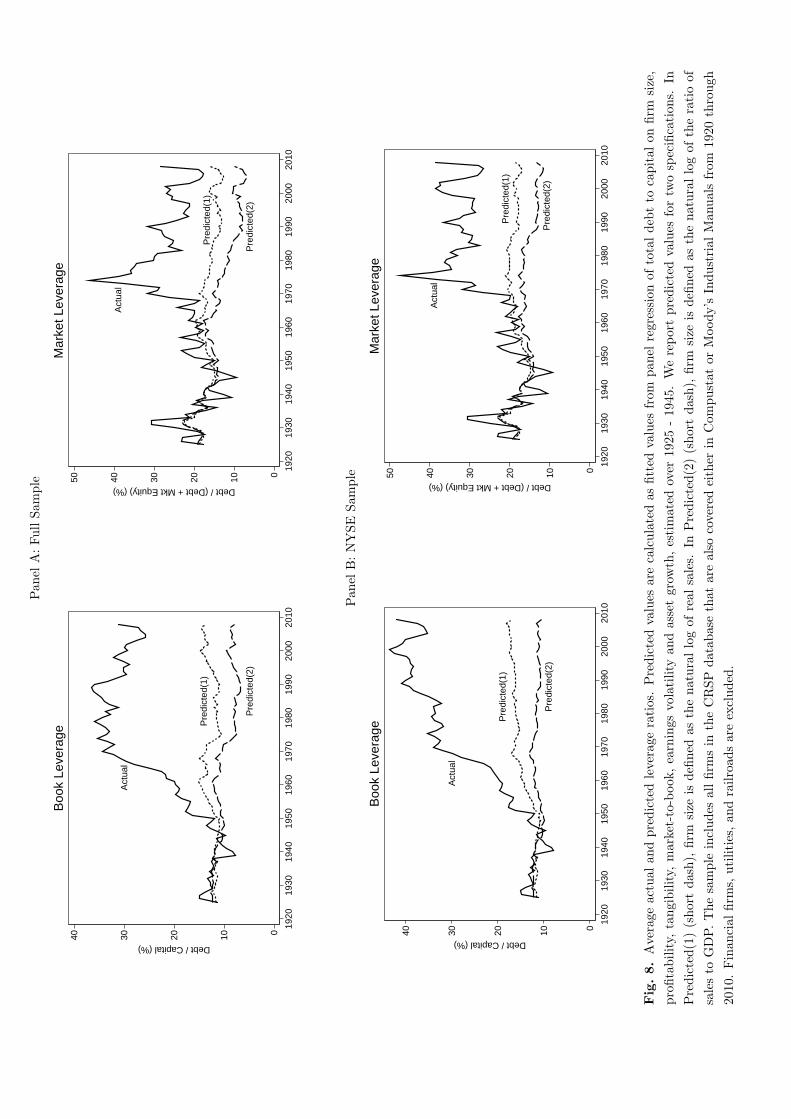
Pan
elA:FullSam
ple
Act
ual
Pre
dict
ed(1
)
Pre
dict
ed(2
)
010203040
Debt / Capital (%)
1920
1930
1940
1950
1960
1970
1980
1990
2000
2010
Boo
k Le
vera
ge
Act
ual
Pre
dict
ed(1
)
Pre
dict
ed(2
)
01020304050
Debt / (Debt + Mkt Equity) (%)
1920
1930
1940
1950
1960
1970
1980
1990
2000
2010
Mar
ket L
ever
age
Pan
elB:NYSE
Sam
ple
Act
ual
Pre
dict
ed(1
)
Pre
dict
ed(2
)
010203040
Debt / Capital (%)
1920
1930
1940
1950
1960
1970
1980
1990
2000
2010
Boo
k Le
vera
ge
Act
ual
Pre
dict
ed(1
)
Pre
dict
ed(2
)
01020304050
Debt / (Debt + Mkt Equity) (%)
1920
1930
1940
1950
1960
1970
1980
1990
2000
2010
Mar
ket L
ever
age
Fig.8.Averag
eactual
andpredictedleverag
eratios.Predictedvalues
arecalculatedas
fitted
values
from
pan
elregression
oftotaldeb
tto
capitalonfirm
size,
profitability,
tangibility,
market-to-book
,earnings
volatilityan
dassetgrow
th,estimated
over
1925
-19
45.Wereportpredictedvalues
fortw
ospecifications.
In
Predicted(1)(shortdash),
firm
size
isdefi
ned
asthenaturallogof
real
sales.
InPredicted(2)(shortdash),
firm
size
isdefi
ned
asthenaturallogoftheratioof
salesto
GDP.Thesample
includes
allfirm
sin
theCRSP
datab
asethat
arealso
coveredeither
inCom
pustat
orMoody’s
Industrial
Man
ualsfrom
1920through
2010.Finan
cial
firm
s,utilities,an
drailroad
sare
excluded
.
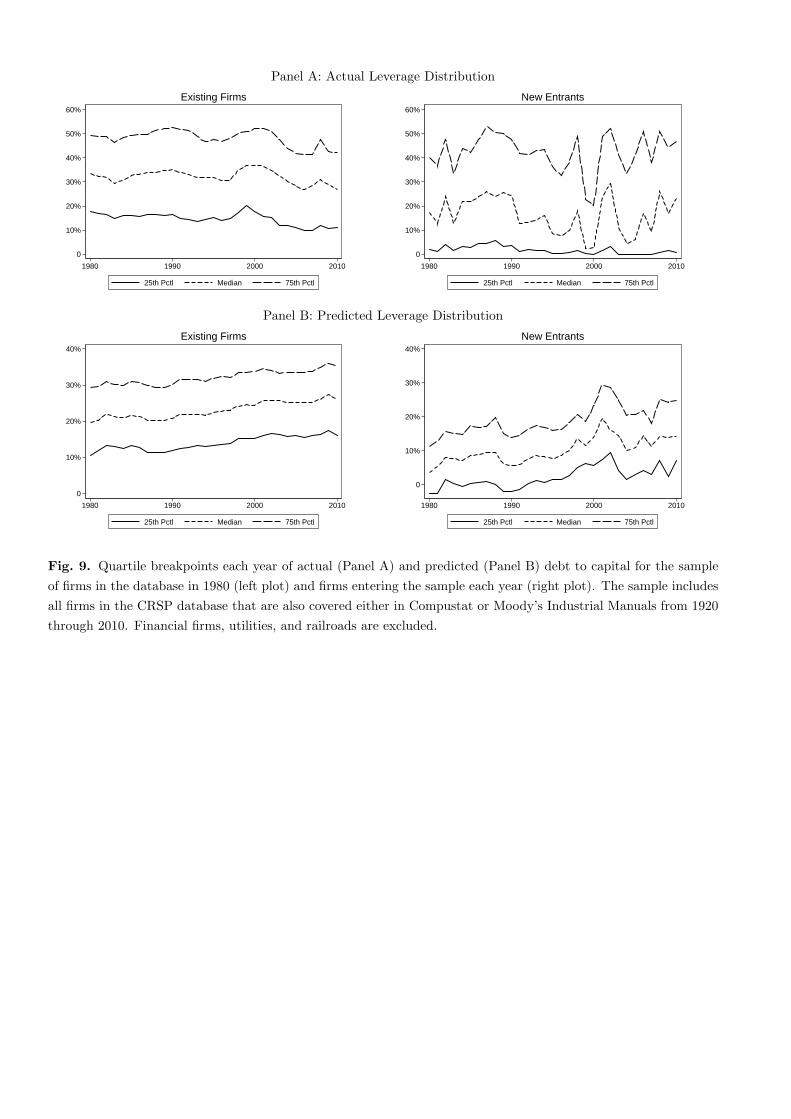
Panel A: Actual Leverage Distribution
0
10%
20%
30%
40%
50%
60%
1980 1990 2000 2010
25th Pctl Median 75th Pctl
Existing Firms
0
10%
20%
30%
40%
50%
60%
1980 1990 2000 2010
25th Pctl Median 75th Pctl
New Entrants
Panel B: Predicted Leverage Distribution
0
10%
20%
30%
40%
1980 1990 2000 2010
25th Pctl Median 75th Pctl
Existing Firms
0
10%
20%
30%
40%
1980 1990 2000 2010
25th Pctl Median 75th Pctl
New Entrants
Fig. 9. Quartile breakpoints each year of actual (Panel A) and predicted (Panel B) debt to capital for the sample
of firms in the database in 1980 (left plot) and firms entering the sample each year (right plot). The sample includes
all firms in the CRSP database that are also covered either in Compustat or Moody’s Industrial Manuals from 1920
through 2010. Financial firms, utilities, and railroads are excluded.
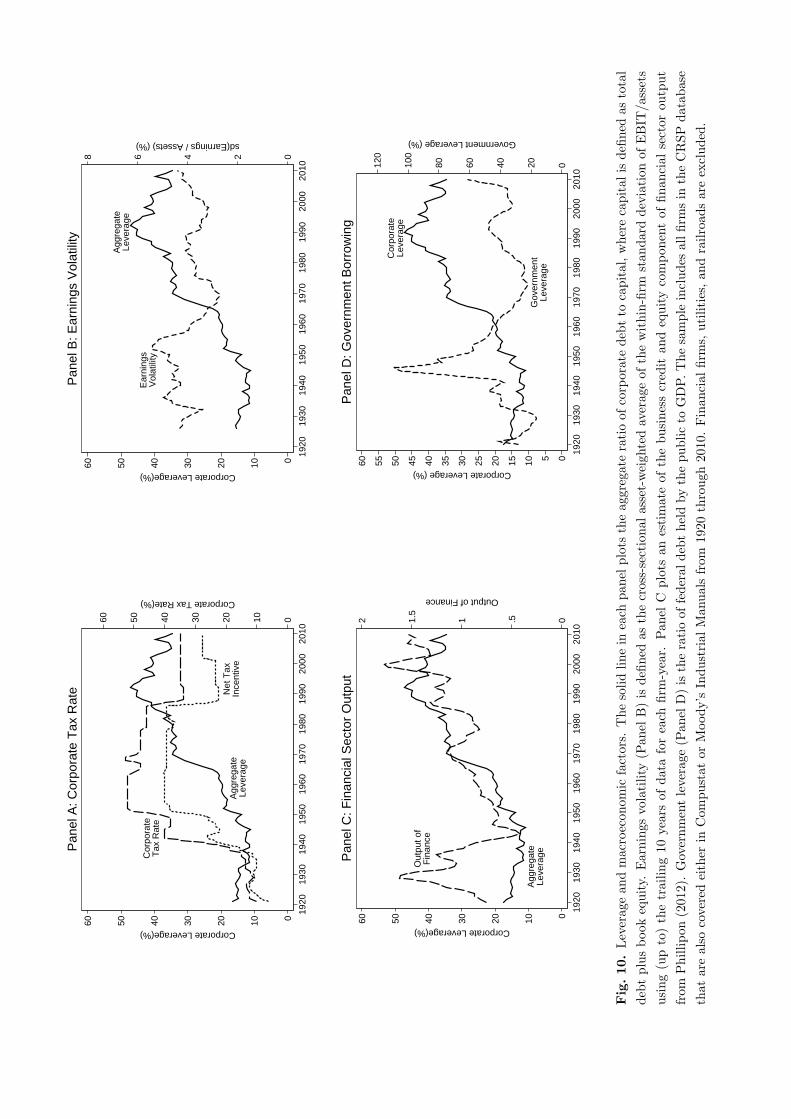
Agg
rega
teLe
vera
ge
Cor
pora
teT
ax R
ate
Net
Tax
Ince
ntiv
e
0102030405060
Corporate Tax Rate(%)
0102030405060
Corporate Leverage(%)
1920
1930
1940
1950
1960
1970
1980
1990
2000
2010
Pan
el A
: Cor
pora
te T
ax R
ate
Agg
rega
teLe
vera
ge
Ear
ning
sV
olat
ility
02468
sd(Earnings / Assets) (%)
0102030405060
Corporate Leverage(%)
1920
1930
1940
1950
1960
1970
1980
1990
2000
2010
Pan
el B
: Ear
ning
s V
olat
ility
Agg
rega
teLe
vera
ge
Out
put o
fF
inan
ce
0.511.5
2
Output of Finance
0102030405060
Corporate Leverage(%)
1920
1930
1940
1950
1960
1970
1980
1990
2000
2010
Pan
el C
: Fin
anci
al S
ecto
r O
utpu
t
Cor
pora
teLe
vera
ge
Gov
ernm
ent
Leve
rage
020406080100
120
Government Leverage (%)
051015202530354045505560
Corporate Leverage (%)
1920
1930
1940
1950
1960
1970
1980
1990
2000
2010
Pan
el D
: Gov
ernm
ent B
orro
win
g
Fig.10.Leverag
ean
dmacroecon
omic
factors.
Thesolidlinein
each
pan
elplots
theag
gregateratioof
corporatedeb
tto
capital,wherecapital
isdefi
ned
astotal
debtplusbook
equity.
Earnings
volatility(P
anel
B)isdefi
ned
asthecross-sectional
asset-weigh
tedaverag
eof
thewithin-firm
stan
darddeviation
ofEBIT
/assets
using(upto)thetrailing10
years
ofdataforeach
firm
-year.
Pan
elC
plots
anestimateof
thebusinesscred
itan
dequitycompon
entof
finan
cialsectoroutput
from
Phillipon(201
2).Governmentleverag
e(P
anel
D)istheratioof
federal
deb
theldbythepublicto
GDP.Thesample
includes
allfirm
sin
theCRSPdatabase
that
arealso
coveredeither
inCom
pustat
orMoody’s
Industrial
Man
ualsfrom
1920
through
2010.Finan
cial
firm
s,utilities,an
drailroad
sareexcluded
.
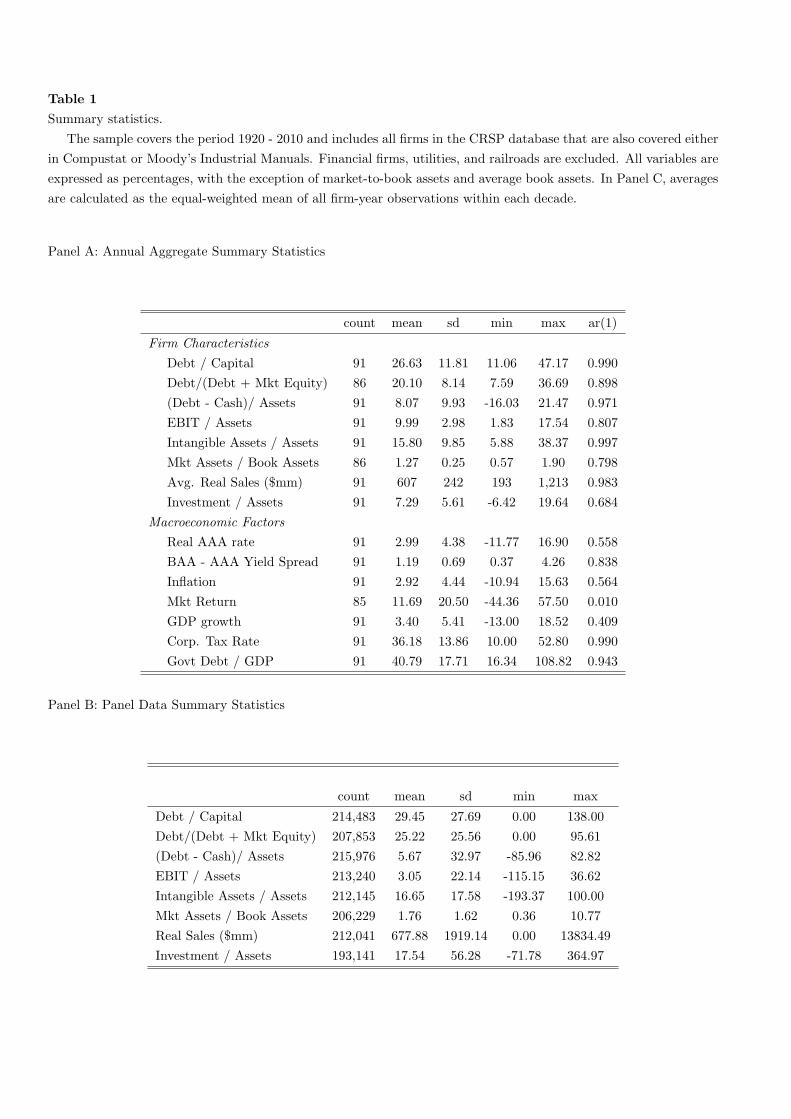
Table 1
Summary statistics.
The sample covers the period 1920 - 2010 and includes all firms in the CRSP database that are also covered either
in Compustat or Moody’s Industrial Manuals. Financial firms, utilities, and railroads are excluded. All variables are
expressed as percentages, with the exception of market-to-book assets and average book assets. In Panel C, averages
are calculated as the equal-weighted mean of all firm-year observations within each decade.
Panel A: Annual Aggregate Summary Statistics
count mean sd min max ar(1)
Firm Characteristics
Debt / Capital 91 26.63 11.81 11.06 47.17 0.990
Debt/(Debt + Mkt Equity) 86 20.10 8.14 7.59 36.69 0.898
(Debt - Cash)/ Assets 91 8.07 9.93 -16.03 21.47 0.971
EBIT / Assets 91 9.99 2.98 1.83 17.54 0.807
Intangible Assets / Assets 91 15.80 9.85 5.88 38.37 0.997
Mkt Assets / Book Assets 86 1.27 0.25 0.57 1.90 0.798
Avg. Real Sales ($mm) 91 607 242 193 1,213 0.983
Investment / Assets 91 7.29 5.61 -6.42 19.64 0.684
Macroeconomic Factors
Real AAA rate 91 2.99 4.38 -11.77 16.90 0.558
BAA - AAA Yield Spread 91 1.19 0.69 0.37 4.26 0.838
Inflation 91 2.92 4.44 -10.94 15.63 0.564
Mkt Return 85 11.69 20.50 -44.36 57.50 0.010
GDP growth 91 3.40 5.41 -13.00 18.52 0.409
Corp. Tax Rate 91 36.18 13.86 10.00 52.80 0.990
Govt Debt / GDP 91 40.79 17.71 16.34 108.82 0.943
Panel B: Panel Data Summary Statistics
count mean sd min max
Debt / Capital 214,483 29.45 27.69 0.00 138.00
Debt/(Debt + Mkt Equity) 207,853 25.22 25.56 0.00 95.61
(Debt - Cash)/ Assets 215,976 5.67 32.97 -85.96 82.82
EBIT / Assets 213,240 3.05 22.14 -115.15 36.62
Intangible Assets / Assets 212,145 16.65 17.58 -193.37 100.00
Mkt Assets / Book Assets 206,229 1.76 1.62 0.36 10.77
Real Sales ($mm) 212,041 677.88 1919.14 0.00 13834.49
Investment / Assets 193,141 17.54 56.28 -71.78 364.97
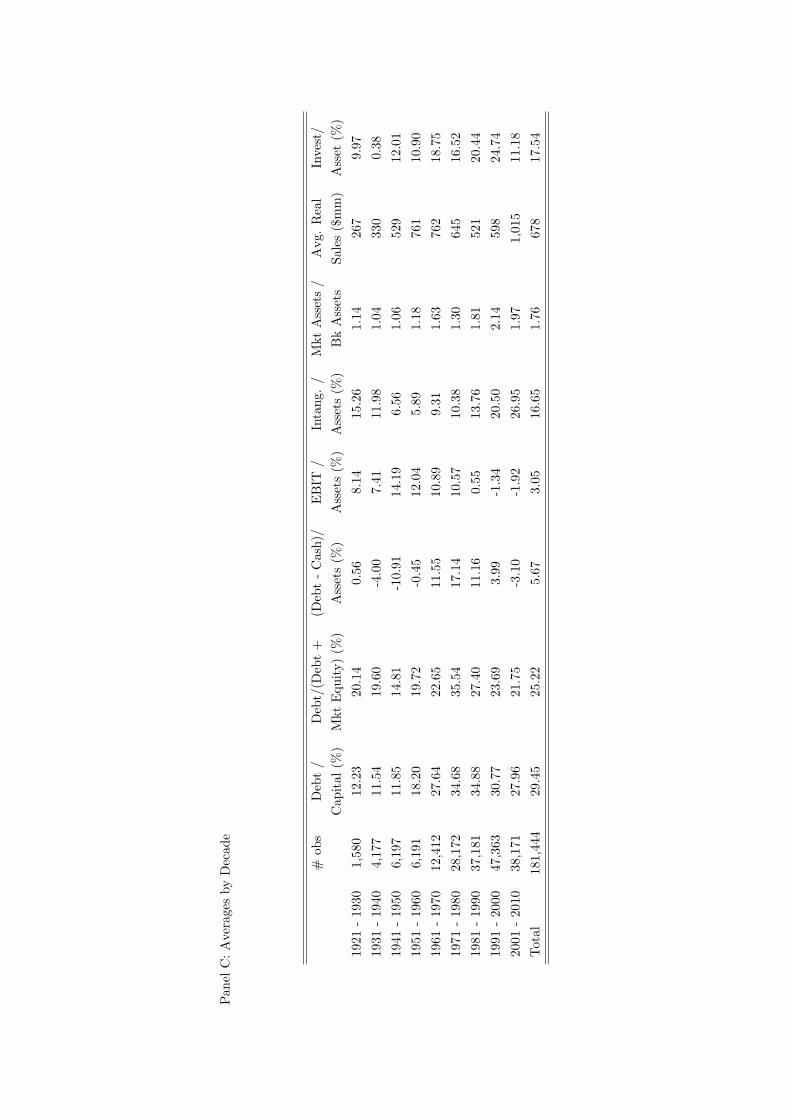
Pan
elC:Averag
esbyDecad
e
#ob
sDebt/
Deb
t/(D
ebt+
(Deb
t-Cash)/
EBIT
/Intang.
/MktAssets/
Avg.
Real
Invest/
Cap
ital
(%)
MktEquity)(%
)Assets(%
)Assets(%
)Assets(%
)BkAssets
Sales
($mm)
Asset
(%)
1921
-19
301,580
12.23
20.14
0.56
8.14
15.26
1.14
267
9.97
1931
-19
404,17
711
.54
19.60
-4.00
7.41
11.98
1.04
330
0.38
1941
-19
506,19
711
.85
14.81
-10.91
14.19
6.56
1.06
529
12.01
1951
-19
606,19
118
.20
19.72
-0.45
12.04
5.89
1.18
761
10.90
1961
-19
7012
,412
27.64
22.65
11.55
10.89
9.31
1.63
762
18.75
1971
-19
8028
,172
34.68
35.54
17.14
10.57
10.38
1.30
645
16.52
1981
-19
9037
,181
34.88
27.40
11.16
0.55
13.76
1.81
521
20.44
1991
-20
0047
,363
30.77
23.69
3.99
-1.34
20.50
2.14
598
24.74
2001
-20
1038
,171
27.96
21.75
-3.10
-1.92
26.95
1.97
1,01
511.18
Total
181,44
429
.45
25.22
5.67
3.05
16.65
1.76
678
17.54
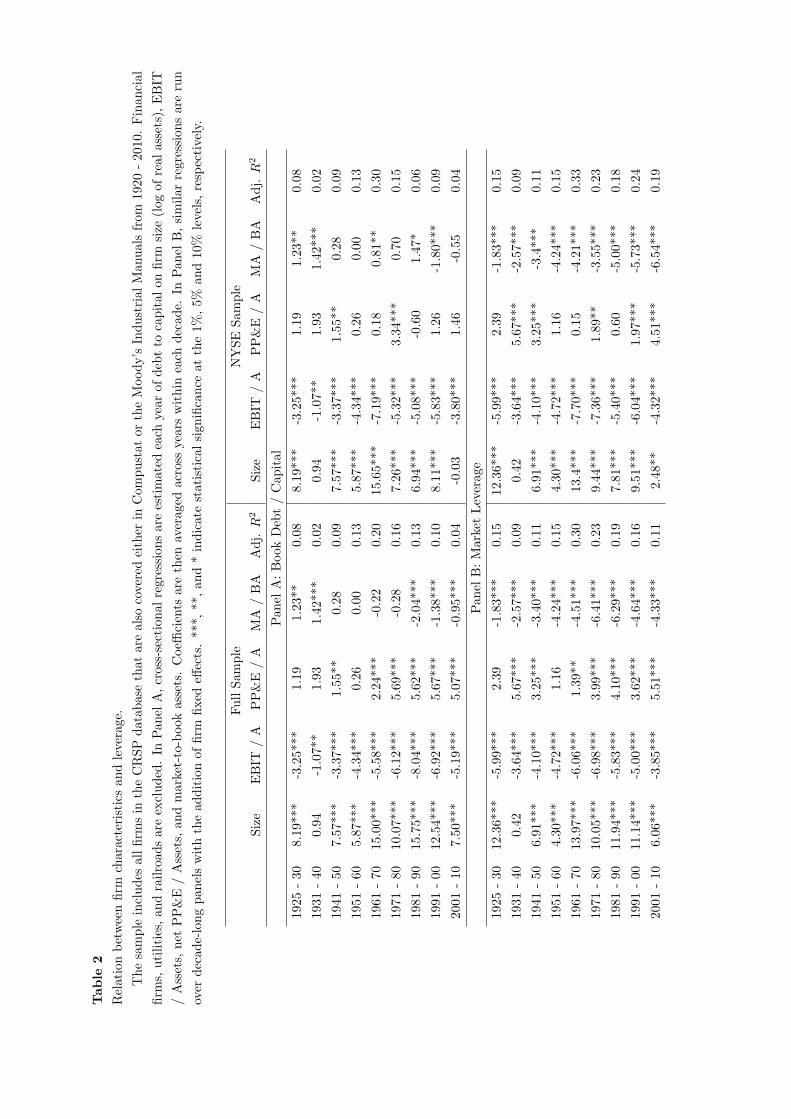
Table
2
Relationbetweenfirm
characteristicsandleverag
e.
Thesample
includes
allfirm
sin
theCRSPdatabasethat
arealso
coveredeither
inCom
pustat
ortheMoody’sIndustrial
Man
ualsfrom
1920
-2010.Financial
firm
s,utilities,an
drailroad
sareexcluded
.In
Pan
elA,cross-sectional
regression
sareestimated
each
yearof
deb
tto
capital
onfirm
size
(log
ofrealassets),EBIT
/Assets,
net
PP&E
/Assets,
andmarket-to-book
assets.Coeffi
cients
arethen
averag
edacross
years
within
each
decad
e.In
Pan
elB,similar
regressionsare
run
over
decad
e-longpan
elswiththead
ditionoffirm
fixed
effects.**
*,**
,an
d*indicatestatisticalsign
ificance
atthe1%
,5%
and10
%levels,
respectively.
FullSam
ple
NYSE
Sam
ple
Size
EBIT
/A
PP&E
/A
MA
/BA
Adj.
R2
Size
EBIT
/A
PP&E
/A
MA
/BA
Adj.
R2
Pan
elA:Book
Deb
t/Cap
ital
1925
-30
8.19
***
-3.25*
**1.19
1.23
**0.08
8.19
***
-3.25*
**1.19
1.23
**0.08
1931
-40
0.94
-1.07*
*1.93
1.42
***
0.02
0.94
-1.07*
*1.93
1.42
***
0.02
1941
-50
7.57
***
-3.37**
*1.55
**0.28
0.09
7.57
***
-3.37*
**1.55
**0.28
0.09
1951
-60
5.87
***
-4.34*
**0.26
0.00
0.13
5.87
***
-4.34*
**0.26
0.00
0.13
1961
-70
15.00*
**-5.58*
**2.24
***
-0.22
0.20
15.65*
**-7.19*
**0.18
0.81
**0.30
1971
-80
10.07*
**-6.12*
**5.69
***
-0.28
0.16
7.26
***
-5.32*
**3.34
***
0.70
0.15
1981
-90
15.75*
**-8.04*
**5.62
***
-2.04*
**0.13
6.94
***
-5.08*
**-0.60
1.47
*0.06
1991
-00
12.54*
**-6.92*
**5.67
***
-1.38*
**0.10
8.11
***
-5.83*
**1.26
-1.80*
**0.09
2001
-10
7.50
***
-5.19*
**5.07
***
-0.95*
**0.04
-0.03
-3.80*
**1.46
-0.55
0.04
Pan
elB:Market
Leverag
e
1925
-30
12.36*
**-5.99*
**2.39
-1.83*
**0.15
12.36*
**-5.99*
**2.39
-1.83*
**0.15
1931
-40
0.42
-3.64*
**5.67
***
-2.57*
**0.09
0.42
-3.64*
**5.67
***
-2.57*
**0.09
1941
-50
6.91
***
-4.10*
**3.25
***
-3.40*
**0.11
6.91
***
-4.10*
**3.25
***
-3.4**
*0.11
1951
-60
4.30
***
-4.72*
**1.16
-4.24*
**0.15
4.30
***
-4.72*
**1.16
-4.24*
**0.15
1961
-70
13.97*
**-6.06*
**1.39*
*-4.51*
**0.30
13.4**
*-7.70*
**0.15
-4.21*
**0.33
1971
-80
10.05*
**-6.98*
**3.99
***
-6.41*
**0.23
9.44
***
-7.36*
**1.89
**-3.55*
**0.23
1981
-90
11.94*
**-5.83*
**4.10
***
-6.29*
**0.19
7.81
***
-5.40*
**0.60
-5.00*
**0.18
1991
-00
11.14*
**-5.00*
**3.62
***
-4.64*
**0.16
9.51
***
-6.04*
**1.97
***
-5.73*
**0.24
2001
-10
6.06
***
-3.85*
**5.51
***
-4.33*
**0.11
2.48
**-4.32*
**4.51
***
-6.54*
**0.19
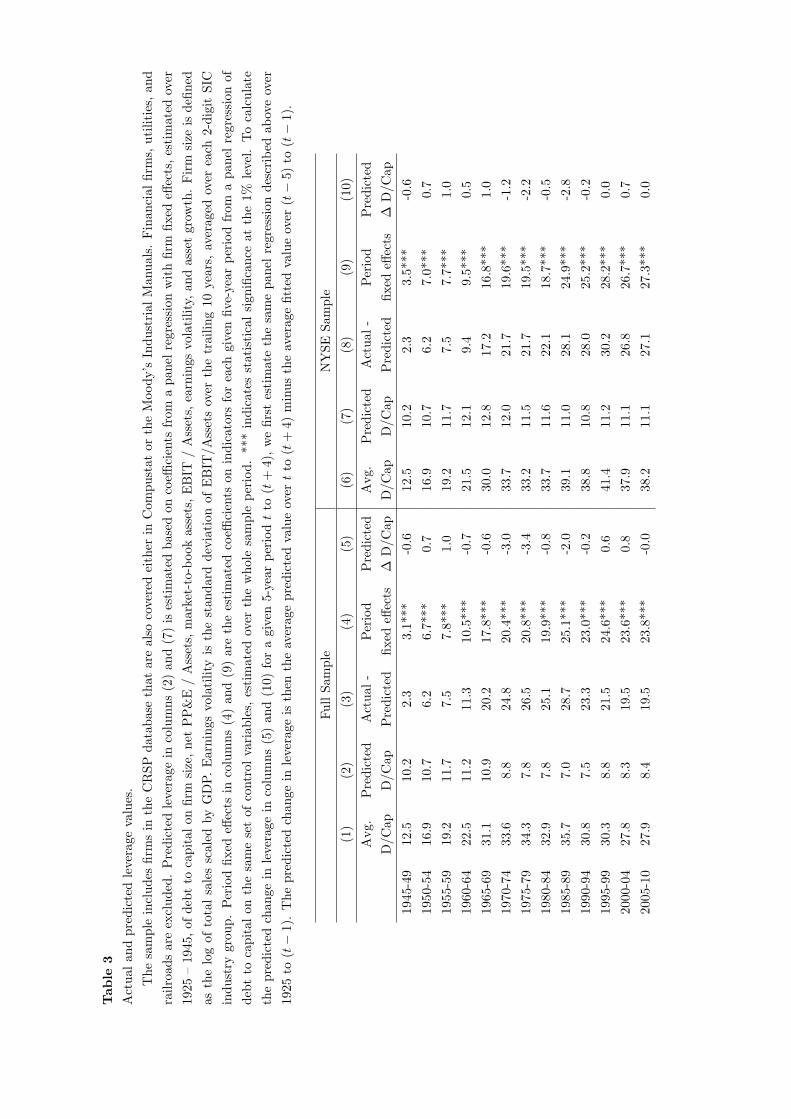
Table
3
Actual
andpredictedleverag
evalues.
Thesample
includes
firm
sin
theCRSP
databasethat
arealso
coveredeither
inCom
pustat
ortheMoody’s
Industrial
Man
uals.
Finan
cial
firm
s,utilities,and
railroad
sareexcluded.Predictedleveragein
columns(2)an
d(7)isestimated
based
oncoeffi
cients
from
apan
elregression
withfirm
fixed
effects,estimatedover
1925
–1945
,of
debtto
capital
onfirm
size,net
PP&E
/Assets,market-to-book
assets,EBIT
/Assets,earnings
volatility,
andassetgrow
th.Firm
size
isdefi
ned
asthelogof
totalsalesscaled
byGDP.Earnings
volatilityis
thestan
darddeviation
ofEBIT
/Assetsover
thetrailing10
years,averag
edover
each
2-digit
SIC
industry
group.Periodfixed
effects
incolumns(4)an
d(9)aretheestimated
coeffi
cients
onindicatorsforeach
given
five-year
periodfrom
apanel
regressionof
debtto
capital
onthesamesetof
control
variab
les,
estimated
over
thewholesample
period.**
*indicates
statisticalsign
ificance
atthe1%
level.Tocalculate
thepredictedchan
gein
leverag
ein
columns(5)an
d(10)
foragiven
5-yearperiodtto
(t+
4),wefirstestimatethesamepan
elregression
described
aboveover
1925
to(t−1).
Thepredictedchan
gein
leverage
isthen
theaverag
epredictedvalueover
tto
(t+
4)minustheaverag
efitted
valueover
(t−
5)to
(t−1).
FullSam
ple
NYSE
Sam
ple
(1)
(2)
(3)
(4)
(5)
(6)
(7)
(8)
(9)
(10)
Avg.
Predicted
Actual-
Period
Predicted
Avg.
Predicted
Actual
-Period
Predicted
D/C
apD/C
apPredicted
fixed
effects
∆D/C
apD/C
apD/C
apPredicted
fixed
effects
∆D/C
ap
194
5-49
12.5
10.2
2.3
3.1*
**-0.6
12.5
10.2
2.3
3.5*
**-0.6
1950
-54
16.9
10.7
6.2
6.7*
**0.7
16.9
10.7
6.2
7.0*
**0.7
1955
-59
19.2
11.7
7.5
7.8*
**1.0
19.2
11.7
7.5
7.7*
**1.0
1960
-64
22.5
11.2
11.3
10.5**
*-0.7
21.5
12.1
9.4
9.5*
**0.5
1965
-69
31.1
10.9
20.2
17.8**
*-0.6
30.0
12.8
17.2
16.8**
*1.0
1970
-74
33.6
8.8
24.8
20.4**
*-3.0
33.7
12.0
21.7
19.6**
*-1.2
1975
-79
34.3
7.8
26.5
20.8**
*-3.4
33.2
11.5
21.7
19.5**
*-2.2
1980
-84
32.9
7.8
25.1
19.9**
*-0.8
33.7
11.6
22.1
18.7**
*-0.5
1985
-89
35.7
7.0
28.7
25.1**
*-2.0
39.1
11.0
28.1
24.9**
*-2.8
1990
-94
30.8
7.5
23.3
23.0**
*-0.2
38.8
10.8
28.0
25.2**
*-0.2
1995
-99
30.3
8.8
21.5
24.6**
*0.6
41.4
11.2
30.2
28.2**
*0.0
2000
-04
27.8
8.3
19.5
23.6**
*0.8
37.9
11.1
26.8
26.7**
*0.7
2005
-10
27.9
8.4
19.5
23.8**
*-0.0
38.2
11.1
27.1
27.3**
*0.0
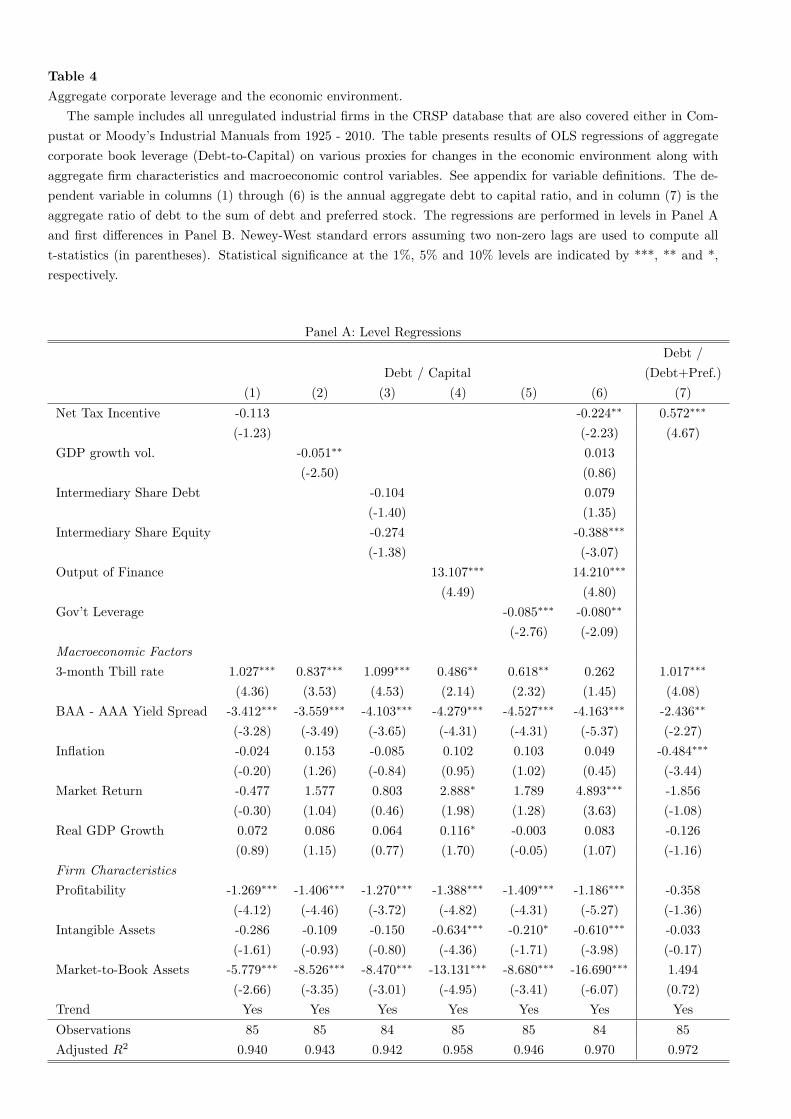
Table 4
Aggregate corporate leverage and the economic environment.
The sample includes all unregulated industrial firms in the CRSP database that are also covered either in Com-
pustat or Moody’s Industrial Manuals from 1925 - 2010. The table presents results of OLS regressions of aggregate
corporate book leverage (Debt-to-Capital) on various proxies for changes in the economic environment along with
aggregate firm characteristics and macroeconomic control variables. See appendix for variable definitions. The de-
pendent variable in columns (1) through (6) is the annual aggregate debt to capital ratio, and in column (7) is the
aggregate ratio of debt to the sum of debt and preferred stock. The regressions are performed in levels in Panel A
and first differences in Panel B. Newey-West standard errors assuming two non-zero lags are used to compute all
t-statistics (in parentheses). Statistical significance at the 1%, 5% and 10% levels are indicated by ***, ** and *,
respectively.
Panel A: Level Regressions
Debt /
Debt / Capital (Debt+Pref.)
(1) (2) (3) (4) (5) (6) (7)
Net Tax Incentive -0.113 -0.224∗∗ 0.572∗∗∗
(-1.23) (-2.23) (4.67)
GDP growth vol. -0.051∗∗ 0.013
(-2.50) (0.86)
Intermediary Share Debt -0.104 0.079
(-1.40) (1.35)
Intermediary Share Equity -0.274 -0.388∗∗∗
(-1.38) (-3.07)
Output of Finance 13.107∗∗∗ 14.210∗∗∗
(4.49) (4.80)
Gov’t Leverage -0.085∗∗∗ -0.080∗∗
(-2.76) (-2.09)
Macroeconomic Factors
3-month Tbill rate 1.027∗∗∗ 0.837∗∗∗ 1.099∗∗∗ 0.486∗∗ 0.618∗∗ 0.262 1.017∗∗∗
(4.36) (3.53) (4.53) (2.14) (2.32) (1.45) (4.08)
BAA - AAA Yield Spread -3.412∗∗∗ -3.559∗∗∗ -4.103∗∗∗ -4.279∗∗∗ -4.527∗∗∗ -4.163∗∗∗ -2.436∗∗
(-3.28) (-3.49) (-3.65) (-4.31) (-4.31) (-5.37) (-2.27)
Inflation -0.024 0.153 -0.085 0.102 0.103 0.049 -0.484∗∗∗
(-0.20) (1.26) (-0.84) (0.95) (1.02) (0.45) (-3.44)
Market Return -0.477 1.577 0.803 2.888∗ 1.789 4.893∗∗∗ -1.856
(-0.30) (1.04) (0.46) (1.98) (1.28) (3.63) (-1.08)
Real GDP Growth 0.072 0.086 0.064 0.116∗ -0.003 0.083 -0.126
(0.89) (1.15) (0.77) (1.70) (-0.05) (1.07) (-1.16)
Firm Characteristics
Profitability -1.269∗∗∗ -1.406∗∗∗ -1.270∗∗∗ -1.388∗∗∗ -1.409∗∗∗ -1.186∗∗∗ -0.358
(-4.12) (-4.46) (-3.72) (-4.82) (-4.31) (-5.27) (-1.36)
Intangible Assets -0.286 -0.109 -0.150 -0.634∗∗∗ -0.210∗ -0.610∗∗∗ -0.033
(-1.61) (-0.93) (-0.80) (-4.36) (-1.71) (-3.98) (-0.17)
Market-to-Book Assets -5.779∗∗∗ -8.526∗∗∗ -8.470∗∗∗ -13.131∗∗∗ -8.680∗∗∗ -16.690∗∗∗ 1.494
(-2.66) (-3.35) (-3.01) (-4.95) (-3.41) (-6.07) (0.72)
Trend Yes Yes Yes Yes Yes Yes Yes
Observations 85 85 84 85 85 84 85
Adjusted R2 0.940 0.943 0.942 0.958 0.946 0.970 0.972
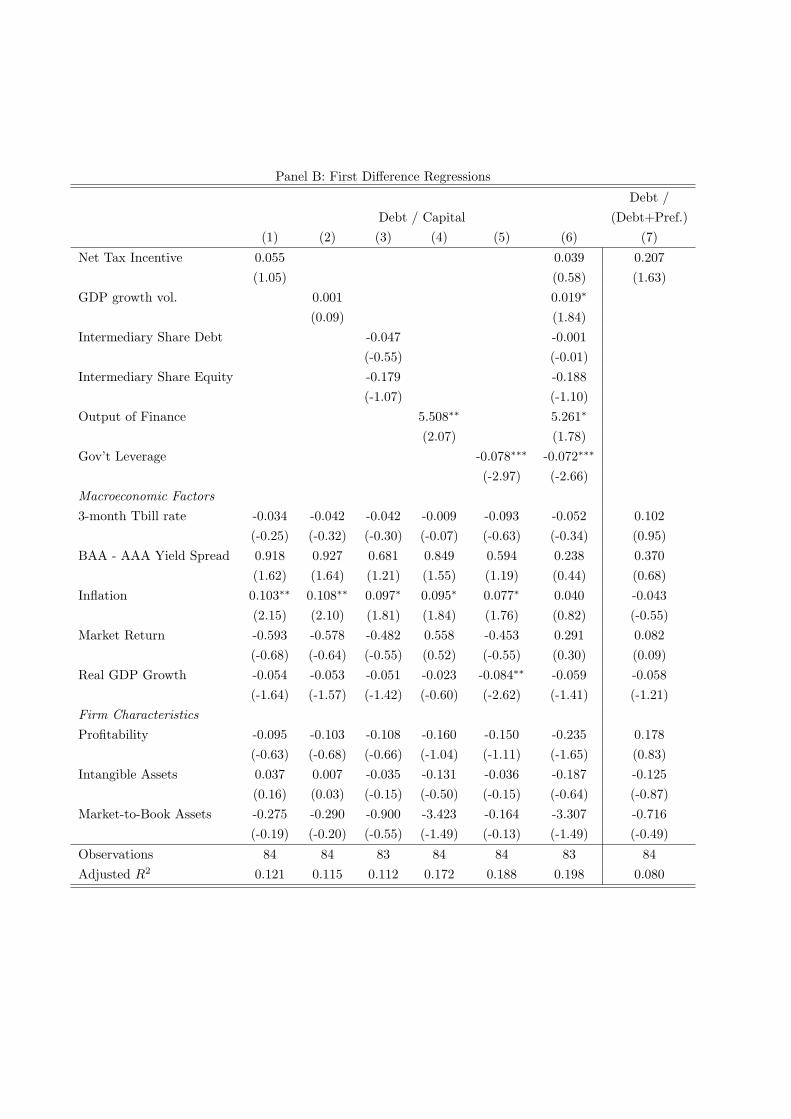
Panel B: First Difference Regressions
Debt /
Debt / Capital (Debt+Pref.)
(1) (2) (3) (4) (5) (6) (7)
Net Tax Incentive 0.055 0.039 0.207
(1.05) (0.58) (1.63)
GDP growth vol. 0.001 0.019∗
(0.09) (1.84)
Intermediary Share Debt -0.047 -0.001
(-0.55) (-0.01)
Intermediary Share Equity -0.179 -0.188
(-1.07) (-1.10)
Output of Finance 5.508∗∗ 5.261∗
(2.07) (1.78)
Gov’t Leverage -0.078∗∗∗ -0.072∗∗∗
(-2.97) (-2.66)
Macroeconomic Factors
3-month Tbill rate -0.034 -0.042 -0.042 -0.009 -0.093 -0.052 0.102
(-0.25) (-0.32) (-0.30) (-0.07) (-0.63) (-0.34) (0.95)
BAA - AAA Yield Spread 0.918 0.927 0.681 0.849 0.594 0.238 0.370
(1.62) (1.64) (1.21) (1.55) (1.19) (0.44) (0.68)
Inflation 0.103∗∗ 0.108∗∗ 0.097∗ 0.095∗ 0.077∗ 0.040 -0.043
(2.15) (2.10) (1.81) (1.84) (1.76) (0.82) (-0.55)
Market Return -0.593 -0.578 -0.482 0.558 -0.453 0.291 0.082
(-0.68) (-0.64) (-0.55) (0.52) (-0.55) (0.30) (0.09)
Real GDP Growth -0.054 -0.053 -0.051 -0.023 -0.084∗∗ -0.059 -0.058
(-1.64) (-1.57) (-1.42) (-0.60) (-2.62) (-1.41) (-1.21)
Firm Characteristics
Profitability -0.095 -0.103 -0.108 -0.160 -0.150 -0.235 0.178
(-0.63) (-0.68) (-0.66) (-1.04) (-1.11) (-1.65) (0.83)
Intangible Assets 0.037 0.007 -0.035 -0.131 -0.036 -0.187 -0.125
(0.16) (0.03) (-0.15) (-0.50) (-0.15) (-0.64) (-0.87)
Market-to-Book Assets -0.275 -0.290 -0.900 -3.423 -0.164 -3.307 -0.716
(-0.19) (-0.20) (-0.55) (-1.49) (-0.13) (-1.49) (-0.49)
Observations 84 84 83 84 84 83 84
Adjusted R2 0.121 0.115 0.112 0.172 0.188 0.198 0.080
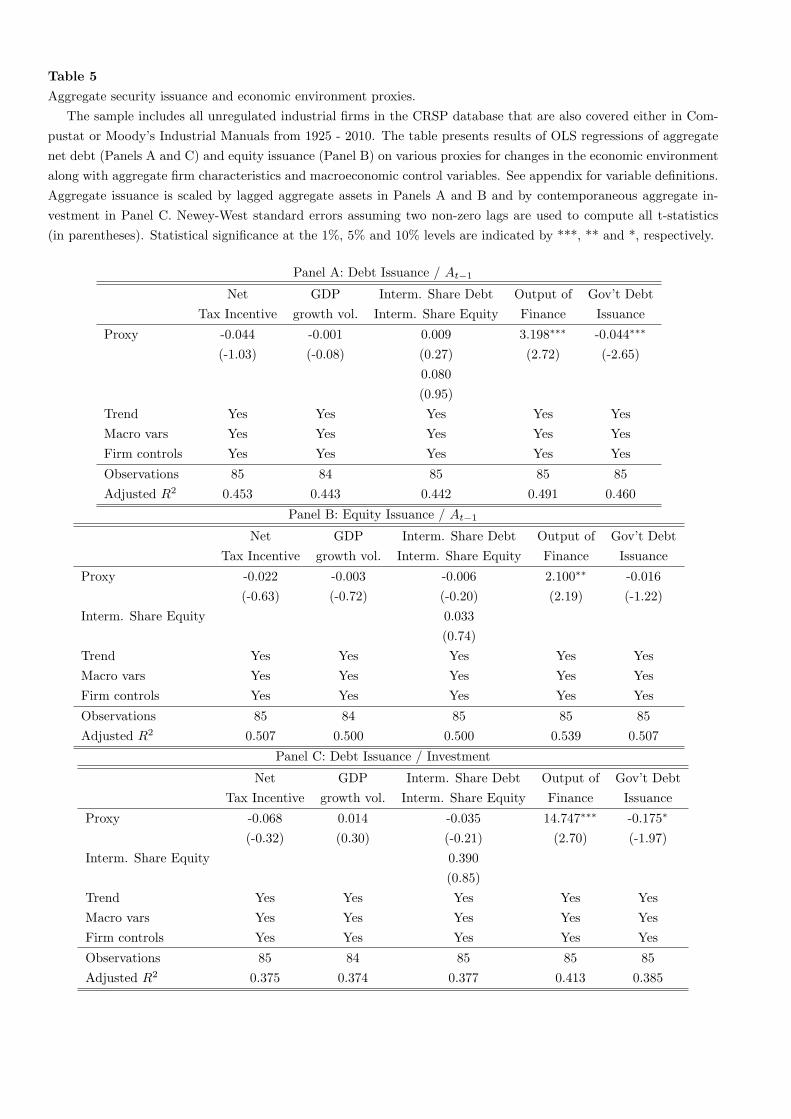
Table 5
Aggregate security issuance and economic environment proxies.
The sample includes all unregulated industrial firms in the CRSP database that are also covered either in Com-
pustat or Moody’s Industrial Manuals from 1925 - 2010. The table presents results of OLS regressions of aggregate
net debt (Panels A and C) and equity issuance (Panel B) on various proxies for changes in the economic environment
along with aggregate firm characteristics and macroeconomic control variables. See appendix for variable definitions.
Aggregate issuance is scaled by lagged aggregate assets in Panels A and B and by contemporaneous aggregate in-
vestment in Panel C. Newey-West standard errors assuming two non-zero lags are used to compute all t-statistics
(in parentheses). Statistical significance at the 1%, 5% and 10% levels are indicated by ***, ** and *, respectively.
Panel A: Debt Issuance / At−1
Net GDP Interm. Share Debt Output of Gov’t Debt
Tax Incentive growth vol. Interm. Share Equity Finance Issuance
Proxy -0.044 -0.001 0.009 3.198∗∗∗ -0.044∗∗∗
(-1.03) (-0.08) (0.27) (2.72) (-2.65)
0.080
(0.95)
Trend Yes Yes Yes Yes Yes
Macro vars Yes Yes Yes Yes Yes
Firm controls Yes Yes Yes Yes Yes
Observations 85 84 85 85 85
Adjusted R2 0.453 0.443 0.442 0.491 0.460
Panel B: Equity Issuance / At−1
Net GDP Interm. Share Debt Output of Gov’t Debt
Tax Incentive growth vol. Interm. Share Equity Finance Issuance
Proxy -0.022 -0.003 -0.006 2.100∗∗ -0.016
(-0.63) (-0.72) (-0.20) (2.19) (-1.22)
Interm. Share Equity 0.033
(0.74)
Trend Yes Yes Yes Yes Yes
Macro vars Yes Yes Yes Yes Yes
Firm controls Yes Yes Yes Yes Yes
Observations 85 84 85 85 85
Adjusted R2 0.507 0.500 0.500 0.539 0.507
Panel C: Debt Issuance / Investment
Net GDP Interm. Share Debt Output of Gov’t Debt
Tax Incentive growth vol. Interm. Share Equity Finance Issuance
Proxy -0.068 0.014 -0.035 14.747∗∗∗ -0.175∗
(-0.32) (0.30) (-0.21) (2.70) (-1.97)
Interm. Share Equity 0.390
(0.85)
Trend Yes Yes Yes Yes Yes
Macro vars Yes Yes Yes Yes Yes
Firm controls Yes Yes Yes Yes Yes
Observations 85 84 85 85 85
Adjusted R2 0.375 0.374 0.377 0.413 0.385
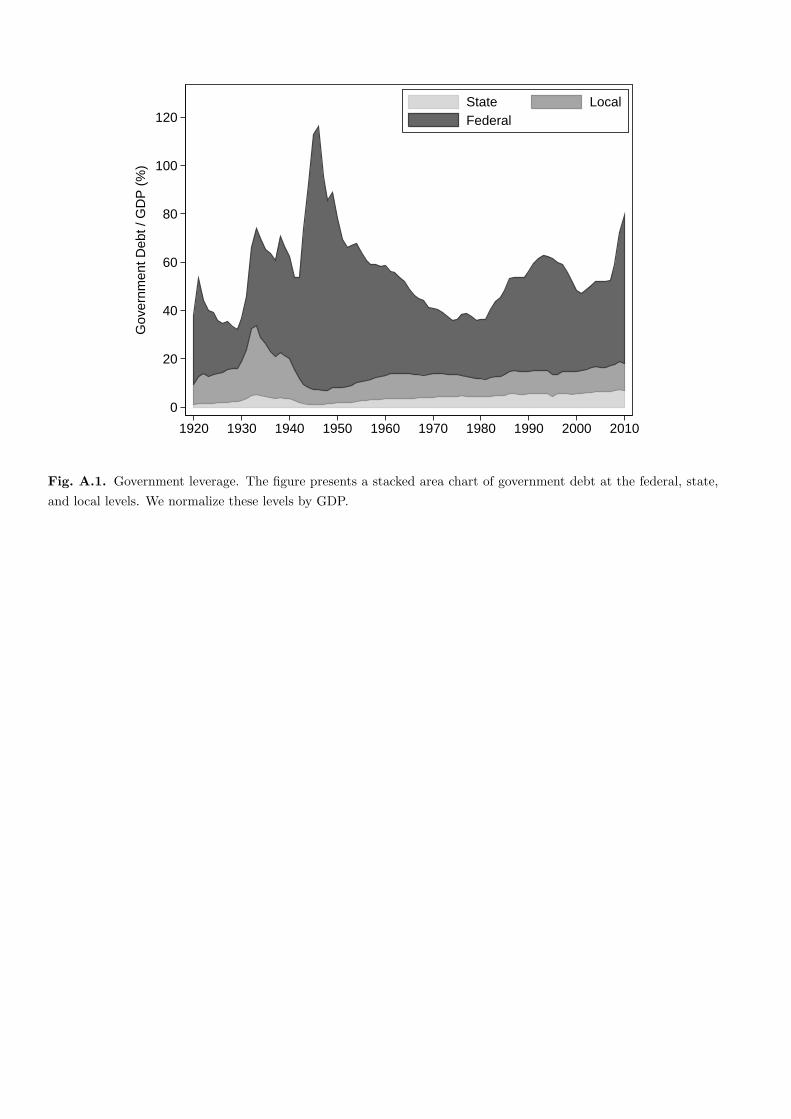
0
20
40
60
80
100
120
Gov
ernm
ent D
ebt /
GD
P (
%)
1920 1930 1940 1950 1960 1970 1980 1990 2000 2010
State LocalFederal
Fig. A.1. Government leverage. The figure presents a stacked area chart of government debt at the federal, state,
and local levels. We normalize these levels by GDP.
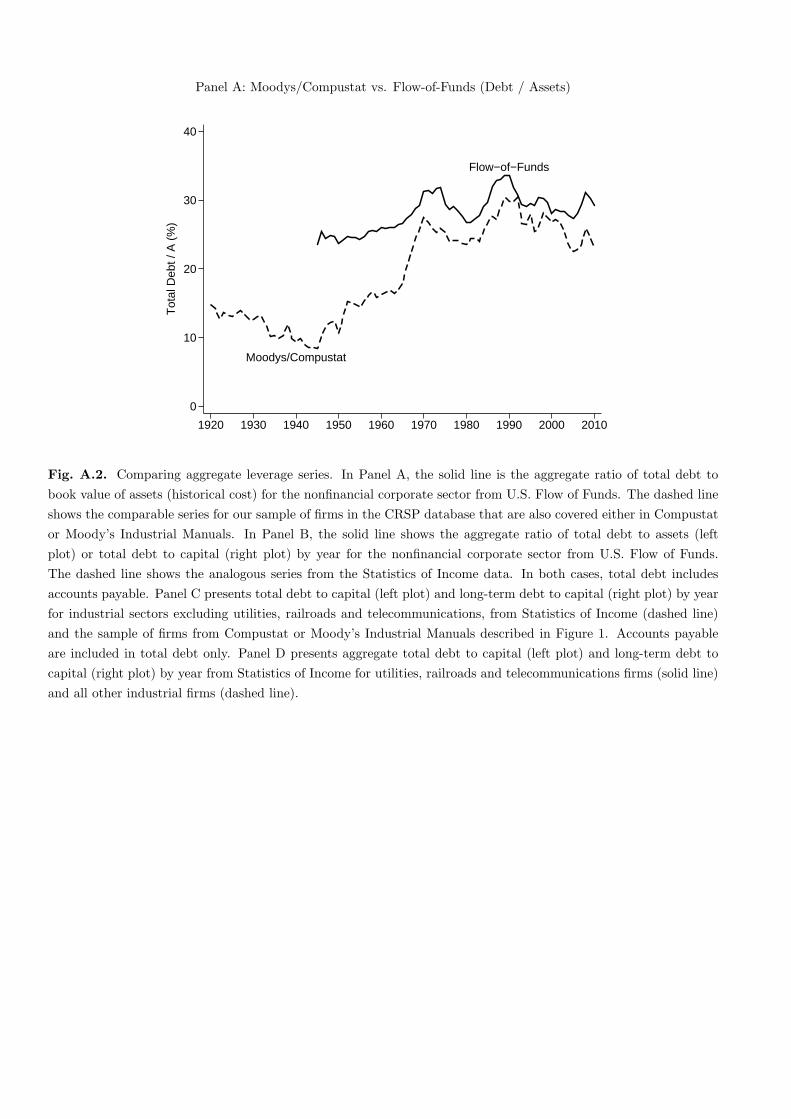
Panel A: Moodys/Compustat vs. Flow-of-Funds (Debt / Assets)
Flow−of−Funds
Moodys/Compustat
0
10
20
30
40
Tot
al D
ebt /
A (
%)
1920 1930 1940 1950 1960 1970 1980 1990 2000 2010
Fig. A.2. Comparing aggregate leverage series. In Panel A, the solid line is the aggregate ratio of total debt to
book value of assets (historical cost) for the nonfinancial corporate sector from U.S. Flow of Funds. The dashed line
shows the comparable series for our sample of firms in the CRSP database that are also covered either in Compustat
or Moody’s Industrial Manuals. In Panel B, the solid line shows the aggregate ratio of total debt to assets (left
plot) or total debt to capital (right plot) by year for the nonfinancial corporate sector from U.S. Flow of Funds.
The dashed line shows the analogous series from the Statistics of Income data. In both cases, total debt includes
accounts payable. Panel C presents total debt to capital (left plot) and long-term debt to capital (right plot) by year
for industrial sectors excluding utilities, railroads and telecommunications, from Statistics of Income (dashed line)
and the sample of firms from Compustat or Moody’s Industrial Manuals described in Figure 1. Accounts payable
are included in total debt only. Panel D presents aggregate total debt to capital (left plot) and long-term debt to
capital (right plot) by year from Statistics of Income for utilities, railroads and telecommunications firms (solid line)
and all other industrial firms (dashed line).
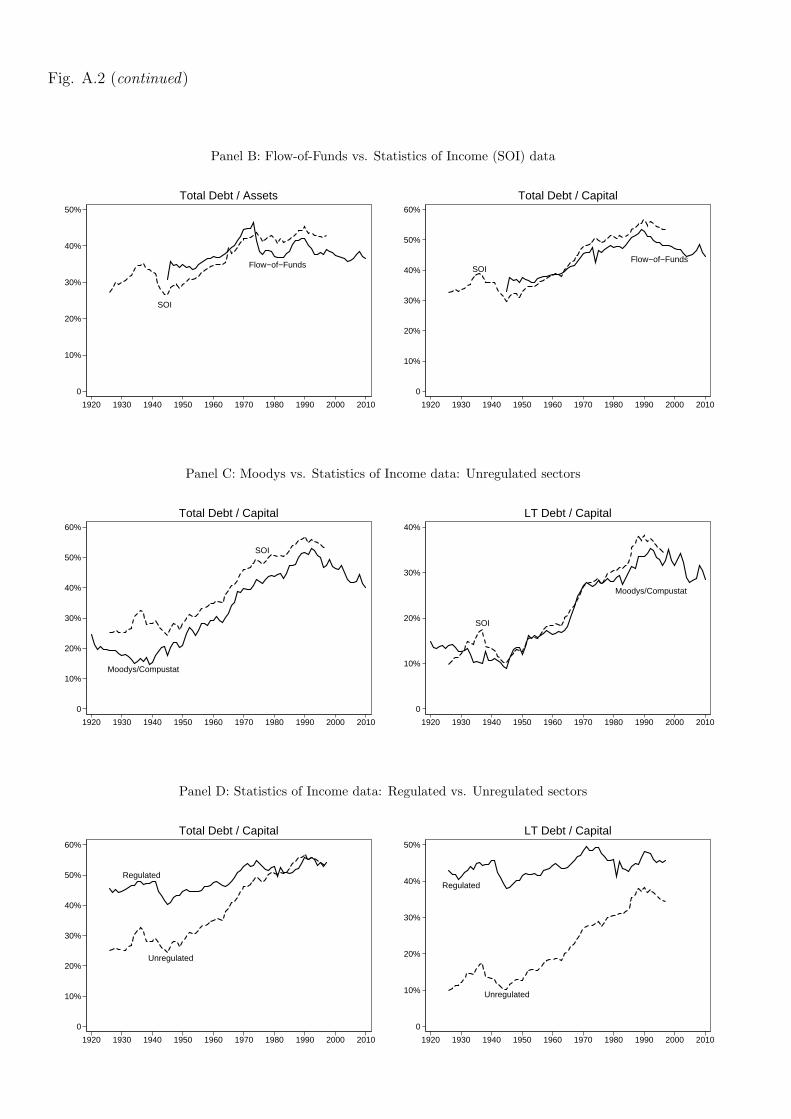
Fig. A.2 (continued)
Panel B: Flow-of-Funds vs. Statistics of Income (SOI) data
Flow−of−Funds
SOI
0
10%
20%
30%
40%
50%
1920 1930 1940 1950 1960 1970 1980 1990 2000 2010
Total Debt / Assets
Flow−of−FundsSOI
0
10%
20%
30%
40%
50%
60%
1920 1930 1940 1950 1960 1970 1980 1990 2000 2010
Total Debt / Capital
Panel C: Moodys vs. Statistics of Income data: Unregulated sectors
Moodys/Compustat
SOI
0
10%
20%
30%
40%
50%
60%
1920 1930 1940 1950 1960 1970 1980 1990 2000 2010
Total Debt / Capital
Moodys/Compustat
SOI
0
10%
20%
30%
40%
1920 1930 1940 1950 1960 1970 1980 1990 2000 2010
LT Debt / Capital
Panel D: Statistics of Income data: Regulated vs. Unregulated sectors
Regulated
Unregulated
0
10%
20%
30%
40%
50%
60%
1920 1930 1940 1950 1960 1970 1980 1990 2000 2010
Total Debt / Capital
Regulated
Unregulated
0
10%
20%
30%
40%
50%
1920 1930 1940 1950 1960 1970 1980 1990 2000 2010
LT Debt / Capital