Embed Size (px)
Citation preview
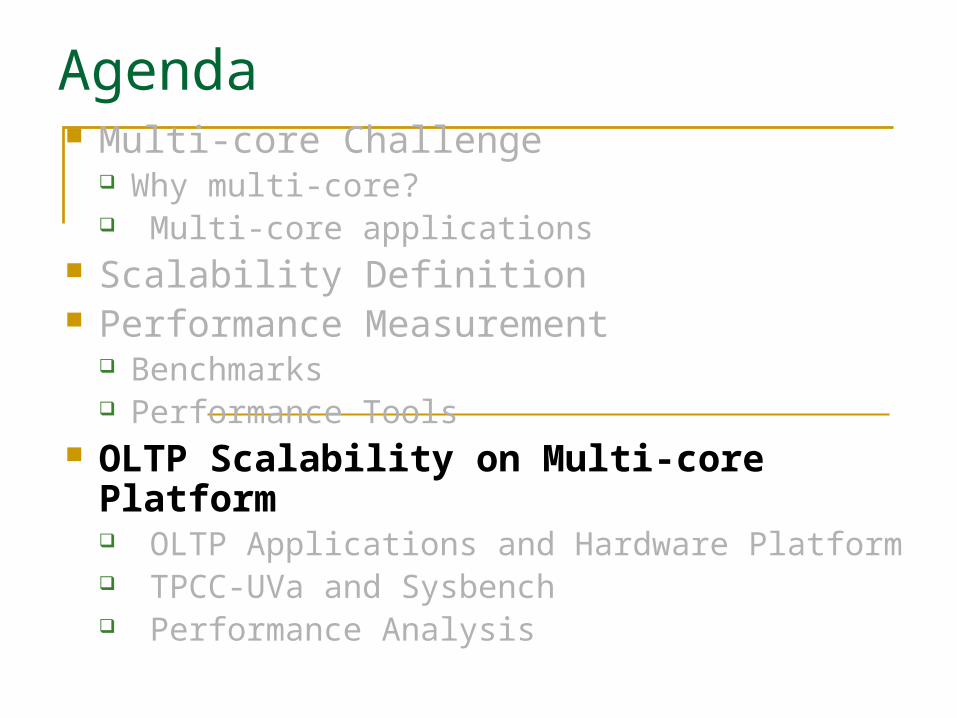
Multi-core Challenge Why multi-core? Multi-core applications
Scalability Definition Performance Measurement
Benchmarks Performance Tools
OLTP Scalability on Multi-core Platform OLTP Applications and Hardware Platform TPCC-UVa and Sysbench Performance Analysis
Agenda
Multi-core Challenge
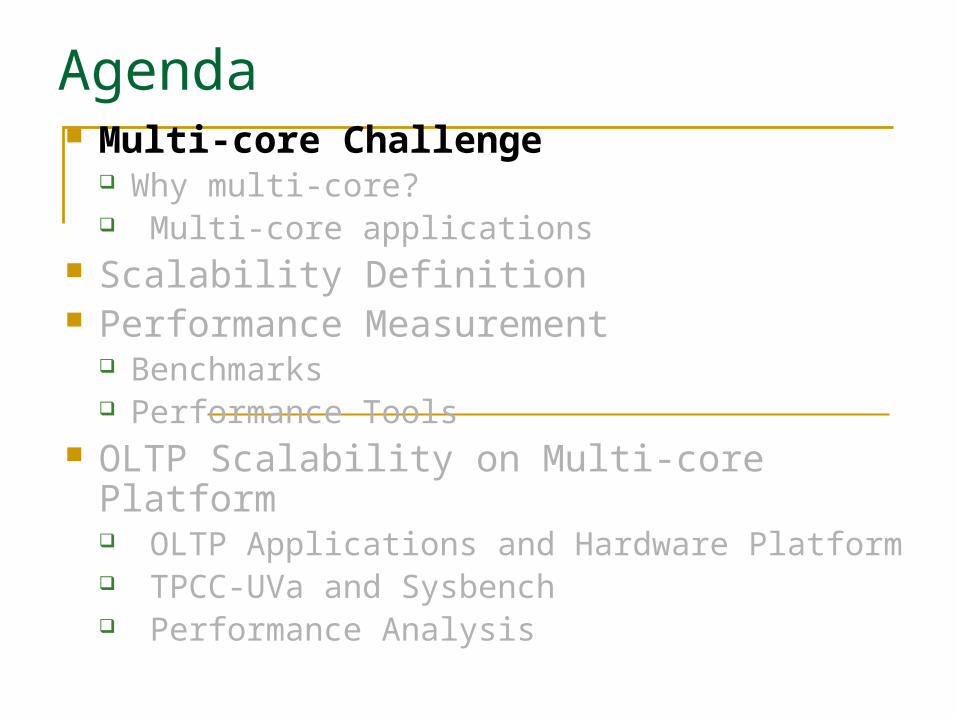
Why Multi-core? Power consumption Hard to design more
complicated processor (ILP)
Figure 1. frequency of CPU
Multi-core Challenge
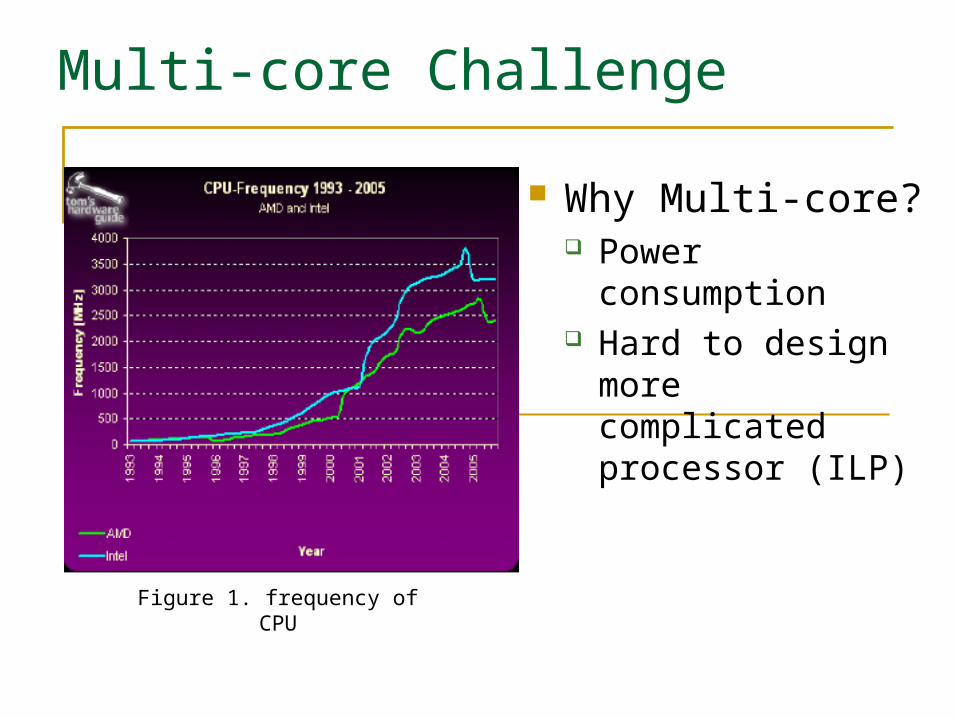
Moore’s Law in multi-core area
Figure 2. Moore’s Law
An Intel prediction: technology might support
2010: 16—64 cores 2013: 64—256 cores
2016: 256--1024 cores
Multi-core Challenge
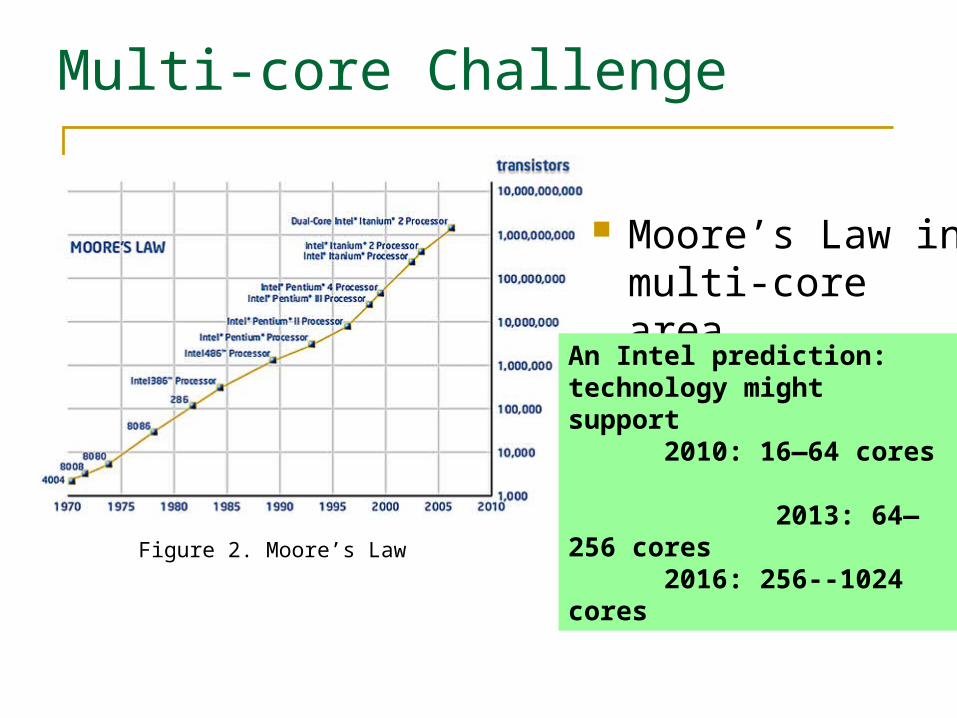
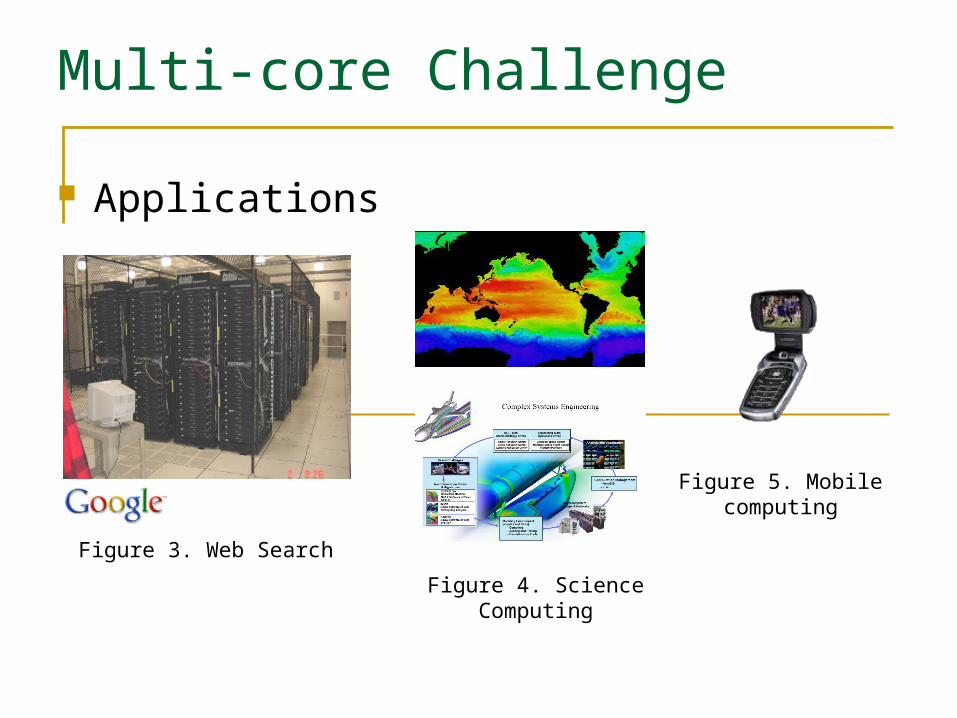
Applications
Figure 3. Web Search
Figure 4. Science Computing
Figure 5. Mobile computing
Multi-core Challenge Why multi-core? Multi-core applications
Scalability Definition Performance Measurement
Benchmarks Performance Tools
OLTP Scalability on Multi-core Platform OLTP Applications and Hardware Platform TPCC-UVa and Sysbench Performance Analysis
Agenda
Scalability Definition
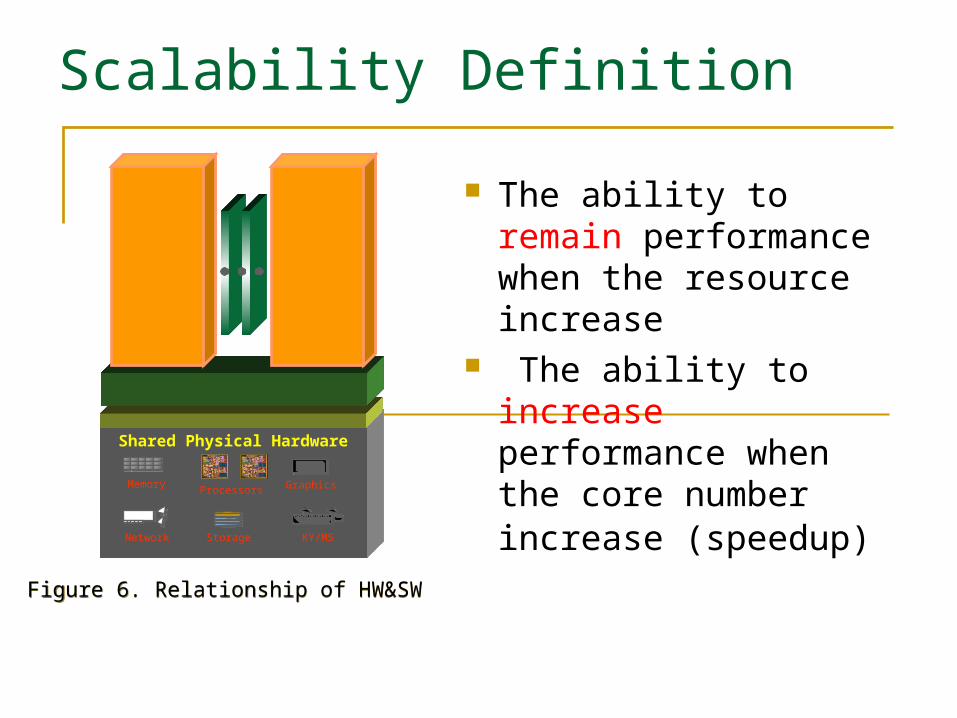
The ability to remain performance when the resource increase
The ability to increase performance when the core number increase (speedup)
Shared Physical Hardware
Memory
KY/MS
Graphics
StorageNetwork
Processors
OSOS
AppApp
OSOS
AppApp
Figure 6. Relationship of HW&SW Figure 6. Relationship of HW&SW
Scalability Definition
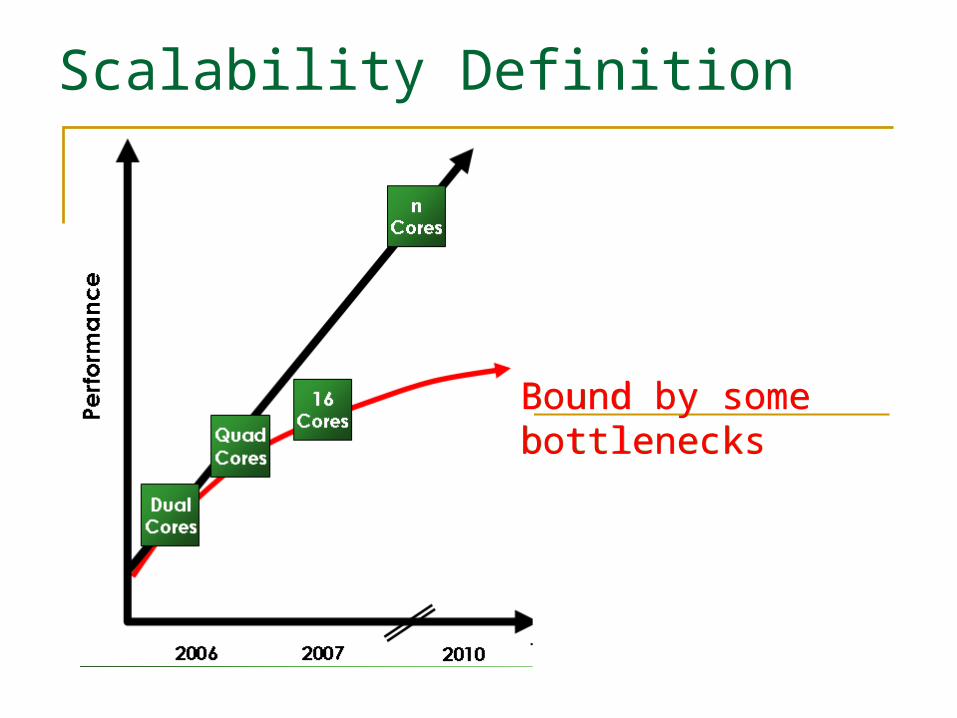
Bound by some bottlenecksBound by some bottlenecks
Multi-core Challenge Why multi-core? Multi-core applications
Scalability Definition Performance Measurement
Benchmarks Performance Tools
OLTP Scalability on Multi-core Platform OLTP Applications and Hardware Platform TPCC-UVa and Sysbench Performance Analysis
Agenda
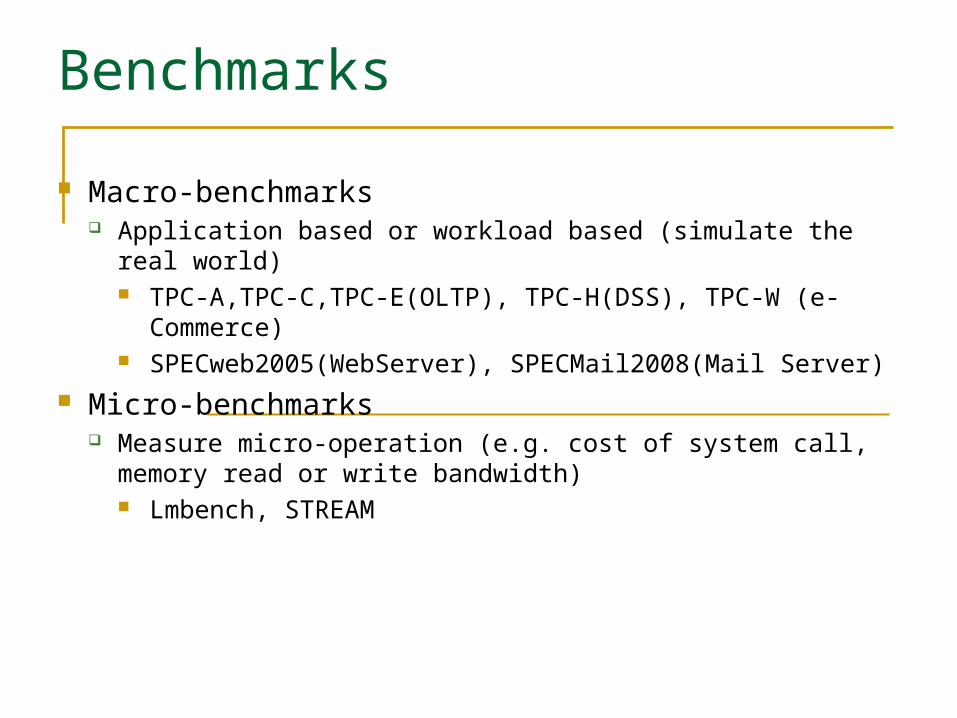
Benchmarks
Macro-benchmarks Application based or workload based (simulate the real world)
TPC-A,TPC-C,TPC-E(OLTP), TPC-H(DSS), TPC-W (e-Commerce)
SPECweb2005(WebServer), SPECMail2008(Mail Server)
Micro-benchmarks Measure micro-operation (e.g. cost of system call, memory read
or write bandwidth) Lmbench, STREAM
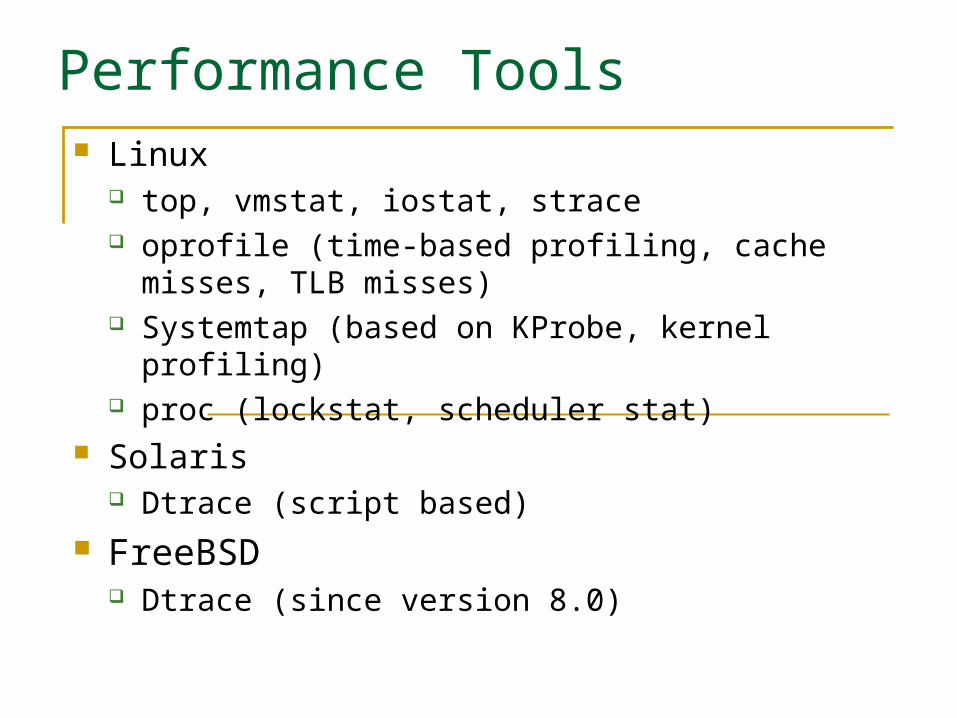
Performance Tools Linux
top, vmstat, iostat, strace oprofile (time-based profiling, cache misses, TLB misses) Systemtap (based on KProbe, kernel profiling) proc (lockstat, scheduler stat)
Solaris Dtrace (script based)
FreeBSD Dtrace (since version 8.0)
Multi-core Challenge Why multi-core? Multi-core applications
Scalability Definition Performance Measurement
Benchmarks Performance Tools
OLTP Scalability on Multi-core Platform OLTP Applications and Hardware Platform TPCC-UVa and Sysbench Performance Analysis
Agenda
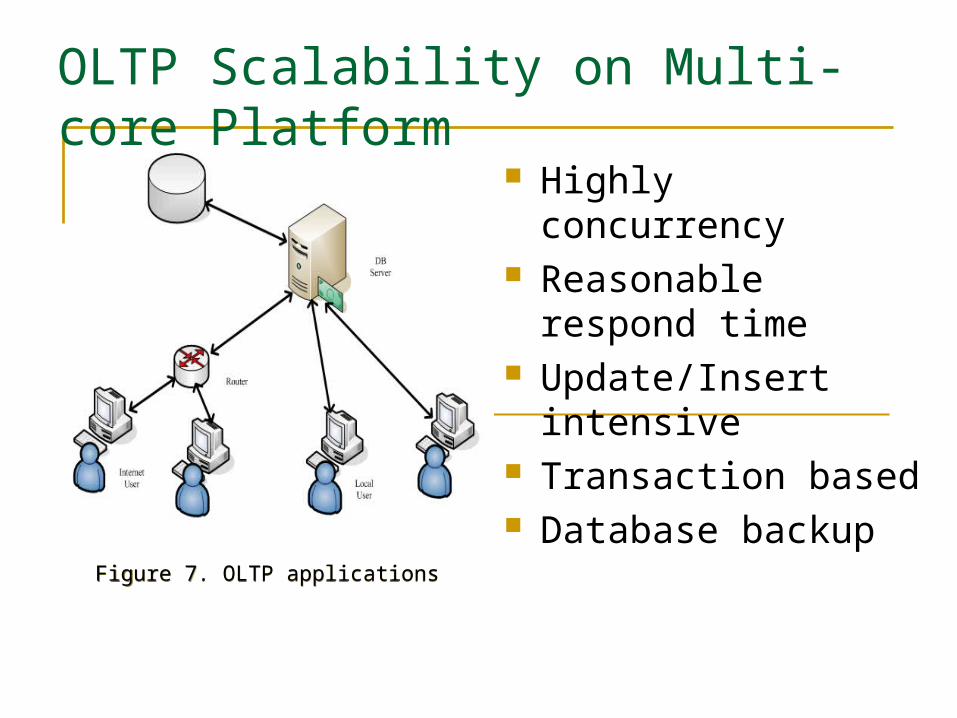
OLTP Scalability on Multi-core Platform
Figure 7. OLTP applications Figure 7. OLTP applications
Highly concurrency Reasonable respond time Update/Insert intensive Transaction based Database backup
OLTP Scalability on Multi-core Platform
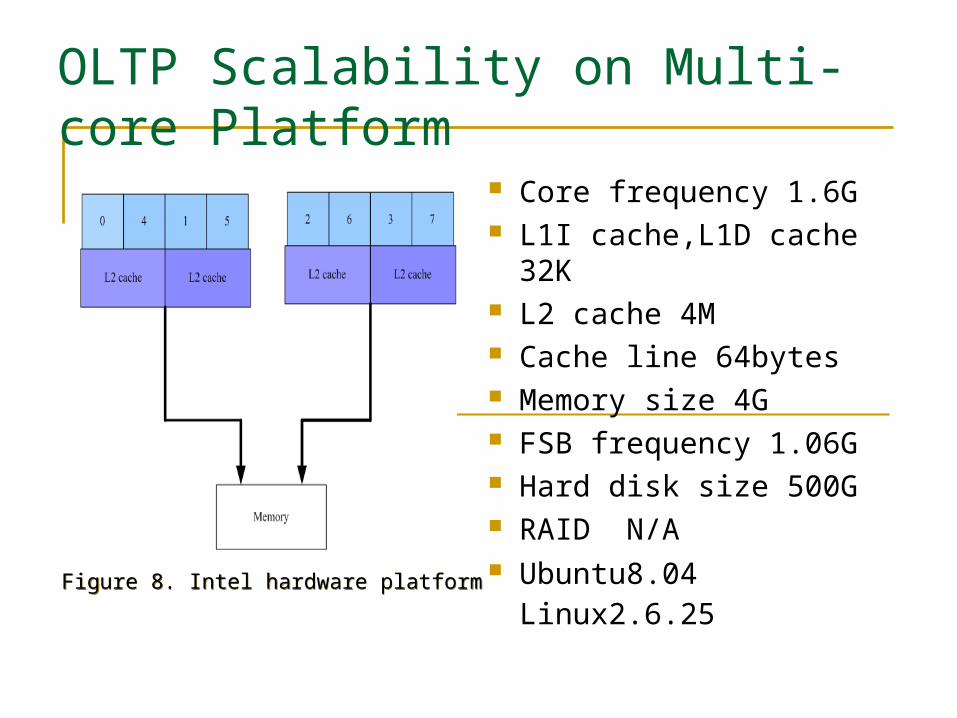
Core frequency 1.6G L1I cache,L1D cache 32K L2 cache 4M Cache line 64bytes Memory size 4G FSB frequency 1.06G Hard disk size 500G RAID N/A Ubuntu8.04 Linux2.6.25
Figure 8. Intel hardware platform Figure 8. Intel hardware platform
OLTP Scalability on Multi-core Platform
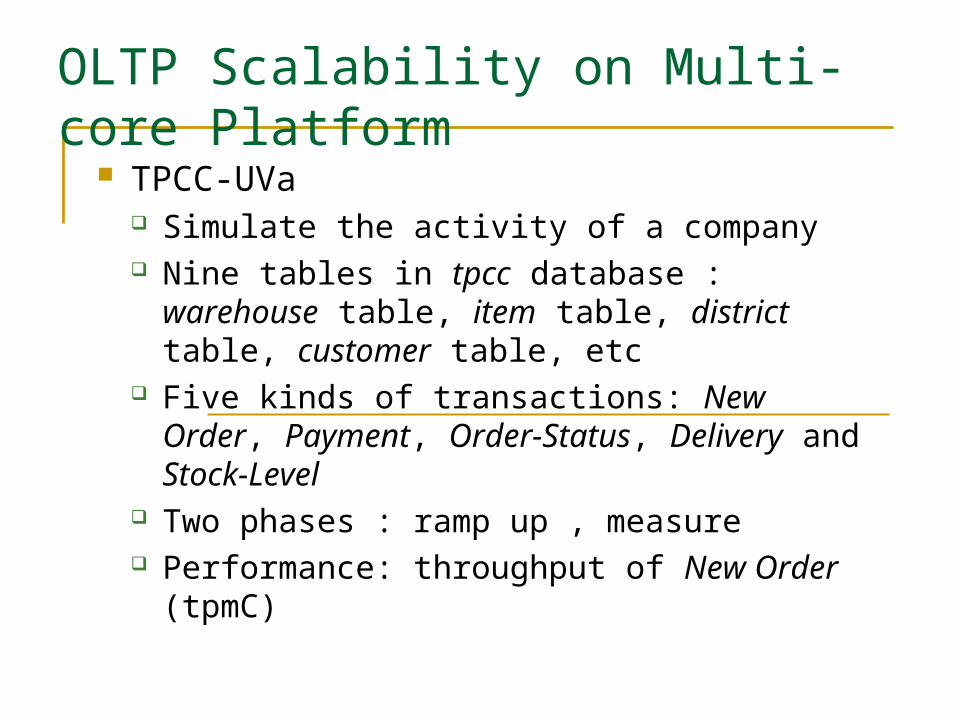
TPCC-UVa Simulate the activity of a company Nine tables in tpcc database : warehouse table,
item table, district table, customer table, etc Five kinds of transactions: New Order, Payment,
Order-Status, Delivery and Stock-Level Two phases : ramp up , measure Performance: throughput of New Order (tpmC)
OLTP Scalability on Multi-core Platform
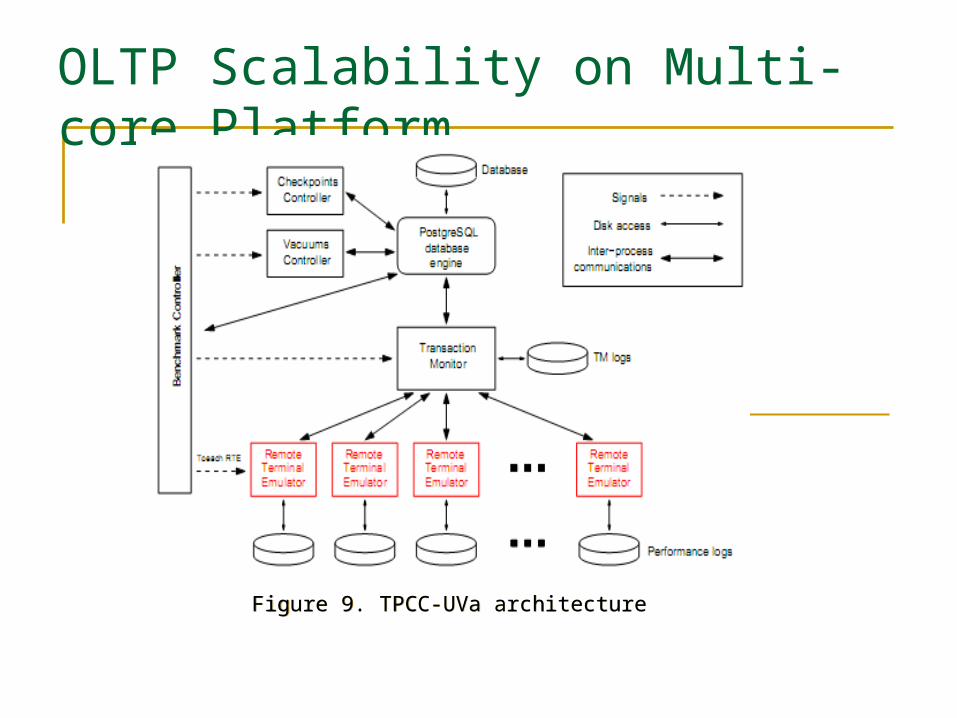
Figure 9. TPCC-UVa architecture Figure 9. TPCC-UVa architecture
OLTP Scalability on Multi-core Platform
Improvements to TPCC-UVa Single message queue through Unix IPC (message
queue) multi-queue transaction monitor A lightweight load balance module between RTE
& TM Benchmark Controller, Checkpoint Controller,
Vacuum Controller busy waiting signal based
OLTP Scalability on Multi-core Platform
Sysbench-OLTP A modular, cross platform and multi-thread
benchmark tool for evaluating OS parameters Two phases: Prepare phase and run phase Complex transaction, simple transaction and non-
transaction Performance of SUT: throughput (tps)
OLTP Scalability on Multi-core Platform
In TPCC-UVa 90 warehouse and 8 message queue Every warehouse has 10 terminals Ramp up time and measure time 20 min & 100
min Enable checkpoint controller and disable the
vacuum controller The performance close to baseline Profiling by iostat : most of time io-waiting and
idle, user time and system time< 1% io-bound
OLTP Scalability on Multi-core Platform
RAID (Redundant Array of Independent Disks ) expensive hardware support
tmpfs memory backup file system
OLTP Scalability on Multi-core Platform
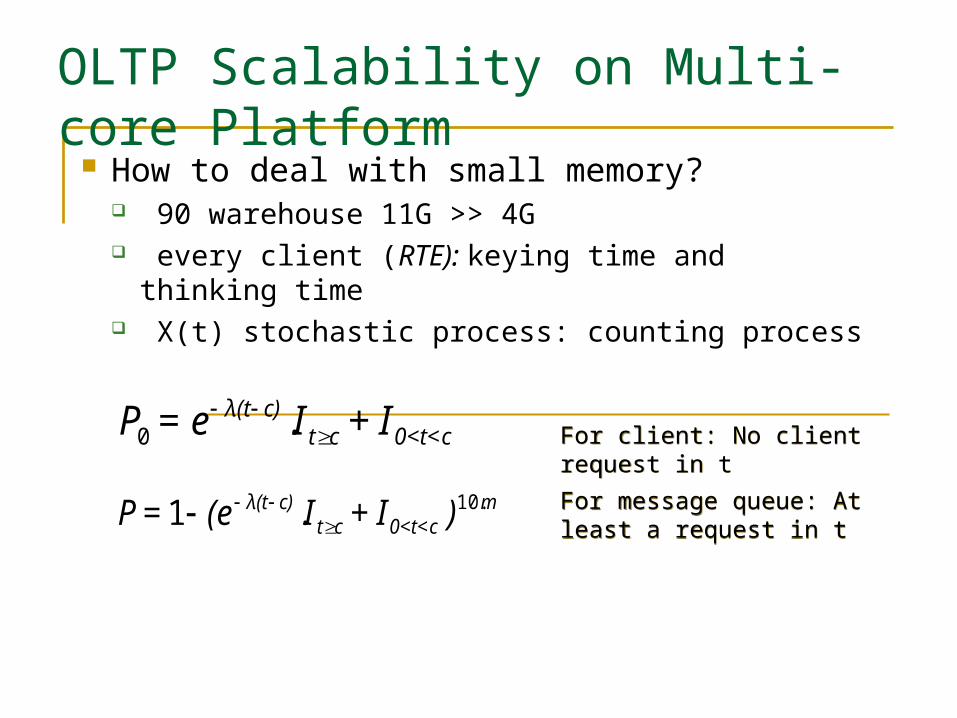
How to deal with small memory? 90 warehouse 11G >> 4G every client (RTE): keying time and thinking time X(t) stochastic process: counting process
c<t0<ctc)λ(t I+Ie=P
.0
mc<t0<ct
c)λ(t )I+I(e=P 10..1
For client: No client request in t For client: No client request in t
For message queue: At least a request in t For message queue: At least a request in t
OLTP Scalability on Multi-core Platform
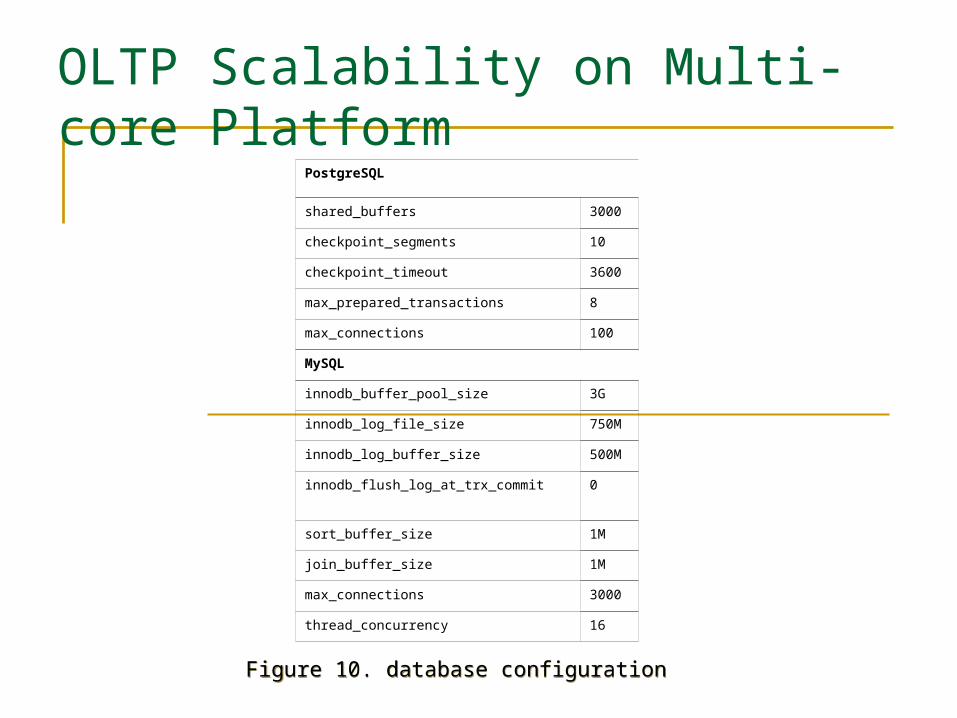
PostgreSQL
shared_buffers 3000
checkpoint_segments 10
checkpoint_timeout 3600
max_prepared_transactions 8
max_connections 100
MySQL
innodb_buffer_pool_size 3G
innodb_log_file_size 750M
innodb_log_buffer_size 500M
innodb_flush_log_at_trx_commit 0
sort_buffer_size 1M
join_buffer_size 1M
max_connections 3000
thread_concurrency 16
Figure 10. database configuration Figure 10. database configuration
OLTP Scalability on Multi-core Platform
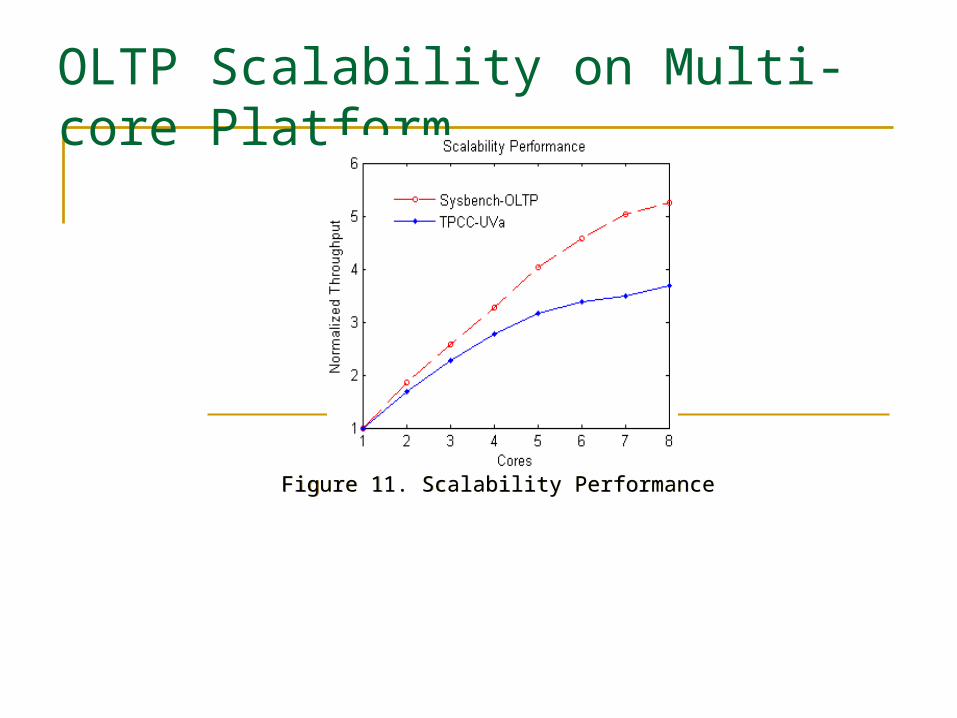
Figure 11. Scalability Performance Figure 11. Scalability Performance
OLTP Scalability on Multi-core Platform
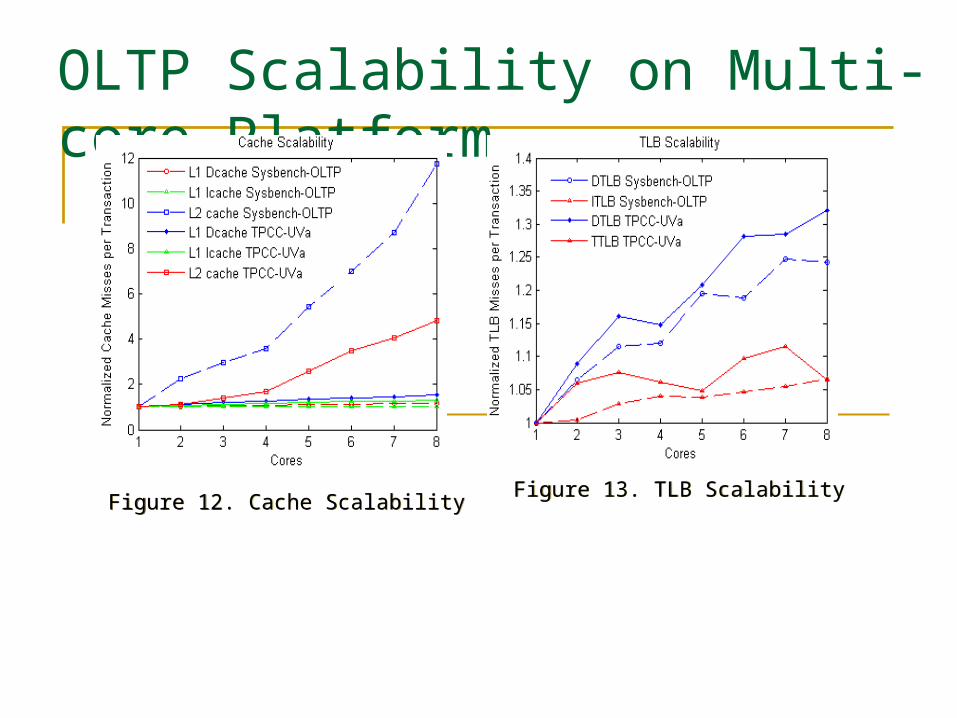
Figure 12. Cache Scalability Figure 12. Cache Scalability Figure 13. TLB Scalability Figure 13. TLB Scalability
OLTP Scalability on Multi-core Platform
Speedup with TPCC-UVa and Sysbench-OLTP 3.8 and 5.2
Performance breakdown: L2 misses stall contributes most
TLB effect small
OLTP Scalability on Multi-core Platform
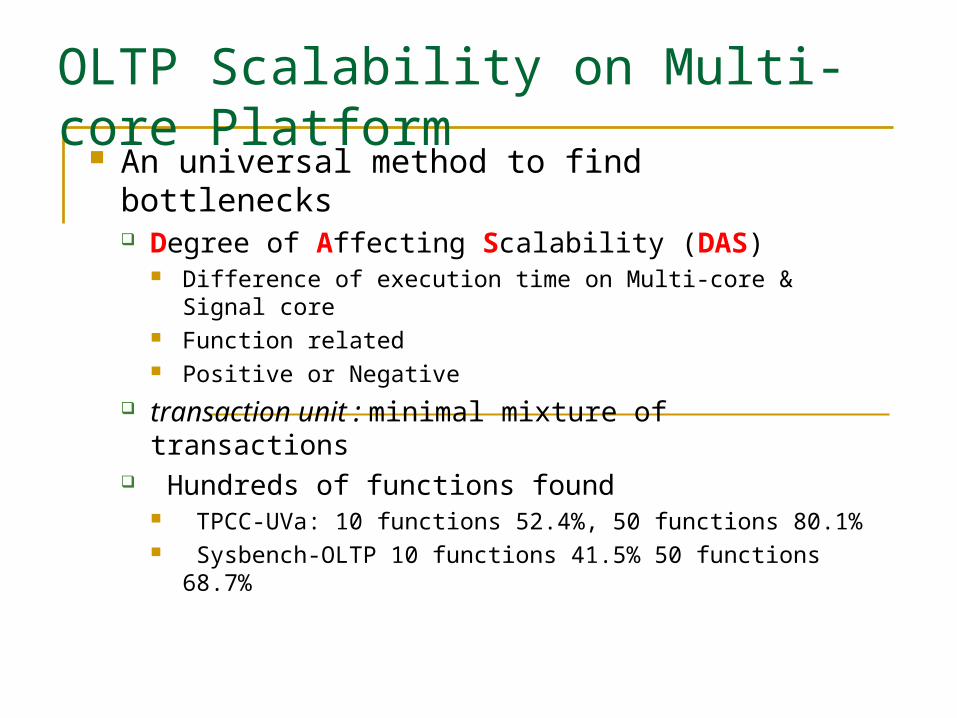
An universal method to find bottlenecks Degree of Affecting Scalability (DAS)
Difference of execution time on Multi-core & Signal core Function related Positive or Negative
transaction unit : minimal mixture of transactions Hundreds of functions found
TPCC-UVa: 10 functions 52.4%, 50 functions 80.1% Sysbench-OLTP 10 functions 41.5% 50 functions 68.7%

OLTP Scalability on Multi-core Platform
Bottlenecks: FSB (copy_user_generic_string)
The most L2 cache misses tmpfs file read (call graph) The cache misses per transaction unit increase with the core
number Large work set : experiments (20%) False sharing
Cache coherence data bus, address bus and address bus during the function (26%, 43.7%, 63.7%)
OLTP Scalability on Multi-core Platform
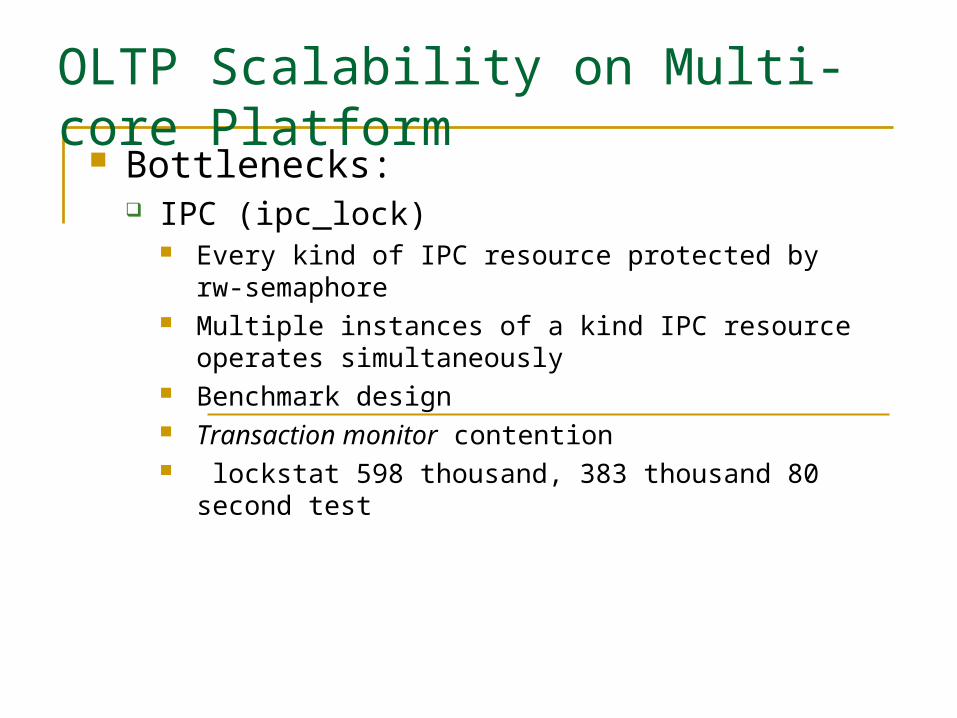
Bottlenecks: IPC (ipc_lock)
Every kind of IPC resource protected by rw-semaphore Multiple instances of a kind IPC resource operates
simultaneously Benchmark design Transaction monitor contention lockstat 598 thousand, 383 thousand 80 second test
OLTP Scalability on Multi-core Platform
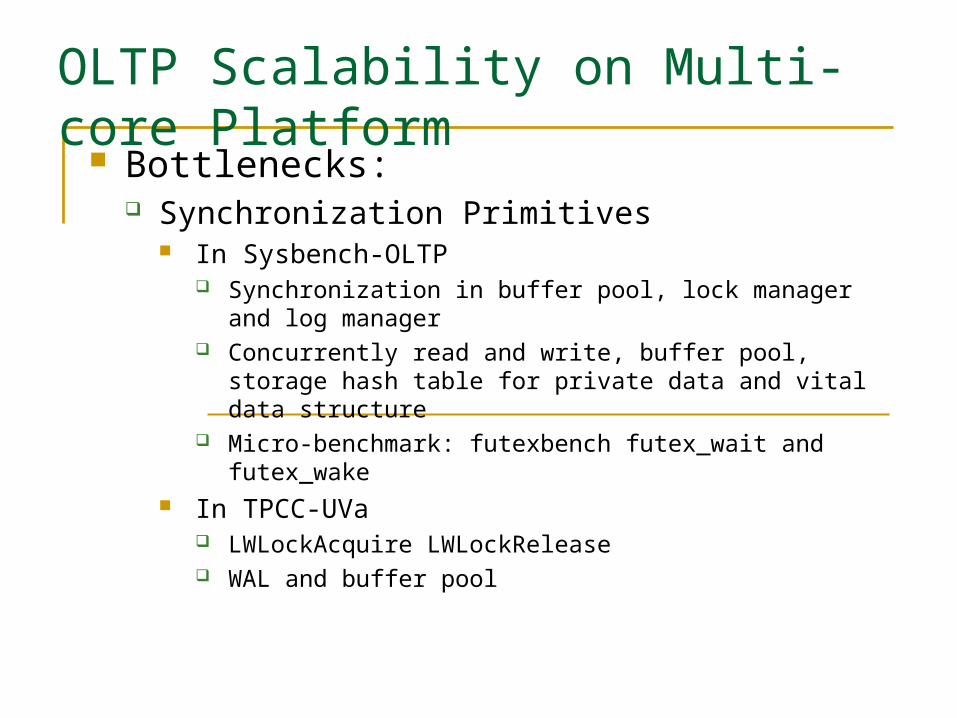
Bottlenecks: Synchronization Primitives
In Sysbench-OLTP Synchronization in buffer pool, lock manager and log manager Concurrently read and write, buffer pool, storage hash table for
private data and vital data structure Micro-benchmark: futexbench futex_wait and futex_wake
In TPCC-UVa LWLockAcquire LWLockRelease WAL and buffer pool
OLTP Scalability on Multi-core Platform
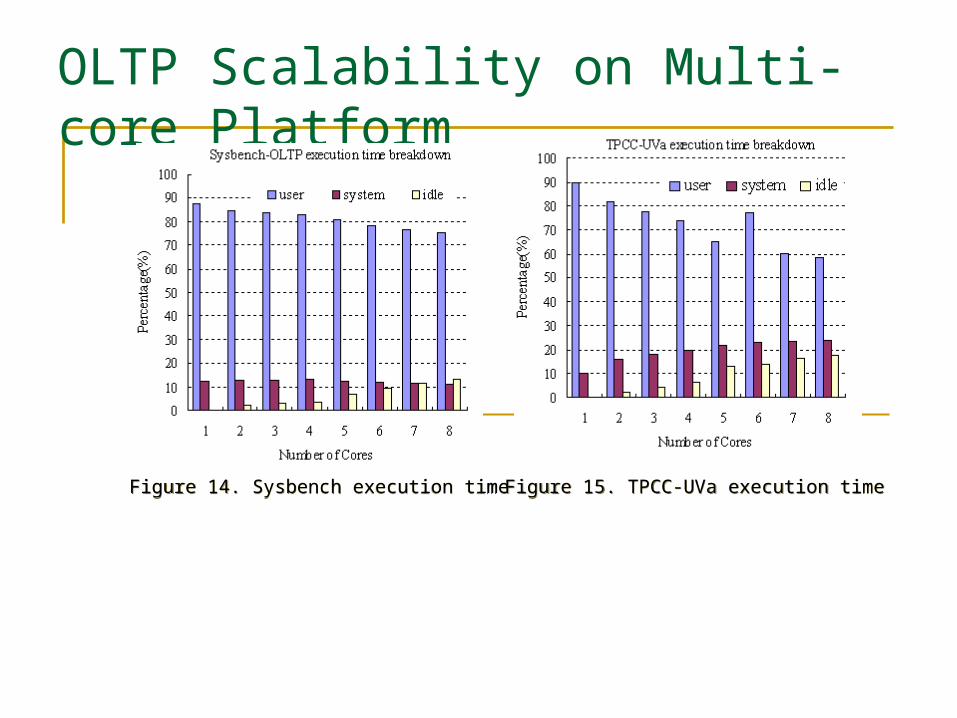
Figure 14. Sysbench execution time Figure 14. Sysbench execution time Figure 15. TPCC-UVa execution time Figure 15. TPCC-UVa execution time
OLTP Scalability on Multi-core Platform
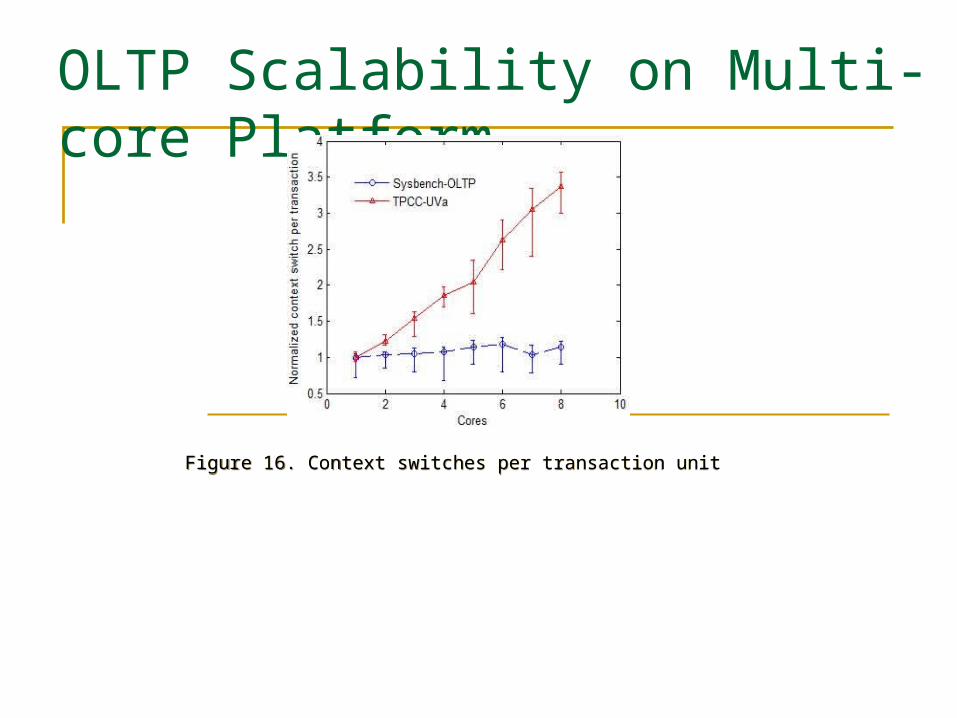
Figure 16. Context switches per transaction unit Figure 16. Context switches per transaction unit
OLTP Scalability on Multi-core Platform
Bottlenecks: Scheduler
Client request SQL statements Server socket (MySQL and PostgreSQL) Lexical analysis, grammar analysis, optimization query
result Remote wakeup degrade the scalability (try_to_wake_up) For Sysbench, remote futex wake up