Embed Size (px)
Citation preview
Consulting Solutions
XenDesktop 2.1 Scalability Analysis December 2008
XenDesktop 2.1 Scalability Analysis White Paper
2
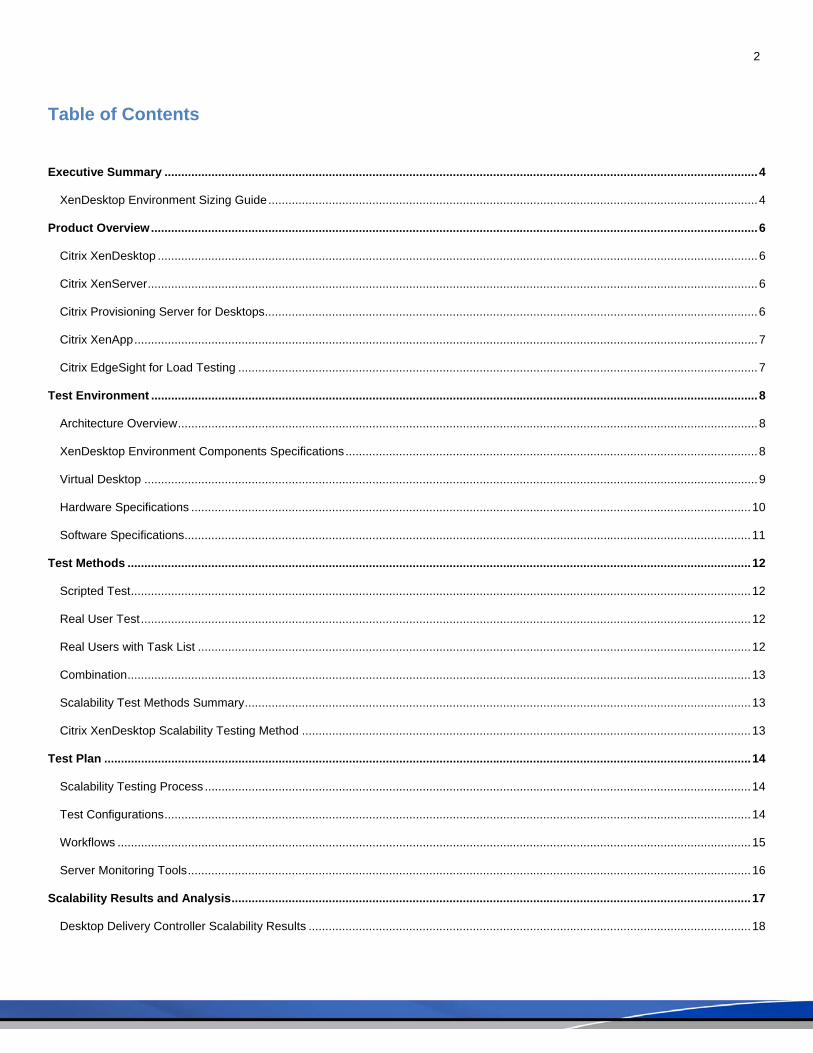
Table of Contents Executive Summary ................................................................................................................................................................................. 4
XenDesktop Environment Sizing Guide .................................................................................................................................................. 4
Product Overview ..................................................................................................................................................................................... 6
Citrix XenDesktop ................................................................................................................................................................................... 6
Citrix XenServer ...................................................................................................................................................................................... 6
Citrix Provisioning Server for Desktops ................................................................................................................................................... 6
Citrix XenApp .......................................................................................................................................................................................... 7
Citrix EdgeSight for Load Testing ........................................................................................................................................................... 7
Test Environment ..................................................................................................................................................................................... 8
Architecture Overview ............................................................................................................................................................................. 8
XenDesktop Environment Components Specifications ........................................................................................................................... 8
Virtual Desktop ....................................................................................................................................................................................... 9
Hardware Specifications ....................................................................................................................................................................... 10
Software Specifications ......................................................................................................................................................................... 11
Test Methods .......................................................................................................................................................................................... 12
Scripted Test ......................................................................................................................................................................................... 12
Real User Test ...................................................................................................................................................................................... 12
Real Users with Task List ..................................................................................................................................................................... 12
Combination .......................................................................................................................................................................................... 13
Scalability Test Methods Summary ....................................................................................................................................................... 13
Citrix XenDesktop Scalability Testing Method ...................................................................................................................................... 13
Test Plan ................................................................................................................................................................................................. 14
Scalability Testing Process ................................................................................................................................................................... 14
Test Configurations ............................................................................................................................................................................... 14
Workflows ............................................................................................................................................................................................. 15
Server Monitoring Tools ........................................................................................................................................................................ 16
Scalability Results and Analysis ........................................................................................................................................................... 17
Desktop Delivery Controller Scalability Results .................................................................................................................................... 18
3
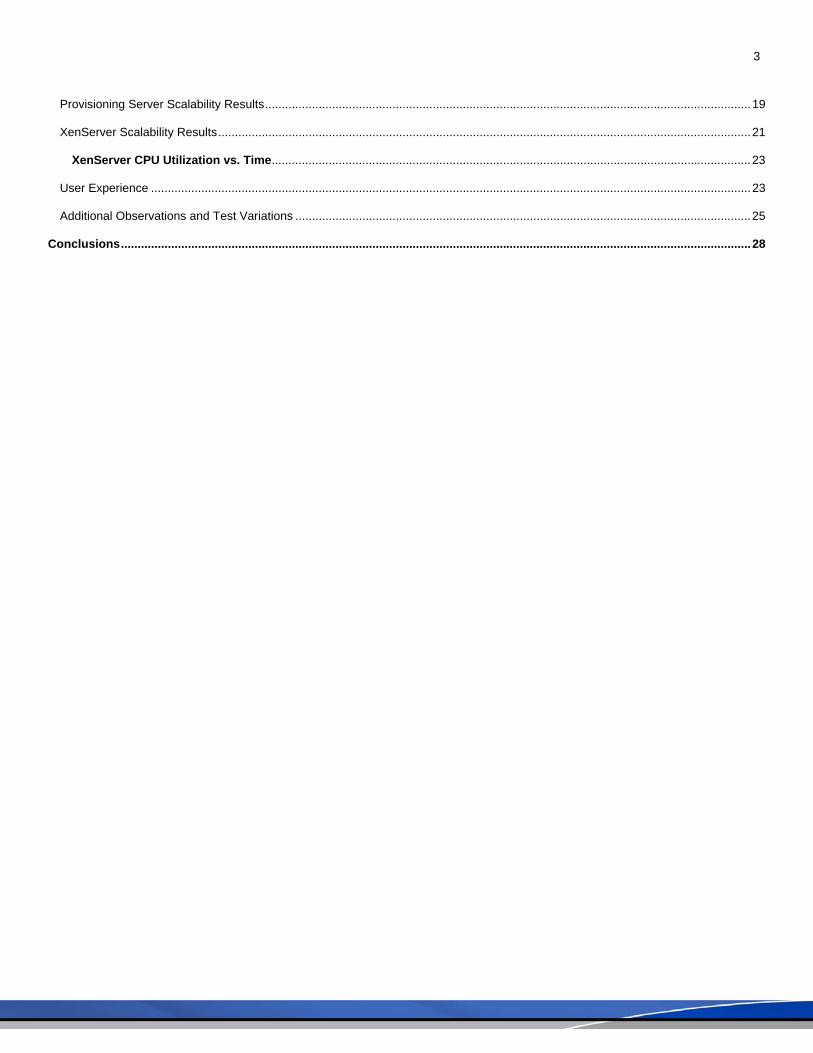
Provisioning Server Scalability Results ................................................................................................................................................. 19
XenServer Scalability Results ............................................................................................................................................................... 21
XenServer CPU Utilization vs. Time ............................................................................................................................................... 23
User Experience ................................................................................................................................................................................... 23
Additional Observations and Test Variations ........................................................................................................................................ 25
Conclusions ............................................................................................................................................................................................ 28
4
Executive Summary Companies worldwide rely on the PC desktop as the primary means for employees to conduct company business, and this need is only increasing as companies expand by introducing additional users into the workplace. As companies evaluate desktop expansion or replacement initiatives, IT departments are required to analyze the purchase, integration and maintenance of employees’ desktops. Any large scale desktop hardware or software project can require a substantial budget, lengthy project timelines, and extensive resources. Citrix XenDesktop approaches the traditional desktop deployment with a new way of thinking. Instead of requiring the IT department to manage and maintain a multitude of desktops, the Citrix desktop delivery approach centralizes these desktops into the data center and delivers a fresh desktop to each user on demand.
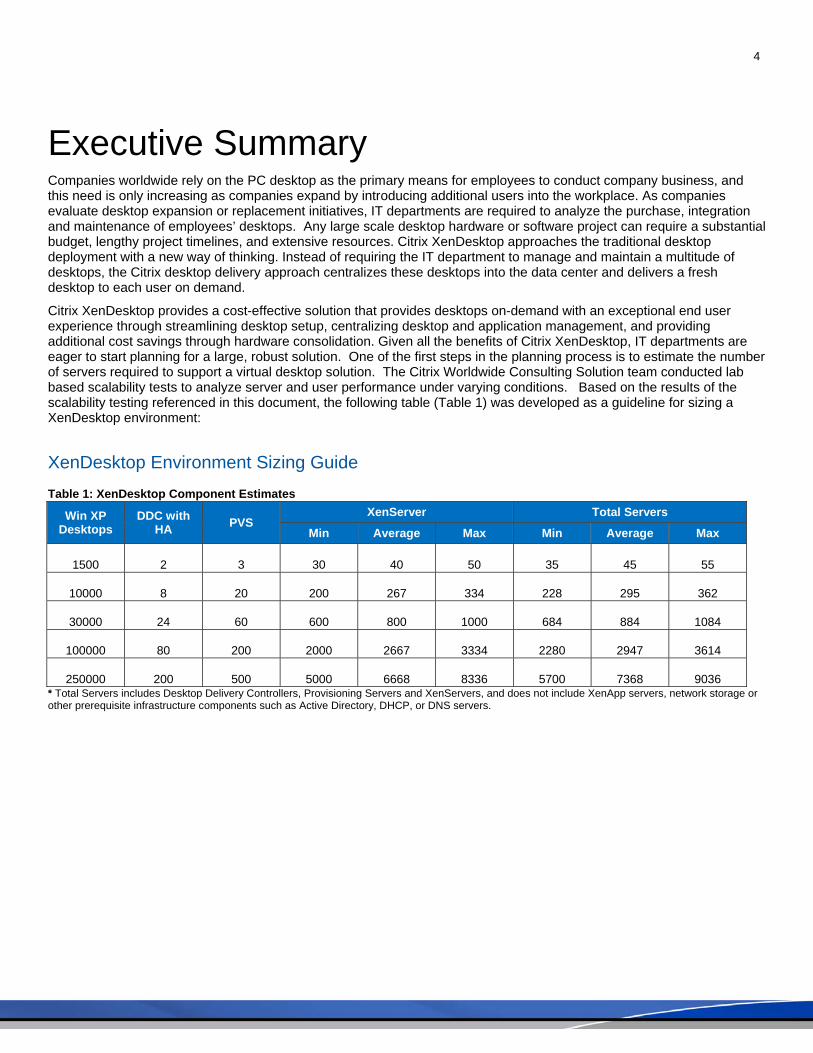
Citrix XenDesktop provides a cost-effective solution that provides desktops on-demand with an exceptional end user experience through streamlining desktop setup, centralizing desktop and application management, and providing additional cost savings through hardware consolidation. Given all the benefits of Citrix XenDesktop, IT departments are eager to start planning for a large, robust solution. One of the first steps in the planning process is to estimate the number of servers required to support a virtual desktop solution. The Citrix Worldwide Consulting Solution team conducted lab based scalability tests to analyze server and user performance under varying conditions. Based on the results of the scalability testing referenced in this document, the following table (Table 1) was developed as a guideline for sizing a XenDesktop environment:
XenDesktop Environment Sizing Guide
Table 1: XenDesktop Component Estimates
Win XP Desktops
DDC with HA PVS
XenServer Total Servers
Min Average Max Min Average Max
1500 2 3 30 40 50 35 45 55
10000 8 20 200 267 334 228 295 362
30000 24 60 600 800 1000 684 884 1084
100000 80 200 2000 2667 3334 2280 2947 3614
250000 200 500 5000 6668 8336 5700 7368 9036 * Total Servers includes Desktop Delivery Controllers, Provisioning Servers and XenServers, and does not include XenApp servers, network storage or other prerequisite infrastructure components such as Active Directory, DHCP, or DNS servers.
5
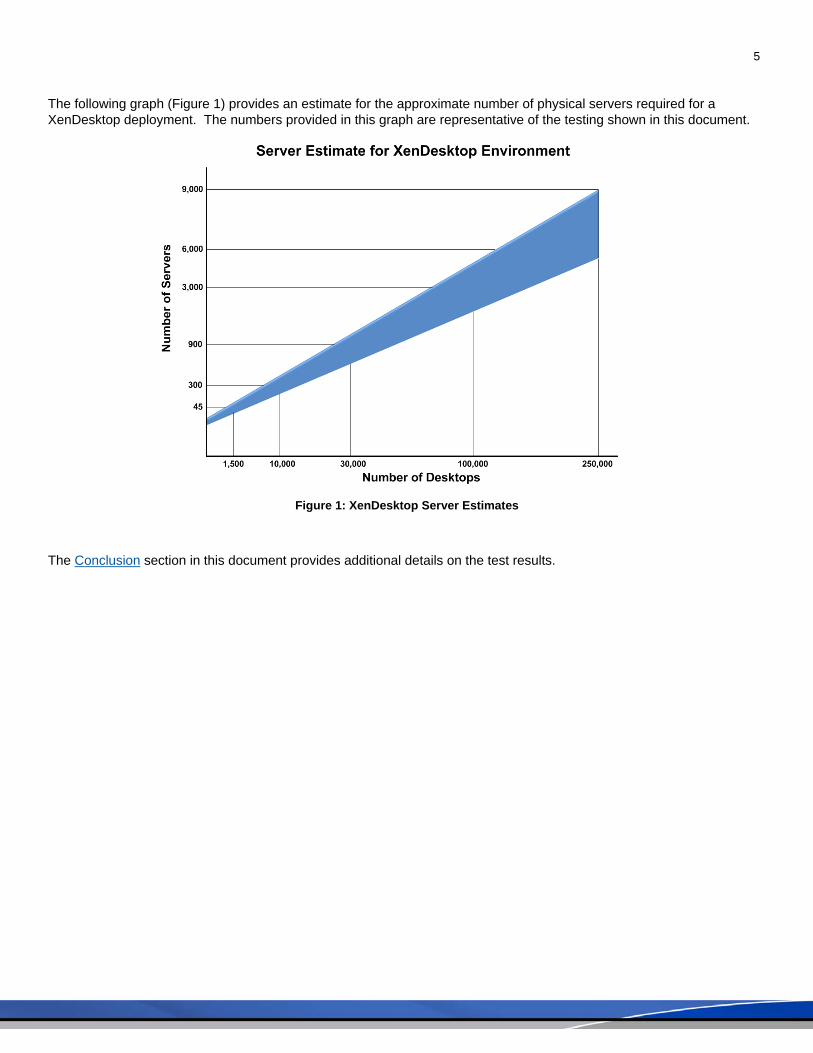
The following graph (Figure 1) provides an estimate for the approximate number of physical servers required for a XenDesktop deployment. The numbers provided in this graph are representative of the testing shown in this document.
Figure 1: XenDesktop Server Estimates
The Conclusion section in this document provides additional details on the test results.
PrCitrXenDattribindeporgan
XenDdeskusingXenSServe
CitrXenSnear-virtuafeatuPoolsthere
CitrCitrixsysteconfiuncomana
Usingsimu
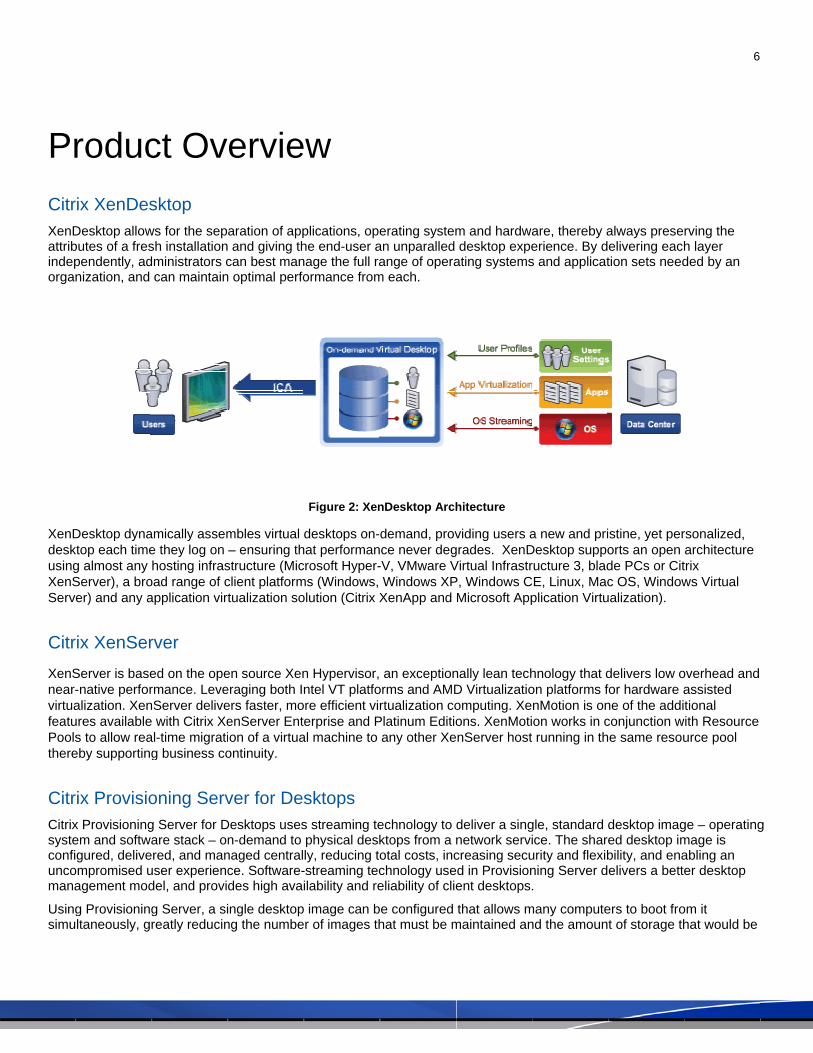
roducrix XenDesDesktop allowbutes of a frespendently, adnization, and
Desktop dynatop each time
g almost any Server), a broer) and any a
rix XenSerServer is base-native perforalization. Xenures availables to allow reaeby supporting
rix Provisiox Provisioningem and softwagured, delive
ompromised uagement mod
g Provisioningltaneously, gr
ct Ovsktop
ws for the sepsh installationministrators ccan maintain
amically asseme they log on hosting infras
oad range of capplication virt
rver
ed on the opermance. LeveServer delive with Citrix Xe
al-time migratig business co
oning Servg Server for Dare stack – onred, and man
user experiencdel, and provid
g Server, a sireatly reducin
ervie
aration of app and giving thcan best mann optimal perfo
mbles virtual d– ensuring th
structure (Micclient platformtualization so
en source Xeneraging both Iners faster, moenServer Enteon of a virtua
ontinuity.
ver for DesDesktops usesn-demand to naged centralce. Software-des high avai
ngle desktopng the numbe
w
plications, opehe end-user anage the full raormance from
Figure 2: Xen
desktops on-hat performancrosoft Hyper-ms (Windows, olution (Citrix X
n Hypervisor, ntel VT platfore efficient virerprise and P
al machine to
sktops s streaming tephysical deskly, reducing to-streaming tecilability and re
image can br of images th
erating systeman unparalled ange of opera
m each.
nDesktop Arch
demand, provce never deg
-V, VMware VWindows XP
XenApp and
an exceptionorms and AMDrtualization co
Platinum Editioany other Xe
echnology to ktops from a notal costs, incchnology useeliability of clie
e configured hat must be m
m and hardwadesktop expe
ating systems
hitecture
viding users agrades. XenDVirtual InfrastrP, Windows CMicrosoft App
nally lean techD Virtualizatioomputing. Xeons. XenMotinServer host
deliver a singnetwork servicreasing secud in Provisionent desktops.
that allows mmaintained an
are, thereby aerience. By ds and applicat
a new and priDesktop supporucture 3, bladE, Linux, Macplication Virtu
hnology that don platforms fnMotion is onon works in crunning in th
gle, standard dice. The shareurity and flexibning Server d.
many computend the amoun
always preseelivering eachtion sets need
stine, yet perorts an open de PCs or Citc OS, Window
ualization).
delivers low ofor hardware ane of the addiconjunction we same resou
desktop imaged desktop imbility, and enaelivers a bette
ers to boot frot of storage th
6
rving the h layer ded by an
rsonalized, architecture trix ws Virtual
overhead and assisted tional ith Resource urce pool
ge – operatingmage is abling an er desktop
om it hat would be
g
7
required. Administrators can make changes to a single operating system image, which will propagate to all client devices with Provisioning Server. This read-only desktop image remains preserved from changes by any users and target devices.
Citrix XenApp Citrix XenApp is an end-to-end Windows application delivery system that offers both client-side and server-side application virtualization. A core feature of the XenApp product family is delivering applications to users via publishing on Citrix XenApp. Applications are installed, configured and updated on servers in the datacenter, instead of on individual client devices, greatly reducing the support burden for troubleshooting and maintaining a wide set of applications on a variety of platforms. Users access their entire set of applications by installing only a Citrix XenApp Application Receiver on their local machine. Applications are delivered to the client device over the network via an ICA connection, allowing for users to remain productive, even while using all types of devices, including thin-clients and mobile devices on any network, anywhere.
Citrix EdgeSight for Load Testing EdgeSight for Load Testing is an automated load and performance testing solution for Citrix XenApp environments. This product extends the application performance visibility that Citrix EdgeSight provides by introducing pre-production application performance tools. This load generating software solution enables administrators to predict how systems will cope with high levels of user load. By simulating hundreds of virtual Citrix users and monitoring the responsiveness of the system under test, it allows the administrator to determine how the current configuration and hardware infrastructure will support anticipated demand.
8
Test Environment Architecture Overview
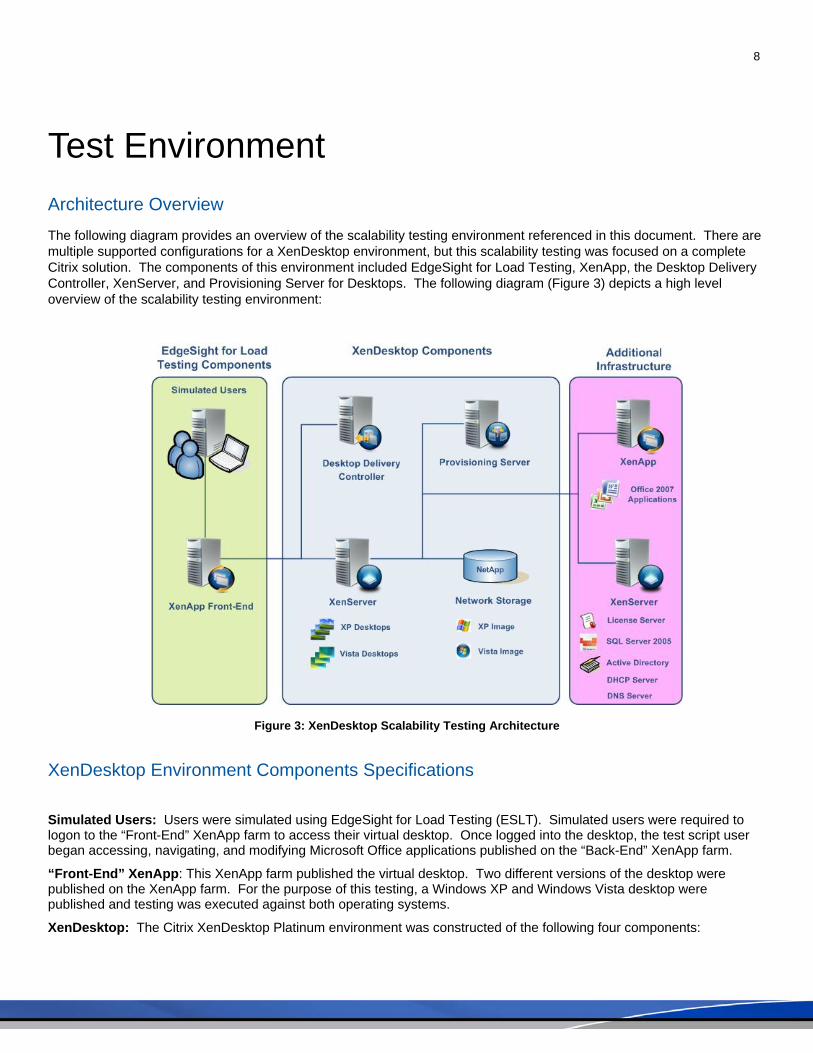
The following diagram provides an overview of the scalability testing environment referenced in this document. There are multiple supported configurations for a XenDesktop environment, but this scalability testing was focused on a complete Citrix solution. The components of this environment included EdgeSight for Load Testing, XenApp, the Desktop Delivery Controller, XenServer, and Provisioning Server for Desktops. The following diagram (Figure 3) depicts a high level overview of the scalability testing environment:
Figure 3: XenDesktop Scalability Testing Architecture
XenDesktop Environment Components Specifications
Simulated Users: Users were simulated using EdgeSight for Load Testing (ESLT). Simulated users were required to logon to the “Front-End” XenApp farm to access their virtual desktop. Once logged into the desktop, the test script user began accessing, navigating, and modifying Microsoft Office applications published on the “Back-End” XenApp farm.
“Front-End” XenApp: This XenApp farm published the virtual desktop. Two different versions of the desktop were published on the XenApp farm. For the purpose of this testing, a Windows XP and Windows Vista desktop were published and testing was executed against both operating systems.
XenDesktop: The Citrix XenDesktop Platinum environment was constructed of the following four components:
9
• Desktop Delivery Controller (DDC): The DDC handled all simulated user requests for desktops and brokered the connections between the virtual desktop and the simulated user requests. The DDC controlled many functions of the XenServer such as the starting and restarting of desktops, managing idle desktops, monitoring server maintenance tasks, and various other desktop functions.
• Citrix XenServer: XenServer was used as the hosting infrastructure for the XenDesktop environment. The XenServer virtualization solution hosted each user’s desktop operating system. XenServer can function within a XenDesktop environment as a single server or as a pool of XenServers. The pool model contains a pool master XenServer and member XenServers.
• NetApp 3050C: The NetApp device was the centralized network storage solution for the Provisioning Server
desktop images and write cache.
• Citrix Provisioning Server for Desktops: Provisioning Server was used to create a clean or “golden” operating system image of the desktop. This image is streamed to the XenServer on-demand for each user logon. This allows the administrator to simply configure and modify a single “golden” image of each operating system and deliver it to many users simultaneously.
“Back-End” XenApp: This XenApp farm had Microsoft Office applications. The simulated user applications were separated from the desktop to optimize the desktop performance. The simulated test users accessed the applications through the Citrix Application Receiver published on the virtual desktop.
XenServer (Infrastructure): The Infrastructure XenServer hosted all the virtual images necessary to make the environment self-contained. These virtual images included the domain controller, Citrix License Server, Microsoft SQL server, and more.
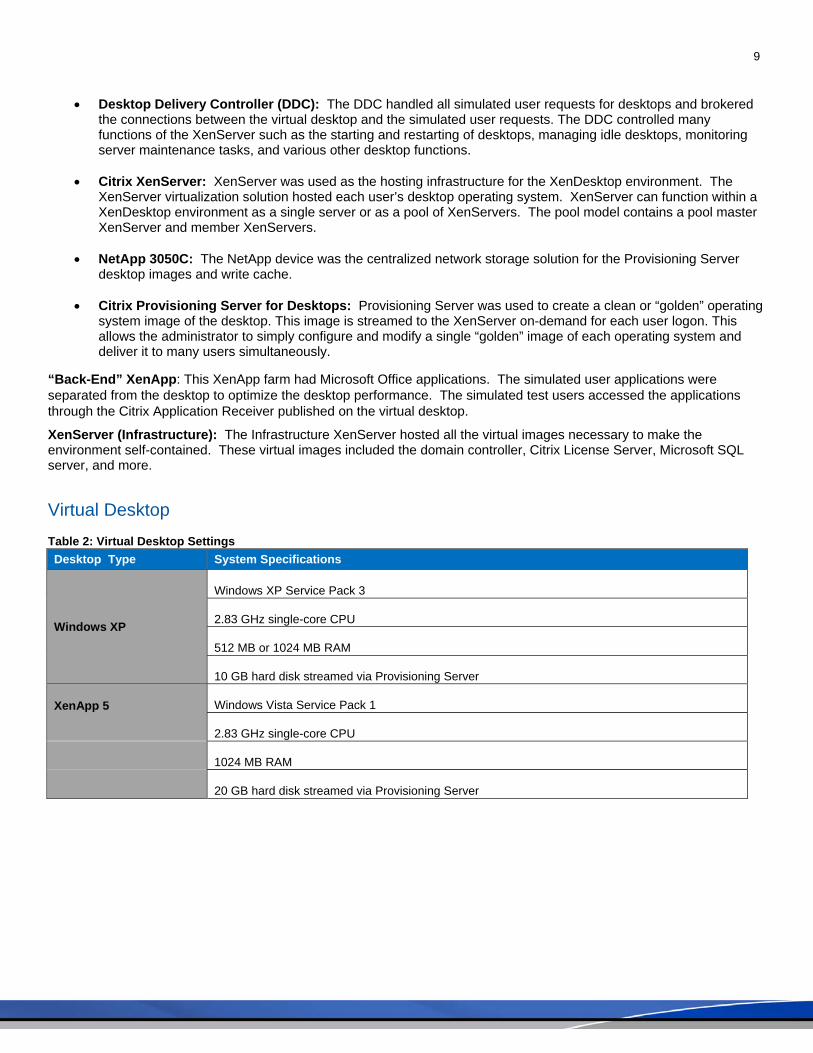
Virtual Desktop Table 2: Virtual Desktop Settings Desktop Type System Specifications
Windows XP
Windows XP Service Pack 3
2.83 GHz single-core CPU
512 MB or 1024 MB RAM
10 GB hard disk streamed via Provisioning Server
XenApp 5
Windows Vista Service Pack 1
2.83 GHz single-core CPU
1024 MB RAM
20 GB hard disk streamed via Provisioning Server
10
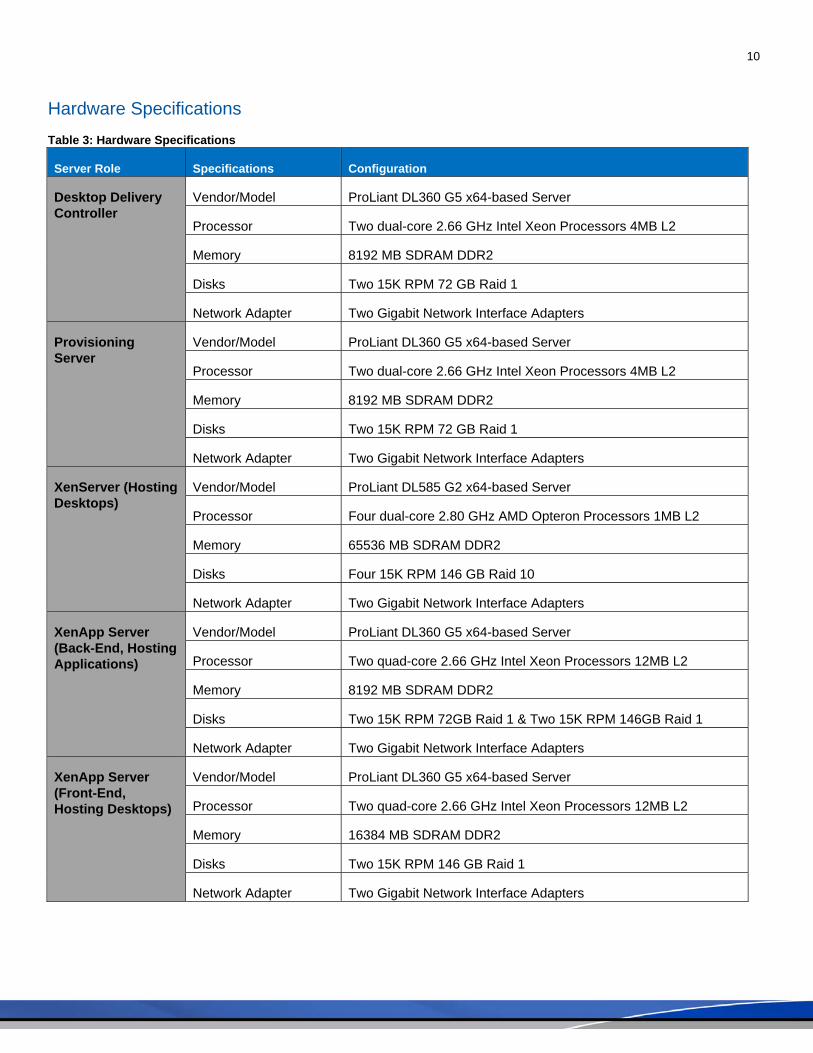
Hardware Specifications Table 3: Hardware Specifications
Server Role Specifications Configuration
Desktop Delivery Controller
Vendor/Model ProLiant DL360 G5 x64-based Server
Processor Two dual-core 2.66 GHz Intel Xeon Processors 4MB L2
Memory 8192 MB SDRAM DDR2
Disks Two 15K RPM 72 GB Raid 1
Network Adapter Two Gigabit Network Interface Adapters
Provisioning Server
Vendor/Model ProLiant DL360 G5 x64-based Server
Processor Two dual-core 2.66 GHz Intel Xeon Processors 4MB L2
Memory 8192 MB SDRAM DDR2
Disks Two 15K RPM 72 GB Raid 1
Network Adapter Two Gigabit Network Interface Adapters
XenServer (Hosting Desktops)
Vendor/Model ProLiant DL585 G2 x64-based Server
Processor Four dual-core 2.80 GHz AMD Opteron Processors 1MB L2
Memory 65536 MB SDRAM DDR2
Disks Four 15K RPM 146 GB Raid 10
Network Adapter Two Gigabit Network Interface Adapters
XenApp Server (Back-End, Hosting Applications)
Vendor/Model ProLiant DL360 G5 x64-based Server
Processor Two quad-core 2.66 GHz Intel Xeon Processors 12MB L2
Memory 8192 MB SDRAM DDR2
Disks Two 15K RPM 72GB Raid 1 & Two 15K RPM 146GB Raid 1
Network Adapter Two Gigabit Network Interface Adapters
XenApp Server (Front-End, Hosting Desktops)
Vendor/Model ProLiant DL360 G5 x64-based Server
Processor Two quad-core 2.66 GHz Intel Xeon Processors 12MB L2
Memory 16384 MB SDRAM DDR2
Disks Two 15K RPM 146 GB Raid 1
Network Adapter Two Gigabit Network Interface Adapters
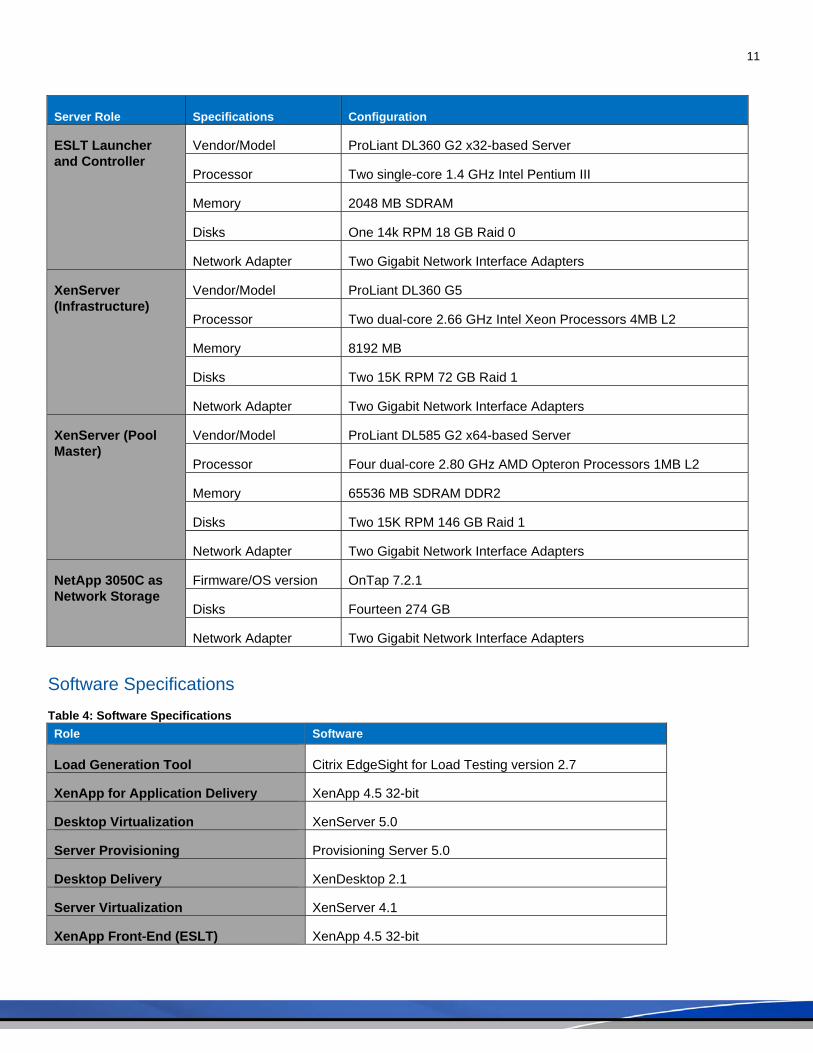
11
Server Role Specifications Configuration
ESLT Launcher and Controller
Vendor/Model ProLiant DL360 G2 x32-based Server
Processor Two single-core 1.4 GHz Intel Pentium III
Memory 2048 MB SDRAM
Disks One 14k RPM 18 GB Raid 0
Network Adapter Two Gigabit Network Interface Adapters
XenServer (Infrastructure)
Vendor/Model ProLiant DL360 G5
Processor Two dual-core 2.66 GHz Intel Xeon Processors 4MB L2
Memory 8192 MB
Disks Two 15K RPM 72 GB Raid 1
Network Adapter Two Gigabit Network Interface Adapters
XenServer (Pool Master)
Vendor/Model ProLiant DL585 G2 x64-based Server
Processor Four dual-core 2.80 GHz AMD Opteron Processors 1MB L2
Memory 65536 MB SDRAM DDR2
Disks Two 15K RPM 146 GB Raid 1
Network Adapter Two Gigabit Network Interface Adapters
NetApp 3050C as Network Storage
Firmware/OS version OnTap 7.2.1
Disks Fourteen 274 GB
Network Adapter Two Gigabit Network Interface Adapters
Software Specifications Table 4: Software Specifications Role Software
Load Generation Tool Citrix EdgeSight for Load Testing version 2.7
XenApp for Application Delivery XenApp 4.5 32-bit
Desktop Virtualization XenServer 5.0
Server Provisioning Provisioning Server 5.0
Desktop Delivery XenDesktop 2.1
Server Virtualization XenServer 4.1
XenApp Front-End (ESLT) XenApp 4.5 32-bit
12
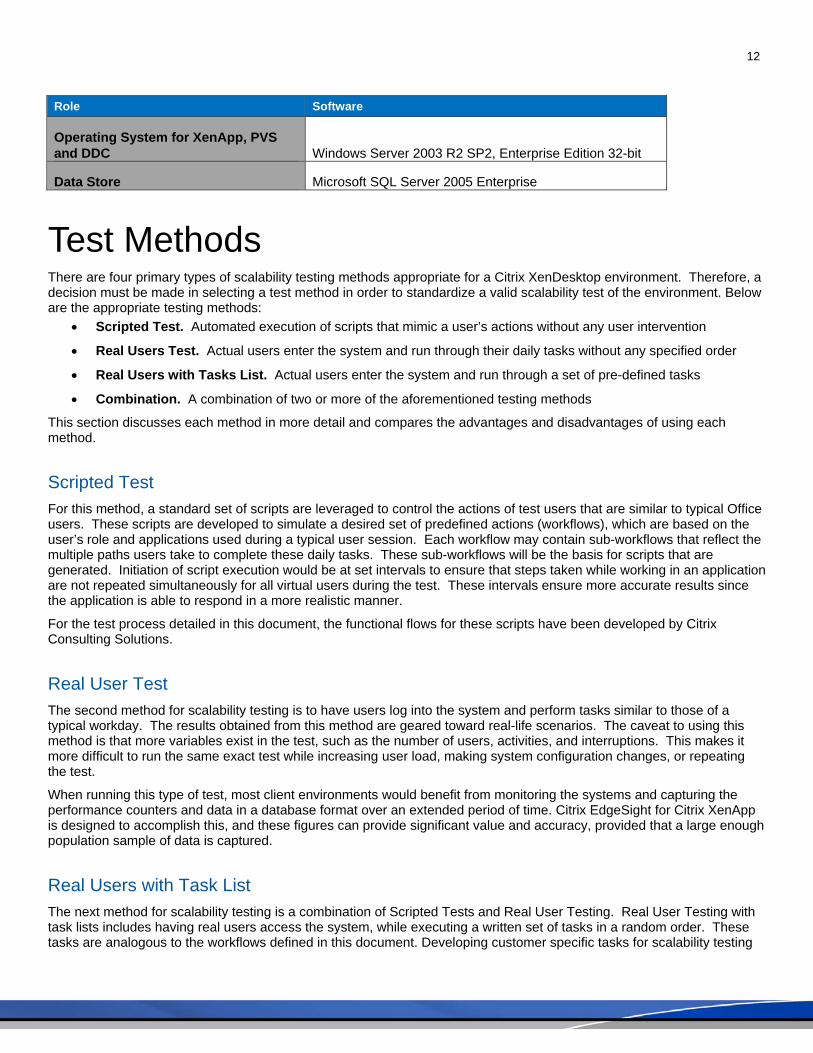
Role Software
Operating System for XenApp, PVS and DDC Windows Server 2003 R2 SP2, Enterprise Edition 32-bit
Data Store Microsoft SQL Server 2005 Enterprise
Test Methods There are four primary types of scalability testing methods appropriate for a Citrix XenDesktop environment. Therefore, a decision must be made in selecting a test method in order to standardize a valid scalability test of the environment. Below are the appropriate testing methods:
• Scripted Test. Automated execution of scripts that mimic a user’s actions without any user intervention
• Real Users Test. Actual users enter the system and run through their daily tasks without any specified order
• Real Users with Tasks List. Actual users enter the system and run through a set of pre-defined tasks
• Combination. A combination of two or more of the aforementioned testing methods
This section discusses each method in more detail and compares the advantages and disadvantages of using each method.
Scripted Test For this method, a standard set of scripts are leveraged to control the actions of test users that are similar to typical Office users. These scripts are developed to simulate a desired set of predefined actions (workflows), which are based on the user’s role and applications used during a typical user session. Each workflow may contain sub-workflows that reflect the multiple paths users take to complete these daily tasks. These sub-workflows will be the basis for scripts that are generated. Initiation of script execution would be at set intervals to ensure that steps taken while working in an application are not repeated simultaneously for all virtual users during the test. These intervals ensure more accurate results since the application is able to respond in a more realistic manner.
For the test process detailed in this document, the functional flows for these scripts have been developed by Citrix Consulting Solutions.
Real User Test The second method for scalability testing is to have users log into the system and perform tasks similar to those of a typical workday. The results obtained from this method are geared toward real-life scenarios. The caveat to using this method is that more variables exist in the test, such as the number of users, activities, and interruptions. This makes it more difficult to run the same exact test while increasing user load, making system configuration changes, or repeating the test.
When running this type of test, most client environments would benefit from monitoring the systems and capturing the performance counters and data in a database format over an extended period of time. Citrix EdgeSight for Citrix XenApp is designed to accomplish this, and these figures can provide significant value and accuracy, provided that a large enough population sample of data is captured.
Real Users with Task List The next method for scalability testing is a combination of Scripted Tests and Real User Testing. Real User Testing with task lists includes having real users access the system, while executing a written set of tasks in a random order. These tasks are analogous to the workflows defined in this document. Developing customer specific tasks for scalability testing
13
will represent the different types of users that will access the system on a daily basis. Each user will be accessing the system at different speeds, reflecting a realistic production environment. However, these users will be following a common set of tasks that will help with standardizing the scalability tests when they need to be re-run with additional users. This type of test is resource intensive and can be difficult to coordinate. Most corporate environments cannot provide multiple resources for this type of application testing and evaluation.
Combination The final method for scalability testing is a combination of a custom script and real users accessing the test environment. For example, five client computers emulating six users each could be used in conjunction with several real users performing searches and more complex customer transactions. This would allow the administrators to load the system to specific level, and then evaluate the subjective and objective results of the users’ interaction with the XenDesktop environment.
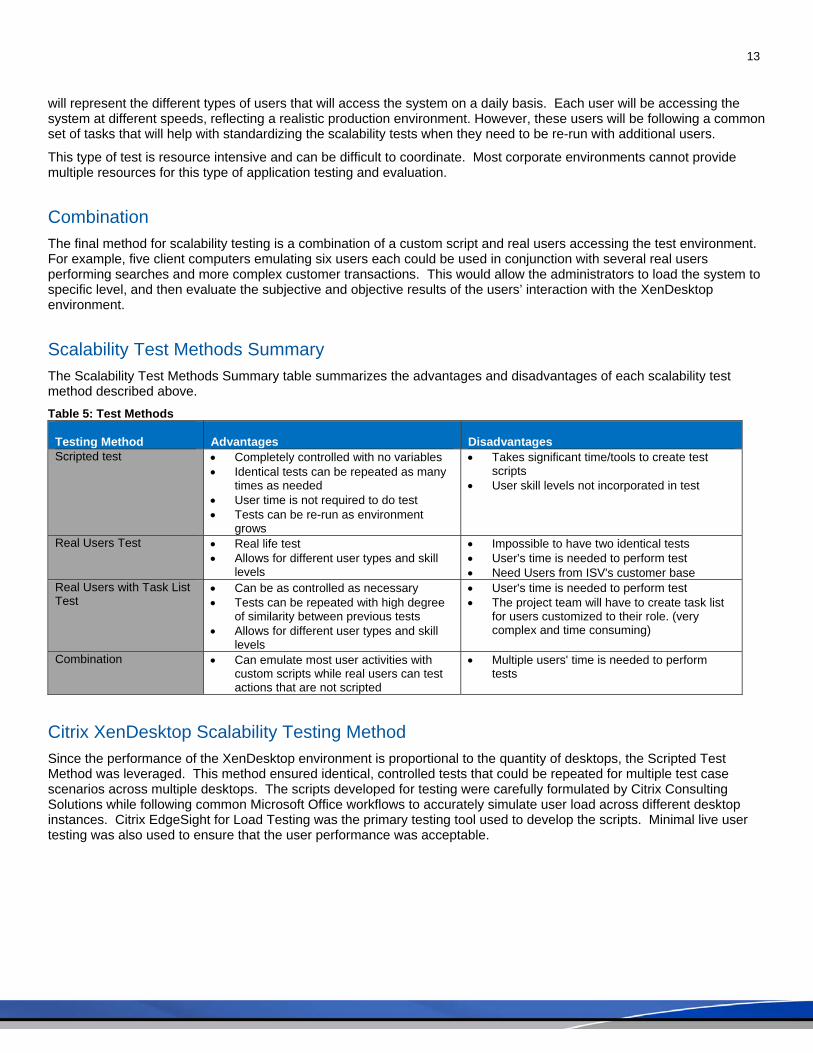
Scalability Test Methods Summary The Scalability Test Methods Summary table summarizes the advantages and disadvantages of each scalability test method described above. Table 5: Test Methods
Testing Method Advantages Disadvantages Scripted test • Completely controlled with no variables
• Identical tests can be repeated as many times as needed
• User time is not required to do test • Tests can be re-run as environment
grows
• Takes significant time/tools to create test scripts
• User skill levels not incorporated in test
Real Users Test • Real life test • Allows for different user types and skill
levels
• Impossible to have two identical tests • User's time is needed to perform test • Need Users from ISV's customer base
Real Users with Task List Test
• Can be as controlled as necessary • Tests can be repeated with high degree
of similarity between previous tests • Allows for different user types and skill
levels
• User's time is needed to perform test • The project team will have to create task list
for users customized to their role. (very complex and time consuming)
Combination • Can emulate most user activities with custom scripts while real users can test actions that are not scripted
• Multiple users' time is needed to perform tests
Citrix XenDesktop Scalability Testing Method Since the performance of the XenDesktop environment is proportional to the quantity of desktops, the Scripted Test Method was leveraged. This method ensured identical, controlled tests that could be repeated for multiple test case scenarios across multiple desktops. The scripts developed for testing were carefully formulated by Citrix Consulting Solutions while following common Microsoft Office workflows to accurately simulate user load across different desktop instances. Citrix EdgeSight for Load Testing was the primary testing tool used to develop the scripts. Minimal live user testing was also used to ensure that the user performance was acceptable.
14
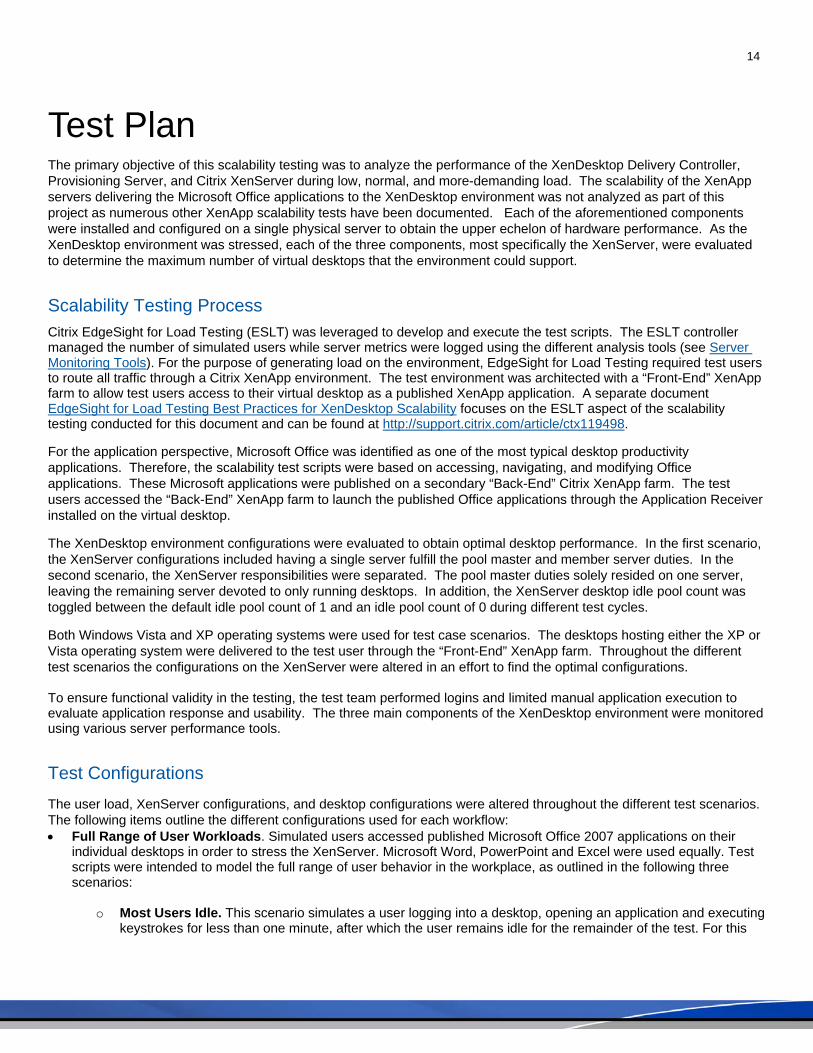
Test Plan
The primary objective of this scalability testing was to analyze the performance of the XenDesktop Delivery Controller, Provisioning Server, and Citrix XenServer during low, normal, and more-demanding load. The scalability of the XenApp servers delivering the Microsoft Office applications to the XenDesktop environment was not analyzed as part of this project as numerous other XenApp scalability tests have been documented. Each of the aforementioned components were installed and configured on a single physical server to obtain the upper echelon of hardware performance. As the XenDesktop environment was stressed, each of the three components, most specifically the XenServer, were evaluated to determine the maximum number of virtual desktops that the environment could support.
Scalability Testing Process Citrix EdgeSight for Load Testing (ESLT) was leveraged to develop and execute the test scripts. The ESLT controller managed the number of simulated users while server metrics were logged using the different analysis tools (see Server Monitoring Tools). For the purpose of generating load on the environment, EdgeSight for Load Testing required test users to route all traffic through a Citrix XenApp environment. The test environment was architected with a “Front-End” XenApp farm to allow test users access to their virtual desktop as a published XenApp application. A separate document EdgeSight for Load Testing Best Practices for XenDesktop Scalability focuses on the ESLT aspect of the scalability testing conducted for this document and can be found at http://support.citrix.com/article/ctx119498.
For the application perspective, Microsoft Office was identified as one of the most typical desktop productivity applications. Therefore, the scalability test scripts were based on accessing, navigating, and modifying Office applications. These Microsoft applications were published on a secondary “Back-End” Citrix XenApp farm. The test users accessed the “Back-End” XenApp farm to launch the published Office applications through the Application Receiver installed on the virtual desktop.
The XenDesktop environment configurations were evaluated to obtain optimal desktop performance. In the first scenario, the XenServer configurations included having a single server fulfill the pool master and member server duties. In the second scenario, the XenServer responsibilities were separated. The pool master duties solely resided on one server, leaving the remaining server devoted to only running desktops. In addition, the XenServer desktop idle pool count was toggled between the default idle pool count of 1 and an idle pool count of 0 during different test cycles.
Both Windows Vista and XP operating systems were used for test case scenarios. The desktops hosting either the XP or Vista operating system were delivered to the test user through the “Front-End” XenApp farm. Throughout the different test scenarios the configurations on the XenServer were altered in an effort to find the optimal configurations. To ensure functional validity in the testing, the test team performed logins and limited manual application execution to evaluate application response and usability. The three main components of the XenDesktop environment were monitored using various server performance tools.
Test Configurations The user load, XenServer configurations, and desktop configurations were altered throughout the different test scenarios. The following items outline the different configurations used for each workflow: • Full Range of User Workloads. Simulated users accessed published Microsoft Office 2007 applications on their
individual desktops in order to stress the XenServer. Microsoft Word, PowerPoint and Excel were used equally. Test scripts were intended to model the full range of user behavior in the workplace, as outlined in the following three scenarios:
o Most Users Idle. This scenario simulates a user logging into a desktop, opening an application and executing
keystrokes for less than one minute, after which the user remains idle for the remainder of the test. For this
15
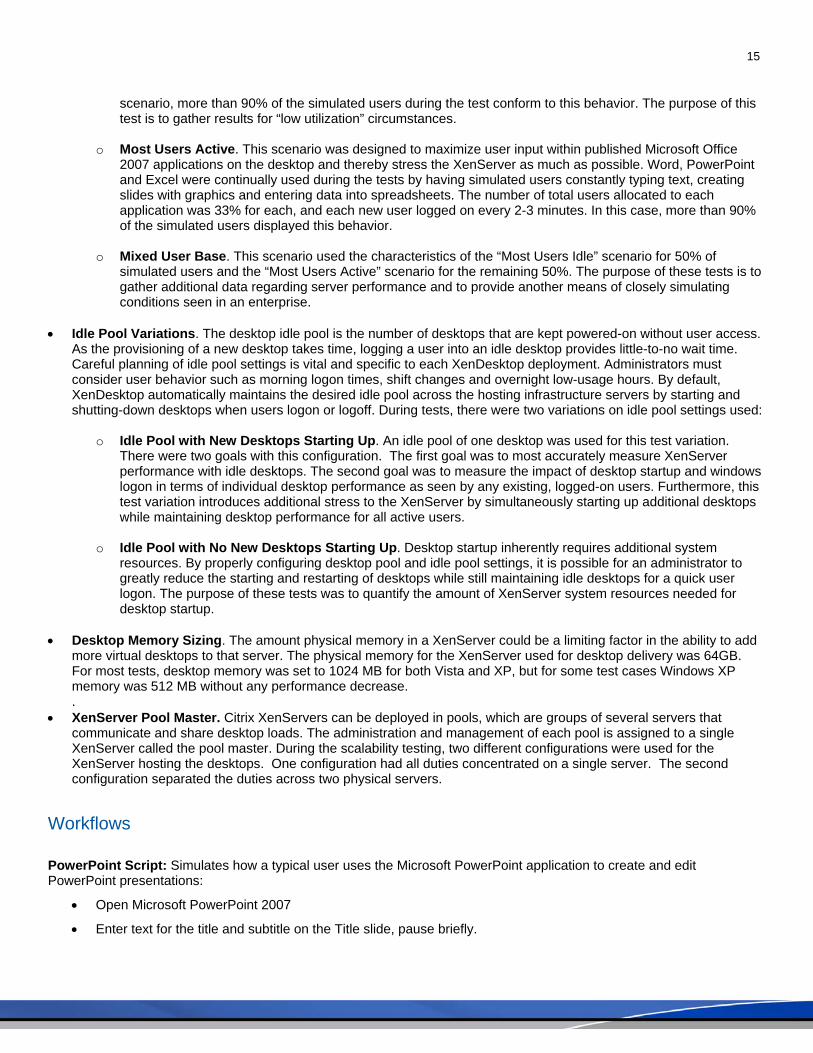
scenario, more than 90% of the simulated users during the test conform to this behavior. The purpose of this test is to gather results for “low utilization” circumstances.
o Most Users Active. This scenario was designed to maximize user input within published Microsoft Office
2007 applications on the desktop and thereby stress the XenServer as much as possible. Word, PowerPoint and Excel were continually used during the tests by having simulated users constantly typing text, creating slides with graphics and entering data into spreadsheets. The number of total users allocated to each application was 33% for each, and each new user logged on every 2-3 minutes. In this case, more than 90% of the simulated users displayed this behavior.
o Mixed User Base. This scenario used the characteristics of the “Most Users Idle” scenario for 50% of
simulated users and the “Most Users Active” scenario for the remaining 50%. The purpose of these tests is to gather additional data regarding server performance and to provide another means of closely simulating conditions seen in an enterprise.
• Idle Pool Variations. The desktop idle pool is the number of desktops that are kept powered-on without user access.
As the provisioning of a new desktop takes time, logging a user into an idle desktop provides little-to-no wait time. Careful planning of idle pool settings is vital and specific to each XenDesktop deployment. Administrators must consider user behavior such as morning logon times, shift changes and overnight low-usage hours. By default, XenDesktop automatically maintains the desired idle pool across the hosting infrastructure servers by starting and shutting-down desktops when users logon or logoff. During tests, there were two variations on idle pool settings used:
o Idle Pool with New Desktops Starting Up. An idle pool of one desktop was used for this test variation.
There were two goals with this configuration. The first goal was to most accurately measure XenServer performance with idle desktops. The second goal was to measure the impact of desktop startup and windows logon in terms of individual desktop performance as seen by any existing, logged-on users. Furthermore, this test variation introduces additional stress to the XenServer by simultaneously starting up additional desktops while maintaining desktop performance for all active users.
o Idle Pool with No New Desktops Starting Up. Desktop startup inherently requires additional system
resources. By properly configuring desktop pool and idle pool settings, it is possible for an administrator to greatly reduce the starting and restarting of desktops while still maintaining idle desktops for a quick user logon. The purpose of these tests was to quantify the amount of XenServer system resources needed for desktop startup.
• Desktop Memory Sizing. The amount physical memory in a XenServer could be a limiting factor in the ability to add
more virtual desktops to that server. The physical memory for the XenServer used for desktop delivery was 64GB. For most tests, desktop memory was set to 1024 MB for both Vista and XP, but for some test cases Windows XP memory was 512 MB without any performance decrease. .
• XenServer Pool Master. Citrix XenServers can be deployed in pools, which are groups of several servers that communicate and share desktop loads. The administration and management of each pool is assigned to a single XenServer called the pool master. During the scalability testing, two different configurations were used for the XenServer hosting the desktops. One configuration had all duties concentrated on a single server. The second configuration separated the duties across two physical servers.
Workflows
PowerPoint Script: Simulates how a typical user uses the Microsoft PowerPoint application to create and edit PowerPoint presentations:
• Open Microsoft PowerPoint 2007
• Enter text for the title and subtitle on the Title slide, pause briefly.
16
• Enter one short sentence for several bullets on a second slide, pause briefly.
• Create a new slide, enter several bullets, and insert an image or clip art, then pause briefly.
• Resize and move the PowerPoint image, pause briefly.
• Repeat the process of creating a new slide with text followed by a second slide with an image indefinitely.
Word Script: Simulates how a typical user uses the Microsoft Word application to create a new document and edit that document:
• Create new document
• Type several sentences in the Word document, pause briefly.
• Enter several more sentences in the Word document and create bulleted text, pause briefly.
• Repeat the previous two steps indefinitely.
Excel Script: Simulates how a typical user uses the Microsoft Excel application to create a new document and edit that document:
• Create new worksheet
• Enter text into several cells, pause briefly.
• Enter numbers into several cells, pause briefly.
• Perform basic arithmetic on numbers in cells, pause briefly.
• Repeat the previous three steps indefinitely.
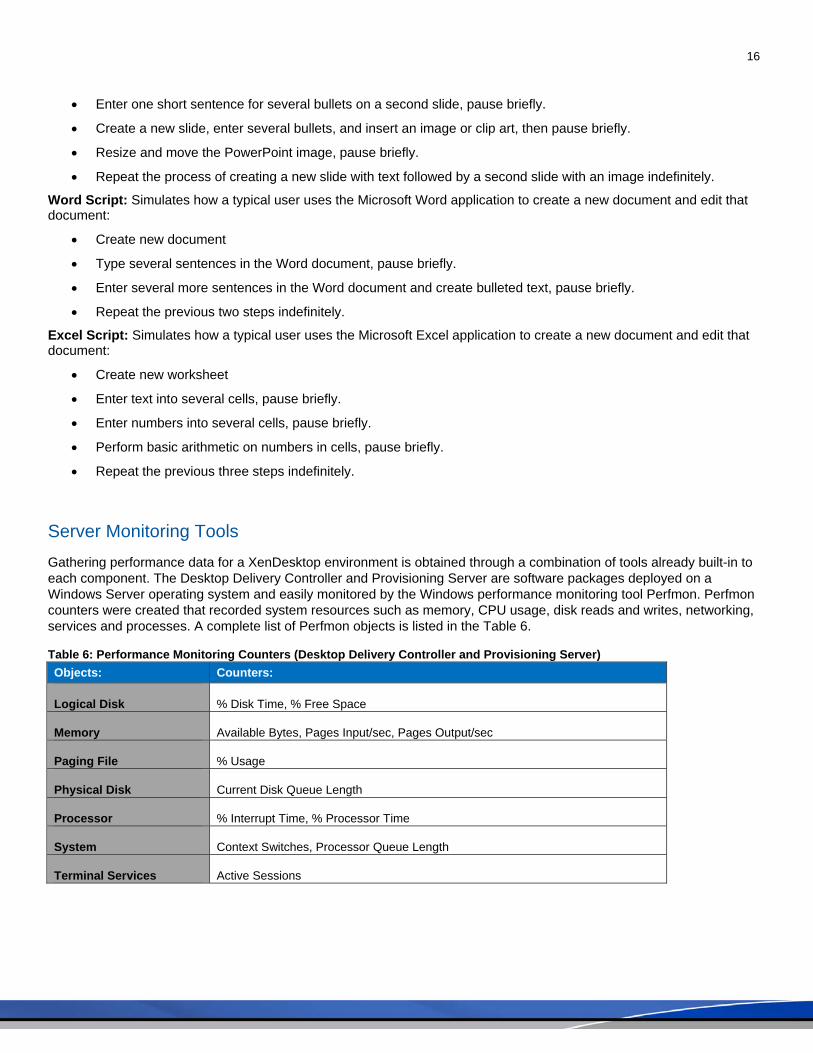
Server Monitoring Tools Gathering performance data for a XenDesktop environment is obtained through a combination of tools already built-in to each component. The Desktop Delivery Controller and Provisioning Server are software packages deployed on a Windows Server operating system and easily monitored by the Windows performance monitoring tool Perfmon. Perfmon counters were created that recorded system resources such as memory, CPU usage, disk reads and writes, networking, services and processes. A complete list of Perfmon objects is listed in the Table 6.
Table 6: Performance Monitoring Counters (Desktop Delivery Controller and Provisioning Server) Objects: Counters:
Logical Disk % Disk Time, % Free Space
Memory Available Bytes, Pages Input/sec, Pages Output/sec
Paging File % Usage
Physical Disk Current Disk Queue Length
Processor % Interrupt Time, % Processor Time
System Context Switches, Processor Queue Length
Terminal Services Active Sessions
17
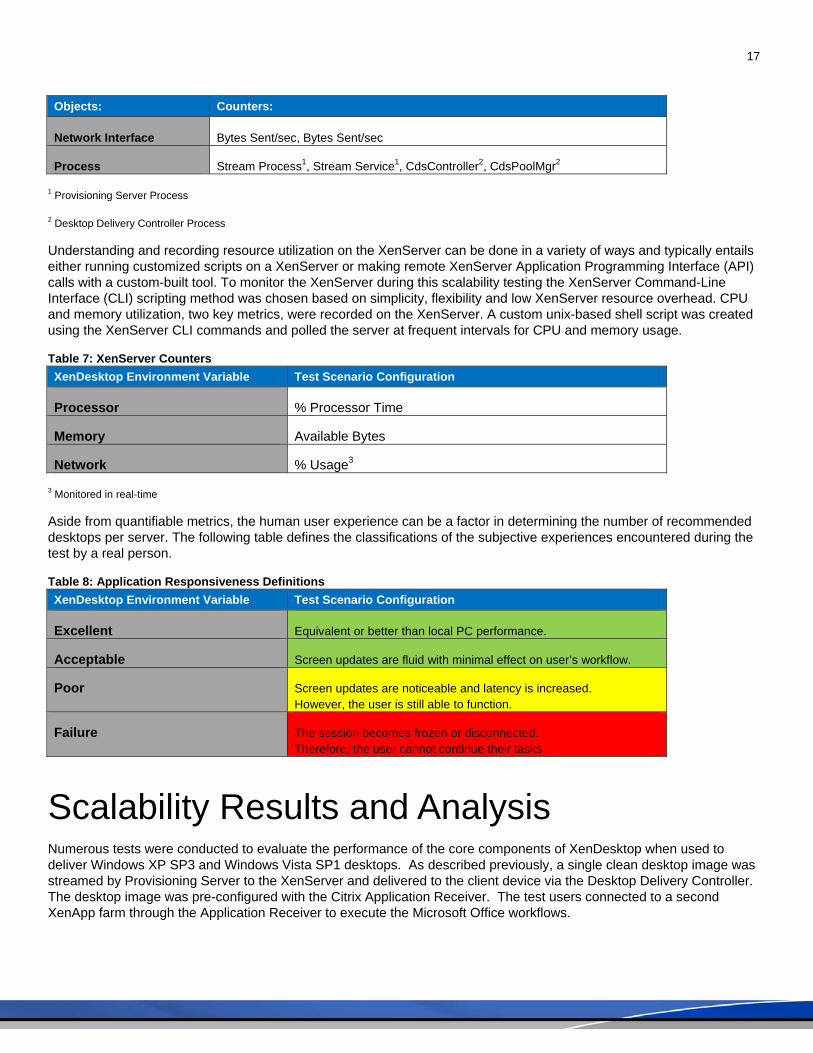
Objects: Counters:
Network Interface Bytes Sent/sec, Bytes Sent/sec
Process Stream Process1, Stream Service1, CdsController2, CdsPoolMgr2
1 Provisioning Server Process
2 Desktop Delivery Controller Process
Understanding and recording resource utilization on the XenServer can be done in a variety of ways and typically entails either running customized scripts on a XenServer or making remote XenServer Application Programming Interface (API) calls with a custom-built tool. To monitor the XenServer during this scalability testing the XenServer Command-Line Interface (CLI) scripting method was chosen based on simplicity, flexibility and low XenServer resource overhead. CPU and memory utilization, two key metrics, were recorded on the XenServer. A custom unix-based shell script was created using the XenServer CLI commands and polled the server at frequent intervals for CPU and memory usage.
Table 7: XenServer Counters XenDesktop Environment Variable Test Scenario Configuration
Processor % Processor Time
Memory Available Bytes
Network % Usage3
3 Monitored in real-time
Aside from quantifiable metrics, the human user experience can be a factor in determining the number of recommended desktops per server. The following table defines the classifications of the subjective experiences encountered during the test by a real person.
Table 8: Application Responsiveness Definitions XenDesktop Environment Variable Test Scenario Configuration
Excellent Equivalent or better than local PC performance.
Acceptable Screen updates are fluid with minimal effect on user’s workflow.
Poor Screen updates are noticeable and latency is increased. However, the user is still able to function.
Failure The session becomes frozen or disconnected. Therefore, the user cannot continue their tasks.
Scalability Results and Analysis Numerous tests were conducted to evaluate the performance of the core components of XenDesktop when used to deliver Windows XP SP3 and Windows Vista SP1 desktops. As described previously, a single clean desktop image was streamed by Provisioning Server to the XenServer and delivered to the client device via the Desktop Delivery Controller. The desktop image was pre-configured with the Citrix Application Receiver. The test users connected to a second XenApp farm through the Application Receiver to execute the Microsoft Office workflows.
18
Throughout the scalability testing, various environment variables were altered to determine the most resource intensive test scenario. The following sections depict performance graphs used to analyze the Desktop Delivery Controller, Provisioning Server for Desktops, and XenServer performance when stressed under the following resource intensive configurations:
Table 9: Test Scenario Configurations XenDesktop Environment Variable Test Scenario Configuration
XenApp User Load Active User Load (90% active users, 10% inactive)
XenServer Idle Pool Count Idle Pool with New Desktops Starting Up
Desktop Operating System Windows XP with 512MB RAM
XenServer Pool Single XenServer acting a Pool Master and Member Server
Desktop Delivery Controller Scalability Results
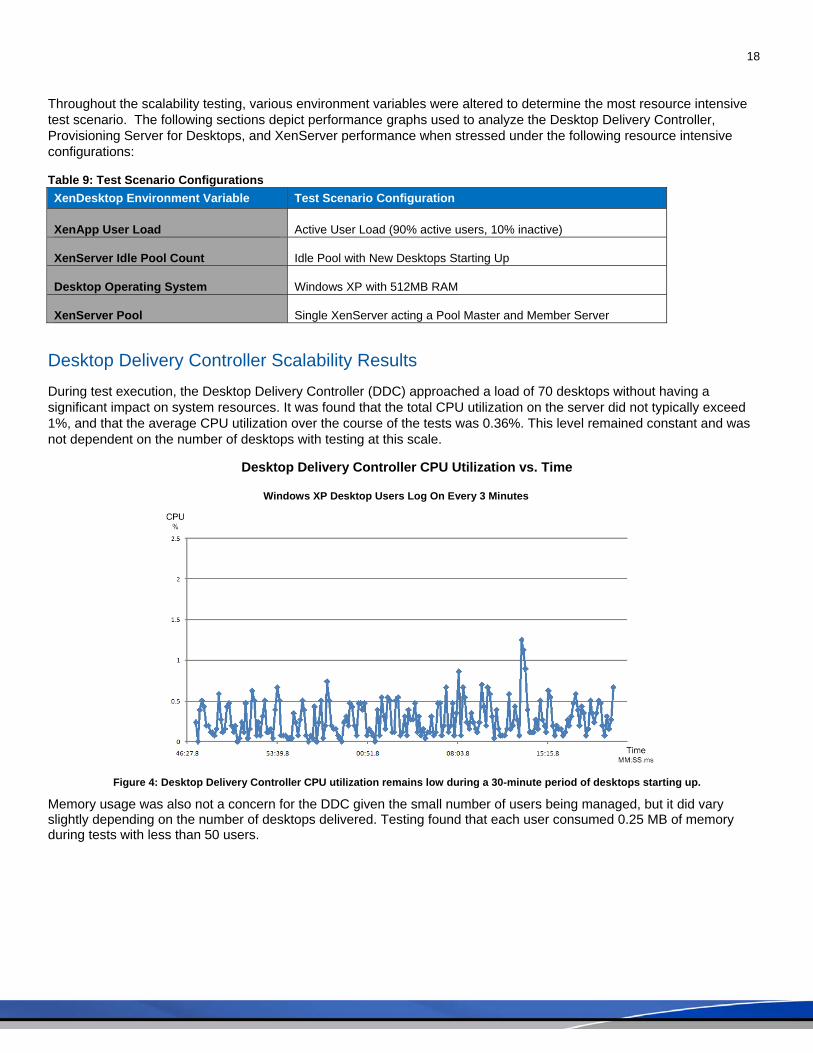
During test execution, the Desktop Delivery Controller (DDC) approached a load of 70 desktops without having a significant impact on system resources. It was found that the total CPU utilization on the server did not typically exceed 1%, and that the average CPU utilization over the course of the tests was 0.36%. This level remained constant and was not dependent on the number of desktops with testing at this scale.
Desktop Delivery Controller CPU Utilization vs. Time
Windows XP Desktop Users Log On Every 3 Minutes
Figure 4: Desktop Delivery Controller CPU utilization remains low during a 30-minute period of desktops starting up.
Memory usage was also not a concern for the DDC given the small number of users being managed, but it did vary slightly depending on the number of desktops delivered. Testing found that each user consumed 0.25 MB of memory during tests with less than 50 users.
19
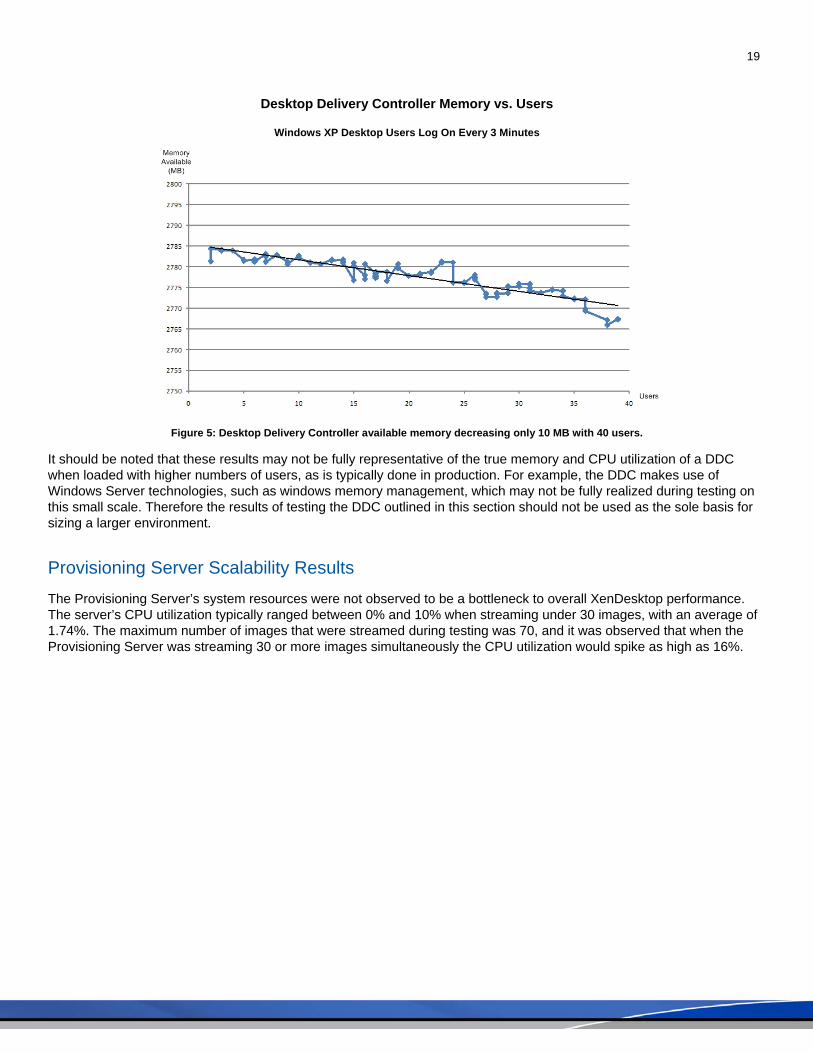
Desktop Delivery Controller Memory vs. Users
Windows XP Desktop Users Log On Every 3 Minutes
Figure 5: Desktop Delivery Controller available memory decreasing only 10 MB with 40 users.
It should be noted that these results may not be fully representative of the true memory and CPU utilization of a DDC when loaded with higher numbers of users, as is typically done in production. For example, the DDC makes use of Windows Server technologies, such as windows memory management, which may not be fully realized during testing on this small scale. Therefore the results of testing the DDC outlined in this section should not be used as the sole basis for sizing a larger environment.
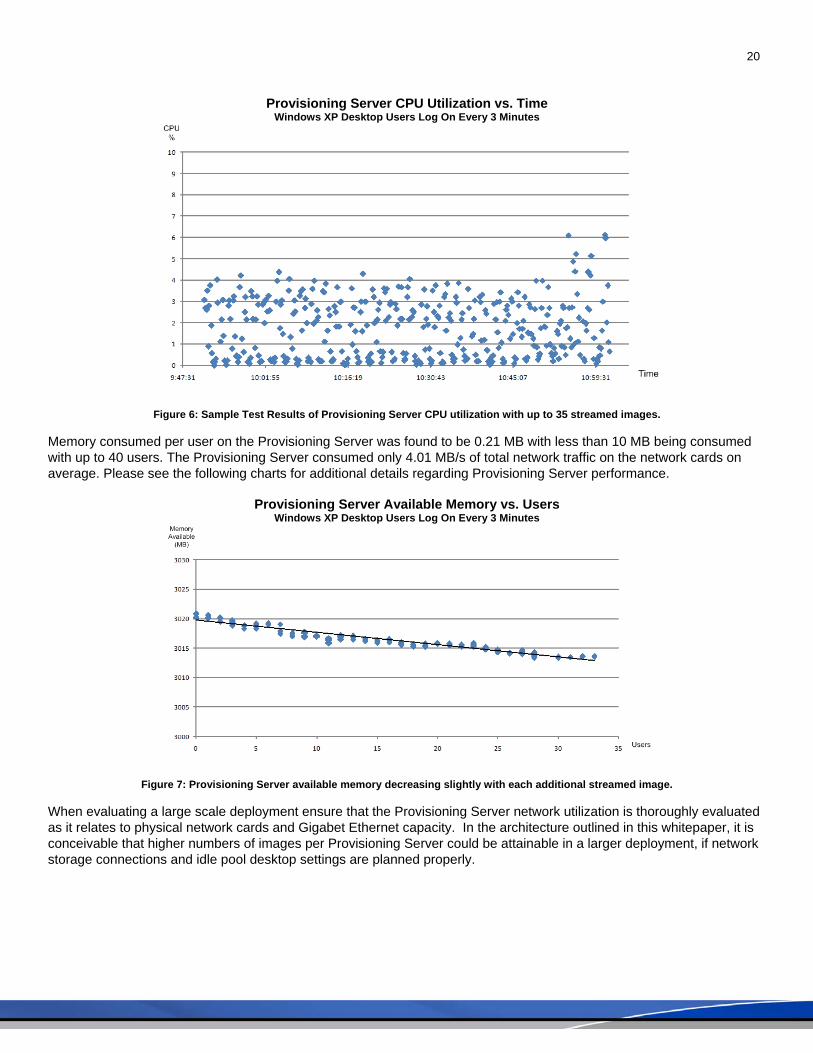
Provisioning Server Scalability Results The Provisioning Server’s system resources were not observed to be a bottleneck to overall XenDesktop performance. The server’s CPU utilization typically ranged between 0% and 10% when streaming under 30 images, with an average of 1.74%. The maximum number of images that were streamed during testing was 70, and it was observed that when the Provisioning Server was streaming 30 or more images simultaneously the CPU utilization would spike as high as 16%.
20
Provisioning Server CPU Utilization vs. Time Windows XP Desktop Users Log On Every 3 Minutes
Figure 6: Sample Test Results of Provisioning Server CPU utilization with up to 35 streamed images.
Memory consumed per user on the Provisioning Server was found to be 0.21 MB with less than 10 MB being consumed with up to 40 users. The Provisioning Server consumed only 4.01 MB/s of total network traffic on the network cards on average. Please see the following charts for additional details regarding Provisioning Server performance.
Provisioning Server Available Memory vs. Users Windows XP Desktop Users Log On Every 3 Minutes
Figure 7: Provisioning Server available memory decreasing slightly with each additional streamed image.
When evaluating a large scale deployment ensure that the Provisioning Server network utilization is thoroughly evaluated as it relates to physical network cards and Gigabet Ethernet capacity. In the architecture outlined in this whitepaper, it is conceivable that higher numbers of images per Provisioning Server could be attainable in a larger deployment, if network storage connections and idle pool desktop settings are planned properly.
21
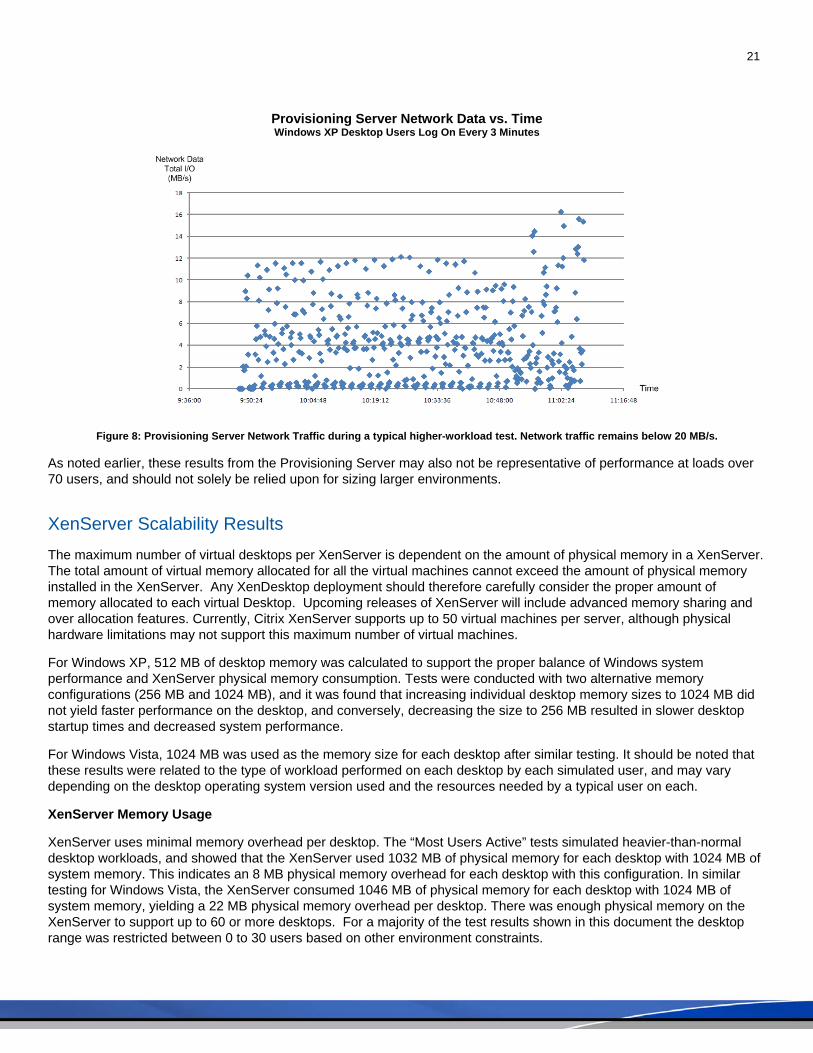
Provisioning Server Network Data vs. Time Windows XP Desktop Users Log On Every 3 Minutes
Figure 8: Provisioning Server Network Traffic during a typical higher-workload test. Network traffic remains below 20 MB/s.
As noted earlier, these results from the Provisioning Server may also not be representative of performance at loads over 70 users, and should not solely be relied upon for sizing larger environments.
XenServer Scalability Results The maximum number of virtual desktops per XenServer is dependent on the amount of physical memory in a XenServer. The total amount of virtual memory allocated for all the virtual machines cannot exceed the amount of physical memory installed in the XenServer. Any XenDesktop deployment should therefore carefully consider the proper amount of memory allocated to each virtual Desktop. Upcoming releases of XenServer will include advanced memory sharing and over allocation features. Currently, Citrix XenServer supports up to 50 virtual machines per server, although physical hardware limitations may not support this maximum number of virtual machines.
For Windows XP, 512 MB of desktop memory was calculated to support the proper balance of Windows system performance and XenServer physical memory consumption. Tests were conducted with two alternative memory configurations (256 MB and 1024 MB), and it was found that increasing individual desktop memory sizes to 1024 MB did not yield faster performance on the desktop, and conversely, decreasing the size to 256 MB resulted in slower desktop startup times and decreased system performance.
For Windows Vista, 1024 MB was used as the memory size for each desktop after similar testing. It should be noted that these results were related to the type of workload performed on each desktop by each simulated user, and may vary depending on the desktop operating system version used and the resources needed by a typical user on each.
XenServer Memory Usage
XenServer uses minimal memory overhead per desktop. The “Most Users Active” tests simulated heavier-than-normal desktop workloads, and showed that the XenServer used 1032 MB of physical memory for each desktop with 1024 MB of system memory. This indicates an 8 MB physical memory overhead for each desktop with this configuration. In similar testing for Windows Vista, the XenServer consumed 1046 MB of physical memory for each desktop with 1024 MB of system memory, yielding a 22 MB physical memory overhead per desktop. There was enough physical memory on the XenServer to support up to 60 or more desktops. For a majority of the test results shown in this document the desktop range was restricted between 0 to 30 users based on other environment constraints.
22
XenServer Network Utilization
XenServer network usage was monitored continually during testing. Average total network usage did not typically exceed 10 MBytes/sec, however brief 2-5 second spikes in network traffic were seen to reach as high as 490 MBytes/sec. Such network spikes did not noticeably impact desktop performance or decrease user experience. Also, network traffic did not increase significantly as additional desktops were powered-on and in-use.
XenServer CPU Utilization
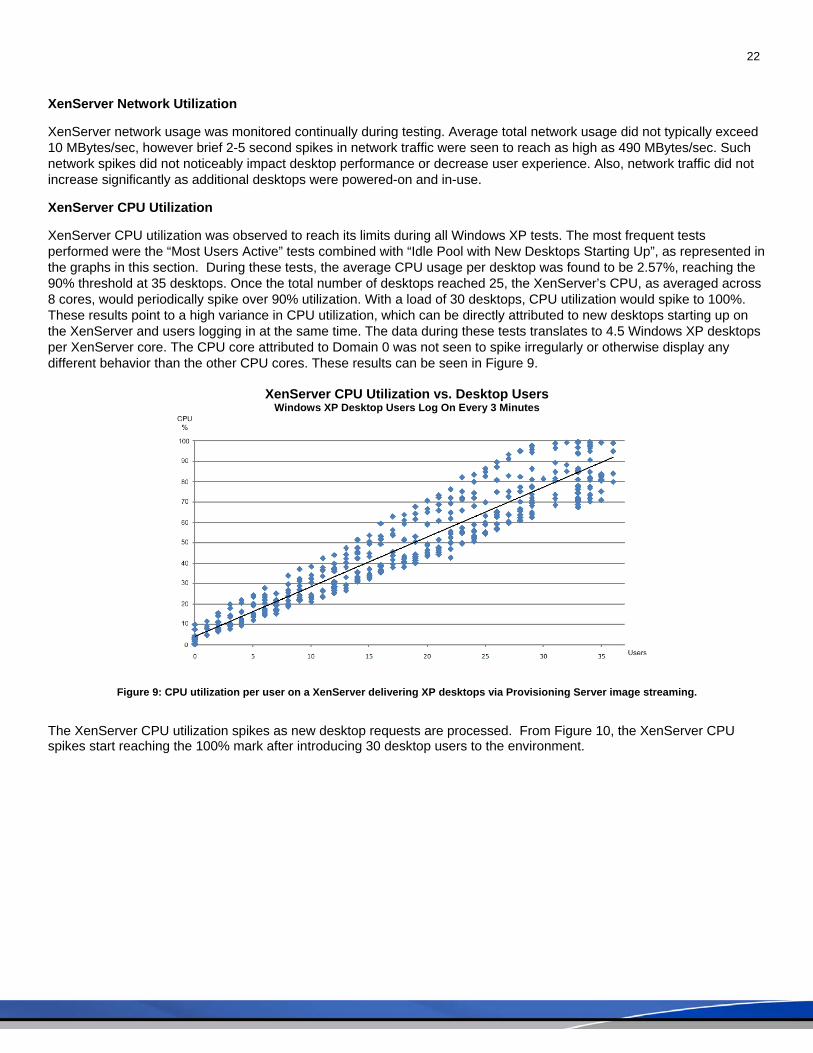
XenServer CPU utilization was observed to reach its limits during all Windows XP tests. The most frequent tests performed were the “Most Users Active” tests combined with “Idle Pool with New Desktops Starting Up”, as represented in the graphs in this section. During these tests, the average CPU usage per desktop was found to be 2.57%, reaching the 90% threshold at 35 desktops. Once the total number of desktops reached 25, the XenServer’s CPU, as averaged across 8 cores, would periodically spike over 90% utilization. With a load of 30 desktops, CPU utilization would spike to 100%. These results point to a high variance in CPU utilization, which can be directly attributed to new desktops starting up on the XenServer and users logging in at the same time. The data during these tests translates to 4.5 Windows XP desktops per XenServer core. The CPU core attributed to Domain 0 was not seen to spike irregularly or otherwise display any different behavior than the other CPU cores. These results can be seen in Figure 9.
XenServer CPU Utilization vs. Desktop Users Windows XP Desktop Users Log On Every 3 Minutes
Figure 9: CPU utilization per user on a XenServer delivering XP desktops via Provisioning Server image streaming.
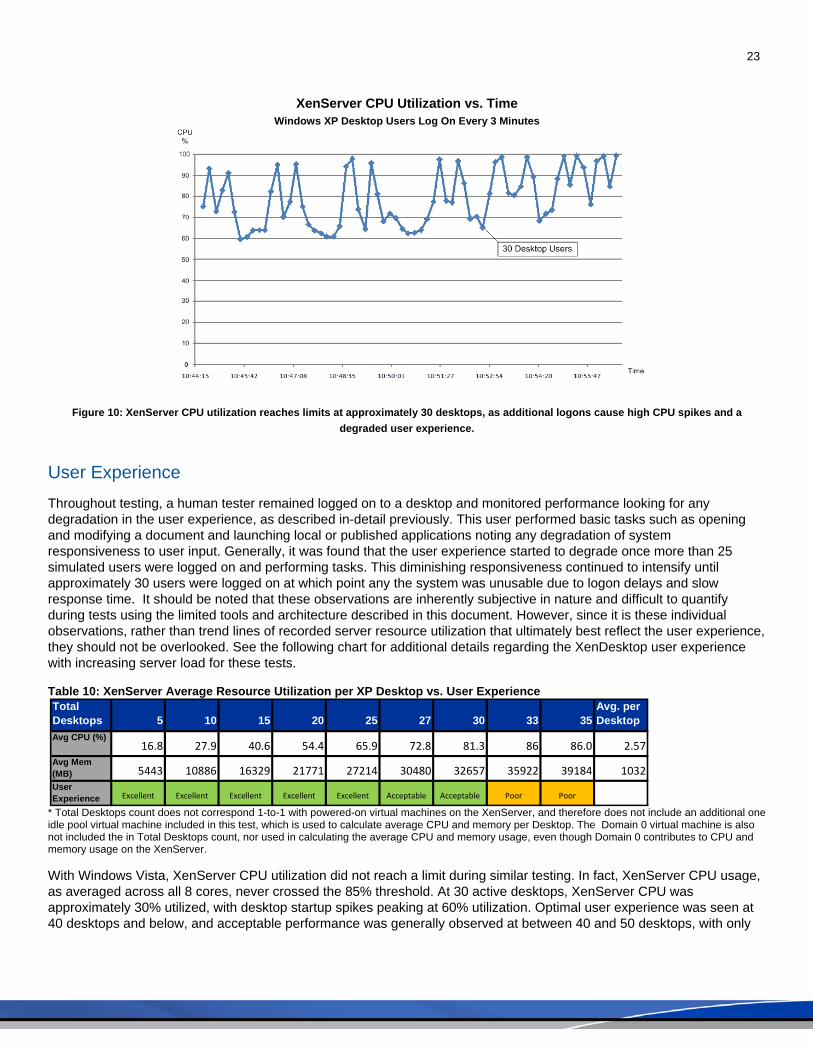
The XenServer CPU utilization spikes as new desktop requests are processed. From Figure 10, the XenServer CPU spikes start reaching the 100% mark after introducing 30 desktop users to the environment.
23
XenServer CPU Utilization vs. Time Windows XP Desktop Users Log On Every 3 Minutes
Figure 10: XenServer CPU utilization reaches limits at approximately 30 desktops, as additional logons cause high CPU spikes and a degraded user experience.
User Experience Throughout testing, a human tester remained logged on to a desktop and monitored performance looking for any degradation in the user experience, as described in-detail previously. This user performed basic tasks such as opening and modifying a document and launching local or published applications noting any degradation of system responsiveness to user input. Generally, it was found that the user experience started to degrade once more than 25 simulated users were logged on and performing tasks. This diminishing responsiveness continued to intensify until approximately 30 users were logged on at which point any the system was unusable due to logon delays and slow response time. It should be noted that these observations are inherently subjective in nature and difficult to quantify during tests using the limited tools and architecture described in this document. However, since it is these individual observations, rather than trend lines of recorded server resource utilization that ultimately best reflect the user experience, they should not be overlooked. See the following chart for additional details regarding the XenDesktop user experience with increasing server load for these tests.
Table 10: XenServer Average Resource Utilization per XP Desktop vs. User Experience
* Total Desktops count does not correspond 1-to-1 with powered-on virtual machines on the XenServer, and therefore does not include an additional one idle pool virtual machine included in this test, which is used to calculate average CPU and memory per Desktop. The Domain 0 virtual machine is also not included the in Total Desktops count, nor used in calculating the average CPU and memory usage, even though Domain 0 contributes to CPU and memory usage on the XenServer.
With Windows Vista, XenServer CPU utilization did not reach a limit during similar testing. In fact, XenServer CPU usage, as averaged across all 8 cores, never crossed the 85% threshold. At 30 active desktops, XenServer CPU was approximately 30% utilized, with desktop startup spikes peaking at 60% utilization. Optimal user experience was seen at 40 desktops and below, and acceptable performance was generally observed at between 40 and 50 desktops, with only
Total Desktops 5 10 15 20 25 27 30 33 35
Avg. per Desktop
Avg CPU (%)16.8 27.9 40.6 54.4 65.9 72.8 81.3 86 86.0 2.57
Avg Mem (MB) 5443 10886 16329 21771 27214 30480 32657 35922 39184 1032User Experience Excellent Excellent Excellent Excellent Excellent Acceptable Acceptable Poor Poor
24
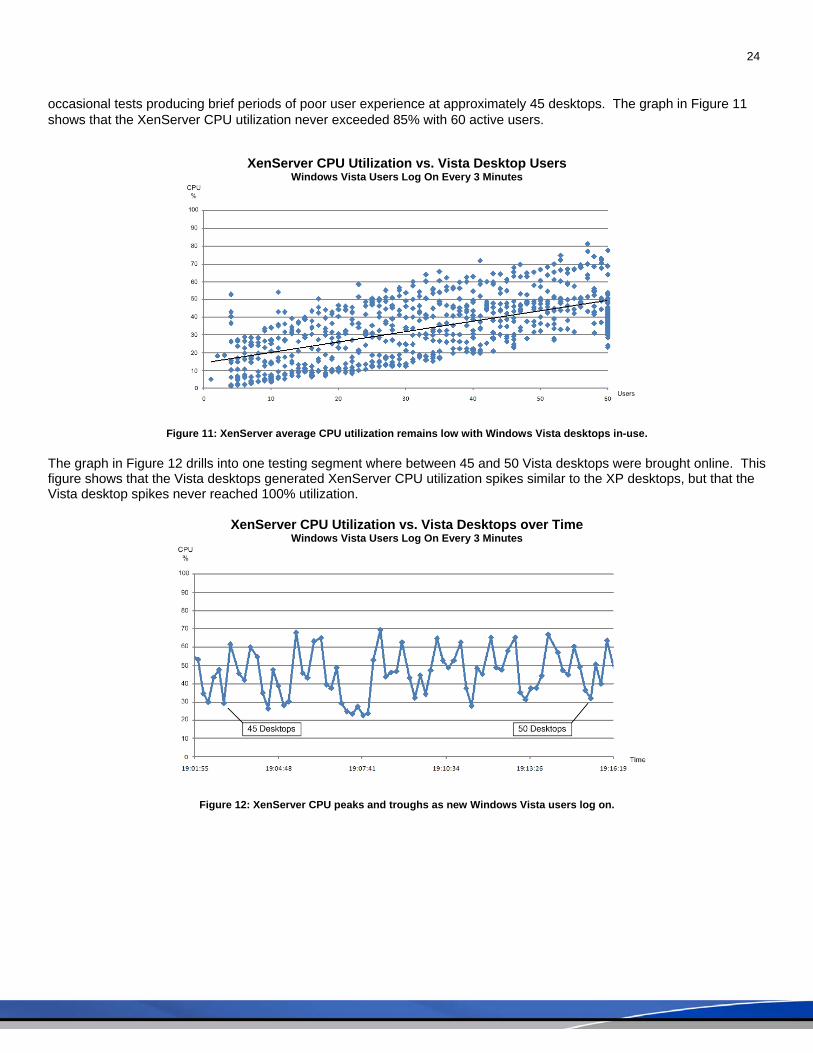
occasional tests producing brief periods of poor user experience at approximately 45 desktops. The graph in Figure 11 shows that the XenServer CPU utilization never exceeded 85% with 60 active users.
XenServer CPU Utilization vs. Vista Desktop Users
Windows Vista Users Log On Every 3 Minutes
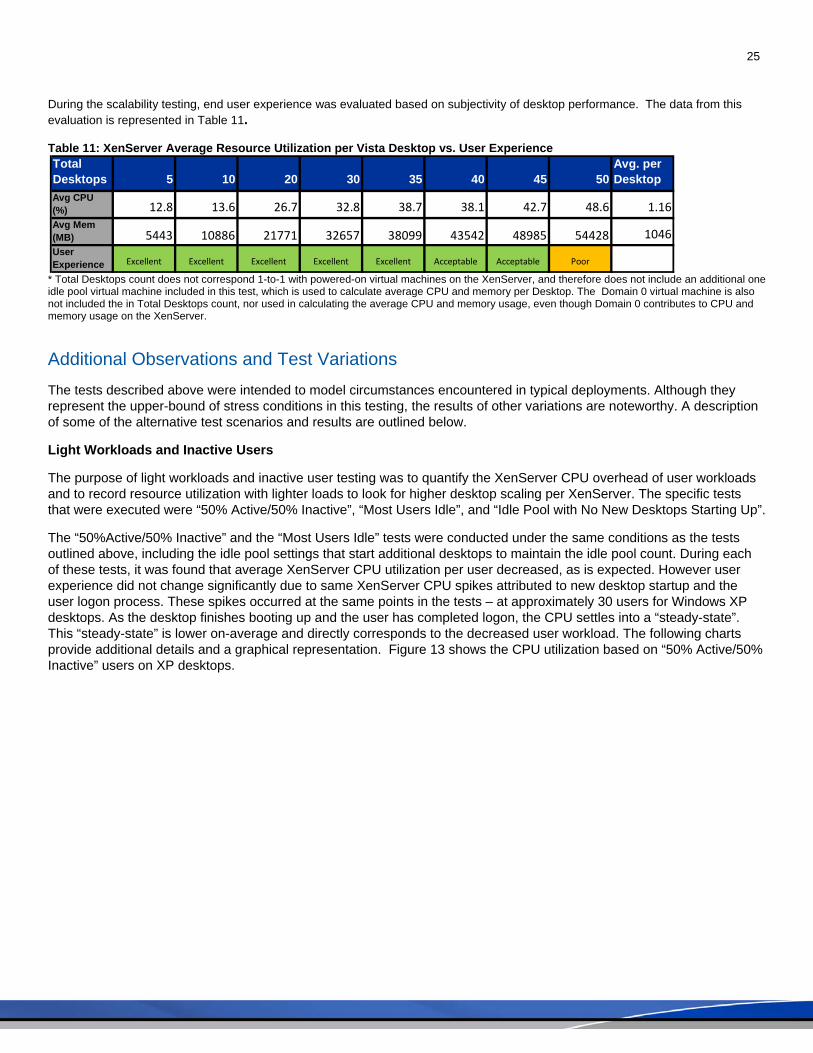
Figure 11: XenServer average CPU utilization remains low with Windows Vista desktops in-use. The graph in Figure 12 drills into one testing segment where between 45 and 50 Vista desktops were brought online. This figure shows that the Vista desktops generated XenServer CPU utilization spikes similar to the XP desktops, but that the Vista desktop spikes never reached 100% utilization.
XenServer CPU Utilization vs. Vista Desktops over Time Windows Vista Users Log On Every 3 Minutes
Figure 12: XenServer CPU peaks and troughs as new Windows Vista users log on.
25
During the scalability testing, end user experience was evaluated based on subjectivity of desktop performance. The data from this evaluation is represented in Table 11.
Table 11: XenServer Average Resource Utilization per Vista Desktop vs. User Experience
* Total Desktops count does not correspond 1-to-1 with powered-on virtual machines on the XenServer, and therefore does not include an additional one idle pool virtual machine included in this test, which is used to calculate average CPU and memory per Desktop. The Domain 0 virtual machine is also not included the in Total Desktops count, nor used in calculating the average CPU and memory usage, even though Domain 0 contributes to CPU and memory usage on the XenServer.
Additional Observations and Test Variations The tests described above were intended to model circumstances encountered in typical deployments. Although they represent the upper-bound of stress conditions in this testing, the results of other variations are noteworthy. A description of some of the alternative test scenarios and results are outlined below.
Light Workloads and Inactive Users
The purpose of light workloads and inactive user testing was to quantify the XenServer CPU overhead of user workloads and to record resource utilization with lighter loads to look for higher desktop scaling per XenServer. The specific tests that were executed were “50% Active/50% Inactive”, “Most Users Idle”, and “Idle Pool with No New Desktops Starting Up”.
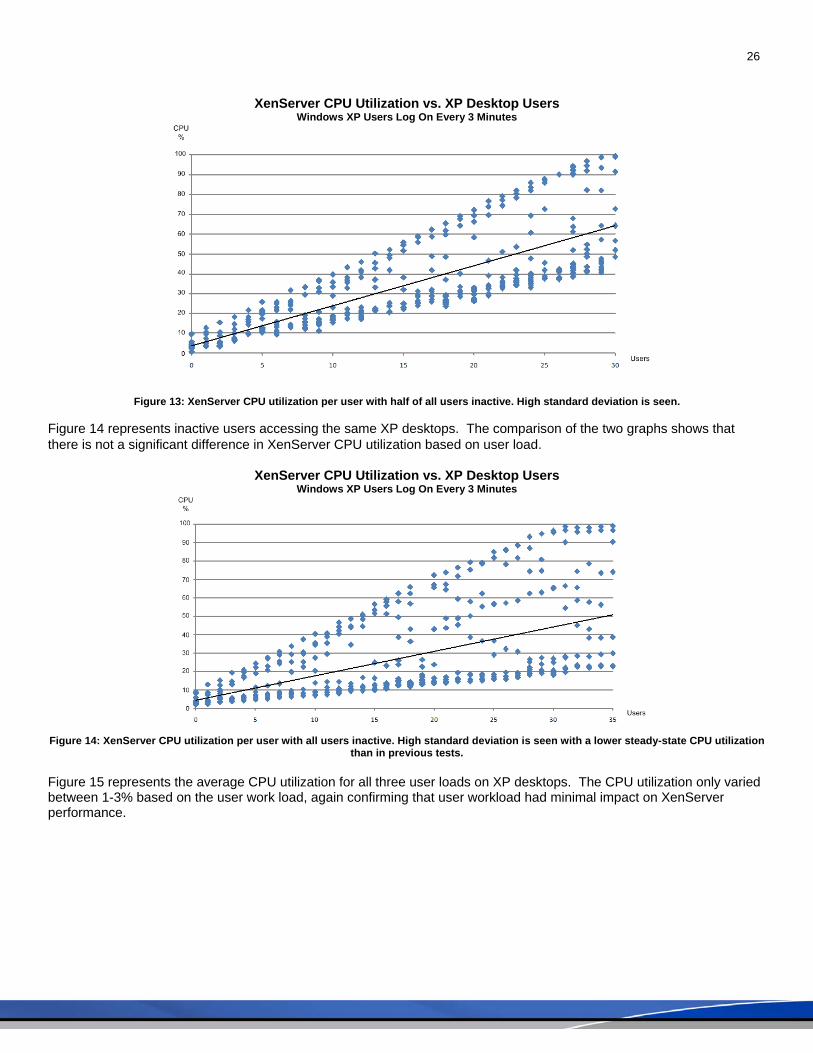
The “50%Active/50% Inactive” and the “Most Users Idle” tests were conducted under the same conditions as the tests outlined above, including the idle pool settings that start additional desktops to maintain the idle pool count. During each of these tests, it was found that average XenServer CPU utilization per user decreased, as is expected. However user experience did not change significantly due to same XenServer CPU spikes attributed to new desktop startup and the user logon process. These spikes occurred at the same points in the tests – at approximately 30 users for Windows XP desktops. As the desktop finishes booting up and the user has completed logon, the CPU settles into a “steady-state”. This “steady-state” is lower on-average and directly corresponds to the decreased user workload. The following charts provide additional details and a graphical representation. Figure 13 shows the CPU utilization based on “50% Active/50% Inactive” users on XP desktops.
Total Desktops 5 10 20 30 35 40 45 50
Avg. per Desktop
Avg CPU (%) 12.8 13.6 26.7 32.8 38.7 38.1 42.7 48.6 1.16Avg Mem (MB) 5443 10886 21771 32657 38099 43542 48985 54428 1046User Experience Excellent Excellent Excellent Excellent Excellent Acceptable Acceptable Poor
26
XenServer CPU Utilization vs. XP Desktop Users Windows XP Users Log On Every 3 Minutes
Figure 13: XenServer CPU utilization per user with half of all users inactive. High standard deviation is seen.
Figure 14 represents inactive users accessing the same XP desktops. The comparison of the two graphs shows that there is not a significant difference in XenServer CPU utilization based on user load.
XenServer CPU Utilization vs. XP Desktop Users Windows XP Users Log On Every 3 Minutes
Figure 14: XenServer CPU utilization per user with all users inactive. High standard deviation is seen with a lower steady-state CPU utilization
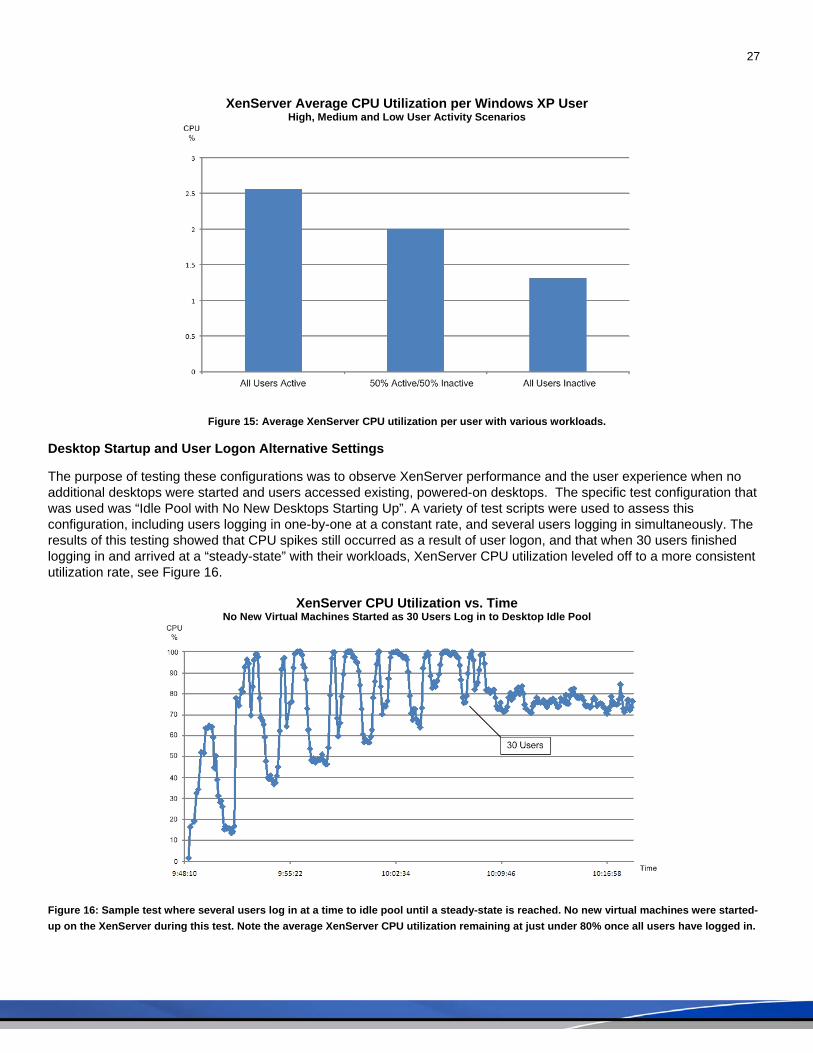
than in previous tests. Figure 15 represents the average CPU utilization for all three user loads on XP desktops. The CPU utilization only varied between 1-3% based on the user work load, again confirming that user workload had minimal impact on XenServer performance.
27
XenServer Average CPU Utilization per Windows XP User High, Medium and Low User Activity Scenarios
Figure 15: Average XenServer CPU utilization per user with various workloads.
Desktop Startup and User Logon Alternative Settings
The purpose of testing these configurations was to observe XenServer performance and the user experience when no additional desktops were started and users accessed existing, powered-on desktops. The specific test configuration that was used was “Idle Pool with No New Desktops Starting Up”. A variety of test scripts were used to assess this configuration, including users logging in one-by-one at a constant rate, and several users logging in simultaneously. The results of this testing showed that CPU spikes still occurred as a result of user logon, and that when 30 users finished logging in and arrived at a “steady-state” with their workloads, XenServer CPU utilization leveled off to a more consistent utilization rate, see Figure 16.
XenServer CPU Utilization vs. Time
No New Virtual Machines Started as 30 Users Log in to Desktop Idle Pool
Figure 16: Sample test where several users log in at a time to idle pool until a steady-state is reached. No new virtual machines were started-up on the XenServer during this test. Note the average XenServer CPU utilization remaining at just under 80% once all users have logged in.
28
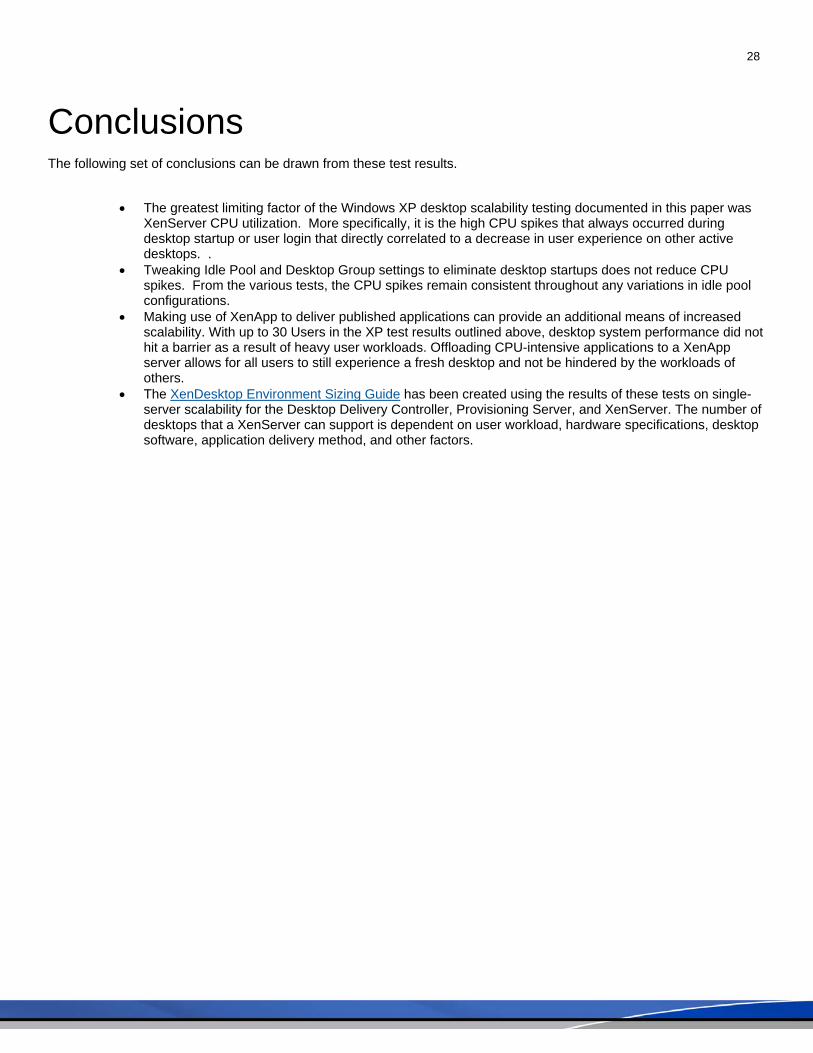
Conclusions The following set of conclusions can be drawn from these test results.
• The greatest limiting factor of the Windows XP desktop scalability testing documented in this paper was
XenServer CPU utilization. More specifically, it is the high CPU spikes that always occurred during desktop startup or user login that directly correlated to a decrease in user experience on other active desktops. .
• Tweaking Idle Pool and Desktop Group settings to eliminate desktop startups does not reduce CPU spikes. From the various tests, the CPU spikes remain consistent throughout any variations in idle pool configurations.
• Making use of XenApp to deliver published applications can provide an additional means of increased scalability. With up to 30 Users in the XP test results outlined above, desktop system performance did not hit a barrier as a result of heavy user workloads. Offloading CPU-intensive applications to a XenApp server allows for all users to still experience a fresh desktop and not be hindered by the workloads of others.
• The XenDesktop Environment Sizing Guide has been created using the results of these tests on single-server scalability for the Desktop Delivery Controller, Provisioning Server, and XenServer. The number of desktops that a XenServer can support is dependent on user workload, hardware specifications, desktop software, application delivery method, and other factors.
29
Notice
The information in this publication is subject to change without notice.
THIS PUBLICATION IS PROVIDED “AS IS” WITHOUT WARRANTIES OF ANY KIND, EXPRESS OR IMPLIED, INCLUDING ANY WARRANTIES OF MERCHANTABILITY, FITNESS FOR A PARTICULAR PURPOSE OR NON-INFRINGEMENT. CITRIX SYSTEMS, INC. (“CITRIX”), SHALL NOT BE LIABLE FOR TECHNICAL OR EDITORIAL ERRORS OR OMISSIONS CONTAINED HEREIN, NOR FOR DIRECT, INCIDENTAL, CONSEQUENTIAL OR ANY OTHER DAMAGES RESULTING FROM THE FURNISHING, PERFORMANCE, OR USE OF THIS PUBLICATION, EVEN IF CITRIX HAS BEEN ADVISED OF THE POSSIBILITY OF SUCH DAMAGES IN ADVANCE.
This publication contains information protected by copyright. Except for internal distribution, no part of this publication may be photocopied or reproduced in any form without prior written consent from Citrix.
The exclusive warranty for Citrix products, if any, is stated in the product documentation accompanying such products. Citrix does not warrant products other than its own.
Product names mentioned herein may be trademarks and/or registered trademarks of their respective companies.
Copyright © 2008 Citrix Systems, Inc., 851 West Cypress Creek Road, Ft. Lauderdale, Florida 33309-2009 U.S.A. All rights reserved.
Version History Author Version Change Log Date
Zachary Menegakis 0.1 Initial Draft 09/24/2008 Technical Readiness 0.2 Quality Assurance 10/20/2008 Consulting Solutions 1.0 Final Version 12/18/2008
851 West Cypress Creek Road Fort Lauderdale, FL 33309 954-267-3000 http://www.citrix.com
Copyright © 2008 Citrix Systems, Inc. All rights reserved. Citrix, the Citrix logo, Citrix ICA, Citrix Presentation Server, Citrix XenApp, and other
Citrix product names are trademarks of Citrix Systems, Inc. All other product names, company names, marks, logos, and symbols are trademarks
of their respective owners.