Embed Size (px)
Citation preview

A Case Study of Active, Continuous andPredictive Social Media Analytics for Smart City
Marco Balduini1, Stefano Bocconi2, Alessandro Bozzon2,Emanuele Della Valle1, Yi Huang3, Jasper Oosterman2, Themis Palpanas4, and
Mikalai Tsytsarau5
1 Politecnico di Milano - DEIB, Milano, Italy2 Delft University of Technology - WIS, Delft, the Netherlands
3 Siemens - Corporate Technology, Munich, Germany4 Paris Decartes University - Paris, France5 University of Trento - DISI, Trento, Italy
Abstract. Imagine you are in Milano for the Design Week. You havejust spent a couple of days attending few nice events in Brera district.Which of the other hundreds of events spread around in Milano shall youattend now? This paper presents a system able to recommend venues tothe visitors of such a city-scale event based on the digital footprintsthey left on Social Media. By combining deductive and inductive streamreasoning techniques with visitor-modeling functionality, this system se-mantically analyses and links visitors’ social network activities to pro-duce high-quality recommendations even when information about visi-tors’ preferences for venues and events is sparse.
Keywords: Social Media Analytics, User Modeling, Stream Reasoning,Link Prediction, Recommendation, User Engagement
1 Introduction
Thanks to the widespread adoption of smart phones, location-based Social Mediacapture an increasingly accurate and up-to-date digital reflection of our cities. Inparticular, they allow to observe a constantly reshaping network of people thatinteracts with places around the city, while talking about a variety of topics.
Being able to predict in real time changes in such a network is of major inter-est for many applications supporting multiple city stakeholders. Short-term pre-dictions may be of interest for tourists and citizens, while medium-term predic-tions may be useful for city-scale service managers. Tourists may receive preciseand timely recommendations to explore places of their interest while sightseeing.Citizens may be informed to avoid means of public transport that are predictedto be crowded. Bike-sharing managers may plan for the availability and the re-balancing of bikes in the stalls based on the predictions of people moving fromone neighbourhood to another.
To reach these goals, a system has to fulfil the following requirements:

R.1 build from one or more social media sources a network whose nodes representpeople, places and topics while edges represent the presence of people inplaces, and the interest of people in topics
R.2 track the evolution of such network in real time to detect changes, both interms of nodes in the graph and in terms of edges
R.3 predict the possible changes in the graph
R.4 use the prediction to address specific needs, such as resource planning
In a previous work [3], we proposed a Continuous Predictive Social MediaAnalytics (CP-SMA) solution that addressed the four requirements above. Thekey innovation of CP-SMA is its ability to predict the appearance of edges in thegraph when little or no training information about existing edges is available.
Such conditions are typical for city-scale events (CSE) like the Milano DesignWeek (MDW). Geographically limited to the city of Milano, the MDW featuredthousands of events attended by half a million visitors in half a thousand venuesthat serve as temporary exhibition centres. Large part of the visitors come fromabroad. The venues hosting the events are temporary. Even associations betweenvisitors and venues are not applicable across different editions of the event,because visitors, venues and events change every year.
CP-SMA was shown in the lab to accurately predict associations betweenvisitors of MDW 2013 and its venues after only 3 days of observations [3]. Inthis paper, we report a real-time case study of CP-SMA deployed for MDW 2014,in collaboration with fuorisalone.it6, with the purpose of recommending venuesto visitors who were detected to talk about MDW on Twitter. We evaluate thequality of the prediction by checking if the predicted associations are observedafter the prediction is made. Our evaluation provides evidence that visitor-venuelinks can be discovered with a good balance between precision and recall, andsentiment annotations can be added to micro-posts with good accuracy. Theevaluation also implicitly demonstrates the ability to build historical and event-related topical profiles of visitors by semantically analysing their social networkactivities.
The remainder of the paper is organised as follows. Section 2 presents thearchitecture of the solution deployed for MDW 2014. Section 3 illustrates themiddleware, which we used to connect the components. Section 4 addresses R.1and R.2, describing the solution used to identify visitors and to track the evo-lution of their associations with places (see also [4]). Section 5 describes thesolution used to address R.1 and R.2 with regards to discovering links betweenvisitors and topics. Section 6 details the robust machine learning based predic-tive model that addresses R.3 by predicting new visitor-venue links (see also [3]).Section 7 describes the strategy we adopted to engages visitors directly throughsocial media (addressing R.4). Section 8 briefly compares our contribution withrelated work. Finally, Section 9 discusses the results obtained and the lessonslearnt in this case study, concluding with future work.
6 Fuorisalone.it is the official Web portal of Milano Design Week.

2 Architecture
For this case study we designed a loosely-coupled architecture based on Stream-ing Linked Data principles [5] and provenance ontology [15], so that differentcomponents could communicate and scale independently from each other. Fig-ure 1 illustrates the architecture. The gray looping arrow illustrates the overallflow of information from Twitter, throughout the components of our solution andback to Twitter. The flow starts from the Twitter Streaming API7 that continu-ously sends to our Social Listener (SL) all the tweets posted from a given area (inthis case the Milano urban area), in order to detect visitor-venue links and themost active users. It loops back to the Twitter REST API8, from which the Vis-itor Modeller (VM) fetches more tweets of visitors in order to build their profiles.The data flow then goes through the Visitor-Venue Recommender (VVR), whichpredicts visitor-venues links, and it heads back to the REST API of Twitter thatis used by the Visitor Engager (VE) to send recommendations to visitors.
Fig. 1. The architecture of the Continuous and Predictive Social Media Analytics sys-tem used for the Smart City case study
More specifically, the SL component registers geo-bound queries in the Twit-ter Streaming API. This starts pushing to the SL tweets posted within thosegeographical areas. The SL analyzes the tweets, links those with positive senti-ment to the venues of the CSE, identifies the most active users and stores theresults in the Blackboard, using the APIs exposed by the Blackboard Mediator(BM). The Blackboard is the central component of our solution, which decou-ples in space and time the intercommunication of all our components. The VMperiodically looks up visitors recently recorded by the SL in the blackboard. Itsubsequently checks if such visitors have been previously observed and, if this is
7 https://dev.twitter.com/docs/api/streaming8 https://dev.twitter.com/docs/api/1.1

not the case, it fetches all their tweets from the Twitter REST API. This compo-nent then extracts the semantic entities (from DBpedia) contained in each tweet,computes a profile of the user as weighted links between visitors and entities, andadds this profile to the Blackboard. The profile is periodically updated with themost recent tweets and added to the Blackboard. The VVR periodically fetchesthe most recent visitor-venue links and visitor profiles from the Blackboard. Thenfor each visitor, the VVR predicts the top 10 most probable visitor-venue linksnot previously observed and adds them to the Blackboard. The VE periodicallylooks up the most recently predicted links and use them as recommendations foreach visitor. If a recommendation concerns a visitor that has not received anymessage yet, the VE invites through Twitter such a visitor to follow its Twitteraccount. If the visitor is already a follower, the VE sends them a Direct Messagewith the computed recommendations.
3 Blackboard and Blackboard Mediator
The heterogeneity of the components and of the data they produce requires anintegration middleware
These requirements can be addressed by a blackboard-based communicationapproach [17]: a flexible communication model that does not require any priorrestriction on who can place what information on the blackboard and whenthey do so. RDF represents a suitable data model to be used with blackboardssince it poses no restriction on the type of information that can be exchanged.Additionally, the PROV ontology [15] offers an adequate vocabulary to trackwho produces the information and when. The Streaming Linked Data Format,proposed in a previous work [4], can be used to deal with data that is produced bydistributed components, and changes frequently over time. This format has twomain elements: the graphs that are continuously published by the components(named instantaneous graphs or, shortly, iGraphs), and the tracking RDF graphs(called stream graph or, shortly, sGraph) that associate each graph producedwith a timestamp and the component that produced it.
Our Blackboard is built on Jena TDB (as RDF triple store), Jena Fuseki(as SPARQL server for querying, updating and managing RDF graphs overHTTP protocol) and a Java API (namely Blackboard Mediator) that hides thecomplexity to invoke Fuseki and provides a single access point to the blackboard.
The Blackboard Mediator (BM) abstracts the communication between thecomponents and the blackboard by offering a Java API to the data producers.The three main methods are: add new graph, retrieve the list of graphs insertedin a given time period by a given agent (i.e. the component), and fetch a graph.In particular, the BM exposes a service to add a new iGraph g by encapsulatingtwo steps: 1) the creation of a tracking sGraph for g in the default graph, and2) the insertion of g. The unique identifier of g consists of the base URI, theagent and the arrival timestamp. The uniqueness of the agent-timestamp pair isenforced by the API.

Fig. 2. Results of the evaluation on the blackboard
The listing below presents an example of a sGraph tracking an iGraph. TheURI at line 1 presents the unique name of the graph inserted in the Blackboard,bbm is the base URI, sl represents the creator agent and finally 1397128512109
represents the creation timestamp of the new entity. In our implementation of theblackboard we assign a different name to each agent: SL for the Social Listener,VM for the Visitor Modeler and VVR for the Visitor-Venue Recommender. Theproperties generatedAtTime and wasAttributedTo at lines 3 and 4 are partof the PROV ontology to track the creator and the creation time of each newentity in the blackboard. The properties at lines 3 and 4 allow to query forgraphs inserted in a given time period by a given agent.
1 bbm:sl /13971285121092 a prov :Ent i ty ;3 prov:generatedAtTime ”2014−04−10T13:15:12Z ”ˆˆ xsd:dateTime ;4 prov:wasAttr ibutedTo bbm:sl .
We ran two different evaluation experiments accessing the blackboard usingthe BM component. The first experiment measured the time needed to randomlyaccess a single graph by URI, varying the number of iGraphs in the blackboard.The second one measured the time for retrieving the list of iGraphs in three dif-ferent time windows (3 minutes, 30 minutes and 180 minutes wide, respectively)varying the number of iGraphs in the blackboard.
As illustrated in Figure 2The efficacy of the blackboard mediator as an in-tegration middleware is empirically demonstrated by this evaluation. The lineargrowth of the access time with the amount of iGraph is not problematic becausein our system iGraphs can be deleted from the blackboard when they are olderthan a predefined threshold, thus preventing an infinite growth.
4 Social Listener
The SL is the container of a pipeline of components devoted to collecting, trans-lating, decorating and analysing a generic data stream from social sources (seeFigure 3). It addresses Requirements R.1 and R.2.

Fig. 3. The diagram of the Social Listener
The Twitter Adapter represents the entry point of the pipeline, it establishesa connection with the Twitter Streaming API to collect the raw tweets andto transform them in a structured data format, using RDF as a common datamodel. The structured representation of a single tweet include the hashtags, theURLs, the creator, etc. in a structured way that eases the operations in theblocks downstream.
The next element in the pipeline is the CSE Entities Decorator. This com-ponent links tweets to venues of the CSE. It uses an aggregation of four lexicalsimilarity metrics that compares content and hashtags of each tweet to the namesof the venues and the titles of the events hosted in each venue (thus also exploit-ing the semantic relationship between venues and events). As shown in the tablebelow, the manual assessment of the correctness of the discovered links providesexperimental evidence of the effectiveness of our CSE Entities Decorator.
Type of Link Number of Links CorrectnessVisitor-Venue 761 72%Visitor-CSE 3723 94%
The decoration phase is concluded by the Sentiment Decorator [21] that addsthe sentiment information to the tweet. It relies on a dictionary-based classifi-cation method, and applies the same processing for tweets written in Englishand in Italian. More specifically, our method uses English and Italian sentimentdictionaries derived from SentiWordNet [12] and MultiWordNet [19] semanticlexicons, where words are attributed with positive, negative and objective scores.These scores are combined into a single sentiment score for each tweet, by con-sidering negation and modifier keywords, and also taking into account positiveand negative emoticons. Still, some sentiments (e.g., sarcasms, idioms) requiremore robust methods, which go beyond pattern-based analysis. Nevertheless, weargue that such complex sentiment expressions are rarely encountered in tweetsmentioning venues, making our method useful for its purposes.
To evaluate the performance of our method, we selected 222 unique tweetsfrom MDW dataset, and asked two human experts to label their opinion po-larities, obtaining 187 tweets with verified annotations. The annotated subset

contained approximately equal amounts of positive, negative and objective (neu-tral) tweets, making the baseline classifier accuracy 0.37, when labeling all tweetsas objective. We compared our method using various dictionaries, and also in-cluded the results obtained by SentiStrength [20] method for English, howeverequipped with Italian dictionaries (provided by the authors). The results of ourexperiments are reported in the table below, where we measured the overall clas-sification accuracy, and the recall for individual classes, while utilizing polaritythresholds that yield the best accuracy.
Approach Accuracy Recall Pos. Recall Neg. Recall Obj.Baseline 0.37 0.00 0.00 1.00IT SentiStrength 0.52 0.50 0.25 0.77IT Only 0.58 0.34 0.51 0.87IT + EN 0.66 0.55 0.63 0.78IT + EN + Stem 0.67 0.59 0.73 0.68
Accordingly, the best performance is reached when our method utilizes bothEnglish and Italian sentiment dictionaries together with stemming. The accu-racy in this case reaches 0.67, being 30% above the baseline and 15% above Sen-tiStrength. What is more important, our method reached 0.73 for the recall ofnegative sentiments, reducing their misclassification as talksAboutPositively
relation, which is of the main interest for the venue recommender.In the Analyze phase two different continuous queries are performed over
the decorated data: the first one extracts the visitor-venue links for the VVRcomponent and the second one extracts the visitor ids for the VM component.Sentiment plays an important role in this phase, only the tweets with a pos-itive sentiment are passed to the VVR and VM components. In this way therecommendation and the visitor analysis is performed only on satisfied visitors
5 Visitor Modeller
The VM performs monitoring and profiling of visitors based on their social me-dia activities. The VM monitors selected visitors (the visitors that have beendetected by the SL) by crawling their social media posts, and subsequently anal-yses them with different techniques to obtain a profile. It complements the SLin addressing Requirements R.1 and R.2.
The VM is composed by the following modules (see also Figure 4): a Front-endthat reads visitor ids from the blackboard; a Scheduler that schedules the analysisof the ids; a Crawler that crawls visitors’ tweets; an Analyzer that extracts entitiesfrom the tweets; and a Profiler that generates a profile for each visitor.
To guarantee high scalability, all components (except for the Profiler) havebeen designed to be replicable, and connected by a load balancing mechanism im-plemented by a message queuing sub-system9. Once a visitor id has been read bythe Front-end and scheduled for analysis by the Scheduler, the Crawler collects allvisitor’s tweets, using Twitter’s public REST APIs. The Analyser then extractsthe entities contained in the tweets. For example, from the tweet “Temperley
9 We use ActiveMQ http://activemq.apache.org/

Fig. 4. The architecture of the Visitor Modeller. White modules represent its com-ponents, grey modules indicate other components described in the paper, while bluemodules indicate existing services and software.
London at London Fashion Week Spring 2014 http://t.co/mXFdvmCWXR”, theVM detects that London Fashion Week refers to the entity http://dbpedia.
org/resource/London_Fashion_Week.
The Analyser can use different Named Entity (NE) extractors. For this casestudy we used the probabilistic version of DBpedia-Spotlight10. This tool ana-lyses the text by “spotting” possible candidates for entities, and disambiguatingeach candidate. NE tools usually provide also some values related to the likeli-hood that the result is correct. In Spotlight’s case, this is not really a confidencevalue, but more an indication of how well the entity was disambiguated fromalternative entities in DBpedia; the candidate could still be wrongly spotted (e.g. not be an entity). In particular, Spotlight provides two values for each foundentities: assuming that there is an entity in the text, how likely this is the entityranked first by Spotlight, normalized with respect to all possible entities (thesimilarityScore), and how likely the second ranked entity is with respect to thefirst ranked one (the percentageOfSecondRank).
The Analyser filters extracted entities below a certain threshold. To obtaina single value from Spotlight, we adopted the following score for each entity:(1− 0.5 ∗ percentageofsecondrank) ∗ similarityscore, the rationale being thatif an entity is very likely (similarityscore=1) but a second one is equally likely,both score 0.5. Since we observed that almost 80% of the entities had a score≥ 0.9, we filtered out entities with lower score to have relatively high qualitywithout losing too much in recall (1.090.237 entities were left).
To evaluate the quality of the extraction, we estimated the proportion ofentities correctly extracted by manually verifying their presence in the tweets.In total we extracted 1.090.237 entities from 1.879.187 tweets. We sampled theentities extracted to estimate the proportion p of correct entities. Consideringthat such a proportion follows a binomial distribution that for large populationcan be approximated by a normal distribution, we used Wald’s method to es-tablish the sample size given the confidence interval conf and the error rangeerr, such as that for the real estimate p we have that p ∈ (p − err, p + err) in
10 https://github.com/dbpedia-spotlight/dbpedia-spotlight/wiki

conf% of the times:
n =qnorm(conf)2p(1 − p)
err2(1)
where qnorm is the quantile function of the normal distribution. We choseerr=0.025 (i. e. 2.5%) and conf=95%. From an initial exploratory evaluation withsample size of 300 entities we obtained an initial estimate for p to be around0.74, which gives a sample size of 833. We therefore sampled (with replacement)the data set and carried out the evaluation presented in the table below.
Entities Samples Correct Precision Range Sup Range Inf Confidence1090237 833 615 73.83% 71.33% 76.33% 95.00%
To be noted that this evaluation only measures the precision of the extraction,and not the recall. Evaluating recall on our data set is much harder since itrequires the evaluator to define the set of the entities that are contained in atweet, while verifying that an entity is contained in a tweet is much easier.
Finally, the Profiler creates a visitor profile. For each visitor the Profiler buildsboth an historical and an event profile. Historical profiles are based on tweetsposted before the monitored event, while event profiles are based on tweetsduring the event. A visitor profile is defined as a set of pairs (e, w(u, e)), where eis an entity and w(u, e) is the weight of e in u’s profile. Initially our strategy hasbeen to select the most common entities (we set the limit at max 10 entities)for each visitor and weighting them based on the number of occurrences. We areplanning to evaluate alternative strategies, such as filtering out entities that arenot discriminative (e. g. because they are too common, such as Milano), and usethe class of entities to have more overlapping among visitor profiles.
6 Visitor-Venue Recommender
This section addresses the requirement R.3: predict the possible changes in thegraph (see Section 1). We briefly describe the component Visitor-Venue Recom-mender (VVR) and evaluate it on the MDW data.
The VVR predicts visitor-venue links that are very likely to occur in thefuture. A statistical machine learning approach named SUNS [14] is applied inthe VVR. SUNS can be viewed as a regularized matrix factorization approach11.This approach is robust with respect to sparsity of data and can incrementallyimprove predictions when more data become available. The regularization canreduce the model’s sensitivity to its parameters. The model of the VVR is trainedusing visitors’ profiles generated by the VM and visitor-venue links detectedby the SL. It is then applied to recommending venues that will be potentiallyvisited by visitors in the upcoming days. In the following updates, when newvisitor-venue links or new or updated visitors’ profiles are available, the model isretrained taking new information into account. This capability enables the VVRto cope with social media stream dynamics.
11 In recent years matrix factorization based approaches have been using in manyrecommendation systems, e.g. Netflix Prize

The evaluation of the VVR in this paper is focused on the capability ofcapturing changes of social media stream over time. During the MDW the VVRprocessed 842 unique links between 512 visitors and 198 venues. This data issummarized in the table below. It is important to clarify what the training datais and what the test data is. Considering the update on April 8th at 4pm, theVVR fetched from the Blackboard 105 new unique links and 65 new visitorswere observed. Until that time 100 visitors had 154 links associated with venuesthey talked about.12 This was the training data exploited at this update time.In subsequent updates until the end of MDW, 22 visitors had 42 more linksto venues. We evaluated the recommendations for those visitors by using theirfuture links as ground truth. The evaluation for all updates was carried out inthis way.
Update Time New Unique Links New Visitors Links to Predict User to Predict2014-04-08T04:00:00 49 35 10 62014-04-08T16:00:00 105 65 42 222014-04-09T04:00:00 49 30 54 272014-04-09T16:00:00 62 41 53 312014-04-10T04:00:00 62 33 46 272014-04-10T16:00:00 158 91 46 312014-04-11T04:00:00 49 24 33 232014-04-11T16:00:00 81 55 27 192014-04-12T04:00:00 23 17 26 192014-04-12T16:00:00 80 51 16 112014-04-13T04:00:00 50 31 16 92014-04-13T16:00:00 74 39 - -
sum 842 512 - -
In order to evaluate the quality of the predictions in the VVR, we comparedSUNS with random guessing (Random), Pearson correlation coefficient (Pearson)and most talked venues (MostTalked). Random assigns randomly a likelihood toevery venue not talked yet by a visitor; Pearson makes recommendations based onthe visitors’ similarity; and MostTalked encodes the popularity of venues in thecommunity observed by counting how frequent the venues were mentioned andrecommending the venues ordered by the frequency to all visitors. In addition, wecombined SUNS with MostTalked (SUNS+MostTalked), which intends to modelboth venue popularity and visitor preferences. The evaluation measures usedwere:
precision@topN = TruePositive/N and
recall@topN = TruePositive/(TruePositive + FalseNegative).
Figures 5 (a) and (b) show the recall@5 and @10 recommendations in 11updates from April 8th at 4am to April 13th at 4am, 2014. The random rank-ing failed in most cases to recommend correct venues. Pearson performed betterthan Random and its recall value increased slowly over time. The performance ofSUNS kept increasing too, especially in the last update. Surprisingly, MostTalkedoutperformed all other approaches and it was clearly overtaken by SUNS onlyin a few updates, when considering the top 5 recommendations. The combined
12 Note that a visitor can talk about the same venue several times and that we reporthere the distinct count.

(a) (b)
(c) (d)
Fig. 5. Precision and recall values at top 5 (a,c) and top 10 (b,d) at each update time
approach SUNS+MostTalked performed in most updates better than both ap-proaches. Figures 5 (c) and (d) show the precision@5 and @10 recommenda-tions. In contrast to the recall, the precision decreased against the top numberof recommendations and it was lower than the recall. That is because the av-erage number of the ground truth links per visitor is not greater than 2, i.e.TruePositive + FalseNegative <= 2 (see the right two columns in the tableabove), whereas precision is calculated by dividing the top number 5 resp. 10.
Our evaluation uncovered several interesting findings. First, the VVR reaches,on average for all visitors, recall over 20% at top 5 and more than 30% at top10 (applying SUNS+MostTalked). If we consider the fact that many events wereheld for several days at the same venue so that the venues which had been talkedby visitors in the past could be recommended again and again, the resulting VVRmodels performed fairly well. Second, in many updates, the more information

Fig. 6. Engagement process of Twitter users
is available, the higher quality of recommendations are provided. However, thisincrease is not observed at all updates. That is because the difficulty degree ofmaking recommendation does not only depend on the available data, but alsoon many other aspects in a particular update, such as the sparsity of the linksregarding the number of visitors and the number of venues and the communitystructure (e.g. active users, user clusters). Last, but not the least, the popularityof venues dominates the performance of the VVR. The visitor similarity, exploredby both SUNS and Pearson, did not contribute as much as it usually does in socialnetworks.
7 Visitor Engager
The purpose of the VE is to automatically contact relevant Twitter users andprovide them with the possibility to view and rate their personalized recom-mendations (addressing Requirement R.4). The VE is a Java enterprise ap-plication build on top of Errai framework and is publicly available at https:
//github.com/WISDelft/AttendeeEngager. It consists of four main compo-nents: 1) The Front-end consisting of an informative landing page of the VE anda personal dashboard, 2) The TwitterManager that handles sending of Twittermessages and monitoring of followers of the designated account, 3) The Recom-mendationManager which uses the Blackboard Mediator to retrieve recommenda-tions calculated by the VVR, and 4) The QueueManager which reliably handlesall communication between the components using the same underlying queuetechnology as for the Visitor Modeller.
The engagement process (see Figure 6) is started by receiving the Twitteruser IDs of new users, as detected by the Social Listener. Using the @fuorisa-lonetips Twitter account, which was officially supported by the organization, theVE sent each user only a welcome and (if necessary) a reminder message via aTweet mentioning the user, a so-called mention. The welcome mention lookedlike: @joosterman Welcome to #fuorisalone Milano Design Week <. . .>. If theuser started following the account, they would be considered opted-in and re-ceived the link to their personal dashboard. To minimize the amount of unso-licited tweets, we chose to send recommendations only to users who had activelyopted in. At any time a user could opt-out via the personal dashboard or stop fol-lowing the designated account to become opted-out, after which they would notreceive any further messages. Opted-in users received direct messages (a private
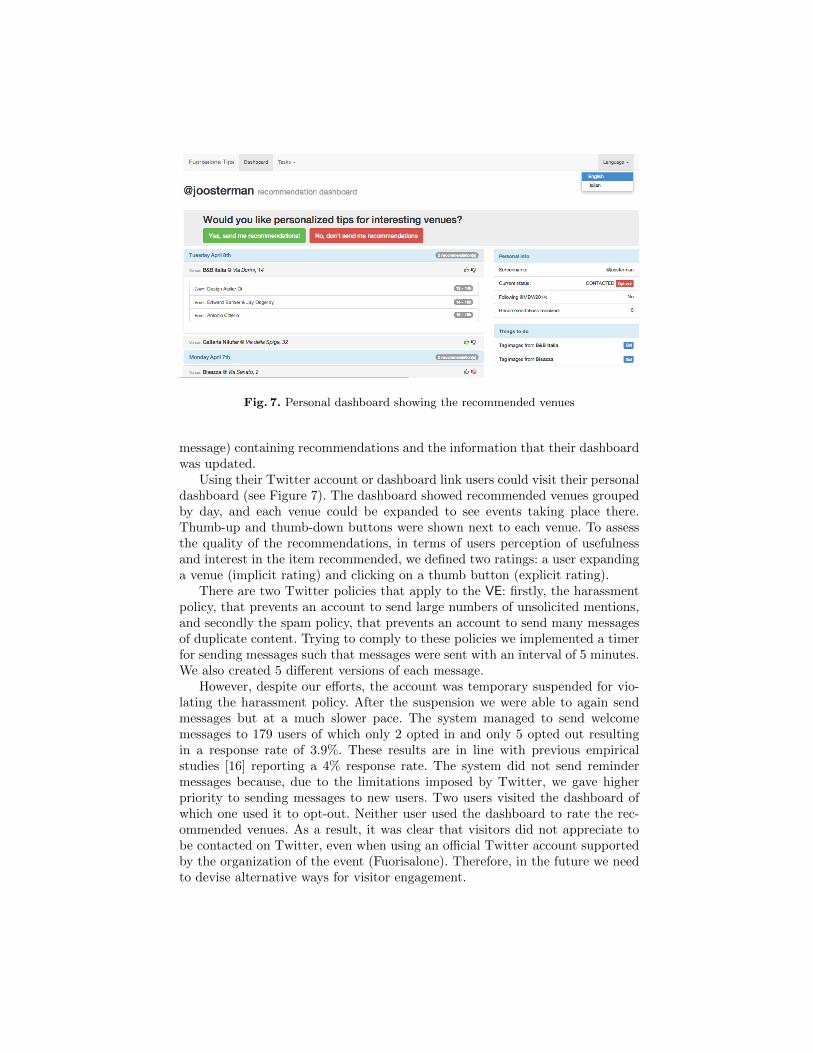
Fig. 7. Personal dashboard showing the recommended venues
message) containing recommendations and the information that their dashboardwas updated.
Using their Twitter account or dashboard link users could visit their personaldashboard (see Figure 7). The dashboard showed recommended venues groupedby day, and each venue could be expanded to see events taking place there.Thumb-up and thumb-down buttons were shown next to each venue. To assessthe quality of the recommendations, in terms of users perception of usefulnessand interest in the item recommended, we defined two ratings: a user expandinga venue (implicit rating) and clicking on a thumb button (explicit rating).
There are two Twitter policies that apply to the VE: firstly, the harassmentpolicy, that prevents an account to send large numbers of unsolicited mentions,and secondly the spam policy, that prevents an account to send many messagesof duplicate content. Trying to comply to these policies we implemented a timerfor sending messages such that messages were sent with an interval of 5 minutes.We also created 5 different versions of each message.
However, despite our efforts, the account was temporary suspended for vio-lating the harassment policy. After the suspension we were able to again sendmessages but at a much slower pace. The system managed to send welcomemessages to 179 users of which only 2 opted in and only 5 opted out resultingin a response rate of 3.9%. These results are in line with previous empiricalstudies [16] reporting a 4% response rate. The system did not send remindermessages because, due to the limitations imposed by Twitter, we gave higherpriority to sending messages to new users. Two users visited the dashboard ofwhich one used it to opt-out. Neither user used the dashboard to rate the rec-ommended venues. As a result, it was clear that visitors did not appreciate tobe contacted on Twitter, even when using an official Twitter account supportedby the organization of the event (Fuorisalone). Therefore, in the future we needto devise alternative ways for visitor engagement.

8 Related Work
Several efforts in literature are related to the solution we adopted for this casestudy, although there are clear differences with our approach.
City venues and their categories have been used in order to characterise acity’s districts, also with the goal of recommending particular areas to visitors.[18] uses Foursquare checkins and Foursquare venue categories to classify differ-ent areas of the city, and to profile users based on the categories of the venuesthat they visit. A similar work is [10], which clusters together areas in a citybased on similar users checking in the venues of that area, based on the assump-tion that both people and places define the character of an area (what they callLivehoods). Both the venue and the visitor profile are based on Foursquare venuecategories. A step further is represented by [11], where the authors define venuesalso based on the profile of the visitors visiting those venues, using Facebook datato profile visitors. They claim that using semantics extracted both from placesand from the online profiles of people who frequent those places improves cityareas and venues classification. Differently from our solution, these approachesrely on the availability of data about the categories of venues. Moreover, venuesare considered as having a static “character”, i.e. a fixed category. In our case,during a City Scale Event venues change their character and this data is notavailable from Location Based Social Networks such as Facebook or Foursquare.
Other efforts have tried to relate tweets to the geographical location fromwhere they were posted. [13] predicts location of a tweet, using a generativemodel based on location-dependent language models. Similarly, also [8] proposea probabilistic framework for estimating a Twitter user’s city-level location basedon the content of the user’s tweets. Such approaches do not achieve the precisionneeded in our approach, considering that they are able to place users within 100miles of their actual location. Also using the geolocation information of socialstreams, but for a different purpose, [9] analyses check-ins as a way to study usermobilities with a large scale perspective (millions of check-ins).
Related to the problem of linking a tweet to a venue, [7] uses entity extractionfrom tweets in order to enrich the static description of Point of Interests withdynamic information contained in the tweets. Again, this approach operates atcity scale, while we operate at venue scale. Moreover, our problem is not tocharacterise an event, but to know who exactly is attending it.
A similar approach to ours, [1] also uses social streams and other user-generated sources such as GPS information to understand the urban contextand generate recommendations, using a semantic approach based on SemanticWeb technologies (Pellet, OWL and SWRL). Different from our work, their usermodeling is not based on user interests but on user preferences for mobility (suchas avoid crowded place to go to work), since their recommendations are related toroute planning. Therefore, their user models have a different content. Similarly,in the field of Smart Cities and mobility, the CityPulse project13 aims to createa distributed framework for semantic discovery, processing and interpretation of
13 http://www.ict-citypulse.eu/

large-scale real-time Internet of Things and relevant social data streams, with thegoal of knowledge extraction in a city environment [6]. In particular,“ExtractingCity Traffic Events from Social Stream’ deals with extracting traffic events fromtwitter streams [2].
9 Conclusions and Future Work
The growing amount of digital footprints that visitors of city-scale events leaveon social media enables to build a graph of visitors attending events hosted invenues. This graph is continuously reshaping and the ability to predict in realtime its evolution can foster innovative social media analytics services. In ourprevious work [4,3], we showed that our deductive and inductive stream reason-ing techniques, once combined with visitor-modeling functionalities, can producehigh-quality predictions of links in such a graph even when information aboutvisitors’ preferences for venues and events is sparse. In this paper, we report onour first attempt to experimentally offer a real-world service for the visitors ofMilano Design Week 2014. The case study confirms the ability of our system tosemantically analyze and link visitors’ social network activities to venues of acity-scale event. The case study also confirms the ability to build representativevisitor profiles. The task of predicting links between visitors and venues is as hardas expected in the lab. The predictions the system produces are in line with ourexpectation (i.e. they are better than any base line methods in the state of theart). Also the integration middleware based on a Streaming Linked Data imple-mentation of the blackboard paradigm showed satisfactory performances. Themost critical task was engaging the visitors. We monitored visitors in Twitterand we also tried to engage them by using Twitter. Unfortunately, the task wasmuch more challenging than expected. Even if we were granted the permissionto use a Twitter account related to MDW and to host the application under asub-domain of the official website of MDW, only few users opted to follow usand, thus, received our recommendations. Moreover, Twitter anti-spam policiesresulted more powerful than our countermeasures.
In our future work, we intend to improve the correctness of the method em-ployed in semantically analysing and linking social media to venues and topics.We will investigate the effect of additional meta data (e.g. organizers of events)on the quality of recommendations. An important challenge we intend to takeon in the future is to predict the appearance or disappearance of nodes fromthe people-venues-events graph. Moreover, we intend to deliver our recommen-dations through an official mobile application of a city-scale event so that we areperceived as a trustable source of recommendations.
Acknowledgements
This publication was supported by the Dutch national program COMMIT.

References
1. Alvarez-Napagao, S., Tejeda-Gomez, A., Oliva, L., Garcia-Gasulla, D., Codina, V.,Vazquez-Salceda, J.: Urban context detection and context-aware recommendationvia networks of humans as sensors. In: CARE (2014)
2. Anantharam, P.: Extracting city traffic events from social streams (2014), https://osf.io/b4q2t/wiki/home
3. Balduini, M., Bozzon, A., Della Valle, E., Huang, Y., Houben, G.J.: Recommendingvenues using continuous predictive social media analytics. IEEE Internet Comput-ing 18(5) (2014)
4. Balduini, M., Della Valle, E., Dell’Aglio, D., Tsytsarau, M., Palpanas, T., Con-falonieri, C.: Social listening of city scale events using the streaming linked dataframework. In: ISWC (2). pp. 1–16 (2013)
5. Barbieri, D.F., Della Valle, E.: A proposal for publishing data streams as linkeddata - a position paper. In: LDOW (2010)
6. Bischof, S., Karapantelakis, A., Sheth, A., Mileo, A., Barnaghi, P.: Semantic mod-elling of smart city data. In: W3C Workshop on the Web of Things Enablers andservices for an open Web of Devices. pp. 1–5. Berlin, Germany (2014)
7. Cano, A.E., Varga, A., Ciravegna, F.: Volatile classification of point of interestsbased on social activity streams. In: Passant, A., Fernandez, S., Breslin, J., Bojars,U. (eds.) SDOW (2011)
8. Cheng, Z., Caverlee, J., Lee, K.: You are where you tweet : A content-based ap-proach to geo-locating twitter users. In: ICKM. pp. 759–768. ACM, New York,NY, USA (2010)
9. Cheng, Z., Caverlee, J., Lee, K., Sui, D.Z.: Exploring millions of footprints inlocation sharing services. In: Adamic, L.A., Baeza-Yates, R.A., Counts, S. (eds.)Proc of the 5th Int Conference on Weblogs and Social Media. vol. 2010, pp. 81–88.The AAAI Press, Barcelona, Catalonia, Spain (2011)
10. Cranshaw, J., Hong, J.I., Sadeh, N.: The livehoods project : Utilizing social mediato understand the dynamics of a city. In: The 6th Int. AAAI Conf. on Weblogsand Social Media. AAAI Press, Dublin, Ireland (2012)
11. Del Bimbo, A., Ferracani, A., Pezzatini, D., D’Amato, F., Sereni, M.: Livecities :Revealing the pulse of cities by location- based social networks venues and usersanalysis. In: WWW. pp. 163—-166. Seoul, Korea (2014)
12. Esuli, A., Sebastiani, F.: Sentiwordnet: A publicly available lexical resource foropinion mining. In: LREC ’06 (2006)
13. Hong, L., Ahmed, A., Gurumurthy, S., Smola, A.J., Tsioutsiouliklis, K.: Discover-ing geographical topics in the twitter stream. In: WWW. pp. 769—-778 (2012)
14. Huang, Y., Tresp, V., Bundschus, M., Rettinger, A., Kriegel, H.P.: Multivariateprediction for learning on the semantic web. In: ILP. pp. 92–104 (2010)
15. Lebo, T., Sahoo, S., McGuinness, D., Belhajjame, K., Cheney, J., Corsar, D.,Garijo, D., Soiland-Reyes, S., Zednik, S., Zhao, J.: Prov-o: The prov ontology.W3C Recommendation, 30th April (2013)
16. Mahmud, J., Zhou, M.X., Megiddo, N., Nichols, J., Drews, C.: Optimizing theselection of strangers to answer questions in social media. CoRR abs/1404.2013(2014)
17. Nii, H.P.: Blackboard systems, part one: The blackboard model of problem solvingand the evolution of blackboard architectures. AI Magazine 7(2), 38–53 (1986)
18. Noulas, A., Scellato, S., Mascolo, C., Pontil, M.: Exploiting semantic annotationsfor clustering geographic areas and users in location-based social networks. In: TheSocial Mobile Web (2011)

19. Pianta, E., Bentivogli, L., Girardi, C.: Multiwordnet: developing an aligned mul-tilingual database. In: Proc. of the 1st Int. Conf. on Global WordNet (January2002)
20. Thelwall, M., Buckley, K., Paltoglou, G., Cai, D., Kappas, A.: Sentiment strengthdetection in short informal text. J. Am. Soc. Inf. Sci. Technol. 61(12), 2544–2558(Dec 2010)
21. Tsytsarau, M., Palpanas, T., Denecke, K.: Scalable detection of sentiment-basedcontradictions. In: DiversiWeb Workshop, WWW2011, Hyderabad, India, March28-31 (2011)