Embed Size (px)
Citation preview
A CASE STUDY ANALYSIS OF THE OVERHEAD RATE IMPACT MODEL
USED DURING THE C-5 MAINTENANCE SOURCE SELECTION
THESIS
William N. Ward, Captain, USAF
AFIT/GAQ/ENV/01M-16
DEPARTMENT OF THE AIR FORCE AIR UNIVERSITY
AIR FORCE INSTITUTE OF TECHNOLOGY Wright-Patterson Air Force Base, Ohio
APPROVED FOR PUBLIC RELEASE; DISTRIBUTION UNLIMITED.
The views expressed in this thesis are those of the author and do not reflect the official
policy or position of the United States Air Force, Department of Defense, or the U. S.
Government.
AFIT/GAQ/ENV/OIM-16
A CASE STUDY ANALYSIS OF THE OVERHEAD RATE IMPACT MODEL
USED DURING THE C-5 MAINTENANCE SOURCE SELECTION
THESIS
Presented to the Faculty
Graduate School of Engineering and Management
Air Force Institute of Technology
Air University
Air Education and Training Command
In Partial Fulfillment of the Requirements for the
Degree of Master of Science in Acquisition Management
William N. Ward, B. S.
Captain, USAF
March 2001
APPROVED FOR PUBLIC RELEASE; DISTRIBUTION UNLIMITED
AFIT/GAQ/ENV/OlM-16
A CASE STUDY ANALYSIS OF THE OVERHEAD RATE IMPACT MODEL
USED DURING THE C-5 MAINTENANCE SOURCE SELECTION
William N. Ward, B.S. Captain, USAF
Approved:
Ä*(cJ*S^*L«i___ 02 A***?/
Lt Col William Stockman, PhD (Chairman) date
Lt Col David Petrillo, PhD (Member) date
Acknowledgements
I would like to express my sincere appreciation to my faculty advisor, Lt Col Bill
Stockman, for his guidance throughout the course of this thesis effort. His insight and
experience were crucial to the completion of this effort. I would also like to thank all of
my classmates who have made the AFIT experience more enjoyable.
A special thanks goes out to my wife and our son. Their support, encouragement,
and understanding throughout this difficult process made its completion possible.
William N. Ward
IV
Table of Contents Page
Acknowledgements iv
List of Figures vii
List of Tables viii
Abstract ix
I. Introduction 1
Background 1 Overhead Savings 3 Problem Statement 4 Research Objectives 5 Research Scope 5 Research Methodology 6 Generalizability 6 Research Contributions 7 Summary 7
II. Literature Review 8
Introduction 8 Determining the Acquisition Strategy 8 Best Value Source Selections 9 Best Value Solicitations 10 How are Overhead Savings Achieved 11 When have Overhead Savings been Dollarized 12 Overhead Costs 14 Overhead Rate Calculations 14 ORI Model 16 Example of ORI Model 18 ORI Model Assumptions 22 Summary 23
III. Methodology 24
Introduction 24 Methodology 24 Case Study Design 26 Data Collection 27
Page Interviews 28 Interview Questions 28 Evaluation of model 29 Limitations of Methodology 29 Summary 30
IV. Findings and Analysis 31
Introduction 31 Research Objective 1 31 Research Objective 2 32 Research Objective 3 39 Research Objective 4 40 Summary 41
V. Conclusions and Recommendations 42
Introduction 42 Research Objective 1 42 Research Objective 2 42 Research Objective 3 43 Research Objective 4 44 Barriers to Implementing this Method 44 Limitations of this Research 45 Recommendations for Further Research 46
Bibliography 47
Vita 49
VI

List of Figures Figure Page
3-1. Relevant Situations for Different Research Strategies 25
3-2. Basic Types of Designs for Case Studies 26
vn
List of Tables
Table Page
2-1. Overhead Rate Impact Model 19
4-2. ORI Model at Aggregate Level ' 32
4-3. Overhead Analysis for Individual Programs 34
4-4. Rate Impact Using the Aggregate Rates 35
4-5. Rate Impact When Calculated at Program Level 35
4-6. Excess Contribution to Overhead Pool 38
vm
AFIT/G AQ/EN V/O 1M-16
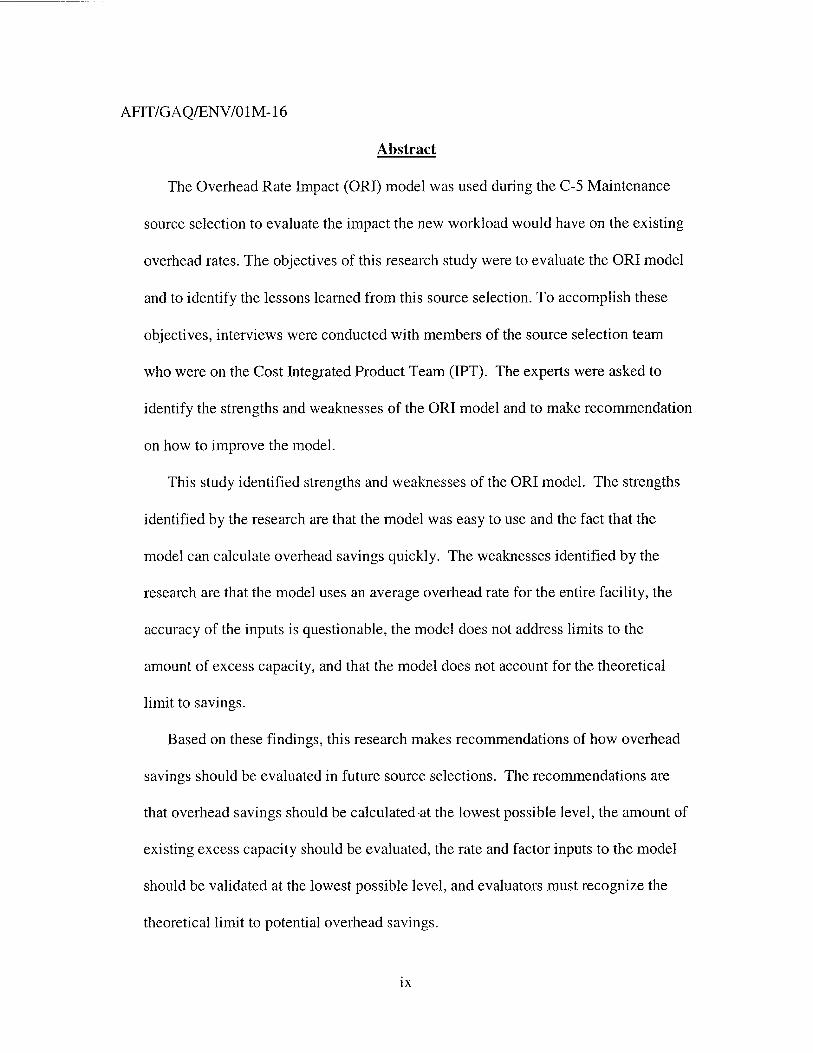
Abstract
The Overhead Rate Impact (ORI) model was used during the C-5 Maintenance
source selection to evaluate the impact the new workload would have on the existing
overhead rates. The objectives of this research study were to evaluate the ORI model
and to identify the lessons learned from this source selection. To accomplish these
objectives, interviews were conducted with members of the source selection team
who were on the Cost Integrated Product Team (IPT). The experts were asked to
identify the strengths and weaknesses of the ORI model and to make recommendation
on how to improve the model.
This study identified strengths and weaknesses of the ORI model. The strengths
identified by the research are that the model was easy to use and the fact that the
model can calculate overhead savings quickly. The weaknesses identified by the
research are that the model uses an average overhead rate for the entire facility, the
accuracy of the inputs is questionable, the model does not address limits to the
amount of excess capacity, and that the model does not account for the theoretical
limit to savings.
Based on these findings, this research makes recommendations of how overhead
savings should be evaluated in future source selections. The recommendations are
that overhead savings should be calculated at the lowest possible level, the amount of
existing excess capacity should be evaluated, the rate and factor inputs to the model
should be validated at the lowest possible level, and evaluators must recognize the
theoretical limit to potential overhead savings.
IX
A CASE STUDY ANALYSIS OF THE OVERHEAD RATE IMPACT MODEL
USED DURING THE C-5 MAINTENANCE SOURCE SELECTION
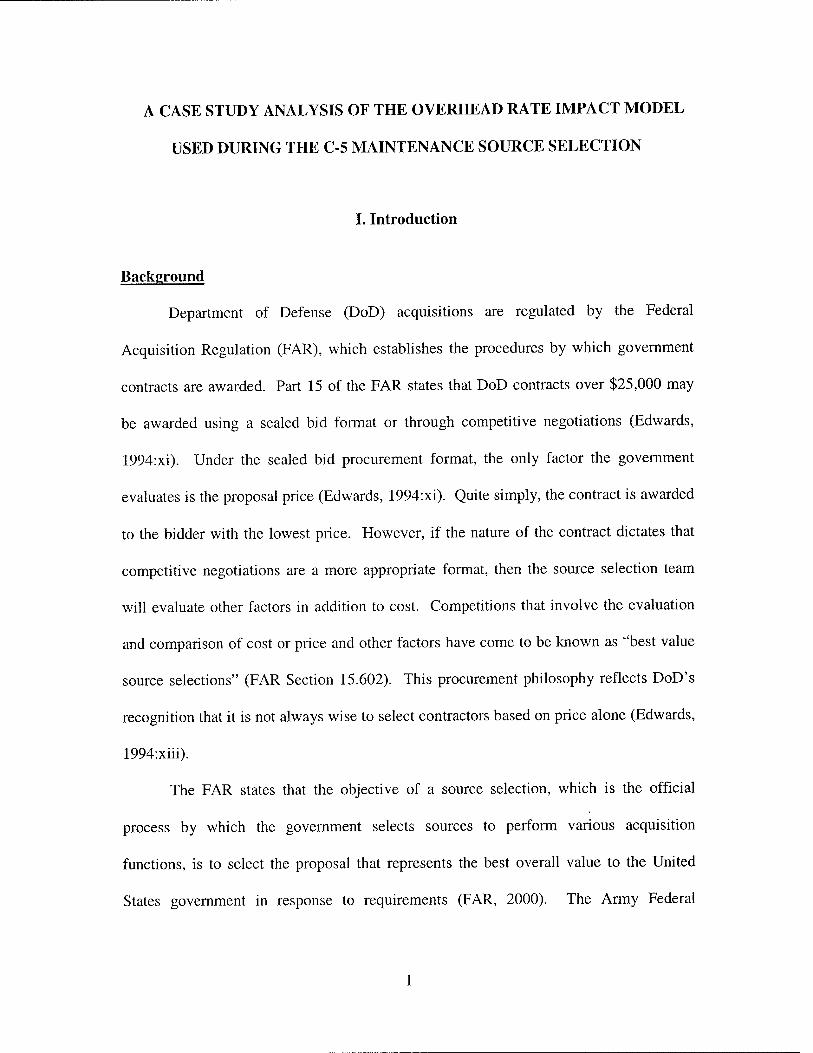
I. Introduction
Background
Department of Defense (DoD) acquisitions are regulated by the Federal
Acquisition Regulation (FAR), which establishes the procedures by which government
contracts are awarded. Part 15 of the FAR states that DoD contracts over $25,000 may
be awarded using a sealed bid format or through competitive negotiations (Edwards,
1994:xi). Under the sealed bid procurement format, the only factor the government
evaluates is the proposal price (Edwards, 1994:xi). Quite simply, the contract is awarded
to the bidder with the lowest price. However, if the nature of the contract dictates that
competitive negotiations are a more appropriate format, then the source selection team
will evaluate other factors in addition to cost. Competitions that involve the evaluation
and comparison of cost or price and other factors have come to be known as "best value
source selections" (FAR Section 15.602). This procurement philosophy reflects DoD's
recognition that it is not always wise to select contractors based on price alone (Edwards,
1994:xiii).
The FAR states that the objective of a source selection, which is the official
process by which the government selects sources to perform various acquisition
functions, is to select the proposal that represents the best overall value to the United
States government in response to requirements (FAR, 2000). The Army Federal
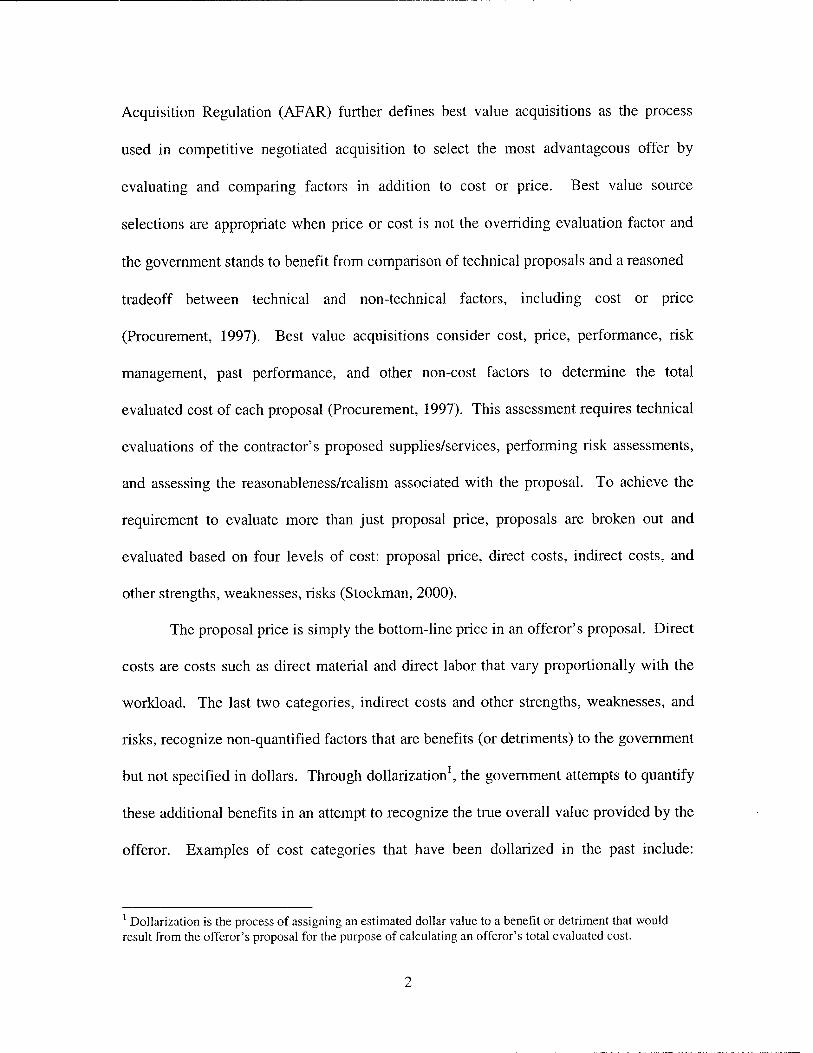
Acquisition Regulation (AFAR) further defines best value acquisitions as the process
used in competitive negotiated acquisition to select the most advantageous offer by
evaluating and comparing factors in addition to cost or price. Best value source
selections are appropriate when price or cost is not the overriding evaluation factor and
the government stands to benefit from comparison of technical proposals and a reasoned
tradeoff between technical and non-technical factors, including cost or price
(Procurement, 1997). Best value acquisitions consider cost, price, performance, risk
management, past performance, and other non-cost factors to determine the total
evaluated cost of each proposal (Procurement, 1997). This assessment requires technical
evaluations of the contractor's proposed supplies/services, performing risk assessments,
and assessing the reasonableness/realism associated with the proposal. To achieve the
requirement to evaluate more than just proposal price, proposals are broken out and
evaluated based on four levels of cost: proposal price, direct costs, indirect costs, and
other strengths, weaknesses, risks (Stockman, 2000).
The proposal price is simply the bottom-line price in an offeror's proposal. Direct
costs are costs such as direct material and direct labor that vary proportionally with the
workload. The last two categories, indirect costs and other strengths, weaknesses, and
risks, recognize non-quantified factors that are benefits (or detriments) to the government
but not specified in dollars. Through dollarization1, the government attempts to quantify
these additional benefits in an attempt to recognize the true overall value provided by the
offeror. Examples of cost categories that have been dollarized in the past include:
1 Dollarization is the process of assigning an estimated dollar value to a benefit or detriment that would result from the offeror's proposal for the purpose of calculating an offeror's total evaluated cost.
overhead savings, RIF2/PCS3/VERA4/VSIP5 expenditures, second destination
transportation, contract administration, cost of capital, transition adjustment, and USAF
material costs. This research focuses specifically on the dollarization of overhead
savings during a best value source selection.
Overhead Savings
During the proposal process, an offeror may assert that award of the contract will
result in reduced overhead rates on other Government contracts currently being
performed by the offeror. In this instance, the additional workload results in fixed
overhead costs being spread over a larger allocation base, thereby reducing overhead
rates. This reduced rate is applied to the existing government work, and the difference
between the original rate and the new rate is multiplied by the original workload to
calculate total overhead savings generated by the additional workload. These savings are
then included in an offeror's bid as a downward adjustment.
Overhead savings can only occur when this additional government workload
increases the offerer's overhead allocation base at a greater rate than it increases the
offerer's overhead cost pool. In addition, the offeror must have existing excess capacity
in order to absorb the increase in workload without increasing overhead costs at the same
rate. If these circumstances exist, then savings result from the increased efficiency of the
existing workforce and facilities.
2 RIF - Reduction in Force, a reduction in personnel because of various reasons 3 PCS - Permanent Change of Station, The long-term, physical relocation of a military member and his/her family 4 VERA - Voluntary Early Retirement Authority 5 VSIP - Voluntary Separation Incentive Pay
Clearly, when an offeror has existing government contracts and excess capacity, it
is in the best interest of the Air Force to evaluate the impact of the additional work to
overhead rates. According to Baseman, "changes in a contractor's business base will
have a significant impact on the costs of programs at the contractor's plant" (Baseman,
111). In the case of overhead savings, the increase in the contractor's business base
decreases the overhead rates of the individual programs at the contractor's plant. The
increase in the contractor's business base is a direct result of the contract being proposed;
therefore, it is reasonable to take these savings into consideration when evaluating
offerers' bids. Since the Air Force is receiving additional benefits of this contract award,
these benefits should be recognized in a best value source selection.
Problem Statement
Though it is easy to see that a lower overhead rate occurs from an increased
allocation base, a standard analysis tool has not been validated. The competition for the
annual C-5 overhaul maintenance contract was the first source selection to include
overhead savings. The public offeror, which was Warner-Robins Air Logistic Center
(ALC), proposed that the new workload would result in lower overhead rates for other
government programs at the facility. To evaluate these proposed savings, the Source
Selection Cost IPT team used the Overhead Rate Impact (ORI) model to estimate
potential overhead savings at Warner-Robins ALC (Stockman, 2000). This estimate was
then used to make budget adjustments to other programs at Warner-Robins to account for
the recognized overhead savings. This adjustment resulted in budget reductions for those
programs that claimed shared resources with the C-5 workload. The validity and
accuracy of the model is crucial since budget adjustments are made based on its output.
Additionally, private sector offerors expressed great concern over the method
used to recognize overhead savings and claimed it provided an unfair advantage to public
offerors (GAO, January 1998:5). In fact, one private sector offerer in the source
selection characterized the overhead savings adjustments as the one factor that most
favors public offerors, and stated that unless the overhead savings evaluation factors
where changed, his organization would likely not compete in future public-private
competitions (GAO, January 1998:8). Given this concern over the method used to
calculate overhead savings and the potential budgetary impact the model results may
have, a study of the ORI is prudent to address the private offerers' concerns.
Accordingly, this study examines the ORI model used to calculate overhead savings
during the C-5 source selection.
Research Objectives
The goals of this research are to evaluate how well the ORI model evaluated
overhead savings during the C-5 source selection and to identify the lessons learned from
this source selection. These goals will be achieved by addressing four separate research
objectives. The four research objectives are as follows:
1. Identify the strengths of the ORI model
2. Identify the weaknesses of the ORI model
3. Identify ways of improving the ORI model's accuracy (if any are needed)
4. Identify factors of the "ideal" method of estimating overhead savings
Research Scope
This research effort examines the ORI model as it was used during the C-5 source
selection. After gaining an understanding of the ORI model and how it was used, this
research identifies ways of improving the ORI model for future source selection teams.
Based on the experiences and lessons learned from the Cost IPX members, this research
provides recommendations on the most appropriate method of evaluating overhead
savings during source selections.
Research Methodology
Data collection was conducted through a literature review and interviews. The
literature review focuses on the relevancy of dollarizing overhead savings during source
selections and the accounting principles associated with overhead savings. The goals of
the literature review were to understand how overhead savings fits into best value source
selections and the economic theories behind overhead savings. A case study analysis was
conducted by interviewing members of the C-5 Source Selection Cost DPT. Since this
study focuses on the experiences of this source selection, these team members are the
experts regarding its use in this forum. The goal of the interviews is to document the
specific strengths and weaknesses of the model as it was used for this evaluation.
Furthermore, the interviews were the source of suggestions on ways to improve the
model and on factors included in the ideal estimation method of overhead savings.
Generalizability
This research focuses on the ORI model as it was used during the C-5 source
selection. The ORI model was specifically developed to analyze overhead savings for
government depots. Therefore, the generalizability of this research regarding the model
itself is limited to specific situations where this model is used to evaluate overhead
savings. However, the theoretical aspects of improving the estimation techniques used to
evaluate overhead savings should be applicable to all circumstances where overhead
savings might be calculated.
Research Contributions
The intent of this research is to determine if the ORI model provides source
selection officials with an effective tool to estimate potential overhead savings. Overhead
savings adjustments have been used in several public-private source selections, and
policy has directed that these adjustments will continue to be used in future source
selections. Identifying the strengths and weaknesses of the ORI model and suggesting
potential improvements on the methods used to calculate these savings will aid future
source selection teams that are faced with evaluating overhead savings.
Summary
Overhead costs are an enormous expense in government acquisition programs,
and an accurate evaluation of overhead savings is essential to ensure a successful best
value source selection. Policy dictates that overhead savings will be included in best
value source selections; therefore, the need for an accurate and effective evaluation tool
to be used in future source selections is great. This research evaluates the accuracy of the
model used to estimate overhead savings during the C-5 Maintenance source selection.
Based on the results of this research, recommendations will be provided for
improvements to the model and for factors to include in an "ideal" model. The next
chapter of this research explains in detail where overhead savings fit into best value
source selections. Chapter 2 also includes an analysis of the ORI model and how it
calculates overhead savings.
II. Literature Review
Introduction
This chapter focuses on the relevancy of overhead savings to source selection
officials. It discusses how source selections have evolved from lowest price to best
value. It discusses dollarization of benefits during source selections and why overhead
savings should be recognized in this manner. It then discusses the model used during the
C-5 Maintenance source selection and walks through how the model estimates potential
overhead savings.
Determining the Acquisition Strategy
A new program is initiated when the Defense Acquisition Board (DAB) approves
the need for a new program based on an identified mission deficiency. Once the DAB
gives this approval, a new program officially begins. At this point, senior officials must
determine the acquisition strategy that best fits the needs of the new program.
Acquisition strategy is defined as a business and technical management approach
designed to achieve program objectives within the resource constraints imposed (Defense
Acquisition, 1991). The acquisition strategy serves as a framework for managing the
program and should reflect the needs of the program with respect to realism, risk,
stability, and flexibility. The acquisition strategy chosen will play a significant role in the
type of acquisition that takes place because the acquisition strategy will highlight the
risks and threats associated with the program. This will be important in determining the
criteria to be evaluated during the source selection. Once the program director and his
staff select an acquisition strategy, it must be presented to the Acquisition Strategy Panel
(ASP) for approval. The ASP, which is comprised of senior acquisition experts, is
assembled to approve or reject the proposed acquisition strategy. Upon the selection of
an acquisition strategy, the ASP establishes the criteria that will be evaluated during the
source selection. The criteria deemed important by the ASP will dictate the type of
source selection to be used. If price is found to be the only important factor, then the
source selection should be conducted using a sealed bid format. However, if the ASP
recognizes other important factors besides cost, then a competitive negotiation format
using a best value approach would be the most appropriate type of source selection.
Best Value Source Selections
As explained in Chapter 1, best value source selections evaluate all factors
associated with an offerers bid. Dr. Gansler, former Under Secretary of Defense for
Acquisition and Technology, noted that awarding contracts with an emphasis on low
price creates enormous incentives to do anything to be the winner (Gansler, 1989). With
a growing trend of programs overrunning their budgets, senior officials became
concerned that focusing on price sacrificed quality, and that a low-priced, poor-quality
product would eventually cost the government more money in operations and
maintenance costs (Conver, 1993: 48). DoD began to recognize the fact that it may have
to pay more in acquisition costs to ensure quality and potentially lower support costs
(Conver, 1993:49). This paradigm shift to best value acquisitions recognizes the fact that
higher quality acquisitions could prove to be cheaper over the life of the program. This
new shift established the idea of recognizing the entire value of an offerer's proposal.
While it may be relatively easy to recognize the dollar value of some benefits, others may
not be so clear. The difficulty becomes assigning a dollar value to non-quantified
benefits so that they may be evaluated during the source selection. Notifying potential
offerers that the source selection will be conducted on a best value basis is the first step
in a best value source selection.
Best Value Solicitations
When the government issues a Request for Proposals6 (RFP), the RFP specifies
the manner in which the proposals should be prepared and how they will be evaluated
(Mickaliger, 1999:43). The RFP will clearly lay out to prospective offerors if the
selection will be based on lowest price or best value. If it is a best value source selection,
the RFP will indicate what factors will be evaluated to calculate each offeror's total
evaluated cost. In addition, the RFP will state whether all evaluation factors other than
cost or price, when combined, are significantly more important than, approximately equal
to, or significantly less important than cost or price (FAR, 2000: Part 15). While it is
impossible and counterproductive for the RFP to identify every potential benefit that
could be recognized during the evaluation process, the RFP does identify some benefits
that are commonly seen, such as overhead savings. If overhead savings will be
recognized during the evaluation, then this fact will be spelled out to perspective offerors
in Section L. For example, the RFP for the C-5 Maintenance workload stated:
"An adjustment shall be made to any public or private offeror's proposal price for
identified and reasonable first order effect overhead costs/savings to other
government workloads performed by the offeror that would be realized during
contract performance."
6 Notice to potential offerors that an evaluation committee will evaluate proposals for a specified contract
10
This clause in the RFP identifies to all prospective offerors that overhead savings will be
evaluated as an additional benefit to the government.
Section M of the RFP establishes how the Government will evaluate the
proposals, how the factors interrelate, and how many awards will be contemplated (SS
Procedures, 2000). If overhead savings will be recognized, then the evaluation scheme
will be provided in this section. An agency and its source selection officials should
exercise particular care to ensure the evaluation of proposals is consistent with the
evaluation criteria established in Section M of the RFP (Mickaliger, 1999). For example,
private offerors greatly contested the manner in which overhead savings where evaluated
during the C-5 Maintenance source selection. However, a legal review of the
competition found that the evaluation team followed the scheme provided in the RFP and
the Depot Competition Procedures handbook (GAO, January 1998:5). Since the Air
Force team followed the established evaluation method, the overhead savings where
found to be reasonable and eventually became the determining factor in award (GAO,
January 1998:6).
How are Overhead Savings Achieved
If a bid is awarded to a specific offerer and the new work increases production
quantity and capacity utilization, associated costs for the product decreases because of a
more efficient use of existing workforce and facilities (Washington, 1997:181). The
additional workload creates larger production quantities and increased economy of scale,
both of which are benefits that should be quantified (Washington, 1997:173). In its
review of the existing excess capacity at Air Force Depots, the GAO noted that increased
economy of scale and increased efficiency decreased overhead rates on government
11
contracts by 18% between 1994-1997 (GAO, December 1996:7). In the late 1980's, the
Base Realignment and Closure Commission (BRAC) concluded that savings result from
transferring work to facilities with excess capacity (GAO, December 1996:3). Based on
these findings, it is reasonable to conclude that increasing the efficiency of a specific
facility results in decreases in the facility's overhead rates.
When have Overhead Savings been Dollarized
Dollarizing estimated overhead savings has been accomplished in several recent
source selections. In the competition for the C-5 maintenance workload, the Air Force
received several private sector proposals as well as one public offeror. Warner-Robins
Air Logistics Center claimed the new workload would create overhead savings for other
programs located at its facility. Following the cost and technical evaluations, the Air
Force selected Warner Robins ALC to perform the C-5 maintenance based on the
evaluation that it's proposal represented the lowest total evaluated cost to the government
(GAO, January 1998:6). The expected savings were so substantial that it became a
primary determining factor during the source selection (GAO, January 1998:5).
In the source selection for the Sacramento Air Logistics Center (ALC) Depot
Maintenance Workload Competition, Ogden Air Logistics Center (ALC) received credit
on its bid in the form of overhead savings. Since Ogden ALC had excess capacity and
the additional depot maintenance workload increased it's allocation base by a greater rate
than it increased Odgen's fixed costs, the ALC was able to show overhead savings would
occur if it where awarded the contract. These savings were credited (subtracted) from
Ogden's most probable cost estimate and reduced Ogden's overall bid by $50M
(Stockman, 2000).
12
In the Public-Private Depot Competition for the San Antonio Engine Depot
Maintenance Workload, source selection officials credited Oklahoma City Air Logistics
Center with a downward adjustment to its bid price to account for overhead savings. The
additional workload could be added to Oklahoma City's existing workload and result in
decreases to the existing overhead rates. While these savings did not play a crucial role
in the outcome of the source selection, they did reduce OKC's bid price by $200M
(Stockman, 2000).
In addition to the examples of overhead savings inclusion during recent source
selections, Air Force officials have received the following policy guidance regarding the
evaluation of overhead savings. A 20 December 1997 letter from SAF AQ/FM states:
"An adjustment shall be made to each public or private contract proposal price for
identified and reasonable overhead costs/savings to other government workloads
performed by the offeror that would be realized during contract performance. The
overhead adjustment costs/savings shall be computed by subtracting the new
overhead rates from the old overhead rate and multiplying the difference by the
existing (excluding workload under competition) government workload overhead
base. "
The policy further states that:
" An adjustment shall be made to any public or private offerer's contract proposal
price for any other costs or benefits to the government that would be
incurred/accrued if awarded the contract."
The evaluation of overhead savings is an additional benefit that should be
dollarized during a best value source selection. If the acquisition strategy dictates a best
13
value source selection, then recognizing overhead savings is reasonable. Based on
precedent and policy, this is an evaluation that belongs in a best value source selection.
Having established the need to evaluate overhead savings during best value source
selection, this research will now focus on the manner in which these savings are
calculated.
Overhead Costs
In Department of Defense (DoD) acquisitions, overhead costs have an enormous
impact on the cost of military programs. Given the magnitude of typical military
acquisition programs, overhead charges can cost the government hundreds of millions of
dollars. In 1995, the DoD estimated that overhead costs average about one-third of a
contract's price (GAO, May 1995:3). In addition, senior DoD acquisition officials have
expressed concern that the decline in defense spending will lead to increases in
contractor's overhead rates (GAO, May 1995:2). As the military purchases lessen due to
declining budgets, defense contractors' business bases will decrease. This decrease
results in contractors' fixed costs being spread over a smaller allocation base causing an
increase in overhead rates. This concern supports the contention that an organization's
business base is a direct determinant of the amount of overhead any one given program
will bear (Baseman 111).
Overhead Rate Calculations
Overhead costs are expenses that exist for the common good of the organization
and that cannot be reasonably or cost-effectively charged directly to a specific activity or
product (Fultz, 1980:9). They typically include all product costs other than direct
material and direct labor that result from operations but cannot be directly attributed to a
14
specific product. These costs are generally considered fixed costs since they do not vary
based on the level of production or activity. Some examples of overhead costs are
indirect material, indirect labor, insurance, utilities, rent, and depreciation. Overhead
costs are costs associated with doing business, and all products share benefits associated
with these costs. Since all products receive benefits from these costs, they cannot and
should not be assigned to just a few products. For this reason, they are added together to
form a "cost pool" known as overhead. These costs are then distributed to products using
some rational and logical allocation base that is common to all products within an
organization, such as by direct labor hours or direct machine hours (Garrison & Noreen,
1994:77).
Overhead rates are calculated by dividing the overhead pool by the specified
allocation base, as shown below:
Estimated Annual Overhead Costs Estimated units of the Allocation Base
So, if an organization has estimated overhead costs for the year to be $100,000 and has
estimated 10,000 direct labor hours for the year.
$100,000 =$10 per labor hour 10,000
This results in an overhead rate of $10 per labor hour.
Since these rates are predetermined and computed using estimated data, any
changes in the overhead cost pool or the allocation base will affect the overhead rates
(Garrison & Noreen, 1994, p. 77). For example, if the organization above acquires
15
additional work that will increase it's annual labor hours by 10,000 without increasing the
overhead cost pool, then the overhead rate will drop to $5 per labor hour.
$100,000 = $5 per labor hour 20,000
As a direct result of the increase in labor hours, each product will only be assessed $5 per
labor hour in overhead costs as opposed to $10 per labor hour. Since existing programs
realize a $5 per labor hour decrease in overhead costs, first order savings occur from the
additional workload. The difference between these two overhead rates ($5 per labor
hour) represents the overhead savings that result from the additional 10,000 labor hours.
Garrison and Noreen also noted that large organizations often have multiple
predetermined overhead rates, usually one for each department (1994:94). This is due to
the fact that each department's costs may be driven by different activities. One single
plant-wide overhead rate equitably allocates overhead costs if costs are incurred at the
same rate throughout the plant; however, if more than one rate exists in the facility, then a
single plant-wide rate does not equitably allocate overhead rates (Garrison & Noreen,
1994:94). Therefore, overhead rates need to be calculated and evaluated at each level
where different rates exists. This also indicates that overhead savings should be
calculated and evaluated at the lowest possible levels.
ORI Model
The Overhead Rate Impact (ORI) Model was developed by analysts at several Air
Logistics Centers (ALC) to analyze and predict the impact of additional workloads to
overhead rates at the ALCs. The model estimates the potential overhead savings that
result from the additional work by analyzing the portion of the new work that involves
16
fixed costs. Since variable costs (direct labor and direct material) increase and decrease
in direct proportion to the amount of work that is performed at the facility, they are not
potential sources of savings. The fixed costs associated with the new workload are the
only potential sources of savings.
The model estimates the percentages of new work that are fixed costs and variable
costs. The fixed cost percentage is then multiplied by the new workload cost, and the
product is added to the existing total of fixed costs. That total (existing fixed costs + new
workload fixed costs) is then divided by the total number of hours (existing hours + new
hours) to calculate the new overhead rate. If fixed costs increase at a lesser rate than the
allocation base, then this overhead rate will be lower than the original overhead rate. The
new overhead rate is then subtracted from the old overhead rate, and that difference is
multiplied by the existing hours to come up with the estimated overhead savings.
The ORI analyzes all costs associated with the new workload and their impact on
the overhead rates at the facility. Direct costs are included in the model, but since direct
costs (labor and material) are variable costs that do not impact overhead rates, these costs
are not evaluated as sources of savings. Production Overhead costs and General &
Administration costs are analyzed in the spreadsheet as potential sources of savings. The
model divides production overhead into two categories: indirect costs and shop support
costs. These two categories are summed up to create the entire production overhead pool.
The model calculates savings by multiplying the existing overhead rate for each Work
Breakdown Structure (WBS) activity by a % variability factor. The % variability factors
are provided by the offeror based on the input of experts working in the respective WBS
activities. The model uses the % variability factor and the existing rate to calculate the
17
impact of the new workload. The following section walks through an example of the
ORI model.
Though the ORI model was developed specifically to predict the overhead impact
of additional work, it has been used in another situation. In the previously mentioned
1996 GAO report, the GAO used the model to estimate the amount of excess capacity at
the existing public depots. During the C-5 source selection, the model was suggested as a
manner in which overhead savings could be evaluated. Since the model has been used in
these other instances, it is appropriate to note that this research is looking specifically at
how the model was used during this source selection.
Example of ORI Model
The following is an example spreadsheet of the ORI model. This section walks
through each of the calculations on the spreadsheet. This explanation of how the model
works is necessary for the reader to follow the critique of the model in the following
chapters. The numbers shown in the model are not the actual numbers evaluated during
the source selection.
18
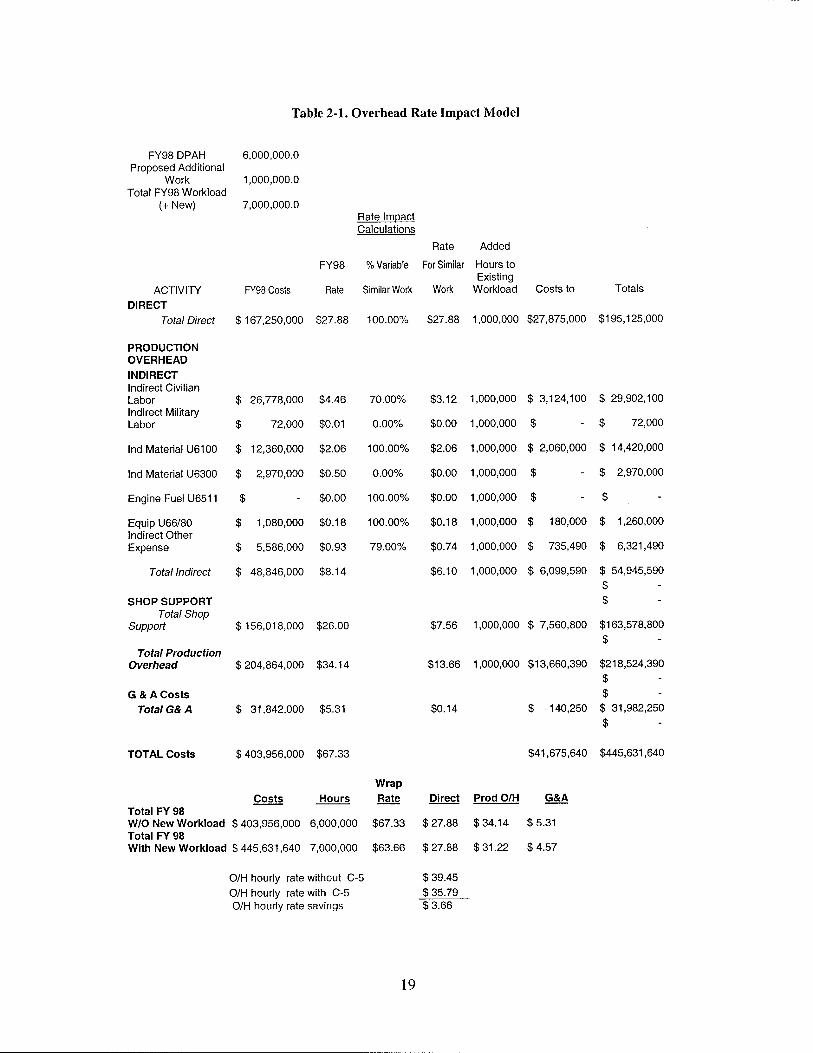
Table 2-1. Overhead Rate Impact Model
FY98 DPAH Proposed Additional
Work Total FY98 Workload
(+ New)
ACTIVITY DIRECT
Total Direct
PRODUCTION OVERHEAD INDIRECT Indirect Civilian Labor Indirect Military Labor
Ind Material U6100
Ind Material U6300
Engine Fuel U6511
Equip U66/80 Indirect Other Expense
Total Indirect
SHOP SUPPORT Total Shop
Support
Total Production Overhead
G & A Costs Total G& A
6,000,000.0
1,000,000.0
7,000,000.0 Rate Impact Calculations
Rate Added
FY98 Costs
1167,250,000 $27,
FY98 % Variable For Similar Hours to Existing
Rate Similar Work Work Workload Costs to Totals
100.00% $27.88 1,000,000 $27,875,000 $195,125,000
26,778,000 $4.46 70.00% $3.12 1,000,000 $ 3,124,100 $ 29,902,100
72,000 $0.01 0.00% $0.00 1,000,000 $ - $ 72,000
12,360,000 $2.06 100.00% $2.06 1,000,000 $ 2,060,000 $ 14,420,000
2,970,000 $0.50 0.00% $0.00 1,000,000 $ - $ 2,970,000
$0.00 100.00% $0.00 1,000,000 $ - $ -
1,080,000 $0.18 100.00% $0.18 1,000,000 $ 180,000 $ 1,260,000
5,586,000 $0.93 79.00% $0.74 1,000,000 $ 735,490 $ 6,321,490
48,846,000 $8.14 $6.10 1,000,000 $ 6,099,590 $ 54,945,590
$156,018,000 $26.00
$204,864,000 $34.14
$ 31,842,000 $5.31
$7.56 1,000,000 $ 7,560,800 $163,578,800
$13.66 1,000,000 $13,660,390 $218,524,390
$0.14 $ 140,250 $ 31,982,250
TOTAL Costs $ 403,956,000 $67.33
Costs Hours Wrap Rate
Total FY 98 W/O New Workload $403,956,000 6,000,000 $67.33 Total FY 98 With New Workload $445,631,640 7,000,000 $63.66
O/H hourly rate without C-5 O/H hourly rate with C-5 O/H hourly rate savings
Direct Prod O/H
$41,675,640 $445,631,640
G&A
; 27.88 $34.14 $5.31
! 27.88 $ 31.22 $ 4.57
! 39.45 ! 35.79
$3.66
19
The top-left corner of the spreadsheet shows the amount of work that is presently
being conducted at the facility. In this example, there are 6,000,000 Direct Production
Actual Hours (DPAH) for FY98. The additional workload being proposed is also listed
in the top-left corner. The "Activity" column identifies the specific Work Breakdown
Structure (WBS) activities involved. The column titled "FY98 Costs" lists the existing
cost for each WBS activity. In this example, the actual FY98 cost for Indirect Civilian
Labor was $26,778,000M. The "FY98 Rate" column represents the existing rates for
each WBS activity. These rates are the actual rates for FY98, which are calculated by
dividing the WBS costs by the existing workload. So, the existing rate for Indirect
Civilian Labor is $4.46/hr ($26,778,000M/6,000,000).
The column titled "% Variable Similar Work" is one of the most important inputs
of this model. This column represents the percentage of costs for each WBS that varies
with additional work. So, since Indirect Civilian Labor varies 70% with changes to the
workload, the percentage in this column is 70%. This means that each additional unit of
work for indirect civilian labor is 70% variable costs and 30% fixed costs. The next
column shows the new rate, which is calculated by multiplying the existing rate by the
variability factor. So, the new workload for Indirect Civilian Labor will be charged at a
rate of $3.12/hr ($4.46 * 70%). This means that Indirect Civilian Labor has excess
capacity such that it may absorb the new workload without incurring any additional fixed
costs. Conversely, Indirect Military Labor does not vary with changes to the workload,
so the variability factor is shown as 0%. This indicates that the workload could be
absorbed without incurring additional fixed costs associated with Indirect Military Labor.
In a third example, the variability factor for Indirect Material is 100%, which means costs
20
for this WBS vary directly with the increase in workload. There is no change in the
overhead rate for this WBS, so the new workload will be charged at a rate of $2.06/hr.
As illustrated in the example of Indirect Civilian Labor, any WBS with costs that are less
than 100% variable is a potential source of overhead savings.
The "Added Hours to Existing Workload" is simply the additional workload that
is being proposed. In this example, the proposal is for 1,000,000 labor hours. The "Costs
to" column lists the costs of the new workload. This is calculated by multiplying the new
rate by the additional workload. Indirect Civilian Labor's cost for the new workload is
$3,120,000M ($3.12 * 1,000,000 His). Finally, the "Totals" column is the sum of the
cost of the existing workload costs and the additional workload costs. Indirect Civilian
Labor has a total cost of $29,902,100M ($26,778,000 + 3,124,100). Having calculated
the impact of the additional workload, the overhead rates are then calculated.
The row titled "Total Production Overhead" sums up the totals from Shop
Support and Indirect Costs. In the column titled "FY98 Costs", the total production
overhead costs are found to be $204,864,000M (156,018,000 + 48,846,000). Total
Production Overhead costs are divided by existing hours at the bottom of the spreadsheet
to calculate the existing production overhead rate as $34.14 ($204,864,000/6,000,000).
The total production overhead rate is then added to the G & A rate to calculate the total
overhead rate. This rate is found to be $39.45/hr ($5.31 + $34.14). This is the average
existing overhead rate for the facility without the new workload. Now we must calculate
the overhead rate including the new workload. On the row titled "Total Production
Overhead" and the column titled "Totals, the spreadsheet shows the production overhead
costs of the existing workload plus the overhead costs of the new workload. This cost is
21
shown as $218,524,390. The new production overhead rate is shown at the bottom as
$31.22/hr ($218,524,390/7,000,000).
The new G & A rate, which is calculated using the same factor analysis, is shown
to be $4.57/hr. These two rates are summed together to come up with the new overhead
rate of $35.79/hr. Finally, the difference between these two overhead rates represents the
overhead savings that result from the new workload. The bottom line of the spreadsheet
shows that the overhead rate decreases $3.66/hr ($39.45- $35.79) as a result of the
additional workload. The overall savings would be this new rate times the existing
workload, which results in overhead savings of $21,960,000 ($3.66 * 6,000,000).
ORI Model Assumptions
The previous example walked through the ORI Model and how it calculates
overhead savings. This model is based on several key assumptions. The first of these
assumptions is that one average overhead rate can be used to calculate the savings. The
bottom-line number provided by the model is an average rate for the entire facility in
question. The model assumes that this single rate adequately reflects the overall
overhead rate for the facility. Secondly, the model assumes that the cost and rate
information provided by the offeror is accurate. The accuracy of these inputs is critical to
the validity of the output. Additionally, these rates and costs should be traced back to
those in the offeror's bid. The ORI model also assumes that each WBS activity that is
not 100% variable will be able to take on the additional workload without incurring
additional fixed costs. Finally, the accuracy of the % variability factor is critical to the
output of the model. Additionally, the offeror must provide cost, rate, and variability data
in order for the source selection team to use the ORI model.
22
Summary
Best value source selections evaluate all relevant factors associated with an
offeror's proposal. If an offeror has an existing facility with excess capacity, then this a
benefit that should be quantified. The C-5 maintenance competition was the first source
selection to recognize these savings as a benefit. The source selection team used the
Overhead Rate Impact model to evaluate the savings during the evaluation period.
Because of these factors, this research focuses on the effectiveness of the model used
during this source selection. The next chapter will outline the methodology used to
gather the data to evaluate the ORI model.
23
III. Methodology
Introduction
The chapter describes the methodology used to answer the research questions
posed in Chapter 1 of this research. The discussion includes the methodology used to
analyze the ORI model, the rationale behind the data collection method chosen, the
development of the interview questions, how experts were identified and selected, and
how the data will be used to evaluate the ORI model.
Methodology
The selection of a research methodology is one of the most important steps in
beginning a research effort. The design of a research effort constitutes a blueprint for
collecting, measuring, and analyzing data (Cooper and Schindler, 1998:130). There are
five major research designs in the social sciences: experiments, surveys, archival
analysis, histories, and case studies (Yin, 1994:4). Yin proposed a set of conditions to
guide researchers in choosing the most advantageous strategy for their particular research
questions (Yin, 1994:4). The three conditions are:
(1) the type of research posed;
(2) the extent of control an investigator has over actual behavioral events;
(3) the degree of focus on contemporary as opposed to historical events.
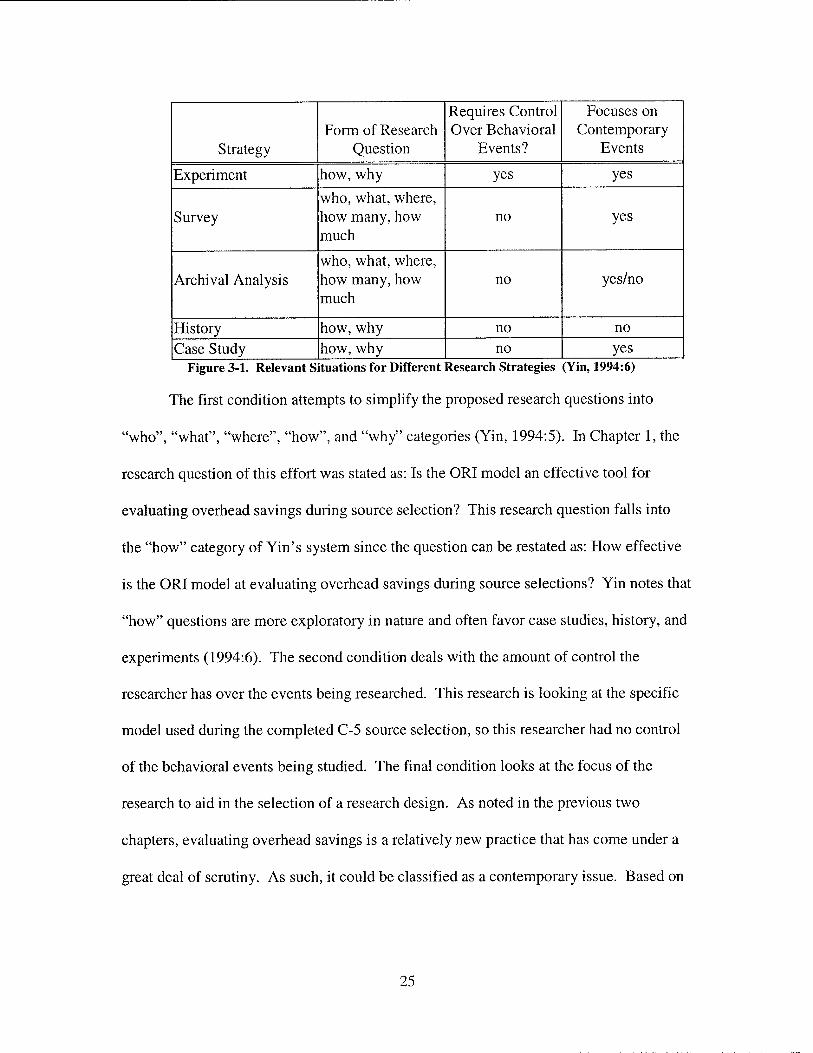
Based on these three conditions, Yin developed the system represented in Figure 3-1 to
guide researchers in selecting the most appropriate research methodology.
24
Strategy Form of Research
Question
Requires Control Over Behavioral
Events?
Focuses on Contemporary
Events
Experiment how, why yes yes
Survey who, what, where, how many, how much
no yes
Archival Analysis who, what, where, how many, how much
no yes/no
History how, why no no Case Study how, why no yes
Figure 3-1. Relevant Situations for Different Research Strategies (Yin, 1994:6)
The first condition attempts to simplify the proposed research questions into
"who", "what", "where", "how", and "why" categories (Yin, 1994:5). In Chapter 1, the
research question of this effort was stated as: Is the ORI model an effective tool for
evaluating overhead savings during source selection? This research question falls into
the "how" category of Yin's system since the question can be restated as: How effective
is the ORI model at evaluating overhead savings during source selections? Yin notes that
"how" questions are more exploratory in nature and often favor case studies, history, and
experiments (1994:6). The second condition deals with the amount of control the
researcher has over the events being researched. This research is looking at the specific
model used during the completed C-5 source selection, so this researcher had no control
of the behavioral events being studied. The final condition looks at the focus of the
research to aid in the selection of a research design. As noted in the previous two
chapters, evaluating overhead savings is a relatively new practice that has come under a
great deal of scrutiny. As such, it could be classified as a contemporary issue. Based on
25
Yin's system for selecting a research design, the case study methodology is the most
appropriate manner in which to evaluate the ORI model.
Case Study Design
Once the case study methodology was chosen, the next step involved determining
the type of case study design to be used. Yin further outlined case study designs by
providing a methodology to aid the researcher in selecting the most appropriate case
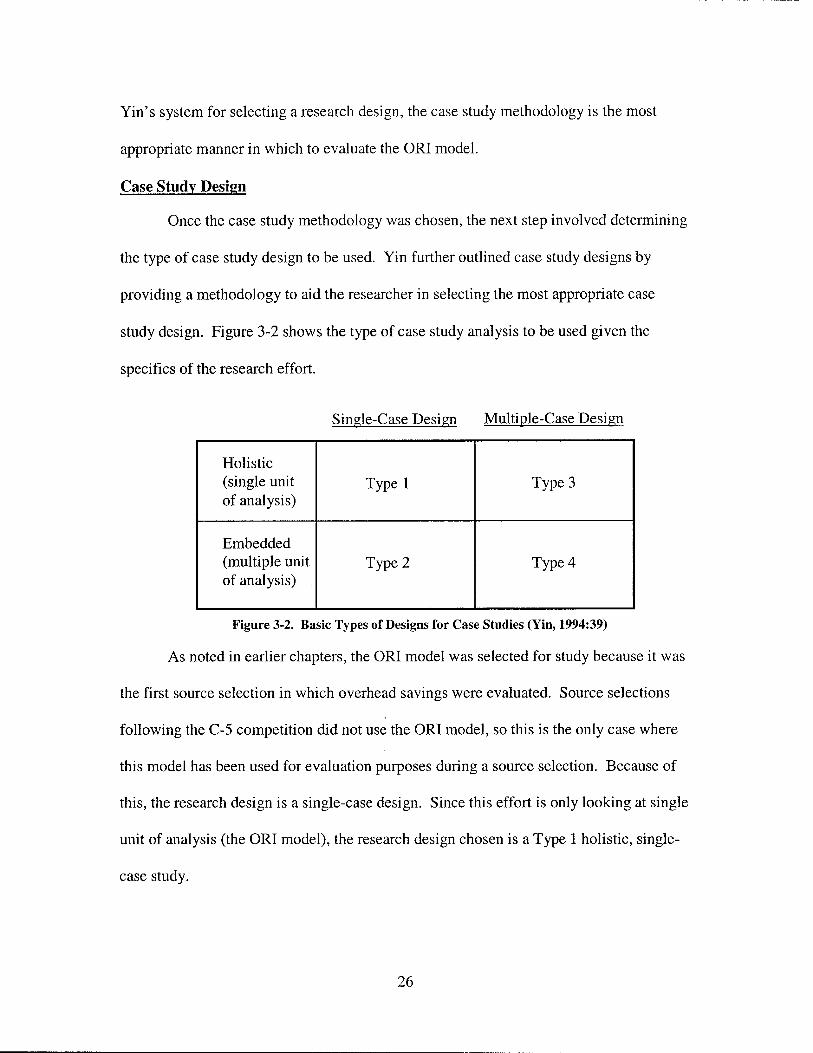
study design. Figure 3-2 shows the type of case study analysis to be used given the
specifics of the research effort.
Single-Case Design Multiple-Case Design
Holistic (single unit of analysis)
Type 1 Type 3
Embedded (multiple unit of analysis)
Type 2 Type 4
Figure 3-2. Basic Types of Designs for Case Studies (Yin, 1994:39)
As noted in earlier chapters, the ORI model was selected for study because it was
the first source selection in which overhead savings were evaluated. Source selections
following the C-5 competition did not use the ORI model, so this is the only case where
this model has been used for evaluation purposes during a source selection. Because of
this, the research design is a single-case design. Since this effort is only looking at single
unit of analysis (the ORI model), the research design chosen is a Type 1 holistic, single-
case study.
26
Data Collection
Interviews were chosen as the most appropriate data collection methodology for
this research. This research sought to draw out expert opinion regarding the applicability
and accuracy of the ORI model based on their experience. The only two data collection
methods suitable to gather this information were questionnaires and interviews, and a
questionnaire was deemed too structured because it would not provide the specific insight
that this research was seeking. Glastonbury and MacKean note that often times there is
little alternative to interviewing because of the nature of the data sought by the researcher
(1991:227). The interaction between the interviewer and the interviewee provides an
opportunity for the researcher to seek further clarification or explanation regarding
answers. The ability to allow the experts to elaborate on their opinions, make specific
points, provide additional insight, and make any suggestions they saw fit was necessary
because that was the specific information this research sought. These factors led me to
choose interviews as the appropriate data collection method.
All interviews were conducted in accordance with AFI 36-2601, Personnel: Air
Force Personnel Survey Program and local Air Force Institute of Technology (AFIT)
procedures. Participants were reminded that their identities would not be disclosed and
that their responses would not be incorporated into this research in such a way that allows
tracking back to the source. The pool of potential interviewees consisted of those
personnel who participated in the C-5 source selection. This limited the number of
potential subjects who could be interviewed. Though this research is dealing with a
relatively small sample, the experience of using the model is the exact knowledge that
these interviews sought to extract. The small sample is a reality of dealing with a new,
27
previously un-researched topic. Because this research is exploring the opinions of the
users and is a case study, it is not believed that sample size is a threat to the validity of
this research.
Interviews
The purpose of these interviews was to gather expert opinions on the accuracy
and validity of the model. The interview questions are listed below. The interview
questions are very simple and straightforward. The questions are explicate enough to
ensure the interviewee understands what he or she is being asked while allowing plenty
of flexibility for the experts to answer the question as they see fit. The open-ended nature
of the questions is common in case study interviews because it allows the respondent to
provide their opinion as well as the facts about the specific case (Yin, 1994:84).
The first two questions were asked to ensure the interviewee has experience
working with the ORI model. The rest of the questions are directly linked to the research
objectives they support.
The experts were identified as members of the C-5 Source Selection Cost IPT.
These were the actual people who worked with the ORI during the source selection, so
they had far more insight than anyone regarding the effectiveness of the model. Of the
10 potential experts, 6 were contacted and interviewed for this research.
Interview Questions
1. Are you familiar with the concept of overhead savings?
2. Have you used the ORI model to calculate overhead savings in past or present
source selections?
3. What do you feel are the strengths of this model?
28
4. What do you feel are the weaknesses of this model?
5. How would you suggest improving on this model?
6. What would be the most accurate way of calculating overhead savings?
Evaluation of model
Once the interviews were completed, I used the results to evaluate the accuracy
and effectiveness of the ORI model in calculating overhead savings. The interview
results provided a basis to establish the strengths and weaknesses of the model. The
interview results also provided a foundation to recommend improvements to the ORI
model and theoretical ideas of how to ideally estimate overhead savings.
Limitations of Methodology
Though a case study analysis was deemed the most appropriate methodology for
this research, there are some limitations that should be addressed. The first limitation is
the experts from whom the data was collected. The C-5 Source Selection was conducted
in 1996, and the data collection for this research was collected in December 2000 and
January 2001. This forced the experts to draw on events and experiences that happened
over four years ago. Additionally, the experts only used the model for this one source
selection, so familiarity with the model was limited to this specific experience. Although
these limitations exist, they are the result of analyzing a specific case study. The experts
identified are such because they used the model for the specific purpose of estimating
overhead savings. Their experiences in this case are exactly what this research sought to
capture. Finally, as noted in chapter 2, the GAO has used this model in evaluating the
excess capacity at public depots. Including members of the GAO and analysts that were
29
involved in the development of the model as potential experts could have added to the
external validity of this research. Though others could have provided insight into the
functioning of the model, their usefulness for this research was insignificant since they
had no experience with using the model to estimate overhead savings.
Summary
This research used an open-ended interview technique to extract expert opinions
regarding the ORI model. Interviews were used to gather expert opinions regarding the
strengths and weaknesses of the ORI model. The experts also provided insight on how to
improve the ORI model and how to ideally estimate overhead savings. Though there are
some limitations to the methodology used, it was appropriate given the research
objectives. The following chapter presents the results of the interviews and the analysis
of the ORI model based on these results.
30
IV. Findings and Analysis
Introduction
This chapter contains the research findings and analysis resulting from the
interview process. The results of the interviews are presented beneath the research
objective that the interview question supports. The chapter concludes with a theoretical
recommendation of how to evaluate overhead savings.
Research Objective 1
Identify the strengths of the Overhead Rate Impact (ORI) model
Each of the experts was asked to identify the strengths of the Overhead Rate
Impact model. This question was important for this research because it helped identify
positive aspects of the model. It also recognized aspects that should be included in the
"ideal method".
All six of the experts interviewed identified the fact that the model is
straightforward and easy to use as its primary strength. Once the data is provided for the
model, it is simple to input the relevant information, and the model then calculates the
savings. One expert identified another strength of the model to be that it forces the
source selection team to consider the impact of adding or deleting work from an existing
facility. This expert felt that even if the information provided by the model was not
entirely accurate, the model provides a rough estimate of the impact of additional work to
the facility. The fact that the model forces this consideration is a strength in itself.
Additionally, this expert noted that the biggest obstacles most source selection teams face
is time constraints. Given this constraint, this model provides the team with a tool to
quickly gain an overall idea of the magnitude of savings the new workload will generate.
31
Research Objective 2
Identify the weaknesses of the Overhead Rate Impact (ORI) model
The experts were asked their opinions of the weaknesses of the ORI model. It
was necessary to identify the weaknesses of the model in order to identify areas where
accuracy and applicability could be improved.
All of the experts identified the primary weakness of the ORI model being that the
model assumed one overhead rate for the entire base. The bottom line of the model
provides an estimated overhead rate based on the existing workload and the proposed
workload. This overhead rate results from adding all of the production overhead costs for
the entire base and then dividing that cost by the total existing hours on the base before
and after the additional workload.
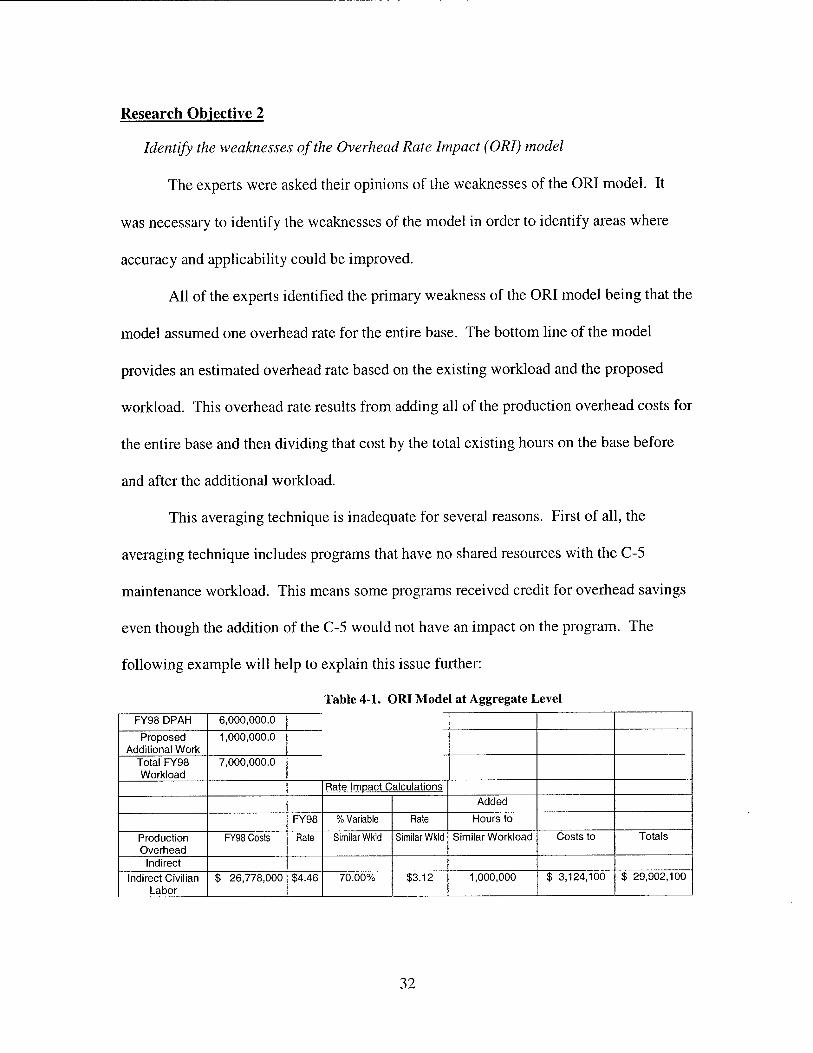
This averaging technique is inadequate for several reasons. First of all, the
averaging technique includes programs that have no shared resources with the C-5
maintenance workload. This means some programs received credit for overhead savings
even though the addition of the C-5 would not have an impact on the program. The
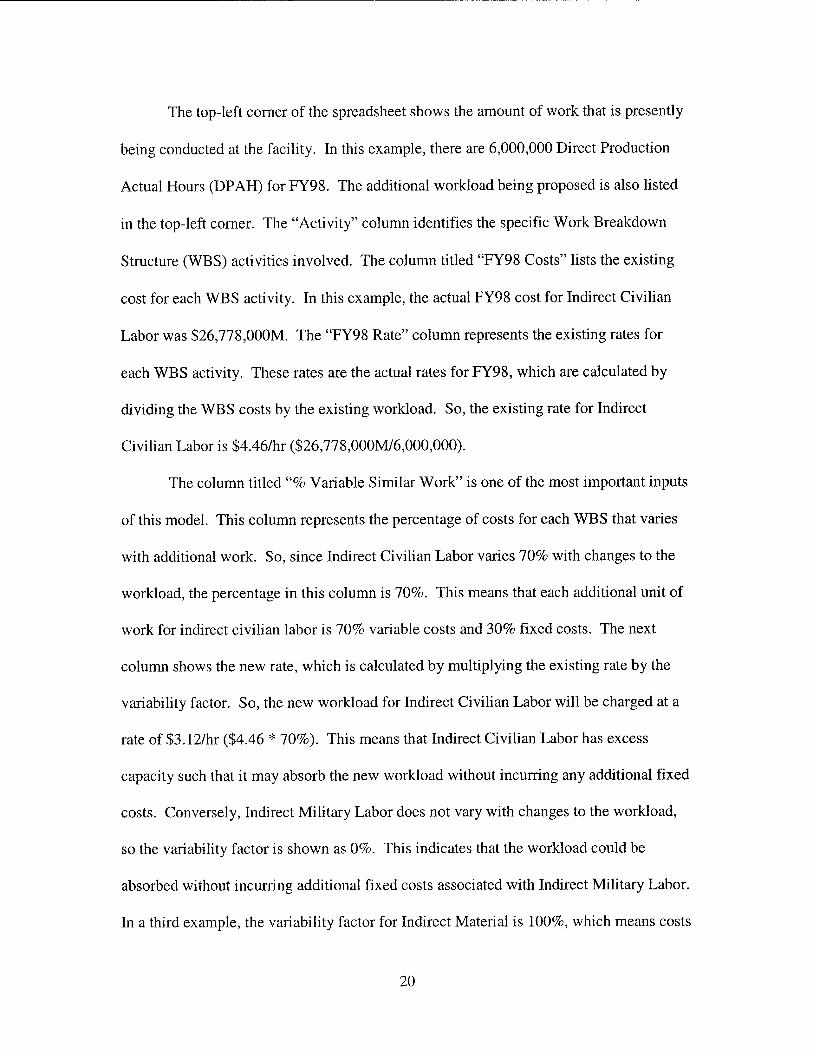
following example will help to explain this issue further:
Table 4-1. ORI Model at Aggregate Level
FY98 DPAH 6,000,000.0
Proposed Additional Work
1,000,000.0
Total FY98 Workload
7,000,000.0
Rate Impact Calculations Added
FY98 % Variable Rate Hours to
Production Overhead
FY98 Costs Rate Similar Wkld Similar Wkld Similar Workload Costs to Totals
Indirect Indirect Civilian
Labor $ 26,778,000 $4.46 70.00% $3.12 1,000,000 $ 3,124,100 $ 29,902,100
32
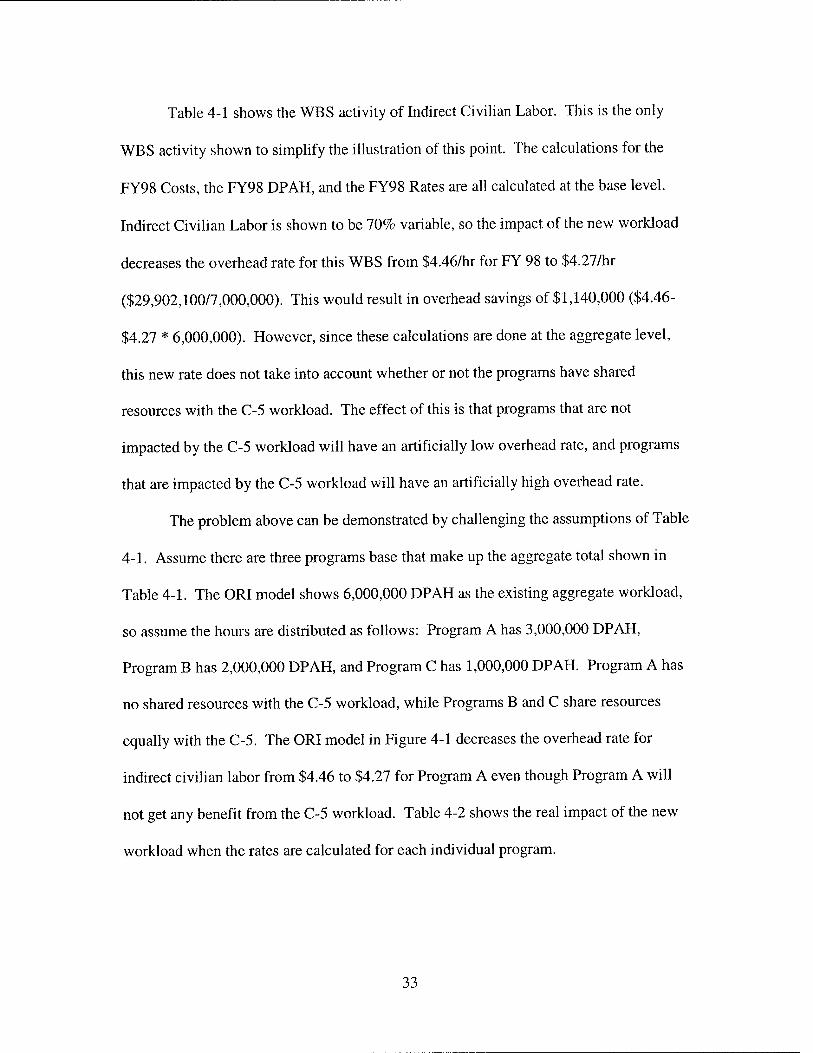
Table 4-1 shows the WBS activity of Indirect Civilian Labor. This is the only
WBS activity shown to simplify the illustration of this point. The calculations for the
FY98 Costs, the FY98 DP AH, and the FY98 Rates are all calculated at the base level.
Indirect Civilian Labor is shown to be 70% variable, so the impact of the new workload
decreases the overhead rate for this WBS from $4.46/hr for FY 98 to $4.27/hr
($29,902,100/7,000,000). This would result in overhead savings of $1,140,000 ($4.46-
$4.27 * 6,000,000). However, since these calculations are done at the aggregate level,
this new rate does not take into account whether or not the programs have shared
resources with the C-5 workload. The effect of this is that programs that are not
impacted by the C-5 workload will have an artificially low overhead rate, and programs
that are impacted by the C-5 workload will have an artificially high overhead rate.
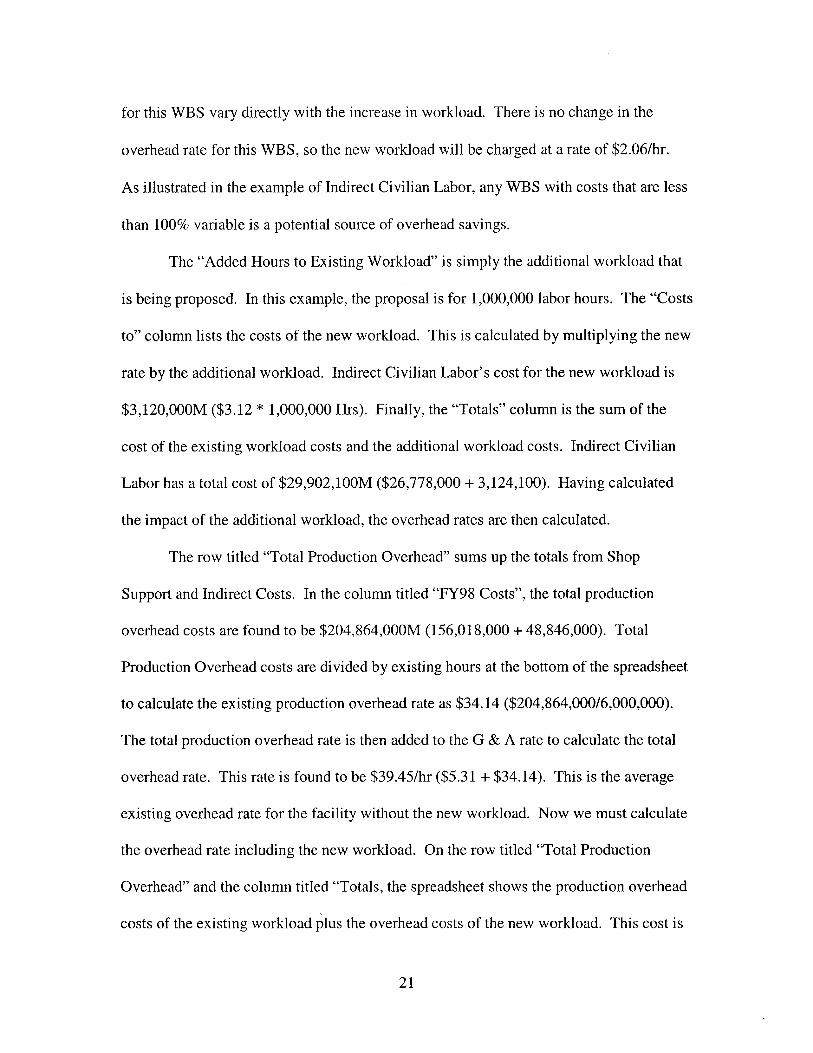
The problem above can be demonstrated by challenging the assumptions of Table
4-1. Assume there are three programs base that make up the aggregate total shown in
Table 4-1. The ORI model shows 6,000,000 DP AH as the existing aggregate workload,
so assume the hours are distributed as follows: Program A has 3,000,000 DP AH,
Program B has 2,000,000 DP AH, and Program C has 1,000,000 DP AH. Program A has
no shared resources with the C-5 workload, while Programs B and C share resources
equally with the C-5. The ORI model in Figure 4-1 decreases the overhead rate for
indirect civilian labor from $4.46 to $4.27 for Program A even though Program A will
not get any benefit from the C-5 workload. Table 4-2 shows the real impact of the new
workload when the rates are calculated for each individual program.
33
CD CO z: x
CD
CÄ
o CM O
JO
o
■o CD
T3 X5 <
CO cz
_o jo rj .o CO Ü -*—' o CO Q.
E CD CO
CC
CO o Ü
■o CO o
o -*
£ * E
CO
33 JX
CD £
x ig E
CO
I- « > cc co
51 ^ CO
oo o> °) a fT CC
CO o Ü 00
>-
o o o O) oo co co"
o
<M
CO c/>
o o Ö
CD
■<t
o o o a> CO co co" co" 5>
o o o o" o o
JO CO
+-» o I-
co ■4—»
CO o Ü
■o CO o
o -* CD CO ° T3 i= & "öS < 11
'E CO
35 .*:
S5 DC IS
E to
.CO I>
CO CO
51 ^ CO
co £ o> CO
CO o Ü oo en
LL
O lO O CO 00 ^1-
O m o CM" CD in
5* o o o o o in
CM
co
o o d
CD
o o o o o o CD" O" CM O O) o oo" CM"
v>
B o I-
co o o T3 CO o
o -* 73 ~ o CD CO °
"o 5 <t ° Ja X IS I CO
32 .*:
CD § 03 JS CC IS
£ CO
-° > .55 > CO _cö
51 ^ CO
oo B SJ> CO >- CC LL
CO o Ü oo
o m o in CM o CD"
o in o CM" CD in
S> o o o d o m
CM
co c/>
o o d r--
CD
o o o co" CD
o o o o" o o
03 U W) o u
PLH
'S
c U
=2
>, "a a < a
u > o r\
3 S3
H
■3- co
< o o CC QL
Q < LU X X LU > o
o .a co _i c CO
Oh!T
CC - c > X LL
m
< CC CD O CC Q.
Q < LU X X LU > o
o CO _i
CO
o y- =5 T
SssS CC - c > X LL
o
< X Ü o X X
a < LU X X LU > o -z. o . P o o LU 3 gc Q Q O z: X —
x
o X3 CO _1 c CO
Is X Q
^ co 12 a> = >-
LL
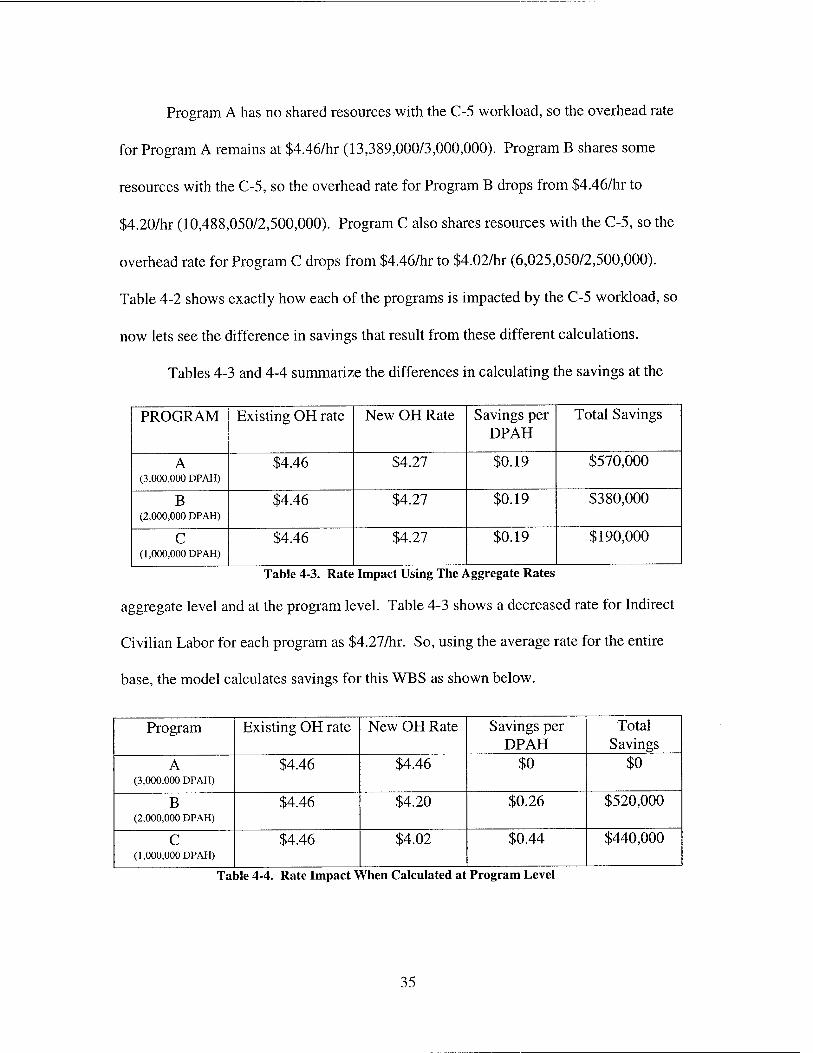
Program A has no shared resources with the C-5 workload, so the overhead rate
for Program A remains at $4.46/hr (13,389,000/3,000,000). Program B shares some
resources with the C-5, so the overhead rate for Program B drops from $4.46/hr to
$4.20/hr (10,488,050/2,500,000). Program C also shares resources with the C-5, so the
overhead rate for Program C drops from $4.46/hr to $4.02/hr (6,025,050/2,500,000).
Table 4-2 shows exactly how each of the programs is impacted by the C-5 workload, so
now lets see the difference in savings that result from these different calculations.
Tables 4-3 and 4-4 summarize the differences in calculating the savings at the
PROGRAM Existing OH rate New OH Rate Savings per DPAH
Total Savings
A (3,000,000 DPAH)
$4.46 $4.27 $0.19 $570,000
B (2,000,000 DPAH)
$4.46 $4.27 $0.19 $380,000
C (1,000,000 DPAH)
$4.46 $4.27 $0.19 $190,000
Table 4-3. Rate Impact Using The Aggregate Rates
aggregate level and at the program level. Table 4-3 shows a decreased rate for Indirect
Civilian Labor for each program as $4.27/hr. So, using the average rate for the entire
base, the model calculates savings for this WBS as shown below.
Program Existing OH rate New OH Rate Savings per DPAH
Total Savings
A (3,000,000 DPAH)
$4.46 $4.46 $0 $0
B (2,000,000 DPAH)
$4.46 $4.20 $0.26 $520,000
C (1,000,000 DPAH)
$4.46 $4.02 $0.44 $440,000
Table 4-4. Rate Impact When Calculated at Program Level
35
However, Table 4-4 illustrates the real impact to the existing overhead rates due
to the increased workload. Since Program A does not have any shared resources with the
C-5, the program does not realize any savings. But Programs B and C do share
resources, and their actual rates are lower than predicted by the averaging technique.
So, by using the average rates as the ORI model does, some programs receive
credit for overhead savings when they shouldn't, and some programs do not receive
enough credit for the savings that will actually occur. Furthermore, the total amount of
savings recognized by this single WBS is lower when the calculations are done at the
program level.
All of experts also identified the potential error in inputs as the next major
weaknesses of the ORI model. To begin, the percent variability factor was simply
provided by expert opinion. The offeror could not validate these factors with data, and
no grassroots estimate or bottom-ups build-up was ever conducted to determine the
accuracy of these factors. The experts felt that this potentially introduced error and/or
bias. Since these factors are one of the most important inputs of the model, it is
reasonable to expect data to support the factors provided. Another issue related to the
averaging technique used by the ORI model is that it assumes all indirect costs pools are
the same.
Another weakness identified by 4 of the 6 experts is that the model does not
address how much excess capacity exists for each WBS activity and the applicable range
for the overhead rates. The model allows activities to absorb an unlimited amount of
workload if the percent variability factor is less than 100%. This practice assumes that
each of the activities has enough excess capacity to absorb that amount of workload.
36
While some activities may be able to absorb the entire new workload and realize
overhead savings, it is not necessarily true for all activities. This application assumes that
the existing costs are linear or applicable for an unlimited amount of work. The experts
recognized that this was not necessarily the case. For example, lets assume a WBS
activity has 100,000 hours of existing work and is operating at 70% capacity. A proposal
is submitted for another 100,000 hours of work, and the WBS activity is given a percent
variability factor of 50%. Since the WBS activity has a percent variability factor less
than 100%, it would be a potential source of savings in the ORI model. The model would
allow savings to be credited for the entire 100,000 hours; however, savings would not
result over the entire range because the activity does not have the capacity to absorb all
the new work. From a theoretical standpoint, since the WBS activity is operating at 70%
capacity, the most amount of work it could absorb is about 43,000 hours (100,000/.7). At
that point, the WBS activity would be operating at 100% capacity. At that point, the
WBS activity would have to incur more fixed costs, such as faculties or machinery, to
accomplish the work. When additional fixed costs are incurred, the overhead savings
calculations provided by the ORI are no longer applicable. The overhead rates would
change as a result of the additional fixed costs, so the rates in the ORI model would not
be valid for the workload that exceeded 100% capacity for the WBS. The costs in the
model are assumed to be linear over an unlimited range, when in reality they are incurred
in a step-function fashion.
Another weaknesses of the ORI model identified by 5 of the 6 experts is that the
overhead rates provided in the model where not associated with the overhead rates in the
offerer's bid. As mentioned earlier, the overhead rates where calculated based on the
37
workload of the entire depot. Therefore, the overhead rates calculated in the ORI model
where not the true rates associated with the C-5 workload. In fact, since the rates in the
ORI model were calculated based on averages, these rates could not be identified in any
program on the base. Without a connection between the rates in the model and the rates
in the bid, the source selection team had difficulty determining how the calculated
savings would actually impact the offerer's bid.
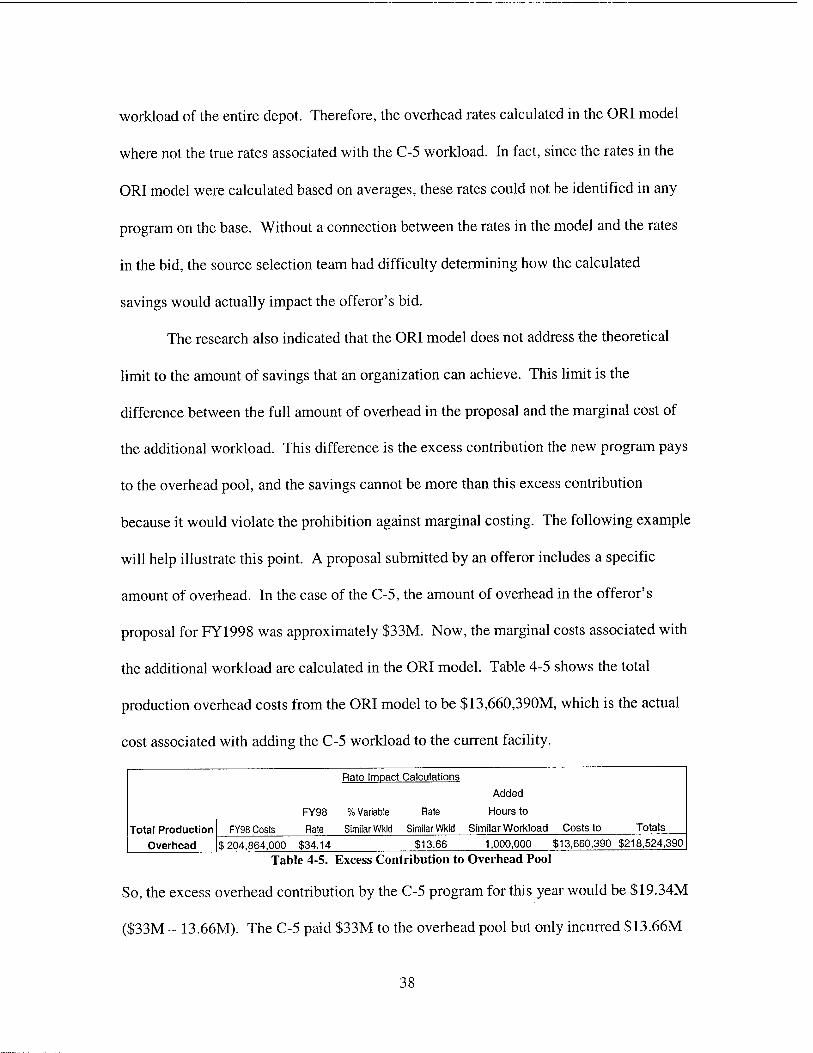
The research also indicated that the ORI model does not address the theoretical
limit to the amount of savings that an organization can achieve. This limit is the
difference between the full amount of overhead in the proposal and the marginal cost of
the additional workload. This difference is the excess contribution the new program pays
to the overhead pool, and the savings cannot be more than this excess contribution
because it would violate the prohibition against marginal costing. The following example
will help illustrate this point. A proposal submitted by an offerer includes a specific
amount of overhead. In the case of the C-5, the amount of overhead in the offerer's
proposal for FY1998 was approximately $33M. Now, the marginal costs associated with
the additional workload are calculated in the ORI model. Table 4-5 shows the total
production overhead costs from the ORI model to be $13,660,390M, which is the actual
cost associated with adding the C-5 workload to the current facility.
Rate Impact Calculations
Added
FY98 % Variable Rate Hours to
Total Production Overhead
FY98 Costs Rate Similar Wkld Similar Wkld Similar Workload Costs to Totals
$ 204,864,000 $34.14 $13.66 1,000,000 $13,660,390 $218,524,390
Table 4-5. Excess Contribution to Overhead Pool
So, the excess overhead contribution by the C-5 program for this year would be $19.34M
($33M - 13.66M). The C-5 paid $33M to the overhead pool but only incurred $13.66M
38
in overhead costs. The excess contribution of $19.34M is the maximum amount of
savings that can be achieved for this specific year. However, the ORI model calculated
overhead savings at $21,960,000 ($3.66 * 6,000,000). The ORI model should recognize
that there is a limit to the amount of overhead savings that can be achieved.
Research Objective 3
Identify areas were the Overhead Rate Impact (ORI) model could be improved
The experts were asked to identify specific areas of the ORI model that, in their
opinion, could be improved to enhance the accuracy of the ORI model. It was
necessary to identify these areas in order to help this research arrive at the theoretical
"ideal way" to estimate overhead savings. As expected, the suggestions for improving
the ORI model are closely linked to the weaknesses identified by the experts.
All of the experts stated that the evaluation of overhead rates and the impact new
workloads would have on these overhead rates should be conducted at the lowest level
possible. Their suggestion was to analyze every Responsibility Cost Center (RCC) that
would potentially share resources with the new workload. The RCC is the "shop level"
and is the lowest level where costs are tracked in the Air Force. Rates would then be
calculated for each specific RCC, which would greatly improve the reliability and
accuracy of the overhead savings estimates.
Each of the experts also commented that the validity of the percent variability
factors must be validated to a greater extent. By conducting analysis at the RCC level,
the source selection team would be able to confirm these factors through data analysis
and discussions with the RCC managers. One expert commented that a regression
analysis of how new workloads have impacted overhead rates in the past would be
39
helpful to gain an understanding of how the facility captured the proposed savings. This
expert noted that the regression analysis in itself should not be used to estimate overhead
rates because the estimates would be outside of the regression's applicable range, but that
the regression would be useful to gain an understanding of the RCCs ability to achieve
savings.
Four of the experts agreed that the rates provided by the ORI model where
relatively useless if they were not linked to the offeror's bid. Encompassing the actual
rates in the model will help make the identified savings defendable. An analysis at the
RCC level would also be able to validate the amount of excess capacity for each RCC.
As noted earlier, an understanding of the amount of excess capacity is necessary to
ensure savings are applied correctly. Finally, the model needs to address the fact that
there is theoretical limit to the amount of savings that can be realized.
Research Objective 4
Identify factors of the "ideal" method of estimating overhead savings
All of the experts suggested the best way to estimate overhead savings during
source selections was to conduct the analysis at the lowest level possible. By conducting
the analysis at the shop level, analysts would be able to determine which RCC were
impacted by the new workload. This level of analysis would also provide insight to the
excess capacity for each of the RCCs, and the validity of the estimates would be greatly
enhanced by conducting such a low level analysis. In addition to the data analysis at the
shop level, source selection members would interview the shop leaders for their expert
opinion regarding the impact of the new workload. If the expert opinion coincided with
40
the data analysis, then source selection members would have a better assurance that the
estimate was as accurate as possible.
Two experts stated that the ideal situation would be to establish cost-trade curves
for each of the RCCs involved in the workload. These curves would provide an excellent
source for determining the amount of excess capacity and the applicable range for the
present costs. They both noted that an Activity Based Costing system would be
necessary to identify costs in such a precise manner.
Summary
This chapter presented the results of the interviews conducted for this research.
The interviews revealed that the experts felt the Overhead Rate Impact model was an
inadequate method of estimating overhead savings. They disagreed with the model's
assumption that one overhead rate can be used to estimate overhead for an entire facility.
They also questioned the validity of the inputs provided for the model. If there is no
assurance that these inputs are reasonably accurate, then the output of the model is
unreliable. The experts also noted that the costs and rates associated with the model
should be linked directly to the offerer's bid. If they are not, then the accuracy of these
inputs becomes more questionable. Finally, the model does not address the fact that
overhead savings are achieved in a "step-order" fashion. The assumption that existing
rates are relevant over an unlimited range is inaccurate. Overhead savings may be
achieved only up to the point where the workload exceeds the facilities max capacity. At
this point, more fixed costs would have to be incurred to handle the workload. The next
chapter will provide conclusions and recommendations based on these results and the
analysis of these results.
41
V. Conclusions and Recommendations
Introduction
This chapter presents the recommendations and conclusions of this research based
on the interview results presented in the previous chapter. The goal of this chapter is to
draw a conclusion regarding the accuracy and effectiveness of the ORI model and to
make recommendations for how to conduct overhead savings analysis in future source
selections.
Research Objective 1
Identify the strengths of the Overhead Rate Impact (ORI) model
The results indicated that there were very few strengths of the ORI model. The
strength most frequently noted by the experts was that the model could provide an
estimate very quickly. Since source selection teams are often operating under a time
constraint, the estimate provided by the ORI model is better than none at all.
Research Objective 2
Identify the weaknesses of the Overhead Rate Impact (ORI) model
The interviews revealed several weaknesses of the ORI model. The most widely
noted weakness was that the average overhead rate assumed by the ORI model was
inaccurate. The existing overhead rates where calculated using base-wide costs and
hours. The analysis in the previous chapter showed how this technique distorted the
actual overhead rates of different programs. It credited programs with savings when
there where no shared resources with that program and the C-5, and it did not give
enough credit to programs that would share resources with the C-5.
42
Another major weakness of the model was the validity surrounding the variability
factor inputs of the model. There was no audit trail provided or available that the source
selection team could use to assure the accuracy of these factors. Without the ability to
validate these factors, the output of the model is immediately questionable.
The model assumption regarding the linearity of costs was another weaknesses
revealed through the data collection process. Clearly, the overhead rates are only
reasonable for an established workload range based on the amount of excess capacity for
each RCC. Once the workload exceeds the capacity for an RCC, the overhead rates are
no longer reliable because additional fixed costs must be incurred.
Research Objective 3
Identify areas were the Overhead Rate Impact (ORI) model could be improved
The recommended improvements to the ORI model are tied closely to the experts'
opinions regarding the weaknesses of the model. The results show that the model could
be vastly improved by ensuring the overhead rates in the model are calculated at the
lowest level possible. This will ensure only those shops that will share resources with the
new workload will receive credit for overhead savings. An analysis of the excess
capacity at the shop level will further improve the model by establishing the applicable
range for the overhead rates and the savings associated with the new workload. The
percent variability factor is a crucial input into the ORI model, and the model's output
would be vastly improved if analysts had greater confidence in how these factors are
calculated.
43
Research Objective 4
Based on the results of this research, an analysis of overhead savings during
future source selections should include each of the following:
1) Overhead rates should be calculated at the lowest level possible
2) Conduct analysis of the excess capacity for each shop impacted by the workload
3) Conduct a regression analysis at the shop level to provide an audit trail to substantiate how past savings have been achieved
4) Ensure the rates evaluated for overhead savings match the overhead rates in the offeror's proposal
5) Evaluate the applicable range for existing and future overhead rates
6) Recognize the theoretical maximum for achievable overhead savings
7) Validate the variability factors of workload at the lowest levels
Barriers to Implementing this Method
While the experts identified the ideal manner in which to estimate overhead
savings, there are some barriers to implementing their suggestions. The first and most
significant is the time constraint that most source selection teams face. Analyzing each
individual show would take a great deal of time and manpower, and often times the
source selection teams do not have the resources to commit to such an in-depth analysis.
Access to the data is another potential barrier to this method. If the offerer is public, then
the information may not be in an appropriate form for the source selection team to
conduct a proper analysis. If a private offerer proposes overhead savings, then the
offerer may be unwilling to provide the team with the information.
44
Limitations of this Research
The first limitation to this research is the fact that the conclusions are drawn off of
a relatively small sample size. Given the fact that this research was a case study of the
specific model used during this source selection, the entire population of potential
interviewees was limited to individuals who worked with the model during the C-5
source selection. As identified earlier, other potential interviewees where excluded from
the population because their experience did not deal with the model for this specific case.
The opinions of the experts who have used the ORI model were the exact information
this research was attempting to extract. Since these experts comprised the population of
subjects with the knowledge and experience to form opinions regarding the ORI model, it
is reasonable to conclude that their opinions are reflective of those others might draw
regarding the ORI model's usage in this case. Although members from the private
offeror could have provided insight for the methodology used during this source
selection, access and time constraints prevented their inclusion into the population of
experts.
Because this research was qualitative in nature and employed an interview as the
primary data collection methodology, the conclusions are subject to individual bias and
interpretation. Additionally, the experts' experiences occurred four years ago, so there is
the possibility that their recollection of the methodology was not complete. However,
these facts do not detract from the conclusions drawn from these interviews because the
bias and interpretation help comprise each individual's opinion. Regardless of how the
subjects' opinions regarding the applicability or accuracy of the model where formed,
45
this research specifically sought to extract those opinions. As such, this is not believed to
be a threat to this research's validity.
Recommendations for Further Research
This research is believed to be the first to investigate the methodologies used to
evaluate overhead savings during source selections. As mentioned in chapter 2, there
have been several source selection since the C-5 competition to evaluate overhead saving
during the selection process. A review of each of the methodologies used during these
source selections would help to validate the accuracy of the conclusions drawn from this
research.
Additional research efforts could be undertaken to determine the actual savings
achieved by the programs. An analysis of the current overhead rates for the C-5 program,
or others programs where credit for overhead savings was provided during the source
selection, would be useful to determine the actual savings being captured by the
government.
Additional research of this specific model could also be conducted by widening
the scope of experts. Further research could include analysts from the depots and
analysts from the GAO. Though they could not provide insight into this specific source
selection, they could provide their opinions of the model and how it should be used to
estimate overhead savings.
46
Bibliography
Baseman, Leroy T. Class Handout, QMGT 680, Project Risk Analysis. School of Systems and Logistics, Air Force Institute of Technology, Wright-Patterson AFB OH. 24 April 2000.
Conver, S.K. "Shaping the Downsizing," Armed Forces Journal International: 48-51 (March 1993).
Cooper, Donald R. and Pamela S. Schindler. Business Research Methods (6th Edition). New-York: Irwin McGraw-Hill Book Company, 1998.
Department of the Air Force. United States Air Force Source Selection Procedures Guide. Washington: GPO, 2000.
Department of the Army. Procurement: Best Value Source Selection Guide To Best Practices. Winchester, Virginia: Transatlantic Programs Center, 1997.
Department of the Army. Army Federal Acquisition Regulation. Washington: GPO, 2000.
Department of Defense. Defense Acquisition. DoD Directive 5000.1. Washington: GPO,23Feb91.
Department of Defense. Federal Acquisition Regulation. Washington: GPO, 2000.
Edwards, Vernon J. Questions & Answers about Best-Value Source Selection. Washington DC: The George Washington University, 1994.
Fultz, JackF. Overhead. Cambridge: Abt Associates, Inc., 1980.
Gansler, J.S. Affording Defense. Cambridge: MIT Press, 1989.
General Accounting Office. Overhead Costs: Defense Industry Initiatives to Control Overhead Rates. GAO/NSIAD-95-115. Washington: GPO, May 1995.
General Accounting Office. Air Force Depot Maintenance: Privatization-in-Place Plans Are Costly While Excess Capacity Exists. GAO/NSIAD-97-130. Washington: GPO, December 1996.
General Accounting Office. Public-Private Competitions: Processes Used for C-5 Aircraft Award Appear Reasonable. GAO/NSIAD-98-72. Washington: GPO, January 1998.
47
Garrison, Ray H. and Eric W. Noreen. Managerial Accounting (7th Edition). Boston: Irwin, Inc., 1994.
Glastonbury, Bryan and Jill MacKean. "Survey Methods." Handbook for Research Students in the Social Sciences. Ed. Graham Allan and Chris Skinner. Bristol: Falmer Press, 1991.
Mickaliger, Michael J. "Understanding Source Selections: A Best-Value Methodology," Contract Management, 39: (Aug 1999).
Request for Proposal. C-5 Annual Maintenance Competition. Spring 1996.
Under Secretary of Defense for Acquisition. Memorandum 20 December 1997.
Source Selection IPT. "Proposal Analysis Report." Report to Deputy Secretary of the Air Force for Acquisition, Washington. September 1997.
Stockman, William K, Lt Col. Cost IPT Lead, USAF. Personal Interview. 7 April 2000.
Washington, William N. "A Review of the Literature: Competition Versus Sole-Source Procurements," Acquisition Review Quarterly: (Spring 1997).
Yin, Robert K. Case Study Research Design and Methods (2nd Edition). Thousand Oaks: Sage Publications, Inc., 1994.
48
Vita
Captain William N. Ward graduated from Edmond Memorial High School in
Edmond, Oklahoma in May 1991. He entered undergraduate studies at the United States
Air Force Academy, where he graduated with a Bachelor of Science degree in
Management in May 1996. He was commissioned a Second Lieutenant on 29 May 96.
His first assignment was at Los Angeles AFB, CA. In Aug 1996, he was assigned
to the Management Information Systems division of Launch Programs, where he served
as a finance officer. In Dec 98, he was assigned to the Titan Division of Launch
Programs, where he served as a cost analyst. In Aug 1999, he entered the Graduate
School of Engineering and Management, Air Force Institute of Technology. Upon
graduation, he will be assigned to the Joint Strike Fighter Program at Wright-Patterson
AFB.
49
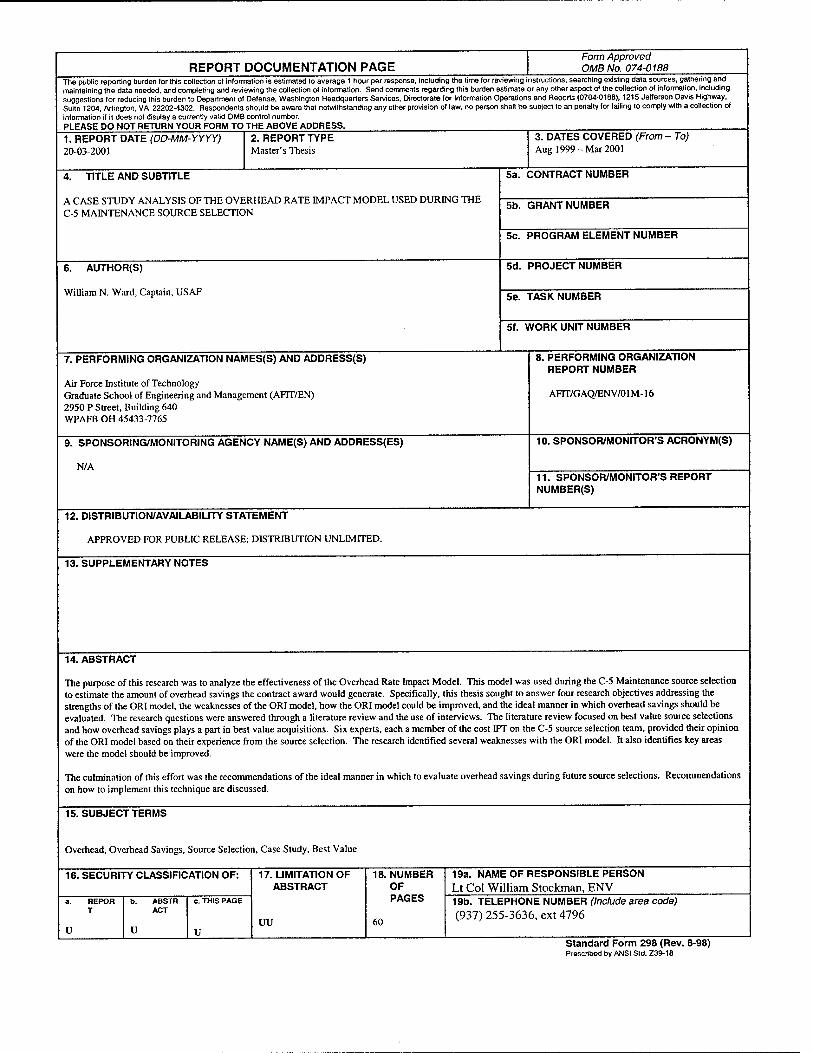
REPORT DOCUMENTATION PAGE Form Approved OMB No. 074-0188
The public reporting burden lor this collection of information is estimated to average 1 hour per response, including the time lor reviewing instructions, searching existing data sources, gathering and maintaining the data needed, and completing and reviewing the collection of information. Send comments regarding this burden estimate or any other aspect of the collection of information, including suggestions for reducing this burden to Department of Defense, Washington Headquarters Services, Directorate for Information Operations and Reports (0704-0188), 1215 Jefferson Davis Highway, Suite 1204, Arlington, VA 22202-4302. Respondents should be aware that notwithstanding any other provision of law, no person shall be subject to an penalty for failing to comply with a collection of information if it does not display a currently valid OMB control number. PLEASE DO NOT RETURN YOUR FORM TO THE ABOVE ADDRESS. 1. REPORT DATE (DD-MM-YYYY) 20-03-2001
2. REPORT TYPE Master's Thesis
TITLE AND SUBTITLE
A CASE STUDY ANALYSIS OF THE OVERHEAD RATE IMPACT MODEL USED DURING THE C-5 MAINTENANCE SOURCE SELECTION
6. AUTHOR(S)
William N. Ward, Captain, USAF
3. DATES COVERED (From - To) Aug 1999 -Mar 2001
5a. CONTRACT NUMBER
5b. GRANT NUMBER
5c. PROGRAM ELEMENT NUMBER
5d. PROJECT NUMBER
5e. TASK NUMBER
5f. WORK UNIT NUMBER
7. PERFORMING ORGANIZATION NAMES(S) AND ADDRESS(S)
Air Force Institute of Technology Graduate School of Engineering and Management (AFIT/EN) 2950 P Street, Building 640 WPAFB OH 45433-7765
9. SPONSORING/MONITORING AGENCY NAME(S) AND ADDRESS(ES)
N/A
8. PERFORMING ORGANIZATION REPORT NUMBER
AFTT/G AQ/ENV/01M-16
10. SPONSOR/MONITOR'S ACRONYM(S)
11. SPONSOR/MONITOR'S REPORT NUMBER(S)
12. DISTRIBUTION/AVAILABILITY STATEMENT
APPROVED FOR PUBLIC RELEASE, DISTRIBUTION UNLIMrTED.
13. SUPPLEMENTARY NOTES
14. ABSTRACT
The purpose of this research was to analyze the effectiveness of the Overhead Rate Impact Model. This model was used during the C-5 Maintenance source selection to estimate the amount of overhead savings the contract award would generate. Specifically, this thesis sought to answer four research objectives addressing the strengths of the ORI model, the weaknesses of the ORI model, how the ORI model could be improved, and the ideal manner in which overhead savings should be evaluated. The research questions were answered through a literature review and the use of interviews. The literature review focused on best value source selections and how overhead savings plays a part in best value acquisitions. Six experts, each a member of the cost IPT on the C-5 source selection team, provided their opinion of the ORI model based on their experience from the source selection. The research identified several weaknesses with the ORI model. It also identifies key areas were the model should be improved.
The culmination of this effort was the recommendations of the ideal manner in which to evaluate overhead savings during future source selections. Recommendations on how to implement this technique are discussed.
15. SUBJECT TERMS
Overhead, Overhead Savings, Source Selection, Case Study, Best Value
16. SECURITY CLASSIFICATION OF:
REPOR T
b. ABSTR ACT
c. THIS PAGE
17. LIMITATION OF ABSTRACT
UU
18. NUMBER OF PAGES
60
19a. NAME OF RESPONSIBLE PERSON Lt Col William Stockman, ENV 19b. TELEPHONE NUMBER (Include area code) (937) 255-3636, ext 4796
Standard Form 298 (Rev. 8-98) Prescribed by ANSI Std. Z39-18