Embed Size (px)
Citation preview
A Business Plan for Inner City Apparel Retail Providing the Latest in Hip Hop and Urban Fashions
December 5, 2002
Executive Summary Image Fashions is a retailing concept that addresses an unmet demand and it will target a profitable emerging market that is affluent, accessible and trend setting. This market is America’s inner city, and, in Chicago alone, there is an estimated gap of $631M between demand and supply. To fill a portion of this gap, Image Fashions will provide the latest in high-end urban and hip-hop apparel to ethnic groups and minorities on the Southside of Chicago.
Historically, retailers have avoided the inner city because of perceived characteristics, whether founded or unfounded, and poor statistical information. Statistically, retailers have relied exclusively on per capita income to determine the purchasing power of neighborhoods; hence most retailers have focused on the wealthy Northside of Chicago and the suburbs. However, this metric ignores the competitive advantages of the inner city, specifically population density, spending patterns and ethnic diversity. When these factors are accounted for, the retail purchasing power of the Southside inner city is comparable to any location in Chicago.
Image Fashions’ primary market is the African Americans and Hispanics between 12-34 years of age who populate these neighborhoods. This population is very fashion conscious and, on average, spends 30% more on apparel then their white counterparts. They view their clothes as an expression of their personality and a statement of their connection to the latest icons and popular trends. However, it is very difficult for this group to purchase fashionable clothes. Typically, they must spend an hour or more on public transportation to go to Michigan Avenue. Once there, they may have difficulty finding ethnic brands, or they are shadowed by security, who automatically assume they will steal something. Image Fashions will offer these fashionable products, but it will offer these products in a professional and respectful manner in the customers’ neighborhoods.
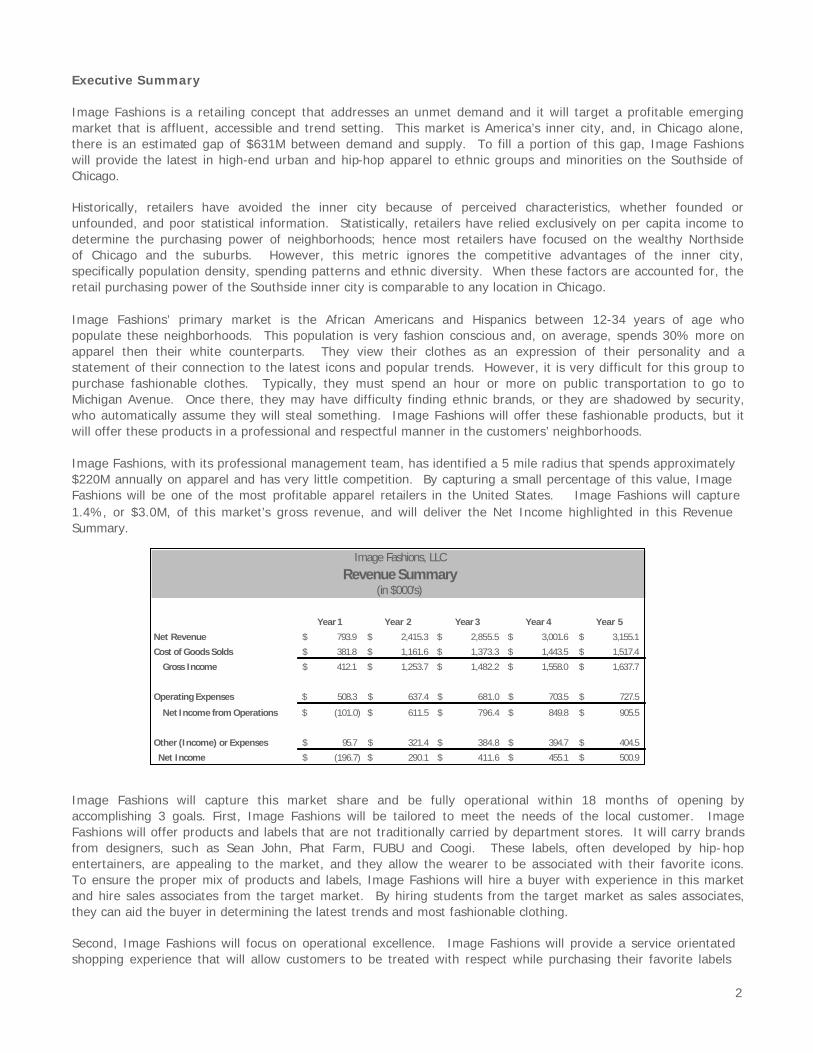
Image Fashions, with its professional management team, has identified a 5 mile radius that spends approximately $220M annually on apparel and has very little competition. By capturing a small percentage of this value, Image Fashions will be one of the most profitable apparel retailers in the United States. Image Fashions will capture 1.4%, or $3.0M, of this market’s gross revenue, and will deliver the Net Income highlighted in this Revenue Summary.
Image Fashions, LLC
Revenue Summary (in $000's)
Year 1 Year 2 Year 3 Year 4 Year 5
Net Revenue
Cost of Goods Solds
Gross Income
$ 793.9 $
$ 381.8 $
$ 412.1 $
2,415.3 $
1,161.6 $
1,253.7 $
2,855.5 $
1,373.3 $
1,482.2 $
3,001.6 $
1,443.5 $
1,558.0 $
3,155.1
1,517.4
1,637.7
Operating Expenses $
Net Income from Operations $
508.3 $
(101.0) $
637.4 $
611.5 $
681.0 $
796.4 $
703.5 $
849.8 $
727.5
905.5
Other (Income) or Expenses
Net Income
$ 95.7 $
$ (196.7) $
321.4 $
290.1 $
384.8 $
411.6 $
394.7 $
455.1 $
404.5
500.9 Image Fashions will capture this market share and be fully operational within 18 months of opening by accomplishing 3 goals. First, Image Fashions will be tailored to meet the needs of the local customer. Image Fashions will offer products and labels that are not traditionally carried by department stores. It will carry brands from designers, suc h as Sean John, Phat Farm, FUBU and Coogi. These labels, often developed by hip- hop entertainers, are appealing to the market, and they allow the wearer to be associated with their favorite icons. To ensure the proper mix of products and labels, Image Fashions will hire a buyer with experience in this market and hire sales associates from the target market. By hiring students from the target market as sales associates, they can aid the buyer in determining the latest trends and most fashionable clothing.
Second, Image Fashions will focus on operational excellence. Image Fashions will provide a service orientated shopping experience that will allow customers to be treated with respect while purchasing their favorite labels
2

within their neighborhoods. The store will be trendy, clean and well lit. The staff will be professional and courteous, and the store policy will reinforce the value of the customer and the experience. While security and shrink are issues, Image Fashions will focus on containing the few problem elements, rather then assuming all customers and employees are potential problems.
The third factor for Image Fashions is commitment and leadership within the community. Image Fashions will create jobs and be an active participant in the community. It will host graduation and community events, and this involvement will allow Image Fashions to demonstrate its sincere commitment to the community while building its own brand and identifying new fashion trends.
Image Fashions has also studied other markets and expansion opportunities. It plans on opening other stores in second tier cities, such as Pittsburgh, Detroit, Atlanta and Miami, where the target customers of Image Fashion are underserved.
The management team is formed with a variety of complimentary skills. They have functional experience in finance, marketing, operations, sales and strategy, and they also have domain experience in apparel, ethnic marketing, retail, and urban development. Through this experience, Image Fashions will gain credibility in being committed to the community and recognition as the retailer and employer of choice within the target communities.
The management team is seeking a commercial loan of $1.05M to begin operation of Image Fashions in the Fall of 2003. The loan will be secured against Image Fashions’ inventory, accounts receivable and managements’ personal guarantees.
3

Table of Contents I. Concept ......................................................................................................................................................5 II. Industry Analysis ........................................................................................................................................5
A. General Market Definition ........................................................................................................................5 B. The Chicago Market ................................................................................................................................7
III. Target Market / Marketing – Sales Plan ..................................................................................................... 11 A. Marketing Objective .............................................................................................................................. 11 B. Target Segment .................................................................................................................................... 11 C. Positioning Strategy .............................................................................................................................. 11
1. Price ................................................................................................................................................. 12 2. Promotion......................................................................................................................................... 12 3. Product Mix....................................................................................................................................... 13 4. Location ........................................................................................................................................... 15
IV. Market Analysis…………………………………….. ............................................................................................... 15 A. General Competitive Landscape ............................................................................................................. 15 B. Site Specific Competitive Landscape ....................................................................................................... 15
V. Company Overview / Products & Services .................................................................................................... 18 A. Labor ................................................................................................................................................... 18
1. Managers.......................................................................................................................................... 18 2. Sales Associates ................................................................................................................................ 18 3. Buyer ............................................................................................................................................... 18 4. Training Philosophy ........................................................................................................................... 19
B. Store Design ......................................................................................................................................... 19 C. Security ................................................................................................................................................ 21
1. Personnel ......................................................................................................................................... 21 2. Infrastructure/Store Layout ................................................................................................................ 21
D. Inventory ............................................................................................................................................. 22 E. Purchasing............................................................................................................................................ 22 F. Hours of Operation ................................................................................................................................ 22 G. Layaway and Return Policy: ................................................................................................................... 23
VI. Financial Projections ................................................................................................................................. 23 A. Revenue Model ..................................................................................................................................... 23 B. Comparative Financial Performance ........................................................................................................ 26
VI. Financial Statements………………….............................................................................................................. 26 A. Start Up Costs ....................................................................................................................................... 26 B. Financing .............................................................................................................................................. 27
VII. Management .......................................................................................................................................... 27 A. Management Team ............................................................................................................................... 27 B. Advisory Board...................................................................................................................................... 28
VIII.Exit Strategy........................................................................................................................................... 28 APPENDIX A…Financial Analysis ..................................................................................................................... 29
A-1…Most Likely Scenario .......................................................................................................................... 29 A-2.. Best Case Scenario ............................................................................................................................ 32 A-3…Worst Case Scenario .......................................................................................................................... 35
APPENDIX B…Management Resumes ............................................................................................................. 38
4

I. Concept Globalization has improved access to new customers and increased the competition for those customers. However, in the rush to cross over into new borders, American retailers have overlooked an opportunity. This overlooked customer is easily accessible, affluent, an early adaptor and trendsetter. This market is the American inner city, and the customer is the growing minority population that lives there.
According to recent studies, the American inner city has $85B in retail purchasing power, but nearly 25% of that demand is unmet. The result is $21B in retail spending that is not captured, and in Chicago alone this gap is $640M.1 This business plan will outline why high e nd apparel is a major unmet market in Chicago’s inner city and how a strategic and disciplined approach to high end apparel retail in Chicago’s low income communities can generate revenue and employment.
II. The General Market
A. General Market Definiti on
The definition of a low income, or economically distressed neighborhood is a that which has a “median household income 25% less then the city average, a poverty rate at least 50% higher than the city average and/or unemployment at least 30% higher then the city average.” 2 In Chicago, 1.77M people live within a neighborhood that fits this definition.
The purchasing power of this population is counterintuitive. To the casual observer, below average per capita income would mean less purchasing power for luxury or high end goods. However, a series of characteristics make this market extremely attractive. The first and most important characteristic is population density.
In the inner city, most families and individuals rent apartments. While there are several macro issues that drive this pattern, the result is a large number of renters living within a small area. By comparison, 1 lot in the suburbs or an affluent neighborhood will typically have a single or dual unit town home. In the same acreage of an inner city neighborhood, there is a 5-10 story apartment complex housing 35 families. The discretionary income of the 2 families in the affluent neighborhood is less than the combined discretionary income of the 35 families in the inner city!
Another pattern that frees discretionary income for inner city residents is that affluent homeowners spend a large percentage of their income on housing repairs and maintenance costs. Since a renter does not have these costs, it frees their discretionary income to be spent on personal items and expenses, such as retail goods and entertainment services. Statistically, 67% of total U.S. shoppers own their home as compared to only 36% in the inner city. 3
The third driver of the inner city purchasing power is the racial and ethnic composition of the neighborhood. Low income neighborhoods are typically populated by African American and Latino families and individuals. According to market research, 4 both groups are more image conscious than their white or suburban counterparts. Since they are not spending their income on housing expenses, they focus their expenditures to meet their image and fashion concerns, specifically in apparel. The following graph displays the difference in apparel purchasing patterns.
1 The Business Case for Pursing Retail Opportunities in the Inner City, The Boston Consulting Group in a partnership with The Initiative for a Competitive Inner City, June 1998. 2 The Inner-City Shopper A S rategic Perspective, Pricewaterhouse Coopers and the Initiative for a Competitive Inner City, 1997. : t
r- t r3 2nd Annual Inner-City Shopper Survey: Inne City Shoppers Make Cen s (and Dolla s), The Initiative for a Competitive Inner City and Pricewaterhouse Coopers, November, 1998. 4 The Business Case for Pursing Retail Opportunities in the Inner City, The Boston Consulting Group in a partnership with The Initiative for a Competitive Inner City, June 1998.
5

Illustration 1: Annual Apparel and Service Expenditures by Race
r- t r
$1,200
$1,000
$800
$600
$400
$200
$0
Total Inner City US Shoppers White African American Hispanic
Note: The U.S. Census defines this clothing expenditures in the category, Apparel and Services, and it is defined as retail expenditures includes dollars spent on all apparel, footwear, jewelry and other apparel and services.5
Currently, several key mainstream designers, such as Tommy Hilfiger and Ralph Lauren, view the inner city as fashion trendsetters. These neighborhoods are early adaptors of new designs and set the trends for their suburban peers. In market surveys, over 50% of African Americans and Latinos ranked trend setting fashions as somewhat or very important in the purchase criteria. This is compared to 30% of the average U.S. shopper. This trend also seems to be increasing amongst the target populations. 6
MTV’s urban, hip-hop music show, called Direct Effect, and MTV’s fashion show, called Fashionably Loud, recently hosted a one hour special fashion show highlighting the premier urban and hip hop fashion brands. The show was a runway display of the new lines from leading urban designers with several performances by leading rap and hip-hop groups. It was a high-energy display of current and future trends that visually demonstrated a clear difference in the trends and expectations of racial and ethnic groups as opposed to their white counterparts. The influence and success of this show and others like it on MTV and BET (Black Entertainment Television) demonstrates that this market and product offering is nearing a stage of rapid growth and development.
The outcome of these combined characteristics is an image conscious and fashion sensitive population that has discretionary income to spend on apparel. While there has been a drastic increase in the number of designers, such as Sean John, Baby Phat, Phat Farm and FUBU targeting the urban consumer, there has not been a corresponding increase in the retail stores that carry these lines. The result is an escalating demand for the product and few sp ecialty stores to cater to this market.
5 http://www.oconomowocusa.com/retail%20profile.pdf 6 2nd Annual Inner-City Shopper Survey: Inne City Shoppers Make Cen s (and Dolla s), The Initiative for a Competitive Inner C ity and Pricewaterhouse Coopers, November, 1998.
6

B The Chicago Market . Chicago is a unique market on several levels. First, Chicago is one of the top 3, most populated markets in the U.S. and is recognized for its diverse and affluent population. Due to its affluence, most major designers and retailers have stores on Chicago’s “Magnificent Mile” (downtown Michigan Avenue) or in the neighboring affluent communities. While Los Angeles and New York typically set American fashion trends, Chicago earns its title of “Second City,” by eventually providing all of the same amenities and products as other “trend leading” cities.
The second unique aspect of Chicago is the segregation of its population. Typically, races or ethnic groups dominate one neighborhood or community and have little interaction with other groups. Typically, affluent Caucasian city dwellers are drawn to the north side of the city, while lower income foreigners and minorities live on the west and south side of the city. The result is high price real estate on the north side with an abundance of retailers competing for revenue, while the west and south side offer low cost housing but few recognized retailers. To spend their discretionary income, west and south- siders travel to the north side of the city or Michigan Avenue.
Illustration 2a demonstrates the average per capita income by ZIP Code. Historically, retailers would use this as their primary metric when expanding operations into a new market or neighborhood. The darker green ZIP Codes on the map indicate higher income areas as compared to the lighter green ZIP Codes. Using this metric, the north side of Chicago seems to be the most attractive market, with little opportunity for retail businesses on the south side. However, this metric does not account for population density or spending patterns, two factors that are critical in measuring the potential success of retail operations.
Illustration 2b accounts for the population density and for spending patterns, rather then strictly using per capita incomes. In this second illustration, the north-side’s advantage is not as clear, and it demonstrates retail opportunities, based upon total apparel expenditures, on the south and west-side of Chicago. The south side offers five high apparel spending ZIP Codes which are in the >$50MM range, impressive when compared to their annual per capita income.
7

Illustration 2a: Average Per Capita Income by ZIP Code 7 Illustration 2b: Total Apparel Expenditures by ZIP Code 8
7 Source: Analysis of U.S. Census Data 8 Source: Analysis of U.S. Census Data

Illustration 3 overlays Chicago’s apparel retailers with the information from Illustration 2b (Total Apparel Expenditures by ZIP Code). It supports the historical pattern that retailers have used only average income to define new market opportunities. The retailers, consistent with average income patterns, are concentrated on the north side of the city. Markedly fewer retailers are present on the south and west sides despite the great market potential.
Illus ration 3 Per Capita Income by ZIP Code and Apparel Re ailers by Addr ess 9 t : t
In comparing Illustrations 2 and 3, it is apparent that there is an affluent market sector that is not having its demands met. Additionally, to further validate the opportunity of real estate and business in the south side of Chicago, the area was recently selected by CNN.com as one of the top U.S. neighborhoods to live in. 10
Based upon the growth of the high-end apparel industry and the customers’ spending power, there is a unique opportunity to enter the fashion retail business in low income ur ban neighborhoods. Chicago is a strong point of entry because of its national affinity to new trends, diverse demographic distribution, lack of competition and high population density.
9 Source: Analysis of U.S. Census Data and Business Yellow Page Listings 10 CNN.com’s Money section. http://money.cnn.com/2002/11/08/pf/yourhome/bplive_chicago/index.htm

III. Image Fashion’s Marketing Model The marketing model will focus not only on attracting customers away from competitors but also on trying to satisfy the innate demand within the local catchment area. The marketing model can be considered as below:
Illustra ion 4: Image Fashions’ Marketing Model t
t t
Positioning Strategy
Price
Marketing Objective
Promotion
Target Segment
Product Mix
Location
A. Marketing Objective
The Marketing Objective is to generate sales of $3.0M in the third year.
B. Target Segment
The urban clothing mix will be aimed specifically at young adults aged between 12 – 34. Based on primary market research, this segment of the market is highly influenced by fashion and values the distinctiveness that Image Fashions will provide. The buyer for a compariable urban clothing retailer, The Lark, noted that “our target market is aged 12 upwards, with clothes being often their only major outlay and who place a premium on wearing the right clothes.”11
C. Positioning S ra egy
Because Image Fashions does not intend to manufacture or design its own products, it will differentiate itself on service and product mix (by responding rapidl y to changes in fashions). In fact, very few designer brands are exclusive to a particular retail outlet. Research has uncovered that the key factors when deciding where to shop are:
• Being treated with respect • Courteous sales staff • Being in an environment where they don’t feel like they are being taken advantage of 12
• Clear return policies • Branded offerings • Clean and stress-free shopping environment 13
11 Interview, November 9th 2002. 12 Interview with targeted customer segment, Saturday November 9th 2002. 13 The Case of inner-city retailing, Boston Consulting Group.
11

Having analysed the market and target segment, the marketing strategy will be as follows:
1. Price
Prices will be competitive with local competitors (with stores such as the Lark, Manalive and Freshwear) rather than the local department store (Carson Pirie Scott and Marshall Fields). However, price competition and undercutting will be avoided in order to maintain Image Fashion’s status as a high end retailer. Again, the primary assumption is that there is considerable latent demand, so growth will come from tapping into this market, rather than stealing it by discounting or through price competition.
Accordin g to Bob, the District Manager and Buyer for The Lark, they use neither sales promotions nor loss leader products to promote sales because the business cannot afford to. Rather the key differentiation is understanding the customer, both in terms of service and product. The Lark sells 90% of its clothes at the initial price, and therefore, the attraction of being the first with the cool clothes outweighs the price.
As a start-up, Image Fashions faces constraints in terms of limited initial cash flow and lack of leverage with suppliers to return unsold products. Hence, in keeping a high status image, Image Fashions will not compete by using sales discounts or loss leader products.
2. Promotion
The promotion strategy will be driven by the requirements of the local market. Specifically, the strategy will encompass four areas:
a. Advertising
Because of the high urban density, most of the paid for advertising will be in the form of billboards and local rap/hip- hop radio station advertising. These have the added advantage of being relatively inexpensive compared to department store competitors’ methods.
Once operational, Image Fashions plans to spend 5% of its revenue on marketing and promotional expenses.
b. Promotion of local events in the community
Image Fashions’ target market can be easily reached through local high schools, colleges and sports centers. There are plans to hold co- branded events (with the apparel brand manufacturers) to promote awareness of the store. This idea has precedence – one local retailer currently sponsors an annual high school graduation party and regularly has in excess of 3,000 potential customers turning up at the door, despite the fact that the capacity is only for 1,200. In addition to providing advertising, these events will help establish Image Fashions as a supporter of the local community.
c. Staff
By recruiting sales associates from the target market, Image Fashions will gain two advantages beyond hiring other employees. First, sales associates will be familiar with trends and be able to anticipate changes in tastes. MTV is famous for using this model with their production assistants, who are students within the target demographic. Secondly, it will reduce shrink/theft by having local, known faces to operate the store.
12

The sales associates will know some of the ‘problem customers’ through their community relationships.
In order to reduce staff turnover and improve selling ability, the staff will be hired through a joint project with the local schools where grades are dependent on the commitment and quality of work at Image Fashions. This labor model has been tried before with considerable success in urban neighbourhoods.
d. Courteous service and respect for the customer
Given that Image Fashions will sell other brands rather than producing in- house lables, the promotional activities will focus on service and product mix, which will be reinforced through the store’s employee incentive system and training program. Customer courtesy is essential in building and maintinaing a high end retail image.
3. Product Mix
From interviews with local buyers, product mix varies dramatically from location to location and is driven by the heterogeneity that can be seen in the urban city market. Since the right product mix is critical for success, Image Fashions recognizes that it currently does not have the buyer expertise required and is in the process of identifying an experienced specialty apparel buyer. The product mix will be heavily influenced by fashions in Los Angeles (for women) and New York (for men) and the clothing worn on the local television networks, particularly rap/hip-hop stations such as MTV and BET.
a. Labels
Labels or brands are a critical component that allows the consumer to project a certain style and image. Through customer surveys and market validation, a combination of mainstream and ethnic brands has been identified. Illustration 4 is a sample of the brands to be carried by the store. Mainstream brands like Tommy Hilfiger appeal to a wide customer base, while ethnic brands like Phat Farm and Sean John are focused purely on minority groups. These brands are identified as ‘high-end’ apparel labels and the exclusivity of the brands provides an even greater perceived value to the consumer. This core group of brands share the vision of selling an exclusive image and reflect a lifestyle that is unique and differentiated. Currently, customers need to go to outside of their community to several places to find all these brands. Image Fashions will differentiate itself by offering the convenience of bringing all these brands under one roof and to their neighborhood.
The merchandize manager has begun negotiations with the various manufacturers to determine the terms and conditions for distribution of these labels. The majority of the negotiations should be concluded within the next 8 weeks.
13

Illustriation 5: Image Fashions’ Brand Licenses
MARITHE FRANCOIS GIRBAUD
ICEBERG
COOGI
PELLE PELLE
Sean John
b. Product offering
In line with ‘high-end’ fashion apparel, a wide combination of shirts, pants, dresses, shoes and accessories have been identified for the initial store launch. These products are the key elements that define the image that the target customers seek to portray. The products cover a wide price range, largel y influenced by customer demand and preferences determined during market validation. Image Fashions also views customer service as part of the overall product offering. The staff will be trained to recommend and assemble items to capture the look and image that individual customers desire. This is another way that Image Fashions will differentiate itself and will create loyal customers, who will keep returning because of the intimate and personal service provided. It is critical to have the right product mix, which is why an experienced buyer will be hired, who is knowledgeable of the fashion trends and the specific needs of our minority target customers. By virtue of the store location and a unique product mix, Image Fashions will be able to move products fast. The average ticket per sale is forecasted to be about $180.
Illustriation 6 Image Fashions’ Price and Per Purchase Revenue :
Price Range
Low High Probability Average Leather/Fur Jacket $250 $900 4% $575 Shirt $45 $380 25 $213 Sweaters $30 $120 13% $75 Jeans / Pants $60 $200 33% $130 Shoes $75 $220 10% $148 Jumpsuits $140 $350 15% $245 TOTAL 100%
Average Ticket: $180
14

4. Location
A key advantage is that rather than being loca ted in an out- of-reach mall, Image Fashions will be located within the target market and conveniently accessible by public transportation, which is the mode most often used by our target demographic.
IV. Competitive Environment
A. General Competi ive Landscape
As mentioned previously, the competition falls into two categories:
• Local urban speciality retailers such as The Lark, Freshwear, Manalive • Local Department Stores such as Carson’s, Marshall Fields
Given the generally underserved and extremely localized nature of the markets, there is limited need to steal market share from the competition. Nevertheless, Image Fashions will adopt the best practices of other urban retailers, as well as noting mistakes that have been previously made (particularly with respect to local department stores).
The best of the competition is a small chain known as ‘The Lark’, operating 9 stores in and around Indiana and Illinois. Many of the best practices that have been identified are in place with benchmarks for achievable results. For example, using the practices identified above, The Lark estimates that they turnover 90% of their product mix at the original price, considerably better than the larger department stores. They have also reduced problems with shrinkage to “low single figure percentages”, despite taking the decision not to introduce security tags. This compares very favourably with corporate giants such as The Limited, who’s shrinkage is 5% and increasing. 14
The key differentiatior between Image Fashions and The Lark is that The Lark continues to sell in large suburban malls whereas Image Fashions will be located in the heart of the inner city and also nearer to local high schools and colleges.
B. Site Specific Competitive Landscape
An ideal inner city location would incorporate convenience for the target consumer while maximizing the probability of success for the retail business. The site location was chosen based on combining elements of the above two qualities. Initially, ZIP Codes were parsed based on average income per person in the surrounding Chicago area. The 60629 ZIP Code was selected, an area that is in the heart of southern Chicago and the specific address is 7400 South Street.
The area within ZIP Code 60629 is a comparatively low income area with average income per person approximating $30,000. In contrast, the area has one of the highest apparel expenditures per ZIP Code, with expenditures in the range of >$50MM per year. With the purchasing power of residents in ZIP Code 60629 and the surrounding 5 mile radius, the apparel purchasing power within the immediate vicinity of the store is estimated at $223MM per year. This exemplifies the inner city consumer with the large spending power that Image Fashions is targeting. In addition, there are currently only eight retail apparel stores within a 7 square mile area surrounding this specific location. None of these stores cater to high- end fashion. The table below summarizes the competitive specifics:
14 Interview with Kelly Vergamini, Wednesday 13th November, Summer Associate, The Limited Corporate Headquarters.
t
15

Illustra ion 7: Local Competitive Analysis t
Distance from IF location (7400 South) Women’s retailers
Children’s retailers
Athletic retailers
Men’s retailers
1 mile 3 3 0 0
3 miles
(includes 1 mile retailers) 9 5 1 2
The following map highlights the annual apparel expenditures around the store and the location of apparel retailers.
Illustration 8: Competitive Analysis and Apparel Expenditures at Site Location
16

Another critical part of the location analysis is the different linkages between the consumer and the store. These linkages include factors such as accessibility, convenience and exposure. One measure of location appeal from a retail perspective is the location’s traffic count. The 7400 South address has a reported 52,900 car drive -bys per day – a very large average daily traffic count15. This large traffic flow will provide a good amount of exposure to the store. Image Fashions’ plan is to take advantage of this by placing large signage (billboards, “wall frescos”, etc.) in the proximity of the location. Since 7400 South is at the signalized intersection of Gold Road and South Avenue consumers can easily turn into the location if they are traveling in a car. The site also affords plenty of on premises parking, further augmenting its convenience. In the likely event that consumers will be commuting via public transportation, the location is easily accessible via numerous transportation routes.
Six different CTA bus lines have stops, all within less than a block from the location. The 54B, 379, 382, 383, 384, 385 bus routes give consumers access to the location from all directions, during all times of day (see Illustration 9). Additionally, the CTA Orange El line is less than three miles north of 7400 South where all of the above mentioned bus lines originate from. This ensures adequate public transportation from the Orange El to the location, making it a convenient commute from almost anywhere on the CTA train system.
Illustration 9: CTA Bus Routes near 7400 South 16
15 Source: Illinois Department of Transportation, Average Daily Traffic 16 Source: Chicago Transit Authority, south west system map
17
V. Operations
A. Labor
1. Managers
Staffing will include two managers, who will work on a shift system so that the store is fully manned, seven days a week. One manager will be an employee on a $40,000 base salary and bonus package, while the other manager will be an owner earning $50,000 per year plus his/her equity stake in the store.
The store manager will have a crucial role in running the store and ensuring its success. Along with greater responsibility, a great deal of latitude will also be given to the store manager. The store manger’s skills are crucial in two areas:
• Experience in urban retail store management: Image Fashions will hire experienced
managers from the competitors.
• The ability to intimately relate to customers: This means that the store mana gers will proactively create relationships by being visible both in the store and in the local community. The store manager will be present at the major parties and events where the current and potential customers frequent and will provide major input into the product mix.
Based on the crucial role in the store, it is important that the store manager be compensated generously. Incentives will be given based on store performance, and 2% of net income will be given to the store manager in addition to salary. Full dental and medical insurance will be given.
2. Sales Associates
Sales Associates will primarily be recruited from local high schools and colleges. The pay will be $5.50 per hour (an industry-wide figure). In order to reduce employee turnover, Im age Fashions will be actively working with the faculty and administration at these institutions to identify the most reliable students and to institute some work experience programs. As the buyer/district manager at The Lark (who successfully follows this approach) commented, “the most reliable sales associates are those that initially had some form of academic incentive. They even continued to work for us during vacation time.”
The hourly wage sales associates will not be given significant benefits. The wage is consistent with other retailers, so it does not distinguish Image Fashions as an employer of choice. What will give Image Fashions a hiring advantage amongst its target group is a $100 coupon for clothes. For every week that an associate works, they will receive a coupon for apparel in the store. The perceived value of the coupon will be $100, but the actual cost will only be $45, based upon the COGS. This incentive will make it very fashionable and desirable to work for Image Fashions rather than another retailer also paying $5.50/hour.
3. Buyer
One of the key success factors for this business venture is to offer a product portfolio that is based on the latest fashion trends and preferences of the target customer segment. The role of the buyer is critical in order to achieve this objective. Therefore, the management team is spending considerable time and effort to identify the most suitable buyer to meet the vision of Image Fashions. Four candidates have been shortlisted based on criteria supplied by Image Fashions’ Board Advisor and the position is expected to be filled within the next six weeks.
18
4 Training Philosophy .
It is expected that the sales associateswill start with minimal retail experience. Thus a five day in- store training period will be administered for all new employees. This is a significantly longer training period than compared to other retail stores. Skills to be acquired at the end of the training period are: basic store operating skills, an understanding of the clothing lines carried by Image Fashions and the importance of customer service.
The primary message that store employees will be trained on is that exceptional customer service is critical. The Image Fashions’ definition of exceptional customer service includes making the customers feel welcomed and treating them with respect. Employees will not push for a sale, but rather they will give an honest, non-offensive, opinion relating to the customer’s choice of apparel. Employees will also generate suggestions of alternative products and apparel combinations. The customers should feel that the employees dedicate sufficient time with them in a very respectful and attentive way. The store managers will have a central role in educating the employees on the importance of making the customers feel comfortable in the store.
B. Store Design
The store site will be located at 7400 South Avenue. The property is 8,000 square feet and located in a freestanding building. As a freestanding building, the exterior of the location can be modified to exude a high-end apparel store. Visible from the exterior will be ample storefront to display the latest cutting edge minority driven trends. The rent for the location is $25,120 annually ($3.14 per square foot). This amount does not include utility costs or property insurance. The interior of the location is 50 feet wide by 80 feet long with no interior dividing walls. Bradley Builders of Chicago has been contacted to transform the inside of the store into a trend setting retail space. Bradley Builders has remodeled Bang & Olufsen retail spaces, a trend-setting retailer. The cost to accomplish this would be $630,000, which includes the build-out with all lighting and fixtures.
Given that the store site is located in a higher crime rate neighborhood, Image Fashions will need to address shrinkage in the store design. As part of the store layout, Bradley will include design elements that help prevent shrinkage, mainly consisting of creating an indirect access from the store entrance to the inside of the store. There will be a walled off area of the store that will be used for inventory storage, back office space, security monitoring and fitting room areas. This will leave 7,500 square feet of retail space for displaying apparel. Most of the inventory will be displayed on the store fixtures in the retail space with inventory storage being used primarily for new product shipments and storing extraneous quantities.
19
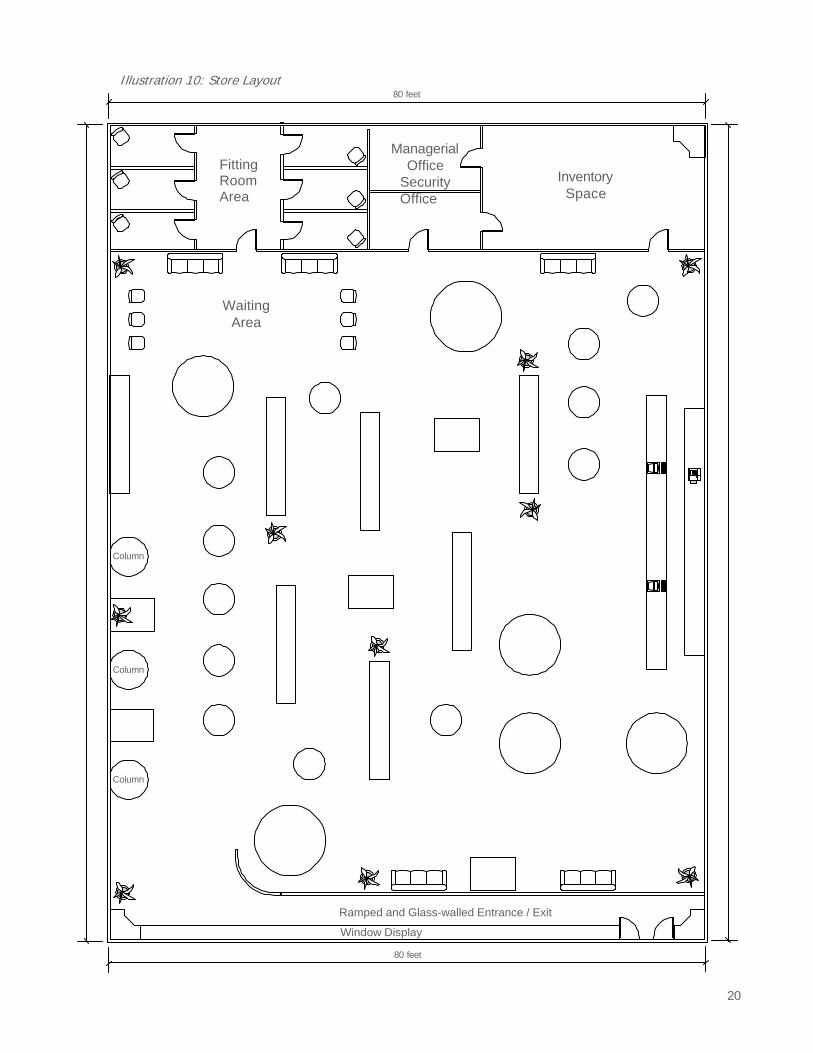
Illustration 10: Store Layout
80 feet
Fitting Room Area
Waiting Area
Managerial
Office Security Office
Inventory
Space
Column
Column
Column
Ramped and Glass-walled Entrance / Exit
Window Display
80 feet
20

C. Security
One of the main risk factors of running a business in an inner city location is the high incidence of crime such as shrink, burglary and arson. The following table shows the area crime statistics for the district within which the proposed store location is based.
Illustration 11 Number of Crime Occurrences 17 :
. t r /
Year (January – September)
Robbery Burglary Theft Arson Violent Property
2002 935 1,767 4,762 61 2,093 8,430
2001 774 1,600 4,863 65 1,850 8,271
Crime is a significant deterrent that discourages many entrepreneurs from setting up businesses in the inner city. Therefore, it is being considered a serious issue, and Image Fashions is proactively devoting resources to mitigate the risk.
1. Personnel
The employee training program will include crime prevention and handling procedures. Market research has indicated that inner city customers often believe that they are treated with disrespect since they are considered a possible crime suspect from the very moment they step into a store. Therefore, in line with the vision of providing a safe shopping environment and desire to treat customers with the highest satisfaction, employees will be trained to keep a watchful yet discreet eye on possible offenders. Howeve r, a full-time security guard, or “bouncer,” will not be employed. A security advantage of hiring employees from the community is that they will know which customers are potential crime suspects.
One of the store employees will be responsible for check ing the number of items that a customer takes into a fitting room. In addition to store employees, Image Fashions intends to hire a security company to provide security personnel to monitor the premises during after-hour periods to discourage arson and burglaries.
2 Infrastruc u e Store Layout
Image Fashions will invest in a surveillance camera system that will be placed at strategic points in the store such as the store entrance/exit, fitting rooms, inventory space, cash register areas, and throug hout the floor space. There will be only one entrance/exit to the store, which will be glass walled and ramped, as shown in Illustration 8. In addition, Image Fashions plans to place anti-theft devices on all higher priced items that will sound an alarm when a customer walks past the detectors placed at the exit. The anti- theft devices will be removed at the cash register when the customer pays for the item. The glass-walled and ramped entrance/exit will discourage ‘take - and-run’ theft incidences.
17 Chicago Police Department
21

D Inventory .
Successful inventory management is a key element for success and profitability for Image Fashions. Fashion trends are especially fickle. As a start up, Image Fashions does not have the reputation or financial strength to finance inventory or return unsold items. It must have inventory on hand to meet flash demand or impulse purchases. However, excess inventory could tie up cash flow or be written off as a loss.
Image Fashions will manage its products through two categories:
• Advance Orders: regular fashion trends viewed through trade shows • Urban Hits: heavily influenced by street trends and new breaking promotions through television
and other music stars. These can be ordered a month in advance.
Image Fashions intends to have its inventory delivered on a weekly basis so as to minimize warehousing costs, reduce working capital and keep the product mix current. This may cost more, in terms of delivery charges and COGS, but will pay for itself through higher margins.
Image Fashions, in its first year, will have to order and pay for the first 8 months worth of inventory in advance as it will not have a credit history or relationship with the suppliers. Due to the small order size, Image Fashions cannot expect to be able to return unsold goods to the manufacturer.
To overcome this limitation, three actions are considered:
• Minimize ordering of non-selling SKUs – this will be done by ordering deliveries on a weekly basis
to minimize order sizes. • Promoting lower selling SKUs by getting sales associates to wear them in the store. This has
been tried successfully in Inditex, a global retailing chain. • Sales discounts will only be used to move old invesntory (these discounts will not occur as a store
wide sale, rather as individual markdowns).
The bulk of the inventory will be on display in the commercial area, with a small portion stored in an inventory holding area in the back of the store.
E. Purchasing
There are three main trade shows that occur in the fashion business, each selling for the Spring, Fall/Winter and Summer collections respectively. 18 Image Fashions will need to pay for goods in advance. Therefore, 8 months of inventory will need to be financed. These costs have been included in the start-up and Year 1 costs. Beyond that period, Image Fashions will be able to finance the inventory purchases from the profits and by negotiating credit periods based on the trading history with manufacturers.
Due to the highly volatile nature of the urban fashion market, trends can be started overnight by the rise of a new music star or a hot new TV show. Deliveries will be scheduled to occur on a weekly basis allowing for maximum flexibility. Maintaining the right product mix is more important that minimizing delivery expense, particularly given the high gross margins available on the merchandise.
F. Hours of Operation
The store will have the following opening hours:
Monday- Friday: 10.00 am – 9.00 pm Saturday: 10.00 am – 9.00 pm Sunday: 11.00 am – 7.00 pm
18 E-mail interview with Chun Yee Yip, Buyer, Ann -Taylor.
22

Work Shifts: One store manager will be in store at any one time. The table below lists the number of sales assistants per shift. Although there will be 18 sales assistants, the Full Time Equivalent is 10.9 (assuming a 40 hour working week).
Illustration 12 S ore Operating Hours : t
t
No. of sales assistants Morning Shift Afternoon Shift Evening Shift Mon 2 2 6 Tue - Thu 2 2 6 Friday 2 8 12 Sat 12 12 12 Sun 10 10 10
Total number of store managers: 2 full time. Total number of retail employees: 18 sales assistants (part-time)
G. Return Policy:
While Image Fashions does not anticipate a significant amount of the business being impacted by returns (in line with competitors), there will be a clear policy regarding them:
Return Policy The most important part of the return policy is that it remains clear and visible before the point of purchase without being distasteful. The policy will be posted clearly beside the till. In accordance with its reputation for excellent customer service, Image Fashions will allow customers to return undamaged goods accompanied by a receipt within 30 days. Unless the goods are defective from the manufacturer, Image Fashions cannot return the merchandise for credit. Rather, Image Fashions will liquidate the merchandise off-line (not through store sales) via discounted sales to either current employees or major discount retail brokers.
VI. Financial Analysis
A. Revenue Model
Image Fashions’ ability to generate revenue is susceptible to several variables within its localized market. The overall market and site -specific market was discussed in Section IV: Competi ive Environment and highlighted the total apparel sales within the region. However, several assumptions were made to determine the revenue that Image Fashions can capture. The first critical variable is the percentage of the total apparel value that is spent on high-end apparel within this market. The second key variable is the market share that Image Fashions can gain within its local market. Since the Image Fashions business model is based upon providing high-end products with outstanding customer service within low income neighborhoods, Image Fashions must capture a portion of the market share within a 5-mile radius. To improve the sensitivity of the analysis, individual market shares were estimated for 1, 3 and 5 mile radii.
23

Illustration 13 highlights the captured marketing share for three different scenarios, Best Case, Most Likely and Worst Case.
Illustration 13: Market Share Scenarios
Best Case Most Likely Worst Case
High End Apparel as % of Total Apparel Revenue 26.0% 25.0% 22.0%
IF Market Share for…
1 Mile Radius 25% 20% 15% 3 Mile Radius 12% 10% 8% 5 Mile Radius 6% 4% 2%
Gross Revenue (Fully Operational) $4,769,487 $3,443,228 $2,024,362
To fully develop the financial model beyond the market share, several additional assumptions were made to estimate revenues and costs. These assumptions included:
• Returned Goods: In an effort to provide outstanding customer service, Images Fashions will
allow customers to return unused clothing to the store for a full refund. Returns were estimated as 2% of gross sales.
• Discounted Sales: While Image Fashions will not provide ongoing discounts, some items will need to be discounted to clear inventory. The financial model estimates that 15% of Image Fashions gross sales will be sold at a 20% discount. As mentioned in this plan, The Lark sells 90% of its items at full price, so this assumption is conservative.
• Cost of Goods Sold: Image Fashions’ wholesale prices will not be determined until orders are placed. However, it is unlikely to qualify for volume discounts. The financial model assumes that the Image Fashion’s wholesale cost will be 45% of the retail price. The summation of wholesale price and sales discounts combine for the total cost of goods sold.
• Credit Card Purchases: Image Fashions’ clientele will use credit cards, but not as frequently as shoppers in the suburbs or on Michigan Avenue. It is assumed that 40% of net sales will come from credit cards with a standard service fee of 2% of sales tha t is typically charged to the vendor by the credit card provider. The revenue from credit card purchases will be Image Fashions’ primary accounts receivable.
• Inventory: Image Fashion’s greatest expense, both in start-up and operation, is its inventory. It will target 4 inventory turns per year, which will dictate the level of stocked inventory as well as ordering levels. Currently, the industry average for stocked inventory is 26%, which is consistent with the assumption of 4 turns per year. Image Fashion’s will finance its first 8 months of inventory through the initial loan. Another inventory concern is shrink, or theft, from customers or employees. This was estimated at 3% of sales.
• Loan Terms : Image Fashions’ loan will cover the cost of start up and inventory, and it
anticipates loan terms approximating 8% over 7 years. Servicing this debt is included in the financial projections. A scenario does exist to draw down the loan in 2 two phases, for start-up and in Year 2, which would save the owners approximately $6,000, however, these financials reflect a single draw down.
Based upon these assumptions, the following charts demonstrate the financial performance over the next 5 years. The full financial statements for all three scenarios are in Appe ndix A.
24

Illustration 14: Financial Projections for Image Fashions.
Gross Revenue from Income Statement
Net Income from Income Statement
$5,000,000
$4,500,000
$4,000,000
$3,500,000
$3,000,000
$2,500,000
$2,000,000
$1,500,000
$1,000,000
$500,000
$0
Year 1 Year 2 Year 3 Year 4 Year 5
Best Case Most Likely Worst Case
$1,000,000
$800,000
$600,000
$400,000
$200,000
$0
($200,000)
($400,000)
Year 1 Year 2 Year 3 Year 4 Year 5
Net Cash Flow from Operating Activity from Cash Flow Statement
Outstanding Current Debt
from Balance Sheet
$1,000,000
$800,000
$600,000
$400,000
$200,000
$0
($200,000)
$1,200,000 $1,000,000
$800,000
$600,000
$400,000
$200,000
($400,000)
Year 1 Year 2 Year 3 Year 4 Year 5
$0
Year 0 Year 1 Year 2 Year 3 Year 4 Year 5

B Comparative Financial Performance .
t
r
I t : t t
To formulate some of the assumptions and validate the results in the financial model, retail industry benchmarks were used. The foll owing table shows the major benchmarks that were obtained from various retail stores. The results forecasted by Image Fashions may be superior to some of the industry benchmarks such as the ‘sales per square foot’ since the store will be more focused on a smaller customer segment and by virtue of its unique product mix. However, the overall performance metrics demonstrate that Image Fashions’ financial projections are conservative.
Illustration 15: Comparative Performance Me rics 19
Abercrombie
& Fitch Aeropostal
American
Eagle Outfitters
GAP Guess
Nieman Marcus
Image Fashions
Gross Sales/Square Foot $401 $514 $394 $288 $511 $430 Sales/Store $3,095,000 $3,320,000 $1,477,700 $3,443,228
Square Feet/store 7,840 8,700 5,100 8,000 COGS* 59.1% 69.9% 39.9% 64.0% 65.0% 32.3% 48.1% SG&A* 21.0% 15.2% 24.0% 41.6% 26.2% 23.8% Net Earnings* 8.9% 8.6% -0.1% 1.1% 14.4%
*Note: Percentages based upon Net Revenue
VI. Financing
A. Sta t Up Costs
The primary costs in starting a retailing operation is the store build-out (the conversion of an existing space into a store), the inventory expense and the working capital. The cost is detailed as follows:
llus ration 16 S art Up Cos s
Item Cost
Advertising Expense Infrastructure
Build Out Inventory System & Register
Miscellaneous Electrical Equipment Inventory Legal Fees Security Working Capital
$ 10,000 $ 600,000 $ 25,000 $ 5,000 $ 553,973 $ 6,000 $ 15,000 $ 295,496
Total
$ 1,510,469
As a start up, Image Fashions will need to finance 8 months of inventory since it does not have an existing credit line. The initial inventory cost is approximately $554,000. Furthermore, since Image Fashions is a startup business, approximately $295,000 will be needed to cover operating costs during the first 18 months of operations. Along with several other miscellaneous expenses the total to open a high-end apparel retail store on the southside of Chicago is $1.5M.
19 Source: Company Annual Reports for Fiscal Year 2000 verse Image Fashions’ Full Operational Year 3

B. Financing
t
r t
r t
The start up costs for Image Fashions will be funded through the following 3 sources:
Illustra ion 17: Sources of Funding
Owner Equity $
Percentage 20%Grants/Funds $
Pe cen age 10% Commercial Loans $
Pe cen age 70%
Total $
302,094
151,047 1,057,328 1,510,469
The first source is the owners’ investment, which is 20% of the total cost. The six owner’s will each contribute approximately $50,000 totalling the $302,000 requirement. The second source of funding will be through the City of Chicago and other community development funds. As highlighted in Appendix C several groups provide funding to support economic devlepment in low income neighborhoods. Based upon the management team’s familiarity with the organizations, they anticipate receiving 10%, or approximately $151,000 in grants. The final source will be a commercial loan for $1.06M.
VII. Management
A. Management Team
The management team of Image Fashions is formed by a variety of different backgrounds, which are complementary and will allow Image Fashions excel in retail sales.
• Barry Miller, the CEO, has considerable experience in developing projects for the community. He
has worked with youth and community development groups in the inner city for over 8 years, and currently runs a management consulting organization that provides consulting services to businesses in low income neighborhoods. The organization, the Neighborhood Business Initiative , currently involves over 140 people. This exposure to the inner city and experience running an organization will provide the managerial foundation for Image Fashions.
• Jon Smith has broad experience in finance and marketing services through his work as a consultant for more than 5 years. He will be responsible for the financial department while paying close attention to meeting financial milestones.
• Allen Green has been working as a consultant for more than 4 years and has relevant experience in business planning and operational efficiency. He will provide valuable insight into the site selection, store layout, and ongoing operations of the store.
• Oscar Williams has worked in sales for more than 3 years, dealing with diverse customers and industry sectors. He also worked for a European retailer, Makro, for 6 months in the sport apparel department. He will manage the store operations by optimizing the allocation of inventory as well as the store layout to maximize the ticket purchases among the customers who enter the store.
• Will Sharpe will be in charge of the marketing strategy. He has extensive experience with media companies as well as designing and implementing business plans. He has customer relationship experience that will help Image Fashions to formulate the right strategy for acquiring loyal customers. He will also be in charge of the advertising strategy while leveraging his relationships with the media and advertising companies.
27

• George Michaels will be responsible for merchandizing and selectin g the right product mix needed to attract and maximize the purchase rate per customer. Together with a buyer, to be identified, he will control the product mix to reflect the current fashion trends.
B. Advisory Board
Image Fashions recognizes the value of a trusted and experienced Board of Advisors. Although the management is in conversations with additional renowned experts who may join in the future, the current Board of Advisors is comprised of:
• Professor Gerald Dryer, Director of the Center for Retail Management, Williams
t
t i
• Professor Wilma Darman, Professor of Marketing Strategy, Williams • Gary Park, Senior Buyer, Saks • Mike Lowe, Director of E hnic Marketing, Old & Circle
Image Fashions will use the Advisory Board’s wealth of experience to improve its operations as well as to streamline efficiency in the use of limited resources and personnel.
VIII. Timelines and Next Steps
The background analysis is complete, but the fundraising process is just beginning. We have yet to receive final confirmation from the grant providers, but this funding appears secured. With the approval of a commercial loan, the Image Fashions management team is ready to begin operations immediately. The next step is to hire a buyer and purchase the first season of clothing for Image Fashions. It will require 8 months from order to delivery, so orders will need to be placed soon for the winter of 2003 season. The second step is to finalize the lease on 7400 South and begin the store build-out, which will take 4 months to complete.
Barry Miller, the President/CEO, will be the first full time employee and assume full responsibility for the operations of the business. The remaining members of the management team will continue to work their current jobs until the overall organization can support their fields of expertise. Gulshan Verma will be the second member of the management team to begin full time employment with Image Fashions.
The overall goal of the management team is to grow Image Fashions into a national chain that is recognized for urban fashions and its unique model of operating in low income neighborhoods. If the model and operation proves effective, then a second store will be opened in the 60619 ZIP code in two years. Further expansi on will take Image Fashions into other markets, specifically Detroit, Pittsburgh, St. Louis and Miami. Eventually, the size and growth of the organization will be able to support all 6 owners.
Illustra ion 18: Timeline of Act vities
Activities
Secure financing
Store location selection
Store construction
Brand / distribution right negotiation
Buyer selection
Hire staff and train employees
Advertising
Market validation
Month 1 2 3 4 5 6 7 8 9 10 11 12 13 14 15 16
28

APPENDIX A…Financial Analysis A-1…Most Likely Scenario
Image Fashions, LLC
Income Statement For Year Ending December 31, 20xx
(in $000's)
Year 1 Year 2 Year 3 Year 4 Year 5
Gross Revenue Returned Goods
Discounts
Net Revenue
$ 831.0 $ $ 12.5 $
$ 24.6 $
$ 793.9 $
2,527.9 $ 37.9 $
74.7 $
2,415.3 $
2,988.6 $ 44.8 $
88.3 $
2,855.5 $
3,141.5 $ 47.1 $
92.8 $
3,001.6 $
3,302.2 49.5
97.6
3,155.1
Cost of Goods Solds
$ 381.8 $
1,161.6 $
1,373.3 $
1,443.5 $
1,517.4
Gross Income
$ 412.1 $
1,253.7 $
1,482.2 $
1,558.0 $
1,637.7
Operating Expenses
Selling Expenses
Sales Salaries & Expenses
Advertising Expenses
Bad Debt Expense
Credit Card Charges
Theft/Shrink
Total Selling Expenses
$ 170.2 $
$ 24.9 $
$ - $
$ 6.4 $
$ 23.8 $
$ 225.2 $
175.9 $
75.8 $
- $
19.3 $
72.5 $
343.6 $
178.4 $
89.7 $
- $
22.8 $
85.7 $
376.5 $
179.2 $
94.2 $
- $
24.0 $
90.0 $
387.5 $
180.2
99.1
-
25.2
94.7
399.1
Administrative Expenses
Administrative Salaries & Expenses
Bank Charges
Loan Payments
Miscellaneous Expenses
Accounting Expenses
Insurance Legal Costs
Telephone
Rent Expenses
Security Expenses
Total Administrative Expenses
$ 108.0 $
$ - $
$ 117.8 $
$ 4.0 $
$ 12.0 $ $ 9.0 $
$ 1.2 $
$ 25.1 $
$ 6.0 $
$ 283.1 $
108.0 $
- $
127.6 $
4.0 $
12.0 $ 10.0 $
1.2 $
25.1 $
6.0 $
293.9 $
108.0 $
- $
138.1 $
4.0 $
12.0 $ 10.0 $
1.2 $
25.1 $
6.0 $
304.5 $
108.0 $
- $
149.6 $
4.0 $
12.0 $ 10.0 $
1.2 $
25.1 $
6.0 $
315.9 $
108.0
-
162.0
4.0
12.0 10.0
1.2
25.1
6.0
328.4
Total Operating Expenses
$ 508.3 $
637.4 $
681.0 $
703.5 $
727.5
Net Income from Operations
$ (101.0) $
611.5 $
796.4 $
849.8 $
905.5
Other (Income) or Expenses
Tax Expense
Interest income
Interest expense
Depreciation/Amortization
(Gain) or loss on assets
Other (Gain) or loss Total Other (Income) or Expenses
$ 9.1 $
$ - $
$ 80.6 $
$ 6.0 $
$ - $
$ - $ $ 95.7 $
244.6 $
- $
70.8 $
6.0 $
- $
- $ 321.4 $
318.6 $
- $
60.2 $
6.0 $
- $
- $ 384.8 $
339.9 $
- $
48.8 $
6.0 $
- $
- $ 394.7 $
362.2
-
36.3
6.0
-
- 404.5
Net Profit after Taxes
$ (196.7) $
290.1 $
411.6 $
455.1 $
500.9
29

Image Fashions, LLC
Balance Sheet For Year Ended December 31, 20xx (in 000's)
r
(in $000's)
Assets Year 1 Year 2 Year 3 Year 4 Year 5
Current Assets Cash and cash equivalents Accounts Recievable
Inventories
Prepaid expenses
Total Current Assets
Long Term Assets Property, plant and equipment
Goodwill and other intangibles
Other assets
Total Long Term Assets Total Assets
$ 109.6 $ $ 45.8 $
$ 198.5 $
$ 5.1 $
$ 358.9 $
$ - $
$ 24.0 $
$ - $
$ - $
$ 24.0 $ $ 382.9 $
0.3 $ 92.6 $
603.8 $
6.4 $
703.1 $
- $
18.0 $
- $
- $
18.0 $ 721.1 $
307.9 $ 97.4 $
713.9 $
6.8 $
1,125.9 $
- $
12.0 $
- $
- $
12.0 $ 1,137.9 $
732.4 $ 102.4 $
750.4 $
7.0 $
1,592.2 $
- $
6.0 $
- $
- $
6.0 $ 1,598.2 $
1,201.0 107.6
788.8
7.3
2,104.6
-
-
-
-
- 2,104.6
Liabilities and Owner's Equity
Cu rent liabilities Current debt
Accounts payable
Accrued expenses
Total current liabilities
$ 942.9 $
$ 5.1 $
$ - $
$ 948.0 $
815.3 $
6.4 $
- $
821.7 $
677.2 $
6.8 $
- $
684.0 $
527.6 $
7.0 $
- $
534.6 $
365.5
7.3
-
372.8
Long term debt
-$ $ - $ - $
$- -
Total liabilities
$ 948.0 $
821.7 $
684.0 $
534.6 $
372.8
Total Owners' Equity
$ (565.1) $
(100.6) $
453.9 $
1,063.6 $
1,731.8
Image Fashions, LLC
Statement of Cash Flows For Year Ended December 31, 20xx (in 000's)
(in $000's)
Cash flows from Operating Activities
Net Income per Income Statement
Add
Depreciation
Deduct
$ (196.7) $
$ 6.0 $
290.1 $
6.0 $
411.6 $
6.0 $
455.1 $
6.0 $
500.9
6.0
Increase in Inventory N/A $
Increase in PrePaid Expenses N/A $
405.3 $
1.3 $
110.0 $
0.4 $
36.5 $
0.2 $
38.4
0.2
Decrease in Accounts Payable N/A $ (1.3) $ (0.4) $ (0.2) $ (0.2) Net Cash Flow from Operating Activities $ (190.7) $ (109.3) $ 307.6 $ 424.6 $ 468.5
Cash flows from Investing Activities
Cash Received from Investments Sold
Less Cash Paid for Store Equipment
Net Cash Flow from Investing Activities
-$ $ - $ - $
-$ $ - $ - $
-$ $ - $ - $
-$ $ - $ - $
$- -
$- -
$- -
$- -
Cash flows from Financing Activities
Cash Paid for Dividends
-$ $ - $ - $
$- -
Increase in Cash
$ (190.7) $
(109.3) $
307.6 $
424.6 $
468.5
Cash at the Beginning of the Year
Cash at the End of the Year
$ 300.3 $
$ 109.6 $
109.6 $
0.3 $
0.3 $
307.9 $
307.9 $
732.4 $
732.4
1,201.0
30

Image Fashions, LLC
Financial Metrics and Coverage Ratios
Income Statement
Year 1 Year 2 Year 3 Year 4 Year 5
Sales growth (%) N/A 204% 18% 5% 5%
Net Revenue/Sq. Foot $103.87 $315.99 $373.58 $392.69 $412.78
Cost of goods sold / Sales (%) 48% 48% 48% 48% 48% Gross margin (%) 52% 52% 52% 52% 52% Operating expenses / Sales (%) 64% 26% 24% 23% 23% Operating Margin (%) 36% 74% 76% 77% 77% Operating Growth Rate (%) N/A -708% 30% 7% 7% Net income margin (%) -25% 12% 14% 15% 16% Net income growth (%) N/A 248% 42% 11% 10%
Coverage Ratios
Debt / EBITDA -9.3 x 1.3 x 0.8 x 0.6 x 0.4 x EBITDA / Interest expense -1.3 x 8.7 x 13.3 x 17.5 x 25.0 x EBIT / Interest expense -2.3 x 7.6 x 12.2 x 16.4 x 23.8 x Note: All Sales Percentages are based upon Net Sales
31

A 2.. Best Case Scenario -
Image Fashions, LLC
Income Statement For Year Ending December 31, 20xx
(in $000's)
Year 1 Year 2 Year 3 Year 4 Year 5
Gross Revenue
Returned Goods Discounts
Net Revenue
$ 1,151.0 $
$ 17.3 $ $ 34.0 $
$ 1,099.7 $
3,501.7 $
52.5 $ 103.5 $
3,345.7 $
4,139.8 $
62.1 $ 122.3 $
3,955.3 $
4,351.6 $
65.3 $ 128.6 $
4,157.7 $
4,574.2
68.6 135.2
4,370.4
Cost of Goods Solds
$ 528.9 $
1,609.0 $
1,902.2 $
1,999.6 $
2,101.9
Gross Income
$ 570.8 $
1,736.6 $
2,053.1 $
2,158.2 $
2,268.6
Operating Expenses
Selling Expenses
Sales Salaries & Expenses Advertising Expenses
Bad Debt Expense
Credit Card Charges
Theft/Shrink
Total Selling Expenses
$ 170.6 $ $ 34.5 $
$ - $
$ 8.8 $
$ 33.0 $
$ 246.9 $
180.8 $ 105.0 $
- $
26.8 $
100.4 $
413.0 $
184.2 $ 124.2 $
- $
31.6 $
118.7 $
458.7 $
185.3 $ 130.5 $
- $
33.3 $
124.7 $
473.9 $
186.6 137.2
-
35.0
131.1
489.9
Administrative Expenses
Administrative Salaries & Expenses
Bank Charges
Loan Payments Miscellaneous Expenses
Accounting Expenses
Insurance
Legal Costs
Telephone
Rent Expenses
Security Expenses
Total Administrative Expenses
$ 108.0 $
$ - $
$ 120.1 $
$ 4.0 $
$ 12.0 $
$ 9.0 $
$ 1.2 $
$ 25.1 $
$ 6.0 $
$ 285.4 $
108.0 $
- $
130.1 $
4.0 $
12.0 $
10.0 $
1.2 $
25.1 $
6.0 $
296.4 $
108.0 $
- $
140.9 $
4.0 $
12.0 $
10.0 $
1.2 $
25.1 $
6.0 $
307.2 $
108.0 $
- $
152.6 $
4.0 $
12.0 $
10.0 $
1.2 $
25.1 $
6.0 $
318.9 $
108.0
-
165.2
4.0
12.0
10.0
1.2
25.1
6.0
331.5
Total Operating Expenses
$ 532.3 $
709.4 $
765.9 $
792.8 $
821.4
Net Income from Operations
$ 33.7 $
1,022.4 $
1,282.4 $
1,360.6 $
1,442.3
Other (Income) or Expenses
Tax Expense
Interest income
Interest expense
Depreciation/Amortization
(Gain) or loss on assets Other (Gain) or loss
Total Other (Income) or Expenses
$ 38.4 $
$ - $
$ 82.2 $
$ 6.0 $
$ - $ $ - $
$ 126.5 $
409.0 $
- $
72.2 $
6.0 $
- $ - $
487.2 $
513.0 $
- $
61.4 $
6.0 $
- $ - $
580.4 $
544.2 $
- $
49.7 $
6.0 $
- $ - $
600.0 $
576.9
-
37.1
6.0
- -
620.0
Net Profit after Taxes
$ (92.8) $
535.2 $
702.0 $
760.6 $
822.3
32

Image Fashions, LLC
Balance Sheet For Year Ended December 31, 20xx (in 000's)
r
(in $000's)
Assets Year 1 Year 2 Year 3 Year 4 Year 5
Current Assets Cash and cash equivalents Accounts Recievable
Inventories
Prepaid expenses
Total Current Assets
Long Term Assets Property, plant and equipment
Goodwill and other intangibles
Other assets
Total Long Term Assets Total Assets
$ 30.0 $ $ 63.4 $
$ 274.9 $
$ 5.3 $
$ 373.6 $
$ - $
$ 24.0 $
$ - $
$ - $
$ 24.0 $ $ 397.6 $
9.7 $ 128.3 $
836.4 $
7.1 $
981.5 $
- $
18.0 $
- $
- $
18.0 $ 999.5 $
565.3 $ 134.9 $
988.8 $
7.7 $
1,696.7 $
- $
12.0 $
- $
- $
12.0 $ 1,708.7 $
1,281.4 $ 141.8 $
1,039.4 $
7.9 $
2,470.5 $
- $
6.0 $
- $
- $
6.0 $ 2,476.5 $
2,056.5 149.0
1,092.6
8.2
3,306.4
-
-
-
-
- 3,306.4
Liabilities and Owner's Equity
Cu rent liabilities Current debt
Accounts payable
Accrued expenses
Total current liabilities
$ 961.5 $
$ 5.3 $
$ - $
$ 966.8 $
831.4 $
7.1 $
- $
838.5 $
690.5 $
7.7 $
- $
698.2 $
538.0 $
7.9 $
- $
545.9 $
372.7
8.2
-
380.9
Long term debt
-$ $ - $ - $
$- -
Total liabilities
$ 966.8 $
838.5 $
698.2 $
545.9 $
380.9
Total Owners' Equity
$ (569.2) $
161.1 $
1,010.5 $
1,930.6 $
2,925.4
Image Fashions, LLC
Statement of Cash Flows For Year Ended December 31, 20xx (in 000's)
(in $000's)
Cash flows from Operating Activities
Net Income per Income Statement
Add
Depreciation
Deduct
$ (92.8) $
$ 6.0 $
535.2 $
6.0 $
702.0 $
6.0 $
760.6 $
6.0 $
822.3
6.0
Increase in Inventory N/A $
Increase in PrePaid Expenses N/A $
561.5 $
1.8 $
152.4 $
0.6 $
50.6 $
0.3 $
53.2
0.3
Decrease in Accounts Payable N/A $ (1.8) $ (0.6) $ (0.3) $ (0.3) Net Cash Flow from Operating Activities $ (86.8) $ (20.2) $ 555.6 $ 716.0 $ 775.2
Cash flows from Investing Activities
Cash Received from Investments Sold
Less Cash Paid for Store Equipment
Net Cash Flow from Investing Activities
-$ $ - $ - $
-$ $ - $ - $
-$ $ - $ - $
-$ $ - $ - $
$- -
$- -
$- -
$- -
Cash flows from Financing Activities
Cash Paid for Dividends
-$ $ - $ - $
$- -
Increase in Cash
$ (86.8) $
(20.2) $
555.6 $
716.0 $
775.2
Cash at the Beginning of the Year
Cash at the End of the Year
$ 116.8 $
$ 30.0 $
30.0 $
9.7 $
9.7 $
565.3 $
565.3 $
1,281.4 $
1,281.4
2,056.5
33

Image Fashions, LLC
Financial Metrics and Coverage Ratios
Income Statement
Year 1 Year 2 Year 3 Year 4 Year 5
Sales growth (%) N/A 204% 18% 5% 5%
Net Revenue/Sq. Foot $143.88 $437.71 $517.47 $543.95 $571.78
Cost of goods sold / Sales (%) 48% 48% 48% 48% 48% Gross margin (%) 52% 52% 52% 52% 52% Operating expenses / Sales (%) 48% 21% 19% 19% 19% Operating Margin (%) 52% 79% 81% 81% 81% Operating Growth Rate (%) N/A 2929% 25% 6% 6% Net income margin (%) -8% 16% 18% 18% 19% Net income growth (%) N/A 677% 31% 8% 8%
Coverage Ratios
Debt / EBITDA 28.5 x 0.8 x 0.5 x 0.4 x 0.3 x EBITDA / Interest expense 0.4 x 14.2 x 20.9 x 27.4 x 38.9 x EBIT / Interest expense -0.7 x 13.1 x 19.8 x 26.2 x 37.8 x Note: All Sales Percentages are based upon Net Sales
34

A 3…Worst Case Scenario -
Image Fashions, LLC
Income Statement For Year Ending December 31, 20xx
(in $000's)
Year 1 Year 2 Year 3 Year 4 Year 5
Gross Revenue
Returned Goods Discounts
Net Revenue
$ 488.5 $
$ 7.3 $ $ 14.4 $
$ 466.8 $
1,486.2 $
22.3 $ 43.9 $
1,420.0 $
1,757.1 $
26.4 $ 51.9 $
1,678.8 $
1,847.0 $
27.7 $ 54.6 $
1,764.7 $
1,941.5
29.1 57.4
1,855.0
Cost of Goods Solds
$ 224.5 $
682.9 $
807.4 $
848.7 $
892.1
Gross Income
$ 242.3 $
737.1 $
871.4 $
916.0 $
962.9
Operating Expenses
Selling Expenses
Sales Salaries & Expenses Advertising Expenses
Bad Debt Expense
Credit Card Charges
Theft/Shrink
Total Selling Expenses
$ 170.1 $ $ 14.6 $
$ - $
$ 3.7 $
$ 14.0 $
$ 202.5 $
171.1 $ 44.6 $
- $
11.4 $
42.6 $
269.6 $
172.1 $ 52.7 $
- $
13.4 $
50.4 $
288.6 $
172.6 $ 55.4 $
- $
14.1 $
52.9 $
295.1 $
173.2 58.2
-
14.8
55.6
301.9
Administrative Expenses
Administrative Salaries & Expenses
Bank Charges
Loan Payments Miscellaneous Expenses
Accounting Expenses
Insurance
Legal Costs
Telephone
Rent Expenses
Security Expenses
Total Administrative Expenses
$ 108.0 $
$ - $
$ 118.9 $
$ 4.0 $
$ 12.0 $
$ 9.0 $
$ 1.2 $
$ 25.1 $
$ 6.0 $
$ 284.2 $
108.0 $
- $
128.8 $
4.0 $
12.0 $
10.0 $
1.2 $
25.1 $
6.0 $
295.1 $
108.0 $
- $
139.5 $
4.0 $
12.0 $
10.0 $
1.2 $
25.1 $
6.0 $
305.8 $
108.0 $
- $
151.1 $
4.0 $
12.0 $
10.0 $
1.2 $
25.1 $
6.0 $
317.4 $
108.0
-
163.6
4.0
12.0
10.0
1.2
25.1
6.0
329.9
Total Operating Expenses
$ 486.7 $
564.7 $
594.4 $
612.5 $
631.8
Net Income from Operations
$ (249.2) $
167.6 $
272.3 $
298.7 $
326.2
Other (Income) or Expenses
Tax Expense
Interest income
Interest expense
Depreciation/Amortization
(Gain) or loss on assets Other (Gain) or loss
Total Other (Income) or Expenses
$ - $
$ - $
$ 81.4 $
$ 6.0 $
$ - $ $ - $
$ 87.4 $
69.4 $
- $
71.5 $
6.0 $
- $ - $
146.9 $
108.9 $
- $
60.8 $
6.0 $
- $ - $
175.7 $
119.5 $
- $
49.2 $
6.0 $
- $ - $
174.7 $
130.5
-
36.7
6.0
- -
173.2
Net Profit after Taxes
$ (336.6) $
20.7 $
96.5 $
124.0 $
153.0
35

Image Fashions, LLC
Balance Sheet For Year Ended December 31, 20xx (in 000's)
r
(in $000's)
Assets Year 1 Year 2 Year 3 Year 4 Year 5
Current Assets Cash and cash equivalents Accounts Recievable
Inventories
Prepaid expenses
Total Current Assets
Long Term Assets Property, plant and equipment
Goodwill and other intangibles
Other assets
Total Long Term Assets Total Assets
$ 212.5 $ $ 26.9 $
$ 116.7 $
$ 4.9 $
$ 361.0 $
$ - $
$ 24.0 $
$ - $
$ - $
$ 24.0 $ $ 385.0 $
0.9 $ 54.5 $
355.0 $
5.6 $
416.0 $
- $
18.0 $
- $
- $
18.0 $ 434.0 $
38.7 $ 57.2 $
419.7 $
5.9 $
521.6 $
- $
12.0 $
- $
- $
12.0 $ 533.6 $
147.3 $ 60.2 $
441.2 $
6.1 $
654.8 $
- $
6.0 $
- $
- $
6.0 $ 660.8 $
283.8 63.3
463.7
6.3
817.1
-
-
-
-
- 817.1
Liabilities and Owner's Equity
Cu rent liabilities Current debt
Accounts payable
Accrued expenses
Total current liabilities
$ 951.9 $
$ 4.9 $
$ - $
$ 956.8 $
823.2 $
5.6 $
- $
828.8 $
683.7 $
5.9 $
- $
689.6 $
532.6 $
6.1 $
- $
538.8 $
369.0
6.3
-
375.4
Long term debt
-$ $ - $ - $
$- -
Total liabilities
$ 956.8 $
828.8 $
689.6 $
538.8 $
375.4
Total Owners' Equity
$ (571.9) $
(394.8) $
(156.0) $
122.0 $
441.7
Image Fashions, LLC
Statement of Cash Flows For Year Ended December 31, 20xx (in 000's)
(in $000's)
Cash flows from Operating Activities
Net Income per Income Statement
Add
Depreciation
Deduct
$ (336.6) $
$ 6.0 $
20.7 $
6.0 $
96.5 $
6.0 $
124.0 $
6.0 $
153.0
6.0
Increase in Inventory N/A $
Increase in PrePaid Expenses N/A $
238.3 $
0.8 $
64.7 $
0.3 $
21.5 $
0.2 $
22.6
0.2
Decrease in Accounts Payable N/A $ (0.8) $ (0.3) $ (0.2) $ (0.2) Net Cash Flow from Operating Activities $ (330.6) $ (211.6) $ 37.8 $ 108.5 $ 136.5
Cash flows from Investing Activities
Cash Received from Investments Sold
Less Cash Paid for Store Equipment
Net Cash Flow from Investing Activities
-$ $ - $ - $
-$ $ - $ - $
-$ $ - $ - $
-$ $ - $ - $
$- -
$- -
$- -
$- -
Cash flows from Financing Activities
Cash Paid for Dividends
-$ $ - $ - $
$- -
Increase in Cash
$ (330.6) $
(211.6) $
37.8 $
108.5 $
136.5
Cash at the Beginning of the Year
Cash at the End of the Year
$ 543.1 $
$ 212.5 $
212.5 $
0.9 $
0.9 $
38.7 $
38.7 $
147.3 $
147.3
283.8
36
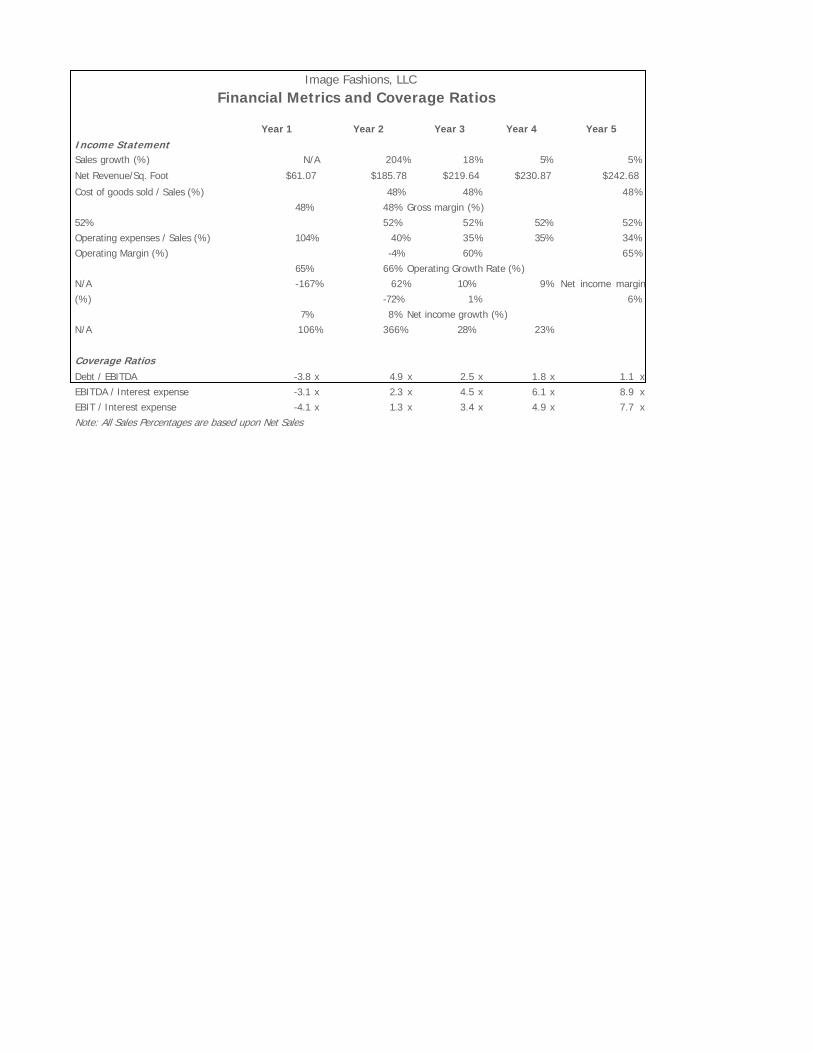
Image Fashions, LLC
Financial Metrics and Coverage Ratios
Income Statement
Year 1 Year 2 Year 3 Year 4 Year 5
Sales growth (%) N/A 204% 18% 5% 5%
Net Revenue/Sq. Foot $61.07 $185.78 $219.64 $230.87 $242.68
Cost of goods sold / Sales (%) 48% 48% 48% 48% 48% Gross margin (%) 52% 52% 52% 52% 52% Operating expenses / Sales (%) 104% 40% 35% 35% 34% Operating Margin (%) -4% 60% 65% 65% 66% Operating Growth Rate (%) N/A -167% 62% 10% 9% Net income margin (%) -72% 1% 6% 7% 8% Net income growth (%) N/A 106% 366% 28% 23%
Coverage Ratios
Debt / EBITDA -3.8 x 4.9 x 2.5 x 1.8 x 1.1 x EBITDA / Interest expense -3.1 x 2.3 x 4.5 x 6.1 x 8.9 x EBIT / Interest expense -4.1 x 1.3 x 3.4 x 4.9 x 7.7 x Note: All Sales Percentages are based upon Net Sales

37

APPENDIX B…Management Resumes
38
WILLIAMS, OSCAR
PRESENT ADDRESS: PERMANENT ADDRESS: 08907 Valencia 08907 Valencia Spain Spain
Personal Data: 28 years old, Spanish, single EDUCATION
2001 - 2003 IESE, UNIVERSITY OF TOLEDO TOLEDO, SPAIN Master of Business Administration (MBA Program).
Fall 2002 WILLIAMS SCHOOL OF MANAGEMENT WILLIAMS, UNITED STATES MBA Student Exchange Program
1996 – 1998 HOGESCHOOL ZEELAND VLISSINGEN, THE NETHERLANDS Bachelor in Commercial Economics
1992 – 1997 UNIVERSITAT DE TOLEDO TOLEDO, SPAIN Business Administration Degree
EXPERIENCE Summer 2002 Dell BARCELONA, SPAIN
Summer Internship (IESE) Developed a marketing plan for the banking group to improve DEll’s business on Commercial and Investment Banks.
Feb. 99-Oct. 01 Dell BARCELONA, SPAIN Key Account Manager: Personal System Division (PSG) • In charge of three Dell Business Partners. • Responsible for achieving annual sales objective of more than US$40 million. • Coordinator of a project (budget of US$20 million) for renewal of all PCs in the office network of a bank. Liaison between departments, both Spanish and foreign, to fulfill requirements set by the client to win the bid. • Presented products to clients and distributors. • Awarded with the "EMEA Leadership Award" twice (only 160 p eople from IBM Europe are awarded quarterly).
Feb. 98-Dec. 98 BLUE, S.A. ESPLUGUES DEL LL., SPAIN
Financial Analyst • Carried out financial analysis of the policies for the marketing and sales department as well as studies to impro ve processes. Monthly reporting to the head -office in Germany. • Feasibility study for Braun Española´s subsidiary in Portugal.
Jul. 97-Jan. 98 NEXT VIEWING SYSTEMS COSTA MESA (CA), UNITED STATES High-quality printer manufacturing company wit h a total staff around 200 Assistant, International Sales and Marketing Department • Serviced sales network at international level for countries throughout the world with total control for South America with regard to distributors and campaign designs. • Located new distributors in countries with no representation.
Summer 1996 CAIXA DE SABADELL SABADELL, SPAIN
Administrative Assistant, Payment Methods Department • Provided service for the complete network of offices, clients and financial companies. • Previously worked from June to November 1995 in an office dealing with the public.
LANGUAGES
Spanish Mother tongue Catalan Mother tongue English Proficient French Fair

ALLEN GREEN
EDUCATION
5540 North Drive # 16H • Williams, IL • 60657
2001 – Present WILLIAMS SCHOOL OF MA NAGEMENT Williams, IL
Candidate for Master of Business Administration degree, June 2003 Candidate for Master in Engineering Management degree, June 2003 Majors in finance, marketing, management & strategy, entrepreneurship Member, Finance Club, Marketing Club, Scuba Diving Club
1992 – 1996 WILLIAMS UNIVERS ITY Williams, IL
Bachelor of Science in Mechanical Engineering, December 1996 Bachelor of Science in Manufacturing Engineering, December 1996
EXPERIENCE
1997 – 2001 DELRAY CONSULTING Williams, IL
Consultant • Telecommunications Provider – Customer Care and Billing System Implementation
Led a multi-national system testing execution team (9 client, contract, and firm employees). Developed business scenarios used to identify and resolve over 1,000 defects during system development. Managed responsibilities between Israeli, French, and Canadian teams.
• Broadband Provider – Inventory Visibility Analysis Assessed the current inventory tracking method and recommended new processes. Facilitated selection of software to address cable system inventory visibility issues.
• Electronic Components & Computer Distributor – Financial ERP Planning Project Led accounts receivable team. Assessed and developed new order to cash cycle processes.
• Delray Consulting InformationPrint™ Approach Development – Internal Project
Developed a matrix of financial performance metrics for various corporate functional areas.
• International Game & Entertainment Developer – Financial ERP Implementation Managed accounts receivable team consisting of 2 System Analysts and 6 client personnel.
• Midwest Truck & Automotive Supplier – Manufacturing ERP Implementation
Developed the financial business requirements for a manufacturing plant opening in Mexico.
• Midwest Utility Company – ERP Software Selection Project Developed detailed project cost model for ERP package implementation.
• Nation’s Largest HMO, Member Service Center – Call Center Optimization Project Identified Call Center management weaknesses and made recommendations regarding processes, FTE scheduling, and FTE productivity measures.
Summer 1996 SUNRAY MOTORS Soot, MI Design Engineer Intern • V6 Engineering Center – Product Design Internship
Responsible for the design modifications, testing, and analysis of a p rototype intake manifold.
Summers 1995, ENGINEERING LOGISTICS COMPANY Freeburg, CO 1994 Process Engineer Intern
• Engineering Logistics Company – Manufacturing Optimization Internship Designed a new manufacturing layout for two flow meter lines, including a new parts handling and storage system.
• Engineering Logistics Company – Quality Assurance Internship Facilitated the implementation of ISO 9003 international quality control standards.
OTHER DATA
• Conversant in German – travel Europe extensively, family resides in Germany and Austria.
• Interests include photography and scuba diving.
41

JON SMITH 1955 Warren Avenue #523
Wiliams, Illinois 60201, USA
EDUCATION 2001-Present WILLIAMS SCHOOL OF MA NAGEMENT, Williams, IL
WILLIAMS UNIVERSITY Candidate for Master of Business Administration degree, June 2003. • Intended majors in management & strategy, finance, and international business. • Leader, Global Initiatives in Management class and trip to Vi etnam. • Recipient of Janson’s scholarship, awarded to accomplished Norwegians with potential to significantly impact
Norwegian industry. • Member of general management, consulting, finance and public speaking clubs.
1990-1995 SCANDINAVIAN INSTITUTE OF TECHNOLOGY Stockholm, Sweden
Master of Science, Engineering Cybernetics, December 1995. • Co-Chair of Erasmus European Student Exchange Network. • Head Instructor of NTHI Tae Kwon Do club. Trained Norwegian and European Champions.
EXPERIENCE Summer 2002 DUTCH BANK
Summer Associate, Global Investment Banking - Mergers and Acquisitions Bristol, UK • Member of a sell side team for a live M&A deal in the UK. Responsible for setting up due diligence
meetings for potential buyers and participated in discussing the terms of the final bid. • Participated in a €125MM High Yield offering. Drafted the Offering Memorandum and performed
company/financial due diligence. Prepared client senior management for debt rating agency meeting. • Performed a broad range of corporate finance duties including comparable company, comparable
transaction, strategic analyses and preparation of pitch book and various management presentations.
1996-2001 ALLRIGHT TECHNOLOGY Swedish consulting firm providing high-end IT, e-commerce and marketing services. Director North Pole, Norway
• Promoted to Director, Oil & Gas Division in 2001. Youngest director in company’s history.
Senior Consultant – Information System Group 1996 -2001 Houston, TX & Caracas, Venezuela • Earned early promotion as youngest leader of $90 MM project implementing the world’s most
advanced control system for oil and gas production for the Venezuelan National Oil Company (PDVSA). • Led global cross-functional teams of 3 to 8 consultants and client personnel in all aspects of
development of information systems to support client’s water injection, oil treatment and water treatment operations.
• Shortened waiting time of lab results from 2 days to 4 seconds, potential annual saving of $1.5 MM in reduced chemical consumption.
• Implemented system for corrosion monitoring in pipelines, expected savings of over $ 1M annually. • Designed treatment systems, significantly increasing probability for accurate and timely crude
delivery to external clients, saving daily fines as high as $150 K and rerouting costs. • Managed relations with client’s middle management, including contract negotiations.
1995-1996 INDEPENDENT AS
Norway’s largest software house. Software Programmer Stavanger, Norway • Implemented system currently used by over 75 % of all Norwegian municipals for healthcare
reporting • Reprogrammed 3000+ users healthcare system from UNIX to Windows.
42

EDUCATION
BARRY MILLER 1544 South Ave, Apt. 1S, Williams, IL 60626
2000-Current WILLIAMS SCHOOL OF MA NAGEMENT Williams, IL BINGO SCHOOL O F ENGINEERING WILLIAMS UNIVERS ITY Candidate for Master of Business Administration degree, Class of 2003 Candidate for Master of Engineering Management degree, Class of 2003 • Majors: Finance, Entrepreneurship & Innovation and Management & Strategy • Select ed as a leader for the Southeast Asian management studies program • Awarded the first Student Leadership Honor for work in the Neighborhood Business Initiative • Club Memberships: Investment Banking, Finance, Entrepreneurship & Venture Capital, and
Business Leadership
1991-1996 ZURICH COLLEGE Gettysburg, PA Bachelors of Science in Chemical Engineering with Minor in Business Administration • Received a Varsity Football Letter and Eddie Hartman Award for Service and Character • Paid for degree with work-study programs and summer construction projects
EXPERIENCE
2002 RAR CORPORATION Wood Dale, IL
Summer Associate, Mergers and Acquisitions • Identified and investigated strategic acquisition targets for a $700M aerospace/Defense company • Provided comprehensive and detailed analysis, including financial considerations, organizational structure and
strategic rationale, for CEO and Board of Directors for a $12M acquisition • Performed synergy and financial valuation analysis including merger pro forma projections, earnings,
accretion/dilution, discounted cash flow and common stock comparisons
2001-2002 MILLENIUM INVESTMENT GROUP Beirut, Lebanon Business Development Officer • Developed and e xecuted diversified investment strategy for a Jordanian private equity firm • Provided strategic rationale and financial analysis of international investment opportunities, including potential
venture partners, to executive officers • Managed cross-border client contact • Defined preliminary fund structure for a multinational grant program, called “The Qualifying Investment Fund,”
to use business incentives to improve the Jordan-Israel peace treaty
1996-2000 NEXT PHYSICS, INCORPORATED Operations Engineer/Q uality Leader, 1999-2000 St. Lou, IL • Managed Quality Department budget and personnel resulting in a 20% decrease in operating budget • Developed and implemented an operational strategy resulting in improved labor effectiveness and utilization • Improved material management by designing a process control program to reduce costs by $230,000/year
Quality Process Engineer, 1996-1999 Raca, PA • Led department reorganization resulting in $1.25M in savings and a 25% work force reduction • Designed Internet -based system to improve communication between customers, logistics and operations and to
save $500,000 in material handling costs • Received 3 separate awards for contribution and customer commitment
ADDITIONAL ACTIVITIES 2000-Current NEIGHBORHOOD BUSINESS INITIATIVE Williams, IL
Founder and President • Started a volunteer-based consulting organization to aid businesses in under-resourced neighborhoods • Directed all aspects of organizational activities, including capability assessments, corporate partnerships,
infrastructure design, marketing, project development, project management and recruitment • Organization has grown to 140 volunteers • Organization has completed 8 projects and is engaged in an additional 15 projects
COMMUNITY SERVIC E • Led 11 volunteers in building projects in the Dominican Republic and Costa Rica • Volunteer martial arts instructor for at -risk high school students in Elgin, IL • Led summer camp for 70 inner city children in Pittsburgh, PA
INTERESTS • Hiking and Mountaineering, International Travel, Philosophy, Rock Climbing, Theater and Wine
43

WILL SHARPE 1941 New York Avenue, # 301, Williams, Illinois 60201
EDUCATION 2001-Present WILLIAMS SCHOOL OF MA NAGEMENT, WILLIAMS UNIVERSITY Williams, IL
Candidate for Master of Business Administration degree, June 2003. • Intended majors in Management & Strategy, Finance and Marketing. • Elected as Global Affairs Representative of student government and developed Williams Globe website. • Team Captain for AT Kearney Global Prize Consulting Competition. • Member of Finance Club, Consulting Club, Private Equity and Entrepreneurship Club.
1994-1996 GUMBO UNIVERSITY Leslo, IN
Master of Science degree in Electrical Engineering, May 1996.
1991-1994 GEORGIA TECH Blacksburg, GA Bachelor of Science degree in Electrical Engineering, May 1994. • Graduated Magna Cum Laude, Dean’s List, Completed 4-year program in 3 -years. • Elected Social Chairman of Tau Beta Pi National Engineering Honor Society.
EXPERIENCE Summer 2002 BLUEFRONT NETWORKS San Jose, CA
Summer Associate, Corporate Strategy and Business Development • Developed business case and financial model to preserve #1 market share and stimulate new revenue
opportunities with top global clients. • Conducted gap analysis of corporate marketing strategy against major competitors and recommended actions
to bolster industry leadership position.
1996-2001 COMPUCHESS LIMITED Singapore Regional Business Manager, 2000-2001 • Spearheaded business development activities and formulated marketing strategies by focusing on specific market
requirements and value creation methodologies. • Managed complex cross-border proposals valued at over $130 Million, requiring extensive project management,
negotiation and analytical skills. • Conducted presentations to senior executives of lead ing global service providers at international telecom
conferences, leading to new account opportunities worth $8 Million. • Strengthened relationships with global alliance partners to deliver value-added solutions. • Analyzed bottom-line profit drivers and evaluated competitive benchmarking of product portfolio. • Selected for Year 2000 Employee Recognition Award, given to top 5% of 7,000 global employees.
Regional Systems Sales Specialist, 1997-1999 • Achieved sales revenue growth of 300% over 2-year period, despite economic downturn through focused
marketing efforts and dedicated relationship building. • Designed product positioning and pricing strategy for regional offices and channel partners. • Advised on creation of global customer service organization to offer professional services, generating
more than $2 Million in revenue and enhanced customer satisfaction metrics. • Reengineered configuration tools to improve sales request response time from 2 days to 1 hour. • Promoted from Systems Engineer after one year with greater product management responsibilities.
44

EDUCATION
GEORGE MICHAELS 1725 Blink Avenue, #527,Williams, IL 60201
2001-present WILLIAMS SCHOOL OF MA NAGEMENT Williams, IL
WILLIAMS UNIVERS ITY Candidate for Master of Business Administration degree, June 2003. • Intended majors in Finance, Management & Strategy and Marketing. • Selected to Dean’s Ho nor List. • Selected to represent Williams at the Economist Magazine Business Schools Challenge in Canada. • Runner-up, Williams Global Prize Consulting Case competition (out of fifteen teams). • Editor, Williams 2003 Yearbook and elected section representative (o ut of 68 people).
1993-1997 DUN SCHOOL OF ECONOMICS Dun, England Master of Science in Political Economy, September 1997. Bachelors of Science in Economics (honors), June 1996. • Financed whole education through 50% scholarship and working as a televis ion news producer. • Briefed British Foreign Office diplomats for inter-governmental conference negotiations with Germany.
EXPERIENCE
Summer 2002 ENGLISH BROADCASTING CORPORATION (EBC) London, England (six weeks) Associate, Finance Planning and Analysis
• Reported directly to Chief Operating Officer, BBC News. • Coordinated a structural and organizational review of BBC News divisions to extract cost savings of $23mm a
year on an annualized basis across interactive, radio and television platforms.
Summer 2002 OLD MEXICO MEDIA Los Angeles/San Francisco, CA (nine weeks) Business Development Associate,(a marketing agency focusing on the ethnic markets).
• Managed a six people cross-functional team to develop and launch new media directory product o n both print and interactive online platform.
• Prepared business plan and proposal that generated $125,000 product sponsorship covering development costs for the first two years.
2000-2001 INTERNATIONAL IMPROVEMENTS GROUP (IIG) London, England
Financial Analyst, IIG. Reported directly to CFO. • Managed financial relationship with IIG’s largest client. Dealt directly with client CFO and COO on project to
create world’s first converged media network (client billings of $7 0mm per year). • Implemented financial and management reporting procedures and organizational structure charts for 450 staff,
prepared forecasts and monitored cost center variances against budgets. • Devised new budget and capital expenditure processes that reduced time to approval from client by 70%. • Negotiated payment schedule with client, resulting in payment of $20mm six months before due date,
improving profit margins on the project by 28%. • Prepared and presented business cases for projects which were approved by client and resulted in increasing
revenues from client by $5mm.
1997-2000 ASSOCIATED PRESS TELEVISION NEWS (APTN) London, England
Television arm of the Associated Press. Revenues grew from $18mm in 1997 to $110mm in 2000. Budget Accountant, 1999 -2000. • Budgetary responsibilities were in excess of $100mm and located in over 60 countries. • Monitored costs and revenues from profit centers against budget. Marketi ng Analyst, 1997 -1999. • Member of due-diligence and integration teams on acquisition and merger of Worldwide Television News
(Integration team given special bonus for outstanding work (for only third time in 150 years). • Developed market projection, pricing model and business plan for an industry -first joint venture with Ziff -
Davis to create a Technology News Feed. OTHER DATA
• Fluent in Hindi; volunteer teacher at a local school (one afternoon a week); Struggling golfer and avid
cricketer (played in a competit ive London league). Co-chair and Treasurer, Sports Business Club 45