Embed Size (px)
Citation preview
Other Apparel Accessories andOther Apparel Manufacturing:2002
2002 Economic Census
Manufacturing
Industry Series
Issued December 2004
EC02-31I-315999 (RV)
U.S. Department of CommerceEconomics and Statistics Administration
U.S. CENSUS BUREAU

This report was prepared in the Manufacturing and Construction Division under the direction of Judy M.Dodds, Assistant Division Chief for Census and Related Programs who was responsible for the overallplanning, management, and coordination. Robert Reinard, Chief, Consumer Goods Industries Branch,assisted by Suzanne Conard, Susan DiCola, and James Hinckley, and Raphael Corrado,Tom Flood, Robert Miller, and Robert Rosati, Special Assistants, performed the planning andimplementation. Bill Baldwin, Phillip Brown, Chris Cunningham, Karen Harshbarger, Tom Ickes,Evelyn Jordan, Cathy Knudsen, Robert Lee, Jennifer Leotta, Michael Perkinson,LaTanya Steele, Aronda Stovall, Susan Sundermann, Dora Thomas, and Ronanne Vinson,provided primary staff assistance. Mendel D. Gayle, Chief, Census and Related Programs SupportBranch, assisted by Kimberly DePhillip, Section Chief, performed overall coordination of thepublication process. Patrick Duck, Michael Flaherty, Taylor C. Murph, Wanda Sledd, andVeronica White provided primary staff assistance.
Mathematical and statistical techniques, as well as the coverage operations, were provided byPaul Hsen, Assistant Division Chief for Research and Methodology Programs, assisted by Stacey Cole,Chief, Manufacturing Methodology Branch, and Robert Struble, Section Chief. Jeffrey Dalzell andCathy Gregor provided primary staff assistance.
Eddie J. Salyers, Assistant Division Chief of Economic Planning and Coordination Division, wasresponsible for overseeing the editing and tabulation procedures and the interactive analytical software.Dennis Shoemaker and Kim Wortman, Special Assistants, John D. Ward, Chief, Analytical Branch,and Brandy L. Yarbrough, Chief, Edit Branch, were responsible for developing the systems andprocedures for data collection, editing, review, and correction. Donna L. Hambric, Chief of theEconomic Planning Staff, was responsible for overseeing the systems and information for dissemination.Douglas J. Miller, Chief, Tables and Dissemination Branch, assisted by Lisa Aispuro, Jamie Fleming,Keith Fuller, Andrew W. Hait, and Kathy G. Padgett were responsible for developing the datadissemination systems and procedures.
The Geography Division staff, Robert LaMacchia, Chief, developed geographic coding procedures andassociated computer programs.
The Economic Statistical Methods and Programming Division, Howard R. Hogan, Chief, developed andcoordinated the computer processing systems. Barry F. Sessamen, Assistant Division Chief for PostCollection, was responsible for design and implementation of the processing system and computerprograms. Gary T. Sheridan, Chief, Macro Analytical Branch, assisted by Apparao V. Katikineni andEdward F. Johnson provided computer programming and implementation.
The Systems Support Division provided the table composition system. Robert Joseph Brown, TableImage Processing System (TIPS) Senior Software Engineer, was responsible for the design anddevelopment of the TIPS, under the supervision of Robert J. Bateman, Assistant Division Chief,Information Systems.
The staff of the National Processing Center performed mailout preparation and receipt operations,clerical and analytical review activities, and data entry.
Margaret A. Smith, Bernadette J. Beasley, Michael T. Browne, and Alan R. Plisch of theAdministrative and Customer Services Division, Walter C. Odom, Chief, provided publication andprinting management, graphics design and composition, and editorial review for print and electronicmedia. General direction and production management were provided by James R. Clark, AssistantDivision Chief, and Susan L. Rappa, Chief, Publications Services Branch.
Special acknowledgment is also due the many businesses whose cooperation contributed to thepublication of these data.
ACKNOWLEDGMENTS
Other Apparel Accessories andOther Apparel Manufacturing:
2002
2002 Economic Census
Manufacturing
Industry Series
Issued December 2004
EC02-31I-315999 (RV)
U.S. Department of CommerceDonald L. Evans,
SecretaryTheodore W. Kassinger,
Deputy Secretary
Economics and Statistics AdministrationKathleen B. Cooper,
Under Secretary forEconomic Affairs
U.S. CENSUS BUREAUCharles Louis Kincannon,
Director
Vacant,Principal AssociateDirector for Programs
Frederick T. Knickerbocker,Associate Directorfor Economic Programs
Thomas L. Mesenbourg,Assistant Directorfor Economic Programs
William G. Bostic, Jr.,Chief, Manufacturingand Construction Division
ECONOMICS
AND STATISTICS
ADMINISTRATION
Economicsand StatisticsAdministration
Kathleen B. Cooper,Under Secretaryfor Economic Affairs
U.S. CENSUS BUREAU
Charles Louis Kincannon,Director
Hermann Habermann,Deputy Director andChief Operating Officer
CONTENTS
Introduction to the Economic Census v�����������������������������
Manufacturing ix�������������������������������������������������
Tables
1. Historical Statistics for the Industry: 2002 and Earlier Years 1���
2. Industry Statistics for Selected States: 2002 2�����������������
3. Detailed Statistics by Industry: 2002 3������������������������
4. Industry Statistics by Employment Size: 2002 4����������������
5. Industry Statistics by Primary Product Class Specialization:2002 5���������������������������������������������������
6a. Products Statistics: 2002 and 1997 6�������������������������
6b. Product Class Shipments for Selected States: 2002 and 1997 8�
7. Materials Consumed by Kind: 2002 and 1997 9����������������
Appendixes
A. Explanation of Terms A–1�������������������������������������
B. NAICS Codes, Titles, and Descriptions B–1����������������������
C. Methodology C–1���������������������������������������������
D. Geographic Notes ������������������������������������������
E. Metropolitan and Micropolitan Statistical Areas �����������������
F. Comparability of Product Classes and Product Codes: 2002 to1997 F–1���������������������������������������������������
�� Not applicable for this report.
Manufacturing�Industry Series Other Apparel Accessories & Other Apparel Mfg iiiU.S. Census Bureau, 2002 Economic Census
Introduction to the Economic Census
PURPOSES AND USES OF THE ECONOMIC CENSUS
The economic census is the major source of facts about the structure and functioning of thenation’s economy. It provides essential information for government, business, industry, and thegeneral public. Title 13 of the United States Code (Sections 131, 191, and 224) directs the CensusBureau to take the economic census every 5 years, covering years ending in “2” and “7.”
The economic census furnishes an important part of the framework for such composite measuresas the gross domestic product estimates, input/output measures, production and price indexes,and other statistical series that measure short-term changes in economic conditions. Specific usesof economic census data include the following:
• Policymaking agencies of the federal government use the data to monitor economic activity andto assess the effectiveness of policies.
• State and local governments use the data to assess business activities and tax bases withintheir jurisdictions and to develop programs to attract business.
• Trade associations study trends in their own and competing industries, which allows them tokeep their members informed of market changes.
• Individual businesses use the data to locate potential markets and to analyze their own produc-tion and sales performance relative to industry or area averages.
INDUSTRY CLASSIFICATIONS
Data from the 2002 Economic Census are published primarily according to the 2002 North Ameri-can Industry Classification System (NAICS). NAICS was first adopted in the United States, Canada,and Mexico in 1997. The 2002 Economic Census covers the following NAICS sectors:
21 Mining22 Utilities23 Construction31-33 Manufacturing42 Wholesale Trade44-45 Retail Trade48-49 Transportation and Warehousing51 Information52 Finance and Insurance53 Real Estate and Rental and Leasing54 Professional, Scientific, and Technical Services55 Management of Companies and Enterprises56 Administrative and Support and Waste Management and Remediation Services61 Educational Services62 Health Care and Social Assistance71 Arts, Entertainment, and Recreation72 Accommodation and Food Services81 Other Services (except Public Administration)
(Not listed above are the Agriculture, Forestry, Fishing, and Hunting sector (NAICS 11), partiallycovered by the census of agriculture conducted by the U.S. Department of Agriculture, and thePublic Administration sector (NAICS 92), largely covered by the census of governments conductedby the Census Bureau.)
The 20 NAICS sectors are subdivided into 100 subsectors (three-digit codes), 317 industry groups(four-digit codes), and, as implemented in the United States, 1,179 industries (six-digit codes).
Introduction v2002 Economic Census
U.S. Census Bureau, 2002 Economic Census
RELATIONSHIP TO HISTORICAL INDUSTRY CLASSIFICATIONS
Prior to the 1997 Economic Census, data were published according to the Standard Industrial Clas-sification (SIC) system. While many of the individual NAICS industries correspond directly to indus-tries as defined under the SIC system, most of the higher level groupings do not. Particular careshould be taken in comparing data for retail trade, wholesale trade, and manufacturing, which aresector titles used in both NAICS and SIC, but cover somewhat different groups of industries. The1997 Economic Census Bridge Between NAICS and SIC demonstrates the relationships betweenNAICS and SIC industries. Where changes are significant, it may not be possible to construct timeseries that include data for points both before and after 1997.
Most industry classifications remained unchanged between 1997 and 2002, but NAICS 2002includes substantial revisions within the construction and wholesale trade sectors, and a numberof revisions for the retail trade and information sectors. These changes are noted in industry defi-nitions and will be demonstrated in the Bridge Between NAICS 2002 and NAICS 1997.
For 2002, data for enterprise support establishments (those functioning primarily to support theactivities of their company’s operating establishments, such as a warehouse or a research anddevelopment laboratory) are included in the industry that reflects their activities (such as ware-housing). For 1997, such establishments were termed auxiliaries and were excluded from industrytotals.
BASIS OF REPORTING
The economic census is conducted on an establishment basis. A company operating at more thanone location is required to file a separate report for each store, factory, shop, or other location.Each establishment is assigned a separate industry classification based on its primary activity andnot that of its parent company. (For selected industries, only payroll, employment, and classifica-tion are collected for individual establishments, while other data are collected on a consolidatedbasis.)
GEOGRAPHIC AREA CODING
Accurate and complete information on the physical location of each establishment is required totabulate the census data for states, metropolitan and micropolitan statistical areas, counties, andcorporate municipalities (places) including cities, towns, townships, villages, and boroughs.Respondents were required to report their physical location (street address, municipality, county,and state) if it differed from their mailing address. For establishments not surveyed by mail (andthose single-establishment companies that did not provide acceptable information on physicallocation), location information from administrative sources is used as a basis for coding.
AVAILABILITY OF ADDITIONAL DATA
All results of the 2002 Economic Census are available on the Census Bureau Internet site(www.census.gov) and on digital versatile discs (DVD-ROMs) for sale by the Census Bureau. TheAmerican FactFinder system at the Internet site allows selective retrieval and downloading of thedata. For more information, including a description of reports being issued, see the Internet site,write to the U.S. Census Bureau, Washington, DC 20233-6100, or call Customer Services at 301-763-4100.
HISTORICAL INFORMATION
The economic census has been taken as an integrated program at 5-year intervals since 1967 andbefore that for 1954, 1958, and 1963. Prior to that time, individual components of the economiccensus were taken separately at varying intervals.
The economic census traces its beginnings to the 1810 Decennial Census, when questions onmanufacturing were included with those for population. Coverage of economic activities wasexpanded for the 1840 Decennial Census and subsequent censuses to include mining and somecommercial activities. The 1905 Manufactures Census was the first time a census was taken apart
vi Introduction 2002 Economic Census
U.S. Census Bureau, 2002 Economic Census
from the regular decennial population census. Censuses covering retail and wholesale trade andconstruction industries were added in 1930, as were some service trades in 1933. Censuses ofconstruction, manufacturing, and the other business censuses were suspended during World WarII.
The 1954 Economic Census was the first census to be fully integrated, providing comparable cen-sus data across economic sectors and using consistent time periods, concepts, definitions, classi-fications, and reporting units. It was the first census to be taken by mail, using lists of firms pro-vided by the administrative records of other federal agencies. Since 1963, administrative recordsalso have been used to provide basic statistics for very small firms, reducing or eliminating theneed to send them census report forms.
The range of industries covered in the economic census expanded between 1967 and 2002. Thecensus of construction industries began on a regular basis in 1967, and the scope of serviceindustries, introduced in 1933, was broadened in 1967, 1977, and 1987. While a few transporta-tion industries were covered as early as 1963, it was not until 1992 that the census broadened toinclude all of transportation, communications, and utilities. Also new for 1992 was coverage offinancial, insurance, and real estate industries. With these additions, the economic census and theseparate census of governments and census of agriculture collectively covered roughly 98 percentof all economic activity. New for 2002 is coverage of four industries classified in the agriculture,forestry, and fishing sector under the SIC system: landscape architectural services, landscapingservices, veterinary services, and pet care services.
Printed statistical reports from the 1992 and earlier censuses provide historical figures for thestudy of long-term time series and are available in some large libraries. Reports for 1997 werepublished primarily on the Internet and copies of 1992 reports are also available there. CD-ROMsissued from the 1987, 1992, and 1997 Economic Censuses contain databases that include all ornearly all data published in print, plus additional statistics, such as ZIP Code statistics, publishedonly on CD-ROM.
SOURCES FOR MORE INFORMATION
More information about the scope, coverage, classification system, data items, and publicationsfor the 2002 Economic Census and related surveys is published in the Guide to the 2002 EconomicCensus at www.census.gov/econ/census02/guide. More information on the methodology, proce-dures, and history of the census will be published in the History of the 2002 Economic Census atwww.census.gov/econ/www/history.html.
Introduction vii2002 Economic Census
U.S. Census Bureau, 2002 Economic Census

This page is intentionally blank.
viii Introduction 2002 Economic Census
U.S. Census Bureau, 2002 Economic Census
Manufacturing
SCOPE
The Manufacturing sector (sector 31-33) comprises establishments engaged in the mechanical,physical, or chemical transformation of materials, substances, or components into new products.The assembling of component parts of manufactured products is considered manufacturing,except in cases where the activity is appropriately classified in Sector 23, Construction.
Establishments in the manufacturing sector are often described as plants, factories, or mills andcharacteristically use power-driven machines and materials-handling equipment. However, estab-lishments that transform materials or substances into new products by hand or in the worker’shome and those engaged in selling to the general public products made on the same premisesfrom which they are sold, such as bakeries, candy stores, and custom tailors, may also beincluded in this sector. Manufacturing establishments may process materials or may contract withother establishments to process their materials for them. Both types of establishments areincluded in manufacturing.
The materials, substances, or components transformed by manufacturing establishments are rawmaterials that are products of agriculture, forestry, fishing, mining, or quarrying, as well as prod-ucts of other manufacturing establishments. The materials used may be purchased directly fromproducers, obtained through customary trade channels, or secured without recourse to the marketby transferring the product from one establishment to another, under the same ownership. Thenew product of a manufacturing establishment may be finished in the sense that it is ready forutilization or consumption, or it may be semifinished to become an input for an establishmentengaged in further manufacturing. For example, the product of the alumina refinery is the inputused in the primary production of aluminum; primary aluminum is the input to an aluminum wiredrawing plant; and aluminum wire is the input for a fabricated wire product manufacturing estab-lishment.
The subsectors in the manufacturing sector generally reflect distinct production processes relatedto material inputs, production equipment, and employee skills. In the machinery area, whereassembling is a key activity, parts and accessories for manufactured products are classified in theindustry of the finished manufactured item when they are made for separate sale. For example, areplacement refrigerator door would be classified with refrigerators and an attachment for a pieceof metal working machinery would be classified with metal working machinery. However, compo-nents, input from other manufacturing establishments, are classified based on the productionfunction of the component manufacturer. For example, electronic components are classified inSubsector 334, Computer and Electronic Product Manufacturing; and stampings are classified inSubsector 332, Fabricated Metal Product Manufacturing.
Manufacturing establishments often perform one or more activities that are classified outside themanufacturing sector of NAICS. For instance, almost all manufacturing has some captive researchand development or administrative operations, such as accounting, payroll, or management.These captive services are treated the same as captive manufacturing activities. When the servicesare provided by separate establishments, they are classified to the NAICS sector where such ser-vices are primary, not in manufacturing.
The boundaries of manufacturing and the other sectors of the classification system can be some-what blurry. The establishments in the manufacturing sector are engaged in the transformation ofmaterials into new products. Their output is a new product. However, the definition of what con-stitutes a new product can be somewhat subjective. As clarification, the following activities are
Manufacturing ix2002 Economic Census
U.S. Census Bureau, 2002 Economic Census
considered manufacturing in NAICS: milk bottling and pasteurizing; water bottling and process-ing; fresh fish packaging (oyster shucking, fish filleting); apparel jobbing (assigning of materialsto contract factories or shops for fabrication or other contract operations); as well as contractingon materials owned by others; printing and related activities; ready-mixed concrete production;leather converting; grinding of lenses to prescription; wood preserving; electroplating, plating,metal heat treating, and polishing for the trade; lapidary work for the trade; fabricating signs andadvertising displays; rebuilding or remanufacturing machinery (i.e., automotive parts); ship repairand renovation; machine shops; and tire retreading.
Exclusions. There are activities that are sometimes considered manufacturing, but for NAICS areclassified in another sector. These activities include logging, classified in Sector 11, Agriculture,Forestry, Fishing and Hunting is considered a harvesting operation; the beneficiating of ores andother minerals, classified in Sector 21, Mining, is considered part of the activity of mining; theconstruction of structures and fabricating operations performed at the site of construction by con-tractors, is classified in Sector 23, Construction; establishments engaged in breaking of bulk andredistribution in smaller lots, including packaging, repackaging, or bottling products, such asliquors or chemicals; the customized assembly of computers; sorting of scrap; mixing paints tocustomer order; and cutting metals to customer order, classified in Sector 42, Wholesale Trade orSector 44-45, Retail Trade, produce a modified version of the same product, not a new product;and publishing and the combined activity of publishing and printing, classified in Sector 51, Infor-mation, perform the transformation of information into a product where as the value of the prod-uct to the consumer lies in the information content, not in the format in which it is distributed(i.e., the book or software diskette).
The tabulations for this sector do not include central administrative offices, warehouses, or otherestablishments that serve manufacturing establishments within the same organization. Data forsuch establishments are classified according to the nature of the service they provide. Forexample, separate headquarters establishments are reported in NAICS Sector 55, Management ofCompanies and Enterprises.
The reports described below exclude establishments of firms with no paid employees. These“nonemployers,” typically self-employed individuals or partnerships operating businesses thatthey have not chosen to incorporate, are reported separately in Nonemployer Statistics. The con-tribution of nonemployers, relatively small for this sector, may be examined atwww.census.gov/nonemployerimpact.
The reports described below cover all manufacturing establishments with one or more paidemployees.
Definitions. Industry categories are defined in Appendix B, NAICS Codes, Titles, and Descrip-tions. Other terms are defined in Appendix A, Explanation of Terms.
REPORTS
The following reports provide statistics on this sector:
Industry Series. There are 473 reports, each covering a single NAICS industry (six-digit code).These reports include such statistics as number of establishments, employment, payroll, valueadded by manufacture, cost of materials consumed, value of shipments, capital expenditures, etc.The industry reports also include data for states with 100 employees or more in the industry. Thedata in industry reports are preliminary and subject to change in the following reports.
Geographic Area Series. There are 51 separate reports, one for each state and the District ofColumbia. Each state report presents similar statistics at the “all manufacturing” level for eachstate and its metropolitan and micropolitan areas with 250 employees or more, and for counties,consolidated cities, and places with 500 employees or more. The state reports also include six-digit NAICS level data for industries with 100 employees or more in the state.
Subject Series:
x Manufacturing 2002 Economic Census
U.S. Census Bureau, 2002 Economic Census
• Industry-Product Analysis Summary. This report presents value of shipments, value ofproduct shipments, percentage of product shipments of the total value of shipments, and per-centage of distribution of value of product shipments on the NAICS six-digit industry level andby the six- and seven-digit product code levels. It also includes miscellaneous receipts at thesix- and seven-digit product code levels by NAICS six-digit industry levels.
• General Summary. This report contains industry and geographic area statistics summarized inone report. It includes higher levels of aggregation than the industry and state reports, as wellas revisions to the data made after the release of the industry and state reports.
• Product Summary. This report summarizes the products data published in the industryreports. This report also includes a table with data for products that are primary to more thanone industry, which are not in the industry reports.
• Materials Summary. This report summarizes the materials data published in the industryreports.
• Concentration Ratio Summary. This report publishes data on the percentage of value of ship-ments and value added accounted for by the 4-, 8-, 20-, and 50-largest companies for eachmanufacturing industry. Also shown in this report are Herfindahl-Herschmann indexes for eachindustry.
• Location of Manufacturing Plants Summary. This report contains statistics on the numberof establishments for the three-and six-digit NAICS industry by state, county, place, and ZIPCode by employment-size of the establishment.
ZIP Code Statistics. This report contain statistics on the number of establishments for the three-and six-digit NAICS industry by employment-size of the establishment by ZIP Code.
Other reports. Data for this sector are also included in reports with multisector coverage, includ-ing Nonemployer Statistics, Comparative Statistics, Bridge Between 2002 NAICS and 1997 NAICS,Business Expenses, and the Survey of Business Owners reports.
GEOGRAPHIC AREAS COVERED
The level of geographic detail varies by report. Maps are available atwww.census.gov/econ2002maps. Notes specific to areas in the state are included in Appendix D,Geographic Notes.
1. The United States as a whole.
2. States and the District of Columbia.
3. Metropolitan and micropolitan statistical areas with 250 employees or more. A core based sta-tistical areas (CBSA) contains a core area with a substantial population nucleus, together withadjacent communities having a high degree of social and economic integration with that core.CBSAs are differentiated into metropolitan and micropolitan statistical areas based on size cri-teria. Both metropolitan and micropolitan areas are defined in terms of entire counties, andare listed in Appendix E, Metropolitan and Micropolitan Statistical Areas.
a. Metropolitan Statistical Areas (metro areas). Metro areas have at least one urbanized area of50,000 or more population, plus adjacent territory that has a high degree of social and eco-nomic integration with the core as measured by commuting ties.
b. Micropolitan Statistical Areas (micro areas). Micro areas have at least one urban cluster ofat least 10,000 but less than 50,000 population, plus adjacent territory that has a highdegree of social and economic integration with the core as measured by commuting ties.
c. Metropolitan Divisions (metro divisions). If specified criteria are met, a metro area contain-ing a single core with a population of 2.5 million or more may be subdivided to formsmaller groupings of counties referred to as Metropolitan Divisions.
Manufacturing xi2002 Economic Census
U.S. Census Bureau, 2002 Economic Census
d. Combined Statistical Areas (combined areas). If specified criteria are met, adjacent metroand micro areas, in various combinations, may become the components of a new set ofareas called Combined Statistical Areas. The areas that combine retain their own designa-tions as metro or micro areas within the larger combined area.
4. Counties and county equivalents defined as of January 1, 2002, with 500 employees or more.Counties are the primary divisions of states, except in Louisiana where they are called par-ishes and in Alaska where they are called boroughs, census areas, and city and boroughs.Maryland, Missouri, Nevada, and Virginia have one place or more that is independent of anycounty organization and constitutes primary divisions of their states. These places are treatedas counties and as places.
5. Economic places with 500 employees or more.
a. Municipalities of 2,500 inhabitants or more defined as of January 1, 2002. These are areasof significant population incorporated as cities, boroughs, villages, or towns according tothe 2000 Census of Population. For the economic census, boroughs and census areas inAlaska and boroughs in New York are not included in this category.
b. Consolidated cities defined as of January 1, 2002. Consolidated cities are consolidatedgovernments that consist of separately incorporated municipalities.
c. Townships in Michigan, New Jersey, and Pennsylvania, and towns in New York, Wisconsin,and the six New England states with 10,000 inhabitants or more (according to the 2000Census of Population).
d. Balance of county. Areas outside the entities listed above, including incorporated munici-palities with populations of fewer than 2,500, town and townships not qualifying as notedabove, and the remainders of counties outside places are categorized as “Balance ofcounty.”
DOLLAR VALUES
All dollar values presented are expressed in current dollars; i.e., 2002 data are expressed in 2002dollars, and 1997 data, in 1997 dollars. Consequently, when making comparisons with prioryears, users of the data should consider the changes in prices that have occurred.
All dollar values are shown in thousands of dollars.
COMPARABILITY OF THE 1997 AND 2002 ECONOMIC CENSUSES
Both the 2002 Economic Census and the 1997 Economic Census present data based on the NorthAmerican Industry Classification System (NAICS). While there were revisions to selected industriesfor 2002, this sector is not affected by those revisions.
For 2002, there have been several additional data tables added, which did not exist in 1997.These tables for 2002 include products primary to more than one industry, industry-productanalysis, e-commerce value of shipments, and leased and nonleased detail employment statisticsby subsectors.
RELIABILITY OF DATA
All data compiled for this sector are subject to nonsampling errors. Nonsampling errors can beattributed to many sources: inability to identify all cases in the actual universe; definition andclassification difficulties; differences in the interpretation of questions; errors in recording or cod-ing the data obtained; and other errors of collection, response, coverage, processing, and estima-tion for missing or misreported data. Selected data in tables titled “Detailed Statistics” are basedon the Annual Survey of Manufactures and are subject to sampling errors as well as nonsamplingerrors.
xii Manufacturing 2002 Economic Census
U.S. Census Bureau, 2002 Economic Census
No direct measurement of these effects has been obtained except for estimation for missing ormisreported data, as by the percentages shown in the tables. Precautionary steps were taken in allphases of the collection, processing, and tabulation of the data in an effort to minimize the effectsof nonsampling errors. More information on the reliability of the data is included in Appendix C,Methodology.
DISCLOSURE
In accordance with federal law governing census reports (Title 13 of the United States Code), nodata are published that would disclose the operations of an individual establishment or company.However, the number of establishments in a specific industry or geographic area is not considereda disclosure; therefore, this information may be released even though other information is with-held. Techniques employed to limit disclosure are discussed atwww.census.gov/epcd/ec02/disclosure.htm.
The disclosure analysis for “industry statistics” files is based on the total value of shipments.When the total value of shipments cannot be shown without disclosing information for individualcompanies, the complete line is suppressed except for capital expenditures. Nonetheless, the sup-pressed data are included in higher-level totals. A separate disclosure analysis is performed forcapital expenditures, which can be suppressed even though value of shipments data are pub-lished.
AVAILABILITY OF MORE FREQUENT ECONOMIC DATA
The Census Bureau conducts the Annual Survey of Manufactures (ASM) in each of the 4 yearsbetween the economic censuses. The ASM is a probability-based sample of approximately 55,000establishments and collects many of the same industry statistics (including employment, payroll,value of shipments, etc.) as the economic census. However, there are selected statistics notincluded in the ASM. Among these are the number of companies and establishments, detailedproduct and materials data, and substate geographic data. In addition to the ASM, the CensusBureau conducts the Current Industrial Reports (CIR) program. The CIR program publishes selecteddetailed product statistics for selected manufacturing industries at the U.S. level annually and, insome cases, monthly and/or quarterly. The Census Bureau also conducts the monthly Manufactur-ers’ Shipments, Inventories, and Orders (M3) Program, which publishes detailed statistics formanufacturing industries at the U.S. level.
In addition, the County Business Patterns program offers annual statistics on the number of estab-lishments, employment, and payroll classified by industry within each county, and Statistics ofU.S. Businesses provides annual statistics classified by the employment size of the enterprise, fur-ther classified by industry for the United States, and by broader categories for states and metro-politan areas.
CONTACTS FOR DATA USERS
Questions about these data may be directed to the U.S. Census Bureau, Manufacturing & Construc-tion Division, Information Services Center, 301-763-4673 or ask.census.gov.
ABBREVIATIONS AND SYMBOLS
The following abbreviations and symbols are used with these data:
A Standard error of 100 percent or moreD Withheld to avoid disclosing data of individual companies; data are included in higher level totalsF Exceeds 100 percent because data include establishments with payroll exceeding revenueN Not available or not comparableS Withheld because estimates did not meet publication standardsX Not applicableZ Less than half the unit shown
a 0 to 19 employeesb 20 to 99 employeesc 100 to 249 employees
Manufacturing xiii2002 Economic Census
U.S. Census Bureau, 2002 Economic Census
e 250 to 499 employeesf 500 to 999 employeesg 1,000 to 2,499 employeesh 2,500 to 4,999 employeesi 5,000 to 9,999 employeesj 10,000 to 24,999 employeesk 25,000 to 49,999 employeesl 50,000 to 99,999 employeesm 100,000 employees or more
p 10 to 19 percent estimatedq 20 to 29 percent estimatedr Reviseds Sampling error exceeds 40 percentnsk Not specified by kind– Represents zero (page image/print only)(CC) Consolidated city(IC) Independent city
xiv Manufacturing 2002 Economic Census
U.S. Census Bureau, 2002 Economic Census
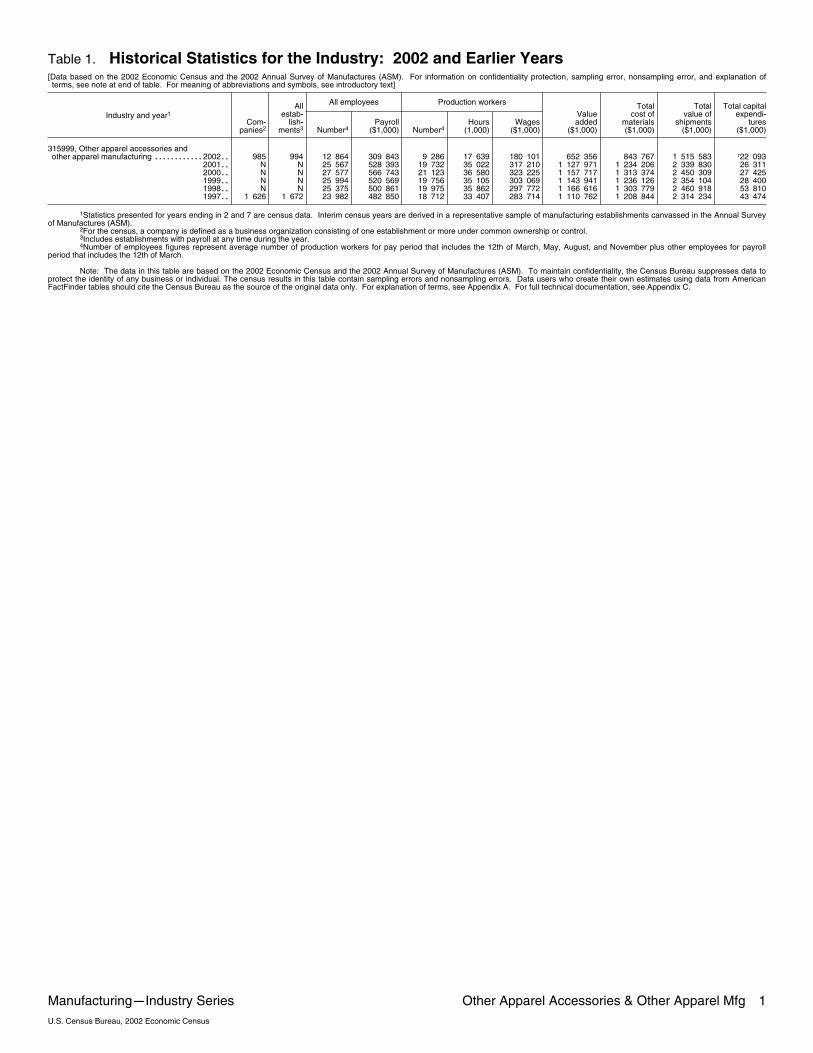
Table 1. Historical Statistics for the Industry: 2002 and Earlier Years[Data based on the 2002 Economic Census and the 2002 Annual Survey of Manufactures (ASM). For information on confidentiality protection, sampling error, nonsampling error, and explanation ofterms, see note at end of table. For meaning of abbreviations and symbols, see introductory text]
Industry and year1
All employees Production workers
Com�
panies2
Allestab�
lish�ments3 Number4
Payroll($1,000) Number4
Hours(1,000)
Wages($1,000)
Valueadded
($1,000)
Totalcost of
materials($1,000)
Totalvalue of
shipments($1,000)
Total capitalexpendi�
tures($1,000)
315999, Other apparel accessories andother apparel manufacturing 2002�������������� 985 994 12 864 309 843 9 286 17 639 180 101 652 356 843 767 1 515 583 r22 093
2001�� N N 25 567 528 393 19 732 35 022 317 210 1 127 971 1 234 206 2 339 830 26 3112000�� N N 27 577 566 743 21 123 36 580 323 225 1 157 717 1 313 374 2 450 309 27 4251999�� N N 25 994 520 569 19 756 35 105 303 069 1 143 941 1 236 126 2 354 104 28 4001998�� N N 25 375 500 861 19 975 35 862 297 772 1 166 616 1 303 779 2 460 918 53 8101997�� 1 626 1 672 23 982 482 850 18 712 33 407 283 714 1 110 762 1 208 844 2 314 234 43 474
1Statistics presented for years ending in 2 and 7 are census data. Interim census years are derived in a representative sample of manufacturing establishments canvassed in the Annual Surveyof Manufactures (ASM).
2For the census, a company is defined as a business organization consisting of one establishment or more under common ownership or control.3Includes establishments with payroll at any time during the year.4Number of employees figures represent average number of production workers for pay period that includes the 12th of March, May, August, and November plus other employees for payroll
period that includes the 12th of March.
Note: The data in this table are based on the 2002 Economic Census and the 2002 Annual Survey of Manufactures (ASM). To maintain confidentiality, the Census Bureau suppresses data toprotect the identity of any business or individual. The census results in this table contain sampling errors and nonsampling errors. Data users who create their own estimates using data from AmericanFactFinder tables should cite the Census Bureau as the source of the original data only. For explanation of terms, see Appendix A. For full technical documentation, see Appendix C.
Manufacturing�Industry Series Other Apparel Accessories & Other Apparel Mfg 1U.S. Census Bureau, 2002 Economic Census
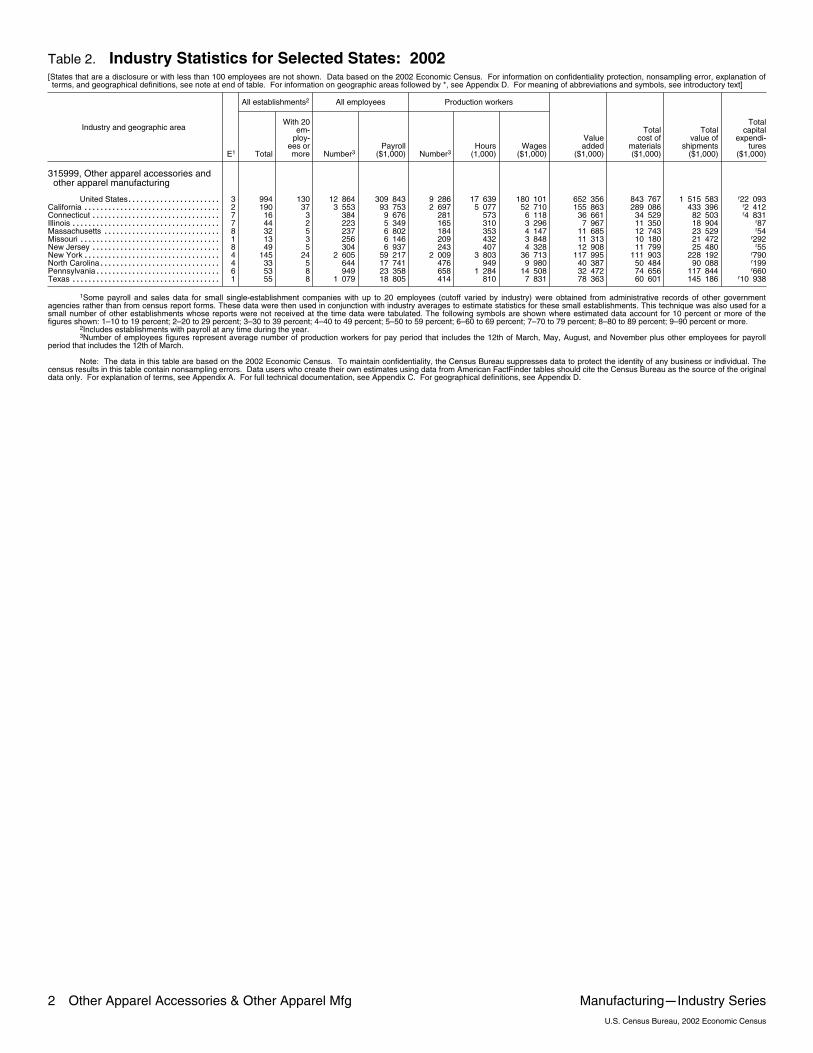
Table 2. Industry Statistics for Selected States: 2002[States that are a disclosure or with less than 100 employees are not shown. Data based on the 2002 Economic Census. For information on confidentiality protection, nonsampling error, explanation ofterms, and geographical definitions, see note at end of table. For information on geographic areas followed by *, see Appendix D. For meaning of abbreviations and symbols, see introductory text]
Industry and geographic area
All establishments2 All employees Production workers
E1 Total
With 20em�
ploy�ees ormore Number3
Payroll($1,000) Number3
Hours(1,000)
Wages($1,000)
Valueadded
($1,000)
Totalcost of
materials($1,000)
Totalvalue of
shipments($1,000)
Totalcapital
expendi�tures
($1,000)
315999, Other apparel accessories andother apparel manufacturing
United States 3����������������������� 994 130 12 864 309 843 9 286 17 639 180 101 652 356 843 767 1 515 583 r22 093California 2���������������������������������� 190 37 3 553 93 753 2 697 5 077 52 710 155 863 289 086 433 396 r2 412Connecticut 7�������������������������������� 16 3 384 9 676 281 573 6 118 36 661 34 529 82 503 r4 831Illinois 7������������������������������������� 44 2 223 5 349 165 310 3 296 7 967 11 350 18 904 r87Massachusetts 8����������������������������� 32 5 237 6 802 184 353 4 147 11 685 12 743 23 529 r54Missouri 1����������������������������������� 13 3 256 6 146 209 432 3 848 11 313 10 180 21 472 r292New Jersey 8�������������������������������� 49 5 304 6 937 243 407 4 328 12 908 11 799 25 480 r55New York 4���������������������������������� 145 24 2 605 59 217 2 009 3 803 36 713 117 995 111 903 228 192 r790North Carolina 4������������������������������ 33 5 644 17 741 476 949 9 980 40 387 50 484 90 088 r199Pennsylvania 6������������������������������� 53 8 949 23 358 658 1 284 14 508 32 472 74 656 117 844 r660Texas 1������������������������������������� 55 8 1 079 18 805 414 810 7 831 78 363 60 601 145 186 r10 938
1Some payroll and sales data for small single�establishment companies with up to 20 employees (cutoff varied by industry) were obtained from administrative records of other governmentagencies rather than from census report forms. These data were then used in conjunction with industry averages to estimate statistics for these small establishments. This technique was also used for asmall number of other establishments whose reports were not received at the time data were tabulated. The following symbols are shown where estimated data account for 10 percent or more of thefigures shown: 1–10 to 19 percent; 2–20 to 29 percent; 3–30 to 39 percent; 4–40 to 49 percent; 5–50 to 59 percent; 6–60 to 69 percent; 7–70 to 79 percent; 8–80 to 89 percent; 9–90 percent or more.
2Includes establishments with payroll at any time during the year.3Number of employees figures represent average number of production workers for pay period that includes the 12th of March, May, August, and November plus other employees for payroll
period that includes the 12th of March.
Note: The data in this table are based on the 2002 Economic Census. To maintain confidentiality, the Census Bureau suppresses data to protect the identity of any business or individual. Thecensus results in this table contain nonsampling errors. Data users who create their own estimates using data from American FactFinder tables should cite the Census Bureau as the source of the originaldata only. For explanation of terms, see Appendix A. For full technical documentation, see Appendix C. For geographical definitions, see Appendix D.
2 Other Apparel Accessories & Other Apparel Mfg Manufacturing�Industry SeriesU.S. Census Bureau, 2002 Economic Census
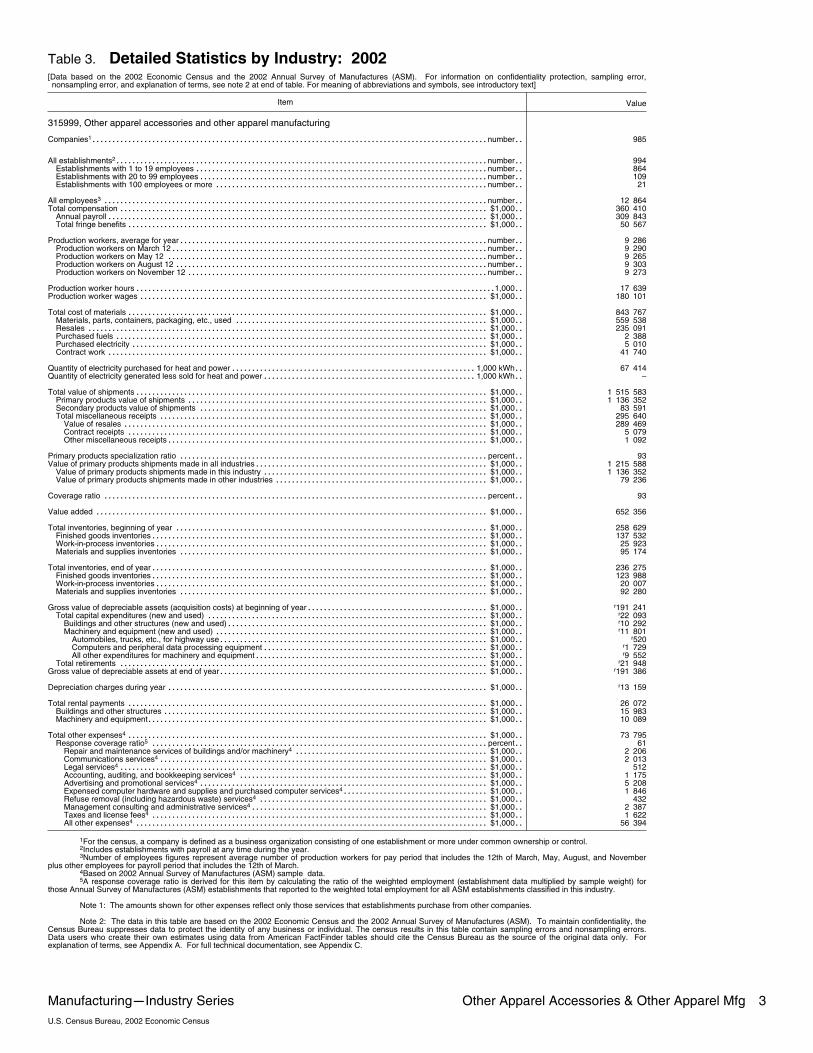
Table 3. Detailed Statistics by Industry: 2002[Data based on the 2002 Economic Census and the 2002 Annual Survey of Manufactures (ASM). For information on confidentiality protection, sampling error,nonsampling error, and explanation of terms, see note 2 at end of table. For meaning of abbreviations and symbols, see introductory text]
Item Value
315999, Other apparel accessories and other apparel manufacturing
Companies1 number����������������������������������������������������������������������������������������������������� 985
All establishments2 number����������������������������������������������������������������������������������������������� 994Establishments with 1 to 19 employees number��������������������������������������������������������������������������� 864Establishments with 20 to 99 employees number�������������������������������������������������������������������������� 109Establishments with 100 employees or more number���������������������������������������������������������������������� 21
All employees3 number�������������������������������������������������������������������������������������������������� 12 864Total compensation $1,000���������������������������������������������������������������������������������������������� 360 410
Annual payroll $1,000������������������������������������������������������������������������������������������������� 309 843Total fringe benefits $1,000�������������������������������������������������������������������������������������������� 50 567
Production workers, average for year number������������������������������������������������������������������������������� 9 286Production workers on March 12 number��������������������������������������������������������������������������������� 9 290Production workers on May 12 number���������������������������������������������������������������������������������� 9 265Production workers on August 12 number�������������������������������������������������������������������������������� 9 303Production workers on November 12 number����������������������������������������������������������������������������� 9 273
Production worker hours 1,000�������������������������������������������������������������������������������������������� 17 639Production worker wages $1,000����������������������������������������������������������������������������������������� 180 101
Total cost of materials $1,000�������������������������������������������������������������������������������������������� 843 767Materials, parts, containers, packaging, etc., used $1,000����������������������������������������������������������������� 559 538Resales $1,000������������������������������������������������������������������������������������������������������ 235 091Purchased fuels $1,000����������������������������������������������������������������������������������������������� 2 388Purchased electricity $1,000������������������������������������������������������������������������������������������� 5 010Contract work $1,000������������������������������������������������������������������������������������������������� 41 740
Quantity of electricity purchased for heat and power 1,000 kWh��������������������������������������������������������������� 67 414Quantity of electricity generated less sold for heat and power 1,000 kWh������������������������������������������������������� –
Total value of shipments $1,000������������������������������������������������������������������������������������������ 1 515 583Primary products value of shipments $1,000����������������������������������������������������������������������������� 1 136 352Secondary products value of shipments $1,000�������������������������������������������������������������������������� 83 591Total miscellaneous receipts $1,000������������������������������������������������������������������������������������ 295 640
Value of resales $1,000��������������������������������������������������������������������������������������������� 289 469Contract receipts $1,000�������������������������������������������������������������������������������������������� 5 079Other miscellaneous receipts $1,000���������������������������������������������������������������������������������� 1 092
Primary products specialization ratio percent������������������������������������������������������������������������������� 93Value of primary products shipments made in all industries $1,000������������������������������������������������������������ 1 215 588
Value of primary products shipments made in this industry $1,000���������������������������������������������������������� 1 136 352Value of primary products shipments made in other industries $1,000������������������������������������������������������� 79 236
Coverage ratio percent�������������������������������������������������������������������������������������������������� 93
Value added $1,000���������������������������������������������������������������������������������������������������� 652 356
Total inventories, beginning of year $1,000�������������������������������������������������������������������������������� 258 629Finished goods inventories $1,000�������������������������������������������������������������������������������������� 137 532Work�in�process inventories $1,000������������������������������������������������������������������������������������� 25 923Materials and supplies inventories $1,000������������������������������������������������������������������������������� 95 174
Total inventories, end of year $1,000�������������������������������������������������������������������������������������� 236 275Finished goods inventories $1,000�������������������������������������������������������������������������������������� 123 988Work�in�process inventories $1,000������������������������������������������������������������������������������������� 20 007Materials and supplies inventories $1,000������������������������������������������������������������������������������� 92 280
Gross value of depreciable assets (acquisition costs) at beginning of year $1,000�����������������������������������������������r191 241
Total capital expenditures (new and used) $1,000������������������������������������������������������������������������r22 093
Buildings and other structures (new and used) $1,000�������������������������������������������������������������������r10 292
Machinery and equipment (new and used) $1,000����������������������������������������������������������������������r11 801
Automobiles, trucks, etc., for highway use $1,000���������������������������������������������������������������������r520
Computers and peripheral data processing equipment $1,000����������������������������������������������������������r1 729
All other expenditures for machinery and equipment $1,000������������������������������������������������������������r9 552
Total retirements $1,000����������������������������������������������������������������������������������������������r21 948
Gross value of depreciable assets at end of year $1,000���������������������������������������������������������������������r191 386
Depreciation charges during year $1,000����������������������������������������������������������������������������������r13 159
Total rental payments $1,000�������������������������������������������������������������������������������������������� 26 072Buildings and other structures $1,000����������������������������������������������������������������������������������� 15 983Machinery and equipment $1,000��������������������������������������������������������������������������������������� 10 089
Total other expenses4 $1,000�������������������������������������������������������������������������������������������� 73 795Response coverage ratio5 percent�������������������������������������������������������������������������������������� 61
Repair and maintenance services of buildings and/or machinery4 $1,000�������������������������������������������������� 2 206Communications services4 $1,000������������������������������������������������������������������������������������ 2 013Legal services4 $1,000���������������������������������������������������������������������������������������������� 512Accounting, auditing, and bookkeeping services4 $1,000���������������������������������������������������������������� 1 175Advertising and promotional services4 $1,000�������������������������������������������������������������������������� 5 208Expensed computer hardware and supplies and purchased computer services4 $1,000�������������������������������������� 1 846Refuse removal (including hazardous waste) services4 $1,000����������������������������������������������������������� 432Management consulting and administrative services4 $1,000������������������������������������������������������������� 2 387Taxes and license fees4 $1,000�������������������������������������������������������������������������������������� 1 622All other expenses4 $1,000������������������������������������������������������������������������������������������ 56 394
1For the census, a company is defined as a business organization consisting of one establishment or more under common ownership or control.2Includes establishments with payroll at any time during the year.3Number of employees figures represent average number of production workers for pay period that includes the 12th of March, May, August, and November
plus other employees for payroll period that includes the 12th of March.4Based on 2002 Annual Survey of Manufactures (ASM) sample data.5A response coverage ratio is derived for this item by calculating the ratio of the weighted employment (establishment data multiplied by sample weight) for
those Annual Survey of Manufactures (ASM) establishments that reported to the weighted total employment for all ASM establishments classified in this industry.
Note 1: The amounts shown for other expenses reflect only those services that establishments purchase from other companies.
Note 2: The data in this table are based on the 2002 Economic Census and the 2002 Annual Survey of Manufactures (ASM). To maintain confidentiality, theCensus Bureau suppresses data to protect the identity of any business or individual. The census results in this table contain sampling errors and nonsampling errors.Data users who create their own estimates using data from American FactFinder tables should cite the Census Bureau as the source of the original data only. Forexplanation of terms, see Appendix A. For full technical documentation, see Appendix C.
Manufacturing�Industry Series Other Apparel Accessories & Other Apparel Mfg 3U.S. Census Bureau, 2002 Economic Census
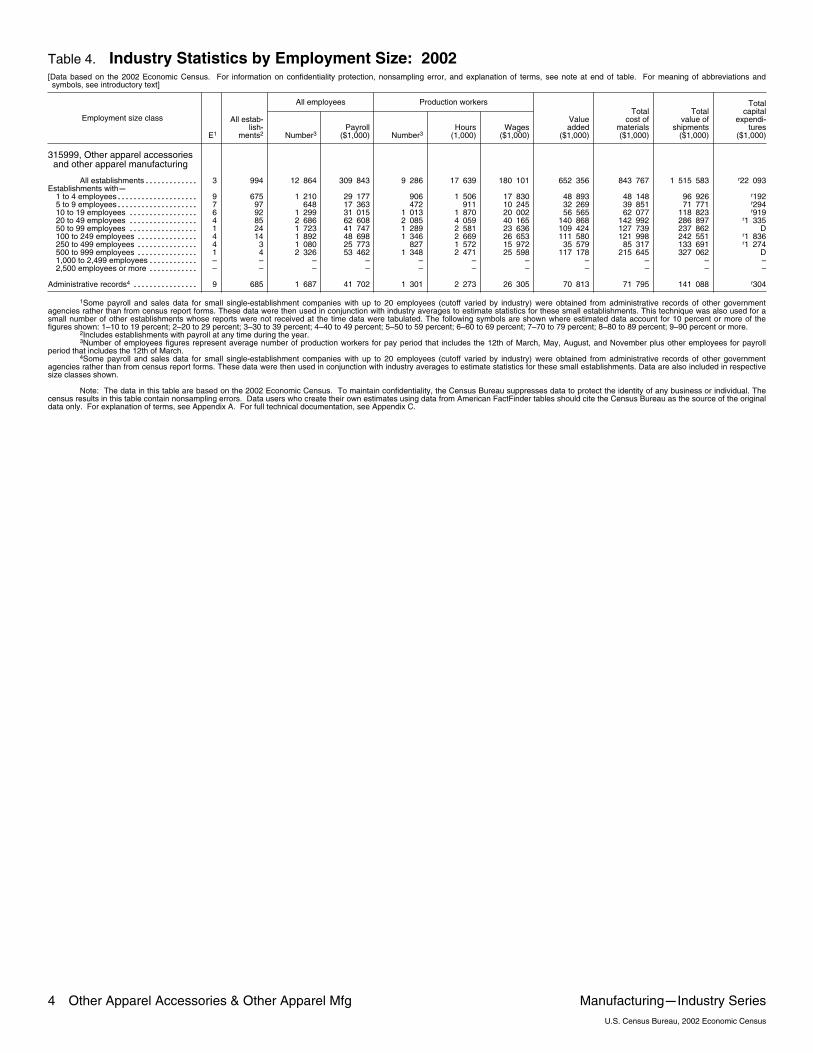
Table 4. Industry Statistics by Employment Size: 2002[Data based on the 2002 Economic Census. For information on confidentiality protection, nonsampling error, and explanation of terms, see note at end of table. For meaning of abbreviations andsymbols, see introductory text]
Employment size class
All employees Production workers
E1
All estab�lish�
ments2 Number3Payroll
($1,000) Number3Hours
(1,000)Wages
($1,000)
Valueadded
($1,000)
Totalcost of
materials($1,000)
Totalvalue of
shipments($1,000)
Totalcapital
expendi�tures
($1,000)
315999, Other apparel accessoriesand other apparel manufacturing
All establishments 3������������� 994 12 864 309 843 9 286 17 639 180 101 652 356 843 767 1 515 583 r22 093Establishments with�
1 to 4 employees 9�������������������� 675 1 210 29 177 906 1 506 17 830 48 893 48 148 96 926 r1925 to 9 employees 7�������������������� 97 648 17 363 472 911 10 245 32 269 39 851 71 771 r29410 to 19 employees 6����������������� 92 1 299 31 015 1 013 1 870 20 002 56 565 62 077 118 823 r91920 to 49 employees 4����������������� 85 2 686 62 608 2 085 4 059 40 165 140 868 142 992 286 897 r1 33550 to 99 employees 1����������������� 24 1 723 41 747 1 289 2 581 23 636 109 424 127 739 237 862 D100 to 249 employees 4��������������� 14 1 892 48 698 1 346 2 669 26 653 111 580 121 998 242 551 r1 836250 to 499 employees 4��������������� 3 1 080 25 773 827 1 572 15 972 35 579 85 317 133 691 r1 274500 to 999 employees 1��������������� 4 2 326 53 462 1 348 2 471 25 598 117 178 215 645 327 062 D1,000 to 2,499 employees –������������ – – – – – – – – – –2,500 employees or more –������������ – – – – – – – – – –
Administrative records4 9���������������� 685 1 687 41 702 1 301 2 273 26 305 70 813 71 795 141 088 r304
1Some payroll and sales data for small single�establishment companies with up to 20 employees (cutoff varied by industry) were obtained from administrative records of other governmentagencies rather than from census report forms. These data were then used in conjunction with industry averages to estimate statistics for these small establishments. This technique was also used for asmall number of other establishments whose reports were not received at the time data were tabulated. The following symbols are shown where estimated data account for 10 percent or more of thefigures shown: 1–10 to 19 percent; 2–20 to 29 percent; 3–30 to 39 percent; 4–40 to 49 percent; 5–50 to 59 percent; 6–60 to 69 percent; 7–70 to 79 percent; 8–80 to 89 percent; 9–90 percent or more.
2Includes establishments with payroll at any time during the year.3Number of employees figures represent average number of production workers for pay period that includes the 12th of March, May, August, and November plus other employees for payroll
period that includes the 12th of March.4Some payroll and sales data for small single�establishment companies with up to 20 employees (cutoff varied by industry) were obtained from administrative records of other government
agencies rather than from census report forms. These data were then used in conjunction with industry averages to estimate statistics for these small establishments. Data are also included in respectivesize classes shown.
Note: The data in this table are based on the 2002 Economic Census. To maintain confidentiality, the Census Bureau suppresses data to protect the identity of any business or individual. Thecensus results in this table contain nonsampling errors. Data users who create their own estimates using data from American FactFinder tables should cite the Census Bureau as the source of the originaldata only. For explanation of terms, see Appendix A. For full technical documentation, see Appendix C.
4 Other Apparel Accessories & Other Apparel Mfg Manufacturing�Industry SeriesU.S. Census Bureau, 2002 Economic Census
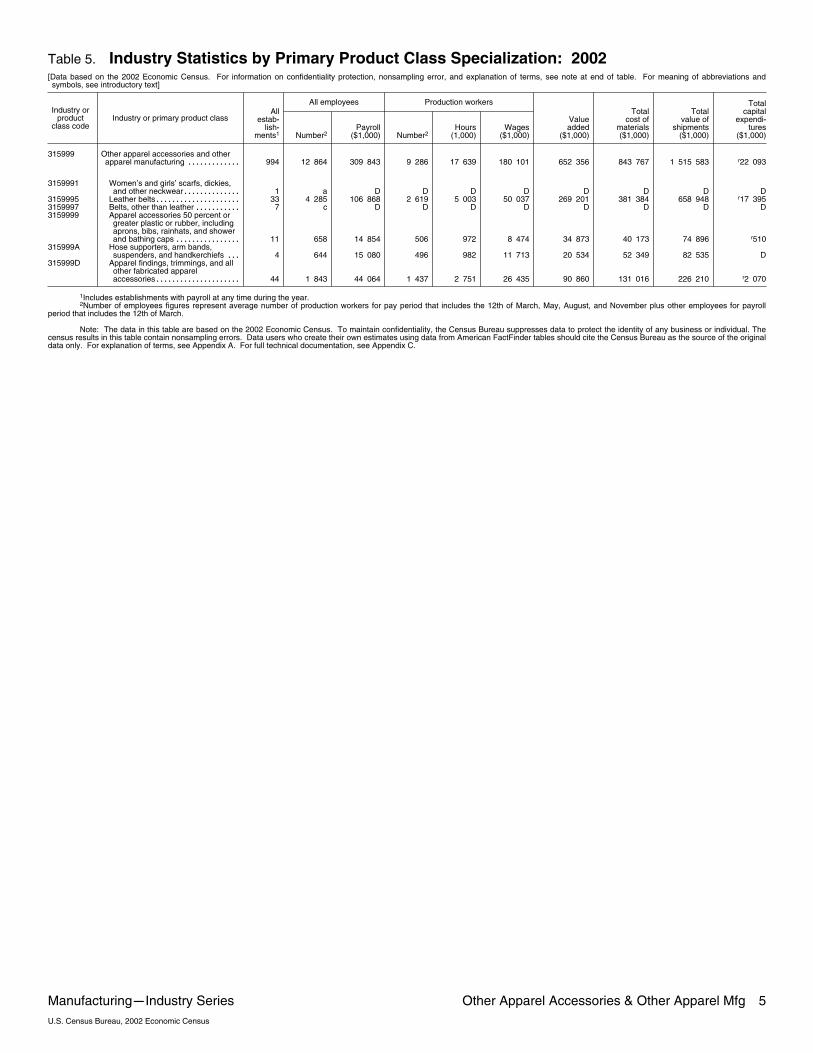
Table 5. Industry Statistics by Primary Product Class Specialization: 2002[Data based on the 2002 Economic Census. For information on confidentiality protection, nonsampling error, and explanation of terms, see note at end of table. For meaning of abbreviations andsymbols, see introductory text]
Industry orproduct
class codeIndustry or primary product class
All employees Production workersAll
estab�lish�
ments1 Number2Payroll
($1,000) Number2Hours
(1,000)Wages
($1,000)
Valueadded
($1,000)
Totalcost of
materials($1,000)
Totalvalue of
shipments($1,000)
Totalcapital
expendi�tures
($1,000)
315999 Other apparel accessories and otherapparel manufacturing 994������������� 12 864 309 843 9 286 17 639 180 101 652 356 843 767 1 515 583 r22 093
3159991 Women’s and girls’ scarfs, dickies,and other neckwear 1�������������� a D D D D D D D D
3159995 Leather belts 33��������������������� 4 285 106 868 2 619 5 003 50 037 269 201 381 384 658 948 r17 3953159997 Belts, other than leather 7����������� c D D D D D D D D3159999 Apparel accessories 50 percent or
greater plastic or rubber, includingaprons, bibs, rainhats, and showerand bathing caps 11���������������� 658 14 854 506 972 8 474 34 873 40 173 74 896 r510
315999A Hose supporters, arm bands,suspenders, and handkerchiefs 4��� 644 15 080 496 982 11 713 20 534 52 349 82 535 D
315999D Apparel findings, trimmings, and allother fabricated apparelaccessories 44��������������������� 1 843 44 064 1 437 2 751 26 435 90 860 131 016 226 210 r2 070
1Includes establishments with payroll at any time during the year.2Number of employees figures represent average number of production workers for pay period that includes the 12th of March, May, August, and November plus other employees for payroll
period that includes the 12th of March.
Note: The data in this table are based on the 2002 Economic Census. To maintain confidentiality, the Census Bureau suppresses data to protect the identity of any business or individual. Thecensus results in this table contain nonsampling errors. Data users who create their own estimates using data from American FactFinder tables should cite the Census Bureau as the source of the originaldata only. For explanation of terms, see Appendix A. For full technical documentation, see Appendix C.
Manufacturing�Industry Series Other Apparel Accessories & Other Apparel Mfg 5U.S. Census Bureau, 2002 Economic Census
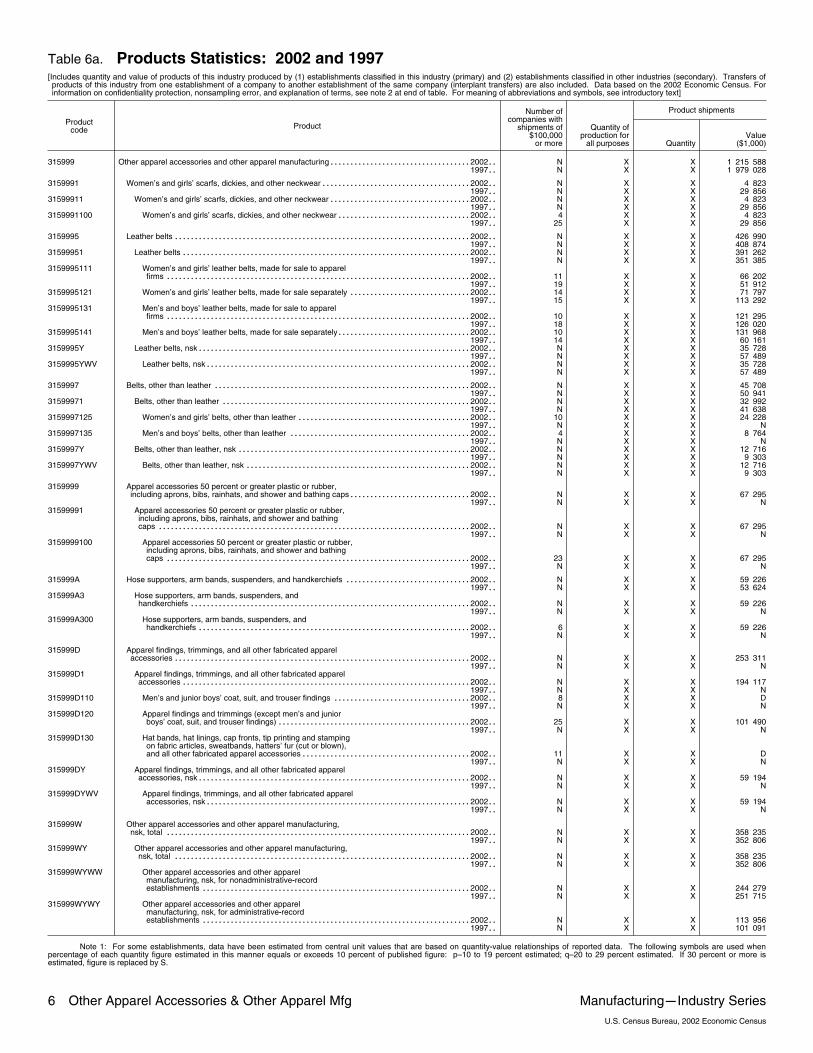
Table 6a. Products Statistics: 2002 and 1997[Includes quantity and value of products of this industry produced by (1) establishments classified in this industry (primary) and (2) establishments classified in other industries (secondary). Transfers ofproducts of this industry from one establishment of a company to another establishment of the same company (interplant transfers) are also included. Data based on the 2002 Economic Census. Forinformation on confidentiality protection, nonsampling error, and explanation of terms, see note 2 at end of table. For meaning of abbreviations and symbols, see introductory text]
Productcode Product
Product shipmentsNumber ofcompanies with
shipments of$100,000
or more
Quantity ofproduction for
all purposes QuantityValue
($1,000)
315999 Other apparel accessories and other apparel manufacturing 2002������������������������������������� N X X 1 215 5881997�� N X X 1 979 028
3159991 Women’s and girls’ scarfs, dickies, and other neckwear 2002��������������������������������������� N X X 4 8231997�� N X X 29 856
31599911 Women’s and girls’ scarfs, dickies, and other neckwear 2002������������������������������������� N X X 4 8231997�� N X X 29 856
3159991100 Women’s and girls’ scarfs, dickies, and other neckwear 2002����������������������������������� 4 X X 4 8231997�� 25 X X 29 856
3159995 Leather belts 2002���������������������������������������������������������������������������� N X X 426 9901997�� N X X 408 874
31599951 Leather belts 2002�������������������������������������������������������������������������� N X X 391 2621997�� N X X 351 385
3159995111 Women’s and girls’ leather belts, made for sale to apparelfirms 2002������������������������������������������������������������������������������ 11 X X 66 202
1997�� 19 X X 51 9123159995121 Women’s and girls’ leather belts, made for sale separately 2002�������������������������������� 14 X X 71 797
1997�� 15 X X 113 2923159995131 Men’s and boys’ leather belts, made for sale to apparel
firms 2002������������������������������������������������������������������������������ 10 X X 121 2951997�� 18 X X 126 020
3159995141 Men’s and boys’ leather belts, made for sale separately 2002����������������������������������� 10 X X 131 9681997�� 14 X X 60 161
3159995Y Leather belts, nsk 2002���������������������������������������������������������������������� N X X 35 7281997�� N X X 57 489
3159995YWV Leather belts, nsk 2002�������������������������������������������������������������������� N X X 35 7281997�� N X X 57 489
3159997 Belts, other than leather 2002������������������������������������������������������������������ N X X 45 7081997�� N X X 50 941
31599971 Belts, other than leather 2002���������������������������������������������������������������� N X X 32 9921997�� N X X 41 638
3159997125 Women’s and girls’ belts, other than leather 2002��������������������������������������������� 10 X X 24 2281997�� N X X N
3159997135 Men’s and boys’ belts, other than leather 2002����������������������������������������������� 4 X X 8 7641997�� N X X N
3159997Y Belts, other than leather, nsk 2002������������������������������������������������������������ N X X 12 7161997�� N X X 9 303
3159997YWV Belts, other than leather, nsk 2002���������������������������������������������������������� N X X 12 7161997�� N X X 9 303
3159999 Apparel accessories 50 percent or greater plastic or rubber,including aprons, bibs, rainhats, and shower and bathing caps 2002�������������������������������� N X X 67 295
1997�� N X X N31599991 Apparel accessories 50 percent or greater plastic or rubber,
including aprons, bibs, rainhats, and shower and bathingcaps 2002�������������������������������������������������������������������������������� N X X 67 295
1997�� N X X N3159999100 Apparel accessories 50 percent or greater plastic or rubber,
including aprons, bibs, rainhats, and shower and bathingcaps 2002������������������������������������������������������������������������������ 23 X X 67 295
1997�� N X X N
315999A Hose supporters, arm bands, suspenders, and handkerchiefs 2002��������������������������������� N X X 59 2261997�� N X X 53 624
315999A3 Hose supporters, arm bands, suspenders, andhandkerchiefs 2002������������������������������������������������������������������������ N X X 59 226
1997�� N X X N315999A300 Hose supporters, arm bands, suspenders, and
handkerchiefs 2002���������������������������������������������������������������������� 6 X X 59 2261997�� N X X N
315999D Apparel findings, trimmings, and all other fabricated apparelaccessories 2002���������������������������������������������������������������������������� N X X 253 311
1997�� N X X N315999D1 Apparel findings, trimmings, and all other fabricated apparel
accessories 2002�������������������������������������������������������������������������� N X X 194 1171997�� N X X N
315999D110 Men’s and junior boys’ coat, suit, and trouser findings 2002������������������������������������ 8 X X D1997�� N X X N
315999D120 Apparel findings and trimmings (except men’s and juniorboys’ coat, suit, and trouser findings) 2002�������������������������������������������������� 25 X X 101 490
1997�� N X X N315999D130 Hat bands, hat linings, cap fronts, tip printing and stamping
on fabric articles, sweatbands, hatters’ fur (cut or blown),and all other fabricated apparel accessories 2002�������������������������������������������� 11 X X D
1997�� N X X N315999DY Apparel findings, trimmings, and all other fabricated apparel
accessories, nsk 2002���������������������������������������������������������������������� N X X 59 1941997�� N X X N
315999DYWV Apparel findings, trimmings, and all other fabricated apparelaccessories, nsk 2002�������������������������������������������������������������������� N X X 59 194
1997�� N X X N
315999W Other apparel accessories and other apparel manufacturing,nsk, total 2002������������������������������������������������������������������������������ N X X 358 235
1997�� N X X 352 806315999WY Other apparel accessories and other apparel manufacturing,
nsk, total 2002���������������������������������������������������������������������������� N X X 358 2351997�� N X X 352 806
315999WYWW Other apparel accessories and other apparelmanufacturing, nsk, for nonadministrative�recordestablishments 2002��������������������������������������������������������������������� N X X 244 279
1997�� N X X 251 715315999WYWY Other apparel accessories and other apparel
manufacturing, nsk, for administrative�recordestablishments 2002��������������������������������������������������������������������� N X X 113 956
1997�� N X X 101 091
Note 1: For some establishments, data have been estimated from central unit values that are based on quantity�value relationships of reported data. The following symbols are used whenpercentage of each quantity figure estimated in this manner equals or exceeds 10 percent of published figure: p–10 to 19 percent estimated; q–20 to 29 percent estimated. If 30 percent or more isestimated, figure is replaced by S.
6 Other Apparel Accessories & Other Apparel Mfg Manufacturing�Industry SeriesU.S. Census Bureau, 2002 Economic Census

Table 6a. Products Statistics: 2002 and 1997�Con.Note 2: The data in this table are based on the 2002 Economic Census. To maintain confidentiality, the Census Bureau suppresses data to protect the identity of any business or individual. The
census results in this table contain nonsampling errors. Data users who create their own estimates using data from American FactFinder tables should cite the Census Bureau as the source of the originaldata only. For explanation of terms, see Appendix A. For full technical documentation, see Appendix C.
Manufacturing�Industry Series Other Apparel Accessories & Other Apparel Mfg 7U.S. Census Bureau, 2002 Economic Census
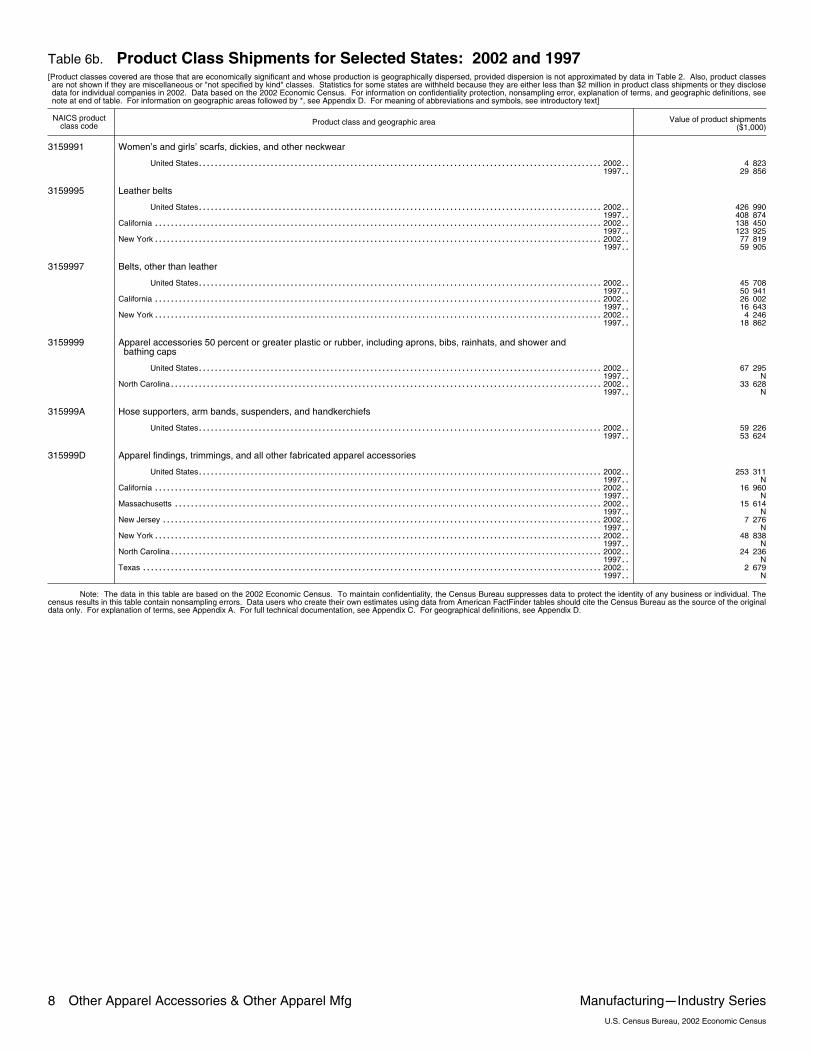
Table 6b. Product Class Shipments for Selected States: 2002 and 1997[Product classes covered are those that are economically significant and whose production is geographically dispersed, provided dispersion is not approximated by data in Table 2. Also, product classesare not shown if they are miscellaneous or "not specified by kind" classes. Statistics for some states are withheld because they are either less than $2 million in product class shipments or they disclosedata for individual companies in 2002. Data based on the 2002 Economic Census. For information on confidentiality protection, nonsampling error, explanation of terms, and geographic definitions, seenote at end of table. For information on geographic areas followed by *, see Appendix D. For meaning of abbreviations and symbols, see introductory text]
NAICS productclass code Product class and geographic area Value of product shipments
($1,000)
3159991 Women’s and girls’ scarfs, dickies, and other neckwear
United States 2002������������������������������������������������������������������������������������������������������� 4 8231997�� 29 856
3159995 Leather belts
United States 2002������������������������������������������������������������������������������������������������������� 426 9901997�� 408 874
California 2002������������������������������������������������������������������������������������������������������������������ 138 4501997�� 123 925
New York 2002������������������������������������������������������������������������������������������������������������������ 77 8191997�� 59 905
3159997 Belts, other than leather
United States 2002������������������������������������������������������������������������������������������������������� 45 7081997�� 50 941
California 2002������������������������������������������������������������������������������������������������������������������ 26 0021997�� 16 643
New York 2002������������������������������������������������������������������������������������������������������������������ 4 2461997�� 18 862
3159999 Apparel accessories 50 percent or greater plastic or rubber, including aprons, bibs, rainhats, and shower andbathing caps
United States 2002������������������������������������������������������������������������������������������������������� 67 2951997�� N
North Carolina 2002�������������������������������������������������������������������������������������������������������������� 33 6281997�� N
315999A Hose supporters, arm bands, suspenders, and handkerchiefs
United States 2002������������������������������������������������������������������������������������������������������� 59 2261997�� 53 624
315999D Apparel findings, trimmings, and all other fabricated apparel accessories
United States 2002������������������������������������������������������������������������������������������������������� 253 3111997�� N
California 2002������������������������������������������������������������������������������������������������������������������ 16 9601997�� N
Massachusetts 2002������������������������������������������������������������������������������������������������������������� 15 6141997�� N
New Jersey 2002���������������������������������������������������������������������������������������������������������������� 7 2761997�� N
New York 2002������������������������������������������������������������������������������������������������������������������ 48 8381997�� N
North Carolina 2002�������������������������������������������������������������������������������������������������������������� 24 2361997�� N
Texas 2002��������������������������������������������������������������������������������������������������������������������� 2 6791997�� N
Note: The data in this table are based on the 2002 Economic Census. To maintain confidentiality, the Census Bureau suppresses data to protect the identity of any business or individual. Thecensus results in this table contain nonsampling errors. Data users who create their own estimates using data from American FactFinder tables should cite the Census Bureau as the source of the originaldata only. For explanation of terms, see Appendix A. For full technical documentation, see Appendix C. For geographical definitions, see Appendix D.
8 Other Apparel Accessories & Other Apparel Mfg Manufacturing�Industry SeriesU.S. Census Bureau, 2002 Economic Census
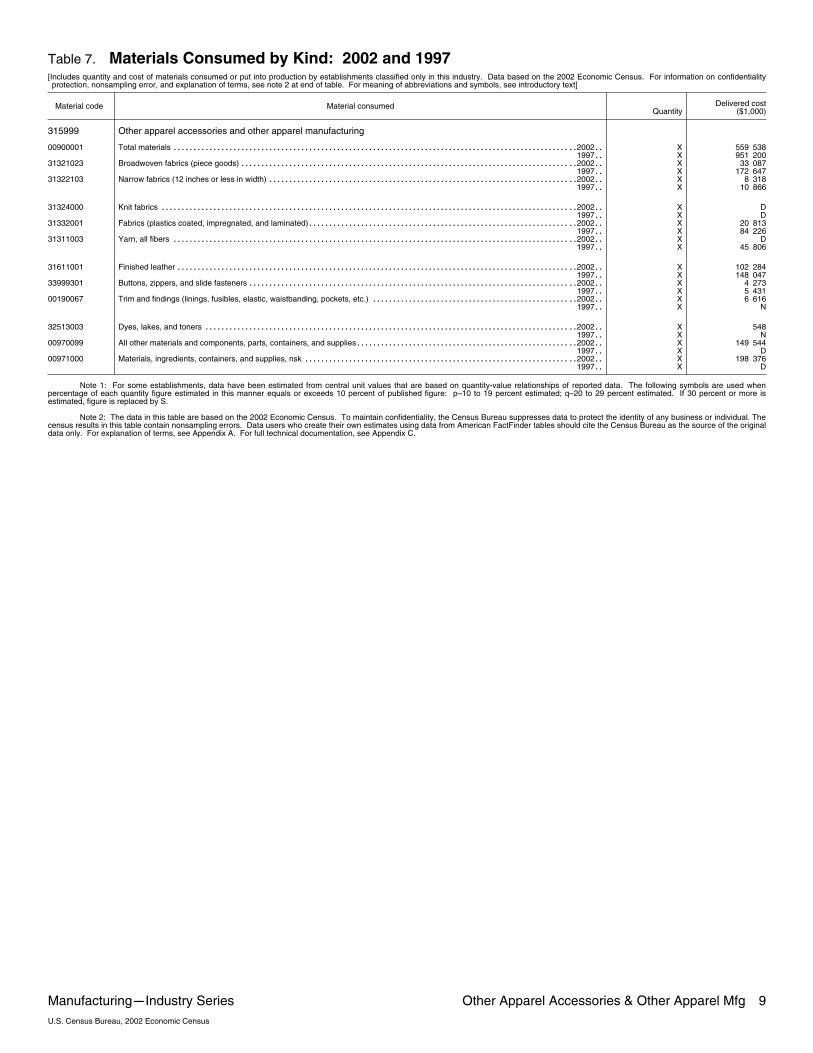
Table 7. Materials Consumed by Kind: 2002 and 1997[Includes quantity and cost of materials consumed or put into production by establishments classified only in this industry. Data based on the 2002 Economic Census. For information on confidentialityprotection, nonsampling error, and explanation of terms, see note 2 at end of table. For meaning of abbreviations and symbols, see introductory text]
Material code Material consumedQuantity
Delivered cost($1,000)
315999 Other apparel accessories and other apparel manufacturing
00900001 Total materials ��2002����������������������������������������������������������������������������������������������������� X 559 5381997�� X 951 200
31321023 Broadwoven fabrics (piece goods) ��2002������������������������������������������������������������������������������������ X 33 0871997�� X 172 647
31322103 Narrow fabrics (12 inches or less in width) ��2002����������������������������������������������������������������������������� X 8 3181997�� X 10 866
31324000 Knit fabrics ��2002�������������������������������������������������������������������������������������������������������� X D1997�� X D
31332001 Fabrics (plastics coated, impregnated, and laminated) ��2002������������������������������������������������������������������� X 20 8131997�� X 84 226
31311003 Yarn, all fibers ��2002����������������������������������������������������������������������������������������������������� X D1997�� X 45 806
31611001 Finished leather ��2002���������������������������������������������������������������������������������������������������� X 102 2841997�� X 148 047
33999301 Buttons, zippers, and slide fasteners ��2002���������������������������������������������������������������������������������� X 4 2731997�� X 5 431
00190067 Trim and findings (linings, fusibles, elastic, waistbanding, pockets, etc.) ��2002��������������������������������������������������� X 6 6161997�� X N
32513003 Dyes, lakes, and toners ��2002��������������������������������������������������������������������������������������������� X 5481997�� X N
00970099 All other materials and components, parts, containers, and supplies ��2002������������������������������������������������������� X 149 5441997�� X D
00971000 Materials, ingredients, containers, and supplies, nsk ��2002�������������������������������������������������������������������� X 198 3761997�� X D
Note 1: For some establishments, data have been estimated from central unit values that are based on quantity�value relationships of reported data. The following symbols are used whenpercentage of each quantity figure estimated in this manner equals or exceeds 10 percent of published figure: p–10 to 19 percent estimated; q–20 to 29 percent estimated. If 30 percent or more isestimated, figure is replaced by S.
Note 2: The data in this table are based on the 2002 Economic Census. To maintain confidentiality, the Census Bureau suppresses data to protect the identity of any business or individual. Thecensus results in this table contain nonsampling errors. Data users who create their own estimates using data from American FactFinder tables should cite the Census Bureau as the source of the originaldata only. For explanation of terms, see Appendix A. For full technical documentation, see Appendix C.
Manufacturing�Industry Series Other Apparel Accessories & Other Apparel Mfg 9U.S. Census Bureau, 2002 Economic Census
Appendix A.Explanation of Terms
BEGINNING- AND END-OF-YEAR INVENTORIES
Respondents were asked to report their beginning-of-year and end-of-year inventories at cost ormarket. Effective with the 1982 Economic Census, this change to a uniform instruction for report-ing inventories was introduced for all sector reports. Prior to 1982, respondents were permitted tovalue inventories using any generally accepted accounting method (FIFO, LIFO, market, to name afew). Beginning in 1982, LIFO users were asked to first report inventory values prior to the LIFOadjustment and, then, to report the LIFO reserve and the LIFO value after adjustment for thereserve.
Inventory data by stage of fabrication
Total inventories and three detailed components (1)finished goods, (2)work-in-process, and(3)materials, supplies, fuels, etc., were collected.
When using inventory data by stage of fabrication for “all industries” and at the three-digit subsec-tor level, it should be noted that an item treated as a finished product by an establishment in oneindustry may be reported as a raw material by an establishment in a different industry. Forexample, the finished-product inventories of a steel mill would be reported as raw materials by astamping plant. Such differences are present in the inventory figures by stage of fabricationshown for all publication levels.
COST OF MATERIALS
This term refers to direct charges actually paid or payable for items consumed or put into produc-tion during the year, including freight charges and other direct charges incurred by the establish-ment in acquiring these materials. It includes the cost of materials or fuel consumed, whether pur-chased by the individual establishment from other companies, transferred to it from otherestablishments of the same company, or withdrawn from inventory during the year.
Included in this item are:
1. Cost of parts, components, containers, etc. Includes all raw materials, semifinished goods,parts, containers, scrap, and supplies put into production or used as operating supplies andfor repair and maintenance during the year.
2. Cost of products bought and sold in the same condition.
3. Cost of fuels consumed for heat and power. Includes the cost of materials or fuel consumed,whether purchased by the individual establishment from other companies, transferred to itfrom other establishments of the same company, or withdrawn from inventory during theyear.
4. Cost of purchased electricity. The cost of purchased electric energy represents the amountactually used during the year for heat and power. In addition, information was collected onthe quantity of electric energy generated by the establishment and the quantity of electricenergy sold or transferred to other plants of the same company.
5. Cost of contract work. This term applies to work done by others on materials furnished by themanufacturing establishment. The actual cost of the material is to be reported on the cost ofmaterials, parts, and containers line of this item. The term ‘‘Contract Work’’ refers to the fee acompany pays to another company to perform a service.
Appendix A A–1Manufacturing
U.S. Census Bureau, 2002 Economic Census
Specific materials consumed
In addition to the total cost of materials, which every establishment was required to report, infor-mation also was collected for most manufacturing industries on the consumption of major materi-als used in manufacturing. The inquiries were restricted to those materials that were importantparts of the cost of production in a particular industry and for which cost information was avail-able from manufacturers’ records. If less than $25,000 of a listed material was consumed by anestablishment, the cost data could be reported in the “Cost of all other materials” Census materialcode 00970099.
Also, the cost of materials for small establishments for which administrative records or shortforms were used was imputed into the “Materials not specified by kind” Census materials code00971000.
Duplication in cost of materials and value of shipment
The aggregate of the cost of materials and value of shipments figures for industry groups and forall manufacturing industries includes large amounts of duplication since the products of someindustries are used as materials by others. This duplication results, in part, from the addition ofrelated industries representing successive stages in the production of a finished manufacturedproduct. Examples are the addition of flour mills to bakeries in the food group and the addition ofpulp mills to paper mills in the paper and allied products group of industries.
Estimates of the overall extent of this duplication indicate that the value of manufactured prod-ucts exclusive of such duplication (the value of finished manufactures) tends to approximate two-thirds of the total value of products reported in the survey.
Duplication of products within individual industries is significant within a number of industrygroups, e.g., machinery and transportation industries. These industries frequently include com-plete machinery and their parts. In this case, the parts made for original equipment are materialsconsumed for assembly plants in the same industry.
Even when no significant amount of duplication is involved, value of shipments figures are defi-cient as measures of the relative economic importance of individual manufacturing industries orgeographic areas because of the wide variation in ratio of materials, labor, and other processingcosts of value of shipments, both among industries and within the same industry.
Before 1962, cost of materials and value of shipments were not published for some industrieswhich included considerable duplication. Since then, these data have been published for all indus-tries at the U.S. level and beginning in 1964, for all geographic levels.
SELECTED PURCHASED SERVICES
Annual Survey of Manufactures (ASM) establishments were requested to provide information onthe cost of selected purchased services for the repair and maintenance services of buildingsand/or machinery; communication services; legal services; accounting, auditing, and bookkeepingservices; advertising and promotional services; expensed computer hardware and supplies andpurchased computer services; refuse removal services; management consulting and administra-tive services; taxes and license fees; and all other expenses not previously stated. Each of theseitems reflects the costs paid directly by the establishment and excludes salaries paid to employ-ees of the establishment for these services. These expenses are normally considered as nonpro-duction related costs purchased from other companies.
Included in the cost of selected purchased services for the repair and maintenance services ofbuildings and/or machinery are payments made for all maintenance and repair work on buildingsand equipment. Payments made to other establishments of the same company and for repair andmaintenance of any leased property also are included. Excluded from this item are extensiverepairs or reconstruction that was capitalized, which is considered capital expenditures; costsincurred directly by the establishment in using its own work force to perform repairs and mainte-nance work; and repairs and maintenance provided by the building or machinery owner as part ofthe rental contract.
A–2 Appendix A Manufacturing
U.S. Census Bureau, 2002 Economic Census
Included in the cost of selected purchased services for communication is the actual expenseincurred or payable during the year for any type of communication. Such types of communicationinclude telephone, data transmission, telegraph, Internet, connectivity, FAX, telex, photo transmis-sion, paging, cellular telephone, on-line access and related services, etc.
Included in the cost of selected purchased services for legal services are payments made to othercompanies for these services that were paid directly by the establishment. Excluded are the sala-ries paid to employees of the establishment for these services.
Included in the cost of selected accounting, auditing, and bookkeeping services are paymentsmade to other companies for these services that were paid directly by the establishment.Excluded are the salaries paid to employees of this establishment for these services.
Included in the cost of selected advertising and promotional services are payments made to othercompanies for these services that were paid directly by the establishment. These include pay-ments for printing, media coverage, and other services and materials. Excluded are the salariespaid to employees of this establishment for these services.
Included in the cost of selected expensed computer hardware and supplies and purchased com-puter services are actual expenses incurred or payable during the year for this item. Purchases forcomputer hardware and supplies, computer services (software, data transmission, processing ser-vices, Web design, etc.) are all included. Excluded are services provided by other establishmentsof the same company (such as a separate central data processing unit).
Included in the cost of selected purchased refuse removal services are payments made to othercompanies for these services that were paid directly by the establishment, including costs for haz-ardous waste removal or treatment. Excluded are all costs included in rental payments or as capi-tal expenditures and the salaries paid to employees of the establishment for these services.
Included in the cost of selected purchased management consulting and administrative services arepayments made to other companies for these services that were paid directly by the establish-ment. Excluded are the salaries paid to employees of this establishment for these services.
Included in the cost of selected purchased taxes and license fees are payments made to othercompanies for these services that were paid directly by the establishment, excluding income,sales, payroll, and excise taxes. Excluded are also the salaries paid to employees of this establish-ment for these services.
Response coverage ratio
A response coverage ratio is a measure of the extent to which respondents report for an item. Theestimate is made by calculating the ratio value of the weighted total employment data for all theASM establishments that report the item to the weighted total employment data for all ASM estab-lishments classified in an industry (reporters and nonreporters).
DEPRECIATION CHARGES FOR FIXED ASSETS
This item includes depreciation and amortization charged during the year against assets. Depre-ciation charged against fixed assets acquired since the beginning of the year and against assetssold or retired during the year are components of this category. Respondents were requested tomake certain that they did not report accumulated depreciation.
NUMBER OF EMPLOYEES
This item includes all full-time and part-time employees on the payrolls of operating manufactur-ing establishments during any part of the pay period that included the 12th of the months speci-fied on the report form. Included are employees on paid sick leave, paid holidays, and paid vaca-tions; not included are proprietors and partners of unincorporated businesses.
These individuals comprise of all full-time and part-time employees who are on the payrolls ofestablishments who worked or received pay for any part of the pay period including the 12th ofMarch, May, August, and November.
Appendix A A–3Manufacturing
U.S. Census Bureau, 2002 Economic Census
The “all employees” number is the average number of production workers plus the number ofother employees in mid-March. The number of production workers is the average for the payrollperiods including the 12th of March, May, August, and November
Production Workers
The “production workers” number includes workers (up through the line-supervisor level) engagedin fabricating, processing, assembling, inspecting, receiving, storing, handling, packing, ware-housing, shipping (but not delivering), maintenance, repair, janitorial and guard services, productdevelopment, auxiliary production for plant’s own use (e.g., power plant), recordkeeping, andother services closely associated with these production operations at the establishment coveredby the report. Employees above the working-supervisor level are excluded from this item.
All Other Employees
The “other employees” covers nonproduction employees of the manufacturing establishmentincluding those engaged in factory supervision above the line-supervisor level. It includes sales(including driver-salespersons), sales delivery (highway truck drivers and their helpers), advertis-ing, credit, collection, installation and servicing of own products, clerical and routine office func-tions, executive, purchasing, financing, legal, personnel (including cafeteria, medical, etc.), profes-sional, and technical employees. Also included are employees on the payroll of the manufacturingestablishment engaged in the construction of major additions or alterations utilized as a separatework force.
TOTAL FRINGE BENEFITS
This item is the employer’s costs for social security tax, unemployment tax, workmen’s compen-sation insurance, state disability insurance pension plans, stock purchase plans, union-negotiatedbenefits, life insurance premiums, and insurance premiums on hospital and medical plans foremployees.
Fringe benefits are divided into legally required expenditures and payments for voluntary pro-grams. The legally required portion consists primarily of federal old age and survivors’ insurance,unemployment compensation, and workers’ compensation. Payments for voluntary programsinclude all programs not specifically required by legislation, whether they were employer initiatedor the result of collective bargaining. They include the employer portion of such plans as insur-ance premiums, premiums for supplemental accident and sickness insurance, pension plans,supplemental unemployment compensation, welfare plans, stock purchase plans on which theemployer payment is not subject to withholding tax, and deferred profit-sharing plans. Theyexclude such items as company-operated cafeterias, in-plant medical services, free parking lots,discounts on employee purchases, and uniforms and work clothing for employees.
GROSS VALUE OF DEPRECIABLE ASSETS (ACQUISITION COSTS) AT BEGINNING OF YEAR(BOY) AND END OF YEAR (EOY)
Total value of depreciable assets is collected on all census forms.
It shows the value of depreciable assets for the beginning of year (BOY) and end of year (EOY).The data encompass all fixed depreciable assets on the books of establishments. The valuesshown (book value) represent the actual cost of assets at the time they were acquired, includingall costs incurred in making the assets usable (such as transportation and installation). Includedare all buildings, structures, machinery, and equipment (production, office, and transportationequipment) for which depreciation reserves are maintained. Excluded are nondepreciable capitalassets including inventories and intangible assets, such as timber and mineral rights.
The definition of fixed depreciable assets is consistent with the definition of capital expenditures.For example, expenditures include actual capital outlays during the year rather than the finalvalue of equipment put in place and buildings completed during the year.
Accordingly, the value of assets at the end of the year includes the value of construction inprogress.
A–4 Appendix A Manufacturing
U.S. Census Bureau, 2002 Economic Census
In addition, respondents were requested to make certain that assets at the beginning of the yearplus capital expenditures, less retirements, equaled assets at the end of the year.
ESTABLISHMENT
An establishment is a single physical location where business is conducted or where services orindustrial operations are performed. Data in this sector includes those establishments wheremanufacturing is performed. A separate report was required for each manufacturing establish-ment (plant) with one employee or more that were in operation at any time during the year.
An establishment not in operation for any portion of the year was requested to return the reportform with the proper notation in the “Operational Status” section of the form. In addition, theestablishment was requested to report data on any employees, capital expenditures, inventories,or shipments from inventories during the year.
Company
A company or (“enterprise”) is comprised of all the establishments that operate under the owner-ship or control of a single organization. A company may be a business, service, or membershiporganization; consist of one or several establishments; and operate at one or several locations. Itincludes all subsidiary organizations, all establishments that are majority-owned by the companyor any subsidiary, and all the establishments that can be directed or managed by the company orany subsidiary.
A company may have one or many establishments. Examples include product and service salesoffices (retail and wholesale), industrial production plants, processing or assembly operations,mines or well sites, and support operations (such as an administrative office, warehouse, cus-tomer service center, or regional headquarters). Each establishment should receive, complete, andreturn a separate census form.
If the company operated at different physical locations, even if the individual locations were pro-ducing the same line of goods, a separate report was requested for each location. If the companyoperated in two or more distinct lines of manufacturing at the same location, a separate reportwas requested for each activity.
PAYROLL
This item includes the gross earnings of all employees on the payrolls of operating manufacturingestablishments paid in the calendar year. Respondents were told they could follow the definitionof payrolls used for calculating the federal withholding tax. It includes all forms of compensation,such as salaries, wages, commissions, dismissal pay, bonuses, vacation and sick leave pay, andcompensation in kind, prior to such deductions as employees’ social security contributions, with-holding taxes, group insurance, union dues, and savings bonds. The total includes salaries ofofficers of corporations; it excludes payments to proprietors or partners of unincorporated con-cerns. Also excluded are payments to members of Armed Forces and pensioners carried on theactive payrolls of manufacturing establishments.
The census definition of payrolls is identical to that recommended to all federal statistical agen-cies by the Office of Management and Budget. It should be noted that this definition does notinclude employers’ social security contributions or other nonpayroll labor costs, such as employ-ees’ pension plans, group insurance premiums, and workers’ compensation.
The ASM provides estimates of employers’ total supplemental labor costs (those required by fed-eral and state laws and those incurred voluntarily or as part of collective bargaining agreements).
PRODUCT CODES AND CLASSES OF PRODUCTS
NAICS United States industries are identified by a six-digit code. The longer code accommodatesthe large number of sectors and allows more flexibility in designing subsectors. Each product orservice is assigned a ten-digit code. The product coding structure represents an extension by theCensus Bureau of the six-digit industry classifications of the manufacturing and mining sectors.The classification system operates so that the industrial coverage is progressively narrower withthe successive addition of digits.
Appendix A A–5Manufacturing
U.S. Census Bureau, 2002 Economic Census
As in previous censuses, data were collected for most industries on the quantity and value of indi-vidual products shipped. Since the 1997 census programs, information is collected on the outputof almost 10,000 individual product items.
In the manufacturing sector for 2002, there are 21 subsectors (three-digit NAICS), 86 industrygroups (four-digit NAICS), 184 NAICS industries (five-digit NAICS) that are comparable with Cana-dian and Mexican classification, and 473 U.S. industries (six-digit NAICS). Product classes andproducts of the manufacturing industries have been assigned codes based on the industry fromwhich they originate. There are 1,450 product classes (seven-digit codes), 5,674 census products,and an additional 3,746 ten-digit product codes. The ten-digit products are considered the pri-mary products of the industry with the same first six digits.
The list of products for which separate information was collected was prepared after consultationwith industry and government representatives.
Comparability with previous figures was given considerable weight in the selection of product cat-egories, so that comparable 1992 information is presented for most products.
Typically, both quantity and value of shipments information were collected. However, if quantitywas not significant or could not be reported by manufacturers, only value of shipments was col-lected.
Shipments include both commercial shipments and transfers of products to other plants of thesame company. For industries in which a considerable portion of the total shipments is trans-ferred to other plants of the same company, separate information on interplant transfers also wascollected. Moreover, for products that are used to a large degree within the same establishment asmaterials or components in the fabrication of other products, total production and often con-sumption of the item within the plant (quantity produced and consumed) was collected. Typically,the information on production also was collected for products for which there are significant dif-ferences between total production and shipments in a given year because of wide fluctuations infinished goods inventories. Other measures of output of products with long production cycleswere used as appropriate and feasible.
PRODUCTION-WORKER HOURS
This item covers all hours worked or paid for at the manufacturing plant, including actual over-time hours (not straight-time equivalent hours). It excludes hours paid for vacations, holidays, orsick leave when the employee was not at the establishment.
QUANTITY OF ELECTRICITY PURCHASED FOR HEAT AND POWER
Data on the cost of purchased electric energy were collected on all census forms. However, dataon the quantity of purchased electric energy were collected only on the Annual Survey of Manufac-tures (ASM) form. In addition, information is collected on the quantity of electric energy generatedby the establishment and the quantity of electric energy sold or transferred to other plants of thesame company.
RENTAL PAYMENTS
Total rental payments are collected on all census forms. However, the breakdown between rentalpayments for buildings and other structures and rental payments for machinery and equipment iscollected only on the ASM forms. This item includes rental payments for the use of all items forwhich depreciation reserves would be maintained, if they were owned by the establishment, e.g.,structures and buildings, and production, office, and transportation equipment. Excluded are roy-alties and other payments for the use of intangibles and depletable assets and land rents whereseparable.
When an establishment of a multiestablishment company was charged rent by another part of thesame company for the use of assets owned by the company, it was instructed to exclude that costfrom rental payments.
A–6 Appendix A Manufacturing
U.S. Census Bureau, 2002 Economic Census
However, the book value (original cost) of these company-owned assets was to be reported asassets of the establishment at the end of the year.
If there were assets at an establishment rented from another company and the rents were paidcentrally by the head office of the establishment, the company was instructed to report theserental payments as if they were paid directly by the establishment.
RETIREMENTS OF DEPRECIABLE ASSETS
Included in this item is the gross value of assets sold, retired, scrapped, destroyed, etc., duringthe calendar year. When a complete operation or establishment changed ownership, the respon-dent was instructed to report the value of the assets sold at the original cost as recorded in thebooks of the seller. The respondent also was requested to report retirements of equipment orstructures owned by a parent company that the establishment was using as if it were a tenant.
CAPITAL EXPENDITURES FOR NEW AND USED PLANT AND EQUIPMENT
Represents the total new and used capital expenditures reported by establishments in operationand any known plants under construction.
These data include expenditures for:
1. Permanent additions and major alterations to manufacturing and mining establishments.
2. New and used machinery and equipment used for replacement and additions to plant capac-ity, if they are of the type for which depreciation, depletion, or (for mining establishments)Office of Minerals Exploration accounts are ordinarily maintained. In addition, for miningestablishments, these data include expenditures made during the year for development andexploration of mineral properties. For manufacturing establishments, these data are brokendown into three types.
a. Automobiles, trucks, etc. for highway use. These include vehicles acquired under a lease-purchase agreement and excludes vehicles leased or normally designed to transport mate-rials, property, or equipment on mining, construction, petroleum development, and similarprojects. These vehicles are of such size or weight as to be normally restricted by statelaws or regulations from operating on public highways. It also excludes purchases ofvehicles that are purchased by a company for highway use.
b. Computers and peripheral data processing equipment. This item include all purchases ofcomputers and related equipment.
c. All other expenditures for machinery and equipment excluding automobiles and computerequipment.
Capital expenditures include work done by contract, as well as by the establishment’s own work-force.
These data exclude expenditures for land and mineral rights and cost of maintenance and repairscharged as current operating expenses.
VALUE ADDED
This measure of manufacturing activity is derived by subtracting the cost of materials, supplies,containers, fuel, purchased electricity, and contract work from the value of shipments (productsmanufactured plus receipts for services rendered). The result of this calculation is adjusted by theaddition of value added by merchandising operations (i.e., the difference between the sales valueand the cost of merchandise sold without further manufacture, processing, or assembly) plus thenet change in finished goods and work-in-process between the beginning- and end-of-year inven-tories.
Appendix A A–7Manufacturing
U.S. Census Bureau, 2002 Economic Census
For those industries where value of production is collected instead of value of shipments, valueadded is adjusted only for the change in work-in-process inventories between the beginning andend of year. For those industries where value of work done is collected, the value added does notinclude an adjustment for the change in finished goods or work-in-process inventories.
“Value added” avoids the duplication in the figure for value of shipments that results from the useof products of some establishments as materials by others. Value added is considered to be thebest value measure available for comparing the relative economic importance of manufacturingamong industries and geographic areas.
VALUE OF SHIPMENTS
This item covers the received or receivable net selling values, f.o.b. plant (exclusive of freight andtaxes), of all products shipped, both primary and secondary, as well as all miscellaneous receipts,such as receipts for contract work performed for others, installation and repair, sales of scrap, andsales of products bought and sold without further processing. Included are all items made by orfor the establishments from material owned by it, whether sold, transferred to other plants of thesame company, or shipped on consignment. The net selling value of products made in one planton a contract basis from materials owned by another was reported by the plant providing thematerials.
In the case of multiunit companies, the manufacturer was requested to report the value of prod-ucts transferred to other establishments of the same company at full economic or commercialvalue, including not only the direct cost of production but also a reasonable proportion of “allother costs” (including company overhead) and profit.
In addition to the value for NAICS defined products, aggregates of the following categories of mis-cellaneous receipts are reported as part of a total establishment’s value of product shipments:Reported contract work — receipts for work or services that a plant performed for others on theirmaterials. Value of resales — sales of products brought and sold without further manufacture, pro-cessing, or assembly. Other miscellaneous receipts — such as repair work, installation, sales ofscrap, etc.
Industry primary product value of shipments represents one of the three components of value ofshipments. These components are: Primary products value of shipments. Secondary product valueof shipments. Total miscellaneous receipts.
Primary product shipments is used in the calculations of industry specialization ratio and industrycoverage ratio. The term “Value of primary products shipments made in this industry” is used inthis publication and refers to the same data.
Duplication in cost of materials and value of shipment
The aggregate of the cost of materials and value of shipments figures for industry groups and forall manufacturing industries includes large amounts of duplication since, the products of someindustries are used as materials by others. This duplication results, in part, from the addition ofrelated industries representing successive stages in the production of a finished manufacturedproduct. Examples are the addition of flour mills to bakeries in the food group and the addition ofpulp mills to paper mills in the paper and allied products group of industries.
Estimates of the overall extent of this duplication indicate that the value of manufactured prod-ucts exclusive of such duplication (the value of finished manufactures) tends to approximate two-thirds of the total value of products reported in the annual survey.
Duplication of products within individual industries is significant within a number of industrygroups, e.g., machinery and transportation industries. These industries frequently include com-plete machinery and their parts. In this case, the parts made for original equipment are materialsconsumed for assembly plants in the same industry.
Even when no significant amount of duplication is involved, value of shipments figures are defi-cient as measures of the relative economic importance of individual manufacturing industries orgeographic areas because of the wide variation in ratio of materials, labor, and other processingcosts of value of shipments, both among industries and within the same industry.
A–8 Appendix A Manufacturing
U.S. Census Bureau, 2002 Economic Census
Before 1962, cost of materials and value of shipments were not published for some industries thatincluded considerable duplication. Since then, these data have been published for all industries atthe U.S. level and beginning in 1964, for all geographic levels.
Specialization and coverage ratio
These items are not collected on the report forms, but are derived from the data shown in Table 3.An establishment is classified in a particular industry, if its shipments of primary products of thatindustry exceed in value its shipments of the products of any other single industry.
An establishment’s shipments include those products assigned to an industry (primary products),those considered primary to other industries (secondary products), and receipts for miscellaneousactivities (merchandising, contract work, resales, etc.).
Specialization and coverage ratio have been developed to measure the relationship of primaryproduct shipments to the data on shipments for the industry shown in Tables 1 through 5 anddata on product shipments shown in Tables 6a and 6b.
Specialization ratio represents the ratio of primary product shipments to total product shipments(primary and secondary, excluding miscellaneous receipts) for the establishments classified in theindustry.
Coverage ratio represents the ratio of primary products shipped by the establishments classifiedin the industry to the total shipments of such products that are shipped by all manufacturingestablishments wherever classified.
Appendix A A–9Manufacturing
U.S. Census Bureau, 2002 Economic Census
Appendix B.NAICS Codes, Titles, and Descriptions
315999 OTHER APPAREL ACCESSORIES AND OTHER APPAREL MANUFACTURING
This U.S. industry comprises establishments primarily engaged in manufacturing apparel andapparel accessories (except apparel knitting mills; cut and sew apparel contractors; cut and sewapparel; hats and caps; mittens and gloves; and men’s and boys’ neckwear). Jobbers for theseproducts, who perform entrepreneurial functions involved in other apparel and accessory manu-facture, including buying raw materials, designing and preparing samples, arranging for otherapparel and accessories to be made from their materials, and marketing finished other appareland accessories, are included. Examples of products made by these establishments are appareltrimmings and findings, belts, women’s scarves, and suspenders.
Appendix B B–1Manufacturing
U.S. Census Bureau, 2002 Economic Census
Appendix C.Methodology
SOURCES OF THE DATA
The manufacturing sector includes approximately 350,000 establishments. This number includesthose industries in the North American Industry Classification System (NAICS) definition of manu-facturing. The amount of information requested from manufacturing establishments was depen-dent upon a number of factors. The more important considerations were the size of the companyand whether it was included in the Annual Survey of Manufactures (ASM).
Establishments in the 2002 Economic Census are divided into those sent report forms and thosenot sent report forms. The coverage of and the method of obtaining census information from eachare described below:
1. Establishments sent a report form:
a. ASM sample establishments. This group accounts for approximately 15 percent of allmanufacturing establishments. The ASM panel covers all the units of large manufacturingestablishments, as well as a sample of the medium and smaller establishments. The prob-ability of selection was proportionate to size. For more information, see the Description ofthe ASM Survey Sample.
In an economic census year, the ASM report form (MA-10000) replaces the first page of theregular census form for those establishments included in the ASM. In addition to informa-tion on employment, payroll, and other items normally requested on the regular censusform, establishments in the ASM sample were requested to supply additional informationon gross book value of assets and capital expenditures. ASM establishments were alsorequested to provide information on retirements, depreciation, rental payments, andsupplemental labor costs. For establishments not included in the ASM, these additionalitems were estimated using relationships observed in the ASM establishment data. The cen-sus statistics for these variables are a sum of the ASM establishment data and the esti-mated data for non-ASM establishments. ASM establishments were also requested to pro-vide information for selected purchased services. The census statistics for the purchasedservice items were derived solely from the ASM establishments. See Appendix A. Explana-tion of Terms, for an explanation of these items. The census part of the report form is 1 of220 versions containing product, material, and special inquiries. The diversity of manufac-turing activities necessitated the use of this many forms to canvass the 473 manufacturingindustries. Each form was developed for a group of related industries.
Appearing on each form was a list of products primary to the group of related industries,as well as secondary products and miscellaneous services that establishments classified inthese industries were likely to perform. Respondents were requested to identify the prod-ucts, the value of each product, and, in certain cases, the quantity of the product shippedduring the survey year. Space also was provided for the respondent to describe productsnot specifically identified on the form.
The report form also contained a materials-consumed inquiry, which varied from form toform depending on the industries being canvassed. The respondents were asked to reviewa list of materials generally used in their production processes. From this list, each estab-lishment was requested to identify those materials consumed during the survey year, thecost of each, and, in certain cases, the quantity consumed. Once again, space was provided
Appendix C C–1Manufacturing
U.S. Census Bureau, 2002 Economic Census
for the respondent to describe significant materials not listed on the form.
A wide variety of special inquiries were included to measure activities peculiar to a givenindustry, such as operations performed and equipment used.
b. Large and medium establishments (non-ASM). Approximately 30 percent of all manufactur-ing establishments were included in this group. A variable cutoff, based on administrative-record payroll data and determined on an industry-by-industry basis, was used to selectthose establishments that were to receive 1 of the 220 economic census — manufacturingregular forms. The first page, requesting establishment data for items such as employmentand payroll, was standard but did not contain the detailed statistics included on the ASMform. The product, material, and special inquiry sections supplied were based on the his-torical industry classification of the establishment.
c. Small single-establishment companies (non-ASM). This group includes approximately 15percent of all manufacturing establishments. For those industries where application of thevariable cutoff for administrative-record cases resulted in a large number of small establish-ments being included in the mail canvass, an abbreviated “short form” was used. Theseestablishments received 1 of the 31 versions of the short form, which requested summaryproduct and material data and totals but no details on employment, payroll, cost of materi-als, inventories, and capital expenditures.
Use of the short form has no adverse effect on published totals for the industry statistics,because the same data were collected on the short form as on the long form. However,detailed information on products and materials consumed was not collected on the shortform; thus, its use would increase the value of the “not specified by kind” (nsk) categories.
2. Establishments not sent a report form:
a. Small single-establishment companies not sent a report form. Approximately 40 percent ofthe manufacturing establishments were small single-establishment companies that wereexcused from filing a census report. Selection of these establishments was based on twofactors: annual payroll and the Census Bureau’s ability to assign the correct six-digit NAICSindustry classification to the establishment. For each six-digit NAICS industry code, anannual payroll cutoff was determined. These cutoffs were derived so that the establish-ments with payroll less than the cutoff were expected to account for no more than 3 per-cent of the value of shipments for the industry. Generally, all single-establishment compa-nies with less than 5 employees were excused, while all establishments with more than 20employees were mailed forms. Establishments below the cutoff that could not be directlyassigned a six-digit NAICS code were mailed a classification report that requested informa-tion for assigning NAICS industry codes. Establishments below the cutoff that could bedirectly assigned a six-digit NAICS code were excused from filing any report. For below cut-off establishments, information on the physical location, payroll, and receipts was obtainedfrom the administrative records of other federal agencies under special arrangements thatsafeguarded their confidentiality.
Estimates of data for these small establishments were developed using industry averagesin conjunction with the administrative information. The value of shipments and cost ofmaterials were not distributed among specific products and materials for these establish-ments, but were included in the product and material “not specified by kind” (nsk) catego-ries.
The industry classification codes included in the administrative-record files were assignedon the basis of brief descriptions of the general activity of the establishment. As a result,an indeterminate number of establishments were erroneously coded to a six-digit NAICSindustry. This was especially true whenever there was a relatively fine line of demarcationbetween industries or between manufacturing and nonmanufacturing activity.
Sometimes the administrative-record cases had only two- or three-digit NAICS group classi-fication codes available in the files. For manufacturing, these establishments were sent a
C–2 Appendix C Manufacturing
U.S. Census Bureau, 2002 Economic Census
separate classification form, which requested information on the products and services ofthe establishment. This form was used to code many of these establishments to the appro-priate six-digit NAICS level. Establishments that did not return the classification form werecoded later to those six-digit NAICS industries identified as “All other” industries within thegiven subsector.
As a result of these situations, a number of small establishments may have been misclassi-fied by industry. However, such possible misclassification has no significant effect on thestatistics, other than on the number of companies and establishments.
The total establishment count for individual industries should be viewed as an approxima-tion rather than a precise measurement. The counts for establishments with 20 employeesor more are far more reliable than the count of total number of establishments.
b. All nonemployers, i.e., all firms subject to federal income tax, with no paid employees, dur-ing 2002 are excluded as in previous censuses. Data for nonemployers are not included inthis report, but are released in the annual Nonemployer Statistics series.
The report forms used to collect information for establishments in this sector are available athelp.econ.census.gov/econhelp/resources/.
A more detailed examination of census methodology is presented in the History of the EconomicCensus at www.census.gov/econ/www/history.html.
INDUSTRY CLASSIFICATION OF ESTABLISHMENTS
The classifications for all establishments covered in the 2002 Economic Census — Manufacturingare classified in 1 of 473 industries in accordance with the industry definitions in the North Ameri-can Industry Classification System (NAICS), United States, 2002 manual. There were no changesbetween the 2002 edition and the 1997 edition affecting this sector. When applicable, Appendix Fof this report shows the product class and product comparability between the two systems fordata in this report.
In the NAICS system, an industry is generally defined as a group of establishments that have simi-lar production processes. To the extent practical, the system uses supply-based or production-oriented concepts in defining industries. The resulting group of establishments must be signifi-cant in terms of number, value added by manufacture, value of shipments, and number ofemployees.
The coding system works in such a way that the definitions progressively become narrower withsuccessive additions of numerical digits. In the manufacturing sector for 2002, there are 21 sub-sectors (three-digit NAICS), 86 industry groups (four-digit NAICS), 184 NAICS industries (five-digitNAICS) that are comparable with Canadian and Mexican classification, and 473 U.S. industries (six-digit NAICS). Product classes and products of the manufacturing industries have been assignedcodes based on the industry from which they originate. There are 1,450 product classes (seven-digit codes), 5,674 census products, and an additional 3,746 ten-digit product codes. The ten-digit products are considered the primary products of the industry with the same first six digits.
For the 2002 Economic Census — Manufacturing, all establishments were classified in particularindustries based on the products they produced. If an establishment made products of more thanone industry, it was classified in the industry with the largest product value. For 2002, there wereno “resistance rules” or “frozen industries.”
In ASM years, establishments included in the ASM sample with certainty weights are reclassifiedby industry only if the change in the primary activity from the prior year is significant or if thechange has occurred for 2 successive years. This procedure prevents reclassification when thereare minor shifts in product mix.
In ASM years, establishments included in the ASM sample with noncertainty weight are not shiftedfrom one industry classification to another. They are retained in the industry where they were clas-sified in the base census year. However, in the following census year, these ASM plants areallowed to shift from one industry to another.
Appendix C C–3Manufacturing
U.S. Census Bureau, 2002 Economic Census
The results of these rules covering the switching of plants from one industry classification toanother are that some industries comprise different mixes of establishments in different surveyyears. Hence, comparisons between prior-year and current-year published totals, particularly atthe six-digit NAICS level, should be viewed with caution. This is particularly true for the compari-son between the data shown for a census year versus the data shown for the previous ASM year.
As previously noted, the small establishments that may have been misclassified by industry areusually administrative-record cases whose industry codes were assigned on the basis of incom-plete descriptions of the general activity of the establishment. Such possible misclassificationshave no significant effect on the statistics other than on the number of companies and establish-ments.
Establishments frequently make products classified both in their industry (primary products) andother industries (secondary products). Industry statistics (employment, payroll, value added bymanufacture, value of shipments, etc.) reflect the activities of the establishments that may makeboth primary and secondary products. Product statistics, however, represent the output of allestablishments without regard for the classification of the producing establishment. For this rea-son, when relating the industry statistics, especially the value of shipments, to the product statis-tics, the composition of the industry’s output should be considered.
The extent to which industry and product statistics may be matched with each other is measuredby the primary product specialization ratio and the coverage ratio. The primary product special-ization ratio is the proportion of industry shipments accounted for by the primary products ofestablishments classified in the industry. The coverage ratio is the proportion of product ship-ments accounted for by establishments classified in the industry.
ESTABLISHMENT BASIS OF REPORTING
The 2002 Economic Census — Manufacturing is conducted on an establishment basis. A companyoperating at more than one location is required to file a separate report for each location or estab-lishment. The ASM also is conducted on an establishment basis, but separate reports are filed forjust those establishments selected in the sample. Companies engaged in distinctly different linesof activity at one location are requested to submit separate reports, if the plant records permitsuch a separation and if the activities are substantial in size.
In 2002, as in earlier years, a minimum size limit was set for inclusion of establishments in thecensus. All establishments employing one person or more at any time during the census year areincluded. The same size limitation has applied since 1947 in censuses and annual surveys ofmanufactures. In the 1939 and earlier censuses, establishments with less than $5,000 value ofproducts were excluded. The change in the minimum size limit in 1947 does not appreciablyaffect the historical comparability of the census figures, except for data on number of establish-ments for a few industries.
The 2002 Economic Census — Manufacturing excludes data for central administrative offices(CAOs). These would include separately operated administrative offices, warehouses, garages, andother auxiliary units that service manufacturing establishments of the same company. These dataare published in a separate report series.
DESCRIPTION OF THE ASM SURVEY SAMPLE
The ASM sample is drawn for the second survey year after a census. The most recent sample wasdrawn for the 1999 survey year based on the 1997 Economic Census — Manufacturing. Thissample will be in place through the 2003 ASM.
In 1997, there were approximately 370,000 individual manufacturing establishments. For sampleefficiency and cost considerations, the establishments in the 1997 manufacturing population werepartitioned into two components for developing estimates within the ASM. The details of each aredescribed below:
1. Mail stratum. The mail stratum of the survey is comprised of larger single-location manufac-turing companies and all manufacturing establishments of multiunit companies (companies
C–4 Appendix C Manufacturing
U.S. Census Bureau, 2002 Economic Census
that operate at more than one physical location). Approximately 200,000 of the 370,000establishments in the 1997 census were assigned to the mail stratum. On an annual basis, themail stratum is supplemented with larger, newly active single-location companies identifiedfrom a list provided by the Internal Revenue Service (IRS) and new manufacturing locations ofmultiunit companies identified from the Census Bureau’s Company Organization Survey (COS).
For the 1999 survey, a new sample of approximately 58,000 individual establishments wasselected from the mail stratum assembled from the 1997 census. Supplemental samples rep-resenting both 1998 and 1999 births (newly active establishments that were not included inthe 1997 census) were also selected. Establishments selected for the sample are mailed anASM survey questionnaire for each year through 2003.
The 1999-2003 ASM sample design is similar to the one used since 1984. Companies in the1997 Economic Census — Manufacturing with manufacturing shipments of at least $500 mil-lion were defined as company certainties. For these large companies, each manufacturingestablishment is included in the mail sample. For the 1999-2003 sample, there are approxi-mately 500 certainty companies collectively accounting for over 18,000 establishments.
For the remaining portion of the mail component of the survey, the establishment was definedas the sample unit. All establishments with 250 employees or more were defined as employ-ment certainties. Across these arbitrary certainty classes, there were approximately 25,000establishments included in the sample with certainty. Collectively, these certainty establish-ments accounted for approximately 80 percent of the total value of shipments in the 1997Economic Census — Manufacturing.
Smaller establishments in the remaining portion of the mail stratum were sampled with prob-abilities ranging from .02 to 1.00. The initial probabilities of selection assigned to theseestablishments were proportionate to a measure-of-size determined for each establishment.The measure-of-size was a function of the establishment’s 1997 industry classification and its1997 product class data. For each product class (1,755) and six-digit industry (473), a desiredreliability constraint was specified. Using a technique developed by Dr. James R. Chromy ofthe Research Triangle Institute, the initial establishment probabilities were optimized suchthat the expected sample satisfied all industry and product class reliability constraints, whilethe sample size was minimized. This technique reduces the likelihood of selecting nonrepre-sentative samples for individual product classes or industries.
This method of assigning probabilities based on product class shipments is motivated by theCensus Bureau’s primary desire to produce reliable estimates of both product class and indus-try shipments. The high correlation between shipments and employment, value-added, andother general statistics assures that these variables will also be well represented by thesample. The actual sample selection procedure uses an independent chance of selectionmethod (Poisson sampling) that permits us to prevent small establishments from beingselected in consecutive samples without introducing a bias into the survey estimates.
2. Nonmail stratum. The initial nonmail component of the survey was comprised of approxi-mately 170,000 small, single-establishment companies that were tabulated as administrativerecords in the 1997 Economic Census — Manufacturing. The nonmail stratum is also supple-mented annually using the list of newly active single-location companies provided by theInternal Revenue Service (IRS) and payroll cutoffs. Companies with payroll below the payrollcutoff are added to the nonmail stratum. For this portion of the population, sampling is notused. The data for this group are estimated based on selected information obtained annuallyfrom the administrative records of the IRS and Social Security Administration (SSA). Thisadministrative information, which includes payroll, total employment, industry classification,and physical location, is obtained under conditions which safeguard the confidentiality ofboth tax and census records.
RELIABILITY OF DATA
All data compiled in the economic census are subject to nonsampling errors. Nonsampling errorscan be attributed to many sources during the development or execution of the census. The follow-ing are two ways that further explain this method: ASM Estimating Procedure. Most of the ASM
Appendix C C–5Manufacturing
U.S. Census Bureau, 2002 Economic Census

estimates derived for the mail stratum are computed using a difference estimator. At the establish-ment level, there is a strong correlation between the current-year data values and the correspond-ing 1997 (base) data values. Therefore, within the mailed stratum, for each item at each level ofaggregation, an estimate of the “difference” between the current year and the base year is com-puted from sample cases and added to the corresponding base-year values. For the 1998-2002ASM estimates, the 1997 Economic Census — Manufacturing values serve as the base year. Forthe 2003 ASM, the base will be updated to be the 2002 Economic Census — Manufacturing.
Due to the positive year-to-year correlation, estimates derived using this methodology are gener-ally more reliable than comparable estimates developed from the current sample data alone. Esti-mates for the capital expenditures variables are not generated using the difference estimatorbecause the year-to-year correlations are considerably weaker. The standard linear estimator isused for these variables.
For the nonmail stratum, estimates for payroll and employment are directly tabulated from theadministrative-record data provided by IRS and SSA. Estimates of data other than payroll andemployment are developed from industry averages. Although the nonmail stratum containedapproximately 170,000 individual establishments in 1999, it accounts for less than 2 percent ofthe estimate for total value of shipments at the total manufacturing level.
Corresponding estimates for the mail and nonmail components are combined to produce the esti-mates included in this publication. ASM Data Qualifications. The estimates developed from thesample are apt to differ somewhat from the results of a survey covering all companies in thesample lists, but otherwise conducted under essentially the same conditions as the actual samplesurvey. The estimates of the magnitude of the sampling errors (the difference between the esti-mates obtained and the results theoretically obtained from a comparable, complete-coverage sur-vey) are provided by the standard errors of estimates.
The particular sample selected for the ASM is one of many similar probability samples that, bychance, might have been selected under the same specifications. Each of the possible sampleswould yield somewhat different sets of results, and the standard errors are measures of the varia-tion of all the possible sample estimates around the theoretically comparable, complete-coveragevalues.
Estimates of the standard errors have been computed from the sample data for selected ASM sta-tistics in this report. They are represented in the form of relative standard errors (the standarderrors divided by the estimated values to which they refer).
In conjunction with its associated estimate, the relative standard error may be used to define con-fidence intervals (ranges that would include the comparable, complete-coverage value for speci-fied percentages of all the possible samples).
The complete-coverage value would be included in the range:
• From one standard error below to one standard error above the derived estimate for about two-thirds of all possible samples.
• From two standard errors below to two standard errors above the derived estimate for about 19out of 20 of all possible samples.
• From three standard errors below to three standard errors above the derived estimate for nearlyall samples.
An inference that the comparable, complete-survey result would be within the indicated rangeswould be correct in approximately the relative frequencies shown. Those proportions, therefore,may be interpreted as defining the confidence that the estimates from a particular sample woulddiffer from complete-coverage results by as much as one, two, or three standard errors, respec-tively.
C–6 Appendix C Manufacturing
U.S. Census Bureau, 2002 Economic Census
For example, suppose an estimated total is shown at 50,000 with an associated relative standarderror of 2 percent, that is, a standard error of 1,000 (2 percent of 50,000). There is approximately67 percent confidence that the interval 49,000 to 51,000 includes the complete-coverage total,about 95 percent confidence that the interval 48,000 to 52,000 includes the complete-coveragetotal, and almost certain confidence that the interval 47,000 to 53,000 includes the complete-coverage total.
In addition to the sample errors, the estimates are subject to various response and operationalerrors: errors of collection, reporting, coding, transcription, imputation for nonresponse, etc.These operational errors also would occur if a complete canvass were to be conducted under thesame conditions as the survey. Explicit measures of their effects generally are not available. How-ever, it is believed that most of the important operational errors were detected and corrected dur-ing the Census Bureau’s review of the data for reasonableness and consistency. The small opera-tional errors usually remain. To some extent, they are compensating in the aggregated totalsshown. When important operational errors were detected too late to correct the estimates, thedata were suppressed or were specifically qualified in the tables.
As derived, the estimated standard errors included part of the effect of the operational errors. Thetotal errors, which depend upon the joint effect of the sampling and operational errors, are usu-ally of the order of size indicated by the standard error, or moderately higher. However, for par-ticular estimates, the total error may considerably exceed the standard errors shown. Any figuresshown in the tables in this publication having an associated standard error exceeding 15 percentmay be combined with higher level totals, creating a broader aggregate, which then may be ofacceptable reliability.
DUPLICATION IN COST OF MATERIALS AND VALUE OF SHIPMENTS
Data for cost of materials and value of shipments include varying amounts of duplication, espe-cially at higher levels of aggregation. This is because the products of one establishment may bethe materials of another. The value added statistics avoid this duplication and are, for most pur-poses, the best measure for comparing the relative economic importance of industries and geo-graphic areas.
VALUE OF INDUSTRY SHIPMENTS COMPARED WITH VALUE OF PRODUCT SHIPMENTS
The 2002 Economic Census — Manufacturing shows value of shipments data for industries andproducts. In the industry statistics tables and files, these data represent the total value of ship-ments of all establishments classified in a particular industry. The data include the shipments ofthe products classified in the industry (primary to the industry), products classified in other indus-tries (secondary to the industry), and miscellaneous receipts (repair work, sale of scrap, researchand development, installation receipts, and resales). Value of product shipments shown in theproducts statistics tables and files represent the total value of all products shipped that are classi-fied as primary to an industry regardless of the classification of the producing establishment.
DISCLOSURE
In accordance with federal law governing census reports (Title 13 of the United States Code), nodata are published that would disclose the operations of an individual establishment or company.However, the number of establishments in a specific industry or geographic area is not considereda disclosure; therefore, this information may be released even though other information is with-held. Techniques employed to limit disclosure are discussed atwww.census.gov/epcd/ec02/disclosure.htm.
The disclosure analysis for the industry statistics files is based on the total value of shipments.When the total value of shipments cannot be shown without disclosing information for individualcompanies, the complete line is suppressed except for capital expenditures. Nonetheless, the sup-pressed data are included in higher-level totals. A separate disclosure analysis is performed forcapital expenditures, which can be suppressed even though value of shipments data are pub-lished.
Appendix C C–7Manufacturing
U.S. Census Bureau, 2002 Economic Census

Appendix D.Geographic Notes
Not applicable for this report.
Appendix D D–12002 Economic Census
U.S. Census Bureau, 2002 Economic Census

Appendix E.Metropolitan Areas and MicropolitanStatistical Areas
Not applicable for this report.
Appendix E E–12002 Economic Census
U.S. Census Bureau, 2002 Economic Census
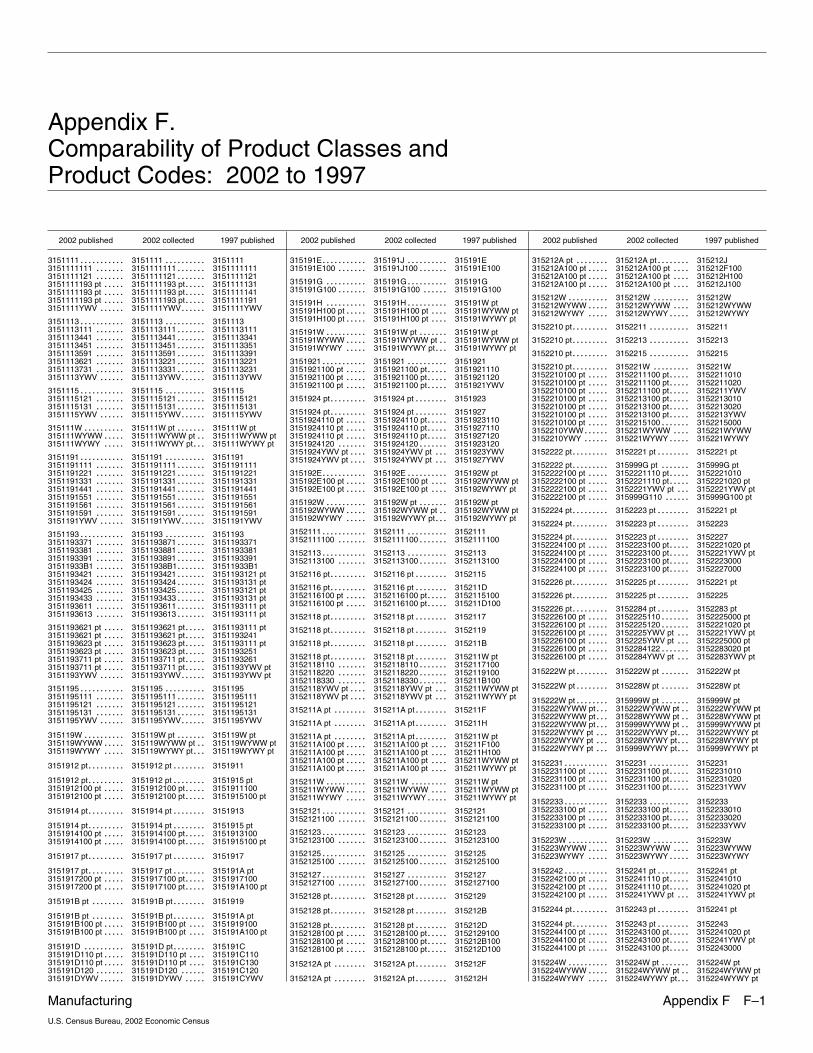
Appendix F.Comparability of Product Classes andProduct Codes: 2002 to 1997
2002 published 2002 collected 1997 published
3151111 3151111����������� 3151111����������
3151111111 3151111111������� 3151111111�������
3151111121 3151111121������� 3151111121�������
3151111193 pt 3151111193 pt����� 3151111131�����
3151111193 pt 3151111193 pt����� 3151111141�����
3151111193 pt 3151111193 pt����� 3151111191�����
3151111YWV 3151111YWV������ 3151111YWV������
3151113 3151113����������� 3151113����������
3151113111 3151113111������� 3151113111�������
3151113441 3151113441������� 3151113341�������
3151113451 3151113451������� 3151113351�������
3151113591 3151113591������� 3151113391�������
3151113621 3151113221������� 3151113221�������
3151113731 3151113331������� 3151113231�������
3151113YWV 3151113YWV������ 3151113YWV������
3151115 3151115����������� 3151115����������
3151115121 3151115121������� 3151115121�������
3151115131 3151115131������� 3151115131�������
3151115YWV 3151115YWV������ 3151115YWV������
315111W 315111W pt���������� 315111W pt�������
315111WYWW 315111WYWW pt����� 315111WYWW pt��
315111WYWY 315111WYWY pt����� 315111WYWY pt���
3151191 3151191����������� 3151191����������
3151191111 3151191111������� 3151191111�������
3151191221 3151191221������� 3151191221�������
3151191331 3151191331������� 3151191331�������
3151191441 3151191441������� 3151191441�������
3151191551 3151191551������� 3151191551�������
3151191561 3151191561������� 3151191561�������
3151191591 3151191591������� 3151191591�������
3151191YWV 3151191YWV������ 3151191YWV������
3151193 3151193����������� 3151193����������
3151193371 3151193871������� 3151193371�������
3151193381 3151193881������� 3151193381�������
3151193391 3151193891������� 3151193391�������
31511933B1 31511938B1������� 31511933B1�������
3151193421 3151193421������� 3151193121 pt�������
3151193424 3151193424������� 3151193131 pt�������
3151193425 3151193425������� 3151193121 pt�������
3151193433 3151193433������� 3151193131 pt�������
3151193611 3151193611������� 3151193111 pt�������
3151193613 3151193613������� 3151193111 pt�������
3151193621 pt 3151193621 pt����� 3151193111 pt�����
3151193621 pt 3151193621 pt����� 3151193241�����
3151193623 pt 3151193623 pt����� 3151193111 pt�����
3151193623 pt 3151193623 pt����� 3151193251�����
3151193711 pt 3151193711 pt����� 3151193261�����
3151193711 pt 3151193711 pt����� 3151193YWV pt�����
3151193YWV 3151193YWV������ 3151193YWV pt������
3151195 3151195����������� 3151195����������
3151195111 3151195111������� 3151195111�������
3151195121 3151195121������� 3151195121�������
3151195131 3151195131������� 3151195131�������
3151195YWV 3151195YWV������ 3151195YWV������
315119W 315119W pt���������� 315119W pt�������
315119WYWW 315119WYWW pt����� 315119WYWW pt��
315119WYWY 315119WYWY pt����� 315119WYWY pt���
3151912 pt 3151912 pt��������� 3151911��������
3151912 pt 3151912 pt��������� 3151915 pt��������
3151912100 pt 3151912100 pt����� 3151911100�����
3151912100 pt 3151912100 pt����� 3151915100 pt�����
3151914 pt 3151914 pt��������� 3151913��������
3151914 pt 3151914 pt��������� 3151915 pt��������
3151914100 pt 3151914100 pt����� 3151913100�����
3151914100 pt 3151914100 pt����� 3151915100 pt�����
3151917 pt 3151917 pt��������� 3151917��������
3151917 pt 3151917 pt��������� 315191A pt��������
3151917200 pt 3151917100 pt����� 3151917100�����
3151917200 pt 3151917100 pt����� 315191A100 pt�����
315191B pt 315191B pt�������� 3151919��������
315191B pt 315191B pt�������� 315191A pt��������
315191B100 pt 315191B100 pt����� 3151919100����
315191B100 pt 315191B100 pt����� 315191A100 pt����
315191D 315191D pt���������� 315191C��������
315191D110 pt 315191D110 pt����� 315191C110����
315191D110 pt 315191D110 pt����� 315191C130����
315191D120 315191D120������� 315191C120������
315191DYWV 315191DYWV������ 315191CYWV�����
2002 published 2002 collected 1997 published
315191E 315191J����������� 315191E����������
315191E100 315191J100������� 315191E100�������
315191G 315191G���������� 315191G����������
315191G100 315191G100������� 315191G100������
315191H 315191H���������� 315191W pt����������
315191H100 pt 315191H100 pt����� 315191WYWW pt����
315191H100 pt 315191H100 pt����� 315191WYWY pt����
315191W 315191W pt���������� 315191W pt�������
315191WYWW 315191WYWW pt����� 315191WYWW pt��
315191WYWY 315191WYWY pt����� 315191WYWY pt���
3151921 3151921����������� 3151921����������
3151921100 pt 3151921100 pt����� 3151921110�����
3151921100 pt 3151921100 pt����� 3151921120�����
3151921100 pt 3151921100 pt����� 3151921YWV�����
3151924 pt 3151924 pt��������� 3151923��������
3151924 pt 3151924 pt��������� 3151927��������
3151924110 pt 3151924110 pt����� 3151923110�����
3151924110 pt 3151924110 pt����� 3151927110�����
3151924110 pt 3151924110 pt����� 3151927120�����
3151924120 3151924120������� 3151923120�������
3151924YWV pt 3151924YWV pt���� 3151923YWV���
3151924YWV pt 3151924YWV pt���� 3151927YWV���
315192E 315192E����������� 315192W pt����������
315192E100 pt 315192E100 pt����� 315192WYWW pt����
315192E100 pt 315192E100 pt����� 315192WYWY pt����
315192W 315192W pt���������� 315192W pt�������
315192WYWW 315192WYWW pt����� 315192WYWW pt��
315192WYWY 315192WYWY pt����� 315192WYWY pt���
3152111 3152111����������� 3152111����������
3152111100 3152111100������� 3152111100�������
3152113 3152113����������� 3152113����������
3152113100 3152113100������� 3152113100�������
3152116 pt 3152116 pt��������� 3152115��������
3152116 pt 3152116 pt��������� 315211D��������
3152116100 pt 3152116100 pt����� 3152115100�����
3152116100 pt 3152116100 pt����� 315211D100�����
3152118 pt 3152118 pt��������� 3152117��������
3152118 pt 3152118 pt��������� 3152119��������
3152118 pt 3152118 pt��������� 315211B��������
3152118 pt 3152118 pt��������� 315211W pt��������
3152118110 3152118110������� 3152117100�������
3152118220 3152118220������� 3152119100�������
3152118330 3152118330������� 315211B100�������
3152118YWV pt 3152118YWV pt���� 315211WYWW pt���
3152118YWV pt 3152118YWV pt���� 315211WYWY pt���
315211A pt 315211A pt�������� 315211F��������
315211A pt 315211A pt�������� 315211H��������
315211A pt 315211A pt�������� 315211W pt��������
315211A100 pt 315211A100 pt����� 315211F100����
315211A100 pt 315211A100 pt����� 315211H100����
315211A100 pt 315211A100 pt����� 315211WYWW pt����
315211A100 pt 315211A100 pt����� 315211WYWY pt����
315211W 315211W���������� 315211W pt���������
315211WYWW 315211WYWW����� 315211WYWW pt����
315211WYWY 315211WYWY����� 315211WYWY pt�����
3152121 3152121����������� 3152121����������
3152121100 3152121100������� 3152121100�������
3152123 3152123����������� 3152123����������
3152123100 3152123100������� 3152123100�������
3152125 3152125����������� 3152125����������
3152125100 3152125100������� 3152125100�������
3152127 3152127����������� 3152127����������
3152127100 3152127100������� 3152127100�������
3152128 pt 3152128 pt��������� 3152129��������
3152128 pt 3152128 pt��������� 315212B��������
3152128 pt 3152128 pt��������� 315212D��������
3152128100 pt 3152128100 pt����� 3152129100�����
3152128100 pt 3152128100 pt����� 315212B100�����
3152128100 pt 3152128100 pt����� 315212D100�����
315212A pt 315212A pt�������� 315212F��������
315212A pt 315212A pt�������� 315212H��������
2002 published 2002 collected 1997 published
315212A pt 315212A pt�������� 315212J��������
315212A100 pt 315212A100 pt����� 315212F100����
315212A100 pt 315212A100 pt����� 315212H100����
315212A100 pt 315212A100 pt����� 315212J100����
315212W 315212W���������� 315212W���������
315212WYWW 315212WYWW����� 315212WYWW����
315212WYWY 315212WYWY����� 315212WYWY�����
3152210 pt 3152211��������� 3152211����������
3152210 pt 3152213��������� 3152213����������
3152210 pt 3152215��������� 3152215����������
3152210 pt 315221W��������� 315221W���������
3152210100 pt 3152211100 pt����� 3152211010�����
3152210100 pt 3152211100 pt����� 3152211020�����
3152210100 pt 3152211100 pt����� 3152211YWV�����
3152210100 pt 3152213100 pt����� 3152213010�����
3152210100 pt 3152213100 pt����� 3152213020�����
3152210100 pt 3152213100 pt����� 3152213YWV�����
3152210100 pt 3152215100����� 3152215000�������
3152210YWW 315221WYWW������ 315221WYWW����
3152210YWY 315221WYWY������ 315221WYWY�����
3152222 pt 3152221 pt��������� 3152221 pt��������
3152222 pt 315999G pt��������� 315999G pt�������
3152222100 pt 3152221110 pt����� 3152221010�����
3152222100 pt 3152221110 pt����� 3152221020 pt�����
3152222100 pt 3152221YWV pt����� 3152221YWV pt���
3152222100 pt 315999G110����� 315999G100 pt������
3152224 pt 3152223 pt��������� 3152221 pt��������
3152224 pt 3152223 pt��������� 3152223��������
3152224 pt 3152223 pt��������� 3152227��������
3152224100 pt 3152223100 pt����� 3152221020 pt�����
3152224100 pt 3152223100 pt����� 3152221YWV pt�����
3152224100 pt 3152223100 pt����� 3152223000�����
3152224100 pt 3152223100 pt����� 3152227000�����
3152226 pt 3152225 pt��������� 3152221 pt��������
3152226 pt 3152225 pt��������� 3152225��������
3152226 pt 3152284 pt��������� 3152283 pt��������
3152226100 pt 3152225110����� 3152225000 pt�������
3152226100 pt 3152225120����� 3152221020 pt�������
3152226100 pt 3152225YWV pt����� 3152221YWV pt���
3152226100 pt 3152225YWV pt����� 3152225000 pt���
3152226100 pt 3152284122����� 3152283020 pt�������
3152226100 pt 3152284YWV pt����� 3152283YWV pt���
315222W pt 315222W pt�������� 315222W pt�������
315222W pt 315228W pt�������� 315228W pt�������
315222W pt 315999W pt�������� 315999W pt�������
315222WYWW pt 315222WYWW pt��� 315222WYWW pt��
315222WYWW pt 315228WYWW pt��� 315228WYWW pt��
315222WYWW pt 315999WYWW pt��� 315999WYWW pt��
315222WYWY pt 315222WYWY pt��� 315222WYWY pt���
315222WYWY pt 315228WYWY pt��� 315228WYWY pt���
315222WYWY pt 315999WYWY pt��� 315999WYWY pt���
3152231 3152231����������� 3152231����������
3152231100 pt 3152231100 pt����� 3152231010�����
3152231100 pt 3152231100 pt����� 3152231020�����
3152231100 pt 3152231100 pt����� 3152231YWV�����
3152233 3152233����������� 3152233����������
3152233100 pt 3152233100 pt����� 3152233010�����
3152233100 pt 3152233100 pt����� 3152233020�����
3152233100 pt 3152233100 pt����� 3152233YWV�����
315223W 315223W���������� 315223W���������
315223WYWW 315223WYWW����� 315223WYWW����
315223WYWY 315223WYWY����� 315223WYWY�����
3152242 3152241 pt����������� 3152241 pt��������
3152242100 pt 3152241110 pt����� 3152241010�����
3152242100 pt 3152241110 pt����� 3152241020 pt�����
3152242100 pt 3152241YWV pt����� 3152241YWV pt���
3152244 pt 3152243 pt��������� 3152241 pt��������
3152244 pt 3152243 pt��������� 3152243��������
3152244100 pt 3152243100 pt����� 3152241020 pt�����
3152244100 pt 3152243100 pt����� 3152241YWV pt�����
3152244100 pt 3152243100 pt����� 3152243000�����
315224W 315224W pt���������� 315224W pt�������
315224WYWW 315224WYWW pt����� 315224WYWW pt��
315224WYWY 315224WYWY pt����� 315224WYWY pt���
Manufacturing Appendix F F–1U.S. Census Bureau, 2002 Economic Census
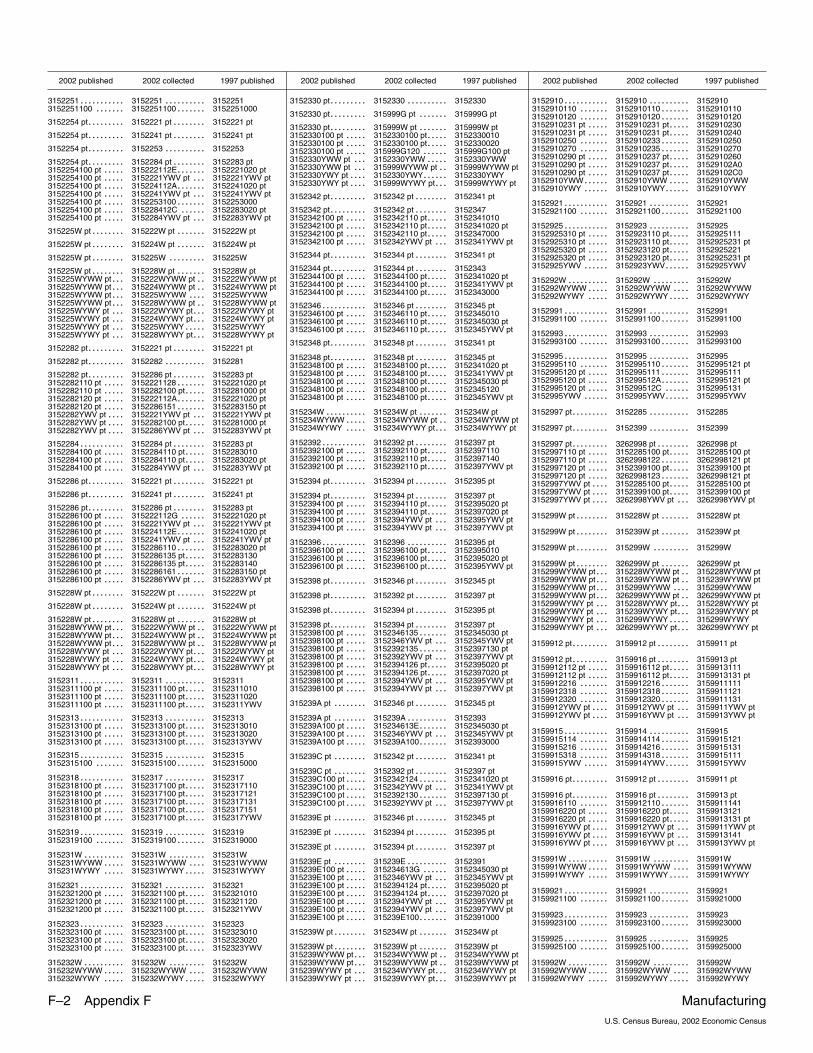
2002 published 2002 collected 1997 published
3152251 3152251����������� 3152251����������
3152251100 3152251100������� 3152251000�������
3152254 pt 3152221 pt��������� 3152221 pt��������
3152254 pt 3152241 pt��������� 3152241 pt��������
3152254 pt 3152253��������� 3152253����������
3152254 pt 3152284 pt��������� 3152283 pt��������
3152254100 pt 315222112E����� 3152221020 pt�������
3152254100 pt 3152221YWV pt����� 3152221YWV pt���
3152254100 pt 315224112A����� 3152241020 pt�������
3152254100 pt 3152241YWV pt����� 3152241YWV pt���
3152254100 pt 3152253100����� 3152253000�������
3152254100 pt 315228412C����� 3152283020 pt������
3152254100 pt 3152284YWV pt����� 3152283YWV pt���
315225W pt 315222W pt�������� 315222W pt�������
315225W pt 315224W pt�������� 315224W pt�������
315225W pt 315225W�������� 315225W���������
315225W pt 315228W pt�������� 315228W pt�������
315225WYWW pt 315222WYWW pt��� 315222WYWW pt��
315225WYWW pt 315224WYWW pt��� 315224WYWW pt��
315225WYWW pt 315225WYWW��� 315225WYWW����
315225WYWW pt 315228WYWW pt��� 315228WYWW pt��
315225WYWY pt 315222WYWY pt��� 315222WYWY pt���
315225WYWY pt 315224WYWY pt��� 315224WYWY pt���
315225WYWY pt 315225WYWY��� 315225WYWY�����
315225WYWY pt 315228WYWY pt��� 315228WYWY pt���
3152282 pt 3152221 pt��������� 3152221 pt��������
3152282 pt 3152282��������� 3152281����������
3152282 pt 3152286 pt��������� 3152283 pt��������
3152282110 pt 3152221128����� 3152221020 pt�������
3152282110 pt 3152282100 pt����� 3152281000 pt�����
3152282120 pt 315222112A����� 3152221020 pt�������
3152282120 pt 3152286151����� 3152283150 pt�������
3152282YWV pt 3152221YWV pt���� 3152221YWV pt���
3152282YWV pt 3152282100 pt���� 3152281000 pt�����
3152282YWV pt 3152286YWV pt���� 3152283YWV pt���
3152284 3152284 pt����������� 3152283 pt��������
3152284100 pt 3152284110 pt����� 3152283010�����
3152284100 pt 3152284110 pt����� 3152283020 pt�����
3152284100 pt 3152284YWV pt����� 3152283YWV pt���
3152286 pt 3152221 pt��������� 3152221 pt��������
3152286 pt 3152241 pt��������� 3152241 pt��������
3152286 pt 3152286 pt��������� 3152283 pt��������
3152286100 pt 315222112G����� 3152221020 pt������
3152286100 pt 3152221YWV pt����� 3152221YWV pt���
3152286100 pt 315224112E����� 3152241020 pt�������
3152286100 pt 3152241YWV pt����� 3152241YWV pt���
3152286100 pt 3152286110����� 3152283020 pt�������
3152286100 pt 3152286135 pt����� 3152283130�����
3152286100 pt 3152286135 pt����� 3152283140�����
3152286100 pt 3152286161����� 3152283150 pt�������
3152286100 pt 3152286YWV pt����� 3152283YWV pt���
315228W pt 315222W pt�������� 315222W pt�������
315228W pt 315224W pt�������� 315224W pt�������
315228W pt 315228W pt�������� 315228W pt�������
315228WYWW pt 315222WYWW pt��� 315222WYWW pt��
315228WYWW pt 315224WYWW pt��� 315224WYWW pt��
315228WYWW pt 315228WYWW pt��� 315228WYWW pt��
315228WYWY pt 315222WYWY pt��� 315222WYWY pt���
315228WYWY pt 315224WYWY pt��� 315224WYWY pt���
315228WYWY pt 315228WYWY pt��� 315228WYWY pt���
3152311 3152311����������� 3152311����������
3152311100 pt 3152311100 pt����� 3152311010�����
3152311100 pt 3152311100 pt����� 3152311020�����
3152311100 pt 3152311100 pt����� 3152311YWV�����
3152313 3152313����������� 3152313����������
3152313100 pt 3152313100 pt����� 3152313010�����
3152313100 pt 3152313100 pt����� 3152313020�����
3152313100 pt 3152313100 pt����� 3152313YWV�����
3152315 3152315����������� 3152315����������
3152315100 3152315100������� 3152315000�������
3152318 3152317����������� 3152317����������
3152318100 pt 3152317100 pt����� 3152317110�����
3152318100 pt 3152317100 pt����� 3152317121�����
3152318100 pt 3152317100 pt����� 3152317131�����
3152318100 pt 3152317100 pt����� 3152317151�����
3152318100 pt 3152317100 pt����� 3152317YWV�����
3152319 3152319����������� 3152319����������
3152319100 3152319100������� 3152319000�������
315231W 315231W���������� 315231W���������
315231WYWW 315231WYWW����� 315231WYWW����
315231WYWY 315231WYWY����� 315231WYWY�����
3152321 3152321����������� 3152321����������
3152321200 pt 3152321100 pt����� 3152321010�����
3152321200 pt 3152321100 pt����� 3152321120�����
3152321200 pt 3152321100 pt����� 3152321YWV�����
3152323 3152323����������� 3152323����������
3152323100 pt 3152323100 pt����� 3152323010�����
3152323100 pt 3152323100 pt����� 3152323020�����
3152323100 pt 3152323100 pt����� 3152323YWV�����
315232W 315232W���������� 315232W���������
315232WYWW 315232WYWW����� 315232WYWW����
315232WYWY 315232WYWY����� 315232WYWY�����
2002 published 2002 collected 1997 published
3152330 pt 3152330��������� 3152330����������
3152330 pt 315999G pt��������� 315999G pt�������
3152330 pt 315999W pt��������� 315999W pt�������
3152330100 pt 3152330100 pt����� 3152330010�����
3152330100 pt 3152330100 pt����� 3152330020�����
3152330100 pt 315999G120����� 315999G100 pt������
3152330YWW pt 3152330YWW��� 3152330YWW�����
3152330YWW pt 315999WYWW pt��� 315999WYWW pt��
3152330YWY pt 3152330YWY���� 3152330YWY������
3152330YWY pt 315999WYWY pt���� 315999WYWY pt���
3152342 pt 3152342 pt��������� 3152341 pt��������
3152342 pt 3152342 pt��������� 3152347��������
3152342100 pt 3152342110 pt����� 3152341010�����
3152342100 pt 3152342110 pt����� 3152341020 pt�����
3152342100 pt 3152342110 pt����� 3152347000�����
3152342100 pt 3152342YWV pt����� 3152341YWV pt���
3152344 pt 3152344 pt��������� 3152341 pt��������
3152344 pt 3152344 pt��������� 3152343��������
3152344100 pt 3152344100 pt����� 3152341020 pt�����
3152344100 pt 3152344100 pt����� 3152341YWV pt�����
3152344100 pt 3152344100 pt����� 3152343000�����
3152346 3152346 pt����������� 3152345 pt��������
3152346100 pt 3152346110 pt����� 3152345010�����
3152346100 pt 3152346110 pt����� 3152345030 pt�����
3152346100 pt 3152346110 pt����� 3152345YWV pt�����
3152348 pt 3152348 pt��������� 3152341 pt��������
3152348 pt 3152348 pt��������� 3152345 pt��������
3152348100 pt 3152348100 pt����� 3152341020 pt�����
3152348100 pt 3152348100 pt����� 3152341YWV pt�����
3152348100 pt 3152348100 pt����� 3152345030 pt�����
3152348100 pt 3152348100 pt����� 3152345120�����
3152348100 pt 3152348100 pt����� 3152345YWV pt�����
315234W 315234W pt���������� 315234W pt�������
315234WYWW 315234WYWW pt����� 315234WYWW pt��
315234WYWY 315234WYWY pt����� 315234WYWY pt���
3152392 3152392 pt����������� 3152397 pt��������
3152392100 pt 3152392110 pt����� 3152397110�����
3152392100 pt 3152392110 pt����� 3152397140�����
3152392100 pt 3152392110 pt����� 3152397YWV pt�����
3152394 pt 3152394 pt��������� 3152395 pt��������
3152394 pt 3152394 pt��������� 3152397 pt��������
3152394100 pt 3152394110 pt����� 3152395020 pt�����
3152394100 pt 3152394110 pt����� 3152397020 pt�����
3152394100 pt 3152394YWV pt����� 3152395YWV pt���
3152394100 pt 3152394YWV pt����� 3152397YWV pt���
3152396 3152396����������� 3152395 pt����������
3152396100 pt 3152396100 pt����� 3152395010�����
3152396100 pt 3152396100 pt����� 3152395020 pt�����
3152396100 pt 3152396100 pt����� 3152395YWV pt�����
3152398 pt 3152346 pt��������� 3152345 pt��������
3152398 pt 3152392 pt��������� 3152397 pt��������
3152398 pt 3152394 pt��������� 3152395 pt��������
3152398 pt 3152394 pt��������� 3152397 pt��������
3152398100 pt 3152346135����� 3152345030 pt�������
3152398100 pt 3152346YWV pt����� 3152345YWV pt���
3152398100 pt 3152392135����� 3152397130 pt�������
3152398100 pt 3152392YWV pt����� 3152397YWV pt���
3152398100 pt 3152394126 pt����� 3152395020 pt�����
3152398100 pt 3152394126 pt����� 3152397020 pt�����
3152398100 pt 3152394YWV pt����� 3152395YWV pt���
3152398100 pt 3152394YWV pt����� 3152397YWV pt���
315239A pt 3152346 pt�������� 3152345 pt��������
315239A pt 315239A�������� 3152393����������
315239A100 pt 315234613E����� 3152345030 pt�������
315239A100 pt 3152346YWV pt����� 3152345YWV pt���
315239A100 pt 315239A100����� 3152393000�������
315239C pt 3152342 pt�������� 3152341 pt��������
315239C pt 3152392 pt�������� 3152397 pt��������
315239C100 pt 3152342124����� 3152341020 pt�������
315239C100 pt 3152342YWV pt����� 3152341YWV pt���
315239C100 pt 3152392130����� 3152397130 pt�������
315239C100 pt 3152392YWV pt����� 3152397YWV pt���
315239E pt 3152346 pt�������� 3152345 pt��������
315239E pt 3152394 pt�������� 3152395 pt��������
315239E pt 3152394 pt�������� 3152397 pt��������
315239E pt 315239E�������� 3152391����������
315239E100 pt 315234613G����� 3152345030 pt������
315239E100 pt 3152346YWV pt����� 3152345YWV pt���
315239E100 pt 3152394124 pt����� 3152395020 pt�����
315239E100 pt 3152394124 pt����� 3152397020 pt�����
315239E100 pt 3152394YWV pt����� 3152395YWV pt���
315239E100 pt 3152394YWV pt����� 3152397YWV pt���
315239E100 pt 315239E100����� 3152391000�������
315239W pt 315234W pt�������� 315234W pt�������
315239W pt 315239W pt�������� 315239W pt�������
315239WYWW pt 315234WYWW pt��� 315234WYWW pt��
315239WYWW pt 315239WYWW pt��� 315239WYWW pt��
315239WYWY pt 315234WYWY pt��� 315234WYWY pt���
315239WYWY pt 315239WYWY pt��� 315239WYWY pt���
2002 published 2002 collected 1997 published
3152910 3152910����������� 3152910����������
3152910110 3152910110������� 3152910110�������
3152910120 3152910120������� 3152910120�������
3152910231 pt 3152910231 pt����� 3152910230�����
3152910231 pt 3152910231 pt����� 3152910240�����
3152910250 3152910233������� 3152910250�������
3152910270 3152910235������� 3152910270�������
3152910290 pt 3152910237 pt����� 3152910260�����
3152910290 pt 3152910237 pt����� 31529102A0�����
3152910290 pt 3152910237 pt����� 31529102C0�����
3152910YWW 3152910YWW������ 3152910YWW�����
3152910YWY 3152910YWY������ 3152910YWY������
3152921 3152921����������� 3152921����������
3152921100 3152921100������� 3152921100�������
3152925 3152923����������� 3152925����������
3152925310 pt 3152923110 pt����� 3152925111�����
3152925310 pt 3152923110 pt����� 3152925231 pt�����
3152925320 pt 3152923120 pt����� 3152925221�����
3152925320 pt 3152923120 pt����� 3152925231 pt�����
3152925YWV 3152923YWV������ 3152925YWV������
315292W 315292W���������� 315292W���������
315292WYWW 315292WYWW����� 315292WYWW����
315292WYWY 315292WYWY����� 315292WYWY�����
3152991 3152991����������� 3152991����������
3152991100 3152991100������� 3152991100�������
3152993 3152993����������� 3152993����������
3152993100 3152993100������� 3152993100�������
3152995 3152995����������� 3152995����������
3152995110 3152995110������� 3152995121 pt�������
3152995120 pt 3152995111����� 3152995111�������
3152995120 pt 315299512A����� 3152995121 pt�������
3152995120 pt 315299512C����� 3152995131������
3152995YWV 3152995YWV������ 3152995YWV������
3152997 pt 3152285��������� 3152285����������
3152997 pt 3152399��������� 3152399����������
3152997 pt 3262998 pt��������� 3262998 pt��������
3152997110 pt 3152285100 pt����� 3152285100 pt�����
3152997110 pt 3262998122����� 3262998121 pt�������
3152997120 pt 3152399100 pt����� 3152399100 pt�����
3152997120 pt 3262998123����� 3262998121 pt�������
3152997YWV pt 3152285100 pt���� 3152285100 pt�����
3152997YWV pt 3152399100 pt���� 3152399100 pt�����
3152997YWV pt 3262998YWV pt���� 3262998YWV pt���
315299W pt 315228W pt�������� 315228W pt�������
315299W pt 315239W pt�������� 315239W pt�������
315299W pt 315299W�������� 315299W���������
315299W pt 326299W pt�������� 326299W pt�������
315299WYWW pt 315228WYWW pt��� 315228WYWW pt��
315299WYWW pt 315239WYWW pt��� 315239WYWW pt��
315299WYWW pt 315299WYWW��� 315299WYWW����
315299WYWW pt 326299WYWW pt��� 326299WYWW pt��
315299WYWY pt 315228WYWY pt��� 315228WYWY pt���
315299WYWY pt 315239WYWY pt��� 315239WYWY pt���
315299WYWY pt 315299WYWY��� 315299WYWY�����
315299WYWY pt 326299WYWY pt��� 326299WYWY pt���
3159912 pt 3159912 pt��������� 3159911 pt��������
3159912 pt 3159916 pt��������� 3159913 pt��������
3159912112 pt 3159916112 pt����� 3159913111�����
3159912112 pt 3159916112 pt����� 3159913131 pt�����
3159912216 3159912216������� 3159911111�������
3159912318 3159912318������� 3159911121�������
3159912320 3159912320������� 3159911131�������
3159912YWV pt 3159912YWV pt���� 3159911YWV pt���
3159912YWV pt 3159916YWV pt���� 3159913YWV pt���
3159915 3159914����������� 3159915����������
3159915114 3159914114������� 3159915121�������
3159915216 3159914216������� 3159915131�������
3159915318 3159914318������� 3159915111�������
3159915YWV 3159914YWV������ 3159915YWV������
3159916 pt 3159912 pt��������� 3159911 pt��������
3159916 pt 3159916 pt��������� 3159913 pt��������
3159916110 3159912110������� 3159911141�������
3159916220 pt 3159916220 pt����� 3159913121�����
3159916220 pt 3159916220 pt����� 3159913131 pt�����
3159916YWV pt 3159912YWV pt���� 3159911YWV pt���
3159916YWV pt 3159916YWV pt���� 3159913141���
3159916YWV pt 3159916YWV pt���� 3159913YWV pt���
315991W 315991W���������� 315991W���������
315991WYWW 315991WYWW����� 315991WYWW����
315991WYWY 315991WYWY����� 315991WYWY�����
3159921 3159921����������� 3159921����������
3159921100 3159921100������� 3159921000�������
3159923 3159923����������� 3159923����������
3159923100 3159923100������� 3159923000�������
3159925 3159925����������� 3159925����������
3159925100 3159925100������� 3159925000�������
315992W 315992W���������� 315992W���������
315992WYWW 315992WYWW����� 315992WYWW����
315992WYWY 315992WYWY����� 315992WYWY�����
F–2 Appendix F ManufacturingU.S. Census Bureau, 2002 Economic Census
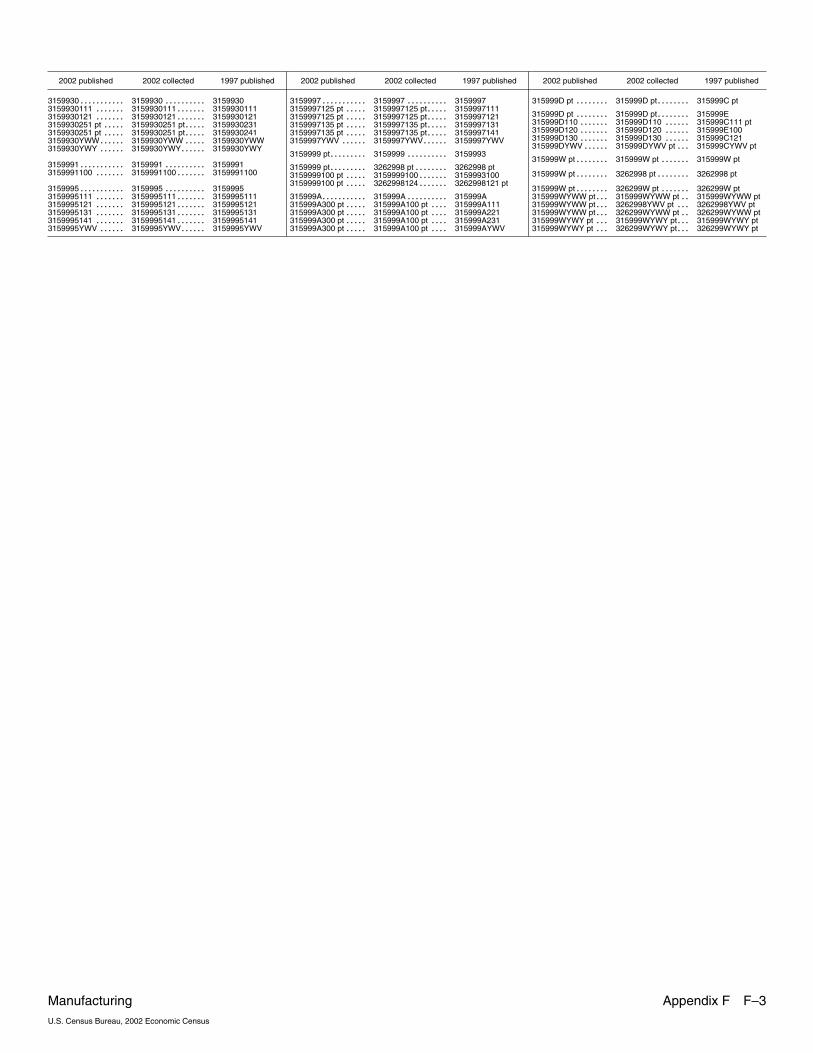
2002 published 2002 collected 1997 published
3159930 3159930����������� 3159930����������
3159930111 3159930111������� 3159930111�������
3159930121 3159930121������� 3159930121�������
3159930251 pt 3159930251 pt����� 3159930231�����
3159930251 pt 3159930251 pt����� 3159930241�����
3159930YWW 3159930YWW������ 3159930YWW�����
3159930YWY 3159930YWY������ 3159930YWY������
3159991 3159991����������� 3159991����������
3159991100 3159991100������� 3159991100�������
3159995 3159995����������� 3159995����������
3159995111 3159995111������� 3159995111�������
3159995121 3159995121������� 3159995121�������
3159995131 3159995131������� 3159995131�������
3159995141 3159995141������� 3159995141�������
3159995YWV 3159995YWV������ 3159995YWV������
2002 published 2002 collected 1997 published
3159997 3159997����������� 3159997����������
3159997125 pt 3159997125 pt����� 3159997111�����
3159997125 pt 3159997125 pt����� 3159997121�����
3159997135 pt 3159997135 pt����� 3159997131�����
3159997135 pt 3159997135 pt����� 3159997141�����
3159997YWV 3159997YWV������ 3159997YWV������
3159999 pt 3159999��������� 3159993����������
3159999 pt 3262998 pt��������� 3262998 pt��������
3159999100 pt 3159999100����� 3159993100�������
3159999100 pt 3262998124����� 3262998121 pt�������
315999A 315999A����������� 315999A����������
315999A300 pt 315999A100 pt����� 315999A111����
315999A300 pt 315999A100 pt����� 315999A221����
315999A300 pt 315999A100 pt����� 315999A231����
315999A300 pt 315999A100 pt����� 315999AYWV����
2002 published 2002 collected 1997 published
315999D pt 315999D pt�������� 315999C pt��������
315999D pt 315999D pt�������� 315999E��������
315999D110 315999D110������� 315999C111 pt������
315999D120 315999D120������� 315999E100������
315999D130 315999D130������� 315999C121������
315999DYWV 315999DYWV pt������ 315999CYWV pt���
315999W pt 315999W pt�������� 315999W pt�������
315999W pt 3262998 pt�������� 3262998 pt��������
315999W pt 326299W pt�������� 326299W pt�������
315999WYWW pt 315999WYWW pt��� 315999WYWW pt��
315999WYWW pt 3262998YWV pt��� 3262998YWV pt���
315999WYWW pt 326299WYWW pt��� 326299WYWW pt��
315999WYWY pt 315999WYWY pt��� 315999WYWY pt���
315999WYWY pt 326299WYWY pt��� 326299WYWY pt���
Manufacturing Appendix F F–3U.S. Census Bureau, 2002 Economic Census

EC0
2-3
1I-3
15
99
9(R
V)
20
02
Oth
erA
pp
arel
Acc
esso
ries
and
Oth
erA
pp
arel
Man
ufa
ctu
rin
g:2
00
22
00
2Eco
nom
icC
en
su
sM
anufa
cturi
ng
Indust
rySe
ries
US
CE
NS
US
BU
RE
AU


![Apparel Manufacturing Process[1]](https://img.pdfslide.us/doc/110x75/577c7c0d1a28abe05499168c/apparel-manufacturing-process1.jpg)