Embed Size (px)
Citation preview
Copyright © 2010 by Andrea Ryan, Gunnar Trumbull, Peter Tufano
Working papers are in draft form. This working paper is distributed for purposes of comment and discussion only. It may not be reproduced without permission of the copyright holder. Copies of working papers are available from the author.
A Brief Postwar History of US Consumer Finance Andrea Ryan Gunnar Trumbull Peter Tufano
Working Paper
11-058

2
A Brief Postwar History of US Consumer Finance
Andrea Ryan
Gunnar Trumbull Harvard Business School
Peter Tufano*
Harvard Business School, NBER, and Doorways to Dreams Fund
This article describes the consumer finance sector in the US since World War II. We first define the sector in terms of the functions delivered by firms (payments, savings/investing, borrowing, managing risk, and providing advice.) We provide time series evidence on major trends in consumption, savings, and borrowing. Examining consumer decisions, changes in regulation, and business practices, we identify four major themes that characterize the sector: (a) innovation that increased the choices available to consumer; (b) enhanced access in the form of broadening participation of consumers in financial activities, (c) do-it-yourself consumer finance, which allowed and forced consumers to take greater responsibility for their own financial lives, and (d) the resultant increase in household risk taking.
*Corresponding Author. Contact information: [email protected], [email protected]. We are grateful for the very useful comments by Howell Jackson, Geoff Jones, Walter Friedman and by members of the Business History group at Harvard Business School. This work was supported by the Division of Faculty Research and Development at the Harvard Business School.
3
Introduction
The postwar history of consumer finance in the United States has been a story of
growth—in variety, in access, and in freedom of choice. Postwar consumerism followed
increases in household income and wealth. These trends drove demand for many products and
services, including financial products and services. Firms responded with innovations that
offered consumers more choices, including electronic banking (i.e., direct deposit of paychecks
and ATM transactions), credit and debit cards, thousands of mutual funds, and complex
mortgages. The increasing variety of products accompanied broadening access. More people
could get mortgages and purchase homes; more people could invest in low-cost portfolios
through mutual funds and exchange-traded funds. This broadening partially reflected increasing
income and wealth, but it also resulted from political and social movements in which previously
excluded social groups fought for access to financial products. These expansions in the number
and type of products and the share of the population with access to them gave American
consumers unprecedented financial flexibility.
Milton Friedman’s 1980 PBS TV series and subsequent book, “Free to Choose”, reflected
an inflection point in American politics, economics and consumer finance.1
1 Milton Friedman, Free to Choose: A Personal Statement (New York, 1980).
Friedman railed
against the Consumer Product Safety Commission and other regulatory agencies for “taking
away our freedom to choose.” While this may have been true of other consumer products, in
their financial affairs, consumers in the latter half of the postwar period were granted more
freedom of choice. This manifested itself in a “do-it-yourself” style of consumer finance, by
which consumers were not only allowed to make financial choices, but also frequently forced to
make financial choices. Through revolving credit and new flexible forms of mortgages,
consumers could fashion their own repayment plans. Rather than just hold cash in banks, they

4
could choose from a variety of money market mutual funds. Rather than work with a full-service
broker, they could use online discount brokerages to trade stocks and bonds at will. Rather than
getting a fixed pension, workers were allowed—and mostly required—to make their own
retirement decisions as part of tax-exempt 401(k) plans. Rather than sit on previously illiquid
assets, like pensions and houses, individuals could monetize these holdings by borrowing against
their 40l(k) plans or home equity.
One consequence was that consumers took on increasing levels of risk—in their
investment portfolios, their borrowing decisions, and even the way in which they purchased
items. This risk taking, enabled by an increase in personal decision making and a growth in the
complexity and flexibility of financial options, was not matched by a commensurate rise either in
financial capabilities of consumers nor in financial advice provided by third parties.
We begin this paper by outlining the basic functions of household finance. We trace the
rising demand for consumer finance products; new innovations in products and institutions that
firms in the sector faced; and broadened accessibility of financial products to a growing number
of households. We conclude by discussing the growing responsibility of individual consumers
for making financial decisions, and the concurrent shift in risk away from institutional actors and
toward households.
Five Functions of the Consumer Finance Sector
The number and variety of institutions and services in the consumer finance sector are
large. The main actors are traditional financial institutions, including banks, mutual funds,
insurance companies, and brokerage firms (including a host of new online firms); government
bodies, including the postal service and social security administration; and informal personal
5
networks of friends and family. The roles of these actors have shifted and merged over time2 but
the core functions have remained the same:3
The payments function is simultaneously delivered by banks (via checks, money orders,
ATM services, debit and credit cards, and electronic payment services), governments (via
modern national currencies, local currencies, postal money orders, and infrastructure services),
and technology firms (e.g., PayPal). While all of these products can be used to pay for goods
and services, the form of payments has been transformed by telecommunications and computer
revolutions. At the end of World War II, nearly all payment activity in America was paper-
based: essentially cash, checks and money orders. By 2008, 57% of consumer payment activity
(1) moving funds between consumers and other
actors (payments); (2) moving funds forward in time (saving and investing); (3) moving funds
backwards in time (borrowing and credit); (4) managing risk (insurance); and (5) providing
information and advice about these decisions. This sparse list of functions brackets all
consumer financial products and institutions, but usually not in a one-to-one mapping. A single
product often embodies multiple functions: credit cards, for example, serve both payment and
credit functions. Conversely, quite different institutions and products may serve the same
functions.
2 For a thorough historical review of money and financial services, including both institutional and consumer
perspectives see Niall Ferguson, The Ascent of Money: A Financial History of the World (New York, 2008).
3 See the following articles for further discussion of the functional perspective: Dwight B. Crane et al., eds., The
Global Financial System: a Functional Perspective (Cambridge, MA, 1995), Robert C. Merton and Zvi Bodie, "A
Conceptual Framework for Analyzing the Financial Environment," in The Global Financial System: a Functional
Perspective, ed. Dwight B. Crane, et al. (Boston, MA, 1995).
6
was conducted via some sort of electronic product—up from 26% in 1999—representing $4.5
trillion dollars spread across 75 billion transactions.4
Consumers have come to rely heavily on charge cards, credit cards, debit cards, and
prepaid cards, many of which operate over network platforms like Visa or MasterCard. So too
have banks, for which the payments function generates over 33% of total US revenues (three
quarters from consumer credit cards and transaction accounts).
5
Savings and investing products are made available by a wide range of providers.
Households can assemble portfolios on their own or engage others to invest on their behalf,
either individually (through a full-service broker, trust department or separate account) or as part
of an investment pool. Short-term low-risk investments can come from banks (i.e., savings
accounts, money market demand accounts, and certificates of deposit), money market mutual
funds, direct government obligations (i.e., treasury bills) or even corporate obligations (i.e.,
adjustable-rate notes). Consumers can gain exposure to stock and bond markets via a wide range
of products: direct investments, mutual funds, annuity products sold by insurance companies,
index-linked certificates of deposit (CDs) sold by banks, exchange-traded funds, futures
contracts, and structured products offered by investment banks. While many of these products
The increasing digitization of
payments shortened settlement times, requiring consumers to be more diligent about managing
their accounts, but also providing ways to track and manage their own spending habits in detail.
Since the launch of bank credit cards in the 1950s, payments increasingly blended with credit.
4 The respective shares of each type of electronic payment as of 2008 are as follows: credit (26% of volume, 18% of
transactions), debit (17%, 24%), prepaid (2%, 4%), and other preauthorized and remote payments (12%, 6%). The
Nilson Report, Issue #939, December 2009 and Issue #729, December 2000.
5 Vijay D’Silva, "Payments in Flux: Megatrends Reshape the Industry," in Moving Money: The Future of
Consumer Payments, Brooking Institution, ed. Robert E Litan and Martin N Baily (Washington DC, 2009).
7
existed prior to World War II, some of the most popular investment innovations occurred in the
postwar period. Those include money market funds (first offered in 1971), index funds (1976),
index-linked CDs (1987) exchange-traded funds (1993) and a host of corporate securities aimed
at retail investors.6
The way consumers borrow has changed as well. Most types of secured installment
loans—including mortgage loans, auto loans and margin loans on securities—predated World
War II, and remained popular throughout the postwar period, with roughly 50% of families
holding some form of installment debt during this time.
(See Table 1 for a postwar timeline of selected financial innovations.)
7
The risk-management function in household finance includes traditional private insurance
(i.e., life, property and casualty, disability, health), plus government-sponsored social protection
programs (i.e., Social Security, unemployment insurance, workers’ compensation, Medicaid,
Some older forms of credit, including
pawn and open-book retail credit, declined in popularity. These were replaced by a range of new
unsecured installment and revolving loans that became increasingly popular in the postwar
period, including student loans, payday loans (a reinvention of the salary loan), credit cards,
overdraft protection, and bank lines of credit. These household credit products were provided by
many actors, including the government (i.e., student loans and government-sponsored
mortgages), private companies (i.e., retailers, consumer finance companies, banks, non-bank
alternative finance organizations), non-profit groups (e.g., credit unions), and a variety of hybrid
financial organizations including person-to-person lending services and savings circles.
6 Peter Tufano, "Financial Innovation and First Mover Advantage," Journal of Financial Economics 25 (1989).,
213-240.
7 In 1960, 48% of families had installment debt as compared to 50% in 1989 and 47% in 2007. Survey of Consumer
Finances, 1960, 1989, 2007.
8
food stamps), precautionary savings, lines of credit, and social networks.8 Two trends
characterized postwar risk management. First, expanding from their Depression-era roots,
government programs to manage individual risk grew in number and scope. The Social Security
program, which already included survivors’ insurance, was extended to include benefits for the
disabled (1956).9 Medicare (1965) introduced publicly financed health coverage for the elderly.
The Employee Retirement Income Security Act (1974) guaranteed employer defined benefit
retirement plans.10
Finally, organizations that provided consumers with financial advice expanded. While
informal social networks, investment clubs,
Second, and less dramatically, private life insurance plans increasingly
blended death benefits with customized investment vehicles.
11 formal media, bankers, salesmen, and security
brokers continued to provide information and advice, the later part of the postwar period saw an
increase in new models of providing advice, including computerized models (such as Financial
Engines), chat boards,12
account aggregators (such as Mint.com), and product comparison sites.
8 See an excellent discussion of risk-management as it applies to both households and macro-economies in Robert
Shiller, The New Financial Order: Risk in the 21st Century (Princeton, NJ, 2003).
9 Later amendments expanded disability coverage further. See a chronology of the Social Security Administration at
http://www.ssa.gov/history/chrono.html (accessed August 2010).
10 David Moss, When All Else Fails: Government as the Ultimate Risk Manager (Cambridge, MA, 2002). p 215.
11 Harrington, Brooke. Pop Finance: Investment Clubs and the New Investor Populism. Princeton, NJ, 2008.
12 Sanjiv Das, Asis Martinez-Jerez, and Peter Tufano, "E-Information," Financial Management 34 (Autumn 2005).
9
Postwar Trends in Consumer Finance
While the basic functions of a consumer finance system remain the same over time, the
ways in which these functions were delivered and used—the mix of clients, products and
services, and institutions—has evolved. We identify four major trends from the past 65 years:
• More products: demand, innovation, and changing firm boundaries
• Greater access: broadening participation of consumers in the financial sector
• Do-it-Yourself: increases in consumer responsibility
• Greater risk: the aggregate impact of consumer decisions
More products: demand, innovation, and changing firm boundaries
Demand. Growth in demand for consumer finance products followed the postwar
increase in income and consumption. Between 1950 and 2008, American per capita real
disposable income grew from $12,374 to $34,946 (in 2008 dollars), for a compound annual
growth rate of 1.81%. Growth in personal consumption followed the increase in income and
wealth (See Figure 1). Per capita household expenditures increased from $11,320 in 1950 to
$33,028 in 2008 (both in 2008 dollars), growing 1.86% per year.13
While consumption rose in
absolute terms, it remained remarkably stable when considered as a share of disposable income.
(See Figure 2.) We consumed more, but largely because we earned more.
>>>Insert Figures 1 & 2 Here<<<
13 Bureau of Economic Analysis, Personal Consumption Expenditures
10
The increase in American household consumption has been discussed at length by
historians, political scientists, sociologists, and economists.14 Efforts to make sense of American
acquisitiveness, the phenomenon of consumerism, and the consumer culture it generated have
been surprisingly contentious. Researchers disagree on how consumerism is defined, what drives
it, what its effects are, and how these effects are to be judged.15
The historical context behind these perspectives is rather consistent, however. After the
war, government policies and initiatives fostered new highway construction, federally-insured
home mortgages, and liberal land-use planning. New roads and new suburbs created a commuter
culture that drove demand for automobiles. New houses required furniture and appliances.
14 Hillel Black, Buy Now, Pay Later (New York, 1961), Lendol Calder, Financing the American Dream: A Cultural
History of Consumer Credit (Princeton, 1999)., Lizabeth Cohen, A Consumer's Republic: The Politics of Mass
Consumption in Postwar America (New York, 2003)., Lizabeth Cohen, "From Town Center to Shopping Center:
The Reconfiguration of Community Marketplaces in Postwar America," The American Historical Review 101, no. 4
(1996)., Rosa-Maria Gelpi and Francois Julian-Labruyere, The History of Consumer Credit: Doctrine and Practices
(New York, 2000), Lawrence B. Glickman, ed., Consumer Society in American History: A Reader (Ithaca, New
York, 1999), Brooke Harrington, Pop Finance: Investment Clubs and the New Investor Populism (Princeton, NJ,
2008)., Daniel Horowitz, The Anxieties of Affluence: Critiques of American Consumer Culture 1939-1979
(Amherst, MA, 2004), Lewis Mandell, The Credit Card Industry: A History (Boston, 1990), Daniel J. Monti, The
American City: A Social and Cultural History (Oxford., 1999)., Joseph Nocera, A Piece of the Action (New York,
1994), Juliet Schor, The Overspent American: Why We Want What We Don't Need (New York, 1999)., Michael
Schudson, "Delectable Materialism: Second Thoughts on Consumer Culture," in Consumer Society in American
History: A Reader, ed. Lawrence B. Glickman (Ithaca, NY, 1999), Eleanor Bernert Sheldon, “Family Economic
Behavior: Problems and Prospects (Philadelphia, PA, 1961), David M. Tucker, The Decline of Thrift in America:
Our Cultural Shift from Saving to Spending (New York, 1991)., Brett Williams, Debt for Sale: A Social History of
the Credit Trap (Philadelphia, 2004).
15 Lawrence B. Glickman, ed., Consumer Society in American History: A Reader (Ithaca, New York, 1999).
11
Furthermore, after the war, and coming off of savings rates as high as 26%, people were ready to
begin spending again. Between 1941 and 1961, annual consumer spending for housing and cars
more than tripled, from $718 to $2,513 per household in constant dollars.16 To buy these goods,
many households relied on credit. By 1949, 49% of new cars, 54% of used cars, 54% of
refrigerators, and 46% of TVs were being sold on credit.17
How these patterns of economic activity developed into the phenomenon of
consumerism, and what impact they had on the American way of life, is a matter of considerable
debate. Some theorists emphasize the role of manufacturers and retailers intent on selling more
products. Using clever marketing and advertising tools, they sent the message that their products
not only were desirable, but also were necessary for achieving the American dream.
18 In this
view, consumerism was a product of manipulative advertising, creating a ‘false’ consumer desire
for consumer goods and a willingness to use credit to attain them.19
16 Cohen, A Consumer's Republic: The Politics of Mass Consumption in Postwar America. p. 195
This perspective emphasizes
how consumer credit made it easier to afford things that had before been out of reach, allowing
more different types of people to reflect their identities through material goods, and perhaps
17 Federal Reserve Board, Survey of Consumer Finances, 1950.
18 In short, capitalism needs consumers, and production-oriented institutions were poised to create demand however
they could. Juliet B Schor and Douglas B Holt, "Introduction: Do American's Consume Too Much?," in The
Consumer Society Reader., ed. Juliet B Schor and Douglas B Holt (New York, 2000)., , Strasser, Susan. Satisfaction
Guaranteed: The Making of the American Mass Market ( New York, 1989).
19 Bordo, Susan. "Hunger as Ideology," J. B. Schor and D. B. Holt, The Consumer Society Reader.( New York,
2000) , Galbraith, John Kenneth. "The Dependence Effect," J. B. Schor and D. B. Holt, The Consumer Society
Reader ( New York 2000), Klein, Lloyd. It's in the Cards: Consumer Credit and the American Experience.
(Westport, CT, 1999).
12
secure higher social status.20 While consumerism generated increased access to goods and
services, this class of theorists have more commonly lamented the increasingly central role that
material objects play in consumer’s lives—the “commodification of daily life.”21
Others reject the idea that consumerism is inherently problematic. Employing a cultural
perspective, they emphasize the ways in which consumption brings people together—how the
goods we buy reflect who we are individually as well as culturally.
22 Historian Gary Cross
writes that postwar consumer goods “provided a valued balance between belonging and
autonomy…Indeed much of the sociability of groups and neighbors was built around shared and
compared display of goods.”23
20 Klein, Lloyd. It's in the Cards: Consumer Credit and the American Experience., Logemann, Jan. "Different Paths
to Mass Consumption: Consumer Credit in the United States and West Germany During the 1950s and 1960s."
Journal of Social History, 2008, 41, pp. 525-59, Schor, The Overspent American: Why We Want What We Don't
Need., Twitchell, James B. Lead Us into Temptation: The Triumph of American Materialism. New York, 1999.
Much of the work is also related to Bourdieu, Pierre. Distinction: A Social Critique of the Judgment of Taste.
(Cambridge, MA, 1984), Veblen, Thorstein. The Theory of the Leisure Class. (New York, 1973 (1899).
Americans’ consumer behavior facilitated social bonding.
21 Schor and Holt, "Introduction: Do American's Consume Too Much?."
22Monti, The American City: A Social and Cultural History..Calder, Financing the American Dream: A Cultural
History of Consumer Credit.. Cross, Gary S. An All-Consuming Century: Why Commericialism Won in Modern
America (New York, 2000). Martin, John Levi. "The Myth of the Consumption-Oriented Economy and the Rise of
the Desiring Subject." Theory and Society, 1999, 28(3), pp. 425-53, McCracken, Grant. Culture and Consumption:
New Approaches to the Symbolic Character of Consumer Goods and Activities (Bloomington, IN 1988), Trentmann,
Frank. "Beyond Consumerism: New Historical Perspectives on Consumption." Journal of Contemporary History,
2004, 39(3), pp. 373-401. See also Zelizer, Vivana. "Culture and Consumption," N. J. Smelser and R. Swedberg,
The Handbook of Economic Sociology. Princeton, NJ: Princeton University Press, 2005, 331-54.
23 Cross, Gary S. "Consumer History and the Dilemmas of Working-Class History." Labour History Review, 1997,
62(3), pp. 261-74.
13
Retailers seemed to understand this well. In the 1960s, shopping malls became an essential part
of suburbanization. This made shopping a new experience, putting larger, more diverse, and less
“local” retailers under one roof. If malls made shopping a more anonymous experience than it
once had been at the corner store, they also attempted to foster an alternative community. Often
constructed to look like an idealized main street, malls offered meeting places and “community
events,” much like would occur in a town center. This new way of consuming helped to
reinforce the notion that individual consumption was inherently a community affair.24
Other researchers have emphasized the importance of inequality. Postwar consumer
patterns shifted in ways that directly affected minorities and women—at first, leaving them
behind, but then creating a context in which they were prompted to take action. By the early
1970s, women’s groups and urban blacks had come to define access as a central front in the
battle for full citizenship. Indeed, political and social movements among minorities and women
gradually increased access to consumer goods and consumer credit.
25
However consumerism is interpreted, it is clear that more and different types of people
have been consuming more goods and services over the past 50 years, and that this trend drove
growth and innovation in consumer financial services. The increase in car and home ownership
24 Cohen, "From Town Center to Shopping Center: The Reconfiguration of Community Marketplaces in Postwar
America."pp. 1050-81. See also Monti, The American City: A Social and Cultural History.
25 Cohen, A Consumer's Republic: The Politics of Mass Consumption in Postwar America., Ownby, Ted. American
Dreams in Mississippi: Consumers, Poverty, and Culture, 1830–1998. . Chapel Hill, NC: University of North
Carolina Press, 1999, Weems, Jr., Robert E. "The Revolution Will Be Marketed: American Corporations and Black
Consumers During the 1960s," L. Glickman, B., Consumer Society in American History: A Reader. (Ithaca, NY,
1999)
14
(respectively from 51% and 51% in 1949 to 87% and 69% in 200726
Historian Lizabeth Cohen has emphasized the role of demand for new products in driving
productivity and wage gains. With regular and rising salaries, the amount of household savings
increased steadily from the end of the war through the mid-1980s,
) both depended on and
supported demand for consumer financial products, such as auto and home insurance. With new
mobility afforded by automobiles, consumers increasingly traveled outside of their own towns
and states, creating demand for secure payment systems that bridged the highly fragmented
national banking system. New hotel, gas, and travel and leisure cards all emerged to fill this
payments gap. Higher demand for consumer goods also fostered an increasing emphasis on and
need for consumer credit products, as consumers were increasingly willing and able to purchase
cars and durable goods “on time.”
27 creating opportunities for
new classes of investment products that could be sold to households. As the workforce expanded,
widening access to financial products helped to forge what Cohen has called the “mass middle-
class.”28
Innovation. The rapid innovation that Nobel Prize-winning economist Merton Miller
described in corporate finance between the 1960s and 1980s was equally pronounced in postwar
consumer finance.
Concurrent gains in income, wealth, and consumption supported an expanding
consumer finance sector and innovation.
29
26 Survey of Consumer Finances, 1950 (car ownership in 1949), 1960 (home ownership in 1949), and 2007.
The postwar period witnessed new products, new infrastructure, new
27 Bureau of Economic Analysis. The savings rate, however, remained fairly steady during this time, averaging
8.90% between 1950 and 1986, after which it began to decline steadily.
28 Cohen, A Consumer's Republic: The Politics of Mass Consumption in Postwar America, Harrington, Pop
Finance: Investment Clubs and the New Investor Populism.
29 Merton Miller, Financial Innovations and Market Volatility (London, 1991).
15
strategies and new technologies for providing existing products, as well as new opportunities to
mass market financial services.30
(See Table 1.) Consumers from the 1950s would likely be
surprised by the way in which consumers today pay for goods and services (e.g., cards and
electronic payments), by how and where they invest (e.g., mutual funds, at work), and by how
they borrow (e.g., revolving credit cards and innovative mortgages).
>>>Insert Table 1 Here<<<
Most innovations in consumer finance products and services relied on underlying process
innovations, coupled with new channels by which products were marketed to, and adopted by,
consumers. Many of these innovations were hidden from public view. For example, the
automated clearing house (ACH) systems introduced in the 1970s established the first electronic
30 The old adage “There’s nothing new under the sun,” has a strong element of truth. Merton (1992) writes about
an innovation spiral, in which one innovation creates the platform on which others build so that little is truly
original. Tufano (2003) provides examples of this spiral, and of forgotten innovations from earlier times that are
uncannily like the newest of financial products. For example, the appendix from the first edition of Graham and
Dodd’s investing classic, Security Analysis, lists over two hundred security innovations, many of which resemble the
complex securities designed in the 1980s and 1990s. Robert C. Merton, "Financial Innovation and Economic
Performance," Journal of Applied Corporate Finance 4, no. 4 (1992), Peter Tufano, "Financial Innovation," in
Handbook of the Economics of Finance, ed. George Constantinides, Milton Harris, and Rene Stulz (Amsterdam,
2003). (Benjamin Graham and David Dodd, Security Analysis, 6th ed. (New York 2009 [1934]).) Ferguson (2008)
likens developments in the financial sector to evolution in nature, where weaker institutions die out and new types of
businesses, growing out of speculation as much as economic scale and scope, push their way in.
16
protocols for processing financial transactions.31 Along with related process and software
innovations, ACH transformed consumer payment. Rather than carrying extra cash in their
pocketbooks, consumers could access cash and other payment options around the clock using
automated teller machines (ATMs) that were first installed in the early 1970s.32
In the next decade, point-of-sale (POS) equipment was introduced, allowing consumers
to use debit cards at retailers and making credit card use increasingly swift.
33 Rather than
waiting in line to deposit checks, consumers now could use ATMs or authorize the direct deposit
of their payroll.34 Rather than writing and mailing checks, they now could use electronic bill
payment services.35
Innovations also were evident in the new investment products that consumers could
access. From only 98 mutual funds available in the 1950s, American consumers in 2007 could
select among 8,029 US-domiciled mutual funds offering every possible investment class and
Rather than calling up a broker to get price quotes or to trade, they could
conduct their own research on the internet using discount brokerage services. These technology-
driven innovations changed the ways in which consumers conducted their financial business.
31 The idea for an automated file transfer system came about in the early 1970s. The Federal Reserve helped to
consolidate smaller programs into the nationwide clearinghouse, which formed in 1974.
http://www.newyorkfed.org/aboutthefed/fedpoint/fed31.html
32 W. Scott Frame and Lawrence J. White, "Technological Change, Financial Innovation, and Diffusion in Banking,"
Federal Reserve Bank of Atlanta Working Paper 2009-10 (2009).
33 Ibid.
34"The Electronic Payments Network and the ACH: A History," (New York: Electronic Payments Network,
unknown), Daniel D. Garcia-Swartz, Robert Hain, Anne Layne-Farrar, “The Move Toward A Cashless Society: A
Closer Look at Payment Instrument Economics,” Review of Network Economics, 5, no. 2 (June 2006).
35"The Electronic Payments Network and the ACH: A History”
17
strategy.36 During the same period, the number of stocks listed on the New York Stock
Exchange grew from 1,057 to 2,805.37 Beginning in 1975, household investors could buy low-
cost index funds that tracked the performance of broad classes of stock—a product that even
wealthy investors would had difficulty accessing in the 1950s. Mutual fund companies changed
their distribution practices as well. Whereas in 1970 only 11% of long-term fund sales were
direct-marketed “no load” funds, these funds comprised the majority of all funds sold by 2000.38
Patterns of simple savings also were influenced by innovation. In 1950, American
households held 17% of their financial assets in deposit products—primarily bank savings
accounts and time-deposit accounts like CDs. Virtually all of these savings were held in banks.
In 2008, the share of household assets held in deposit products was similar (15 %), but where
consumers saved them had changed. By then, a quarter of all deposits, equal to $1.6 trillion, were
held in money market mutual funds, a product that had only been invented in 1971.
39
Innovations also changed the delivery of credit. Aspiring homeowners in the 1950s had
access primarily to 30 year fixed-rate amortizing mortgages.
40
36 Investment Company Institute, 2009.
Starting in the 1980s they could
37 Data from http://www.nyxdata.com/factbook visited May 4, 2010.
38 Fink, Matthew. The Rise of Mutual Funds: An Insider's View (New York, 2008).
39 Federal Reserve Board, Z.1 report. These figures include all assets of households and nonprofits.
40 The fixed-rate, long-term, fully-amortizing mortgage was made possible through the Home Owner’s Loan
Corporation established in 1933 (and the precursor to Fannie Mae) and the National Housing Act of 1934 (which
created the Federal Housing Administration). Prior to the Depression-era, mortgages commonly were only available
for a 5-10 year term and required a large payment toward principal at the end of the term. Most also had variable
rates. These loans all but required that they be refinanced at the end of the term. Green, Richard K. and Susan M.
Wachter, “The American Mortgage in Historical and International Context,” Journal of Economic Perspectives,
18
choose among a far more complex set of options, including adjustable rate mortgages (ARMs),
interest-only mortgages and option ARMs (which allowed the principal loan balances to exceed
the value of the home).41 In 2003, ARMs comprised 18% of all mortgages, growing to 25% by
2005.42 Homeowners who presented more risk to lenders had more options as well, in the form
of “subprime” loans.43 While the subprime lending market started in the 1990s, it didn’t begin to
take shape until the early 2000s, accounting for 6% of all residential mortgage originations. By
2006, subprime originations comprised 25% of all mortgage loan originations that year and 14%
of the overall mortgage market.44
2005, 19:4, pp. 93-114. Crawford, Morris D. Types and Sources of Home-Mortgage Financing, The Analysts
Journal (June 1955).
41 Title VIII of the St. Germain Depository Institutions Act of 1982 made it possible for mortgage interest rates to be
adjusted or renegotiated. Green and Wachter, 2005. See also Lacy, William H. "Innovation Is a Key to Banks'
Meeting Home-Financing Needs." ABA Banking Journal, 1982, (May), pp. 118-21.
42 “Characteristics of Outstanding Residential Mortgage Debt: 2006”, MBA Research DataNotes, January 2007,
available at:
http://www.mortgagebankers.org/files/Bulletin/InternalResource/47210_DataNoteCharacteristicsofOuttandingResid
entialMortgageDebtfor2006.pdf
43See S Chomsisengphet and A Pennington-Cross, "The Evolution of the Subprime Mortgage Market," Federal
Reserve Bank of St. Louis Review January/February (2006).. Available at:
http://research.stlouisfed.org/publications/review/06/01/ChomPennCross.pdf
44 “The Subprime Mortgage Market: National and Twelfth District Developments,” Federal Reserve Bank of San
Francisco, 2007 Annual Report. Available at:
http://www.frbsf.org/publications/federalreserve/annual/2007/subprime.pdf. See also Ibid., which reports slightly
different numbers, stating that the subprime market share of all originations went from 10.2% in 1995 to a peak of
14.5% in 1997 and then down to 8.4% in 2001.
19
In consumer credit, the principal product innovations had appeared before World War II.
Early charge cards, including the Farrington Charga-Plate, were created in the 1920s.45 The basic
retail revolving credit account was invented in 1938.46 What was striking in the postwar era was
how quickly these innovations spread. By 1959, 88% of all department stores offered revolving
accounts.47 Banks first began offering credit cards tied to revolving credit accounts in the mid-
1950s. Initially, these were marketed to small retailers as a way to allow them to compete with
larger stores that offered in-house credit. A decade later, in 1967, an estimated 1,500 banks were
offering credit cards, and 11-13 million of these were in active use.48 Two major bank card
networks emerged—BankAmericard (later VISA) in 1965 and Interbank (later MasterCard) in
1967. By 1969 these two networks included 44 million cardholders.49 Including retail and travel
and leisure cards, the total number of cards in use at the time was estimated at 400 million, or
roughly three for every adult.50 Over time, credit card transactions would come to rival the
traditional check-based payment system. Electronic transactions (credit cards, debit cards,
electronic funds transfers) surpassed check transactions in number in 2003.51
45 Michel Schlosser and Gérard Tardy, Les cartes de crédit (Paris, 1971).
46 JC Penney Corporate Records, Southern Methodist University, Recollections by Wallis B. Hocker, Retired Credit
Manager, 1989, responses to clarifying questions, pp 6-7.
47 Lelia Easson, “New Developments in Consumer Credit,” Journal of Home Economics (December 1959), p 847.
48 Robert L. D. Morris Papers, Kansas State University, Box 35, folder 4, E.J. Kersting, Credit Cards: Thirty Days
to Reality, August 1967.
49 David S. Evans and Richard Schmalensee, Paying with Plastic: The Digital Revolution in Buying and Borrowing
(Cambridge, MA: MIT Press, 1999).
50 Schlosser and Tardy, Les cartes de crédit, p. 13.
51 Geoffrey R. Gerdes and Jack K. II Walton, "The Use of Checks and Other Noncash Payment Instruments in the
United States," Federal Reserve Bulletin August (2002); The 2004 Federal Reserve Payments Study, Analysis of
20
The new consumer credit providers relied on ancillary service providers to ensure
repayment. While the United States entered the postwar period with several nation-wide credit-
rating companies that assessed business risk (e.g., Dun and Bradstreet, Standard and Poors, and
Moody’s52), consumer credit rating had been highly decentralized. In 1960, an estimated 1,500
independent local credit bureaus collected information on household income, profession, marital
status, and outstanding debts, plus informal testimonies from neighbors and colleagues. Some
operated for profit; most were non-profit cooperatives.53 In many communities, the local
“Welcome Wagon” collected credit information on new arrivals to the town.54
Noncash Payments Trends in the United States, 2000-2003. The number of check payments is estimated to have
peaked in 1995 at 49.5 billion (Stephen Quinn and William Roberds, “The Evolution of the Check as a Means of
Payment: A Historical Survey,” Economic Review, Number 4, 2008p. 23.. Data provided by the Nilson Report,
shows that check volume dropped below 50% of the total payment volume (including cash) as of 1999. Between
2000 and 2003, the fraction of check-based transactions dropped from 58% to 45% and the volume of these
payments dropped from 66% to 55% of total volume.
Over the 1960s,
these local bureaus began to consolidate into national networks. The movement culminated in
1970, the year in which Fair Isaac Company (FICO) launched a universal credit scoring system,
and Retail Credit Company (Equifax) computerized the entire 45 million records in its credit
52 Richard Cantor and Frank Packer, "The Credit Rating Industry," FRBNY Quarterly Review Summer-Fall (1994),
R.W. Hidy, "Credit Rating before Dun and Bradstreet," Bulletin of the Business Historical Society 13, no. 6 (1939),
James H. Madison, "The Evolution of Commercial Credit Reporting Agencies in Nineteenth Century America,"
Business History Review 48, no. 2 (1974), Rowena Olegario, "Credit Reporting Agencies: A Historical Perspective,"
in Credit Reporting Systems and the International Economy, ed. Margaret J. Miller (Cambridge, MA, 2003), B.
Wyatt-Brown, "God and Dun & Bradstreet," Business History Review 40, no. 4 (1966).
53 André Malterre, “Problème du credit à la consommation,” Journal Officiel 20, 11 August 1961, pp 764.
54 Louis Hyman “Debtor Nation,” Enterprise and Society 9 no. 4, (2008).
21
ratings database.55 Applying the FICO scoring system to digital data, consolidated credit-rating
agencies were able to offer services that spanned the consumer lending value chain: from
generating mailing lists of prospective new customers, to approving new applicants, to
monitoring services for existing revolving-account customers. Lenders that had previously
deployed in-house risk scoring techniques increasingly relied on credit scores provided by the
three big external credit rating agencies: Experian (TRW), TransUnion, and Equifax.56
There is little question that the postwar period witnessed an increase in the variety of
products available to consumers. To understand the industry dynamics that supported this
innovation, it is useful to characterize how consumer financial service firms evolved in the
postwar period.
Other
specialized service providers emerged to manage collections and customer loyalty programs.
Changing boundaries of the firm. The postwar period saw two countervailing trends
regarding the scope of consumer finance businesses. The first trend was toward a broadening,
both in terms of services offered and in geographic scope. The second trend was the
disaggregation of consumer finance activities across networked firms.
Expansion of the scope of consumer finance firms can be seen in the geographic
expansion of banking organizations. Precluded from operating across state lines, the banking
industry traditionally was highly fragmented. In 1950, there were 14,000 banking organizations
in America. Beginning with the passage of the Garn-St Germain Depository Institutions Act in
1982, and state-by-state deregulation that led to the passage of the Reigle-Neal Interstate 55 Donncha Marron, “‘Lending by Numbers’: Credit scoring and the constitution of risk within American consumer
credit,” Economy and Society 36 no. 1 (February 2007): 103-133.
56 Mark Furletti, “An Overview and History of Credit Reporting,” Federal Reserve Bank of Philadelphia Discussion
Paper, 2002.
22
Banking and Branching Efficiency Act in 1994, banks increasingly were allowed to cross state
lines.57 Banking consolidation (or expansion of scope) occurred furiously; slightly over 7,000
banking organizations remained in 2008. For example, in 1993, the Ohio-based BancOne
controlled 78 banks in twelve states as well as ten non-bank affiliates. It was one of the nation’s
top-10 acquirers, having completed 50 acquisitions in the previous decade.58
Not only were banks now allowed to operate across state lines, but in 1999 the barrier
between commercial banking and investment banking was removed, leading to even greater
consolidation. For example, today’s JPMorganChase is an amalgam of JP Morgan, Chase
Manhattan Bank, Chemical Bank, Manufacturer’s Hanover, Bank One, First Chicago, and
National Bank of Detroit.
59 Consolidation also took place in the brokerage or wire house
business, which provided stock services to customers. With fixed brokerage commissions
outlawed in 1975, the business models of many smaller boutique firms were challenged. After
nearly 40 years of quiet operation, the two-partner firm of Harris-Upham and Co. would grow
from 1976 to 1998 into Smith Barney, which was then acquired by Citigroup.60
57 Randall S. Krosner, "The Motivations Behind Banking Reform," Regulation (2001), 36-41.
New behemoth
financial services companies like the Citigroup-Travelers-Smith-Barney, or the ultimately
58 Ben Esty, Peter Tufano and Jonathan Headley, "Bancone Corporation: Asset and Liability Management," Journal
of Applied Corporate Finance 7 (1994), 33-51.
59 See the history of JPMorgan Chase at http://www.jpmorgan.com/pages/jpmc/about/history
60 Smith, Barney & Co. merged with Harris, Upham & Co. in 1987 was acquired by Primerica, a public financial
services company, in 1993 became a wholly-owned subsidiary of Travelers Group, in 1997 was combined with
Saloman, Inc. and then in 1998 becomes part of Citigroup.
http://www.citigroup.com/citi/corporate/history/smithbarney.htm
23
unsuccessful Sears-Allstate-Coldwell Banker-Dean Witter-Discover amalgam, would sell
themselves as the “supermarkets” of household finance.61
Pushing against this trend towards aggregation was an equally strong, and in many ways
less obvious, trend towards disaggregation of firms connected through consumer finance
business networks. We see this strikingly in home mortgage products. Until the 1970s and
1980s, most home mortgages were originated, funded and serviced by banks and credit unions
or, if they were government-insured mortgages, were bought by government-owned Fannie Mae
(which, in 1968 would become a private shareholder-owned corporation).
62 Over time,
origination, servicing, and funding activities became separated. Funding activities were
transferred to third parties through securitization—the bundling and then tranching of mortgage
claims. The volume of securitized home mortgages grew from $28 billion in 1976 to $4.2
trillion in 2003.63 Government-sponsored entities (i.e., Fannie Mae and Freddie Mac) played an
important role in this process by standardizing mortgage products, pooling mortgages into
mortgage-backed securities, and guaranteeing investors against losses.64
61 For an “obituary” of the latter, see Barnaby, J. Feder, “Sears, Returning to its Roots, is Giving up Allstate” New
York Times, Nov 10, 1994.
Mortgage brokers and
specialized mortgage originators developed a new “originate-to-distribute” model in which even
servicing was broken out to specialized mortgage servicers.
62 http://www.fundinguniverse.com/company-histories/Fannie-Mae-Company-History.html
63 Elena Loutskina and Philip E. Strahan, "Securitization and the Declining Impact of Bank Finance on Loan Supply:
Evidence from Mortgage Originations," Journal of Finance LSIV, no. 2 (2009).
64 Scott W. Frame and Lawrence J. White , "Fussing and Fuming About Fannie and Freddie: How Much Smoke,
How Much Fire?" Journal of Economic Perspectives 19 (2005).
24
Other lending activities also used this networked form. Automobile loans were first
securitized in 1985; credit card loans followed in 1986.65 By 2006, approximately 55% of all
mortgages, 45% of all credit card loans, and 16% of non-revolving loans (many of which are
auto installment loans) were securitized.66 Over time, these networks of firms and investors
displaced traditional lenders. Much attention has been focused on the way in which changes in
financial intermediation, especially in mortgages, would come to influence the national and
global economy.67
65 "Asset Securitization Comptroller's Handbook." C. o. t. C. Liquid and Funds Management, Washington, DC: U.S.
Department of Treasury, 1997.
66 Mortgage data from Figure 2 in Richard J. Rosen, "The Role of Securitization in Mortgage Lending," in Chicago
Fed Letter: Essays on Issues (Federal Reserve Bank of Chicago, 2007). Revolving and non-revolving debt data
from Federal Reserve Statistical Release, Series G19, http://www.federalreserve.gov/releases/g19/Current/; xxx.
67 Adam B. Ashcraft and Til Schuermann, "Understanding the Securitization of Subprime Mortgage Credit," in Staff
Reports (New York: Federal Reserve Bank of New York, 2008), Antje Berndt and Anurag Gupta, "Moral Hazard
and Adverse Selection in the Originate-to-Distribute Model of Bank Credit " Available at SSRN:
http://ssrn.com.ezp-prod1.hul.harvard.edu/abstract=1290312 (2008), Joshua Coval, Jakub Jurek, and Eric Stafford,
"The Economics of Structured Finance," Journal of Economic Perspectives 23, no. 1 (2009), Matias Hoffman and
Thomas Nitschka, "Securitization of Mortgage Debt, Asset Prices, and International Risk Sharing," Institute for
Empirical Research in Economics, University of Zurich, Working Paper Series (2008), Loutskina and Strahan,
"Securitization and the Declining Impact of Bank Finance on Loan Supply: Evidence from Mortgage
Originations.", Christopher Mayer, Karen Pence, and Shane M. Sherlund, "The Rise in Mortgage Defaults," Journal
of Economic Perspectives 23, no. 1 (2009), Atif Mian and Amir Sufi, "The Consequences of Mortgage Credit
Expansion: Evidence from the 2007 Mortgage Default Crisis," NBER Working Paper 13936 (2008), Amiyatosh
Purnanandam, "Originate-to-Distribute Model and the Subprime Mortgage Crisis," AFA 2010 Atlanta Meetings
Paper. Available at SSRN: http://ssrn.com.ezp-prod1.hul.harvard.edu/abstract=1167786 (2009), Robert J. Shiller,
25
The creation of networks of firms to deliver financial services went beyond mortgages
and credit products. A growing field of defined contribution retirement plans offered by
employers also depended on a network of providers. Investment managers, plan servicers, and
sponsors all were outsourced. Similar networks emerged to serve the two-sided market of credit
and debit cards. Banks had long been organized into correspondent networks to cash and
process checks. With the advent of credit card, elaborate networks emerged linking cardholders
and merchants via issuing banks (e.g., Capital One or Citibank), card associations (Visa or
MasterCard), acquiring banks (e.g., Citi Merchant Services, Fifth Third Bank), and specialized
data processors (e.g., First Data Corporation).68 This networked structure enabled merchants to
get immediate authorization of charges, facilitated the flow of information and funds through the
system, and allowed consumers to cancel payment in case of grievance against a merchant.69
New consumer finance markets became the focus of intense competition. In the credit
function, banks competed fiercely with consumer finance companies and retailers to control the
card payment system. In the saving function, money market mutual funds competed with
commercial banks for household savings. In the electronic payments function, competing card
payment providers vied for dominance. And because the consumer financial markets were highly
regulated, competition nearly always occurred in the shadow of the regulatory state. This meant
that companies providing consumer financial services ended up deeply involved in state and
national regulatory battles.
The Subprime Solution: How Today's Global Financial Crisis Happened and What to Do About It (Princeton, NJ:
Princeton University Press, 2008). 68 Evans and Schmalensee, Paying with Plastic: The Digital Revolution in Buying and Borrowing.
69 Ronald J. Mann, Charging Ahead: The Growth and Regulation of Payment Card Markets (Cambridge, 2006), pp
25-27.
26
We observe this close interconnection between regulation and competition in consumer
credit markets. From the 1940s until the late 1960s commercial banks fought fiercely to block
laws that would force them to disclose their actual lending rates as annualized percentages.
While consumer finance companies were bound by strict truth in lending laws, banks could use
creative pricing, including discounting and add-on insurance, to advertise loans at 6% that had
effective annual rates ranging from 20% to 25%.70
With the passage of the 1968 Truth in Lending Act (TILA), banks were required to report
the cost of their loans in a standardized fashion. In response, banks shifted their strategies. In the
late 1960s and early 1970s, banks supported state-level usury reform initiatives, advanced largely
by consumer advocacy organizations, to lower legal interest–rate caps (typically from 18% to
12% per year) in an effort to make inroads into the large retail credit business. Since banks
increasingly supplemented their interest income from user and retailer fees, they were less
sensitive to low interest rates than were their retail lending competitors. Indeed, where these
reform initiatives succeeded, mid-sized and regional retail chains abandoned their own credit
cards and accepted bank-issued cards. By the late 1970s, the remaining large retail lenders
countered by opening banks and moving into the general-purpose credit card business. In 1988,
the top four American credit card issuers, measured by numbers of cards and volume of
outstanding loans, were still retailers: Sears, JC Penney, Wards, and Allied Department Stores.
71
Greater access: broadening participation of consumers in the financial sector 70 Richard L. D. Morse, statement before the Subcommittee of the Kansas Senate Committee on Financial
Institutions, December 18, 1969, p 2. The Richard L.D. Morse Papers, Kansas State University, Consumer
Movement Archives, Box 212, folder 12.
71 Mandell, The Credit Card Industry: A History.

27
The postwar period saw an increase in Americans’ access to financial products: the
“democratization” of financial services.72 Table 2 shows the fraction of American households
with various types of financial assets or liabilities. By virtually all measures, financial products
and services have become more widely dispersed. A larger variety of assets was held by more
and different types of US families, especially those with lower incomes and net worth, as well as
among racial and ethnic minorities. For example, families in the lowest 20% of income who had
checking or savings accounts rose from 55.6% to 74.9% between 1989 and 2007.73 Table 3
highlights changes to selected assets and liabilities by income and race/ethnicity. More striking
than the increased use of basic transaction accounts is the increase in asset holdings for non-
whites and Hispanics. The share of non-white and Hispanic families with assets held in pooled
investment funds and stocks increased from 1.0% to 5.8% and 4.6% to 9.4% respectively
between 1989 and 2007.74
72 Arthur Morris, founder of the Morris Plan consumer lending banks, claims to have coined this term. It was also
used by Henry Wolff, an early advocate for the adoption of credit unions. Arthur J. Morris, “Fifty years creating and
developing the Morris Plan system of consumer bank,” speech to the Consumer Bankers Association, October 25,
1956. Arthur J. Morris papers, Library of Congress, Box 17, Speeches and Writings File, 1918-60.
For retirement account assets, ownership share increased from 18.0%
to 39.1%. Yet, while more people held a wider variety of assets, there were more people with
debt as well. This was most pronounced among lower-income families. Households in the
lowest two income quintiles were more likely to carry credit card debt (roughly 11% more of
them had credit card debt) in 2007 than in 1989, while those in the top income quintile were less
73 The Survey of Consumer Finance was conducted in a different form prior to 1989. The data from these earlier
years are not reliable for use in a time series and therefore are not included here.
74 Survey of Consumer Finances, various years.
28
likely to carry credit card debt over this time period. Consumers at nearly all income levels had
more mortgage debt, although again there was least change in the top quintile. Non-whites and
Hispanics were more likely to have both credit card debt (40.6%) and mortgage debt (40.4%) in
2007 than they were in 1989 (34.4% and 28.9% respectively).75
>>>Insert Tables 2 & 3 Here<<<
The extension of credit to new groups in society was driven in part by new technical
innovations, including new automated risk-modeling techniques that allowed lenders to better
distinguish reliable borrowers. The trend also reflected a change in attitudes and public policy
about the role of credit in society. This change was in turn triggered by civil rights and women’s
movements in the late 1960s and 1970s that portrayed consumer credit as a basic right that
should be provided as broadly as possible. These social movements around credit began as a
response to the urban riots that spread across the country between 1965 and 1969. Research into
the sources of black urban violence led policymakers to conclude that the urban poor should be
given greater economic access.76
75 Survey of Consumer Finances
In part, that meant access to credit. That conclusion reflected
the findings of David Caplovitz, whose book The Poor Pay More documented the exploitative
lending conditions faced by the urban poor, and of the Kerner Commission, which concluded
76 Cohen, A Consumer's Republic: The Politics of Mass Consumption in Postwar America; "Report of the National
Advisory Commission on Civil Disorders," (Kerner Commission, 1968).
29
that urban blacks could be de-radicalized if they were given greater access to credit at a fair
price.77
The first grass-roots call for broad access to affordable consumer credit came from the
welfare rights movement. In 1970, the National Welfare Rights Organization (NWRO) shifted its
focus from securing welfare benefits for its members—who were mainly women receiving Aid
to Families with Dependent Children (AFDC)—to securing credit access for them. Under the
slogan “credit for being American,” they approached retailers to get them to offer lines of credit
to their members. Many stores assented, including Montgomery Ward and Dillards; others did
not, including JC Penney and Sears. The NWRO held a highly publicized two-year boycott of
Sears to protest their decision not to offer credit to their members.
78 By 1972, it had become
clear that the repayment rates under the NWRO program were disappointing, and the program
was discontinued.79
Just as the NWRO credit campaign was waning, the National Organization for Women
(NOW) mobilized to promote credit access for a very different constituency: middle-class white
women. Their grievances were broad ranging. Women who married had their credit information
merged into their husbands’ files, and credit cards were issued in their husbands’ names.
Nonetheless, their campaign ignited a national policy effort to promote
credit access.
77 David Caplovitz, The Poor Pay More: Consumer Practices of Low Income Families (New York: Free Press,
1963); Kerner Commission, Report of the National Advisory Commission on Civil Disorders, 1968, p 7.
78 Patricia Ann Kornbluh, A Right to Welfare? Poor Women, Professionals, and Poverty Programs, 1935-1975,
Dissertation, Princeton University, 2000, Andrea Jule Sachs, The Politics of Poverty: Race, Class, Motherhood, and
the National Welfare Rights Organization, 196501975, Dissertation, University of Minnesota, 2001
79 Robert H. Edelstein, “Improving the Selection of Credit Risks: An Analysis of a Commercial Bank Minority
Lending Program,” Journal of Finance 30/1 (1975), p 39.
30
Mortgage lenders frequently discounted or even ignored a wife’s income on the belief that she
would have children and lose her salary. Indeed, many mortgage lenders would recognize
women’s salaries only if their doctor issued “baby letters” certifying that they were infertile or
using birth control. Marriage was not the only source of discrimination.80 Young unmarried
women were disproportionately denied educational loans because they were thought to be less
serious students. If women divorced or were widowed, they found themselves without credit.81
Mobilization around credit led to new legislation that would treat credit access as a right.
The Equal Credit Opportunity Act (ECOA) of 1974 initially banned credit discrimination based
on sex or marital status, and was amended in 1976 to include race. In the same year, an
amendment to the Fair Credit Reporting Act of 1970 required credit rating agencies to keep
records on married women. The Home Mortgage Disclosure Act of 1975 allowed the Federal
Reserve to track bank mortgage histories in order to detect discriminatory patters of lending. In
1977, the Community Reinvestment Act banned redlining and required banks to lend in the
communities in which they operated. These legal protections were accompanied by grass-roots
projects to promote credit use. Federally-sponsored low-income credit unions (LICUs), launched
by the Office for Economic Opportunity starting in 1964, opened in urban areas around the
country. New specialized banks focused on the previously excluded populations. Successful
urban lenders included Shore Bank in Chicago (1973) and the Consumer Action Program of
80 Billie Venable Sessoms, Suzanne Nelsen, and Patricia Smith, “A Preliminary Report on Women and Cedit,”
report prepared by the North Carolina Chapter of National Organization for Women, Durham, North Carolina
Chapter, October 15, 1973. National Organization for Women archives, Schlessinger Library, Radcliffe Institute,
Box 211, File 41,
81 Laurie D. Zelon, "Equal Credit Promise or Reality?," Harvard Civil Rights-Civil Liberties Law Review 11 (1976),
Flora Davis, ed., Moving the Mountain: The Women’s Movement in America since 1960 (Champaign, Ill., 1999)
31
Bedford Stuyvesant (1966) in New York.82 Women’s activist groups like NOW and 9-to-5
counseled women on how to build their credit rating. Feminist credit unions emerged across the
country to offer loans that could become the basis of a credit history.83
By the early 1980s, the
democratization of credit had become an uncontroversial assumption on the political left and
right.
Do-it-Yourself: increases in consumer responsibility
Driven by a combination of technical innovations, increasing access, and regulatory
changes, America embarked on a period of do-it-yourself (DIY) finance, in which consumers
took greater responsibility for the design and delivery of their own financial services. New
financial products increasingly allowed, encouraged, and in some cases required consumers to
make financial decisions and transactions that had previously either not been possible, or had
been reserved for financial professionals.
Product innovations enabled the rise of DIY consumer finance. The postwar evolution of
consumer credit products followed this trend. Early consumer credit was installment credit, with
fixed repayment terms. The shift to revolving credit that took place in the 1950s and early 1960s
allowed borrowers to customize their repayment plans. Suddenly, consumers could choose
whether they would repay the entire balance or only a required minimum. By the 1980s, required
minimum monthly payments were dramatically reduced, such that a consumer could literally
82 The Urban Coalition, Consumer Credit and the Low Income Consumer: Preliminary Report (1969).
83 "Sistershares, Newsletter of the Massachusetts Feminist Federal Credit Union," 2, no. 1-4 (1976-1977).
32
finance a dinner at a restaurant over a period of years.84 The growing share of revolving credit
left consumers “free to choose,” and in so doing put an end to the disciplining role that fixed
installment plans had traditionally played in household finance.85 In the mid-1990s, banks and
credit unions began to offer “courtesy pay” or overdraft features so that consumers could
overdraw their checking or debit accounts, for a fee. The service proved profitable; in 2009,
Americans paid $38 billion in overdraft fees.86
Innovations in home mortgage products led to more extreme versions of DIY finance.
Interest-only mortgages and option ARMs allowed consumers to choose monthly payments and
amortization schedules. In the first half of 2006, interest-only loans comprised 25% of the total
volume of loan originations.
Whereas the amount of cash in one’s wallet might
have regulated spending behavior in prior years, new innovations permitted consumers to spend
more freely.
87
84 This was alleged to be the card companies’ intention. David Rummel, "Secret History of the Credit Card," in
Frontline (Public Broadcasting System, 2004).
These credit innovations gave consumers more flexibility and
greater control over the amount they borrowed and their refinancing schedules. Homeowners
could postpone repayment of their principal almost indefinitely, or even choose negative-
amortization products that increased their principal over time. Home equity loans and lines of
credit, which were increasingly available as home prices grew, added an additional tool to the
consumer’s financial toolbox. With these tools, homeowners could more easily spend the
85 Calder, Financing the American Dream: A Cultural History of Consumer Credit.
86 Moebs Services, 2009 Survey.
87 Mortgage Bankers Association, “The Residential Mortgage Market and Its Economic Context in 2007,” January
30, 2007. Available at:
http://www.mbaf.org/pdf/2007/Residential%20Mortgage%20Market%20Report%202007.pdf
33
otherwise illiquid trapped equity in their homes. These products also made it that much easier to
borrow and played an important role in increasing household leverage beginning in the 1990s.88
The DIY approach also changed the means by which people saved, invested, and insured
against risk. Innovations in investment products exposed consumers to a broad range of asset
classes. The expanded menu of mutual funds gave individual investors low-cost access to
diversified pools of investments without requiring that they select individual securities or pay
commissions to brokers. Index funds gave them even cheaper access to entire markets and asset
classes. Individuals could choose between insured bank deposits or uninsured money market
funds. Even for trading individual stocks, widespread access to internet-based discount
brokerages in the 2000s allowed households to bypass financial advisors all together. With these
choices came the possibility for new levels of risk exposure.
The insurance function also saw slightly more DIY products, giving households greater
control. Historically, most life insurance products had blended pure insurance (death benefits)
with largely predetermined investments with fixed rates of interest. By the 1980s, consumers
were able to choose the extent and type of investments that would be held inside insurance
wrappers. These new products included universal- and variable-life plans. Like whole-life
plans, universal plans covered clients for their entire lives and earned “cash value” in a fixed-
investment program, yet allowed more flexibility in premiums and the size of death benefit.
Variable and the hybrid variable-universal insurance plans were Securities and Exchange
Commission (SEC)-registered contracts that allowed participants to direct their investment to a
88 Alan Greenspan and James Kennedy, "Sources and Uses of Equity Extracted from Homes," Oxford Review of
Economic Policy, Vol. 24, Issue 1, pp. 120-144, 2008. Available at SSRN: http://ssrn.com/abstract=1154417 or
doi:grn003 (2008).
34
variety of accounts and/or stocks and bonds; by 2008, 13% of all insurance premiums paid were
to variable plans.89 Innovations in health insurance followed a similar trend. The introduction
of high-deductible health insurance tied to tax-exempt health savings accounts gave consumers
and employers new discretion over the level of risk they faced.90
Some of the most important elements of DIY in consumer finance were in workplace
savings plans facilitated by government policy. The largest driver toward DIY in consumer
investing, for example, was the shift by employers from defined benefit (DB) to defined-
contribution (DC) pension plans. In the former, employers agreed to provide a specific level of
retirement benefits, usually as a function of an employee’s salary prior to retirement. Because
employers had responsibility for providing the benefit, employees didn’t make decisions about
the size and type of retirement investments. With the rise of DC plans, employees were given
broad latitude to determine the amount and types of investments they would make, but bore the
risk of inadequate retirement funds. As DC plans overtook DB plans, American households
increasingly took responsibility for the level of funding and the form of retirement investments.
In 1985, of the $1.2 trillion American workers held in private pension funds, 35% was in DC
plans. In 1996, the share of DC plans surpassed that of DB plans. By 2009, American workers
had $5.4 trillion invested in private pension funds, of which 61% was held in DC plans and 39%
in DB plans.
91
89 Based on LIMRA (a worldwide association of financial and service companies) estimates of US individual life,
annualized new premium market share by product, and LIMRA definitions.
Under these DC plans, employees were required to make complex decisions about
where their retirement funds would go, choosing among plans that ranged from secure
90 Kaiser Family Foundation, Employer Health Benefits, 2007 Survey.
91 Federal Reserve Flow of Funds, supplementary tables L. 118b and L.118c
35
government-only portfolios, ‘prime’ portfolios that took on slightly more risk, to narrow sector-
specific investment funds.
The emergent DIY consumer financial culture was supported by federal regulations, often
in the form of disclosure requirements. Prior to the late 1960s, the primary means of consumer
protection in credit markets was through restrictions on products offerings and caps on interest
rates for deposits and loans. Over time, the caps were phased out, and in part replaced by a
regime of enhanced disclosure. Pushed by consumer and worker-advocacy groups, legislators
created new laws to improve the transparency and accountability of financial-service providers.
Table 4 highlights some of the major regulations during the postwar period. In consumer
credit, early federal regulations emphasized transparency and accountability. The federal Truth
in Lending Act (1968) required lenders to disclose the annual percentage rate (APR) and total
cost of loans. The Fair Credit Reporting Act (1970) increased transparency and accountability of
credit rating agencies. Other regulations offered consumers assurances. Changes to rules at the
Federal Trade Commission in the 1970s limited consumer liability for credit card fraud to $50—
a move that was later seen as key to easing public concerns about the credit card industry. For
workers, the 1974 Employee Retirement Income Security Act (ERISA) regulated disclosure and
accountability of employer-sponsored defined contribution plans. The Real Estate Settlement
Procedures Act (1974) imposed standardized cost reporting for home mortgages.
>>>Insert Table 4 Here<<<
Once a legal framework assuring transparency and accountability was in place, Congress
and the courts began to loosen restrictions on the kinds of products that consumer finance
36
companies could offer. The Monetary Control Act of 1980 began the process of eliminating
interest rate caps on deposits by authorizing NOW (negotiable order of withdrawal) accounts,
which offered a legal workaround to the caps imposed under Regulation Q. The Garn St.
Germain Act of 1982, which deregulated the Savings and Loan industry, also legalized another
form of savings account, the money market deposit account (MMDA), which could now offer
higher interest rates. Financial deregulation extended to consumer lending as well. In 1978, the
Supreme Court decision in Marquette v. First of Omaha found that out-of-state credit card
lenders were bound by usury regulations only in the state in which they were located.92 Given
that some states either had no usury caps or were—like South Dakota—willing to eliminate
them, the decision drove a regulatory race in which jurisdictions with more liberal credit terms
attracted national lenders. New federal and state laws reinforced this trend. The Monetary
Control Act of 1980 extended a usury exemption to all FDIC-insured banks, wherever they were
located. In order to support domestic non-bank lenders, most states responded by loosening or
eliminating their own usury restrictions. New rules issued in 2004 by the Office of the
Comptroller of the Currency further extended federal preemption to include not just interest rates
but also non-interest charges, disclosures, and details of credit account management.93
By the
mid-2000s, US consumer lenders operated in a regulatory environment that paired vast product
variety with fairly aggressive regulation of transparency and accountability.
92 U.S. Supreme Court, Marquette Nat. Bank v. First of Omaha Svc. Corp., 439 U.S. 299 (1978), No. 77-1265.
93 Mark Furletti, “The Debate Over the National Bank Act and the Preemption of State Efforts to Regulate Credit
Cards,” Temple Law Review 77 (2004).
37
Greater risk: the aggregate impact of consumer decisions
In his book, The Great Risk Shift, political scientist Jacob Hacker draws on evidence from
changing patterns in the cost of living, employment stability, household decision-making, and
the impact of social programs to paint a broad picture of American society in which ordinary
Americans have been asked to take on ever greater risk.94 Our postwar history of household
financial services is broadly consistent with his characterization. The combination of
innovations, broader adoption of financial products, and greater access to DIY products created a
context in which households assumed greater risk. The reasons for this are multiple. Personal
preferences, herd mentality, the availability of new and riskier financial products, and new
government policies and incentives all reinforced the risk shift in consumer finance.95
In some cases, the shift of risk to households was a side effect of new product adoption.
Households moved their deposits from insured depository instruments like CDs to new and
uninsured money market funds. DB pension plans came with a limited federal guarantee
(through the Pension Benefit Guarantee Corporation), whereas increasingly popular DC plans
offered no guaranteed payout either by their employers or the government. New electronic
payments technologies offered more convenient payment options, but they also incurred variety
of charges and fees (i.e., overdraft fees, late fees, and finance charges) aimed at consumers who
94 Jacob Hacker, The Great Risk Shift: The Assault on American Jobs, Families, Health Care, and Retirement--and
How You Can Fight Back (New York, 2006).
95 The amount of risk consumers take on is also psychologically-related, including the fact that we tend not to
understand the probability of facing certain risks. See Robert Shiller, The New Financial Order: Risk in the 21st
Century. Also, as our colleague Robert Merton has noted, consumers become comfortable with risks as they increase
their (successful) experience with them.
38
were not diligent about managing their accounts. Similarly, increasingly low monthly minimum
credit card payment requirements offered new flexibility, but cost those consumers who were
undisciplined or inattentive about prompt repayment.96
The aggregation of these decisions in the consumer finance sector can be seen in the
“scissor” pattern in savings and borrowing. In general, over the past sixty five years, but
particularly in the past three decades, households took on more risk as their savings rate declined
and their leverage increased. (See Figure 3.) During the last 65 years, the level and composition
of savings (i.e., the difference between post-tax disposable income and personal consumption)
has changed materially. Following a rationing-induced wartime savings rate of 26% (1943-44),
household savings in the late 1940s fell briefly below 5%. As a general trend, however, savings
rose to roughly 10% by the early 1970s, remained at that level until 1985
97, then declined to
below 0% in for four consecutive months in 2005.98 (In response to the financial crisis of 2008,
savings rates rose to 4.3% as of 2009.99
)
>>>Insert Figure 3 Here<<<
96 David Rummel, "Secret History of the Credit Card"
97 Bureau of Economic Analysis
98 "Spendthrift Nation," Federal Reserve Bank of San Francisco Economic Letter 2005-30 (2005).
99 A historical narrative of this change is told by David Tucker in his 1991 book, The Decline of Thrift in America
and is an element of the story of increased household leverage as told in Manning’s Credit Card Nation. Tucker, The
Decline of Thrift in America: Our Cultural Shift from Saving to Spending. Robert D. Manning, Credit Card Nation:
The Consequences of America's Addiction to Credit (New York, 2000).
39
Yet, these often-reported low savings numbers significantly understate the rate at which
total US household assets grew in the postwar period.100 Because the United States experienced
strong housing- and stock-market appreciation, overall wealth rose markedly in the postwar
period. From 1950 to 2005, the real per capita market value of owner-occupied real estate rose
from $14,330 to $79,796 (in constant 2008 dollars). By 2007 it had fallen back to $60,149, a
24% drop).101 Stock market increases were similarly dramatic. The S&P 500 total returns index
rose from $40 in 1950 to $2,395 by 2007.102 As the market grew, more families began to hold
stock. The share of families holding stock rose from 8% in 1949, 17% in 1960, to 44% in 1970,
to over 80% in 2007.103 Of stock holders in 2007, 65% held stock through their retirement
accounts; only 18% held stocks directly.104
The aggregate household portfolio allocation changed over time, taking on greater risk.
As part of its Flow of Funds data, the Federal Reserve Board calculates the fraction of the
household (and nonprofit) balance sheet is composed of equity. Figure 4 shows the fraction of
financial assets that are directly or indirectly exposed to equities (excluding defined benefit
plans). This fraction has varied dramatically over the 65 years, rising above 30% during the go-
go years of the 1960s, and rising again in the late 1990s. In the later part of the period,
households assumed greater equity price exposure, until at least the bursting of the dot.com
bubble and the more recent precipitous decline in equities.
100 For accounting purposes, appreciation of financial and housing assets does not constitute “savings.”
101 Federal Reserve Data. Includes vacant land.
102 Global Financial Data, S&P 500 Total Return Index (with GFD extension)
103 Survey of Consumer Finances 1960, 1970, and 2007. There is no weighting documentation for these surveys.
Data are assumed to be self-weighting.
104 Survey of Consumer Finances, 1989-2007
40
>>>Insert Figure 4 Here <<<
We must consider, however, not only household assets, but also leverage. By definition,
increased leverage increases the riskiness of a firm or household in two ways. First, leverage
amplifies the exposure to fluctuations in asset prices; and second, leverage opens the option of
default and bankruptcy. By any measure, households took on greater leverage in the postwar
period. Measured as a percentage of personal income, household debt (mortgage and non-
mortgage) grew six-fold from 1946 and 2008. This growth was distributed unevenly over time,
with periods of rapid debt growth in the 1950s and early 1960s, and again in the 1980s and
1990s. As a percent of disposable income, total debt also rose from 20% in 1946 to 60% in 1965.
For the next twenty years, from 1965 to 1985, outstanding household debt remained roughly
stable. Then, from 1985 until 2008, debt as a share of disposable income again increased
dramatically, from 60% to 125%.105
The type of debt households carry has also changed over time. The share of household
financial liabilities represented by mortgages increased from 59% in 1950 to 73% in 2008; the
share represented by consumer debt fell from 31% to 18%.
106
105 Bureau of Economic Analysis
The rise in mortgage debt likely
reflected greater access to mortgages and increasing debt per home (with the latter facilitated
through home equity products). Relative to other non-mortgage debt, credit card lending showed
disproportionate growth. Between the time when BankAmericard was formed in 1968 and 2008,
credit card debt grew at an annual rate of 9.1%, compared to a 6.4% annual growth rate for all
106 Federal Reserve Board, Z.1 Report
41
non-mortgage consumer credit.107 The share of non-mortgage debt comprised by revolving debt
grew from just 3.8% in 1970 to 37.5% in 2008.108
By 2009, American households had roughly three times more leverage than in 1950.
109
Figure 5 shows three indicators of consumer leverage: the ratio of total household liabilities to
total assets, total home mortgage debt as a share of the replacement value of residential real
estate, and consumer credit measured as a percentage of disposable personal income. Although
these ratios show variation over time—with periods of strong growth punctuated by periods of
relative stability—the overall trend toward increasing leverage is clear, reflecting long-term
trends toward both more debt and less savings.
>>>Insert Figure 5 Here<<<
Why did Americans go so far into debt? Home mortgages are a major part of the reason,
and the drivers of home mortgage growth were not just economic, but also regulatory. An
explicit national goal of greater homeownership generated bipartisan support for mortgage
subsidies. Throughout most of the postwar period, consumer interest gave rise to tax deductions,
but under the Tax Reform Act of 1986, most of these deductions were removed, leaving only
mortgage insurance deductions permitted on federal income taxes. In addition, monetary policy
kept interest rates low. These and other factors contributed to the rise in home ownership levels
107 Credit card debt from “revolving” credit figures from Bureau of Economic Analysis. 108 Federal Reserve Board, Consumer Credit Data, Series G.19.
109 Ratio of liabilities to assets in 1950 (Q4) was .068 and in 2009 (Q3) was .208. Federal Reserve Flow of Funds
data.
42
from 51% in 1949 to 69% in 2007.110 Other forms of household borrowing also were
encouraged. Loans for higher education were promoted through government-sponsored
insurance, and these left students with high balances to repay upon graduation. In 1996, 58% of
bachelor’s degree recipients graduated with an average of $18,000 in student loan debt (inflation
adjusted); by 2008, nearly two-thirds of bachelor’s degree graduates had debt, averaging
$23,000.111
To get a rough sense of the rise in the riskiness of the US households’ finances over time,
Figure 6 examines the standard deviation of annual changes in per capita CPI-adjusted
household net worth and disposable personal income for each of the six past decades. The
standard deviation in annual changes reflects how variable the changes in net worth and income
are from year to year. This calculation is imprecise for various reasons: it is measured at the
aggregate level; the inflation-adjusted results may vary by type of deflator; and the “household”
sector includes a small fraction of the non-profit activities. Nevertheless, the story of the
household sector is not about increasing aggregate variability in personal income. To the
contrary, this variation has eased off, albeit modestly over the period. The real change is the
substantial increase in variability in per capita real changes in net worth, as households were
exposed to stocks and ever more levered real estate holdings, both of which experienced
substantial shocks in the past decade.
>>>Insert Figure 6 Here<<<
110 Survey of Consumer Finances, 1960 and 2007.
111 Matthew Reed and Diane Cheng, "Student Debt and the Class of 2008," (Berkeley, CA: Institute for College
Access and Success, 2009).
43
Implications
Recent attention to subprime mortgages and debate over the recently enacted Bureau of
Consumer Financial Protection have increased awareness of the consumer finance space;
however, the events of the last few years are only part of a longer and richer story. An expanded
account of postwar American consumer finance places mortgage lending in the context of the
fuller set of consumer financial decisions, and reveals that the trends of the last few years are part
of a broader pattern. The postwar period has seen increased innovation that made more products
available to a broader range of the population. Largely, the period has witnessed a rise in do-it-
yourself consumer finance, with the outcome being that households in aggregate have taken on
greater risk than earlier in the post war period.
While it is appropriate to focus on the costs of these decisions (e.g., greater defaults), one
cannot assess the social welfare implications of these trends without also considering the benefits
of increasing leverage and reduced savings. More families could borrow to buy homes and cars,
and fund higher education. Younger families enjoyed higher standards of living by borrowing
against future earnings ability. In this review, we do not attempt to draw conclusions about the
net benefits or costs of the trends we identify.
There is good reason to be concerned about the implications of the DIY trend in
consumer finance. Researchers have begun to explore the financial capability of consumers, and
their ability and preparedness to make household financial decisions. These studies illustrate that
most consumers are ill-equipped to make financial decisions that would keep their balance sheets
healthy—whether that means having enough money in the bank to handle an emergency (or
grow larger amounts of wealth), or keeping their risk-exposure low (including keeping their debt
44
loads down).112 Most Americans fail to understand basic financial concepts,113 including how
to calculate simple interest, how to account for inflation114 and how to understand loan and
mortgage terms.115 This seeming lack of financial capability is linked to a variety of outcomes.
Less financially-literate consumers are less likely to plan for retirement, to accumulate wealth or
to participate in the stock market. A recent study of debt literacy (i.e., knowledge of fundamental
concepts related to debt) illustrates a strong positive relationship between over-indebtedness and
low knowledge of debt fundamentals.116 In short, as Americans have been given more options,
and have been asked to make their own financial decisions, they are apparently ill equipped to
make choices that foster household financial health or contribute to the development of a
healthier national economy.117
112 Annamaria Lusardi, Daniel Schneider, and Peter Tufano, "Households @ Risk: A Cross Country Study of
Household Financial Risk," in Paper presented to the 2010 American Economic Association Meeting. (Denver, CO:
2010).
113 Hilgert, Marianne A.; Hogarth, Jeanne M. and Beverly, Sondra. "Household Financial Management: The
Connection between Knowledge and Behavior." Federal Reserve Bulletin, 2003, (July 2003).
114 Lusardi, Annamaria and Mitchell, Olivia S. "Financial Literacy and Planning: Implications for Retirement
Wellbeing." MRRC Working Paper n. 2006-144., 2006.
115 Moore, Danna. "Survey of Financial Literacy in Washington State: Knowledge, Behavior, Attitudes, and
Experiences," Technical Report n. 03-39. Social and Economic Sciences Research Center, Washington State
University, 2003.
116 Lusardi, Annamaria and Mitchell, Olivia S. "Planning and Financial Literacy. How Do Women Fare?" American
Economic Review, 2008, May, Lusardi, Annamaria and Tufano, Peter. "Debt Literacy, Financial Experience, and
Overindebtedness." Working Paper, Harvard Business School, 2008.
117 See also Niall Ferguson, The Ascent of Money: A Financial History of the World (New York, 2008). On page 12
he states “A society that expects most individuals to take responsibility for management of their own [finances,
45
There is not a lot of evidence to suggest that financial institutions are prepared or willing
to take responsibility for these problems. The recent overleveraging of the American household
was clearly supported by mortgage brokers, lenders and investors. Asset management
companies have generally not performed any better. While there are some firms that seem
committed to educating consumers and improving the quality of decision making, evidence from
the brokerage industry calls into question whether this channel will support improved consumer
decision making. The passage of the Dodd-Frank Wall Street Reform and Consumer Protection
Act (H.R. 4173) on July 21, 2010 and the creation of a federal Bureau of Consumer Financial
Protection reflect and acknowledge this need.
The need to enhance financial decision making will likely get more pressing with the
aging of the US population. In 2008, 13% (36.9 million people) of the US population were 65 or
older, but by 2020, this fraction is expected to rise to 16% (54.8 million people).118 While this
demographic bulge gives rise to pressures on Social Security, it also will require a massive
number of elderly citizens to make one of the most complex financial calculations they will have
ever made (the rate of decumulation from retirement plans), at a time when they are perhaps
most sensitive to financial risk and have diminished cognitive abilities in general, a sobering fact
established by neuroscientists.119
taxes, homeownership, retirement and health insurance] is surely storing up trouble for the future by leaving its
citizens so ill-equipped to make wise financial decisions.”
How business practice—and evolving regulation—address
these issues will determine the arc of the next few decades of consumer finance history.
118 U.S. Bureau of the Census
119 Sumit Agarwal, John C. Driscoll, Xavier Gabaix, and David Laibson, "The Age of Reason: Financial Decisions
over the Lifecycle," NBER Working Papers, no. 13191, National Bureau of Economic Research, Inc. 2007.

46
Table 1: Selected Examples of Consumer Finance Innovation
Date Innovation1949 Diner's Club travel and entertainment card1956 Magnetic ink character recognition (MICR) technology for check reading
1952 Variable annuity life insurance (TIAA-CREF)1
1958 American Express and Carte Blanche travel and entertainment cards1958 Bank Americard credit card1965 Federally-guaranteed student loans1965 BankAmericard creates licensing agreements with other banks (later becomes Visa)1967 MasterCard network (originally the Interbank Card Association)1970 Credit scoring (FICO)
early 1970s Automated Clearing House (ACH) debitsearly 1970s Automated teller machine (ATM)
1970s Securitized mortgages through structured finance mortgage pools2
1970s Point of sale systems for electronic payment processing (IBM)3
1971 Money market mutual funds1973 Negotiable Orders of Withdrawal (NOW) accounts1974 First MMMF to offer check writing1976 Indexed mutual funds (Vanguard)1979 Universal life insurance
late 1970s/early 1980s Home equity line of credit1980s Debit cards
1980s Adjustable rate mortgage, widespread introduction4
1980 Original issue deep discount bonds1983 Collateralized mortgage obligations
mid 1980s Option ARM mortgagemid 1980s Auto-title loans
1984 Fund supermarkets (Schwab)1985 Securitized auto loans1985 Treasury STRIPS1986 Securitized credit cards1987 Index-linked CDs
late 1980s Modern refund anticipation loans at tax sitesearly 1990s Payday lending
early 1990s Subprime mortgage lending (comprised .74% of mortgage market in early 1990s)5
1990s Electronic bill payment1992 Online securities trading1993 Exchange-traded funds
early-mid 1990s Electronic check presentmentmid 1990s Stored-value (i.e., prepaid) cards offered by retailersmid 1990s Collateralized debt obligationsmid 1990s Checking overdraft protection
1995 Internet-only bank (Security First Network Bank)1999 Online payments (Paypal)
late 1990s Account aggregation services to financial institutions (Yodlee.com, CashEdge.com)2000 Mobile banking (Harris Bank)6
2001 Payroll cardsmid 2000s Online money management sites (mint.com, wesabe.com, thrive.com)
2006 Peer lending (Prosper.com)
Selected Sources : 1 http://www.annuity-insurers.org/Resources/History/History-sec5.aspx
3 http://www.touchpos.net/page.html?chapter=10&id=9
5 http://research.stlouisfed.org/publications/review/06/01/ChomPennCross.pdf 6 Rob Luke and Susan S. Luke, "Mobile Banking? Hold the Phone", Bank Technology News, March 2000, 13:3
2 "Asset Securitization Comptroller's Handbook 1997" In Comptroller of the Currency, Liquid and Funds Management. Washington, DC: U.S. Department of Treasury.
4 Frame, W. Scott and Lawrence J. White. 2009. "Technological Change, Financial Innovation, and Diffusion in Banking." Federal Reserve Bank of Atlanta Working Paper, 2009-10.
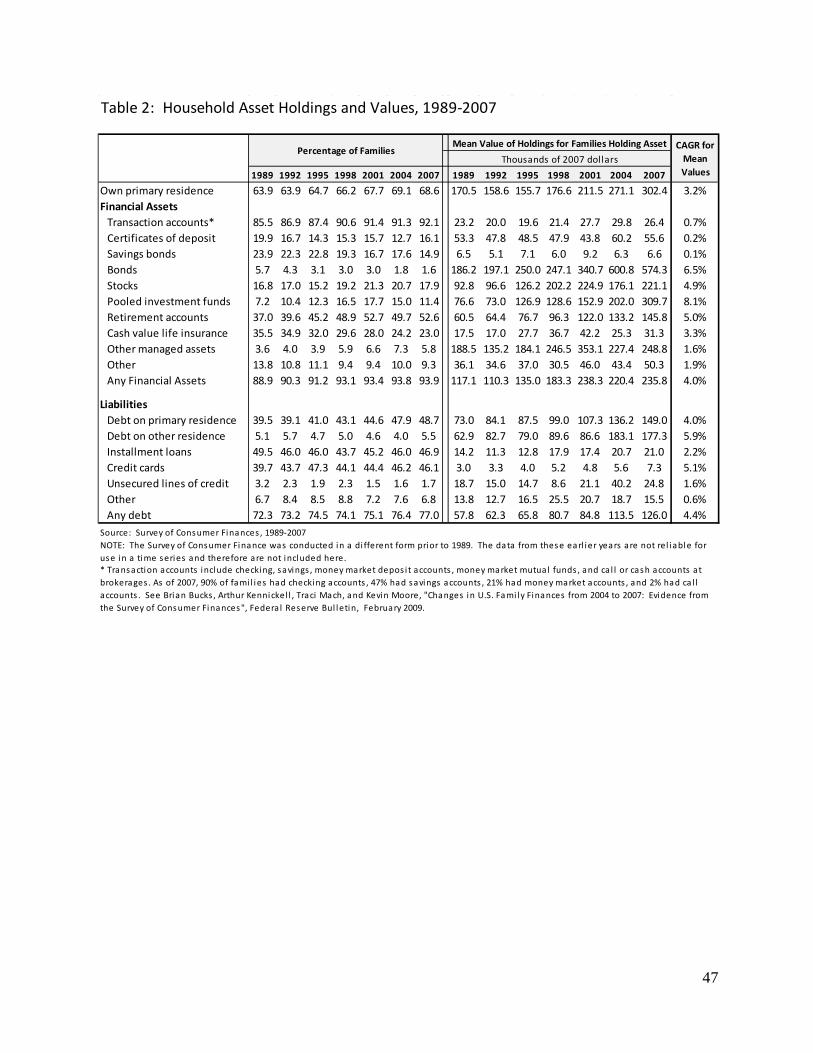
47
Table 2: Household Asset Holdings and Values, 1989-2007
1989 1992 1995 1998 2001 2004 2007 1989 1992 1995 1998 2001 2004 2007
Own primary residence 63.9 63.9 64.7 66.2 67.7 69.1 68.6 170.5 158.6 155.7 176.6 211.5 271.1 302.4 3.2%Financial Assets
Transaction accounts* 85.5 86.9 87.4 90.6 91.4 91.3 92.1 23.2 20.0 19.6 21.4 27.7 29.8 26.4 0.7%Certificates of deposit 19.9 16.7 14.3 15.3 15.7 12.7 16.1 53.3 47.8 48.5 47.9 43.8 60.2 55.6 0.2%Savings bonds 23.9 22.3 22.8 19.3 16.7 17.6 14.9 6.5 5.1 7.1 6.0 9.2 6.3 6.6 0.1%Bonds 5.7 4.3 3.1 3.0 3.0 1.8 1.6 186.2 197.1 250.0 247.1 340.7 600.8 574.3 6.5%Stocks 16.8 17.0 15.2 19.2 21.3 20.7 17.9 92.8 96.6 126.2 202.2 224.9 176.1 221.1 4.9%Pooled investment funds 7.2 10.4 12.3 16.5 17.7 15.0 11.4 76.6 73.0 126.9 128.6 152.9 202.0 309.7 8.1%Retirement accounts 37.0 39.6 45.2 48.9 52.7 49.7 52.6 60.5 64.4 76.7 96.3 122.0 133.2 145.8 5.0%Cash value life insurance 35.5 34.9 32.0 29.6 28.0 24.2 23.0 17.5 17.0 27.7 36.7 42.2 25.3 31.3 3.3%Other managed assets 3.6 4.0 3.9 5.9 6.6 7.3 5.8 188.5 135.2 184.1 246.5 353.1 227.4 248.8 1.6%Other 13.8 10.8 11.1 9.4 9.4 10.0 9.3 36.1 34.6 37.0 30.5 46.0 43.4 50.3 1.9%Any Financial Assets 88.9 90.3 91.2 93.1 93.4 93.8 93.9 117.1 110.3 135.0 183.3 238.3 220.4 235.8 4.0%
LiabilitiesDebt on primary residence 39.5 39.1 41.0 43.1 44.6 47.9 48.7 73.0 84.1 87.5 99.0 107.3 136.2 149.0 4.0%Debt on other residence 5.1 5.7 4.7 5.0 4.6 4.0 5.5 62.9 82.7 79.0 89.6 86.6 183.1 177.3 5.9%Installment loans 49.5 46.0 46.0 43.7 45.2 46.0 46.9 14.2 11.3 12.8 17.9 17.4 20.7 21.0 2.2%Credit cards 39.7 43.7 47.3 44.1 44.4 46.2 46.1 3.0 3.3 4.0 5.2 4.8 5.6 7.3 5.1%Unsecured lines of credit 3.2 2.3 1.9 2.3 1.5 1.6 1.7 18.7 15.0 14.7 8.6 21.1 40.2 24.8 1.6%Other 6.7 8.4 8.5 8.8 7.2 7.6 6.8 13.8 12.7 16.5 25.5 20.7 18.7 15.5 0.6%Any debt 72.3 73.2 74.5 74.1 75.1 76.4 77.0 57.8 62.3 65.8 80.7 84.8 113.5 126.0 4.4%
Source: Survey of Consumer Finances , 1989-2007
* Transaction accounts include checking, savings , money market depos i t accounts , money market mutual funds , and ca l l or cash accounts at brokerages . As of 2007, 90% of fami l ies had checking accounts , 47% had savings accounts , 21% had money market accounts , and 2% had ca l l accounts . See Brian Bucks , Arthur Kennickel l , Traci Mach, and Kevin Moore, "Changes in U.S. Fami ly Finances from 2004 to 2007: Evidence from the Survey of Consumer Finances", Federa l Reserve Bul letin, February 2009.
Mean Value of Holdings for Families Holding Asset CAGR for Mean Values
Thousands of 2007 dollarsPercentage of Families
NOTE: The Survey of Consumer Finance was conducted in a di fferent form prior to 1989. The data from these earl ier years are not rel iable for use in a time series and therefore are not included here.
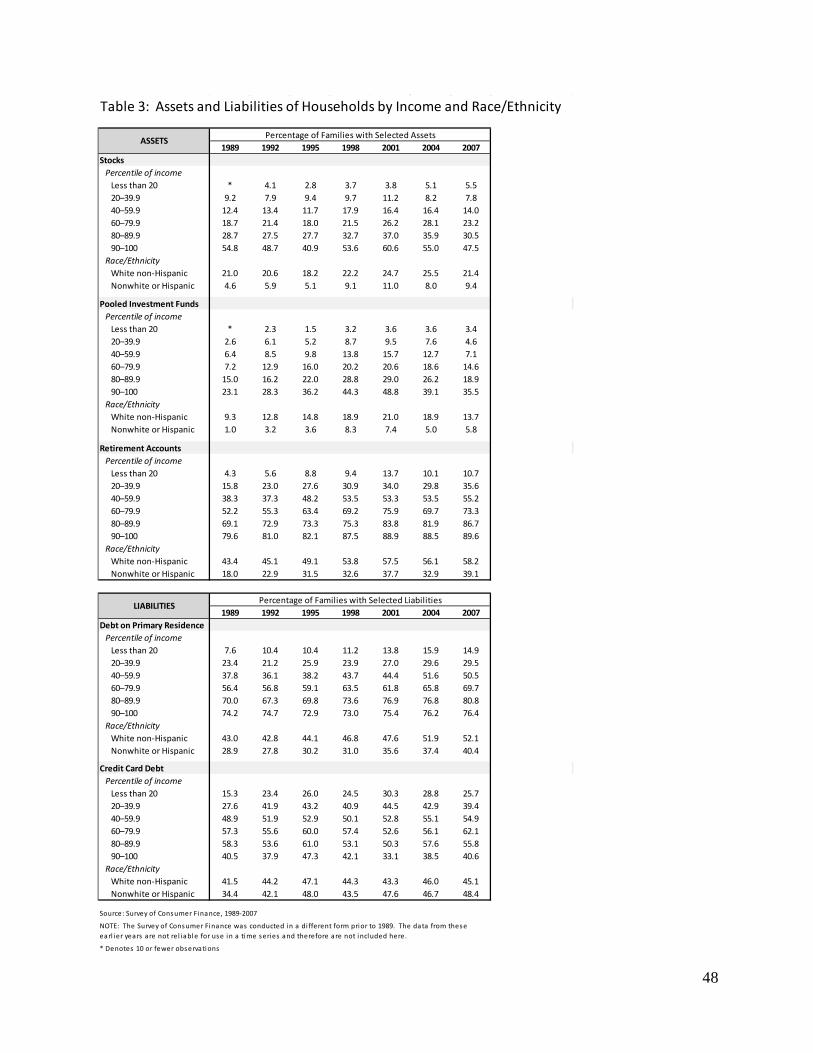
48
Table 3: Assets and Liabilities of Households by Income and Race/Ethnicity
1989 1992 1995 1998 2001 2004 2007Stocks
Percentile of incomeLess than 20 * 4.1 2.8 3.7 3.8 5.1 5.520–39.9 9.2 7.9 9.4 9.7 11.2 8.2 7.840–59.9 12.4 13.4 11.7 17.9 16.4 16.4 14.060–79.9 18.7 21.4 18.0 21.5 26.2 28.1 23.280–89.9 28.7 27.5 27.7 32.7 37.0 35.9 30.590–100 54.8 48.7 40.9 53.6 60.6 55.0 47.5
Race/EthnicityWhite non-Hispanic 21.0 20.6 18.2 22.2 24.7 25.5 21.4Nonwhite or Hispanic 4.6 5.9 5.1 9.1 11.0 8.0 9.4
Pooled Investment FundsPercentile of income
Less than 20 * 2.3 1.5 3.2 3.6 3.6 3.420–39.9 2.6 6.1 5.2 8.7 9.5 7.6 4.640–59.9 6.4 8.5 9.8 13.8 15.7 12.7 7.160–79.9 7.2 12.9 16.0 20.2 20.6 18.6 14.680–89.9 15.0 16.2 22.0 28.8 29.0 26.2 18.990–100 23.1 28.3 36.2 44.3 48.8 39.1 35.5
Race/EthnicityWhite non-Hispanic 9.3 12.8 14.8 18.9 21.0 18.9 13.7Nonwhite or Hispanic 1.0 3.2 3.6 8.3 7.4 5.0 5.8
Retirement AccountsPercentile of income
Less than 20 4.3 5.6 8.8 9.4 13.7 10.1 10.720–39.9 15.8 23.0 27.6 30.9 34.0 29.8 35.640–59.9 38.3 37.3 48.2 53.5 53.3 53.5 55.260–79.9 52.2 55.3 63.4 69.2 75.9 69.7 73.380–89.9 69.1 72.9 73.3 75.3 83.8 81.9 86.790–100 79.6 81.0 82.1 87.5 88.9 88.5 89.6
Race/EthnicityWhite non-Hispanic 43.4 45.1 49.1 53.8 57.5 56.1 58.2Nonwhite or Hispanic 18.0 22.9 31.5 32.6 37.7 32.9 39.1
1989 1992 1995 1998 2001 2004 2007Debt on Primary Residence
Percentile of incomeLess than 20 7.6 10.4 10.4 11.2 13.8 15.9 14.920–39.9 23.4 21.2 25.9 23.9 27.0 29.6 29.540–59.9 37.8 36.1 38.2 43.7 44.4 51.6 50.560–79.9 56.4 56.8 59.1 63.5 61.8 65.8 69.780–89.9 70.0 67.3 69.8 73.6 76.9 76.8 80.890–100 74.2 74.7 72.9 73.0 75.4 76.2 76.4
Race/EthnicityWhite non-Hispanic 43.0 42.8 44.1 46.8 47.6 51.9 52.1Nonwhite or Hispanic 28.9 27.8 30.2 31.0 35.6 37.4 40.4
Credit Card DebtPercentile of income
Less than 20 15.3 23.4 26.0 24.5 30.3 28.8 25.720–39.9 27.6 41.9 43.2 40.9 44.5 42.9 39.440–59.9 48.9 51.9 52.9 50.1 52.8 55.1 54.960–79.9 57.3 55.6 60.0 57.4 52.6 56.1 62.180–89.9 58.3 53.6 61.0 53.1 50.3 57.6 55.890–100 40.5 37.9 47.3 42.1 33.1 38.5 40.6
Race/EthnicityWhite non-Hispanic 41.5 44.2 47.1 44.3 43.3 46.0 45.1Nonwhite or Hispanic 34.4 42.1 48.0 43.5 47.6 46.7 48.4
Source: Survey of Consumer Finance, 1989-2007
* Denotes 10 or fewer observations
Percentage of Families with Selected Assets
Percentage of Families with Selected Liabilities
ASSETS
LIABILITIES
NOTE: The Survey of Consumer Finance was conducted in a di fferent form prior to 1989. The data from these earl ier years are not rel iable for use in a time series and therefore are not included here.

49
Table 4: Selection of Key Legal Events
Year Legal Event Implications for Consumer Finance
Actions with Important Implications for Consumers
1968 Truth in Lending Act Requires clear disclosure of terms and costs in lending to consumers
1968 Fair Housing ActProhibits discrimination on the basis of race, color, religion and national origin in housing sales and rentals
1970 Fair Credit Reporting ActRegulates practices of the consumer reporting agencies with regard to collecting, disseminating and using consumer information
1970 Securities Investor Protection ActEstablished Securities Investment Protection Corporation, a non-profit that protects securities investors from harm if a broker-dealer fails
1970Amendment to the Investment Company Act (Section 36(b))
Imposes fiduciary duties on mutual fund advisors with respect to compensation and provides a mechanism for enforcement
1974 Equal Credit Opportunity Act Prohibits creditors from discriminating based on gender or marital status
1974 Fair Credit Billing Act (Amendment to TILA)Provides dispute settlement procedures for billing errors on unsecured credit accounts (i.e., credit cards)
1974 Real Estate Settlement Procedures Act Requires clear disclosure of home mortgage and purchase costs; prohibits kickbacks between lenders and servicing agents
1974 Employee Retirement Income Security Act (ERISA)Protects employee investments in pension plans by establishing minimum standards of disclosure and behavior of fiduciaries
1975 Home Mortgage Disclosure ActRequires lenders to report mortgage data for the purpose of determining housing patterns and needs and identifying possible discrimination
1976 Amendment to the Equal Credit Opportuinty ActProhibits creditors from discriminating based on race, religion, age, national origin, and receipt of public assistance
1976 Consumer Leasing Act (Amendment to TILA) Requires certain disclosures be made to consumers when leasing property
1977 Fair Debt Collection Practices ActPromotes fairness in debt collection, including giving consumers the right to dispute and validate their credit information
1977 Community Reinvestment ActRequires supervisory agencies to consider depository institution's record and performance in meeting needs of low and moderate-income neighborhoods
1978 Electronic Fund Transfer Act (Regulation E)Established rights, liabilities, and responsibilities of participants in electronic fund transfer systems and protect consumer rights
1978 Bankruptcy Reform Act Considered to be "modern bankruptcy law"; made it easier for consumers to file for bankruptcy under chapter 7 (discharge of qualified debts) or chapter 13 (supervised "financial reorganization")
1982 Alternative Mortgage Transaction Parity ActPre-empted state laws that restricted banks from making any mortgages other than fixed-rate amortizing
1986 Tax Reform ActDisallowed tax deductions on consumer and student loan interest; only tax deductable if secured by home (i.e., home equity or mortgage loans)
1991 Truth in Savings ActEstablished uniform disclosure on terms and conditions with regard to interest and fees
1994Home Ownership and Equity Protection Act (Amendment to TILA)
Requires lenders to disclose and comply with limits on home-equity loans
1996 Credit Repair Organization ActProvides information about and protects consumers from unfair or deceptive practices of credit repair organizations
1998 Home Owners Protection ActRestricts unnecessary payment of private mortgage insurance (PMI); ensures that PMI is no longer billed once a homeowner establishes the required amount of equity in the home
1999 Gramm-Leach-Bliley ActRequires disclosure of privacy policy and sharing of non-public personal information, as well as permits consumers to opt out
2003 Fair and Accurate Credit Transactions Act (FACTA)Added new sections to the Fair Credit Reporting Act; established the Financial Literacy and Education Commission to improve financial literacy among consumers; helps consumers fight identity theft
2005Bankruptcy Abuse Prevention and Consumer Protection Act
Made it harder for consumers to qualify for Chapter 7 bankruptcy, requiring many to file Chapter 13 instead; requires credit counseling for all filers and financial management course prior to any discharges.
2006 Pension Protection Act (Amendments to ERISA)Established new minimum funding standards for pension plans; induces employers to offer auto-enrollment, auto-contribution and default asset-allocation plans; requires employers to make minimum contributions
2008 S.A.F.E. Mortgage Licensing ActProvides consumer protection by requiring states to establish standards and licensing requriements for mortgage loan originators
2009 Credit Card ActLimits "unfair or deceptive" billing and payment practices as well as interest rate increases

50
Table 4, continued
Year Legal Event Implications for Consumer Finance
Structural Regulation and Changes to Sectoral Boundaries
1975 Amendment to Securities Act of 1934 Prohibits fixed-commission rates among broker-dealers
1978 Marquette decisionAuthorized the export of interest rates and facilitated the development of a national market for consumer credit
1980 Monetary Control ActEliminated Regulation Q ceilings on interest rates banks and thrifts could pay on deposits
1982 Garn-St Germain Depository Institutions ActDeregulated savings and loan industry; intention was "to revitalize the housing industry by strengthening the financial stability of home mortgage lending institutions and ensuring the availability of home mortgage loans."
1994Riegle-Neal Interstate Banking and Branching Efficiency Act
Allowed interstate banking, permitting banks to establish branches nationwide without separate subsidiaries
1999 Gramm-Leach-Bliley ActRepealed Glass-Steagall Act (1933) prohibitions against the consolidation of commercial banks, investment banks, securities firms and insurance
GSEs and Mortgages
1968 Amendments to the National Housing Act of 1934Divided existing agency into two, making Fannie Mae privately-owned and creating Ginnie Mae to guarantee repayment of mortgage-backed securities
1970 Amendments to the National Housing Act of 1934 Created Freddie Mac to expand the secondary market for mortgages
1984 Secondary Mortgage Market Enhancement ActBroadened the market for mortgage-backed securities by reducing barriers that prevented private companies from investing in them
2008 Federal Housing Finance Regulatory Reform ActIntended to bring stability and liquidity to the mortgage market, it included authorizing placement of Fannie Mae and Freddie Mac into conservatorship under the Federal Housing Finance Agency and raising loan limits.
Protecting the Financial System
1970 Bank Secrecy ActRequires financial institutions to work with government agencies in an effort to detect and prevent money launderings
2001Know Your Customer rules (Section 326 of the 2001 Patriot Act)
Requires banks and depositories to verify customer identity to ensure they are not on prohibited lists (due to fraud, money laundering, terrorism, etc.)
2001International Money-Laundering Abatement and Financial Anti- Terrorism Act (Title III of the 2001 Patriot Act)
Strengthens bank rules against money laundering and works to detect, prevent and prosecute those laundering money for terrorist activity
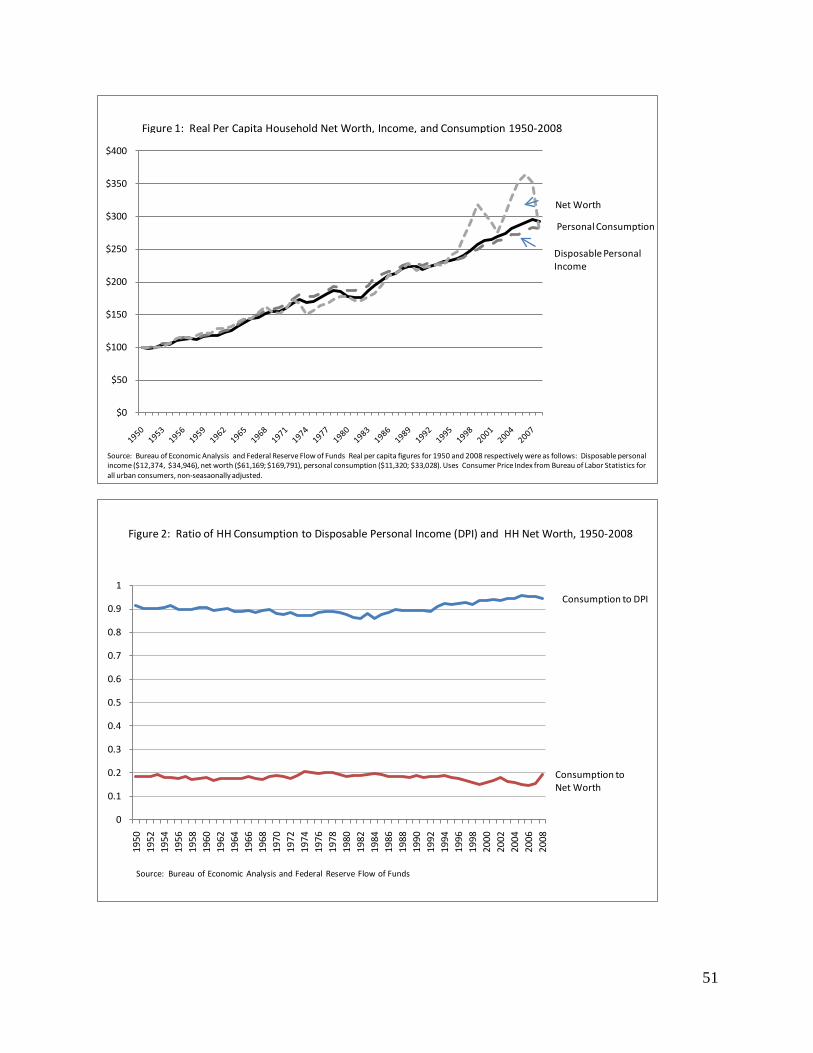
51
$0
$50
$100
$150
$200
$250
$300
$350
$400
Personal Consumption
Net Worth
Disposable Personal Income
Figure 1: Real Per Capita Household Net Worth, Income, and Consumption 1950-2008
Source: Bureau of Economic Analysis and Federal Reserve Flow of Funds Real per capita figures for 1950 and 2008 respectively were as follows: Disposable personal income ($12,374, $34,946), net worth ($61,169; $169,791), personal consumption ($11,320; $33,028). Uses Consumer Price Index from Bureau of Labor Statistics for all urban consumers, non-seasaonally adjusted.
0
0.1
0.2
0.3
0.4
0.5
0.6
0.7
0.8
0.9
1
1950
1952
1954
1956
1958
1960
1962
1964
1966
1968
1970
1972
1974
1976
1978
1980
1982
1984
1986
1988
1990
1992
1994
1996
1998
2000
2002
2004
2006
2008
Consumption to DPI
Consumption to Net Worth
Figure 2: Ratio of HH Consumption to Disposable Personal Income (DPI) and HH Net Worth, 1950-2008
Source: Bureau of Economic Analysis and Federal Reserve Flow of Funds
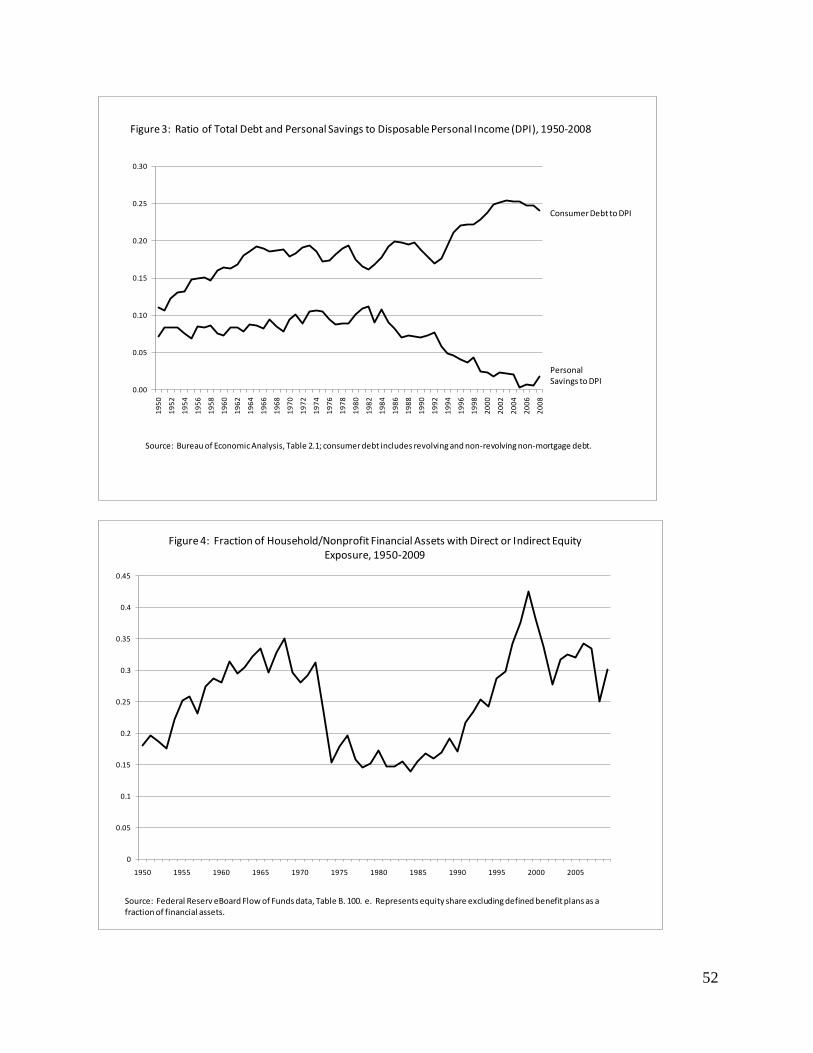
52
0.00
0.05
0.10
0.15
0.20
0.25
0.3019
50
1952
1954
1956
1958
1960
1962
1964
1966
1968
1970
1972
1974
1976
1978
1980
1982
1984
1986
1988
1990
1992
1994
1996
1998
2000
2002
2004
2006
2008
Figure 3: Ratio of Total Debt and Personal Savings to Disposable Personal Income (DPI), 1950-2008
Consumer Debt to DPI
PersonalSavings to DPI
Source: Bureau of Economic Analysis, Table 2.1; consumer debt includes revolving and non-revolving non-mortgage debt.
0
0.05
0.1
0.15
0.2
0.25
0.3
0.35
0.4
0.45
1950 1955 1960 1965 1970 1975 1980 1985 1990 1995 2000 2005
Figure 4: Fraction of Household/Nonprofit Financial Assets with Direct or Indirect Equity Exposure, 1950-2009
Source: Federal Reserv eBoard Flow of Funds data, Table B. 100. e. Represents equity share excluding defined benefit plans as afraction of financial assets.
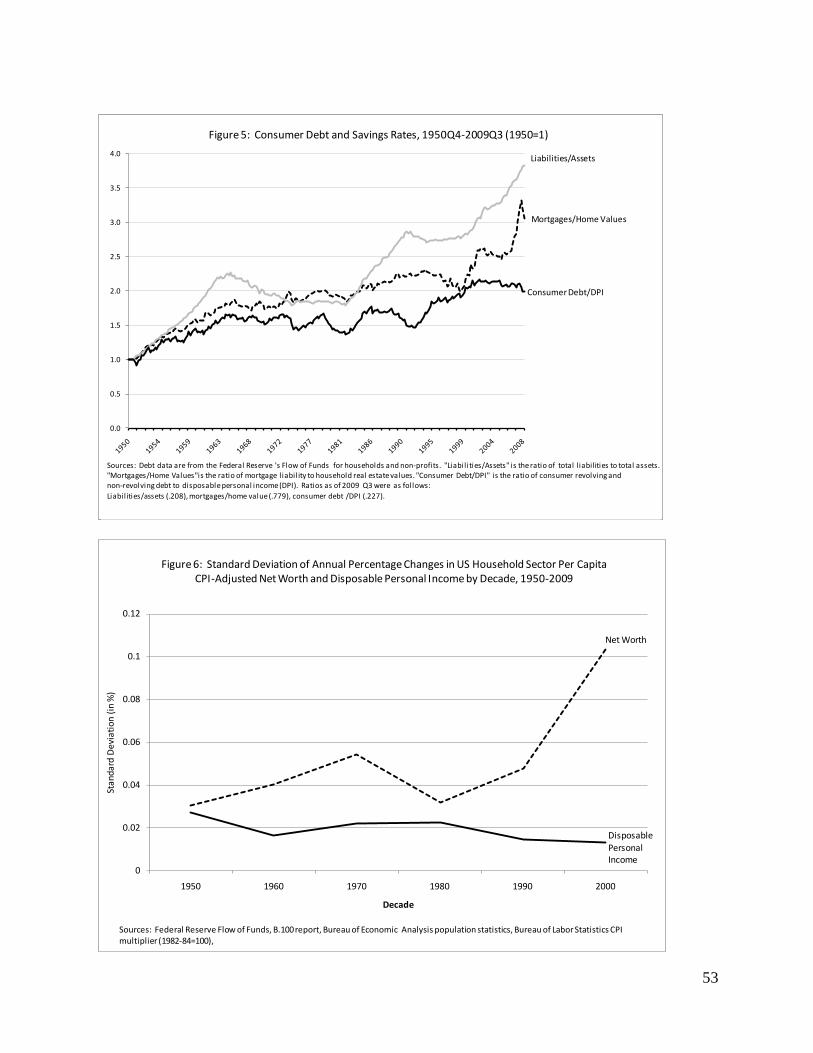
53
0.0
0.5
1.0
1.5
2.0
2.5
3.0
3.5
4.0
Figure 5: Consumer Debt and Savings Rates, 1950Q4-2009Q3 (1950=1)
Sources: Debt data are from the Federal Reserve 's Flow of Funds for households and non-profits. "Liabil ities/Assets" is the ratio of total l iabilities to total assets. "Mortgages/Home Values"is the ratio of mortgage l iabil ity to household real estate values. "Consumer Debt/DPI" is the ratio of consumer revolving and non-revolving debt to disposable personal income (DPI). Ratios as of 2009 Q3 were as follows: Liabil ities/assets (.208), mortgages/home value (.779), consumer debt /DPI (.227).
Liabilities/Assets
Mortgages/Home Values
Consumer Debt/DPI
0
0.02
0.04
0.06
0.08
0.1
0.12
1950 1960 1970 1980 1990 2000
Stan
dard
Dev
iatio
n (in
%)
Decade
Figure 6: Standard Deviation of Annual Percentage Changes in US Household Sector Per Capita CPI-Adjusted Net Worth and Disposable Personal Income by Decade, 1950-2009
Net Worth
Disposable Personal Income
Sources: Federal Reserve Flow of Funds, B.100 report, Bureau of Economic Analysis population statistics, Bureau of Labor Statistics CPI multiplier (1982-84=100),